justin barry professor bill dailey chemistry 502
TRANSCRIPT
Justin Barry
Professor Bill Dailey
Chemistry 502
Experiment #2, Simple/Fractional Distillation
Experimental Organic Chemistry: A Miniscale and Microscale
approach by Gilbert and Martin, Section 4.2-4.3
7-10-06
TA: Mike and Carolyn
INTRODUCTION:
In this experiment, we will separate 2 distillates using their differences in boiling points.
The boiling points of individual liquids are affected by the impurities of the mixture. Each liquid
will be purified, first in a fractional distillation and then in a simple distillation. A fractional
distillation involves a longer vertical pathway in which the volatile vapors travel past the
condenser. Because fractional distillation involves a longer condensing column than simple
distillation, some of the volatile liquid will re-condense. This process of vaporizing and
condensing produces relatively pure products. After fractional distillation is complete, gas
chromatography will be used to determine the exact make up of the condensed liquid. Finally,
simple distillation will be performed on the original mixtures so that one can compare a plot of
temperature versus volume for both fractional and simple distillations.
PROCEDURE
Fractional Distillation
• Obtain 30-mL sample of a mixture of cyclohexane and toluene. Save 0.5-mL of
undistilled mixture in a stoppered and labeled vial for analysis by gas chromatography.
Record the mixture unknown.
• Pack the fractional column with steel sponge (loosely). Allow to drain later without
water.
• Set up distillation apparatus for fractional distillation. Use a graduated cylinder as the
receiver.
• Use a variable transfer with a thermowell heater as a heat source.
• Use a small amount of stopcock grease on joints and use keck clips to secure the
condenser.
• Begin heating and regulate so that there is one drop every 1-2 seconds. Note and record
the head temperature and the total accumulated volume of distillate in the receiving
cylinder when the heat is regulated. o Fraction A: Use 25-mL graduated cylinder to collect, Ambient to ~85º (+/- ca.3º).
Major fraction should contain most of the cyclohexane.

o Fraction B: Use 10-mL graduated cylinder to collect, Ambient to ~85º (+/- ca.3º)
to ~106º. This fraction ideally should be small. It will be a mixture of
cyclohexane and toluene.
o Fraction C: Transfer contents A to labeled Erlenmeyer and stopper. Drain, do not
wash for C. ~106º to 108º Major fraction and should contain most of the toluene.
• Remember: “Only when the temperature begins to rise after the first temperature
“plateau” should the receiver be changed from fraction A to fraction B.
• When the distilling flask has a volume of 1-mL, turn the system off and let it cool.
Gas Chromatography
• Analyze fractions A, B, and C by gas chromatography
• Measure the area of each peak (height * width (@ half the height)) using the
“triangulation” method
• Record and obtain areas of peaks with the electronic integrator on the machine.
Simple Distillation
• Recombine your distillate with your pot residue and repeat the distillation using a simple
distillation apparatus. Use graduated cylinder to collect. Record head temperature as a
function of total volume of distillate in 2-mL increments. TABLE 1: REAGENTS
Compound
Number
Compound Boiling
Point (ºC)
Molecular Weight
(g/mol)
Cyclohexane
80.7
84.16
2
H3C Toluene
110.6
92.14
1
RESULTS AND OBSERVATIONS
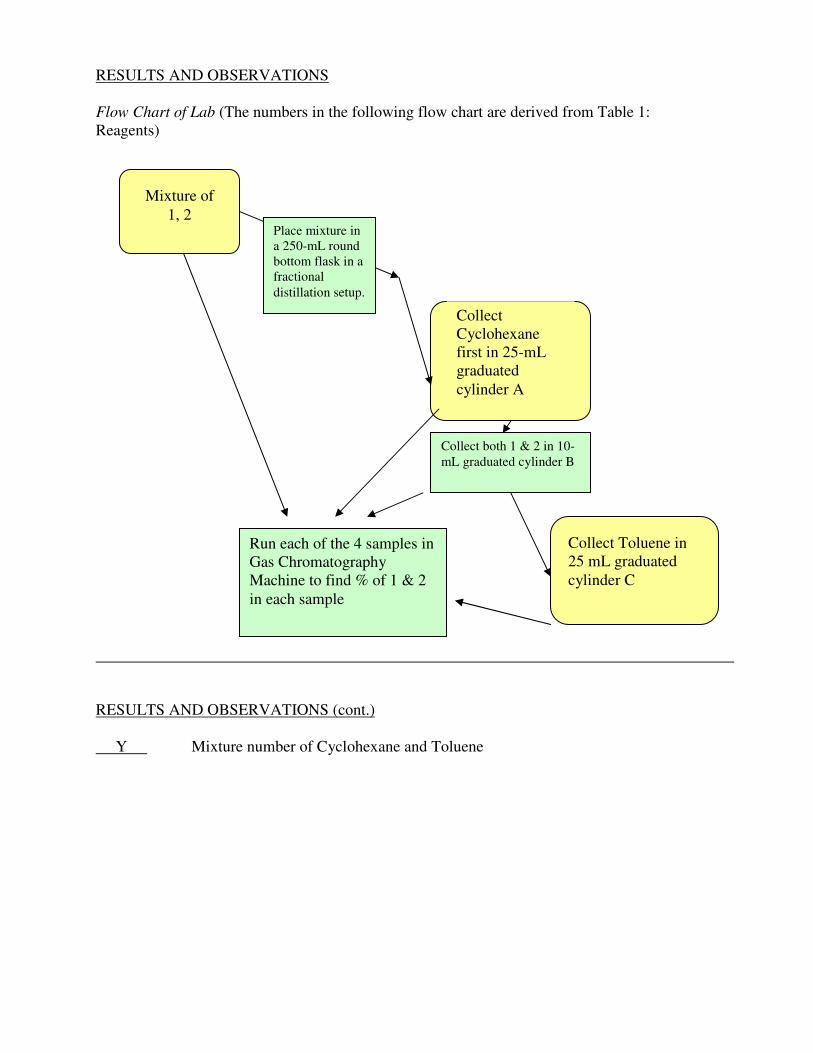
Flow Chart of Lab (The numbers in the following flow chart are derived from Table 1:
Reagents)
RESULTS AND OBSERVATIONS (cont.)
Y Mixture number of Cyclohexane and Toluene
Mixture of
1, 2 Place mixture in
a 250-mL round
bottom flask in a
fractional
distillation setup.
Collect
Cyclohexane
first in 25-mL
graduated
cylinder A
Collect both 1 & 2 in 10-
mL graduated cylinder B
Collect Toluene in
25 mL graduated
cylinder C
Run each of the 4 samples in
Gas Chromatography
Machine to find % of 1 & 2
in each sample

TABLE 1: TEMPERATURE AND VOLUME OF DISTILLATIONS
Fractional Distillation Simple Distillation
Initial Temperature: 77.5 ºC Initial Temperature: 83.9 ºC
Initial Volume: 0.0 mL
Initial Volume: 0.0 mL
Temp (ºC) Volume (mL) Fraction Temp (ºC) Volume (mL)
77.5 0.0 A 83.9 0.0
79.8 2.0 A 85.0 2.0
80.3 4.0 A 86.6 4.0
80.8 6.0 A 88.3 6.0
81.6 8.0 A 89.5 8.0
82.0 10.0 A 90.0 10.0
83.7 12.0 A 91.0 12.0
84.9 14.0 A 91.0 14.0
84.5 15.1 A 91.2 16.0
92.5 18.0
89.2 15.10 B 94.9 20.0
103.1 17.10 B 99.0 22.0
104.8 19.10 B 101.9 24.0
104.9 19.24 B 103.6 26.0
104.9 19.24 C
105.1 21.24 C
105.2 23.24 C
104.3 24.64 C
TOTAL
Volume
24.64 26.0
During this experiment the mixture of unknown Y was placed in a 50 mL round bottom
flask in a fractional distillation setup. The temperature of the variable heating device was slowly
increased until drops were seen at a rate of 1 drop every 1-2 seconds. The temperature was
recorded after each 2 mL of distillate (Table 1). When the temperature reached a steady
temperature of 84.5 ºC, Fraction B was collected till a steady temperature of 104.9 ºC. Then the
rest of the distillate, Fraction C, was collected. The temperature was recorded after each 2 mL of
distillate collected (Table 1). The three samples, along with the original Y sample mixture was
taken to the gas chromatograph for analysis to determine the % composition. (Table 2)
A simple distillation set-up was used for the second part of the lab. 30 mL of fresh Y
mixture was used in the simple distillation. The variable temperature heating device was
regulated once again to yield 1 drop every 1-2 seconds. The temperature was recorded every 2
mL of distillate. The distillate was not separated because the data recorded was only used to plot
and compare with the fractional distillation data. (Table 1)
It is important to note that I was abruptly impeded with a fire drill during the distillation
of fraction A. I do not think that the decrease in temperature for 20 minutes during the drill had
a negative impact on the distillation.
I could have done a better job of being patient during the simple distillation process. At
first, the drops of distillate were dropping faster then the recommended pace. Also, closer
monitoring of the temperature every 2 mL would prove much more accurate if I were to do the
lab again.
Gas Chromatograph Data
• GC #4
• Column B
• 2.5 µL
• Polarity (-)
• Current: 100 mA
• Column T = 94 ºC
• Detector = 150 ºC
• Injector = 130 ºC
TABLE 2: Gas Chromatograph % Composition in Each Fraction
% Composition Unknown
Mixture Y (%)
Fraction A
(cyclohexane) (%)
Fraction B
(cyclohexane and
toluene) (%)
Fraction C
(toluene) (%)
Cyclohexane 48.85 80.913 26.696 2.011
Toluene 51.15 19.087 73.304 97.989
TABLE 3: Triangulation Method for Determining % Composition in Each Fraction
% Composition Unknown
Mixture Y (%)
Fraction A
(cyclohexane) (%)
Fraction B
(cyclohexane and
toluene) (%)
Fraction C
(toluene) (%)
Cyclohexane 47.73 81.3 24.4 1.4
Toluene 52.27 18.7 74.6 98.6

CHART 1: Fractional Distillation
Fractional Distillation
60
65
70
75
80
85
90
95
100
105
110
115
120
0 2 4 6 8 10 12 14 16 18 20 22 24 26
Volume (mL)
Te
mp
era
ture
(d
eg
rees
Ce
lciu
s)
Fractional Distillation
CHART 2: Simple Distillation
Simple Distillation
60
65
70
75
80
85
90
95
100
105
110
115
120
0 2 4 6 8 10 12 14 16 18 20 22 24 26 28
Volume Distillate (mL)
Te
mp
era
ture
(d
eg
rees
Ce
lciu
s)
Simple Distillation
A
B C
A (approximate)
B (approximate)
C (approximate)

CHART 3: Gas Chromatography Analysis of Mixture Y
CHART 4: Gas Chromatography Analysis of Fraction A
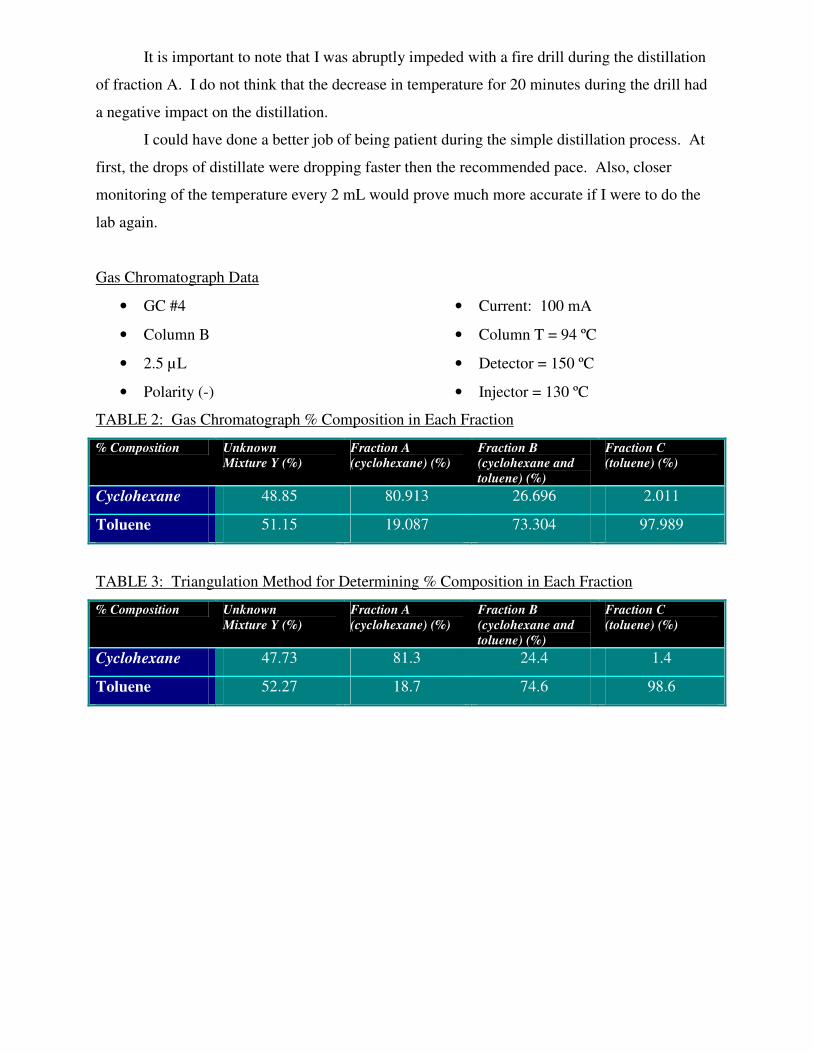
CHART 5: Gas Chromatography Analysis of Fraction B
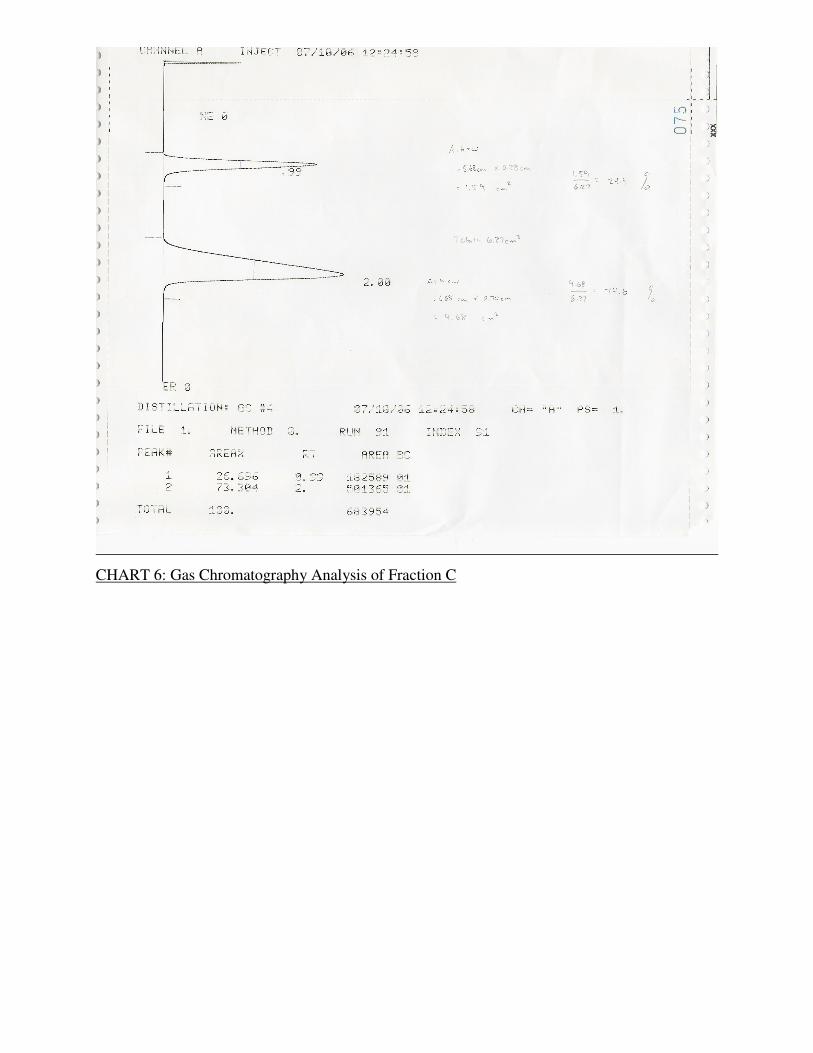
CHART 6: Gas Chromatography Analysis of Fraction C

INTERPRETATION OF INSTRUMENTAL DATA
The % composition was obtained by the GC analysis and the “triangulation method”. As
shown in Table 2 and Table 3, the values for the % composition were very similar. However, the
electronic GC method was undoubtedly better because of the number of opportunities for
measuring errors with the ruler. The “triangulation method” is shown for each sample in Charts
3-6 above.
Graph 1 shows temperature versus volume of distillate collected for fractional distillation.
The best fit curve that can be drawn for the data is fairly consistent with curves found in Gilbert
and Martin (p 125). There was a sharp increase for Fraction B, as expected. However, in one
instance, the same volume remained for different temperatures. This could be explained by
human error in recording or the distillate not completely running down the condenser in a
consistent manner.
Graph 2 shows temperature versus volume of distillate collected for simple distillation.
A consistent curve displays the approximate fractions of A, B, and C. Graph 2 also shows how
fraction B is a significant portion of the volume of both compounds, cyclohexane and toluene.

One can compare Graph 2 with Graph 1, which minimizes the volume of Fraction B and
separates each compound out more completely. This analysis is backed up by the % composition
data found in Table 2 & 3.
CONCLUSION
In this experiment, we separated 2 distilllates using two different means: fractional
distillation and simple distillation. The boiling point of two compounds in a mixture allowed us
to collect the volume as a function of increasing temperature. Gas chromatograph analysis
verified the percent composition in each collection sample and the “triangulation method” was
used to verify the GC results. Graphing the temperature versus volume for each distillation
clearly showed how superior fractional distillation is as compared to simple distillation. The
purity of the samples during the fractional distillation proved to be better. In addition, fractional
distillation uses a well insulated column that allowed the mixture to vaporize and recondense,
improving our results. Overall, the purpose of separating two compounds in a mixture was
achieved relatively well using fractional distillation.
ANSWERS TO ASSIGNED QUESTIONS
11) Given
• Pºmethanol = 406 torr (vapor pressure)
• Pºethanol = 222 torr
• Xmethanol = 0.1
• Xethanol = 0.2
Work and Analysis
• Nmethanol = 0.1 / 0.3 = 0.33
• Nethanol = 0.2 / 0.3 = 0.66
• Pmethanol = Pºmethanol * Nmethanol
Pmethanol = (406 torr)*(0.33) = 134 torr Methanol
• Pethanol = Pºethanol * Nethanol
Pethanol = (222 torr)*(0.66) = 147 torr Ethanol
• Ptotal = 134 torr + 147 torr = 281 torr Total Pressure
