k0133 yeoville rcg church tia v0 wk ek...
TRANSCRIPT

Traffic Impact Assessment
25 FEBRUARY 2019
Yeoville, Revelation Church of God (RCG)
www.koleko.co.za
REPORT

Quality Management
Project Name K0133 – Yeoville, RCG Traffic Impact Assessment (TIA)
Date of Issue 26 February 2019
Project No. K0133
Version DRAFT
Prepared by: Hlulani J. Mathebula (BSc Eng. Civil)
Reviewed by: Elias Kabinde (PrTechEng) Transport Planning
Client: Revelation Church of GOD
Consultant:
Tel: 010 205 9294 Building 16, Woodlands Office Park Fax: 086 679 3575 20 Woodlands Drive, 2091 Email: [email protected] Woodmead, Johannesburg Web: www.koleko.co.za South Africa

TRAFFIC IMPACT STUDY
YEOVILLE, RCG
i
K0133- Yeoville, RCG TIA
Contents
1. Introduction 1
2. Background 2
3. Purpose of the Assessment and the Scope of Work 2
4. Development Location and Land Use 3
5. Existing Surrounding Road Network 4
6. Future Road Network 10
7. Access Arrangements 11
8. Peak Hours Analyses 11
9. Development Trip Generation 12
10. Trip Distribution and Trip Assignment 13
11. Analyses Scenarios and Analysis Parameters 13
12. Traffic Impact and Capacity Analyses 16
13. Proposed Upgrades 17
14. Public Transport and Non-Motorised Transport (NMT) 18
15. Parking 19
16. SDP 19
17. Conclusion 19
18. Recommendations 20

TRAFFIC IMPACT STUDY
YEOVILLE, RCG
ii
K0133- Yeoville, RCG TIA
List of Annexures
Annexure A: Site Layout ...................................................................................................................... 22
Annexure B: Locality Map and Study Area ........................................................................................... 23
Annexure C: Provincial (GPDRT) Road Network (K133) ..................................................................... 24
Annexure D: Proposed Access Plan .................................................................................................... 25
Annexure E: Traffic Flow Diagrams & Overall Intersection, Capacity Analysis Results ....................... 26
Annexure F: Trip Generation Tables ................................................................................................... 27
Annexure G: Detailed Capacity Analysis Results ................................................................................ 28
Annexure H: Proposed, Functionality Upgrades .................................................................................. 29

TRAFFIC IMPACT ASSESSMENT YEOVILLE, RCG
1
K0133- Yeoville, RCG TIA
Yeoville, RCG
Traffic Impact Assessment
Description Reference
1. Introduction
The Revelation Church of GOD (RCG) is planning to
construct a church building to serve as a place of worship for
its membership. The proposed development will be situated
on Stand 1308, Yeoville, and Stand 67, Highlands, in the City
of Johannesburg (CoJ), hereinafter referred to as ‘Site’.
The client had planned to accommodate about 20’000
people within the development. However, initial discussions
between Koleko as the traffic engineer and the Architect
(Shabangu Architects) show that no more than 10’000
people can be accommodate within the yet to be
conceptualised building structure. This is based on aspects
such as the permissible building coverage, parking provision,
and the site topography. Therefore, the Traffic Impact
Assessment (TIA) is based on the absolute maximum of
10’000 people.
The site development plan (SDP) is yet to be drafted. The
site is shown on the layout in Annexure A.
Koleko Solutions (Pty) Ltd was appointed to conduct a traffic
impact assessment for the proposed development. This
report summarises the findings of the assessment.
Annexure A

TRAFFIC IMPACT ASSESSMENT YEOVILLE, RCG
2
K0133- Yeoville, RCG TIA
Yeoville, RCG
Traffic Impact Assessment
Description Reference
2. Background
The RCG church currently operates at a Synagogue near
Joubert Park in the CBD, corner of Claim Street and Smit
Street. The church operations will be relocated from this
Synagogue to the Yeoville church building. There are plans
to start operations at the Yeoville site, through use of
temporary structures, i.e. tent(s), portable toilets, etc., whilst
the permanent building and facilities is under construction.
Most people currently walk to the RCG church in the CBD
and some use the available public transport system. Few
people drive to the RCG church. The same people or
majority of the current membership/patrons are expected to
attend the church in Yeoville. Thus, the vast majority will still
walk to the church or use minibus taxis and/or the BRT
system and/or private lift clubs.
3. Purpose of the
Assessment and the
Scope of Work
The purpose of this TIA is to assess the impact of the
development traffic on the surrounding road network and to
provide traffic related recommendations and mitigation
measures where necessary in order to obtain the required
approval for the proposed land use rights.
This study was conducted following the requirements of the
TMH 16 (COTO, 2012). According to this manual, it is
required that a traffic impact assessment is undertaken for
developments that generate more than 50 vehicle trips
during the peak hour. Therefore, to comply with this
requirement, this traffic impact assessment was prepared for
the proposed RCG church.
The methodology of the traffic impact assessment consists
of traffic surveys and analysis of the road network and
intersections surrounding the proposed development.

TRAFFIC IMPACT ASSESSMENT YEOVILLE, RCG
3
K0133- Yeoville, RCG TIA
4. Development
Location and Land Use
The proposed development is located on adjacent sites in
Yeoville (Erf 1308) and in Highlands (Erf 67), City of
Johannesburg (CoJ). The Site, i.e. both erven combined is
bounded by Percy street and Highlands street to the north.
Both erven are currently zoned ‘Residential 4’.
There are currently only two (one in each erf), old and
dilapidated buildings on the site that are not being used.
Figures 1 and 2, Annexure B shows the location of the
proposed development.
The zoning that will be applied for Erf 1308 is ‘Special’, for a
Public Place of Worship. Erf 67 will be zoned for parking.
This parking will be used to support the church operations on
Erf 1308, where the church building and associated
outbuildings will be situated.
The initial brief according to the RCG church administration,
the vision was to accommodate approximately 20’000
people in the church. However, discussions with the Architect
point to the likely possibility that the building that can be fitted
on Erf 1308 is most likely not going to be able to
accommodate more than 10’000 people seated. Therefore,
the TIA is based on a maximum of 10’000 seated people.
The number of parking bays that can be accommodated on
Erf 67 will be determined when the Site Development Plan
(SDP) is developed. Currently, the number of parking bays
can be estimated at 500 parking bays (5.0 m X 2.5 bays size,
with 7 m circulating space).
Table 3-1: Land Use
Use Zone No
Erf number
Land-Use
Land Use Extent
1 1308 Place of Worship
10,000 people
2 67 Parking TBC
Figures 1 and 2 in
Annexure B

TRAFFIC IMPACT ASSESSMENT YEOVILLE, RCG
4
K0133- Yeoville, RCG TIA
Yeoville, RCG
Traffic Impact Assessment
Description Reference
5. Existing Surrounding
Road Network
During the site visit, it was noticed that in general, the lane
markings are faded and the sidewalks are in a poor
condition.
This section briefly describes the existing roads:
Percy Street:
Percy Street is a Class 5 paved road with one lane per
direction and pedestrian sidewalks on both sides of
the road. This road is situated to the north of the site.
This road intersects with Grafton Road, Highlands
Street and Hendon Street. Figure 5- 1 below shows
an image of Percy street.
Figure 5-1: Percy Street

TRAFFIC IMPACT ASSESSMENT YEOVILLE, RCG
5
K0133- Yeoville, RCG TIA
Highlands street:
Highlands street is a Class 4 paved road with one
lane per direction and pedestrian sidewalks on both
side of the road. It is situated to the north of the
proposed development. This road intersects with
Percy Street and merges to Umlazi Road.
Figure 5-2: Highlands Street
Bezuidenhout Street
Bezuidenhout Street is a Class 4 paved road, with one
lane per direction and a pedestrian sidewalk on both
sides of the road. This road intersects with Durban
road and Paddock street. Bezuidenhout Street also
merges to Umlazi Street. Figure 5-3 below shows an
image of the Bezuidenhout Street/ Paddock Street
intersection. Figure 5-4 below shows an image of the
Durban Road/ Bezuidenhout Street intersection.
Figure 5-3: Bezuidenhout Street/ Paddock Street Intersection
TRAFFIC IMPACT ASSESSMENT YEOVILLE, RCG
6
K0133- Yeoville, RCG TIA
Yeoville, RCG
Traffic Impact Assessment
Description Reference
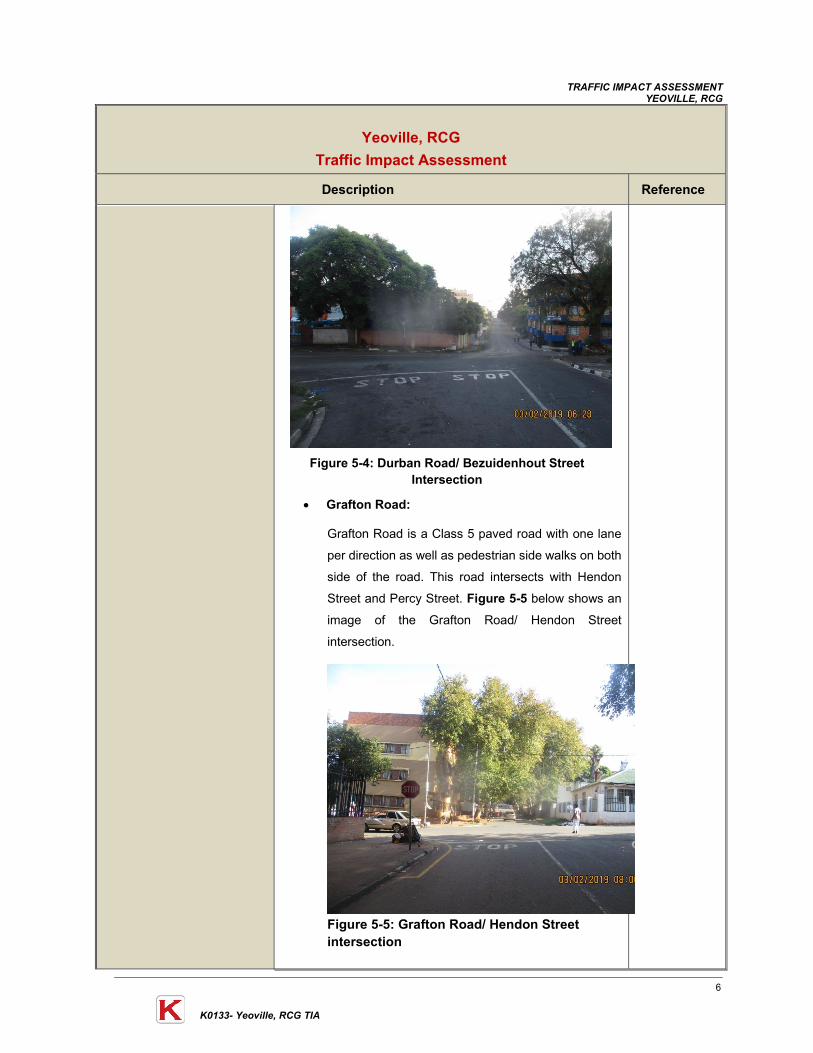
Figure 5-4: Durban Road/ Bezuidenhout Street Intersection
Grafton Road:
Grafton Road is a Class 5 paved road with one lane
per direction as well as pedestrian side walks on both
side of the road. This road intersects with Hendon
Street and Percy Street. Figure 5-5 below shows an
image of the Grafton Road/ Hendon Street
intersection.
Figure 5-5: Grafton Road/ Hendon Street intersection

TRAFFIC IMPACT ASSESSMENT YEOVILLE, RCG
7
K0133- Yeoville, RCG TIA
Hendon Street:
Hendon Street is a Class 5 paved road with one lane
per direction as well as pedestrian sidewalks on both
sides the road. This road intersects with Joe Slovo
Drive, Grafton Street and merges to Harley Street.
Figure 5-6 below shows an image of Hendon Street.
Figure 5-6: Hendon Street
Durban Road
Durban Road is a Class 4 paved road with one lane
per direction as well as pedestrian sidewalks on both
sides of the road. This road merges onto Harley Street
and intersects with Cavendish Road and
Bezuidenhout Street. Figure 5-7 below shows an
image of Durban Road.
TRAFFIC IMPACT ASSESSMENT YEOVILLE, RCG
8
K0133- Yeoville, RCG TIA
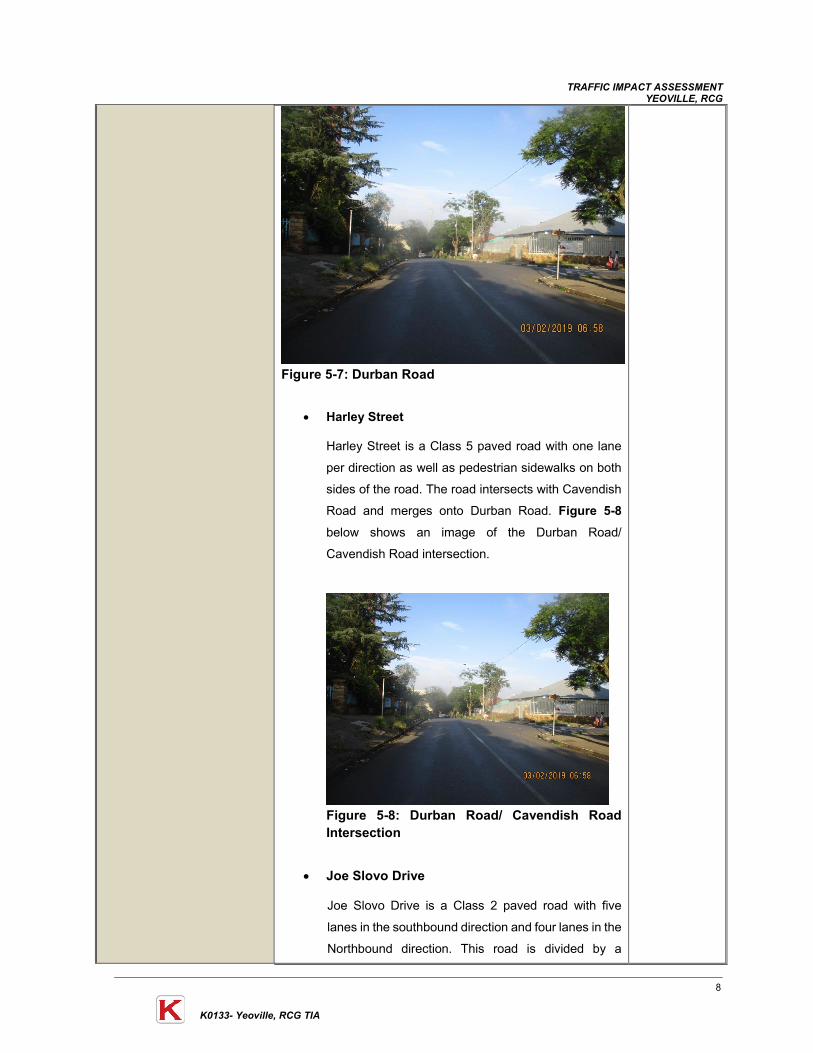
Figure 5-7: Durban Road
Harley Street
Harley Street is a Class 5 paved road with one lane
per direction as well as pedestrian sidewalks on both
sides of the road. The road intersects with Cavendish
Road and merges onto Durban Road. Figure 5-8
below shows an image of the Durban Road/
Cavendish Road intersection.
Figure 5-8: Durban Road/ Cavendish Road Intersection
Joe Slovo Drive
Joe Slovo Drive is a Class 2 paved road with five
lanes in the southbound direction and four lanes in the
Northbound direction. This road is divided by a

TRAFFIC IMPACT ASSESSMENT YEOVILLE, RCG
9
K0133- Yeoville, RCG TIA
Yeoville, RCG
Traffic Impact Assessment
Description Reference
median and there are pedestrian sidewalks on both
sides of the road. The road intersects with Hendon
Street. Figures 5-9 and 5-10 below show images of
the northbound leg and southbound leg of Joe Slovo
Drive respectively.
Figure 5-9:Northbound leg of Joe Slovo Drive
Figure 5-10:Southbound leg of Joe Slovo Drive
Fortesque Road
Forteaque Road is a Class 4 paved road with one
lane per direction as well as pedestrian sidewalks on
both sides of the road. This road intersects with
Hendon Street. This intersection is in a bad condition

TRAFFIC IMPACT ASSESSMENT YEOVILLE, RCG
10
K0133- Yeoville, RCG TIA
Yeoville, RCG
Traffic Impact Assessment
Description Reference
with potholes and requires maintenance. Figure 5-11
below shows an image of Fortesque road.
Figure 5-11: Fortesque Road
6. Future Road Network
Based on the currently available information, the current road
network is not expected to change in the near future.
The nearest provincial road to the site is the K133 (Joe
Sloveo Drive), which is situated approximately 120 m west
of the site.
The proposed RCG church development will not have any
direct impact on the K133 (see Annexure C) alignment or
the road reserve.
Annexure C

TRAFFIC IMPACT ASSESSMENT YEOVILLE, RCG
11
K0133- Yeoville, RCG TIA
Yeoville, RCG
Traffic Impact Assessment
Description Reference
7. Access
Arrangements
Existing Accesses
There is currently one access to Erf 67, Highlands. The
access is on Highlands Street. In addition, there is currently
only one access to Erf 1308, Yeoville. The access is on
South Lane.
Proposed Accesses
Four accesses to the site (i.e. the site consisting of erven 67
and 1308) are proposed. One access on Percy Street, two
accesses on Highlands Street (common intersection) and
one access on South Lane.
The access to Erf 1308 on Highlands Street is planned to be
used by mainly the delivery vehicles, refuse collection trucks
and bus pick-up and drop-offs.
Private vehicles will use all other accesses. An internal,
driving path may link accesses.
All proposed accesses will be controlled by means of a
sliding gate. There will be one inbound and one outbound
lane, at all accesses, to allow vehicles to freely drive in and
out of the development. Each lane should be 4.5 m wide.
All accesses should be designed to allow the safe and easy
manoeuvring of heavy vehicles (busses).
The proposed access arrangement is shown in Annexure D.
Annexure D
8. Peak Hours Analyses
The critical peak hour or critical traffic scenario, from a road
capacity point of view, occurs when the traffic generated by
the development is a maximum or when the highest
combination of existing street traffic and traffic generated by
the development occurs. Based on the expected trip
generation and traffic volumes on the surrounding road
network, the critical peak hours on the surrounding road
network were determined.
Figure 3- 5 Annexure E

TRAFFIC IMPACT ASSESSMENT YEOVILLE, RCG
12
K0133- Yeoville, RCG TIA
Yeoville, RCG
Traffic Impact Assessment
Description Reference
Based on the traffic counts that were carried out on
Thursday, 31 January 2019, and Sunday, 03 February 2019,
the peak hours were found to be the following:
Thursday PM peak hour: from 16:45 to 17:45;
Sunday PM peak hour: from 16:45 to 17:45.
The following intersections were surveyed:
1. Grafton Rd/ Percy St;
2. Highlands St/ Percy St;
3. Cavendish Rd/ Harley St;
4. Bezuidenhout St/ Durban Rd;
5. Grafton Rd/ Hendon St;
6. Joe Slovo Dr/ Abel Rd/ Hendon St; and
7. Fortesque Rd/ Harley St
Figure 3, Annexure E shows the intersection layouts.
Figures 4 and 5, Annexure E shows the AM and PM peak
hour traffic volumes.
9. Development Trip
Generation
The trip generation of the proposed RCG Church was
estimated based on the trip generation rates recommended
in the South African Trip Data Manual (COTO, 2012).
Availability of Public Transport
The site is well served by public transport and it is expected
that majority of the members of the RCG will travel using
public transport or NMT. Provisions will also be made on site
for parking of buses transporting the members of RCG.
Car Ownership
Considering the demographics of the areas surrounding the
church, it is expected that the members would have a very
low vehicle ownership. Therefore, trip generation adjustment
factors can be applied for very low vehicle ownership and
transit nodes and corridors.
Tables 1 & 2 Annexure F

TRAFFIC IMPACT ASSESSMENT YEOVILLE, RCG
13
K0133- Yeoville, RCG TIA
Yeoville, RCG
Traffic Impact Assessment
Description Reference
The resultant combined trip generation adjustment factor is
expected to be 83% and the resultant trip generation for the
proposed development, in vehicles per hour (vph), is
expected to be:
1. Weekday PM Peak Hour:
68 vehicle trips IN.
17 vehicle trips OUT.
2. Sunday Peak Hour:
995 vehicle trips IN.
111 vehicle trips OUT.
The expected total trip generation during the weekday and
Sunday peak hours are 85 vehicles/hour and 1’105
vehicles/hour, respectively.
The trip generation calculation summary is shown on Table
1 an Table 2 in Annexure F.
10. Trip Distribution and
Trip Assignment
The assumptions made with respect to the expected trip
distribution were based on the location of the site access in
relation to the surrounding road network, the existing traffic
volumes, travel patterns as well as the land use nature of the
proposed development.
Figures 6, 7 and 8 show the expected trip distribution and
assignment, respectively, of the proposed development.
Figures 6 - 8
Annexure E
11. Analyses Scenarios
and Analysis Parameters
The following scenarios were analysed as part of this report:
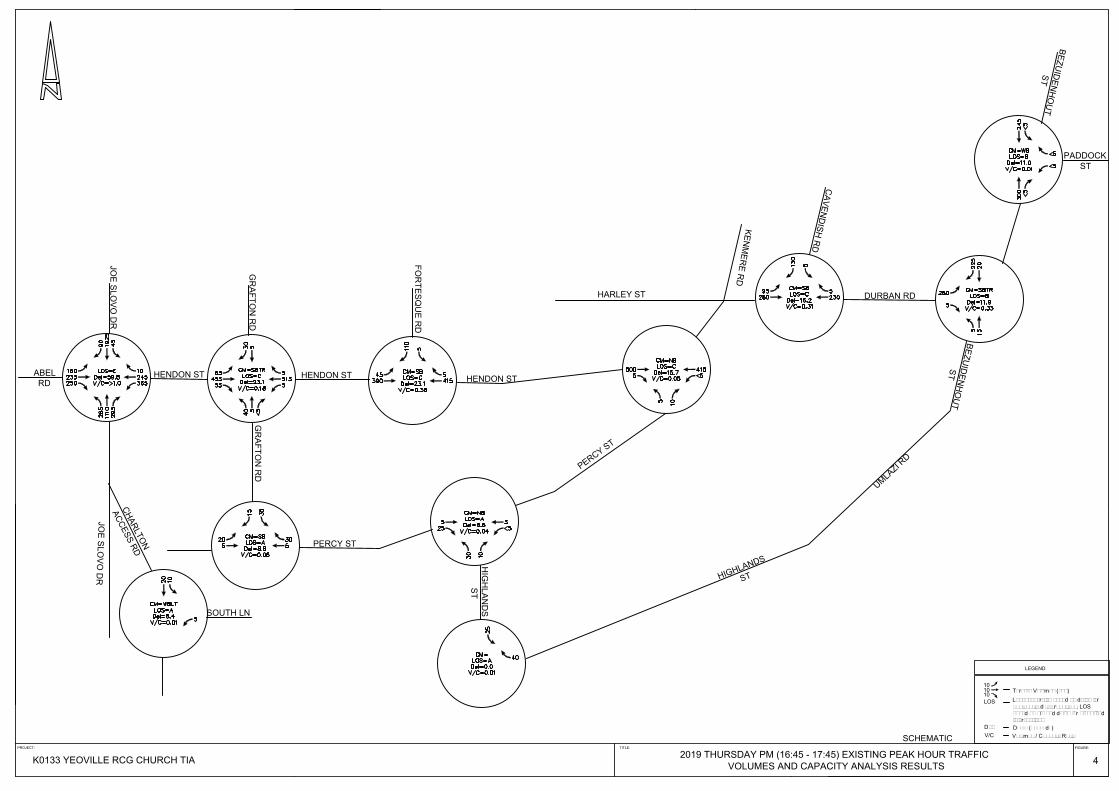
Scenario 1: 2019 Thursday PM and Sunday
Existing (only) Peak Hour Traffic volumes. This
scenario was based on the existing geometry and
intersection control. The scenario evaluated the
existing intersection operating conditions for a
Thursday PM and Sunday PM peak hour traffic for the
year 2019. The analysis results are shown in Figures
4 and 5, Annexure E.
Figures 4 - 14
Annexure E

TRAFFIC IMPACT ASSESSMENT YEOVILLE, RCG
14
K0133- Yeoville, RCG TIA
Yeoville, RCG
Traffic Impact Assessment
Description Reference
Scenario 2: 2019 Thursday PM and Sunday PM
Existing PLUS Development Peak Hour Traffic
volumes. This scenario was based on the existing
geometry and intersection control. The scenario
evaluated the intersection operating conditions for the
existing traffic volumes including the proposed
development for the year 2019. The analysis results
are shown in Figures 9 and 10, Annexure E.
Scenario 3: 2024 Thursday PM and Sunday PM
Background Peak Hour Traffic volumes. This
scenario was based on the existing geometry and
intersection control. The scenario evaluated the
intersection operating conditions for the 2024
background traffic. A growth rate of 1.5% per annum
was applied to the existing 2019 existing traffic
volumes to determine the 2024 traffic demand. The
analysis results are shown in Figures 11 and 12,
Annexure E.
Scenario 4: 2024 Thursday PM and Sunday PM
Total Peak Hour Traffic volumes. This scenario was
based on the existing geometry and intersection
control. The scenario evaluated the intersection
operating conditions for the 2024 background
including the proposed development traffic. A growth
rate of 1.5% per annum was applied to the existing
2019 existing traffic volumes to determine the 2024
traffic demand. The analysis results are shown in
Figure 13 and 14, Annexure E
Analyses Variables
The variables used for the assessment of the traffic impact
are obtained from the Highway Capacity Manual (HCM),
2010. The variables are as follows:

TRAFFIC IMPACT ASSESSMENT YEOVILLE, RCG
15
K0133- Yeoville, RCG TIA
Yeoville, RCG
Traffic Impact Assessment
Description Reference
Levels of service (LOS) at intersections: Is a measure of
intersection performance determined based on the average
delay at intersections. In most rural and urban areas, an
overall LOS of A to D is acceptable. LOS E or F is considered
undesirable. The LOS definitions based on vehicle delay and
V/C at intersections is provided in Table 12.1 and 12.2.
Table 12.1: Levels of Service for Signalized Intersections Control Delay per Vehicle in Seconds
Levels of Service V/C< 1.0
Levels of ServicV/C> 1.0
< 10 A F <10 - 20 B F <20 - 35 C F <35 - 55 D F <55 - 80 E F
< 80 F F
Table 12.2: Levels of Service for Unsignalized Intersections
Control Delay per Vehicle in Seconds
Levels of Service V/C< 1.0
Levels of ServicV/C> 1.0
< 10 A F <15 - 25 B F <20 - 35 C F <25 - 35 D F <35 - 50 E F
< 50 F F
Delay is a measure of intersection or roadway performance. It
is the measure of driver discomfort, frustration, fuel
consumption, and lost travel time. Delay at intersections
depends on various factors such as the type of signal control,
the volume of traffic and volume/capacity ratio of each
approach at an intersection
Volume / Capacity Ratio (v/c): A measure of intersection or
roadway performance. It is the ratio of a number of vehicles
on the road to the available capacity of the roadway. The
intersection capacity in the study area will be rated based on
the volume/capacity ratio. According to the National

TRAFFIC IMPACT ASSESSMENT YEOVILLE, RCG
16
K0133- Yeoville, RCG TIA
Yeoville, RCG
Traffic Impact Assessment
Description Reference
Department of Transport Manual for Traffic Impact Study
(2012), the intersection capacity should be evaluated as
follows:
v/c<1: the intersection operates under capacity,
v/c=1: the intersection operates at capacity,
v/c>1: the intersection operates over capacity,
Road upgrades should be investigated when the v/c ratio
exceeds 0.95.
12. Traffic Impact and
Capacity Analyses
Traffix micro-analytical network analysis tool, was used to
assess the impact at the intersections. Below is the summary
of the analysis.
Scenario 1 – 2019 weekday (Thursday) PM background
traffic.
Scenario 1: 2019 Thursday PM and Sunday Existing
Peak Hour Traffic volumes
From the capacity analysis, it was found that all intersections
that were analysed, operate at LOS D or better and under
capacity with the exception of Joe Slovo Drive/ Hendon Street
intersection during the Thursday PM peak hour.
Scenario 2: 2019 Thursday PM and Sunday Existing
+ Development Peak Hour Traffic volumes.
From the capacity analysis, it was found that all intersections
that were analysed, operate at LOS of D or better and under
capacity with the exception of Joe Slovo Drive/ Hendon Street
intersection during the Thursday PM peak hour and Grafton
Road/ Hendon Street intersection during the Sunday PM peak
hour.
Scenario 3: 2024 Thursday PM and Sunday
Background Peak Hour Traffic volumes.
Figures 4 - 14
Annexure E

TRAFFIC IMPACT ASSESSMENT YEOVILLE, RCG
17
K0133- Yeoville, RCG TIA
Yeoville, RCG
Traffic Impact Assessment
Description Reference
From the capacity analysis, it was found that all intersections
that were analysed, operate at LOS D or better and under
capacity with the exception of Joe Slovo Drive/ Hendon
Street intersection during the Thursday PM peak hour.
Scenario 4: 2024 Thursday PM and Sunday Total
Peak Hour Traffic volumes.
From the capacity analysis, it was found that all intersections
that were analysed, operate at LOS D or better and under
capacity with the exception of Joe Slovo Drive/ Hendon
Street intersection during the Thursday PM peak hour.
The capacity analysis results are shown in Annexure G.
Deduction from the Capacity Analysis
The traffic impact of the proposed RCG church is expected
to be minimal during the weekdays (Monday to Friday). No
capacity upgrades are required to mitigate or to
accommodate the development traffic. The existing road
network should be sufficient to accommodate the
development traffic.
On Sundays, the traffic impact of the RCG church will be
noticeable but not critical. Temporal delays may be
experienced, especially in the afternoon between 15:00 and
17:00 and generally, when the church is full.
The traffic impact of the church will be minimal to negligible
when fewer than 3’000 people are attending a service.
13. Proposed Upgrades
The following upgrades are required:
Capacity Upgrades
From a capacity perspective, no physical upgrades are
required to improve capacity. However, since it was found
that the Grafton Road/ Hendon Street intersection operated
at LOS F after the development volumes were considered, it
Annexure F

TRAFFIC IMPACT ASSESSMENT YEOVILLE, RCG
18
K0133- Yeoville, RCG TIA
Yeoville, RCG
Traffic Impact Assessment
Description Reference
is recommended that the RCG church deploy a traffic control
team every Sunday to this intersection to control traffic.
Furthermore, it is proposed that the RCG should fund and
implemented the following functionality upgrades:
Functionality Upgrades
Re-paint the faded road markings along Percy
Street, Highlands Street, and South Lane to facilitate
compliance with road traffic law.
Improve the condition of the sidewalks along Percy
Street, Highlands Street and South Lane since there
will be large volumes of pedestrians attracted by the
RCG.
The extent of the upgrades is shown in Annexure H.
14. Public Transport and
Non-Motorised Transport
(NMT)
According to the currently available and accessible
metrobus information, there is no metrobus service
within 500 m radius from the site.
Minibus taxis are accessible within a 300 m walking
distance.
At least two BRT stations are accessible within a 1.0 km
walking distance from the proposed RCG Church. One
station is on Charlotte Terrace Road, near Ellis Park
stadium and the other on Louis Botha Avenue, near its
intersection with Cavendish Road.
There are no Gautrain feeder bus route services in the
area.
Pedestrian sidewalks are located on all roads in the study
area. These sidewalks are generally in a poor condition. The
sidewalks along the development frontage, on Percy Street,
Highlands Street, and South Lane should be maintained or
upgraded.

TRAFFIC IMPACT ASSESSMENT YEOVILLE, RCG
19
K0133- Yeoville, RCG TIA
Yeoville, RCG
Traffic Impact Assessment
Description Reference
15. Parking
Parking for private vehicles should be provided as per the
City of Johannesburg Town Planning Scheme.
It is expected that some of the people that will be going to
the church will do so using shuttle busses and therefore a
pick-up and drop-off facility should be provided on-site as
well as parking for busses. It is recommended that at least 5
bus, parking bays should be provided on-site.
16. SDP
At the time of writing this TIA report, a detailed Site
Development Plan (SDP) was not available.
The following transportation facilities should be assessed
when the SDP is developed:
Parking circulations and number of parking bays.
Internal circulation (width and alignment of roads).
Drop-off/ pick-up facilities (for busses and minibuses).
Deliveries and emergency vehicle accommodation.
17. Conclusion
Based on the findings of this study, the following conclusions
are made:
The proposed development will accommodate
10,000 people (or fewer) within the church
building(s) on site.
Based on the TMH 16 trip generation approach, the
trip generation of the RCG church is expected to be
85 and 1’105 vehicles per hour during the weekday
PM and Sunday PM peak hours, respectively.
Analysis of the current (2019) and future (2024)
background traffic on the current road network
shows that all the intersections that were analysed
operate and will continue to operate at LOS D or
better during the weekday PM and Sunday PM peak
hours. The exception is Joe Slovo Drive/ Hendon

TRAFFIC IMPACT ASSESSMENT YEOVILLE, RCG
20
K0133- Yeoville, RCG TIA
Yeoville, RCG
Traffic Impact Assessment
Description Reference
Street intersection, which during the weekday PM
peak hour, operates at LOS F.
Analysis of the current (2019) and future (2024)
background traffic with Development traffic, on the
current road network shows that all the intersections
that were analysed operate and will continue to
operate at LOS D or better during the weekday PM
and Sunday PM peak hours. The exception is Joe
Slovo Drive/ Hendon Street intersection during the
weekday PM and the Grafton Road/ Hendon Street
intersection during the Sunday PM peak hour.
The estimated number of trips that will be added to
the Joe Slovo Drive/ Hendon Street intersection by
the RCG church is expected to be fewer than 75 vph.
18. Recommendations
In order to mitigate and/or to accommodate the propose
RCG Church development the following
recommendations are made:
To mitigate the impact of increasing the delays at the
Grafton Road / Hendon Street intersection, the RCG
should deploy traffic control team (Pointsmen) to
control the traffic at this intersection, when most of
the church traffic is expected to arrive at the church
or when leaving.
Paint road markings along Percy Street, Highlands
Street, and South Lane.
Improve the condition of the sidewalks along Percy
Street, Highlands Street, and South Lane.
Implement the access plan as detailed in this TIA.
Provide the open parking on Erf 67.
It is recommended that the proposed Yeoville RCG Church
be approved from a traffic engineering perspective.

TRAFFIC IMPACT ASSESSMENT YEOVILLE, RCG
21
K0133- Yeoville, RCG TIA
Annexures

TRAFFIC IMPACT STUDY YEOVILLE, RCG
Annexure A: Site Layout

SEWER NOTES:ALL WORK IN STRICT ACCORDANCE WITH SANS CODE 0400FOR CLOSED SYSTEM.
ALL UNDERGROUND PVC PIPES TO SANS 791.
ALL ABOVE GROUND PVC PIPES TO SANS 967.
ALL SEWER PIPES UNDER BUILDINGS AND ROADWAYS TOBE ENCASED IN 350mm CONCRETE.
ALL SEWER PIPES WITH LESS THAN 300mm COVER TO BEENCASED IN CONCRETE.
INSPECTION EYES TO BE BOXED AND MARKED.RODDING EYES TO HAVE 150mm CONC. COLLAR.
HEALTH DEPARTMENT NOTES:
* DUST CONTROL MEASURES TO BE TAKEN ONDEVELOPMENT* CHEMICAL TOILETS TO BE PROVIDED ON SITEBEFORE CONSTRUCTION COMMENSCES* REFUSE AREA TO BE PROVIDED WITH ACEMENT FLOOR AND SLOPE TO GULLEY* MEASURES TO BE TAKEN TO CONTROL NOISEDURING CONSTRUCTION* ALL BUILDING RUBBLE TO BE TAKEN TO ANAPPROVED DUMPING SITE* NO OPEN FIRES OR BURNING OF REFUSE WILLBE PERMITTED ON SITE
U REFUSE DISPOSAL
BY ELECTRICAL MEANS AS INDICATED IN PART O ABOVE.
APPROVAL PRIOR TO OPEN OFFICE SPACES BEING SUBDIVIDED.
THE ENTIRE PREMISES WILL BE RODENT-PROOFED TO THE SATISFACTION
STORAGE AREA FOR REFUSE CONTAINERS IS PROVIDED IN ACCORDANCE
WILL BE PROVIDED IN ACCORDANCE WITH THE REQUIREMENTS OF THE
DEVIATION PLANS WILL BE SUBMITTED TO THE LOCAL AUTHORITY FOR
WITH THE REQUIREMENTS OF THE LOCAL AUTHORITY
V SPACE HEATING
X GENERAL NOTES
W FIRE INSTALLATION
SEE FIRE PROTECTION PLANS.
OF THE LOCAL AUTHORITY.
LOCAL AUTHORITY.
G EXCAVATIONS
MALES & FEMALES ABLUTIONS TO HAVE MECHANICAL VENTILATION AND
PLEASE REFER TO RATIONAL FIRE DESIGN
ABOVE FACILITIES FOR PERSONS WHO ARE DISABLED
T FIRE PROTECTION
WILL BE DESIGNED SO AS TO ENABLE PERSONS WHO USE A WHEELCHAIR
TO GAIN ACCESS TO THE BUILDING. SUCH RAMPS ARE AT LEAST 1,1m
WIDE WITH A MAXIMUM SLOPE OF 1:12, HAVE LANDINGS MIN. 1,2m LONG
ONE 3,5m WIDE PARKING SPACE FOR DISABLED PERSONS IS PROVIDED ON
DOORS WILL ALL BE NOT LESS THAN 800mm WIDE AND WILL BE PROVIDED
WITH LEVER TYPE HANDLES NOT MORE THAN 1,2m ABOVE THE FINISHED
FOR EVERY 1,5m RISE AND AN APPROVED SLIP-RESISTANT SURFACE.
INTERNATIONAL STANDARD SYMBOLS WILL BE USED TO INDICATE ALL THE
S FACILITIES FOR DISABLED PERSONS
RAMPS FROM THE INTERNAL ROADS TO THE ENTRANCE OF THE BUILDING
A RATIONAL DESIGN WILL BE PREPARED BY A PROFESSIONAL ENGINEER
A COMPLETE STORMWATER CONTROL AND DISPOSAL SYSTEM BASED ON
THRESHOLDS AT DOORS WILL NOT EXCEED 15mm
A LEVEL SURFACE.
FLOOR LEVEL.
SINGLE STACK PIPE SYSTEMS AS SHOWN COMPLYING WITH PART P
40dia WASTE DISCHARGE PIPES TO WBs, SHOWERS, BATHS, SINKS
OF THE NATIONAL REGULATIONS AND COMPRISING THE FOLLOWING: -
Ø100 DISCHARGE STACKS, SOIL DISCHARGE PIPES, DRAINS AND STACK
ACCESS TO THE DRAINAGE INSTALLATION TO BE PROVIDED BY ADEQUATELY
MARKED AND PROTECTED AND PERMANENTLY ACCESSIBLE RODDING EYES
AT ALL CHANGES OF DIRECTION, WITHIN 1,5m OF THE DRAIN CONNECTION
TO THE SEWER, AT THE HIGHEST POINT OF THE DRAIN AND AT 25m
ALL WASTE FITTINGS TO HAVE RESEALING TRAPS AND WATER SEALS NOT
R STORMWATER DISPOSAL
INTERVALS ALONG THE LINE OF THE DRAIN
INSPECTION EYES AT ALL BENDS AND JUNCTIONS
VENTS OF APPROVED MATERIAL.
ARTIFICIAL LIGHTING TO THE APPROVAL OF SABS.
DISCHARGING TO SINGLE STACKS.
Ø50mm SOIL DISCHARGE PIPES TO URINALS.
GULLY TO COMPLY WITH P29
LESS THAN 65mm
P DRAINAGE
0,2sqm WHICHEVER IS THE GREATER.
O LIGHTING AND VENTILATION
GLAZING WILL COMPLY WITH THE REGULATIONS AND THE DEEMED TO
SATISFY RULES OF PART N OF THE NATIONAL BUILDING REGULATIONS
SUCH WINDOW IS TO BE NOT LESS THAN 10% OF THE FLOOR AREA SERVED
HABITAL ROOMS TO BE PROVIDED WITH WINDOWS. THE TOTAL AREA OF ANY
WILL NOT BE LESS THAN 5% OF THE FLOOR AREA OF THE ROOM, OR
OPENING SECTIONS FOR NATURAL VENTILATION THE TOTAL AREA OF WHICH
BY IT FOR NATURAL LIGHT AND SUCH WINDOW WILL BE PROVIDED WITH
STAIRWAYS WILL COMPLY WITH THE REGULATIONS AND THE DEEMED TO
SATISFY RULES OF PART M OF THE NATIONAL BUILDING REGULATIONS
AND SABS CODE OF PRACTICE 0400.
SEE DETAIL SECTION FOR DETAILS.
AND SABS CODE OF PRACTICE 0400.
SEE ROOF PLAN FOR NOTES AND DETAILS
M STAIRWAYS
N GLAZING
AN APPROVED VERTICAL WATERPROOF MEMBRANE TO BE FITTED WHERE A
LEVEL AT THE TOP OF THE SURFACE BED AT LEAST 250mm ABOVE THE
THE FULL THICKNESS OF WALLS TO BE INSTALLED AT ALL WALLS AT THE
ROOFS TO BE ANCHORED TO WALLS IN COMPLIANCE WITH CLAUSE KK13 OF
PARTS G, H, J AND K WILL BE DESIGNED BY A PROFESSIONAL ENGINEER
AND WILL BE EXECUTED IN STRICT ACCORDANCE WITH THE NATIONAL
THE NATIONAL BUILDING REGULATIONS.
BUILDING REGULATIONS AND SABS 0400.
WALL OF A ROOM IS IN CONTACT WITH THE GROUND.
ADJOINING GROUND AND AT ALL WINDOW CILLS.
L ROOFS
H FOUNDATIONS
J FLOORS
K WALLS
AS PER PART B.
AS PER PART B.
AS PER PART B.
D PUBLIC SAFETY
WALL NOT LESS THAN 1m HIGH AND SUCH BALUSTRADE WILL COMPLY
WILL BE EXECUTED IN STRICT ACCORDANCE WITH PART F OF THE
ALL SITE OPERATIONS, INCLUDING PROTECTION OF THE PUBLIC,
AVAILABLE BEFORE THE COMMENCEMENT OF AND THROUGHOUT THE
APPROVED SANITARY FACILITIES FOR ALL PERSONNEL WILL BE
NATIONAL BUILDING REGULATIONS UNDER THE SUPERVISION OF THE
DEMOLITION OF EXTG. STRUCTURES TO BE DONE STRICTLY IN
THE GROUND AREA PRESCRIBED IN CODE OF PRACTICE SABS 0124 SHALL
BE TREATED IN ACCORDANCE WITH THE RECOMMENDATIONS OF SABS 0124
ADJACENT LEVEL IS PROVIDED WITH A BALUSTRADE OR PARAPET
THE EDGE OF ANY CHANGE OF LEVEL MORE THAN 1m ABOVE ANY
F SITE OPERATIONS
DURATION OF THE BUILDING OPERATIONS.
E DEMOLITION WORK
ACCORDANCE WITH SABS 0400 PART E.
ARCHITECT AND THE ENGINEER
SOIL POISONING:
WITH SABS 0400 PART M.
BE DESIGNED BY A PROFESSIONAL ENGINEER WHO HAS CERTIFIED
THAT THE DESIGN COMPLIES WITH THE REQUIREMENTS OF THE NATIONAL
THE DESIGN OF THE STRUCTURAL ELEMENTS AND COMPONENTS WILL
BASED ON THE NATIONAL BUILDING REGULATIONS AND SABS
AUTHORITY FOR APPROVAL WHEN THE OPEN OFFICE AREAS ARE SUBMITTED.
HEIGHT OF 2,55m. DEVIATION PLANS WILL BE SUBMITTED TO THE LOCAL
HABITABLE ROOMS WILL HAVE A FLOOR AREA OF NOT LESS THAN 6sqm,
A MINIMUM HORIZONTAL DIMENSION OF NOT LESS THAN 2m AND A MINIMUM
B STRUCTURAL NOTES
A BUILDING CLASSIFICATION
Code of Practice 0400-1990
C ROOM DIMENSIONS
BUILDING REGULATIONS
NOTES
H3
Fire service connection Booster connection and refluxvalve Pressure gauge.Fire hydrants : ( Including FH. at Main Entrance )30m Fire hose reels off 25mm feeder pipe. If more than 2 reelsper line than go to 50mm feeder pipe.2 x 30m Fhr's in total required0 x 15m Fhr's in total required9 Kg Multi purpose DCP Fire extinguisher at each Fhr.Fire main 100mm internal diameter to Fire hydrants with 50 to25mm internal diameter to fire hose reels.A competancy certificate of the plumbing contractor must besubmitted to the Fire Department prior to commencement withthe fire reticulation system.Inconspicuous fire appliances and all emergency exits to beindicated by symbolic signs.Fire department must be notified on completion of installation inorder to obtain a clearance certificate prior to electricalconnection
Joha
nnes
burg
Road
s Age
ncy (
JRA)
Date: / / .
Pikit
upJo
hann
esbu
rg W
ater
(Pty)
Ltd
Envir
onme
ntal
Mana
geme
ntCi
ty Pa
rks &
Urb
anCo
nser
vatio
nCi
ty Po
wer
Envir
onme
ntal H
ealth
Fire D
epar
tmen
tOt
her
(such
as E
SKOM
or a
ny ot
her if
requ
ired)
Date: / / .
Date: / / .
Date: / / .
Date: / / .
Date: / / .
Date: / / .
Date: / / .
Date: / / .
Tran
spor
tation
Date: / / .
Site Development Plan
AS SHAWN
eM
1st Floor
1 Jellicoe and Jan Smuts
Rosebank 2196
Johannesburg South Africa
Tel: 011 880 1214
Fax: 011 880 1216
Email: [email protected]
www.shabanguarchitects.co.za
shabangu architects
T.MUVEVI
YPS-P24-SK-SDP-1000 A
12.02.2019
Ower's Signature:
Date:
TOTAL PARKING BAYS REQUIRED
TOTAL PARKING BAYS PROVIDED
Surplus/deficit No of Parking Bays
The information provided above is hereby certified to be correct and precise
NAME___________________________ SIGNATURE_______________________________
DATE______/_________/___________ PLAN No. _______________________________
N/A
SCHEDULE OF RIGHTS
PROPERTY DESCRIPTION
ZONING INFORMATION
Erf: 1308
Township: Yeoville Township Title Deed No: ***
Town
Planning
Scheme
Use Zone
JOHANNESBURG
: Residential 4
Amendment
Scheme No
Annexure No
DEVELOPMENT CONTROL MEASURES
Permissible Control Actual
Height Zone
Height of buildings
Coverage
Floor Area Ratio
Floor Area
Density (Dwelling Units per hectare)
1 Storey
No of Dwelling Units on the erf
PARKING
Parking Ratio per Use Area per Use Parking Bays Required
N/A parking bays
1 parking bays per dwelling unit n/a n/a
_______/__________
01
Site area: 24321m²
10.6m
2%
0.020
N/A
1979
N/A parking bays
N/A parking bays
ALL STORMWATER TO BE DIRECTED INTO ACENTRAL STORMWATER DISPOSAL SYSTEM
STORMWATER DESIGN & LAYOUT BY ENGINEER
New Church Temporary
Structure on ERF1308
24 Percy Street, Yeoville
12.02.2019
32
495m²
SITE PLANS C A L E 1 : 500
Proposed Entrance Gate
STOP
STOP
STOP
South Street 15,74m
Percy street 15,74m
178,43m BOUNDARY
73,31
m B
OUND
ARY
98,53m BOUNDARY
67,89m BOUNDARY
ERF 7ERF 6ERF 5ERF 1231ERF 2
ERF 1293
ERF 317
Portion 10 of ERF 33
ERF 310
ERF 34
Existing
Building
under ground
electrical cable
stand pipe with gully
1
5
0
0
0
3
3
0
0
0
250
500
1870
WC
Existing Building
Proposed Tent
ERF 1293
Existing Building
South Street
Sectional North Elevation A:A
SCALE 1:200
50
00
TRAFFIC IMPACT STUDY YEOVILLE, RCG
Annexure B: Locality Map and Study Area

FIGURE:
TITLE:
PROJECT:
LOCALITY MAP
1
K0133 - YEOVILLE RCG CHURCH TIA
B
E
R
T
R
A
M
S
R
D
A
L
B
E
R
T
I
N
A
S
I
S
U
L
U
R
D
B
E
Z
U
ID
E
N
H
O
U
T
A
V
E
N
O
R
T
H
A
V
E
OBSERVATORY AVE
B
E
Z
U
I
D
E
N
H
O
U
T
S
T
L
O
U
I
S
B
O
T
H
A
A
V
E
JO
E S
LO
VO
D
R
SM
ITH
ST
M9
C
L
A
R
E
N
D
O
N
P
I
DE
VIL
LIE
RS
ST
S
A
R
A
T
O
G
A
A
V
E
LEGEND
SITE BOUNDARY
GAUTRAIN BUS STOP
REA VAYA BUS STOP
METRO BUS STOP
SOUTH LANE
PERCY ST
HENDON ST
HARLEY ST
G
O
R
D
O
N
R
D
B
E
R
E
A
R
D
H
I
G
H
L
A
N
D
S
S
T
ROCKEY ST
RALEIGH ST
FO
RT
ES
QU
E R
D
J
O
E
S
L
O
V
O
D
R
S
I
V
E
W
R
I
G
H
T
A
V
E
S
T
A
N
D
R
E
W
S
R
D
EMPIRE RD
LIL
IAN
NG
OY
I S
T
WA
ND
ER
ER
S S
T
W
O
LM
AR
AN
S S
T
C
LA
IM
S
T
H
A
D
F
IE
L
D
R
D
H
O
N
E
Y
S
T

TITLE:
PROJECT:
STUDY AREA
2
K0133 - YEOVILLE RCG CHURCH TIA
SOUTH LN
PERCY ST
HENDON ST
HARLEY ST
GR
AF
TO
N R
D
FO
RT
ES
QU
E R
D
KE
NM
ER
E R
D
C
A
V
E
N
D
I
S
H
R
D
H
I
G
H
L
A
N
D
S
S
T
B
E
Z
U
I
D
E
N
H
O
U
T
S
T
P
A
D
D
O
C
K
S
T
114
2
11
8
4
9
7
5
6
12
3
ERF
1308
ERF
67
FIGURE:
LEGEND
SITE BOUNDARY
1
INTERSECTIONS
ERF 1308, YEOVILLE
ERF 67, YEOVILLE
LEGEND
SITE BOUNDARY
1
INTERSECTIONS ANALYSED
ERF 1308, YEOVILLE
ERF 67, HIGHLANDS
MINORS ST
MINORS ST
DURBAN RD
UM
LAZI RD
HARLEY ST
H
E
N
D
O
N
S
T
GR
AF
TO
N R
D
FO
RT
ES
QU
E R
D
JO
E S
LO
VO
S
T

TRAFFIC IMPACT STUDY YEOVILLE, RCG
Annexure C: Provincial (GPDRT) Road Network (K133)

TITLE:
PROJECT:
CK0133 - YEOVILLE RCG CHURCH TIA
FUTURE ROAD NETWORK
ANNEXURE:
PROPOSED
DEVELOPMENT

TRAFFIC IMPACT STUDY YEOVILLE, RCG
Annexure D: Proposed Access Plan

ANNEXURE:
TITLE:
PROJECT:
PROPOSED ACCESSES DK0133 - YEOVILLE RCG CHURCH TIA
SOUTH LN
PERCY ST
HENDON ST
GR
AF
TO
N R
D
FO
RT
ES
QU
E R
D
ACCESS (TO BASEMENT
PARKING)
ACCESS (TO VIP
PARKING)
ACCESS (TO OPEN
PARKING)
ACCESS (TO DELIVERY/
REFUSE REMOVAL)
ERF
1308
ERF
67
H
I
G
H
L
A
N
D
S
S
T
LEGEND
SITE BOUNDARY
DELIVERY / REFUSE REMOVAL
TRUCKS
OPEN PARKING
P
E
R
C
Y
S
T
H
E
N
D
O
N
S
T
PERCY ST
HENDON ST
GR
AF
TO
N R
D

TRAFFIC IMPACT STUDY YEOVILLE, RCG
Annexure E: Traffic Flow Diagrams & Overall Intersection, Capacity Analysis Results Figure 3: Existing Geometry
Figure 4: 2019 Thursday PM Existing Peak Hour Traffic Volumes and Capacity Analysis Results
Figure 5: 2019 Sunday PM Existing Peak Hour Traffic Volumes and Capacity Analysis Results
Figure 6: Trip Assignment (percentage)
Figure 7: Trip Assignment – Thursday PM (vph)
Figure 8: Trip Assignment – Sunday PM (vph)
Figure 9: 2019 Thursday PM Existing Peak Hour + Development Traffic Volumes and Capacity Analysis Results
Figure 10: 2019 Sunday PM Existing Peak Hour + Development Traffic Volumes and Capacity Analysis Results
Figure 11: 2024 Thursday PM Background Peak Hour Traffic Volumes and Capacity Analysis Results
Figure 12: 2024 Sunday PM Background Peak Hour Traffic Volumes and Capacity Analysis Results
Figure 13: 2024 Thursday PM Total Peak Hour Traffic Volumes and Capacity
Figure 14: 2024 Sunday Total PM Total Peak Hour Traffic Volumes and Capacity

FIGURE:
TITLE:
PROJECT:
3
EXISTING GEOMETRY
SCHEMATIC
LEGEND
JO
E S
LO
VO
D
R
ABEL RD
HENDON
ST
HENDON ST
GR
AF
TO
N R
D
FO
RT
ES
QU
E R
D
DURBAN
RD
B
E
Z
U
I
D
E
N
H
O
U
T
S
T
B
E
Z
U
ID
E
N
H
O
U
T
S
T
U
M
L
A
Z
I
R
D
H
I
G
H
L
A
N
D
S
S
T
HARLEY ST
K
E
N
M
E
R
E
R
D
C
A
V
E
N
D
IS
H
R
D
P
E
R
C
Y
S
T
PERCY ST
HENDON ST
SOUTH LN
JO
E S
LO
VO
D
R
C
H
A
R
L
T
O
N
A
C
C
E
S
S
R
D
GR
AF
TO
N R
D
HIG
HLA
ND
S
S
T
K0133 YEOVILLE RCG CHURCH TIA
PADDOCK
ST
PROJECT:
4
2019 THURSDAY PM (16:45 - 17:45) EXISTING PEAK HOUR TRAFFIC
VOLUMES AND CAPACITY ANALYSIS RESULTS
JO
E S
LO
VO
D
R
ABEL
RD
HENDON STHENDON ST
GR
AF
TO
N R
D
FO
RT
ES
QU
E R
D
DURBAN RD
B
E
Z
U
ID
E
N
H
O
U
T
S
T
U
M
L
A
Z
I
R
D
H
I
G
H
L
A
N
D
S
S
T
HARLEY ST
K
E
N
M
E
R
E
R
D
C
A
V
E
N
D
IS
H
R
D
P
E
R
C
Y
S
T
PERCY ST
HENDON ST
SOUTH LN
JO
E S
LO
VO
D
R
C
H
A
R
L
T
O
N
A
C
C
E
S
S
R
D
GR
AF
TO
N R
D
HIG
HLA
ND
S
S
T
SCHEMATIC
LEGEND
Turning Volumes (vph)
LOS
10
10
10
Level of service based on delay for
unsignalised intersections. LOS
based on v/c and delay for signalised
intersections
K0133 YEOVILLE RCG CHURCH TIA
TITLE:FIGURE:
Volumes / Capacity Ratio
Del
V/C
Delay (seconds)
B
E
Z
U
ID
E
N
H
O
U
T
S
T
PADDOCK
ST

PROJECT:
5
JO
E S
LO
VO
D
R
ABEL
RD
HENDON STHENDON ST
GR
AF
TO
N R
D
FO
RT
ES
QU
E R
D
B
E
Z
U
ID
E
N
H
O
U
T
S
T
U
M
L
A
Z
I
R
D
H
I
G
H
L
A
N
D
S
S
T
HARLEY ST
K
E
N
M
E
R
E
R
D
C
A
V
E
N
D
IS
H
R
D
P
E
R
C
Y
S
T
PERCY ST
HENDON ST
SOUTH LN
JO
E S
LO
VO
D
R
C
H
A
R
L
T
O
N
A
C
C
E
S
S
R
D
GR
AF
TO
N R
D
HIG
HLA
ND
S
S
T
DURBAN RD
K0133 YEOVILLE RCG CHURCH TIA
2019 SUNDAY PM (16:45 - 17:45) EXISTING PEAK HOUR TRAFFIC
VOLUMES AND CAPACITY ANALYSIS RESULTS
TITLE:FIGURE:
SCHEMATIC
LEGEND
Turning Volumes (vph)
LOS
10
10
10
Level of service based on delay for
unsignalised intersections. LOS
based on v/c and delay for signalised
intersections
Volumes / Capacity Ratio
Del
V/C
Delay (seconds)
B
E
Z
U
ID
E
N
H
O
U
T
S
T
PADDOCK
ST

PROJECT:
6TRIP ASSIGNMENT (%)K0133 YEOVILLE RCG CHURCH TIA
SCHEMATIC
10%
INBOUND TRIP ASSIGNMENT
LEGEND
(10%)
OUTBOUND TRIP ASSIGNMENT
TITLE:
FIGURE:
JO
E S
LO
VO
D
R
ABEL
RD
HENDON STHENDON ST
GR
AF
TO
N R
D
FO
RT
ES
QU
E R
D
B
E
Z
U
ID
E
N
H
O
U
T
S
T
U
M
L
A
Z
I
R
D
H
I
G
H
L
A
N
D
S
S
T
HARLEY ST
K
E
N
M
E
R
E
R
D
C
A
V
E
N
D
IS
H
R
D
P
E
R
C
Y
S
T
P
E
R
C
Y
S
T
HENDON ST
JO
E S
LO
VO
D
R
C
H
A
R
L
T
O
N
A
C
C
E
S
S
R
D
GR
AF
TO
N R
D
HIG
HLA
ND
S
S
T
AC
CE
SS
AC
CE
SS
ACCESS
DURBAN RD
SOUTH LN
PROPOSED
DEVELOPMENT
B
E
Z
U
ID
E
N
H
O
U
T
S
T
PADDOCK
ST

PROJECT:
7
TRIP ASSIGNMENT - THURSDAY PM (VPH)
K0133 YEOVILLE RCG CHURCH TIA
SCHEMATIC
Turning Volumes (vph)
10
10
10
LEGEND
TITLE:FIGURE:
JO
E S
LO
VO
D
R
ABEL
RD
HENDON ST
HENDON ST
GR
AF
TO
N R
D
FO
RT
ES
QU
E R
D
DURBAN RD
B
E
Z
U
ID
E
N
H
O
U
T
S
T
U
M
L
A
Z
I
R
D
HARLEY ST
K
E
N
M
E
R
E
R
D
C
A
V
E
N
D
IS
H
R
D
HENDON ST
SOUTH LN
JO
E S
LO
VO
D
R
C
H
A
R
L
T
O
N
A
C
C
E
S
S
R
D
H
I
G
H
L
A
N
D
S
S
T
P
E
R
C
Y
S
T
P
E
R
C
Y
S
T
GR
AF
TO
N R
D
HIG
HLA
ND
S
S
T
AC
CE
SS
ACCESS
AC
CE
SS
PROPOSED
DEVELOPMENT
B
E
Z
U
ID
E
N
H
O
U
T
S
T
PADDOCK
ST

PROJECT:
8
TRIP ASSIGNMENT - SUNDAY (VPH)K0133 YEOVILLE RCG CHURCH TIA
TITLE: FIGURE:
SCHEMATIC
Turning Volumes (vph)
10
10
10
LEGEND
JO
E S
LO
VO
D
R
ABEL
RD
HENDON STHENDON ST
GR
AF
TO
N R
D
FO
RT
ES
QU
E R
D
DURBAN RD
B
E
Z
U
ID
E
N
H
O
U
T
S
T
U
M
L
A
Z
I
R
D
HARLEY ST
K
E
N
M
E
R
E
R
D
C
A
V
E
N
D
IS
H
R
D
HENDON ST
SOUTH LN
JO
E S
LO
VO
D
R
C
H
A
R
L
T
O
N
A
C
C
E
S
S
R
D
H
I
G
H
L
A
N
D
S
S
T
P
E
R
C
Y
S
T
P
E
R
C
Y
S
T
GR
AF
TO
N R
D
HIG
HLA
ND
S
S
T
AC
CE
SS
ACCESS
AC
CE
SS
PROPOSED
DEVELOPMENT
B
E
Z
U
ID
E
N
H
O
U
T
S
T
PADDOCK
ST

PROJECT:
9
JO
E S
LO
VO
D
R
ABEL
RD
HENDON STHENDON ST
GR
AF
TO
N R
D
FO
RT
ES
QU
E R
D
DURBAN RD
B
E
Z
U
ID
E
N
H
O
U
T
S
T
U
M
L
A
Z
I
R
D
HARLEY ST
K
E
N
M
E
R
E
R
D
C
A
V
E
N
D
IS
H
R
D
HENDON ST
SOUTH LN
JO
E S
LO
VO
D
R
C
H
A
R
L
T
O
N
A
C
C
E
S
S
R
D
H
I
G
H
L
A
N
D
S
S
T
P
E
R
C
Y
S
T
P
E
R
C
Y
S
T
GR
AF
TO
N R
D
HIG
HLA
ND
S
S
T
AC
CE
SS
ACCESS
AC
CE
SS
PROPOSED
DEVELOPMENT
K0133 YEOVILLE RCG CHURCH TIA
2019 THURSDAY PM (16:45 - 17:45) EXISTING PEAK HOUR + DEVELOPMENT
TRAFFIC VOLUMES AND CAPACITY ANALYSIS RESULTS
TITLE:
FIGURE:
SCHEMATIC
LEGEND
Turning Volumes (vph)
LOS
10
10
10
Level of service based on delay for
unsignalised intersections. LOS
based on v/c and delay for signalised
intersections
Volumes / Capacity Ratio
Del
V/C
Delay (seconds)
B
E
Z
U
ID
E
N
H
O
U
T
S
T
PADDOCK
ST

PROJECT:
10
JO
E S
LO
VO
D
R
ABEL
RD
HENDON STHENDON ST
GR
AF
TO
N R
D
FO
RT
ES
QU
E R
D
DURBAN RD
B
E
Z
U
ID
E
N
H
O
U
T
S
T
U
M
L
A
Z
I
R
D
HARLEY ST
K
E
N
M
E
R
E
R
D
C
A
V
E
N
D
IS
H
R
D
HENDON ST
SOUTH LN
JO
E S
LO
VO
D
R
C
H
A
R
L
T
O
N
A
C
C
E
S
S
R
D
H
I
G
H
L
A
N
D
S
S
T
P
E
R
C
Y
S
T
P
E
R
C
Y
S
T
GR
AF
TO
N R
D
HIG
HLA
ND
S
S
T
AC
CE
SS
ACCESS
AC
CE
SS
PROPOSED
DEVELOPMENT
K0133 YEOVILLE RCG CHURCH TIA
2019 SUNDAY PM (16:45 - 17:45) EXISTING PEAK HOUR + DEVELOPMENT
TRAFFIC VOLUMES AND CAPACITY ANALYSIS RESULTS
TITLE:
FIGURE:
SCHEMATIC
LEGEND
Turning Volumes (vph)
LOS
10
10
10
Level of service based on delay for
unsignalised intersections. LOS
based on v/c and delay for signalised
intersections
Volumes / Capacity Ratio
Del
V/C
Delay (seconds)
B
E
Z
U
ID
E
N
H
O
U
T
S
T
PADDOCK
ST

PROJECT:
11
JO
E S
LO
VO
D
R
ABEL
RD
HENDON ST
HENDON ST
GR
AF
TO
N R
D
FO
RT
ES
QU
E R
D
DURBAN RD
B
E
Z
U
ID
E
N
H
O
U
T
S
T
U
M
L
A
Z
I
R
D
HARLEY ST
K
E
N
M
E
R
E
R
D
C
A
V
E
N
D
IS
H
R
D
HENDON ST
SOUTH LN
JO
E S
LO
VO
D
R
C
H
A
R
L
T
O
N
A
C
C
E
S
S
R
D
H
I
G
H
L
A
N
D
S
S
T
P
E
R
C
Y
S
T
P
E
R
C
Y
S
T
GR
AF
TO
N R
D
HIG
HLA
ND
S
S
T
AC
CE
SS
ACCESS
AC
CE
SS
PROPOSED
DEVELOPMENT
K0133 YEOVILLE RCG CHURCH TIA
2024 THURSDAY PM (16:45 - 17:45) BACKGROUND PEAK HOUR
TRAFFIC VOLUMES AND CAPACITY ANALYSIS RESULTS
TITLE: FIGURE:
SCHEMATIC
LEGEND
Turning Volumes (vph)
LOS
10
10
10
Level of service based on delay for
unsignalised intersections. LOS
based on v/c and delay for signalised
intersections
Volumes / Capacity Ratio
Del
V/C
Delay (seconds)
B
E
Z
U
ID
E
N
H
O
U
T
S
T
PADDOCK
ST

PROJECT:
12
JO
E S
LO
VO
D
R
ABEL
RD
HENDON ST
HENDON ST
GR
AF
TO
N R
D
FO
RT
ES
QU
E R
D
DURBAN RD
B
E
Z
U
ID
E
N
H
O
U
T
S
T
U
M
L
A
Z
I
R
D
HARLEY ST
K
E
N
M
E
R
E
R
D
C
A
V
E
N
D
IS
H
R
D
HENDON ST
SOUTH LN
JO
E S
LO
VO
D
R
C
H
A
R
L
T
O
N
A
C
C
E
S
S
R
D
H
I
G
H
L
A
N
D
S
S
T
P
E
R
C
Y
S
T
P
E
R
C
Y
S
T
GR
AF
TO
N R
D
HIG
HLA
ND
S
S
T
AC
CE
SS
ACCESS
AC
CE
SS
PROPOSED
DEVELOPMENT
K0133 YEOVILLE RCG CHURCH TIA
2024 SUNDAY PM (16:45 - 17:45) BACKGROUND PEAK HOUR
TRAFFIC VOLUMES AND CAPACITY ANALYSIS RESULTS
TITLE:FIGURE:
SCHEMATIC
LEGEND
Turning Volumes (vph)
LOS
10
10
10
Level of service based on delay for
unsignalised intersections. LOS
based on v/c and delay for signalised
intersections
Volumes / Capacity Ratio
Del
V/C
Delay (seconds)
B
E
Z
U
ID
E
N
H
O
U
T
S
T
PADDOCK
ST

PROJECT:
13
JO
E S
LO
VO
D
R
ABEL
RD
HENDON ST
HENDON ST
GR
AF
TO
N R
D
FO
RT
ES
QU
E R
D
DURBAN RD
B
E
Z
U
ID
E
N
H
O
U
T
S
T
U
M
L
A
Z
I
R
D
HARLEY ST
K
E
N
M
E
R
E
R
D
C
A
V
E
N
D
IS
H
R
D
P
E
R
C
Y
S
T
HENDON ST
SOUTH LN
JO
E S
LO
VO
D
R
C
H
A
R
L
T
O
N
A
C
C
E
S
S
R
D
H
I
G
H
L
A
N
D
S
S
T
P
E
R
C
Y
S
T
GR
AF
TO
N R
D
HIG
HLA
ND
S
S
T
AC
CE
SS
ACCESS
AC
CE
SS
PROPOSED
DEVELOPMENT
K0133 YEOVILLE RCG CHURCH TIA
2024 THURSDAY PM (16:45 - 17:45) BACKGROUND + DEVELOPMENT PEAK HOUR
TRAFFIC VOLUMES AND CAPACITY ANALYSIS RESULTS
TITLE: FIGURE:
SCHEMATIC
LEGEND
Turning Volumes (vph)
LOS
10
10
10
Level of service based on delay for
unsignalised intersections. LOS
based on v/c and delay for signalised
intersections
Volumes / Capacity Ratio
Del
V/C
Delay (seconds)
B
E
Z
U
ID
E
N
H
O
U
T
S
T
PADDOCK
ST

PROJECT:
14
JO
E S
LO
VO
D
R
ABEL
RD
HENDON STHENDON ST
GR
AF
TO
N R
D
FO
RT
ES
QU
E R
D
DURBAN RD
B
E
Z
U
ID
E
N
H
O
U
T
S
T
U
M
L
A
Z
I
R
D
HARLEY ST
K
E
N
M
E
R
E
R
D
C
A
V
E
N
D
IS
H
R
D
HENDON ST
SOUTH LN
JO
E S
LO
VO
D
R
C
H
A
R
L
T
O
N
A
C
C
E
S
S
R
D
H
I
G
H
L
A
N
D
S
S
T
P
E
R
C
Y
S
T
P
E
R
C
Y
S
T
GR
AF
TO
N R
D
HIG
HLA
ND
S
S
T
AC
CE
SS
ACCESS
AC
CE
SS
PROPOSED
DEVELOPMENT
K0133 YEOVILLE RCG CHURCH TIA
2024 SUNDAY PM (16:45 - 17:45) BACKGROUND + DEVELOPMENT PEAK HOUR
TRAFFIC VOLUMES AND CAPACITY ANALYSIS RESULTS
TITLE:
FIGURE:
SCHEMATIC
LEGEND
Turning Volumes (vph)
LOS
10
10
10
Level of service based on delay for
unsignalised intersections. LOS
based on v/c and delay for signalised
intersections
Volumes / Capacity Ratio
Del
V/C
Delay (seconds)
B
E
Z
U
ID
E
N
H
O
U
T
S
T
PADDOCK
ST

TRAFFIC IMPACT STUDY YEOVILLE, RCG
Annexure F: Trip Generation Tables

Koleko Solutions (Pty) Ltd Traffic Impact Assessment: Yeoville, RCG
Table 1: Weekday PM Trip Generation
Very Low Vehicle
OwnershipPT Total
Place of Worship 10000 0.80 0.15 0.83 0.05 0.01 80% 20% 68 17 85
68 17 85
Table 2: Sunday Trip Generation
Very Low Vehicle
OwnershipPT Total
Place of Worship 10000 0.80 0.15 0.83 0.65 0.11 90% 10% 995 111 1,105995 111 1,105
Weekday PM (Thursday)
Land Use Erf Size (No. Seats)
Trip reduction
Trip Rate In Split Out Split In (vph) Out(vph) TotalAdjusted Trip Rate
Sunday
Land Use Erf Size (No. Seats)
Trip reduction
Trip Rate In Split Out Split In (vph) Out(vph) TotalAdjusted Trip Rate
Reference: K0133 Annexure F: Trip Generation

TRAFFIC IMPACT STUDY YEOVILLE, RCG
Annexure G: Detailed Capacity Analysis Results

TRAFFIC IMPACT STUDY YEOVILLE RCG CHURCH
2019 Thursday PM Existing Traffic Volumes

Fri Feb 22 12:29:51 2019 Page 1
2019 Thursday PM ExistingTraffic Volumes
Traffix 8.0.0215 (c) 2008 Dowling Associates Licensed to ITS, SOUTH AFRICA
2019 Thursday PM Existing Traffic Volumes
Level Of Service Computation Report2000 HCM Unsignalized Method (Base Volume Alternative)
Index #1: Grafton St & Percy St
Average Delay (sec/veh): 4.1 Worst Case Level Of Service: A[8.8]
Approach: North Bound South Bound East Bound West Bound
Movement: L T R L T R L T R L T R
Control: Stop Sign Stop Sign Uncontrolled Uncontrolled
Lefts Include Include Include Include
Lanes: 0 0 0 0 0 0 0 1! 0 0 0 1 0 0 0 0 0 0 1 0
Volume Module: >> Count Date: 31 Jan 2019 <<
Base Vol: 0 0 0 35 0 16 22 4 0 0 3 30
Growth Adj: 1.00 1.00 1.00 1.00 1.00 1.00 1.00 1.00 1.00 1.00 1.00 1.00
Initial Base: 0 0 0 35 0 16 22 4 0 0 3 30
User Adj: 1.00 1.00 1.00 1.00 1.00 1.00 1.00 1.00 1.00 1.00 1.00 1.00
PHF Adj: 0.89 0.89 0.89 0.89 0.89 0.89 0.89 0.89 0.89 0.89 0.89 0.89
PHF Volume: 0 0 0 39 0 18 25 5 0 0 3 34
Reduct Vol: 0 0 0 0 0 0 0 0 0 0 0 0
Final Vol.: 0 0 0 39 0 18 25 5 0 0 3 34
Critical Gap Module:
Critical Gp: **** **** **** 6.2 6.5 6.4 **** **** **** **** **** 4.1
FollowUpTim: **** **** **** 3.3 4.0 3.5 **** **** **** **** **** 2.2
Capacity Module:
Cnflict Vol: **** **** **** 17 88 88 **** **** **** **** **** 29
Potent Cap.: **** **** **** 1068 806 918 **** **** **** **** **** 1597
Move Cap.: **** **** **** 1068 789 903 **** **** **** **** **** 1597
Volume/Cap: **** **** **** 0.04 0.00 0.02 **** **** **** **** **** 0.02
Level Of Service Module:
2Way95thQ: **** **** **** **** **** **** **** **** **** **** **** 0.1
Control Del: **** **** **** **** **** **** **** **** **** **** **** 7.3
LOS by Move: * * * * * * * * * * * A
Movement: LT LTR RT LT LTR RT LT LTR RT LT LTR RT
Shared Cap.: **** **** **** **** 1010 **** **** **** **** **** **** 11
SharedQueue: **** **** **** **** 0.2 **** **** **** **** **** **** 0.1
Shrd ConDel: **** **** **** **** 8.8 **** **** **** **** **** **** 7.3
Shared LOS: * * * * A * * * * * * A
ApproachDel: **** 8.8 **** ****
ApproachLOS: * A * *
Note: Queue reported is the number of cars per lane.

Fri Feb 22 12:29:51 2019 Page 3
2019 Thursday PM ExistingTraffic Volumes
Traffix 8.0.0215 (c) 2008 Dowling Associates Licensed to ITS, SOUTH AFRICA
2019 Thursday PM Existing Traffic Volumes
Level Of Service Computation Report2000 HCM Unsignalized Method (Base Volume Alternative)
Index #2: Percy St & Highlands St
Average Delay (sec/veh): 4.4 Worst Case Level Of Service: A[8.6]
Approach: North Bound South Bound East Bound West Bound
Movement: L T R L T R L T R L T R
Control: Stop Sign Stop Sign Uncontrolled Uncontrolled
Lefts Include Include Include Include
Lanes: 0 0 1! 0 0 0 0 0 0 0 0 0 0 1 0 0 1 0 0 0
Volume Module: >> Count Date: 3 Jan 2019 <<
Base Vol: 29 0 9 0 0 0 0 7 25 1 3 0
Growth Adj: 1.00 1.00 1.00 1.00 1.00 1.00 1.00 1.00 1.00 1.00 1.00 1.00
Initial Base: 29 0 9 0 0 0 0 7 25 1 3 0
User Adj: 1.00 1.00 1.00 1.00 1.00 1.00 1.00 1.00 1.00 1.00 1.00 1.00
PHF Adj: 0.93 0.93 0.93 0.93 0.93 0.93 0.93 0.93 0.93 0.93 0.93 0.93
PHF Volume: 31 0 10 0 0 0 0 8 27 1 3 0
Reduct Vol: 0 0 0 0 0 0 0 0 0 0 0 0
Final Vol.: 31 0 10 0 0 0 0 8 27 1 3 0
Critical Gap Module:
Critical Gp: 6.2 6.5 6.4 **** **** **** **** **** 4.1 **** **** ****
FollowUpTim: 3.3 4.0 3.5 **** **** **** **** **** 2.2 **** **** ****
Capacity Module:
Cnflict Vol: 4 65 65 **** **** **** **** **** 4 **** **** ****
Potent Cap.: 1086 830 946 **** **** **** **** **** 1631 **** **** ****
Move Cap.: 1086 816 934 **** **** **** **** **** 1631 **** **** ****
Volume/Cap: 0.03 0.00 0.01 **** **** **** **** **** 0.02 **** **** ****
Level Of Service Module:
2Way95thQ: **** **** **** **** **** **** **** **** 0.1 **** **** ****
Control Del: **** **** **** **** **** **** **** **** 7.2 **** **** ****
LOS by Move: * * * * * * * * A * * *
Movement: LT LTR RT LT LTR RT LT LTR RT LT LTR RT
Shared Cap.: **** 1045 **** **** **** **** **** **** 5 **** **** ****
SharedQueue: **** 0.1 **** **** **** **** **** **** 0.1 **** **** ****
Shrd ConDel: **** 8.6 **** **** **** **** **** **** 7.2 **** **** ****
Shared LOS: * A * * * * * * A * * *
ApproachDel: 8.6 **** **** ****
ApproachLOS: A * * *
Note: Queue reported is the number of cars per lane.

Fri Feb 22 12:29:51 2019 Page 5
2019 Thursday PM ExistingTraffic Volumes
Traffix 8.0.0215 (c) 2008 Dowling Associates Licensed to ITS, SOUTH AFRICA
2019 Thursday PM Existing Traffic Volumes
Level Of Service Computation Report2000 HCM Unsignalized Method (Base Volume Alternative)
Index #3: Harley St & Cavendish Rd
Average Delay (sec/veh): 2.9 Worst Case Level Of Service: C[16.2]
Approach: North Bound South Bound East Bound West Bound
Movement: L T R L T R L T R L T R
Control: Stop Sign Stop Sign Uncontrolled Uncontrolled
Lefts Include Include Include Include
Lanes: 0 0 0 0 0 0 0 1! 0 0 0 1 0 0 0 0 0 0 1 0
Volume Module: >> Count Date: 3 Jan 2019 <<
Base Vol: 0 0 0 6 0 128 93 282 0 0 232 7
Growth Adj: 1.00 1.00 1.00 1.00 1.00 1.00 1.00 1.00 1.00 1.00 1.00 1.00
Initial Base: 0 0 0 6 0 128 93 282 0 0 232 7
User Adj: 1.00 1.00 1.00 1.00 1.00 1.00 1.00 1.00 1.00 1.00 1.00 1.00
PHF Adj: 0.93 0.93 0.93 0.93 0.93 0.93 0.93 0.93 0.93 0.93 0.93 0.93
PHF Volume: 0 0 0 6 0 137 100 302 0 0 248 7
Reduct Vol: 0 0 0 0 0 0 0 0 0 0 0 0
Final Vol.: 0 0 0 6 0 137 100 302 0 0 248 7
Critical Gap Module:
Critical Gp: **** **** **** 6.2 6.5 6.4 **** **** **** **** **** 4.1
FollowUpTim: **** **** **** 3.3 4.0 3.5 **** **** **** **** **** 2.2
Capacity Module:
Cnflict Vol: **** **** **** 352 615 615 **** **** **** **** **** 401
Potent Cap.: **** **** **** 696 409 458 **** **** **** **** **** 1168
Move Cap.: **** **** **** 696 407 456 **** **** **** **** **** 1168
Volume/Cap: **** **** **** 0.01 0.00 0.30 **** **** **** **** **** 0.01
Level Of Service Module:
2Way95thQ: **** **** **** **** **** **** **** **** **** **** **** 0.0
Control Del: **** **** **** **** **** **** **** **** **** **** **** 8.1
LOS by Move: * * * * * * * * * * * A
Movement: LT LTR RT LT LTR RT LT LTR RT LT LTR RT
Shared Cap.: **** **** **** **** 463 **** **** **** **** **** **** 1
SharedQueue: **** **** **** **** 1.3 **** **** **** **** **** **** 0.0
Shrd ConDel: **** **** **** **** 16.2 **** **** **** **** **** **** 8.1
Shared LOS: * * * * C * * * * * * A
ApproachDel: **** 16.2 **** ****
ApproachLOS: * C * *
Note: Queue reported is the number of cars per lane.

Fri Feb 22 12:29:51 2019 Page 9
2019 Thursday PM ExistingTraffic Volumes
Traffix 8.0.0215 (c) 2008 Dowling Associates Licensed to ITS, SOUTH AFRICA
2019 Thursday PM Existing Traffic Volumes
Level Of Service Computation Report2000 HCM Unsignalized Method (Base Volume Alternative)
Index #4: Bezuidenhout St & Durban Rd
Average Delay (sec/veh): 5.7 Worst Case Level Of Service: B[11.9]
Approach: North Bound South Bound East Bound West Bound
Movement: L T R L T R L T R L T R
Control: Stop Sign Stop Sign Uncontrolled Uncontrolled
Lefts Include Include Include Include
Lanes: 1 0 1 0 0 0 0 0 1 0 0 0 1! 0 0 0 0 0 0 0
Volume Module: >> Count Date: 3 Jan 2019 <<
Base Vol: 6 17 0 0 21 224 281 0 4 0 0 0
Growth Adj: 1.00 1.00 1.00 1.00 1.00 1.00 1.00 1.00 1.00 1.00 1.00 1.00
Initial Base: 6 17 0 0 21 224 281 0 4 0 0 0
User Adj: 1.00 1.00 1.00 1.00 1.00 1.00 1.00 1.00 1.00 1.00 1.00 1.00
PHF Adj: 0.96 0.96 0.96 0.96 0.96 0.96 0.96 0.96 0.96 0.96 0.96 0.96
PHF Volume: 6 18 0 0 22 233 292 0 4 0 0 0
Reduct Vol: 0 0 0 0 0 0 0 0 0 0 0 0
Final Vol.: 6 18 0 0 22 233 292 0 4 0 0 0
Critical Gap Module:
Critical Gp: 6.2 6.5 **** **** 6.5 7.1 **** **** 4.1 **** **** ****
FollowUpTim: 3.3 4.0 **** **** 4.0 3.5 **** **** 2.2 **** **** ****
Capacity Module:
Cnflict Vol: 0 300 **** **** 154 163 **** **** 0 **** **** ****
Potent Cap.: 1091 616 **** **** 741 806 **** **** 1636 **** **** ****
Move Cap.: 1091 614 **** **** 739 783 **** **** 1636 **** **** ****
Volume/Cap: 0.01 0.03 **** **** 0.03 0.30 **** **** 0.00 **** **** ****
Level Of Service Module:
2Way95thQ: 0.0 0.1 **** **** **** **** **** **** 0.0 **** **** ****
Control Del: 8.3 11.0 **** **** **** **** **** **** 7.2 **** **** ****
LOS by Move: A B * * * * * * A * * *
Movement: LT LTR RT LT LTR RT LT LTR RT LT LTR RT
Shared Cap.: **** **** **** **** **** 779 **** **** **** **** **** ****
SharedQueue: **** **** **** **** **** 1.4 **** **** **** **** **** ****
Shrd ConDel: **** **** **** **** **** 11.9 **** **** **** **** **** ****
Shared LOS: * * * * * B * * * * * *
ApproachDel: 10.3 11.9 **** ****
ApproachLOS: B B * *
Note: Queue reported is the number of cars per lane.

Fri Feb 22 12:29:51 2019 Page 13
2019 Thursday PM ExistingTraffic Volumes
Traffix 8.0.0215 (c) 2008 Dowling Associates Licensed to ITS, SOUTH AFRICA
2019 Thursday PM Existing Traffic Volumes
Level Of Service Computation Report2000 HCM Unsignalized Method (Base Volume Alternative)
Index #5: Grafton Rd & Hendon St
Average Delay (sec/veh): 1.2 Worst Case Level Of Service: C[23.1]
Approach: North Bound South Bound East Bound West Bound
Movement: L T R L T R L T R L T R
Control: Stop Sign Stop Sign Uncontrolled Uncontrolled
Lefts Include Include Include Include
Lanes: 0 0 1! 0 0 0 0 0 1 0 0 0 1! 0 0 0 0 1! 0 0
Volume Module: >> Count Date: 3 Jan 2019 <<
Base Vol: 40 7 2 0 7 31 63 453 56 5 513 5
Growth Adj: 1.00 1.00 1.00 1.00 1.00 1.00 1.00 1.00 1.00 1.00 1.00 1.00
Initial Base: 40 7 2 0 7 31 63 453 56 5 513 5
User Adj: 1.00 1.00 1.00 1.00 1.00 1.00 1.00 1.00 1.00 1.00 1.00 1.00
PHF Adj: 0.92 0.92 0.92 0.92 0.92 0.92 0.92 0.92 0.92 0.92 0.92 0.92
PHF Volume: 43 8 2 0 8 34 68 491 61 5 556 5
Reduct Vol: 0 0 0 0 0 0 0 0 0 0 0 0
Final Vol.: 43 8 2 0 8 34 68 491 61 5 556 5
Critical Gap Module:
Critical Gp: 5.3 5.4 5.5 **** 5.4 5.5 **** **** 3.5 **** **** 3.5
FollowUpTim: 2.3 2.6 3.1 **** 2.6 3.1 **** **** 2.1 **** **** 2.1
Capacity Module:
Cnflict Vol: 432 1217 1221 **** 1182 1208 **** **** 562 **** **** 560
Potent Cap.: 835 295 291 **** 308 260 **** **** 1164 **** **** 1166
Move Cap.: 835 278 272 **** 290 231 **** **** 1164 **** **** 1166
Volume/Cap: 0.05 0.03 0.01 **** 0.03 0.15 **** **** 0.05 **** **** 0.00
Level Of Service Module:
2Way95thQ: **** **** **** **** **** **** **** **** 0.2 **** **** 0.0
Control Del: **** **** **** **** **** **** **** **** 8.3 **** **** 8.1
LOS by Move: * * * * * * * * A * * A
Movement: LT LTR RT LT LTR RT LT LTR RT LT LTR RT
Shared Cap.: **** 609 **** **** **** 240 **** **** **** **** **** ****
SharedQueue: **** 0.3 **** **** **** 0.6 **** **** **** **** **** ****
Shrd ConDel: **** 11.5 **** **** **** 23.1 **** **** **** **** **** ****
Shared LOS: * B * * * C * * * * * *
ApproachDel: 11.5 23.1 **** ****
ApproachLOS: B C * *
Note: Queue reported is the number of cars per lane.

Fri Feb 22 12:29:51 2019 Page 17
2019 Thursday PM ExistingTraffic Volumes
Traffix 8.0.0215 (c) 2008 Dowling Associates Licensed to ITS, SOUTH AFRICA
2019 Thursday PM Existing Traffic Volumes
Level Of Service Computation Report2000 HCM Operations Method (Base Volume Alternative)
Index #6: Joe Slovo Dr & Hendon St
Cycle (sec): 110 Critical Vol./Cap.(X): 1.131
Loss Time (sec): 15 Average Delay (sec/veh): 59.8
Optimal Cycle: 180 Level Of Service: E
Approach: North Bound South Bound East Bound West Bound
Movement: L T R L T R L T R L T R
Control: Protected+Permitted Protected+Permitted Permitted Permitted
Lefts Include Include Include Ovl
Min. Green: 0 0 0 0 0 0 0 0 0 0 0 0
Y+R: 5.0 5.0 5.0 5.0 5.0 5.0 5.0 5.0 5.0 5.0 5.0 5.0
Lanes: 0 1 2 0 2 1 1 1 0 1 1 0 1 1 1 0 1 0 0 1
Volume Module: >> Count Date: 3 Jan 2019 <<
Base Vol: 285 1112 295 45 1927 92 158 236 252 366 245 11
Growth Adj: 1.00 1.00 1.00 1.00 1.00 1.00 1.00 1.00 1.00 1.00 1.00 1.00
Initial Base: 285 1112 295 45 1927 92 158 236 252 366 245 11
User Adj: 1.00 1.00 1.00 1.00 1.00 1.00 1.00 1.00 1.00 1.00 1.00 1.00
PHF Adj: 0.99 0.99 0.99 0.99 0.99 0.99 0.99 0.99 0.99 0.99 0.99 0.99
PHF Volume: 287 1120 297 45 1941 93 159 238 254 369 247 11
Reduct Vol: 0 0 0 0 0 0 0 0 0 0 0 0
Reduced Vol: 287 1120 297 45 1941 93 159 238 254 369 247 11
PCE Adj: 1.00 1.00 1.00 1.00 1.00 1.00 1.00 1.00 1.00 1.00 1.00 1.00
MLF Adj: 1.00 1.00 1.00 1.00 1.00 1.00 1.00 1.00 1.00 1.00 1.00 1.00
Final Vol.: 287 1120 297 45 1941 93 159 238 254 369 247 11
Saturation Flow Module:
Sat/Lane: 1900 1900 1900 1900 1900 1900 1900 1900 1900 1900 1900 1900
Adjustment: 0.88 0.88 0.77 0.95 0.95 0.95 0.85 0.55 0.55 0.91 0.91 0.60
Lanes: 0.61 2.39 2.00 1.00 2.00 1.00 1.00 1.45 1.55 0.60 0.40 1.00
Final Sat.: 1025 4001 2908 1800 3599 1805 1615 1508 1611 1036 693 1134
Capacity Analysis Module:
Vol/Sat: 0.28 0.28 0.10 0.03 0.54 0.05 0.10 0.16 0.16 0.36 0.36 0.01
Crit Moves: **** **** ****
Green/Cycle: 0.47 0.47 0.55 0.47 0.47 0.60 0.31 0.31 0.31 0.39 0.31 0.31
Green/Cycle: 0.47 0.47 0.08 0.47 0.47 0.09 0.31 0.31 0.31 0.39 0.31 0.31
Volume/Cap: 0.60 0.60 0.27 0.05 1.15 0.35 0.32 0.51 0.51 0.91 1.15 0.03
Level Of Service Module:
Uniform Del: 21.7 21.7 12.3 15.8 29.1 12.4 29.0 31.0 31.0 31.5 37.9 26.4
IncremntDel: 0.4 0.4 0.1 0.0 72.6 0.8 0.4 0.4 0.4 15.9 85.4 0.0
InitQueuDel: 0.0 0.0 0.0 0.0 0.0 0.0 0.0 0.0 0.0 0.0 0.0 0.0
Delay Adj: 1.00 1.00 1.00 1.00 1.00 1.00 1.00 1.00 1.00 1.00 1.00 1.00
Delay/Veh: 22.1 22.1 12.5 15.8 101.7 13.1 29.3 31.4 31.4 47.4 123.3 26.4
User DelAdj: 1.00 1.00 1.00 1.00 1.00 1.00 1.00 1.00 1.00 1.00 1.00 1.00
AdjDel/Veh: 22.1 22.1 12.5 15.8 101.7 13.1 29.3 31.4 31.4 47.4 123.3 26.4
LOS by Move: C C B B F B C C C D F C
HCM2kAvgQ: 13.1 13.1 3.1 0.8 53.2 2.0 4.2 5.3 5.3 23.4 33.7 0.3
Note: Queue reported is the number of cars per lane.

Fri Feb 22 12:29:51 2019 Page 31
2019 Thursday PM ExistingTraffic Volumes
Traffix 8.0.0215 (c) 2008 Dowling Associates Licensed to ITS, SOUTH AFRICA
2019 Thursday PM Existing Traffic Volumes
Level Of Service Computation Report2000 HCM Unsignalized Method (Base Volume Alternative)
Index #7: Fortesque Rd & Hendon St
Average Delay (sec/veh): 2.7 Worst Case Level Of Service: C[23.1]
Approach: North Bound South Bound East Bound West Bound
Movement: L T R L T R L T R L T R
Control: Stop Sign Stop Sign Uncontrolled Uncontrolled
Lefts Include Include Include Include
Lanes: 0 0 0 0 0 0 0 1! 0 0 0 1 0 0 0 0 0 0 1 0
Volume Module: >> Count Date: 3 Jan 2019 <<
Base Vol: 0 0 0 3 0 111 44 392 0 0 416 3
Growth Adj: 1.00 1.00 1.00 1.00 1.00 1.00 1.00 1.00 1.00 1.00 1.00 1.00
Initial Base: 0 0 0 3 0 111 44 392 0 0 416 3
User Adj: 1.00 1.00 1.00 1.00 1.00 1.00 1.00 1.00 1.00 1.00 1.00 1.00
PHF Adj: 0.94 0.94 0.94 0.94 0.94 0.94 0.94 0.94 0.94 0.94 0.94 0.94
PHF Volume: 0 0 0 3 0 118 47 416 0 0 441 3
Reduct Vol: 0 0 0 0 0 0 0 0 0 0 0 0
Final Vol.: 0 0 0 3 0 118 47 416 0 0 441 3
Critical Gap Module:
Critical Gp: **** **** **** 6.2 6.5 6.4 **** **** **** **** **** 4.1
FollowUpTim: **** **** **** 3.3 4.0 3.5 **** **** **** **** **** 2.2
Capacity Module:
Cnflict Vol: **** **** **** 348 834 834 **** **** **** **** **** 462
Potent Cap.: **** **** **** 644 282 314 **** **** **** **** **** 1109
Move Cap.: **** **** **** 644 281 313 **** **** **** **** **** 1109
Volume/Cap: **** **** **** 0.00 0.00 0.38 **** **** **** **** **** 0.00
Level Of Service Module:
2Way95thQ: **** **** **** **** **** **** **** **** **** **** **** 0.0
Control Del: **** **** **** **** **** **** **** **** **** **** **** 8.3
LOS by Move: * * * * * * * * * * * A
Movement: LT LTR RT LT LTR RT LT LTR RT LT LTR RT
Shared Cap.: **** **** **** **** 318 **** **** **** **** **** **** 1
SharedQueue: **** **** **** **** 1.7 **** **** **** **** **** **** 0.0
Shrd ConDel: **** **** **** **** 23.1 **** **** **** **** **** **** 8.3
Shared LOS: * * * * C * * * * * * A
ApproachDel: **** 23.1 **** ****
ApproachLOS: * C * *
Note: Queue reported is the number of cars per lane.

Fri Feb 22 12:29:51 2019 Page 35
2019 Thursday PM ExistingTraffic Volumes
Traffix 8.0.0215 (c) 2008 Dowling Associates Licensed to ITS, SOUTH AFRICA
2019 Thursday PM Existing Traffic Volumes
Level Of Service Computation Report2000 HCM Unsignalized Method (Base Volume Alternative)
Index #8: Hendon St & Percy St
Average Delay (sec/veh): 0.3 Worst Case Level Of Service: C[15.7]
Approach: North Bound South Bound East Bound West Bound
Movement: L T R L T R L T R L T R
Control: Stop Sign Stop Sign Uncontrolled Uncontrolled
Lefts Include Include Include Include
Lanes: 0 0 1! 0 0 0 0 0 0 0 0 0 0 1 0 0 1 0 0 0
Volume Module: >> Count Date: 3 Jan 2019 <<
Base Vol: 6 0 10 0 0 0 0 500 3 1 413 0
Growth Adj: 1.00 1.00 1.00 1.00 1.00 1.00 1.00 1.00 1.00 1.00 1.00 1.00
Initial Base: 6 0 10 0 0 0 0 500 3 1 413 0
User Adj: 1.00 1.00 1.00 1.00 1.00 1.00 1.00 1.00 1.00 1.00 1.00 1.00
PHF Adj: 0.94 0.94 0.94 0.94 0.94 0.94 0.94 0.94 0.94 0.94 0.94 0.94
PHF Volume: 6 0 11 0 0 0 0 530 3 1 438 0
Reduct Vol: 0 0 0 0 0 0 0 0 0 0 0 0
Final Vol.: 6 0 11 0 0 0 0 530 3 1 438 0
Critical Gap Module:
Critical Gp: 6.2 6.5 6.4 **** **** **** **** **** 4.1 **** **** ****
FollowUpTim: 3.3 4.0 3.5 **** **** **** **** **** 2.2 **** **** ****
Capacity Module:
Cnflict Vol: 439 975 975 **** **** **** **** **** 439 **** **** ****
Potent Cap.: 623 253 281 **** **** **** **** **** 1132 **** **** ****
Move Cap.: 623 253 281 **** **** **** **** **** 1132 **** **** ****
Volume/Cap: 0.01 0.00 0.04 **** **** **** **** **** 0.00 **** **** ****
Level Of Service Module:
2Way95thQ: **** **** **** **** **** **** **** **** 0.0 **** **** ****
Control Del: **** **** **** **** **** **** **** **** 8.2 **** **** ****
LOS by Move: * * * * * * * * A * * *
Movement: LT LTR RT LT LTR RT LT LTR RT LT LTR RT
Shared Cap.: **** 353 **** **** **** **** **** **** 1 **** **** ****
SharedQueue: **** 0.2 **** **** **** **** **** **** 0.0 **** **** ****
Shrd ConDel: **** 15.7 **** **** **** **** **** **** 8.2 **** **** ****
Shared LOS: * C * * * * * * A * * *
ApproachDel: 15.7 **** **** ****
ApproachLOS: C * * *
Note: Queue reported is the number of cars per lane.

Fri Feb 22 12:29:51 2019 Page 39
2019 Thursday PM ExistingTraffic Volumes
Traffix 8.0.0215 (c) 2008 Dowling Associates Licensed to ITS, SOUTH AFRICA
2019 Thursday PM Existing Traffic Volumes
Level Of Service Computation Report2000 HCM Unsignalized Method (Base Volume Alternative)
Index #9: Bezuidenhout St & Paddock St
Average Delay (sec/veh): 0.0 Worst Case Level Of Service: B[11.0]
Approach: North Bound South Bound East Bound West Bound
Movement: L T R L T R L T R L T R
Control: Uncontrolled Uncontrolled Stop Sign Stop Sign
Lefts Include Include Include Include
Lanes: 0 0 0 1 0 0 1 0 0 0 0 0 0 0 0 0 0 1! 0 0
Volume Module: >> Count Date: 3 Jan 2019 <<
Base Vol: 0 298 1 1 245 0 0 0 0 1 0 1
Growth Adj: 1.00 1.00 1.00 1.00 1.00 1.00 1.00 1.00 1.00 1.00 1.00 1.00
Initial Base: 0 298 1 1 245 0 0 0 0 1 0 1
User Adj: 1.00 1.00 1.00 1.00 1.00 1.00 1.00 1.00 1.00 1.00 1.00 1.00
PHF Adj: 0.96 0.96 0.96 0.96 0.96 0.96 0.96 0.96 0.96 0.96 0.96 0.96
PHF Volume: 0 310 1 1 255 0 0 0 0 1 0 1
Reduct Vol: 0 0 0 0 0 0 0 0 0 0 0 0
Final Vol.: 0 310 1 1 255 0 0 0 0 1 0 1
Critical Gap Module:
Critical Gp: **** **** 4.1 **** **** **** **** **** **** 6.2 6.5 6.4
FollowUpTim: **** **** 2.2 **** **** **** **** **** **** 3.3 4.0 3.5
Capacity Module:
Cnflict Vol: **** **** 256 **** **** **** **** **** **** 255 567 567
Potent Cap.: **** **** 1321 **** **** **** **** **** **** 788 436 488
Move Cap.: **** **** 1321 **** **** **** **** **** **** 788 436 488
Volume/Cap: **** **** 0.00 **** **** **** **** **** **** 0.00 0.00 0.00
Level Of Service Module:
2Way95thQ: **** **** 0.0 **** **** **** **** **** **** **** **** ****
Control Del: **** **** 7.7 **** **** **** **** **** **** **** **** ****
LOS by Move: * * A * * * * * * * * *
Movement: LT LTR RT LT LTR RT LT LTR RT LT LTR RT
Shared Cap.: **** **** 1 **** **** **** **** **** **** **** 603 ****
SharedQueue: **** **** 0.0 **** **** **** **** **** **** **** 0.0 ****
Shrd ConDel: **** **** 7.7 **** **** **** **** **** **** **** 11.0 ****
Shared LOS: * * A * * * * * * * B *
ApproachDel: **** **** **** 11.0
ApproachLOS: * * * B
Note: Queue reported is the number of cars per lane.

Mon Feb 25 11:56:33 2019 Page 41
2019 Thursday PM ExistingTraffic Volumes
Traffix 8.0.0215 (c) 2008 Dowling Associates Licensed to ITS, SOUTH AFRICA
2019 Thursday PM Existing Traffic Volumes
Level Of Service Computation Report2000 HCM Unsignalized Method (Base Volume Alternative)
Index #11: Highlands St & Back-of-House Access
Average Delay (sec/veh): 3.3 Worst Case Level Of Service: A[8.4]
Approach: North Bound South Bound East Bound West Bound
Movement: L T R L T R L T R L T R
Control: Stop Sign Stop Sign Uncontrolled Uncontrolled
Lefts Include Include Include Include
Lanes: 0 0 1! 0 0 1 0 0 0 0 0 0 1! 0 0 0 0 0 0 1
Volume Module: >> Count Date: 3 Jan 2019 <<
Base Vol: 0 0 0 26 0 0 0 0 0 0 0 40
Growth Adj: 1.00 1.00 1.00 1.00 1.00 1.00 1.00 1.00 1.00 1.00 1.00 1.00
Initial Base: 0 0 0 26 0 0 0 0 0 0 0 40
User Adj: 1.00 1.00 1.00 1.00 1.00 1.00 1.00 1.00 1.00 1.00 1.00 1.00
PHF Adj: 0.93 0.93 0.93 0.93 0.93 0.93 0.93 0.93 0.93 0.93 0.93 0.93
PHF Volume: 0 0 0 28 0 0 0 0 0 0 0 43
Reduct Vol: 0 0 0 0 0 0 0 0 0 0 0 0
Final Vol.: 0 0 0 28 0 0 0 0 0 0 0 43
Critical Gap Module:
Critical Gp: 6.2 6.5 7.1 6.2 **** **** **** **** **** **** **** 4.1
FollowUpTim: 3.3 4.0 3.5 3.3 **** **** **** **** **** **** **** 2.2
Capacity Module:
Cnflict Vol: 0 86 100 0 **** **** **** **** **** **** **** 0
Potent Cap.: 1091 808 886 1091 **** **** **** **** **** **** **** 1636
Move Cap.: 1091 787 846 1091 **** **** **** **** **** **** **** 1636
Volume/Cap: 0.00 0.00 0.00 0.03 **** **** **** **** **** **** **** 0.03
Level Of Service Module:
2Way95thQ: **** **** **** 0.1 **** **** **** **** **** **** **** 0.1
Control Del: **** **** **** 8.4 **** **** **** **** **** **** **** 7.3
LOS by Move: * * * A * * * * * * * A
Movement: LT LTR RT LT LTR RT LT LTR RT LT LTR RT
Shared Cap.: **** 0 **** **** **** **** **** **** **** **** **** ****
SharedQueue: **** **** **** **** **** **** **** **** **** **** **** ****
Shrd ConDel: **** **** **** **** **** **** **** **** **** **** **** ****
Shared LOS: * * * * * * * * * * * *
ApproachDel: **** 8.4 **** ****
ApproachLOS: * A * *
Note: Queue reported is the number of cars per lane.

Fri Feb 22 12:29:51 2019 Page 43
2019 Thursday PM ExistingTraffic Volumes
Traffix 8.0.0215 (c) 2008 Dowling Associates Licensed to ITS, SOUTH AFRICA
2019 Thursday PM Existing Traffic Volumes
Level Of Service Computation Report2000 HCM Unsignalized Method (Base Volume Alternative)
Index #12: Charlton Access Rd & South Ln
Average Delay (sec/veh): 1.2 Worst Case Level Of Service: A[8.4]
Approach: North Bound South Bound East Bound West Bound
Movement: L T R L T R L T R L T R
Control: Uncontrolled Uncontrolled Stop Sign Stop Sign
Lefts Include Include Include Include
Lanes: 0 0 0 0 0 0 1 0 0 0 0 0 0 0 0 1 0 0 0 0
Volume Module: >> Count Date: 3 Jan 2019 <<
Base Vol: 0 0 0 10 20 0 0 0 0 5 0 0
Growth Adj: 1.00 1.00 1.00 1.00 1.00 1.00 1.00 1.00 1.00 1.00 1.00 1.00
Initial Base: 0 0 0 10 20 0 0 0 0 5 0 0
User Adj: 1.00 1.00 1.00 1.00 1.00 1.00 1.00 1.00 1.00 1.00 1.00 1.00
PHF Adj: 0.89 0.89 0.89 0.89 0.89 0.89 0.89 0.89 0.89 0.89 0.89 0.89
PHF Volume: 0 0 0 11 23 0 0 0 0 6 0 0
Reduct Vol: 0 0 0 0 0 0 0 0 0 0 0 0
Final Vol.: 0 0 0 11 23 0 0 0 0 6 0 0
Critical Gap Module:
Critical Gp: **** **** **** **** **** **** **** **** **** 6.2 **** ****
FollowUpTim: **** **** **** **** **** **** **** **** **** 3.3 **** ****
Capacity Module:
Cnflict Vol: **** **** **** **** **** **** **** **** **** 28 **** ****
Potent Cap.: **** **** **** **** **** **** **** **** **** 1053 **** ****
Move Cap.: **** **** **** **** **** **** **** **** **** 1053 **** ****
Volume/Cap: **** **** **** **** **** **** **** **** **** 0.01 **** ****
Level Of Service Module:
2Way95thQ: **** **** **** **** **** **** **** **** **** 0.0 **** ****
Control Del: **** **** **** **** **** **** **** **** **** 8.4 **** ****
LOS by Move: * * * * * * * * * A * *
Movement: LT LTR RT LT LTR RT LT LTR RT LT LTR RT
Shared Cap.: **** **** **** **** **** **** **** **** **** **** **** ****
SharedQueue: **** **** **** **** **** **** **** **** **** **** **** ****
Shrd ConDel: **** **** **** **** **** **** **** **** **** **** **** ****
Shared LOS: * * * * * * * * * * * *
ApproachDel: **** **** **** 8.4
ApproachLOS: * * * A
Note: Queue reported is the number of cars per lane.

Fri Feb 22 12:29:51 2019 Page 47
2019 Thursday PM ExistingTraffic Volumes
Traffix 8.0.0215 (c) 2008 Dowling Associates Licensed to ITS, SOUTH AFRICA
2019 Thursday PM Existing Traffic Volumes
Level Of Service Computation Report2000 HCM Unsignalized Method (Future Volume Alternative)
Index #14:
Average Delay (sec/veh): 0.4 Worst Case Level Of Service: A[8.3]
Approach: North Bound South Bound East Bound West Bound
Movement: L T R L T R L T R L T R
Control: Stop Sign Stop Sign Uncontrolled Uncontrolled
Lefts Include Include Include Include
Lanes: 1 0 0 0 0 0 0 0 0 0 0 0 0 1 0 0 0 1 0 0
Volume Module:
Base Vol: 2 0 0 0 0 0 0 24 7 0 6 0
Growth Adj: 1.00 1.00 1.00 1.00 1.00 1.00 1.00 1.00 1.00 1.00 1.00 1.00
Initial Base: 0 0 0 0 0 0 0 0 0 0 0 0
Added Vol: 2 0 0 0 0 0 0 24 7 0 6 0
PasserByVol: 0 0 0 0 0 0 0 0 0 0 0 0
Initial Fut: 2 0 0 0 0 0 0 24 7 0 6 0
User Adj: 1.00 1.00 1.00 1.00 1.00 1.00 1.00 1.00 1.00 1.00 1.00 1.00
PHF Adj: 1.00 1.00 1.00 1.00 1.00 1.00 1.00 1.00 1.00 1.00 1.00 1.00
PHF Volume: 2 0 0 0 0 0 0 24 7 0 6 0
Reduct Vol: 0 0 0 0 0 0 0 0 0 0 0 0
Final Vol.: 2 0 0 0 0 0 0 24 7 0 6 0
Critical Gap Module:
Critical Gp: 6.2 **** **** **** **** **** **** **** 4.1 **** **** ****
FollowUpTim: 3.3 **** **** **** **** **** **** **** 2.2 **** **** ****
Capacity Module:
Cnflict Vol: 6 **** **** **** **** **** **** **** 6 **** **** ****
Potent Cap.: 1083 **** **** **** **** **** **** **** 1628 **** **** ****
Move Cap.: 1083 **** **** **** **** **** **** **** 1628 **** **** ****
Volume/Cap: 0.00 **** **** **** **** **** **** **** 0.00 **** **** ****
Level Of Service Module:
2Way95thQ: 0.0 **** **** **** **** **** **** **** 0.0 **** **** ****
Control Del: 8.3 **** **** **** **** **** **** **** 7.2 **** **** ****
LOS by Move: A * * * * * * * A * * *
Movement: LT LTR RT LT LTR RT LT LTR RT LT LTR RT
Shared Cap.: **** **** **** **** **** **** **** **** 1 **** **** ****
SharedQueue: **** **** **** **** **** **** **** **** 0.0 **** **** ****
Shrd ConDel: **** **** **** **** **** **** **** **** 7.2 **** **** ****
Shared LOS: * * * * * * * * A * * *
ApproachDel: 8.3 **** **** ****
ApproachLOS: A * * *
Note: Queue reported is the number of cars per lane.

TRAFFIC IMPACT STUDY YEOVILLE RCG CHURCH
2019 Sunday PM Existing Traffic Volumes

Fri Feb 22 12:31:00 2019 Page 1
2019 Sunday Existing TrafficVolumes
Traffix 8.0.0215 (c) 2008 Dowling Associates Licensed to ITS, SOUTH AFRICA
2019 Sunday Existing Traffic Volumes
Level Of Service Computation Report2000 HCM Unsignalized Method (Base Volume Alternative)
Index #1: Grafton St & Percy St
Average Delay (sec/veh): 3.2 Worst Case Level Of Service: A[8.7]
Approach: North Bound South Bound East Bound West Bound
Movement: L T R L T R L T R L T R
Control: Stop Sign Stop Sign Uncontrolled Uncontrolled
Lefts Include Include Include Include
Lanes: 0 0 0 0 0 0 0 1! 0 0 0 1 0 0 0 0 0 0 1 0
Volume Module: >> Count Date: 3 Feb 2019 <<
Base Vol: 0 0 0 20 0 12 18 3 0 0 7 26
Growth Adj: 1.00 1.00 1.00 1.00 1.00 1.00 1.00 1.00 1.00 1.00 1.00 1.00
Initial Base: 0 0 0 20 0 12 18 3 0 0 7 26
User Adj: 1.00 1.00 1.00 1.00 1.00 1.00 1.00 1.00 1.00 1.00 1.00 1.00
PHF Adj: 0.96 0.96 0.96 0.96 0.96 0.96 0.96 0.96 0.96 0.96 0.96 0.96
PHF Volume: 0 0 0 21 0 13 19 3 0 0 7 27
Reduct Vol: 0 0 0 0 0 0 0 0 0 0 0 0
Final Vol.: 0 0 0 21 0 13 19 3 0 0 7 27
Critical Gap Module:
Critical Gp: **** **** **** 6.2 6.5 6.4 **** **** **** **** **** 4.1
FollowUpTim: **** **** **** 3.3 4.0 3.5 **** **** **** **** **** 2.2
Capacity Module:
Cnflict Vol: **** **** **** 13 74 74 **** **** **** **** **** 22
Potent Cap.: **** **** **** 1074 820 935 **** **** **** **** **** 1607
Move Cap.: **** **** **** 1074 806 922 **** **** **** **** **** 1607
Volume/Cap: **** **** **** 0.02 0.00 0.01 **** **** **** **** **** 0.02
Level Of Service Module:
2Way95thQ: **** **** **** **** **** **** **** **** **** **** **** 0.1
Control Del: **** **** **** **** **** **** **** **** **** **** **** 7.3
LOS by Move: * * * * * * * * * * * A
Movement: LT LTR RT LT LTR RT LT LTR RT LT LTR RT
Shared Cap.: **** **** **** **** 1012 **** **** **** **** **** **** 5
SharedQueue: **** **** **** **** 0.1 **** **** **** **** **** **** 0.1
Shrd ConDel: **** **** **** **** 8.7 **** **** **** **** **** **** 7.3
Shared LOS: * * * * A * * * * * * A
ApproachDel: **** 8.7 **** ****
ApproachLOS: * A * *
Note: Queue reported is the number of cars per lane.

Fri Feb 22 12:31:00 2019 Page 3
2019 Sunday Existing TrafficVolumes
Traffix 8.0.0215 (c) 2008 Dowling Associates Licensed to ITS, SOUTH AFRICA
2019 Sunday Existing Traffic Volumes
Level Of Service Computation Report2000 HCM Unsignalized Method (Base Volume Alternative)
Index #2: Percy St & Highlands St
Average Delay (sec/veh): 4.3 Worst Case Level Of Service: A[8.6]
Approach: North Bound South Bound East Bound West Bound
Movement: L T R L T R L T R L T R
Control: Stop Sign Stop Sign Uncontrolled Uncontrolled
Lefts Include Include Include Include
Lanes: 0 0 1! 0 0 0 0 0 0 0 0 0 0 1 0 0 1 0 0 0
Volume Module: >> Count Date: 3 Jan 2019 <<
Base Vol: 21 0 13 0 0 0 0 6 15 4 9 0
Growth Adj: 1.00 1.00 1.00 1.00 1.00 1.00 1.00 1.00 1.00 1.00 1.00 1.00
Initial Base: 21 0 13 0 0 0 0 6 15 4 9 0
User Adj: 1.00 1.00 1.00 1.00 1.00 1.00 1.00 1.00 1.00 1.00 1.00 1.00
PHF Adj: 0.95 0.95 0.95 0.95 0.95 0.95 0.95 0.95 0.95 0.95 0.95 0.95
PHF Volume: 22 0 14 0 0 0 0 6 16 4 9 0
Reduct Vol: 0 0 0 0 0 0 0 0 0 0 0 0
Final Vol.: 22 0 14 0 0 0 0 6 16 4 9 0
Critical Gap Module:
Critical Gp: 6.2 6.5 6.4 **** **** **** **** **** 4.1 **** **** ****
FollowUpTim: 3.3 4.0 3.5 **** **** **** **** **** 2.2 **** **** ****
Capacity Module:
Cnflict Vol: 12 50 50 **** **** **** **** **** 14 **** **** ****
Potent Cap.: 1075 846 965 **** **** **** **** **** 1618 **** **** ****
Move Cap.: 1075 837 957 **** **** **** **** **** 1618 **** **** ****
Volume/Cap: 0.02 0.00 0.01 **** **** **** **** **** 0.01 **** **** ****
Level Of Service Module:
2Way95thQ: **** **** **** **** **** **** **** **** 0.0 **** **** ****
Control Del: **** **** **** **** **** **** **** **** 7.2 **** **** ****
LOS by Move: * * * * * * * * A * * *
Movement: LT LTR RT LT LTR RT LT LTR RT LT LTR RT
Shared Cap.: **** 1027 **** **** **** **** **** **** 3 **** **** ****
SharedQueue: **** 0.1 **** **** **** **** **** **** 0.0 **** **** ****
Shrd ConDel: **** 8.6 **** **** **** **** **** **** 7.2 **** **** ****
Shared LOS: * A * * * * * * A * * *
ApproachDel: 8.6 **** **** ****
ApproachLOS: A * * *
Note: Queue reported is the number of cars per lane.

Fri Feb 22 12:31:00 2019 Page 5
2019 Sunday Existing TrafficVolumes
Traffix 8.0.0215 (c) 2008 Dowling Associates Licensed to ITS, SOUTH AFRICA
2019 Sunday Existing Traffic Volumes
Level Of Service Computation Report2000 HCM Unsignalized Method (Base Volume Alternative)
Index #3: Harley St & Cavendish Rd
Average Delay (sec/veh): 2.3 Worst Case Level Of Service: B[12.3]
Approach: North Bound South Bound East Bound West Bound
Movement: L T R L T R L T R L T R
Control: Stop Sign Stop Sign Uncontrolled Uncontrolled
Lefts Include Include Include Include
Lanes: 0 0 0 0 0 0 0 1! 0 0 0 1 0 0 0 0 0 0 1 0
Volume Module: >> Count Date: 3 Feb 2019 <<
Base Vol: 0 0 0 8 0 95 70 218 0 0 144 6
Growth Adj: 1.00 1.00 1.00 1.00 1.00 1.00 1.00 1.00 1.00 1.00 1.00 1.00
Initial Base: 0 0 0 8 0 95 70 218 0 0 144 6
User Adj: 1.00 1.00 1.00 1.00 1.00 1.00 1.00 1.00 1.00 1.00 1.00 1.00
PHF Adj: 0.97 0.97 0.97 0.97 0.97 0.97 0.97 0.97 0.97 0.97 0.97 0.97
PHF Volume: 0 0 0 8 0 98 73 226 0 0 149 6
Reduct Vol: 0 0 0 0 0 0 0 0 0 0 0 0
Final Vol.: 0 0 0 8 0 98 73 226 0 0 149 6
Critical Gap Module:
Critical Gp: **** **** **** 6.2 6.5 6.4 **** **** **** **** **** 4.1
FollowUpTim: **** **** **** 3.3 4.0 3.5 **** **** **** **** **** 2.2
Capacity Module:
Cnflict Vol: **** **** **** 262 424 424 **** **** **** **** **** 298
Potent Cap.: **** **** **** 781 525 591 **** **** **** **** **** 1274
Move Cap.: **** **** **** 781 523 589 **** **** **** **** **** 1274
Volume/Cap: **** **** **** 0.01 0.00 0.17 **** **** **** **** **** 0.00
Level Of Service Module:
2Way95thQ: **** **** **** **** **** **** **** **** **** **** **** 0.0
Control Del: **** **** **** **** **** **** **** **** **** **** **** 7.8
LOS by Move: * * * * * * * * * * * A
Movement: LT LTR RT LT LTR RT LT LTR RT LT LTR RT
Shared Cap.: **** **** **** **** 600 **** **** **** **** **** **** 1
SharedQueue: **** **** **** **** 0.6 **** **** **** **** **** **** 0.0
Shrd ConDel: **** **** **** **** 12.3 **** **** **** **** **** **** 7.8
Shared LOS: * * * * B * * * * * * A
ApproachDel: **** 12.3 **** ****
ApproachLOS: * B * *
Note: Queue reported is the number of cars per lane.

Fri Feb 22 12:31:00 2019 Page 9
2019 Sunday Existing TrafficVolumes
Traffix 8.0.0215 (c) 2008 Dowling Associates Licensed to ITS, SOUTH AFRICA
2019 Sunday Existing Traffic Volumes
Level Of Service Computation Report2000 HCM Unsignalized Method (Base Volume Alternative)
Index #4: Bezuidenhout St & Durban Rd
Average Delay (sec/veh): 5.1 Worst Case Level Of Service: B[10.7]
Approach: North Bound South Bound East Bound West Bound
Movement: L T R L T R L T R L T R
Control: Stop Sign Stop Sign Uncontrolled Uncontrolled
Lefts Include Include Include Include
Lanes: 1 0 1 0 0 0 0 0 1 0 0 0 1! 0 0 0 0 0 0 0
Volume Module: >> Count Date: 3 Feb 2019 <<
Base Vol: 9 10 0 0 31 153 213 0 7 0 0 0
Growth Adj: 1.00 1.00 1.00 1.00 1.00 1.00 1.00 1.00 1.00 1.00 1.00 1.00
Initial Base: 9 10 0 0 31 153 213 0 7 0 0 0
User Adj: 1.00 1.00 1.00 1.00 1.00 1.00 1.00 1.00 1.00 1.00 1.00 1.00
PHF Adj: 0.97 0.97 0.97 0.97 0.97 0.97 0.97 0.97 0.97 0.97 0.97 0.97
PHF Volume: 9 10 0 0 32 158 221 0 7 0 0 0
Reduct Vol: 0 0 0 0 0 0 0 0 0 0 0 0
Final Vol.: 9 10 0 0 32 158 221 0 7 0 0 0
Critical Gap Module:
Critical Gp: 6.2 6.5 **** **** 6.5 7.1 **** **** 4.1 **** **** ****
FollowUpTim: 3.3 4.0 **** **** 4.0 3.5 **** **** 2.2 **** **** ****
Capacity Module:
Cnflict Vol: 0 235 **** **** 125 130 **** **** 0 **** **** ****
Potent Cap.: 1091 669 **** **** 769 847 **** **** 1636 **** **** ****
Move Cap.: 1091 666 **** **** 766 827 **** **** 1636 **** **** ****
Volume/Cap: 0.01 0.02 **** **** 0.04 0.19 **** **** 0.00 **** **** ****
Level Of Service Module:
2Way95thQ: 0.0 0.0 **** **** **** **** **** **** 0.0 **** **** ****
Control Del: 8.3 10.5 **** **** **** **** **** **** 7.2 **** **** ****
LOS by Move: A B * * * * * * A * * *
Movement: LT LTR RT LT LTR RT LT LTR RT LT LTR RT
Shared Cap.: **** **** **** **** **** 816 **** **** **** **** **** ****
SharedQueue: **** **** **** **** **** 0.9 **** **** **** **** **** ****
Shrd ConDel: **** **** **** **** **** 10.7 **** **** **** **** **** ****
Shared LOS: * * * * * B * * * * * *
ApproachDel: 9.5 10.7 **** ****
ApproachLOS: A B * *
Note: Queue reported is the number of cars per lane.

Fri Feb 22 12:31:00 2019 Page 13
2019 Sunday Existing TrafficVolumes
Traffix 8.0.0215 (c) 2008 Dowling Associates Licensed to ITS, SOUTH AFRICA
2019 Sunday Existing Traffic Volumes
Level Of Service Computation Report2000 HCM Unsignalized Method (Base Volume Alternative)
Index #5: Grafton Rd & Hendon St
Average Delay (sec/veh): 1.1 Worst Case Level Of Service: B[12.6]
Approach: North Bound South Bound East Bound West Bound
Movement: L T R L T R L T R L T R
Control: Stop Sign Stop Sign Uncontrolled Uncontrolled
Lefts Include Include Include Include
Lanes: 0 0 1! 0 0 0 0 1! 0 0 0 0 1! 0 0 0 0 1! 0 0
Volume Module: >> Count Date: 3 Feb 2019 <<
Base Vol: 32 6 1 3 8 28 57 307 32 2 311 2
Growth Adj: 1.00 1.00 1.00 1.00 1.00 1.00 1.00 1.00 1.00 1.00 1.00 1.00
Initial Base: 32 6 1 3 8 28 57 307 32 2 311 2
User Adj: 1.00 1.00 1.00 1.00 1.00 1.00 1.00 1.00 1.00 1.00 1.00 1.00
PHF Adj: 0.98 0.98 0.98 0.98 0.98 0.98 0.98 0.98 0.98 0.98 0.98 0.98
PHF Volume: 33 6 1 3 8 29 58 314 33 2 318 2
Reduct Vol: 0 0 0 0 0 0 0 0 0 0 0 0
Final Vol.: 33 6 1 3 8 29 58 314 33 2 318 2
Critical Gap Module:
Critical Gp: 5.3 5.4 5.5 5.3 5.4 5.5 **** **** 3.5 **** **** 3.5
FollowUpTim: 2.3 2.6 3.1 2.3 2.6 3.1 **** **** 2.1 **** **** 2.1
Capacity Module:
Cnflict Vol: 278 736 738 303 706 725 **** **** 320 **** **** 372
Potent Cap.: 1096 572 508 1065 592 498 **** **** 1377 **** **** 1328
Move Cap.: 1096 557 492 1065 577 470 **** **** 1377 **** **** 1328
Volume/Cap: 0.03 0.01 0.00 0.00 0.01 0.06 **** **** 0.02 **** **** 0.00
Level Of Service Module:
2Way95thQ: **** **** **** **** **** **** **** **** 0.1 **** **** 0.0
Control Del: **** **** **** **** **** **** **** **** 7.7 **** **** 7.7
LOS by Move: * * * * * * * * A * * A
Movement: LT LTR RT LT LTR RT LT LTR RT LT LTR RT
Shared Cap.: **** 929 **** **** 511 **** **** **** **** **** **** ****
SharedQueue: **** 0.1 **** **** 0.3 **** **** **** **** **** **** ****
Shrd ConDel: **** 9.0 **** **** 12.6 **** **** **** **** **** **** ****
Shared LOS: * A * * B * * * * * * *
ApproachDel: 9.0 12.6 **** ****
ApproachLOS: A B * *
Note: Queue reported is the number of cars per lane.

Fri Feb 22 12:31:00 2019 Page 17
2019 Sunday Existing TrafficVolumes
Traffix 8.0.0215 (c) 2008 Dowling Associates Licensed to ITS, SOUTH AFRICA
2019 Sunday Existing Traffic Volumes
Level Of Service Computation Report2000 HCM Operations Method (Base Volume Alternative)
Index #6: Joe Slovo Dr & Hendon St
Cycle (sec): 110 Critical Vol./Cap.(X): 0.623
Loss Time (sec): 15 Average Delay (sec/veh): 28.2
Optimal Cycle: 58 Level Of Service: C
Approach: North Bound South Bound East Bound West Bound
Movement: L T R L T R L T R L T R
Control: Protected+Permitted Protected+Permitted Permitted Permitted
Lefts Include Include Include Ovl
Min. Green: 0 0 0 0 0 0 0 0 0 0 0 0
Y+R: 5.0 5.0 5.0 5.0 5.0 5.0 5.0 5.0 5.0 5.0 5.0 5.0
Lanes: 0 1 2 0 2 1 1 1 0 1 1 0 1 1 1 0 1 0 0 1
Volume Module: >> Count Date: 3 Feb 2019 <<
Base Vol: 215 545 191 34 605 109 133 185 218 168 189 15
Growth Adj: 1.00 1.00 1.00 1.00 1.00 1.00 1.00 1.00 1.00 1.00 1.00 1.00
Initial Base: 215 545 191 34 605 109 133 185 218 168 189 15
User Adj: 0.98 0.98 0.98 0.98 0.98 0.98 0.98 0.98 0.98 0.98 0.98 0.98
PHF Adj: 1.00 1.00 1.00 1.00 1.00 1.00 1.00 1.00 1.00 1.00 1.00 1.00
PHF Volume: 210 532 186 33 590 106 130 181 213 164 184 15
Reduct Vol: 0 0 0 0 0 0 0 0 0 0 0 0
Reduced Vol: 210 532 186 33 590 106 130 181 213 164 184 15
PCE Adj: 1.00 1.00 1.00 1.00 1.00 1.00 1.00 1.00 1.00 1.00 1.00 1.00
MLF Adj: 1.00 1.00 1.00 1.00 1.00 1.00 1.00 1.00 1.00 1.00 1.00 1.00
Final Vol.: 210 532 186 33 590 106 130 181 213 164 184 15
Saturation Flow Module:
Sat/Lane: 1900 1900 1900 1900 1900 1900 1900 1900 1900 1900 1900 1900
Adjustment: 0.87 0.87 0.84 0.94 0.94 0.95 0.85 0.22 0.22 0.93 0.93 0.64
Lanes: 0.85 2.15 2.00 1.00 2.00 1.00 1.00 1.38 1.62 0.47 0.53 1.00
Final Sat.: 1405 3562 3177 1791 3581 1805 1615 574 677 831 935 1208
Capacity Analysis Module:
Vol/Sat: 0.15 0.15 0.06 0.02 0.16 0.06 0.08 0.31 0.31 0.20 0.20 0.01
Crit Moves: **** **** ****
Green/Cycle: 0.33 0.26 0.35 0.26 0.26 0.40 0.50 0.50 0.50 0.60 0.50 0.50
Green/Cycle: 0.33 0.26 0.09 0.26 0.26 0.10 0.50 0.50 0.50 0.60 0.50 0.50
Volume/Cap: 0.45 0.58 0.30 0.07 0.62 0.37 0.16 0.62 0.62 0.33 0.39 0.02
Level Of Service Module:
Uniform Del: 29.1 35.7 28.0 30.3 35.6 24.2 14.7 19.7 19.7 11.0 16.8 13.7
IncremntDel: 0.2 0.7 0.3 0.0 1.2 0.8 0.1 1.9 1.9 0.2 0.3 0.0
InitQueuDel: 0.0 0.0 0.0 0.0 0.0 0.0 0.0 0.0 0.0 0.0 0.0 0.0
Delay Adj: 1.00 1.00 1.00 1.00 1.00 1.00 1.00 1.00 1.00 1.00 1.00 1.00
Delay/Veh: 29.3 36.3 28.2 30.3 36.8 25.0 14.8 21.6 21.6 11.2 17.1 13.7
User DelAdj: 1.00 1.00 1.00 1.00 1.00 1.00 1.00 1.00 1.00 1.00 1.00 1.00
AdjDel/Veh: 29.3 36.3 28.2 30.3 36.8 25.0 14.8 21.6 21.6 11.2 17.1 13.7
LOS by Move: C D C C D C B C C B B B
HCM2kAvgQ: 7.4 8.6 2.8 0.9 9.9 2.8 2.3 4.5 4.5 5.8 7.2 0.2
Note: Queue reported is the number of cars per lane.

Fri Feb 22 12:31:00 2019 Page 31
2019 Sunday Existing TrafficVolumes
Traffix 8.0.0215 (c) 2008 Dowling Associates Licensed to ITS, SOUTH AFRICA
2019 Sunday Existing Traffic Volumes
Level Of Service Computation Report2000 HCM Unsignalized Method (Base Volume Alternative)
Index #7: Fortesque Rd & Hendon St
Average Delay (sec/veh): 1.3 Worst Case Level Of Service: B[13.3]
Approach: North Bound South Bound East Bound West Bound
Movement: L T R L T R L T R L T R
Control: Stop Sign Stop Sign Uncontrolled Uncontrolled
Lefts Include Include Include Include
Lanes: 0 0 0 0 0 0 0 0 0 1 0 1 0 0 0 0 0 0 1 0
Volume Module: >> Count Date: 3 Feb 2020 <<
Base Vol: 0 0 0 0 0 60 58 246 0 0 260 4
Growth Adj: 1.00 1.00 1.00 1.00 1.00 1.00 1.00 1.00 1.00 1.00 1.00 1.00
Initial Base: 0 0 0 0 0 60 58 246 0 0 260 4
User Adj: 1.00 1.00 1.00 1.00 1.00 1.00 1.00 1.00 1.00 1.00 1.00 1.00
PHF Adj: 0.98 0.98 0.98 0.98 0.98 0.98 0.98 0.98 0.98 0.98 0.98 0.98
PHF Volume: 0 0 0 0 0 61 59 250 0 0 264 4
Reduct Vol: 0 0 0 0 0 0 0 0 0 0 0 0
Final Vol.: 0 0 0 0 0 61 59 250 0 0 264 4
Critical Gap Module:
Critical Gp: **** **** **** **** **** 6.4 **** **** **** **** **** 4.1
FollowUpTim: **** **** **** **** **** 3.5 **** **** **** **** **** 2.2
Capacity Module:
Cnflict Vol: **** **** **** **** **** 552 **** **** **** **** **** 309
Potent Cap.: **** **** **** **** **** 498 **** **** **** **** **** 1263
Move Cap.: **** **** **** **** **** 497 **** **** **** **** **** 1263
Volume/Cap: **** **** **** **** **** 0.12 **** **** **** **** **** 0.00
Level Of Service Module:
2Way95thQ: **** **** **** **** **** 0.4 **** **** **** **** **** 0.0
Control Del: **** **** **** **** **** 13.3 **** **** **** **** **** 7.9
LOS by Move: * * * * * B * * * * * A
Movement: LT LTR RT LT LTR RT LT LTR RT LT LTR RT
Shared Cap.: **** **** **** **** **** **** **** **** **** **** **** 1
SharedQueue: **** **** **** **** **** **** **** **** **** **** **** 0.0
Shrd ConDel: **** **** **** **** **** **** **** **** **** **** **** 7.9
Shared LOS: * * * * * * * * * * * A
ApproachDel: **** 13.3 **** ****
ApproachLOS: * B * *
Note: Queue reported is the number of cars per lane.

Fri Feb 22 12:31:00 2019 Page 35
2019 Sunday Existing TrafficVolumes
Traffix 8.0.0215 (c) 2008 Dowling Associates Licensed to ITS, SOUTH AFRICA
2019 Sunday Existing Traffic Volumes
Level Of Service Computation Report2000 HCM Unsignalized Method (Base Volume Alternative)
Index #8: Hendon St & Percy St
Average Delay (sec/veh): 0.4 Worst Case Level Of Service: B[11.1]
Approach: North Bound South Bound East Bound West Bound
Movement: L T R L T R L T R L T R
Control: Stop Sign Stop Sign Uncontrolled Uncontrolled
Lefts Include Include Include Include
Lanes: 0 0 1! 0 0 0 0 0 0 0 0 0 0 1 0 0 1 0 0 0
Volume Module: >> Count Date: 3 Feb 2019 <<
Base Vol: 7 0 10 0 0 0 0 242 4 2 257 0
Growth Adj: 1.00 1.00 1.00 1.00 1.00 1.00 1.00 1.00 1.00 1.00 1.00 1.00
Initial Base: 7 0 10 0 0 0 0 242 4 2 257 0
User Adj: 1.00 1.00 1.00 1.00 1.00 1.00 1.00 1.00 1.00 1.00 1.00 1.00
PHF Adj: 0.98 0.98 0.98 0.98 0.98 0.98 0.98 0.98 0.98 0.98 0.98 0.98
PHF Volume: 7 0 10 0 0 0 0 246 4 2 261 0
Reduct Vol: 0 0 0 0 0 0 0 0 0 0 0 0
Final Vol.: 7 0 10 0 0 0 0 246 4 2 261 0
Critical Gap Module:
Critical Gp: 6.2 6.5 6.4 **** **** **** **** **** 4.1 **** **** ****
FollowUpTim: 3.3 4.0 3.5 **** **** **** **** **** 2.2 **** **** ****
Capacity Module:
Cnflict Vol: 262 516 516 **** **** **** **** **** 263 **** **** ****
Potent Cap.: 781 466 522 **** **** **** **** **** 1313 **** **** ****
Move Cap.: 781 464 521 **** **** **** **** **** 1313 **** **** ****
Volume/Cap: 0.01 0.00 0.02 **** **** **** **** **** 0.00 **** **** ****
Level Of Service Module:
2Way95thQ: **** **** **** **** **** **** **** **** 0.0 **** **** ****
Control Del: **** **** **** **** **** **** **** **** 7.8 **** **** ****
LOS by Move: * * * * * * * * A * * *
Movement: LT LTR RT LT LTR RT LT LTR RT LT LTR RT
Shared Cap.: **** 604 **** **** **** **** **** **** 1 **** **** ****
SharedQueue: **** 0.1 **** **** **** **** **** **** 0.0 **** **** ****
Shrd ConDel: **** 11.1 **** **** **** **** **** **** 7.8 **** **** ****
Shared LOS: * B * * * * * * A * * *
ApproachDel: 11.1 **** **** ****
ApproachLOS: B * * *
Note: Queue reported is the number of cars per lane.

Fri Feb 22 12:31:00 2019 Page 39
2019 Sunday Existing TrafficVolumes
Traffix 8.0.0215 (c) 2008 Dowling Associates Licensed to ITS, SOUTH AFRICA
2019 Sunday Existing Traffic Volumes
Level Of Service Computation Report2000 HCM Unsignalized Method (Base Volume Alternative)
Index #9: Bezuidenhout St & Paddock St
Average Delay (sec/veh): 0.0 Worst Case Level Of Service: A[9.2]
Approach: North Bound South Bound East Bound West Bound
Movement: L T R L T R L T R L T R
Control: Uncontrolled Uncontrolled Stop Sign Stop Sign
Lefts Include Include Include Include
Lanes: 0 0 1 0 0 0 1 0 0 0 0 0 0 0 0 1 0 0 0 0
Volume Module: >> Count Date: 3 Feb 2019 <<
Base Vol: 0 223 0 1 184 0 0 0 0 1 0 0
Growth Adj: 1.00 1.00 1.00 1.00 1.00 1.00 1.00 1.00 1.00 1.00 1.00 1.00
Initial Base: 0 223 0 1 184 0 0 0 0 1 0 0
User Adj: 1.00 1.00 1.00 1.00 1.00 1.00 1.00 1.00 1.00 1.00 1.00 1.00
PHF Adj: 0.97 0.97 0.97 0.97 0.97 0.97 0.97 0.97 0.97 0.97 0.97 0.97
PHF Volume: 0 231 0 1 191 0 0 0 0 1 0 0
Reduct Vol: 0 0 0 0 0 0 0 0 0 0 0 0
Final Vol.: 0 231 0 1 191 0 0 0 0 1 0 0
Critical Gap Module:
Critical Gp: **** **** **** **** **** **** **** **** **** 6.2 **** ****
FollowUpTim: **** **** **** **** **** **** **** **** **** 3.3 **** ****
Capacity Module:
Cnflict Vol: **** **** **** **** **** **** **** **** **** 191 **** ****
Potent Cap.: **** **** **** **** **** **** **** **** **** 856 **** ****
Move Cap.: **** **** **** **** **** **** **** **** **** 856 **** ****
Volume/Cap: **** **** **** **** **** **** **** **** **** 0.00 **** ****
Level Of Service Module:
2Way95thQ: **** **** **** **** **** **** **** **** **** 0.0 **** ****
Control Del: **** **** **** **** **** **** **** **** **** 9.2 **** ****
LOS by Move: * * * * * * * * * A * *
Movement: LT LTR RT LT LTR RT LT LTR RT LT LTR RT
Shared Cap.: **** **** **** **** **** **** **** **** **** **** **** ****
SharedQueue: **** **** **** **** **** **** **** **** **** **** **** ****
Shrd ConDel: **** **** **** **** **** **** **** **** **** **** **** ****
Shared LOS: * * * * * * * * * * * *
ApproachDel: **** **** **** 9.2
ApproachLOS: * * * A
Note: Queue reported is the number of cars per lane.

Mon Feb 25 11:58:08 2019 Page 41
2019 Sunday Existing TrafficVolumes
Traffix 8.0.0215 (c) 2008 Dowling Associates Licensed to ITS, SOUTH AFRICA
2019 Sunday Existing Traffic Volumes
Level Of Service Computation Report2000 HCM Unsignalized Method (Base Volume Alternative)
Index #11: Highlands St & Back-of-House Access
Average Delay (sec/veh): 2.9 Worst Case Level Of Service: A[8.4]
Approach: North Bound South Bound East Bound West Bound
Movement: L T R L T R L T R L T R
Control: Stop Sign Stop Sign Uncontrolled Uncontrolled
Lefts Include Include Include Include
Lanes: 0 0 1! 0 0 1 0 0 0 0 0 0 1! 0 0 0 0 0 0 1
Volume Module: >> Count Date: 3 Feb 2019 <<
Base Vol: 0 0 0 19 0 0 0 0 0 0 0 35
Growth Adj: 1.00 1.00 1.00 1.00 1.00 1.00 1.00 1.00 1.00 1.00 1.00 1.00
Initial Base: 0 0 0 19 0 0 0 0 0 0 0 35
User Adj: 1.00 1.00 1.00 1.00 1.00 1.00 1.00 1.00 1.00 1.00 1.00 1.00
PHF Adj: 0.95 0.95 0.95 0.95 0.95 0.95 0.95 0.95 0.95 0.95 0.95 0.95
PHF Volume: 0 0 0 20 0 0 0 0 0 0 0 37
Reduct Vol: 0 0 0 0 0 0 0 0 0 0 0 0
Final Vol.: 0 0 0 20 0 0 0 0 0 0 0 37
Critical Gap Module:
Critical Gp: 6.2 6.5 7.1 6.2 **** **** **** **** **** **** **** 4.1
FollowUpTim: 3.3 4.0 3.5 3.3 **** **** **** **** **** **** **** 2.2
Capacity Module:
Cnflict Vol: 0 74 84 0 **** **** **** **** **** **** **** 0
Potent Cap.: 1091 820 908 1091 **** **** **** **** **** **** **** 1636
Move Cap.: 1091 802 876 1091 **** **** **** **** **** **** **** 1636
Volume/Cap: 0.00 0.00 0.00 0.02 **** **** **** **** **** **** **** 0.02
Level Of Service Module:
2Way95thQ: **** **** **** 0.1 **** **** **** **** **** **** **** 0.1
Control Del: **** **** **** 8.4 **** **** **** **** **** **** **** 7.3
LOS by Move: * * * A * * * * * * * A
Movement: LT LTR RT LT LTR RT LT LTR RT LT LTR RT
Shared Cap.: **** 0 **** **** **** **** **** **** **** **** **** ****
SharedQueue: **** **** **** **** **** **** **** **** **** **** **** ****
Shrd ConDel: **** **** **** **** **** **** **** **** **** **** **** ****
Shared LOS: * * * * * * * * * * * *
ApproachDel: **** 8.4 **** ****
ApproachLOS: * A * *
Note: Queue reported is the number of cars per lane.

Fri Feb 22 12:31:00 2019 Page 43
2019 Sunday Existing TrafficVolumes
Traffix 8.0.0215 (c) 2008 Dowling Associates Licensed to ITS, SOUTH AFRICA
2019 Sunday Existing Traffic Volumes
Level Of Service Computation Report2000 HCM Unsignalized Method (Base Volume Alternative)
Index #12: Charlton Access Rd & South Ln
Average Delay (sec/veh): 1.0 Worst Case Level Of Service: A[8.4]
Approach: North Bound South Bound East Bound West Bound
Movement: L T R L T R L T R L T R
Control: Uncontrolled Uncontrolled Stop Sign Stop Sign
Lefts Include Include Include Include
Lanes: 0 0 0 0 0 0 1 0 0 0 0 0 0 0 0 1 0 0 0 0
Volume Module:
Base Vol: 0 0 0 5 10 0 0 0 0 2 0 0
Growth Adj: 1.00 1.00 1.00 1.00 1.00 1.00 1.00 1.00 1.00 1.00 1.00 1.00
Initial Base: 0 0 0 5 10 0 0 0 0 2 0 0
User Adj: 1.00 1.00 1.00 1.00 1.00 1.00 1.00 1.00 1.00 1.00 1.00 1.00
PHF Adj: 1.00 1.00 1.00 1.00 1.00 1.00 1.00 1.00 1.00 1.00 1.00 1.00
PHF Volume: 0 0 0 5 10 0 0 0 0 2 0 0
Reduct Vol: 0 0 0 0 0 0 0 0 0 0 0 0
Final Vol.: 0 0 0 5 10 0 0 0 0 2 0 0
Critical Gap Module:
Critical Gp: **** **** **** **** **** **** **** **** **** 6.2 **** ****
FollowUpTim: **** **** **** **** **** **** **** **** **** 3.3 **** ****
Capacity Module:
Cnflict Vol: **** **** **** **** **** **** **** **** **** 13 **** ****
Potent Cap.: **** **** **** **** **** **** **** **** **** 1074 **** ****
Move Cap.: **** **** **** **** **** **** **** **** **** 1074 **** ****
Volume/Cap: **** **** **** **** **** **** **** **** **** 0.00 **** ****
Level Of Service Module:
2Way95thQ: **** **** **** **** **** **** **** **** **** 0.0 **** ****
Control Del: **** **** **** **** **** **** **** **** **** 8.4 **** ****
LOS by Move: * * * * * * * * * A * *
Movement: LT LTR RT LT LTR RT LT LTR RT LT LTR RT
Shared Cap.: **** **** **** **** **** **** **** **** **** **** **** ****
SharedQueue: **** **** **** **** **** **** **** **** **** **** **** ****
Shrd ConDel: **** **** **** **** **** **** **** **** **** **** **** ****
Shared LOS: * * * * * * * * * * * *
ApproachDel: **** **** **** 8.4
ApproachLOS: * * * A
Note: Queue reported is the number of cars per lane.

Fri Feb 22 12:31:00 2019 Page 47
2019 Sunday Existing TrafficVolumes
Traffix 8.0.0215 (c) 2008 Dowling Associates Licensed to ITS, SOUTH AFRICA
2019 Sunday Existing Traffic Volumes
Level Of Service Computation Report2000 HCM Unsignalized Method (Base Volume Alternative)
Index #14:
Average Delay (sec/veh): 0.0 Worst Case Level Of Service: A[0.0]
Approach: North Bound South Bound East Bound West Bound
Movement: L T R L T R L T R L T R
Control: Stop Sign Stop Sign Uncontrolled Uncontrolled
Lefts Include Include Include Include
Lanes: 0 0 0 0 0 0 0 0 0 0 0 0 1 0 0 0 0 1 0 0
Volume Module:
Base Vol: 0 0 0 0 0 0 0 23 0 0 33 0
Growth Adj: 1.00 1.00 1.00 1.00 1.00 1.00 1.00 1.00 1.00 1.00 1.00 1.00
Initial Base: 0 0 0 0 0 0 0 23 0 0 33 0
User Adj: 1.00 1.00 1.00 1.00 1.00 1.00 1.00 1.00 1.00 1.00 1.00 1.00
PHF Adj: 1.00 1.00 1.00 1.00 1.00 1.00 1.00 1.00 1.00 1.00 1.00 1.00
PHF Volume: 0 0 0 0 0 0 0 23 0 0 33 0
Reduct Vol: 0 0 0 0 0 0 0 0 0 0 0 0
Final Vol.: 0 0 0 0 0 0 0 23 0 0 33 0
Critical Gap Module:
Critical Gp: **** **** **** **** **** **** **** **** **** **** **** ****
FollowUpTim: **** **** **** **** **** **** **** **** **** **** **** ****
Capacity Module:
Cnflict Vol: **** **** **** **** **** **** **** **** **** **** **** ****
Potent Cap.: **** **** **** **** **** **** **** **** **** **** **** ****
Move Cap.: **** **** **** **** **** **** **** **** **** **** **** ****
Volume/Cap: **** **** **** **** **** **** **** **** **** **** **** ****
Level Of Service Module:
2Way95thQ: **** **** **** **** **** **** **** **** **** **** **** ****
Control Del: **** **** **** **** **** **** **** **** **** **** **** ****
LOS by Move: * * * * * * * * * * * *
Movement: LT LTR RT LT LTR RT LT LTR RT LT LTR RT
Shared Cap.: **** **** **** **** **** **** **** **** **** **** **** ****
SharedQueue: **** **** **** **** **** **** **** **** **** **** **** ****
Shrd ConDel: **** **** **** **** **** **** **** **** **** **** **** ****
Shared LOS: * * * * * * * * * * * *
ApproachDel: **** **** **** ****
ApproachLOS: * * * *
Note: Queue reported is the number of cars per lane.

TRAFFIC IMPACT STUDY YEOVILLE RCG CHURCH
2019 Thursday PM Existing + Development Traffic Volumes

Fri Feb 22 12:31:49 2019 Page 2
2019 Thursday PM + DevelopmentTraffic Volumes
Traffix 8.0.0215 (c) 2008 Dowling Associates Licensed to ITS, SOUTH AFRICA
2019 Thursday PM + Development Traffic Volumes
Level Of Service Computation Report2000 HCM Unsignalized Method (Future Volume Alternative)
Index #1: Grafton St & Percy St
Average Delay (sec/veh): 4.8 Worst Case Level Of Service: A[8.9]
Approach: North Bound South Bound East Bound West Bound
Movement: L T R L T R L T R L T R
Control: Stop Sign Stop Sign Uncontrolled Uncontrolled
Lefts Include Include Include Include
Lanes: 0 0 0 0 0 0 0 1! 0 0 0 1 0 0 0 0 0 0 1 0
Volume Module: >> Count Date: 31 Jan 2019 <<
Base Vol: 0 0 0 65 0 16 23 5 0 0 3 38
Growth Adj: 1.00 1.00 1.00 1.00 1.00 1.00 1.00 1.00 1.00 1.00 1.00 1.00
Initial Base: 0 0 0 35 0 16 22 4 0 0 3 30
Added Vol: 0 0 0 30 0 0 1 1 0 0 0 8
PasserByVol: 0 0 0 0 0 0 0 0 0 0 0 0
Initial Fut: 0 0 0 65 0 16 23 5 0 0 3 38
User Adj: 1.00 1.00 1.00 1.00 1.00 1.00 1.00 1.00 1.00 1.00 1.00 1.00
PHF Adj: 0.89 0.89 0.89 0.89 0.89 0.89 0.89 0.89 0.89 0.89 0.89 0.89
PHF Volume: 0 0 0 73 0 18 26 6 0 0 3 43
Reduct Vol: 0 0 0 0 0 0 0 0 0 0 0 0
Final Vol.: 0 0 0 73 0 18 26 6 0 0 3 43
Critical Gap Module:
Critical Gp: **** **** **** 6.2 6.5 6.4 **** **** **** **** **** 4.1
FollowUpTim: **** **** **** 3.3 4.0 3.5 **** **** **** **** **** 2.2
Capacity Module:
Cnflict Vol: **** **** **** 19 107 107 **** **** **** **** **** 32
Potent Cap.: **** **** **** 1066 786 895 **** **** **** **** **** 1594
Move Cap.: **** **** **** 1066 765 876 **** **** **** **** **** 1594
Volume/Cap: **** **** **** 0.07 0.00 0.02 **** **** **** **** **** 0.03
Level Of Service Module:
2Way95thQ: **** **** **** **** **** **** **** **** **** **** **** 0.1
Control Del: **** **** **** **** **** **** **** **** **** **** **** 7.3
LOS by Move: * * * * * * * * * * * A
Movement: LT LTR RT LT LTR RT LT LTR RT LT LTR RT
Shared Cap.: **** **** **** **** 1022 **** **** **** **** **** **** 14
SharedQueue: **** **** **** **** 0.3 **** **** **** **** **** **** 0.1
Shrd ConDel: **** **** **** **** 8.9 **** **** **** **** **** **** 7.3
Shared LOS: * * * * A * * * * * * A
ApproachDel: **** 8.9 **** ****
ApproachLOS: * A * *
Note: Queue reported is the number of cars per lane.

Fri Feb 22 12:31:49 2019 Page 4
2019 Thursday PM + DevelopmentTraffic Volumes
Traffix 8.0.0215 (c) 2008 Dowling Associates Licensed to ITS, SOUTH AFRICA
2019 Thursday PM + Development Traffic Volumes
Level Of Service Computation Report2000 HCM Unsignalized Method (Future Volume Alternative)
Index #2: Percy St & Highlands St
Average Delay (sec/veh): 3.6 Worst Case Level Of Service: A[8.7]
Approach: North Bound South Bound East Bound West Bound
Movement: L T R L T R L T R L T R
Control: Stop Sign Stop Sign Uncontrolled Uncontrolled
Lefts Include Include Include Include
Lanes: 0 0 1! 0 0 0 0 0 0 0 0 0 0 1 0 0 1 0 0 0
Volume Module: >> Count Date: 3 Jan 2019 <<
Base Vol: 35 0 10 0 0 0 0 7 49 6 3 0
Growth Adj: 1.00 1.00 1.00 1.00 1.00 1.00 1.00 1.00 1.00 1.00 1.00 1.00
Initial Base: 29 0 9 0 0 0 0 7 25 1 3 0
Added Vol: 6 0 1 0 0 0 0 0 24 5 0 0
PasserByVol: 0 0 0 0 0 0 0 0 0 0 0 0
Initial Fut: 35 0 10 0 0 0 0 7 49 6 3 0
User Adj: 1.00 1.00 1.00 1.00 1.00 1.00 1.00 1.00 1.00 1.00 1.00 1.00
PHF Adj: 0.93 0.93 0.93 0.93 0.93 0.93 0.93 0.93 0.93 0.93 0.93 0.93
PHF Volume: 38 0 11 0 0 0 0 8 53 6 3 0
Reduct Vol: 0 0 0 0 0 0 0 0 0 0 0 0
Final Vol.: 38 0 11 0 0 0 0 8 53 6 3 0
Critical Gap Module:
Critical Gp: 6.2 6.5 6.4 **** **** **** **** **** 4.1 **** **** ****
FollowUpTim: 3.3 4.0 3.5 **** **** **** **** **** 2.2 **** **** ****
Capacity Module:
Cnflict Vol: 6 119 119 **** **** **** **** **** 10 **** **** ****
Potent Cap.: 1082 775 881 **** **** **** **** **** 1623 **** **** ****
Move Cap.: 1082 749 859 **** **** **** **** **** 1623 **** **** ****
Volume/Cap: 0.03 0.00 0.01 **** **** **** **** **** 0.03 **** **** ****
Level Of Service Module:
2Way95thQ: **** **** **** **** **** **** **** **** 0.1 **** **** ****
Control Del: **** **** **** **** **** **** **** **** 7.3 **** **** ****
LOS by Move: * * * * * * * * A * * *
Movement: LT LTR RT LT LTR RT LT LTR RT LT LTR RT
Shared Cap.: **** 1023 **** **** **** **** **** **** 8 **** **** ****
SharedQueue: **** 0.1 **** **** **** **** **** **** 0.1 **** **** ****
Shrd ConDel: **** 8.7 **** **** **** **** **** **** 7.3 **** **** ****
Shared LOS: * A * * * * * * A * * *
ApproachDel: 8.7 **** **** ****
ApproachLOS: A * * *
Note: Queue reported is the number of cars per lane.

Fri Feb 22 12:31:49 2019 Page 7
2019 Thursday PM + DevelopmentTraffic Volumes
Traffix 8.0.0215 (c) 2008 Dowling Associates Licensed to ITS, SOUTH AFRICA
2019 Thursday PM + Development Traffic Volumes
Level Of Service Computation Report2000 HCM Unsignalized Method (Future Volume Alternative)
Index #3: Harley St & Cavendish Rd
Average Delay (sec/veh): 3.0 Worst Case Level Of Service: C[16.5]
Approach: North Bound South Bound East Bound West Bound
Movement: L T R L T R L T R L T R
Control: Stop Sign Stop Sign Uncontrolled Uncontrolled
Lefts Include Include Include Include
Lanes: 0 0 0 0 0 0 0 1! 0 0 0 1 0 0 0 0 0 0 1 0
Volume Module: >> Count Date: 3 Jan 2019 <<
Base Vol: 0 0 0 6 0 133 94 282 0 0 235 7
Growth Adj: 1.00 1.00 1.00 1.00 1.00 1.00 1.00 1.00 1.00 1.00 1.00 1.00
Initial Base: 0 0 0 6 0 128 93 282 0 0 232 7
Added Vol: 0 0 0 0 0 5 1 0 0 0 3 0
PasserByVol: 0 0 0 0 0 0 0 0 0 0 0 0
Initial Fut: 0 0 0 6 0 133 94 282 0 0 235 7
User Adj: 1.00 1.00 1.00 1.00 1.00 1.00 1.00 1.00 1.00 1.00 1.00 1.00
PHF Adj: 0.93 0.93 0.93 0.93 0.93 0.93 0.93 0.93 0.93 0.93 0.93 0.93
PHF Volume: 0 0 0 6 0 142 101 302 0 0 252 7
Reduct Vol: 0 0 0 0 0 0 0 0 0 0 0 0
Final Vol.: 0 0 0 6 0 142 101 302 0 0 252 7
Critical Gap Module:
Critical Gp: **** **** **** 6.2 6.5 6.4 **** **** **** **** **** 4.1
FollowUpTim: **** **** **** 3.3 4.0 3.5 **** **** **** **** **** 2.2
Capacity Module:
Cnflict Vol: **** **** **** 352 619 619 **** **** **** **** **** 403
Potent Cap.: **** **** **** 696 407 456 **** **** **** **** **** 1167
Move Cap.: **** **** **** 696 405 453 **** **** **** **** **** 1167
Volume/Cap: **** **** **** 0.01 0.00 0.31 **** **** **** **** **** 0.01
Level Of Service Module:
2Way95thQ: **** **** **** **** **** **** **** **** **** **** **** 0.0
Control Del: **** **** **** **** **** **** **** **** **** **** **** 8.1
LOS by Move: * * * * * * * * * * * A
Movement: LT LTR RT LT LTR RT LT LTR RT LT LTR RT
Shared Cap.: **** **** **** **** 460 **** **** **** **** **** **** 1
SharedQueue: **** **** **** **** 1.4 **** **** **** **** **** **** 0.0
Shrd ConDel: **** **** **** **** 16.5 **** **** **** **** **** **** 8.1
Shared LOS: * * * * C * * * * * * A
ApproachDel: **** 16.5 **** ****
ApproachLOS: * C * *
Note: Queue reported is the number of cars per lane.

Fri Feb 22 12:31:49 2019 Page 11
2019 Thursday PM + DevelopmentTraffic Volumes
Traffix 8.0.0215 (c) 2008 Dowling Associates Licensed to ITS, SOUTH AFRICA
2019 Thursday PM + Development Traffic Volumes
Level Of Service Computation Report2000 HCM Unsignalized Method (Future Volume Alternative)
Index #4: Bezuidenhout St & Durban Rd
Average Delay (sec/veh): 5.8 Worst Case Level Of Service: B[12.0]
Approach: North Bound South Bound East Bound West Bound
Movement: L T R L T R L T R L T R
Control: Stop Sign Stop Sign Uncontrolled Uncontrolled
Lefts Include Include Include Include
Lanes: 1 0 1 0 0 0 0 0 1 0 0 0 1! 0 0 0 0 0 0 0
Volume Module: >> Count Date: 3 Jan 2019 <<
Base Vol: 6 18 0 0 26 227 281 0 4 0 0 0
Growth Adj: 1.00 1.00 1.00 1.00 1.00 1.00 1.00 1.00 1.00 1.00 1.00 1.00
Initial Base: 6 17 0 0 21 224 281 0 4 0 0 0
Added Vol: 0 1 0 0 5 3 0 0 0 0 0 0
PasserByVol: 0 0 0 0 0 0 0 0 0 0 0 0
Initial Fut: 6 18 0 0 26 227 281 0 4 0 0 0
User Adj: 1.00 1.00 1.00 1.00 1.00 1.00 1.00 1.00 1.00 1.00 1.00 1.00
PHF Adj: 0.96 0.96 0.96 0.96 0.96 0.96 0.96 0.96 0.96 0.96 0.96 0.96
PHF Volume: 6 19 0 0 27 236 292 0 4 0 0 0
Reduct Vol: 0 0 0 0 0 0 0 0 0 0 0 0
Final Vol.: 6 19 0 0 27 236 292 0 4 0 0 0
Critical Gap Module:
Critical Gp: 6.2 6.5 **** **** 6.5 7.1 **** **** 4.1 **** **** ****
FollowUpTim: 3.3 4.0 **** **** 4.0 3.5 **** **** 2.2 **** **** ****
Capacity Module:
Cnflict Vol: 0 300 **** **** 154 164 **** **** 0 **** **** ****
Potent Cap.: 1091 616 **** **** 741 806 **** **** 1636 **** **** ****
Move Cap.: 1091 614 **** **** 739 781 **** **** 1636 **** **** ****
Volume/Cap: 0.01 0.03 **** **** 0.04 0.30 **** **** 0.00 **** **** ****
Level Of Service Module:
2Way95thQ: 0.0 0.1 **** **** **** **** **** **** 0.0 **** **** ****
Control Del: 8.3 11.0 **** **** **** **** **** **** 7.2 **** **** ****
LOS by Move: A B * * * * * * A * * *
Movement: LT LTR RT LT LTR RT LT LTR RT LT LTR RT
Shared Cap.: **** **** **** **** **** 776 **** **** **** **** **** ****
SharedQueue: **** **** **** **** **** 1.5 **** **** **** **** **** ****
Shrd ConDel: **** **** **** **** **** 12.0 **** **** **** **** **** ****
Shared LOS: * * * * * B * * * * * *
ApproachDel: 10.4 12.0 **** ****
ApproachLOS: B B * *
Note: Queue reported is the number of cars per lane.

Fri Feb 22 12:31:49 2019 Page 15
2019 Thursday PM + DevelopmentTraffic Volumes
Traffix 8.0.0215 (c) 2008 Dowling Associates Licensed to ITS, SOUTH AFRICA
2019 Thursday PM + Development Traffic Volumes
Level Of Service Computation Report2000 HCM Unsignalized Method (Future Volume Alternative)
Index #5: Grafton Rd & Hendon St
Average Delay (sec/veh): 1.5 Worst Case Level Of Service: D[27.0]
Approach: North Bound South Bound East Bound West Bound
Movement: L T R L T R L T R L T R
Control: Stop Sign Stop Sign Uncontrolled Uncontrolled
Lefts Include Include Include Include
Lanes: 0 0 1! 0 0 0 0 0 1 0 0 0 1! 0 0 0 0 1! 0 0
Volume Module: >> Count Date: 3 Jan 2019 <<
Base Vol: 48 8 2 0 10 34 63 453 83 5 522 5
Growth Adj: 1.00 1.00 1.00 1.00 1.00 1.00 1.00 1.00 1.00 1.00 1.00 1.00
Initial Base: 40 7 2 0 7 31 63 453 56 5 513 5
Added Vol: 8 1 0 0 3 3 0 0 27 0 9 0
PasserByVol: 0 0 0 0 0 0 0 0 0 0 0 0
Initial Fut: 48 8 2 0 10 34 63 453 83 5 522 5
User Adj: 1.00 1.00 1.00 1.00 1.00 1.00 1.00 1.00 1.00 1.00 1.00 1.00
PHF Adj: 0.92 0.92 0.92 0.92 0.92 0.92 0.92 0.92 0.92 0.92 0.92 0.92
PHF Volume: 52 9 2 0 11 37 68 491 90 5 566 5
Reduct Vol: 0 0 0 0 0 0 0 0 0 0 0 0
Final Vol.: 52 9 2 0 11 37 68 491 90 5 566 5
Critical Gap Module:
Critical Gp: 5.3 5.4 5.5 **** 5.4 5.5 **** **** 3.5 **** **** 3.5
FollowUpTim: 2.3 2.6 3.1 **** 2.6 3.1 **** **** 2.1 **** **** 2.1
Capacity Module:
Cnflict Vol: 439 1294 1291 **** 1258 1290 **** **** 572 **** **** 560
Potent Cap.: 826 268 268 **** 280 235 **** **** 1157 **** **** 1166
Move Cap.: 826 245 242 **** 256 200 **** **** 1157 **** **** 1166
Volume/Cap: 0.06 0.04 0.01 **** 0.04 0.18 **** **** 0.08 **** **** 0.00
Level Of Service Module:
2Way95thQ: **** **** **** **** **** **** **** **** 0.3 **** **** 0.0
Control Del: **** **** **** **** **** **** **** **** 8.4 **** **** 8.1
LOS by Move: * * * * * * * * A * * A
Movement: LT LTR RT LT LTR RT LT LTR RT LT LTR RT
Shared Cap.: **** 586 **** **** **** 211 **** **** **** **** **** ****
SharedQueue: **** 0.4 **** **** **** 0.8 **** **** **** **** **** ****
Shrd ConDel: **** 11.9 **** **** **** 27.0 **** **** **** **** **** ****
Shared LOS: * B * * * D * * * * * *
ApproachDel: 11.9 27.0 **** ****
ApproachLOS: B D * *
Note: Queue reported is the number of cars per lane.

Fri Feb 22 12:31:49 2019 Page 24
2019 Thursday PM + DevelopmentTraffic Volumes
Traffix 8.0.0215 (c) 2008 Dowling Associates Licensed to ITS, SOUTH AFRICA
2019 Thursday PM + Development Traffic Volumes
Level Of Service Computation Report2000 HCM Operations Method (Future Volume Alternative)
Index #6: Joe Slovo Dr & Hendon St
Cycle (sec): 110 Critical Vol./Cap.(X): 1.147
Loss Time (sec): 15 Average Delay (sec/veh): 63.1
Optimal Cycle: 180 Level Of Service: E
Approach: North Bound South Bound East Bound West Bound
Movement: L T R L T R L T R L T R
Control: Protected+Permitted Protected+Permitted Permitted Permitted
Lefts Include Include Include Ovl
Min. Green: 0 0 0 0 0 0 0 0 0 0 0 0
Y+R: 5.0 5.0 5.0 5.0 5.0 5.0 5.0 5.0 5.0 5.0 5.0 5.0
Lanes: 0 1 2 0 2 1 1 1 0 1 1 0 1 1 1 0 1 0 0 1
Volume Module: >> Count Date: 3 Jan 2019 <<
Base Vol: 285 1112 303 59 1937 92 158 242 257 380 247 15
Growth Adj: 1.00 1.00 1.00 1.00 1.00 1.00 1.00 1.00 1.00 1.00 1.00 1.00
Initial Base: 285 1112 295 45 1927 92 158 236 252 366 245 11
Added Vol: 0 0 8 14 10 0 0 6 5 14 2 4
PasserByVol: 0 0 0 0 0 0 0 0 0 0 0 0
Initial Fut: 285 1112 303 59 1937 92 158 242 257 380 247 15
User Adj: 1.00 1.00 1.00 1.00 1.00 1.00 1.00 1.00 1.00 1.00 1.00 1.00
PHF Adj: 0.99 0.99 0.99 0.99 0.99 0.99 0.99 0.99 0.99 0.99 0.99 0.99
PHF Volume: 287 1120 305 59 1951 93 159 244 259 383 249 15
Reduct Vol: 0 0 0 0 0 0 0 0 0 0 0 0
Reduced Vol: 287 1120 305 59 1951 93 159 244 259 383 249 15
PCE Adj: 1.00 1.00 1.00 1.00 1.00 1.00 1.00 1.00 1.00 1.00 1.00 1.00
MLF Adj: 1.00 1.00 1.00 1.00 1.00 1.00 1.00 1.00 1.00 1.00 1.00 1.00
Final Vol.: 287 1120 305 59 1951 93 159 244 259 383 249 15
Saturation Flow Module:
Sat/Lane: 1900 1900 1900 1900 1900 1900 1900 1900 1900 1900 1900 1900
Adjustment: 0.88 0.88 0.76 0.95 0.95 0.95 0.85 0.55 0.55 0.91 0.91 0.59
Lanes: 0.61 2.39 2.00 1.00 2.00 1.00 1.00 1.45 1.55 0.61 0.39 1.00
Final Sat.: 1025 4001 2883 1798 3596 1805 1615 1507 1601 1047 680 1125
Capacity Analysis Module:
Vol/Sat: 0.28 0.28 0.11 0.03 0.54 0.05 0.10 0.16 0.16 0.37 0.37 0.01
Crit Moves: **** **** ****
Green/Cycle: 0.46 0.46 0.55 0.47 0.47 0.59 0.31 0.31 0.31 0.40 0.31 0.31
Green/Cycle: 0.46 0.46 0.08 0.47 0.47 0.09 0.31 0.31 0.31 0.40 0.31 0.31
Volume/Cap: 0.60 0.60 0.27 0.07 1.16 0.35 0.31 0.51 0.51 0.92 1.16 0.04
Level Of Service Module:
Uniform Del: 21.9 21.9 12.5 16.2 29.3 12.6 28.7 30.8 30.8 31.5 37.7 26.2
IncremntDel: 0.5 0.5 0.1 0.0 80.2 0.8 0.4 0.5 0.5 17.8 92.2 0.0
InitQueuDel: 0.0 0.0 0.0 0.0 0.0 0.0 0.0 0.0 0.0 0.0 0.0 0.0
Delay Adj: 1.00 1.00 1.00 1.00 1.00 1.00 1.00 1.00 1.00 1.00 1.00 1.00
Delay/Veh: 22.4 22.4 12.6 16.2 109.5 13.4 29.0 31.3 31.3 49.3 129.9 26.3
User DelAdj: 1.00 1.00 1.00 1.00 1.00 1.00 1.00 1.00 1.00 1.00 1.00 1.00
AdjDel/Veh: 22.4 22.4 12.6 16.2 109.5 13.4 29.0 31.3 31.3 49.3 129.9 26.3
LOS by Move: C C B B F B C C C D F C
HCM2kAvgQ: 13.2 13.2 3.2 1.1 54.8 2.0 4.2 5.4 5.4 24.5 35.3 0.4
Note: Queue reported is the number of cars per lane.

Fri Feb 22 12:31:49 2019 Page 33
2019 Thursday PM + DevelopmentTraffic Volumes
Traffix 8.0.0215 (c) 2008 Dowling Associates Licensed to ITS, SOUTH AFRICA
2019 Thursday PM + Development Traffic Volumes
Level Of Service Computation Report2000 HCM Unsignalized Method (Future Volume Alternative)
Index #7: Fortesque Rd & Hendon St
Average Delay (sec/veh): 2.9 Worst Case Level Of Service: C[23.7]
Approach: North Bound South Bound East Bound West Bound
Movement: L T R L T R L T R L T R
Control: Stop Sign Stop Sign Uncontrolled Uncontrolled
Lefts Include Include Include Include
Lanes: 0 0 0 0 0 0 0 1! 0 0 0 1 0 0 0 0 0 0 1 0
Volume Module: >> Count Date: 3 Jan 2019 <<
Base Vol: 0 0 0 6 0 114 44 392 0 0 422 4
Growth Adj: 1.00 1.00 1.00 1.00 1.00 1.00 1.00 1.00 1.00 1.00 1.00 1.00
Initial Base: 0 0 0 3 0 111 44 392 0 0 416 3
Added Vol: 0 0 0 3 0 3 0 0 0 0 6 1
PasserByVol: 0 0 0 0 0 0 0 0 0 0 0 0
Initial Fut: 0 0 0 6 0 114 44 392 0 0 422 4
User Adj: 1.00 1.00 1.00 1.00 1.00 1.00 1.00 1.00 1.00 1.00 1.00 1.00
PHF Adj: 0.94 0.94 0.94 0.94 0.94 0.94 0.94 0.94 0.94 0.94 0.94 0.94
PHF Volume: 0 0 0 6 0 121 47 416 0 0 448 4
Reduct Vol: 0 0 0 0 0 0 0 0 0 0 0 0
Final Vol.: 0 0 0 6 0 121 47 416 0 0 448 4
Critical Gap Module:
Critical Gp: **** **** **** 6.2 6.5 6.4 **** **** **** **** **** 4.1
FollowUpTim: **** **** **** 3.3 4.0 3.5 **** **** **** **** **** 2.2
Capacity Module:
Cnflict Vol: **** **** **** 343 840 840 **** **** **** **** **** 462
Potent Cap.: **** **** **** 646 278 310 **** **** **** **** **** 1109
Move Cap.: **** **** **** 646 277 309 **** **** **** **** **** 1109
Volume/Cap: **** **** **** 0.01 0.00 0.39 **** **** **** **** **** 0.00
Level Of Service Module:
2Way95thQ: **** **** **** **** **** **** **** **** **** **** **** 0.0
Control Del: **** **** **** **** **** **** **** **** **** **** **** 8.3
LOS by Move: * * * * * * * * * * * A
Movement: LT LTR RT LT LTR RT LT LTR RT LT LTR RT
Shared Cap.: **** **** **** **** 317 **** **** **** **** **** **** 1
SharedQueue: **** **** **** **** 1.9 **** **** **** **** **** **** 0.0
Shrd ConDel: **** **** **** **** 23.7 **** **** **** **** **** **** 8.3
Shared LOS: * * * * C * * * * * * A
ApproachDel: **** 23.7 **** ****
ApproachLOS: * C * *
Note: Queue reported is the number of cars per lane.

Fri Feb 22 12:31:49 2019 Page 37
2019 Thursday PM + DevelopmentTraffic Volumes
Traffix 8.0.0215 (c) 2008 Dowling Associates Licensed to ITS, SOUTH AFRICA
2019 Thursday PM + Development Traffic Volumes
Level Of Service Computation Report2000 HCM Unsignalized Method (Future Volume Alternative)
Index #8: Hendon St & Percy St
Average Delay (sec/veh): 0.3 Worst Case Level Of Service: C[15.9]
Approach: North Bound South Bound East Bound West Bound
Movement: L T R L T R L T R L T R
Control: Stop Sign Stop Sign Uncontrolled Uncontrolled
Lefts Include Include Include Include
Lanes: 0 0 1! 0 0 0 0 0 0 0 0 0 0 1 0 0 1 0 0 0
Volume Module: >> Count Date: 3 Jan 2019 <<
Base Vol: 7 0 11 0 0 0 0 500 6 4 419 0
Growth Adj: 1.00 1.00 1.00 1.00 1.00 1.00 1.00 1.00 1.00 1.00 1.00 1.00
Initial Base: 6 0 10 0 0 0 0 500 3 1 413 0
Added Vol: 1 0 1 0 0 0 0 0 3 3 6 0
PasserByVol: 0 0 0 0 0 0 0 0 0 0 0 0
Initial Fut: 7 0 11 0 0 0 0 500 6 4 419 0
User Adj: 1.00 1.00 1.00 1.00 1.00 1.00 1.00 1.00 1.00 1.00 1.00 1.00
PHF Adj: 0.94 0.94 0.94 0.94 0.94 0.94 0.94 0.94 0.94 0.94 0.94 0.94
PHF Volume: 7 0 12 0 0 0 0 530 6 4 444 0
Reduct Vol: 0 0 0 0 0 0 0 0 0 0 0 0
Final Vol.: 7 0 12 0 0 0 0 530 6 4 444 0
Critical Gap Module:
Critical Gp: 6.2 6.5 6.4 **** **** **** **** **** 4.1 **** **** ****
FollowUpTim: 3.3 4.0 3.5 **** **** **** **** **** 2.2 **** **** ****
Capacity Module:
Cnflict Vol: 446 990 990 **** **** **** **** **** 449 **** **** ****
Potent Cap.: 616 249 276 **** **** **** **** **** 1122 **** **** ****
Move Cap.: 616 247 275 **** **** **** **** **** 1122 **** **** ****
Volume/Cap: 0.01 0.00 0.04 **** **** **** **** **** 0.01 **** **** ****
Level Of Service Module:
2Way95thQ: **** **** **** **** **** **** **** **** 0.0 **** **** ****
Control Del: **** **** **** **** **** **** **** **** 8.2 **** **** ****
LOS by Move: * * * * * * * * A * * *
Movement: LT LTR RT LT LTR RT LT LTR RT LT LTR RT
Shared Cap.: **** 350 **** **** **** **** **** **** 1 **** **** ****
SharedQueue: **** 0.2 **** **** **** **** **** **** 0.0 **** **** ****
Shrd ConDel: **** 15.9 **** **** **** **** **** **** 8.2 **** **** ****
Shared LOS: * C * * * * * * A * * *
ApproachDel: 15.9 **** **** ****
ApproachLOS: C * * *
Note: Queue reported is the number of cars per lane.

Fri Feb 22 12:31:49 2019 Page 40
2019 Thursday PM + DevelopmentTraffic Volumes
Traffix 8.0.0215 (c) 2008 Dowling Associates Licensed to ITS, SOUTH AFRICA
2019 Thursday PM + Development Traffic Volumes
Level Of Service Computation Report2000 HCM Unsignalized Method (Future Volume Alternative)
Index #9: Bezuidenhout St & Paddock St
Average Delay (sec/veh): 0.1 Worst Case Level Of Service: B[10.6]
Approach: North Bound South Bound East Bound West Bound
Movement: L T R L T R L T R L T R
Control: Uncontrolled Uncontrolled Stop Sign Stop Sign
Lefts Include Include Include Include
Lanes: 0 0 0 1 0 0 1 0 0 0 0 0 0 0 0 0 0 1! 0 0
Volume Module: >> Count Date: 3 Jan 2019 <<
Base Vol: 0 299 1 1 252 0 0 0 0 2 0 1
Growth Adj: 1.00 1.00 1.00 1.00 1.00 1.00 1.00 1.00 1.00 1.00 1.00 1.00
Initial Base: 0 298 1 1 245 0 0 0 0 1 0 1
Added Vol: 0 1 0 0 7 0 0 0 0 1 0 0
PasserByVol: 0 0 0 0 0 0 0 0 0 0 0 0
Initial Fut: 0 299 1 1 252 0 0 0 0 2 0 1
User Adj: 1.00 1.00 1.00 1.00 1.00 1.00 1.00 1.00 1.00 1.00 1.00 1.00
PHF Adj: 0.96 0.96 0.96 0.96 0.96 0.96 0.96 0.96 0.96 0.96 0.96 0.96
PHF Volume: 0 311 1 1 262 0 0 0 0 2 0 1
Reduct Vol: 0 0 0 0 0 0 0 0 0 0 0 0
Final Vol.: 0 311 1 1 262 0 0 0 0 2 0 1
Critical Gap Module:
Critical Gp: **** **** 4.1 **** **** **** **** **** **** 6.2 6.5 6.4
FollowUpTim: **** **** 2.2 **** **** **** **** **** **** 3.3 4.0 3.5
Capacity Module:
Cnflict Vol: **** **** 263 **** **** **** **** **** **** 262 575 575
Potent Cap.: **** **** 1313 **** **** **** **** **** **** 781 431 483
Move Cap.: **** **** 1313 **** **** **** **** **** **** 781 431 483
Volume/Cap: **** **** 0.00 **** **** **** **** **** **** 0.00 0.00 0.00
Level Of Service Module:
2Way95thQ: **** **** 0.0 **** **** **** **** **** **** **** **** ****
Control Del: **** **** 7.7 **** **** **** **** **** **** **** **** ****
LOS by Move: * * A * * * * * * * * *
Movement: LT LTR RT LT LTR RT LT LTR RT LT LTR RT
Shared Cap.: **** **** 1 **** **** **** **** **** **** **** 648 ****
SharedQueue: **** **** 0.0 **** **** **** **** **** **** **** 0.0 ****
Shrd ConDel: **** **** 7.7 **** **** **** **** **** **** **** 10.6 ****
Shared LOS: * * A * * * * * * * B *
ApproachDel: **** **** **** 10.6
ApproachLOS: * * * B
Note: Queue reported is the number of cars per lane.

Mon Feb 25 11:58:56 2019 Page 42
2019 Thursday PM + DevelopmentTraffic Volumes
Traffix 8.0.0215 (c) 2008 Dowling Associates Licensed to ITS, SOUTH AFRICA
2019 Thursday PM + Development Traffic Volumes
Level Of Service Computation Report2000 HCM Unsignalized Method (Future Volume Alternative)
Index #11: Highlands St & Back-of-House Access
Average Delay (sec/veh): 5.3 Worst Case Level Of Service: A[9.6]
Approach: North Bound South Bound East Bound West Bound
Movement: L T R L T R L T R L T R
Control: Stop Sign Stop Sign Uncontrolled Uncontrolled
Lefts Include Include Include Include
Lanes: 0 0 0 1 0 0 0 1! 0 0 1 0 0 0 0 0 0 1! 0 0
Volume Module: >> Count Date: 3 Jan 2019 <<
Base Vol: 0 6 1 26 22 7 2 0 0 5 0 40
Growth Adj: 1.00 1.00 1.00 1.00 1.00 1.00 1.00 1.00 1.00 1.00 1.00 1.00
Initial Base: 0 0 0 26 0 0 0 0 0 0 0 40
Added Vol: 0 6 1 0 22 7 2 0 0 5 0 0
PasserByVol: 0 0 0 0 0 0 0 0 0 0 0 0
Initial Fut: 0 6 1 26 22 7 2 0 0 5 0 40
User Adj: 1.00 1.00 1.00 1.00 1.00 1.00 1.00 1.00 1.00 1.00 1.00 1.00
PHF Adj: 0.93 0.93 0.93 0.93 0.93 0.93 0.93 0.93 0.93 0.93 0.93 0.93
PHF Volume: 0 6 1 28 24 8 2 0 0 5 0 43
Reduct Vol: 0 0 0 0 0 0 0 0 0 0 0 0
Final Vol.: 0 6 1 28 24 8 2 0 0 5 0 43
Critical Gap Module:
Critical Gp: **** 6.5 7.1 6.2 6.5 7.1 **** **** **** **** **** 4.1
FollowUpTim: **** 4.0 3.5 3.3 4.0 3.5 **** **** **** **** **** 2.2
Capacity Module:
Cnflict Vol: **** 91 100 0 91 92 **** **** **** **** **** 2
Potent Cap.: **** 803 886 1091 803 897 **** **** **** **** **** 1633
Move Cap.: **** 782 826 1091 781 873 **** **** **** **** **** 1633
Volume/Cap: **** 0.01 0.00 0.03 0.03 0.01 **** **** **** **** **** 0.03
Level Of Service Module:
2Way95thQ: **** **** **** **** **** **** **** **** **** **** **** 0.1
Control Del: **** **** **** **** **** **** **** **** **** **** **** 7.3
LOS by Move: * * * * * * * * * * * A
Movement: LT LTR RT LT LTR RT LT LTR RT LT LTR RT
Shared Cap.: **** **** 788 **** 916 **** **** **** **** **** **** ****
SharedQueue: **** **** 0.0 **** 0.2 **** **** **** **** **** **** ****
Shrd ConDel: **** **** 9.6 **** 9.2 **** **** **** **** **** **** ****
Shared LOS: * * A * A * * * * * * *
ApproachDel: 9.6 9.2 **** ****
ApproachLOS: A A * *
Note: Queue reported is the number of cars per lane.

Fri Feb 22 12:31:49 2019 Page 45
2019 Thursday PM + DevelopmentTraffic Volumes
Traffix 8.0.0215 (c) 2008 Dowling Associates Licensed to ITS, SOUTH AFRICA
2019 Thursday PM + Development Traffic Volumes
Level Of Service Computation Report2000 HCM Unsignalized Method (Future Volume Alternative)
Index #12: Charlton Access Rd & South Ln
Average Delay (sec/veh): 1.5 Worst Case Level Of Service: A[8.5]
Approach: North Bound South Bound East Bound West Bound
Movement: L T R L T R L T R L T R
Control: Uncontrolled Uncontrolled Stop Sign Stop Sign
Lefts Include Include Include Include
Lanes: 0 0 0 0 0 0 1 0 0 0 0 0 0 0 0 1 0 0 0 0
Volume Module: >> Count Date: 3 Jan 2019 <<
Base Vol: 0 0 0 37 20 0 0 0 0 12 0 0
Growth Adj: 1.00 1.00 1.00 1.00 1.00 1.00 1.00 1.00 1.00 1.00 1.00 1.00
Initial Base: 0 0 0 10 20 0 0 0 0 5 0 0
Added Vol: 0 0 0 27 0 0 0 0 0 7 0 0
PasserByVol: 0 0 0 0 0 0 0 0 0 0 0 0
Initial Fut: 0 0 0 37 20 0 0 0 0 12 0 0
User Adj: 1.00 1.00 1.00 1.00 1.00 1.00 1.00 1.00 1.00 1.00 1.00 1.00
PHF Adj: 0.89 0.89 0.89 0.89 0.89 0.89 0.89 0.89 0.89 0.89 0.89 0.89
PHF Volume: 0 0 0 42 23 0 0 0 0 14 0 0
Reduct Vol: 0 0 0 0 0 0 0 0 0 0 0 0
Final Vol.: 0 0 0 42 23 0 0 0 0 14 0 0
Critical Gap Module:
Critical Gp: **** **** **** **** **** **** **** **** **** 6.2 **** ****
FollowUpTim: **** **** **** **** **** **** **** **** **** 3.3 **** ****
Capacity Module:
Cnflict Vol: **** **** **** **** **** **** **** **** **** 43 **** ****
Potent Cap.: **** **** **** **** **** **** **** **** **** 1033 **** ****
Move Cap.: **** **** **** **** **** **** **** **** **** 1033 **** ****
Volume/Cap: **** **** **** **** **** **** **** **** **** 0.01 **** ****
Level Of Service Module:
2Way95thQ: **** **** **** **** **** **** **** **** **** 0.0 **** ****
Control Del: **** **** **** **** **** **** **** **** **** 8.5 **** ****
LOS by Move: * * * * * * * * * A * *
Movement: LT LTR RT LT LTR RT LT LTR RT LT LTR RT
Shared Cap.: **** **** **** **** **** **** **** **** **** **** **** ****
SharedQueue: **** **** **** **** **** **** **** **** **** **** **** ****
Shrd ConDel: **** **** **** **** **** **** **** **** **** **** **** ****
Shared LOS: * * * * * * * * * * * *
ApproachDel: **** **** **** 8.5
ApproachLOS: * * * A
Note: Queue reported is the number of cars per lane.

Fri Feb 22 12:31:49 2019 Page 47
2019 Thursday PM + DevelopmentTraffic Volumes
Traffix 8.0.0215 (c) 2008 Dowling Associates Licensed to ITS, SOUTH AFRICA
2019 Thursday PM + Development Traffic Volumes
Level Of Service Computation Report2000 HCM Unsignalized Method (Future Volume Alternative)
Index #14:
Average Delay (sec/veh): 0.4 Worst Case Level Of Service: A[8.3]
Approach: North Bound South Bound East Bound West Bound
Movement: L T R L T R L T R L T R
Control: Stop Sign Stop Sign Uncontrolled Uncontrolled
Lefts Include Include Include Include
Lanes: 1 0 0 0 0 0 0 0 0 0 0 0 0 1 0 0 0 1 0 0
Volume Module:
Base Vol: 2 0 0 0 0 0 0 24 7 0 6 0
Growth Adj: 1.00 1.00 1.00 1.00 1.00 1.00 1.00 1.00 1.00 1.00 1.00 1.00
Initial Base: 0 0 0 0 0 0 0 0 0 0 0 0
Added Vol: 2 0 0 0 0 0 0 24 7 0 6 0
PasserByVol: 0 0 0 0 0 0 0 0 0 0 0 0
Initial Fut: 2 0 0 0 0 0 0 24 7 0 6 0
User Adj: 1.00 1.00 1.00 1.00 1.00 1.00 1.00 1.00 1.00 1.00 1.00 1.00
PHF Adj: 1.00 1.00 1.00 1.00 1.00 1.00 1.00 1.00 1.00 1.00 1.00 1.00
PHF Volume: 2 0 0 0 0 0 0 24 7 0 6 0
Reduct Vol: 0 0 0 0 0 0 0 0 0 0 0 0
Final Vol.: 2 0 0 0 0 0 0 24 7 0 6 0
Critical Gap Module:
Critical Gp: 6.2 **** **** **** **** **** **** **** 4.1 **** **** ****
FollowUpTim: 3.3 **** **** **** **** **** **** **** 2.2 **** **** ****
Capacity Module:
Cnflict Vol: 6 **** **** **** **** **** **** **** 6 **** **** ****
Potent Cap.: 1083 **** **** **** **** **** **** **** 1628 **** **** ****
Move Cap.: 1083 **** **** **** **** **** **** **** 1628 **** **** ****
Volume/Cap: 0.00 **** **** **** **** **** **** **** 0.00 **** **** ****
Level Of Service Module:
2Way95thQ: 0.0 **** **** **** **** **** **** **** 0.0 **** **** ****
Control Del: 8.3 **** **** **** **** **** **** **** 7.2 **** **** ****
LOS by Move: A * * * * * * * A * * *
Movement: LT LTR RT LT LTR RT LT LTR RT LT LTR RT
Shared Cap.: **** **** **** **** **** **** **** **** 1 **** **** ****
SharedQueue: **** **** **** **** **** **** **** **** 0.0 **** **** ****
Shrd ConDel: **** **** **** **** **** **** **** **** 7.2 **** **** ****
Shared LOS: * * * * * * * * A * * *
ApproachDel: 8.3 **** **** ****
ApproachLOS: A * * *
Note: Queue reported is the number of cars per lane.

TRAFFIC IMPACT STUDY YEOVILLE RCG CHURCH
2019 Sunday PM Existing + Development Traffic Volumes

Fri Feb 22 12:32:26 2019 Page 2
2019 Sunday + DevelopmentTraffic Volumes
Traffix 8.0.0215 (c) 2008 Dowling Associates Licensed to ITS, SOUTH AFRICA
2019 Sunday + Development Traffic Volumes
Level Of Service Computation Report2000 HCM Unsignalized Method (Future Volume Alternative)
Index #1: Grafton St & Percy St
Average Delay (sec/veh): 9.1 Worst Case Level Of Service: B[11.5]
Approach: North Bound South Bound East Bound West Bound
Movement: L T R L T R L T R L T R
Control: Stop Sign Stop Sign Uncontrolled Uncontrolled
Lefts Include Include Include Include
Lanes: 0 0 0 0 0 0 0 1! 0 0 0 1 0 0 0 0 0 0 1 0
Volume Module: >> Count Date: 3 Feb 2019 <<
Base Vol: 0 0 0 459 0 12 26 15 0 0 8 74
Growth Adj: 1.00 1.00 1.00 1.00 1.00 1.00 1.00 1.00 1.00 1.00 1.00 1.00
Initial Base: 0 0 0 20 0 12 18 3 0 0 7 26
Added Vol: 0 0 0 439 0 0 8 12 0 0 1 48
PasserByVol: 0 0 0 0 0 0 0 0 0 0 0 0
Initial Fut: 0 0 0 459 0 12 26 15 0 0 8 74
User Adj: 1.00 1.00 1.00 1.00 1.00 1.00 1.00 1.00 1.00 1.00 1.00 1.00
PHF Adj: 0.96 0.96 0.96 0.96 0.96 0.96 0.96 0.96 0.96 0.96 0.96 0.96
PHF Volume: 0 0 0 478 0 13 27 16 0 0 8 77
Reduct Vol: 0 0 0 0 0 0 0 0 0 0 0 0
Final Vol.: 0 0 0 478 0 13 27 16 0 0 8 77
Critical Gap Module:
Critical Gp: **** **** **** 6.2 6.5 6.4 **** **** **** **** **** 4.1
FollowUpTim: **** **** **** 3.3 4.0 3.5 **** **** **** **** **** 2.2
Capacity Module:
Cnflict Vol: **** **** **** 29 192 192 **** **** **** **** **** 43
Potent Cap.: **** **** **** 1051 707 802 **** **** **** **** **** 1579
Move Cap.: **** **** **** 1051 671 770 **** **** **** **** **** 1579
Volume/Cap: **** **** **** 0.46 0.00 0.02 **** **** **** **** **** 0.05
Level Of Service Module:
2Way95thQ: **** **** **** **** **** **** **** **** **** **** **** 0.2
Control Del: **** **** **** **** **** **** **** **** **** **** **** 7.4
LOS by Move: * * * * * * * * * * * A
Movement: LT LTR RT LT LTR RT LT LTR RT LT LTR RT
Shared Cap.: **** **** **** **** 1042 **** **** **** **** **** **** 10
SharedQueue: **** **** **** **** 2.6 **** **** **** **** **** **** 0.2
Shrd ConDel: **** **** **** **** 11.5 **** **** **** **** **** **** 7.4
Shared LOS: * * * * B * * * * * * A
ApproachDel: **** 11.5 **** ****
ApproachLOS: * B * *
Note: Queue reported is the number of cars per lane.

Fri Feb 22 12:32:26 2019 Page 4
2019 Sunday + DevelopmentTraffic Volumes
Traffix 8.0.0215 (c) 2008 Dowling Associates Licensed to ITS, SOUTH AFRICA
2019 Sunday + Development Traffic Volumes
Level Of Service Computation Report2000 HCM Unsignalized Method (Future Volume Alternative)
Index #2: Percy St & Highlands St
Average Delay (sec/veh): 1.9 Worst Case Level Of Service: B[12.5]
Approach: North Bound South Bound East Bound West Bound
Movement: L T R L T R L T R L T R
Control: Stop Sign Stop Sign Uncontrolled Uncontrolled
Lefts Include Include Include Include
Lanes: 0 0 1! 0 0 0 0 0 0 0 0 0 0 1 0 0 1 0 0 0
Volume Module: >> Count Date: 3 Jan 2019 <<
Base Vol: 60 0 22 0 0 0 0 6 366 84 9 0
Growth Adj: 1.00 1.00 1.00 1.00 1.00 1.00 1.00 1.00 1.00 1.00 1.00 1.00
Initial Base: 21 0 13 0 0 0 0 6 15 4 9 0
Added Vol: 39 0 9 0 0 0 0 0 351 80 0 0
PasserByVol: 0 0 0 0 0 0 0 0 0 0 0 0
Initial Fut: 60 0 22 0 0 0 0 6 366 84 9 0
User Adj: 1.00 1.00 1.00 1.00 1.00 1.00 1.00 1.00 1.00 1.00 1.00 1.00
PHF Adj: 0.95 0.95 0.95 0.95 0.95 0.95 0.95 0.95 0.95 0.95 0.95 0.95
PHF Volume: 63 0 23 0 0 0 0 6 386 89 9 0
Reduct Vol: 0 0 0 0 0 0 0 0 0 0 0 0
Final Vol.: 63 0 23 0 0 0 0 6 386 89 9 0
Critical Gap Module:
Critical Gp: 6.2 6.5 6.4 **** **** **** **** **** 4.1 **** **** ****
FollowUpTim: 3.3 4.0 3.5 **** **** **** **** **** 2.2 **** **** ****
Capacity Module:
Cnflict Vol: 54 832 832 **** **** **** **** **** 98 **** **** ****
Potent Cap.: 1019 307 342 **** **** **** **** **** 1508 **** **** ****
Move Cap.: 1019 207 256 **** **** **** **** **** 1508 **** **** ****
Volume/Cap: 0.06 0.00 0.09 **** **** **** **** **** 0.26 **** **** ****
Level Of Service Module:
2Way95thQ: **** **** **** **** **** **** **** **** 1.0 **** **** ****
Control Del: **** **** **** **** **** **** **** **** 8.2 **** **** ****
LOS by Move: * * * * * * * * A * * *
Movement: LT LTR RT LT LTR RT LT LTR RT LT LTR RT
Shared Cap.: **** 566 **** **** **** **** **** **** 60 **** **** ****
SharedQueue: **** 0.5 **** **** **** **** **** **** 1.0 **** **** ****
Shrd ConDel: **** 12.5 **** **** **** **** **** **** 8.2 **** **** ****
Shared LOS: * B * * * * * * A * * *
ApproachDel: 12.5 **** **** ****
ApproachLOS: B * * *
Note: Queue reported is the number of cars per lane.

Fri Feb 22 12:32:26 2019 Page 7
2019 Sunday + DevelopmentTraffic Volumes
Traffix 8.0.0215 (c) 2008 Dowling Associates Licensed to ITS, SOUTH AFRICA
2019 Sunday + Development Traffic Volumes
Level Of Service Computation Report2000 HCM Unsignalized Method (Future Volume Alternative)
Index #3: Harley St & Cavendish Rd
Average Delay (sec/veh): 4.0 Worst Case Level Of Service: B[14.8]
Approach: North Bound South Bound East Bound West Bound
Movement: L T R L T R L T R L T R
Control: Stop Sign Stop Sign Uncontrolled Uncontrolled
Lefts Include Include Include Include
Lanes: 0 0 0 0 0 0 0 1! 0 0 0 1 0 0 0 0 0 0 1 0
Volume Module: >> Count Date: 3 Feb 2019 <<
Base Vol: 0 0 0 8 0 175 74 218 0 0 192 6
Growth Adj: 1.00 1.00 1.00 1.00 1.00 1.00 1.00 1.00 1.00 1.00 1.00 1.00
Initial Base: 0 0 0 8 0 95 70 218 0 0 144 6
Added Vol: 0 0 0 0 0 80 4 0 0 0 48 0
PasserByVol: 0 0 0 0 0 0 0 0 0 0 0 0
Initial Fut: 0 0 0 8 0 175 74 218 0 0 192 6
User Adj: 1.00 1.00 1.00 1.00 1.00 1.00 1.00 1.00 1.00 1.00 1.00 1.00
PHF Adj: 0.97 0.97 0.97 0.97 0.97 0.97 0.97 0.97 0.97 0.97 0.97 0.97
PHF Volume: 0 0 0 8 0 181 77 226 0 0 199 6
Reduct Vol: 0 0 0 0 0 0 0 0 0 0 0 0
Final Vol.: 0 0 0 8 0 181 77 226 0 0 199 6
Critical Gap Module:
Critical Gp: **** **** **** 6.2 6.5 6.4 **** **** **** **** **** 4.1
FollowUpTim: **** **** **** 3.3 4.0 3.5 **** **** **** **** **** 2.2
Capacity Module:
Cnflict Vol: **** **** **** 264 475 475 **** **** **** **** **** 302
Potent Cap.: **** **** **** 779 491 552 **** **** **** **** **** 1270
Move Cap.: **** **** **** 779 489 550 **** **** **** **** **** 1270
Volume/Cap: **** **** **** 0.01 0.00 0.33 **** **** **** **** **** 0.00
Level Of Service Module:
2Way95thQ: **** **** **** **** **** **** **** **** **** **** **** 0.0
Control Del: **** **** **** **** **** **** **** **** **** **** **** 7.8
LOS by Move: * * * * * * * * * * * A
Movement: LT LTR RT LT LTR RT LT LTR RT LT LTR RT
Shared Cap.: **** **** **** **** 557 **** **** **** **** **** **** 1
SharedQueue: **** **** **** **** 1.5 **** **** **** **** **** **** 0.0
Shrd ConDel: **** **** **** **** 14.8 **** **** **** **** **** **** 7.8
Shared LOS: * * * * B * * * * * * A
ApproachDel: **** 14.8 **** ****
ApproachLOS: * B * *
Note: Queue reported is the number of cars per lane.

Fri Feb 22 12:32:26 2019 Page 11
2019 Sunday + DevelopmentTraffic Volumes
Traffix 8.0.0215 (c) 2008 Dowling Associates Licensed to ITS, SOUTH AFRICA
2019 Sunday + Development Traffic Volumes
Level Of Service Computation Report2000 HCM Unsignalized Method (Future Volume Alternative)
Index #4: Bezuidenhout St & Durban Rd
Average Delay (sec/veh): 7.3 Worst Case Level Of Service: B[12.3]
Approach: North Bound South Bound East Bound West Bound
Movement: L T R L T R L T R L T R
Control: Stop Sign Stop Sign Uncontrolled Uncontrolled
Lefts Include Include Include Include
Lanes: 1 0 1 0 0 0 0 0 1 0 0 0 1! 0 0 0 0 0 0 0
Volume Module: >> Count Date: 3 Feb 2019 <<
Base Vol: 9 17 0 0 99 201 213 0 7 0 0 0
Growth Adj: 1.00 1.00 1.00 1.00 1.00 1.00 1.00 1.00 1.00 1.00 1.00 1.00
Initial Base: 9 10 0 0 31 153 213 0 7 0 0 0
Added Vol: 0 7 0 0 68 48 0 0 0 0 0 0
PasserByVol: 0 0 0 0 0 0 0 0 0 0 0 0
Initial Fut: 9 17 0 0 99 201 213 0 7 0 0 0
User Adj: 1.00 1.00 1.00 1.00 1.00 1.00 1.00 1.00 1.00 1.00 1.00 1.00
PHF Adj: 0.97 0.97 0.97 0.97 0.97 0.97 0.97 0.97 0.97 0.97 0.97 0.97
PHF Volume: 9 18 0 0 103 208 221 0 7 0 0 0
Reduct Vol: 0 0 0 0 0 0 0 0 0 0 0 0
Final Vol.: 9 18 0 0 103 208 221 0 7 0 0 0
Critical Gap Module:
Critical Gp: 6.2 6.5 **** **** 6.5 7.1 **** **** 4.1 **** **** ****
FollowUpTim: 3.3 4.0 **** **** 4.0 3.5 **** **** 2.2 **** **** ****
Capacity Module:
Cnflict Vol: 0 235 **** **** 125 134 **** **** 0 **** **** ****
Potent Cap.: 1091 669 **** **** 769 843 **** **** 1636 **** **** ****
Move Cap.: 1091 666 **** **** 766 816 **** **** 1636 **** **** ****
Volume/Cap: 0.01 0.03 **** **** 0.13 0.26 **** **** 0.00 **** **** ****
Level Of Service Module:
2Way95thQ: 0.0 0.1 **** **** **** **** **** **** 0.0 **** **** ****
Control Del: 8.3 10.6 **** **** **** **** **** **** 7.2 **** **** ****
LOS by Move: A B * * * * * * A * * *
Movement: LT LTR RT LT LTR RT LT LTR RT LT LTR RT
Shared Cap.: **** **** **** **** **** 799 **** **** **** **** **** ****
SharedQueue: **** **** **** **** **** 1.9 **** **** **** **** **** ****
Shrd ConDel: **** **** **** **** **** 12.3 **** **** **** **** **** ****
Shared LOS: * * * * * B * * * * * *
ApproachDel: 9.8 12.3 **** ****
ApproachLOS: A B * *
Note: Queue reported is the number of cars per lane.

Fri Feb 22 12:32:26 2019 Page 15
2019 Sunday + DevelopmentTraffic Volumes
Traffix 8.0.0215 (c) 2008 Dowling Associates Licensed to ITS, SOUTH AFRICA
2019 Sunday + Development Traffic Volumes
Level Of Service Computation Report2000 HCM Unsignalized Method (Future Volume Alternative)
Index #5: Grafton Rd & Hendon St
Average Delay (sec/veh): 25.8 Worst Case Level Of Service: F[302.6]
Approach: North Bound South Bound East Bound West Bound
Movement: L T R L T R L T R L T R
Control: Stop Sign Stop Sign Uncontrolled Uncontrolled
Lefts Include Include Include Include
Lanes: 0 0 1! 0 0 0 0 1! 0 0 0 0 1! 0 0 0 0 1! 0 0
Volume Module: >> Count Date: 3 Feb 2019 <<
Base Vol: 84 10 1 3 48 68 57 307 431 2 438 2
Growth Adj: 1.00 1.00 1.00 1.00 1.00 1.00 1.00 1.00 1.00 1.00 1.00 1.00
Initial Base: 32 6 1 3 8 28 57 307 32 2 311 2
Added Vol: 52 4 0 0 40 40 0 0 399 0 127 0
PasserByVol: 0 0 0 0 0 0 0 0 0 0 0 0
Initial Fut: 84 10 1 3 48 68 57 307 431 2 438 2
User Adj: 1.00 1.00 1.00 1.00 1.00 1.00 1.00 1.00 1.00 1.00 1.00 1.00
PHF Adj: 0.98 0.98 0.98 0.98 0.98 0.98 0.98 0.98 0.98 0.98 0.98 0.98
PHF Volume: 86 10 1 3 49 70 58 314 441 2 448 2
Reduct Vol: 0 0 0 0 0 0 0 0 0 0 0 0
Final Vol.: 86 10 1 3 49 70 58 314 441 2 448 2
Critical Gap Module:
Critical Gp: 5.3 5.4 5.5 5.3 5.4 5.5 **** **** 3.5 **** **** 3.5
FollowUpTim: 2.3 2.6 3.1 2.3 2.6 3.1 **** **** 2.1 **** **** 2.1
Capacity Module:
Cnflict Vol: 409 1716 1705 299 1686 1735 **** **** 450 **** **** 372
Potent Cap.: 938 177 164 1066 184 152 **** **** 1258 **** **** 1328
Move Cap.: 938 95 66 1066 98 81 **** **** 1258 **** **** 1328
Volume/Cap: 0.09 0.11 0.02 0.00 0.50 0.86 **** **** 0.35 **** **** 0.00
Level Of Service Module:
2Way95thQ: **** **** **** **** **** **** **** **** 1.6 **** **** 0.0
Control Del: **** **** **** **** **** **** **** **** 9.4 **** **** 7.7
LOS by Move: * * * * * * * * A * * A
Movement: LT LTR RT LT LTR RT LT LTR RT LT LTR RT
Shared Cap.: **** 452 **** **** 90 **** **** **** **** **** **** ****
SharedQueue: **** 0.8 **** **** 9.1 **** **** **** **** **** **** ****
Shrd ConDel: **** 15.1 **** **** 302.6 **** **** **** **** **** **** ****
Shared LOS: * C * * F * * * * * * *
ApproachDel: 15.1 302.6 **** ****
ApproachLOS: C F * *
Note: Queue reported is the number of cars per lane.

Fri Feb 22 12:32:26 2019 Page 24
2019 Sunday + DevelopmentTraffic Volumes
Traffix 8.0.0215 (c) 2008 Dowling Associates Licensed to ITS, SOUTH AFRICA
2019 Sunday + Development Traffic Volumes
Level Of Service Computation Report2000 HCM Operations Method (Future Volume Alternative)
Index #6: Joe Slovo Dr & Hendon St
Cycle (sec): 110 Critical Vol./Cap.(X): 0.930
Loss Time (sec): 15 Average Delay (sec/veh): 35.8
Optimal Cycle: 137 Level Of Service: D
Approach: North Bound South Bound East Bound West Bound
Movement: L T R L T R L T R L T R
Control: Protected+Permitted Protected+Permitted Permitted Permitted
Lefts Include Include Include Ovl
Min. Green: 0 0 0 0 0 0 0 0 0 0 0 0
Y+R: 5.0 5.0 5.0 5.0 5.0 5.0 5.0 5.0 5.0 5.0 5.0 5.0
Lanes: 0 1 2 0 2 1 1 1 0 1 1 0 1 1 1 0 1 0 0 1
Volume Module: >> Count Date: 3 Feb 2019 <<
Base Vol: 215 545 301 233 748 109 133 275 298 355 199 37
Growth Adj: 1.00 1.00 1.00 1.00 1.00 1.00 1.00 1.00 1.00 1.00 1.00 1.00
Initial Base: 215 545 191 34 605 109 133 185 218 168 189 15
Added Vol: 0 0 110 199 143 0 0 90 80 187 10 22
PasserByVol: 0 0 0 0 0 0 0 0 0 0 0 0
Initial Fut: 215 545 301 233 748 109 133 275 298 355 199 37
User Adj: 0.98 0.98 0.98 0.98 0.98 0.98 0.98 0.98 0.98 0.98 0.98 0.98
PHF Adj: 1.00 1.00 1.00 1.00 1.00 1.00 1.00 1.00 1.00 1.00 1.00 1.00
PHF Volume: 210 532 294 227 730 106 130 268 291 346 194 36
Reduct Vol: 0 0 0 0 0 0 0 0 0 0 0 0
Reduced Vol: 210 532 294 227 730 106 130 268 291 346 194 36
PCE Adj: 1.00 1.00 1.00 1.00 1.00 1.00 1.00 1.00 1.00 1.00 1.00 1.00
MLF Adj: 1.00 1.00 1.00 1.00 1.00 1.00 1.00 1.00 1.00 1.00 1.00 1.00
Final Vol.: 210 532 294 227 730 106 130 268 291 346 194 36
Saturation Flow Module:
Sat/Lane: 1900 1900 1900 1900 1900 1900 1900 1900 1900 1900 1900 1900
Adjustment: 0.87 0.87 0.84 0.92 0.92 0.95 0.85 0.20 0.20 0.90 0.90 0.59
Lanes: 0.85 2.15 2.00 1.00 2.00 1.00 1.00 1.44 1.56 0.64 0.36 1.00
Final Sat.: 1405 3562 3177 1741 3481 1805 1615 535 580 1100 617 1117
Capacity Analysis Module:
Vol/Sat: 0.15 0.15 0.09 0.13 0.21 0.06 0.08 0.50 0.50 0.31 0.31 0.03
Crit Moves: **** **** ****
Green/Cycle: 0.30 0.23 0.37 0.23 0.23 0.32 0.54 0.54 0.54 0.64 0.54 0.54
Green/Cycle: 0.30 0.23 0.10 0.23 0.23 0.09 0.54 0.54 0.54 0.64 0.54 0.54
Volume/Cap: 0.49 0.64 0.49 0.58 0.93 0.37 0.15 0.93 0.93 0.49 0.58 0.06
Level Of Service Module:
Uniform Del: 31.4 38.0 21.7 38.0 41.8 22.3 12.7 23.5 23.5 10.5 17.1 12.1
IncremntDel: 0.3 1.2 0.6 0.5 14.3 0.8 0.1 21.2 21.2 0.4 1.0 0.0
InitQueuDel: 0.0 0.0 0.0 0.0 0.0 0.0 0.0 0.0 0.0 0.0 0.0 0.0
Delay Adj: 1.00 1.00 1.00 1.00 1.00 1.00 1.00 1.00 1.00 1.00 1.00 1.00
Delay/Veh: 31.6 39.3 22.3 38.5 56.0 23.1 12.8 44.7 44.7 10.9 18.0 12.1
User DelAdj: 1.00 1.00 1.00 1.00 1.00 1.00 1.00 1.00 1.00 1.00 1.00 1.00
AdjDel/Veh: 31.6 39.3 22.3 38.5 56.0 23.1 12.8 44.7 44.7 10.9 18.0 12.1
LOS by Move: C D C D E C B D D B B B
HCM2kAvgQ: 7.7 9.1 4.8 7.8 16.9 3.1 2.2 9.7 9.7 9.7 12.5 0.6
Note: Queue reported is the number of cars per lane.

Fri Feb 22 12:32:26 2019 Page 33
2019 Sunday + DevelopmentTraffic Volumes
Traffix 8.0.0215 (c) 2008 Dowling Associates Licensed to ITS, SOUTH AFRICA
2019 Sunday + Development Traffic Volumes
Level Of Service Computation Report2000 HCM Unsignalized Method (Future Volume Alternative)
Index #7: Fortesque Rd & Hendon St
Average Delay (sec/veh): 2.7 Worst Case Level Of Service: C[15.2]
Approach: North Bound South Bound East Bound West Bound
Movement: L T R L T R L T R L T R
Control: Stop Sign Stop Sign Uncontrolled Uncontrolled
Lefts Include Include Include Include
Lanes: 0 0 0 0 0 0 0 1! 0 0 0 1 0 0 0 0 0 0 1 0
Volume Module: >> Count Date: 3 Feb 2020 <<
Base Vol: 0 0 0 40 0 100 58 246 0 0 348 8
Growth Adj: 1.00 1.00 1.00 1.00 1.00 1.00 1.00 1.00 1.00 1.00 1.00 1.00
Initial Base: 0 0 0 0 0 60 58 246 0 0 260 4
Added Vol: 0 0 0 40 0 40 0 0 0 0 88 4
PasserByVol: 0 0 0 0 0 0 0 0 0 0 0 0
Initial Fut: 0 0 0 40 0 100 58 246 0 0 348 8
User Adj: 1.00 1.00 1.00 1.00 1.00 1.00 1.00 1.00 1.00 1.00 1.00 1.00
PHF Adj: 0.98 0.98 0.98 0.98 0.98 0.98 0.98 0.98 0.98 0.98 0.98 0.98
PHF Volume: 0 0 0 41 0 102 59 250 0 0 354 8
Reduct Vol: 0 0 0 0 0 0 0 0 0 0 0 0
Final Vol.: 0 0 0 41 0 102 59 250 0 0 354 8
Critical Gap Module:
Critical Gp: **** **** **** 6.2 6.5 6.4 **** **** **** **** **** 4.1
FollowUpTim: **** **** **** 3.3 4.0 3.5 **** **** **** **** **** 2.2
Capacity Module:
Cnflict Vol: **** **** **** 280 650 650 **** **** **** **** **** 309
Potent Cap.: **** **** **** 764 391 437 **** **** **** **** **** 1263
Move Cap.: **** **** **** 764 388 435 **** **** **** **** **** 1263
Volume/Cap: **** **** **** 0.05 0.00 0.23 **** **** **** **** **** 0.01
Level Of Service Module:
2Way95thQ: **** **** **** **** **** **** **** **** **** **** **** 0.0
Control Del: **** **** **** **** **** **** **** **** **** **** **** 7.9
LOS by Move: * * * * * * * * * * * A
Movement: LT LTR RT LT LTR RT LT LTR RT LT LTR RT
Shared Cap.: **** **** **** **** 496 **** **** **** **** **** **** 1
SharedQueue: **** **** **** **** 1.2 **** **** **** **** **** **** 0.0
Shrd ConDel: **** **** **** **** 15.2 **** **** **** **** **** **** 7.9
Shared LOS: * * * * C * * * * * * A
ApproachDel: **** 15.2 **** ****
ApproachLOS: * C * *
Note: Queue reported is the number of cars per lane.

Fri Feb 22 12:32:26 2019 Page 37
2019 Sunday + DevelopmentTraffic Volumes
Traffix 8.0.0215 (c) 2008 Dowling Associates Licensed to ITS, SOUTH AFRICA
2019 Sunday + Development Traffic Volumes
Level Of Service Computation Report2000 HCM Unsignalized Method (Future Volume Alternative)
Index #8: Hendon St & Percy St
Average Delay (sec/veh): 0.5 Worst Case Level Of Service: B[12.9]
Approach: North Bound South Bound East Bound West Bound
Movement: L T R L T R L T R L T R
Control: Stop Sign Stop Sign Uncontrolled Uncontrolled
Lefts Include Include Include Include
Lanes: 0 0 1! 0 0 0 0 0 0 0 0 0 0 1 0 0 1 0 0 0
Volume Module: >> Count Date: 3 Feb 2019 <<
Base Vol: 11 0 14 0 0 0 0 242 44 42 345 0
Growth Adj: 1.00 1.00 1.00 1.00 1.00 1.00 1.00 1.00 1.00 1.00 1.00 1.00
Initial Base: 7 0 10 0 0 0 0 242 4 2 257 0
Added Vol: 4 0 4 0 0 0 0 0 40 40 88 0
PasserByVol: 0 0 0 0 0 0 0 0 0 0 0 0
Initial Fut: 11 0 14 0 0 0 0 242 44 42 345 0
User Adj: 1.00 1.00 1.00 1.00 1.00 1.00 1.00 1.00 1.00 1.00 1.00 1.00
PHF Adj: 0.98 0.98 0.98 0.98 0.98 0.98 0.98 0.98 0.98 0.98 0.98 0.98
PHF Volume: 11 0 14 0 0 0 0 246 45 43 351 0
Reduct Vol: 0 0 0 0 0 0 0 0 0 0 0 0
Final Vol.: 11 0 14 0 0 0 0 246 45 43 351 0
Critical Gap Module:
Critical Gp: 6.2 6.5 6.4 **** **** **** **** **** 4.1 **** **** ****
FollowUpTim: 3.3 4.0 3.5 **** **** **** **** **** 2.2 **** **** ****
Capacity Module:
Cnflict Vol: 372 708 708 **** **** **** **** **** 393 **** **** ****
Potent Cap.: 678 362 404 **** **** **** **** **** 1176 **** **** ****
Move Cap.: 678 348 392 **** **** **** **** **** 1176 **** **** ****
Volume/Cap: 0.02 0.00 0.04 **** **** **** **** **** 0.04 **** **** ****
Level Of Service Module:
2Way95thQ: **** **** **** **** **** **** **** **** 0.1 **** **** ****
Control Del: **** **** **** **** **** **** **** **** 8.2 **** **** ****
LOS by Move: * * * * * * * * A * * *
Movement: LT LTR RT LT LTR RT LT LTR RT LT LTR RT
Shared Cap.: **** 482 **** **** **** **** **** **** 1 **** **** ****
SharedQueue: **** 0.2 **** **** **** **** **** **** 0.1 **** **** ****
Shrd ConDel: **** 12.9 **** **** **** **** **** **** 8.2 **** **** ****
Shared LOS: * B * * * * * * A * * *
ApproachDel: 12.9 **** **** ****
ApproachLOS: B * * *
Note: Queue reported is the number of cars per lane.

Fri Feb 22 12:32:26 2019 Page 40
2019 Sunday + DevelopmentTraffic Volumes
Traffix 8.0.0215 (c) 2008 Dowling Associates Licensed to ITS, SOUTH AFRICA
2019 Sunday + Development Traffic Volumes
Level Of Service Computation Report2000 HCM Unsignalized Method (Future Volume Alternative)
Index #9: Bezuidenhout St & Paddock St
Average Delay (sec/veh): 0.3 Worst Case Level Of Service: A[9.9]
Approach: North Bound South Bound East Bound West Bound
Movement: L T R L T R L T R L T R
Control: Uncontrolled Uncontrolled Stop Sign Stop Sign
Lefts Include Include Include Include
Lanes: 0 0 0 1 0 0 1 0 0 0 0 0 0 0 0 1 0 0 0 0
Volume Module: >> Count Date: 3 Feb 2019 <<
Base Vol: 0 230 1 1 284 0 0 0 0 17 0 0
Growth Adj: 1.00 1.00 1.00 1.00 1.00 1.00 1.00 1.00 1.00 1.00 1.00 1.00
Initial Base: 0 223 0 1 184 0 0 0 0 1 0 0
Added Vol: 0 7 1 0 100 0 0 0 0 16 0 0
PasserByVol: 0 0 0 0 0 0 0 0 0 0 0 0
Initial Fut: 0 230 1 1 284 0 0 0 0 17 0 0
User Adj: 1.00 1.00 1.00 1.00 1.00 1.00 1.00 1.00 1.00 1.00 1.00 1.00
PHF Adj: 0.97 0.97 0.97 0.97 0.97 0.97 0.97 0.97 0.97 0.97 0.97 0.97
PHF Volume: 0 238 1 1 294 0 0 0 0 18 0 0
Reduct Vol: 0 0 0 0 0 0 0 0 0 0 0 0
Final Vol.: 0 238 1 1 294 0 0 0 0 18 0 0
Critical Gap Module:
Critical Gp: **** **** 4.1 **** **** **** **** **** **** 6.2 **** ****
FollowUpTim: **** **** 2.2 **** **** **** **** **** **** 3.3 **** ****
Capacity Module:
Cnflict Vol: **** **** 295 **** **** **** **** **** **** 295 **** ****
Potent Cap.: **** **** 1278 **** **** **** **** **** **** 749 **** ****
Move Cap.: **** **** 1278 **** **** **** **** **** **** 749 **** ****
Volume/Cap: **** **** 0.00 **** **** **** **** **** **** 0.02 **** ****
Level Of Service Module:
2Way95thQ: **** **** 0.0 **** **** **** **** **** **** 0.1 **** ****
Control Del: **** **** 7.8 **** **** **** **** **** **** 9.9 **** ****
LOS by Move: * * A * * * * * * A * *
Movement: LT LTR RT LT LTR RT LT LTR RT LT LTR RT
Shared Cap.: **** **** 1 **** **** **** **** **** **** **** **** ****
SharedQueue: **** **** 0.0 **** **** **** **** **** **** **** **** ****
Shrd ConDel: **** **** 7.8 **** **** **** **** **** **** **** **** ****
Shared LOS: * * A * * * * * * * * *
ApproachDel: **** **** **** 9.9
ApproachLOS: * * * A
Note: Queue reported is the number of cars per lane.

Mon Feb 25 11:59:33 2019 Page 42
2019 Sunday + DevelopmentTraffic Volumes
Traffix 8.0.0215 (c) 2008 Dowling Associates Licensed to ITS, SOUTH AFRICA
2019 Sunday + Development Traffic Volumes
Level Of Service Computation Report2000 HCM Unsignalized Method (Future Volume Alternative)
Index #11: Highlands St & Back-of-House Access
Average Delay (sec/veh): 13.6 Worst Case Level Of Service: C[17.3]
Approach: North Bound South Bound East Bound West Bound
Movement: L T R L T R L T R L T R
Control: Stop Sign Stop Sign Uncontrolled Uncontrolled
Lefts Include Include Include Include
Lanes: 0 0 0 1 0 0 0 1! 0 0 1 0 0 0 0 0 0 1! 0 0
Volume Module: >> Count Date: 3 Feb 2019 <<
Base Vol: 0 37 7 19 330 100 11 0 0 68 0 35
Growth Adj: 1.00 1.00 1.00 1.00 1.00 1.00 1.00 1.00 1.00 1.00 1.00 1.00
Initial Base: 0 0 0 19 0 0 0 0 0 0 0 35
Added Vol: 0 37 7 0 330 100 11 0 0 68 0 0
PasserByVol: 0 0 0 0 0 0 0 0 0 0 0 0
Initial Fut: 0 37 7 19 330 100 11 0 0 68 0 35
User Adj: 1.00 1.00 1.00 1.00 1.00 1.00 1.00 1.00 1.00 1.00 1.00 1.00
PHF Adj: 0.95 0.95 0.95 0.95 0.95 0.95 0.95 0.95 0.95 0.95 0.95 0.95
PHF Volume: 0 39 7 20 348 105 12 0 0 72 0 37
Reduct Vol: 0 0 0 0 0 0 0 0 0 0 0 0
Final Vol.: 0 39 7 20 348 105 12 0 0 72 0 37
Critical Gap Module:
Critical Gp: **** 6.5 7.1 6.2 6.5 7.1 **** **** **** **** **** 4.1
FollowUpTim: **** 4.0 3.5 3.3 4.0 3.5 **** **** **** **** **** 2.2
Capacity Module:
Cnflict Vol: **** 121 284 0 145 129 **** **** **** **** **** 12
Potent Cap.: **** 773 673 1091 750 848 **** **** **** **** **** 1621
Move Cap.: **** 755 407 1091 732 801 **** **** **** **** **** 1621
Volume/Cap: **** 0.05 0.02 0.02 0.48 0.13 **** **** **** **** **** 0.02
Level Of Service Module:
2Way95thQ: **** **** **** **** **** **** **** **** **** **** **** 0.1
Control Del: **** **** **** **** **** **** **** **** **** **** **** 7.3
LOS by Move: * * * * * * * * * * * A
Movement: LT LTR RT LT LTR RT LT LTR RT LT LTR RT
Shared Cap.: **** **** 665 **** 757 **** **** **** **** **** **** ****
SharedQueue: **** **** 0.2 **** 4.4 **** **** **** **** **** **** ****
Shrd ConDel: **** **** 10.8 **** 17.3 **** **** **** **** **** **** ****
Shared LOS: * * B * C * * * * * * *
ApproachDel: 10.8 17.3 **** ****
ApproachLOS: B C * *
Note: Queue reported is the number of cars per lane.

Fri Feb 22 12:32:26 2019 Page 45
2019 Sunday + DevelopmentTraffic Volumes
Traffix 8.0.0215 (c) 2008 Dowling Associates Licensed to ITS, SOUTH AFRICA
2019 Sunday + Development Traffic Volumes
Level Of Service Computation Report2000 HCM Unsignalized Method (Future Volume Alternative)
Index #12: Charlton Access Rd & South Ln
Average Delay (sec/veh): 1.0 Worst Case Level Of Service: A[9.6]
Approach: North Bound South Bound East Bound West Bound
Movement: L T R L T R L T R L T R
Control: Uncontrolled Uncontrolled Stop Sign Stop Sign
Lefts Include Include Include Include
Lanes: 0 0 0 0 0 0 1 0 0 0 0 0 0 0 0 1 0 0 0 0
Volume Module:
Base Vol: 0 0 0 403 10 0 0 0 0 46 0 0
Growth Adj: 1.00 1.00 1.00 1.00 1.00 1.00 1.00 1.00 1.00 1.00 1.00 1.00
Initial Base: 0 0 0 5 10 0 0 0 0 2 0 0
Added Vol: 0 0 0 398 0 0 0 0 0 44 0 0
PasserByVol: 0 0 0 0 0 0 0 0 0 0 0 0
Initial Fut: 0 0 0 403 10 0 0 0 0 46 0 0
User Adj: 1.00 1.00 1.00 1.00 1.00 1.00 1.00 1.00 1.00 1.00 1.00 1.00
PHF Adj: 1.00 1.00 1.00 1.00 1.00 1.00 1.00 1.00 1.00 1.00 1.00 1.00
PHF Volume: 0 0 0 403 10 0 0 0 0 46 0 0
Reduct Vol: 0 0 0 0 0 0 0 0 0 0 0 0
Final Vol.: 0 0 0 403 10 0 0 0 0 46 0 0
Critical Gap Module:
Critical Gp: **** **** **** **** **** **** **** **** **** 6.2 **** ****
FollowUpTim: **** **** **** **** **** **** **** **** **** 3.3 **** ****
Capacity Module:
Cnflict Vol: **** **** **** **** **** **** **** **** **** 212 **** ****
Potent Cap.: **** **** **** **** **** **** **** **** **** 834 **** ****
Move Cap.: **** **** **** **** **** **** **** **** **** 834 **** ****
Volume/Cap: **** **** **** **** **** **** **** **** **** 0.06 **** ****
Level Of Service Module:
2Way95thQ: **** **** **** **** **** **** **** **** **** 0.2 **** ****
Control Del: **** **** **** **** **** **** **** **** **** 9.6 **** ****
LOS by Move: * * * * * * * * * A * *
Movement: LT LTR RT LT LTR RT LT LTR RT LT LTR RT
Shared Cap.: **** **** **** **** **** **** **** **** **** **** **** ****
SharedQueue: **** **** **** **** **** **** **** **** **** **** **** ****
Shrd ConDel: **** **** **** **** **** **** **** **** **** **** **** ****
Shared LOS: * * * * * * * * * * * *
ApproachDel: **** **** **** 9.6
ApproachLOS: * * * A
Note: Queue reported is the number of cars per lane.

Fri Feb 22 12:32:26 2019 Page 48
2019 Sunday + DevelopmentTraffic Volumes
Traffix 8.0.0215 (c) 2008 Dowling Associates Licensed to ITS, SOUTH AFRICA
2019 Sunday + Development Traffic Volumes
Level Of Service Computation Report2000 HCM Unsignalized Method (Future Volume Alternative)
Index #14:
Average Delay (sec/veh): 0.2 Worst Case Level Of Service: A[8.7]
Approach: North Bound South Bound East Bound West Bound
Movement: L T R L T R L T R L T R
Control: Stop Sign Stop Sign Uncontrolled Uncontrolled
Lefts Include Include Include Include
Lanes: 1 0 0 0 0 0 0 0 0 0 0 0 0 1 0 0 0 1 0 0
Volume Module:
Base Vol: 11 0 0 0 0 0 0 374 100 0 72 0
Growth Adj: 1.00 1.00 1.00 1.00 1.00 1.00 1.00 1.00 1.00 1.00 1.00 1.00
Initial Base: 0 0 0 0 0 0 0 23 0 0 33 0
Added Vol: 11 0 0 0 0 0 0 351 100 0 39 0
PasserByVol: 0 0 0 0 0 0 0 0 0 0 0 0
Initial Fut: 11 0 0 0 0 0 0 374 100 0 72 0
User Adj: 1.00 1.00 1.00 1.00 1.00 1.00 1.00 1.00 1.00 1.00 1.00 1.00
PHF Adj: 1.00 1.00 1.00 1.00 1.00 1.00 1.00 1.00 1.00 1.00 1.00 1.00
PHF Volume: 11 0 0 0 0 0 0 374 100 0 72 0
Reduct Vol: 0 0 0 0 0 0 0 0 0 0 0 0
Final Vol.: 11 0 0 0 0 0 0 374 100 0 72 0
Critical Gap Module:
Critical Gp: 6.2 **** **** **** **** **** **** **** 4.1 **** **** ****
FollowUpTim: 3.3 **** **** **** **** **** **** **** 2.2 **** **** ****
Capacity Module:
Cnflict Vol: 72 **** **** **** **** **** **** **** 72 **** **** ****
Potent Cap.: 996 **** **** **** **** **** **** **** 1541 **** **** ****
Move Cap.: 996 **** **** **** **** **** **** **** 1541 **** **** ****
Volume/Cap: 0.01 **** **** **** **** **** **** **** 0.06 **** **** ****
Level Of Service Module:
2Way95thQ: 0.0 **** **** **** **** **** **** **** 0.2 **** **** ****
Control Del: 8.7 **** **** **** **** **** **** **** 7.5 **** **** ****
LOS by Move: A * * * * * * * A * * *
Movement: LT LTR RT LT LTR RT LT LTR RT LT LTR RT
Shared Cap.: **** **** **** **** **** **** **** **** 1 **** **** ****
SharedQueue: **** **** **** **** **** **** **** **** 0.2 **** **** ****
Shrd ConDel: **** **** **** **** **** **** **** **** 7.5 **** **** ****
Shared LOS: * * * * * * * * A * * *
ApproachDel: 8.7 **** **** ****
ApproachLOS: A * * *
Note: Queue reported is the number of cars per lane.

TRAFFIC IMPACT STUDY YEOVILLE RCG CHURCH
2024 Thursday PM Background Traffic Volumes

Fri Feb 22 12:35:54 2019 Page 1
2024 Thursday PM BackgroundTraffic Volumes
Traffix 8.0.0215 (c) 2008 Dowling Associates Licensed to ITS, SOUTH AFRICA
2024 Thursday PM Background Traffic Volumes
Level Of Service Computation Report2000 HCM Unsignalized Method (Base Volume Alternative)
Index #1: Grafton St & Percy St
Average Delay (sec/veh): 4.1 Worst Case Level Of Service: A[8.8]
Approach: North Bound South Bound East Bound West Bound
Movement: L T R L T R L T R L T R
Control: Stop Sign Stop Sign Uncontrolled Uncontrolled
Lefts Include Include Include Include
Lanes: 0 0 0 0 0 0 0 1! 0 0 0 1 0 0 0 0 0 0 1 0
Volume Module: >> Count Date: 31 Jan 2019 <<
Base Vol: 0 0 0 35 0 16 22 4 0 0 3 30
Growth Adj: 1.00 1.00 1.00 1.00 1.00 1.00 1.00 1.00 1.00 1.00 1.00 1.00
Initial Base: 0 0 0 35 0 16 22 4 0 0 3 30
User Adj: 1.00 1.00 1.00 1.00 1.00 1.00 1.00 1.00 1.00 1.00 1.00 1.00
PHF Adj: 0.89 0.89 0.89 0.89 0.89 0.89 0.89 0.89 0.89 0.89 0.89 0.89
PHF Volume: 0 0 0 39 0 18 25 5 0 0 3 34
Reduct Vol: 0 0 0 0 0 0 0 0 0 0 0 0
Final Vol.: 0 0 0 39 0 18 25 5 0 0 3 34
Critical Gap Module:
Critical Gp: **** **** **** 6.2 6.5 6.4 **** **** **** **** **** 4.1
FollowUpTim: **** **** **** 3.3 4.0 3.5 **** **** **** **** **** 2.2
Capacity Module:
Cnflict Vol: **** **** **** 17 88 88 **** **** **** **** **** 29
Potent Cap.: **** **** **** 1068 806 918 **** **** **** **** **** 1597
Move Cap.: **** **** **** 1068 789 903 **** **** **** **** **** 1597
Volume/Cap: **** **** **** 0.04 0.00 0.02 **** **** **** **** **** 0.02
Level Of Service Module:
2Way95thQ: **** **** **** **** **** **** **** **** **** **** **** 0.1
Control Del: **** **** **** **** **** **** **** **** **** **** **** 7.3
LOS by Move: * * * * * * * * * * * A
Movement: LT LTR RT LT LTR RT LT LTR RT LT LTR RT
Shared Cap.: **** **** **** **** 1010 **** **** **** **** **** **** 11
SharedQueue: **** **** **** **** 0.2 **** **** **** **** **** **** 0.1
Shrd ConDel: **** **** **** **** 8.8 **** **** **** **** **** **** 7.3
Shared LOS: * * * * A * * * * * * A
ApproachDel: **** 8.8 **** ****
ApproachLOS: * A * *
Note: Queue reported is the number of cars per lane.

Fri Feb 22 12:35:54 2019 Page 3
2024 Thursday PM BackgroundTraffic Volumes
Traffix 8.0.0215 (c) 2008 Dowling Associates Licensed to ITS, SOUTH AFRICA
2024 Thursday PM Background Traffic Volumes
Level Of Service Computation Report2000 HCM Unsignalized Method (Base Volume Alternative)
Index #2: Percy St & Highlands St
Average Delay (sec/veh): 4.4 Worst Case Level Of Service: A[8.6]
Approach: North Bound South Bound East Bound West Bound
Movement: L T R L T R L T R L T R
Control: Stop Sign Stop Sign Uncontrolled Uncontrolled
Lefts Include Include Include Include
Lanes: 0 0 1! 0 0 0 0 0 0 0 0 0 0 1 0 0 1 0 0 0
Volume Module: >> Count Date: 3 Jan 2019 <<
Base Vol: 29 0 9 0 0 0 0 7 25 1 3 0
Growth Adj: 1.00 1.00 1.00 1.00 1.00 1.00 1.00 1.00 1.00 1.00 1.00 1.00
Initial Base: 29 0 9 0 0 0 0 7 25 1 3 0
User Adj: 1.00 1.00 1.00 1.00 1.00 1.00 1.00 1.00 1.00 1.00 1.00 1.00
PHF Adj: 0.93 0.93 0.93 0.93 0.93 0.93 0.93 0.93 0.93 0.93 0.93 0.93
PHF Volume: 31 0 10 0 0 0 0 8 27 1 3 0
Reduct Vol: 0 0 0 0 0 0 0 0 0 0 0 0
Final Vol.: 31 0 10 0 0 0 0 8 27 1 3 0
Critical Gap Module:
Critical Gp: 6.2 6.5 6.4 **** **** **** **** **** 4.1 **** **** ****
FollowUpTim: 3.3 4.0 3.5 **** **** **** **** **** 2.2 **** **** ****
Capacity Module:
Cnflict Vol: 4 65 65 **** **** **** **** **** 4 **** **** ****
Potent Cap.: 1086 830 946 **** **** **** **** **** 1631 **** **** ****
Move Cap.: 1086 816 934 **** **** **** **** **** 1631 **** **** ****
Volume/Cap: 0.03 0.00 0.01 **** **** **** **** **** 0.02 **** **** ****
Level Of Service Module:
2Way95thQ: **** **** **** **** **** **** **** **** 0.1 **** **** ****
Control Del: **** **** **** **** **** **** **** **** 7.2 **** **** ****
LOS by Move: * * * * * * * * A * * *
Movement: LT LTR RT LT LTR RT LT LTR RT LT LTR RT
Shared Cap.: **** 1045 **** **** **** **** **** **** 5 **** **** ****
SharedQueue: **** 0.1 **** **** **** **** **** **** 0.1 **** **** ****
Shrd ConDel: **** 8.6 **** **** **** **** **** **** 7.2 **** **** ****
Shared LOS: * A * * * * * * A * * *
ApproachDel: 8.6 **** **** ****
ApproachLOS: A * * *
Note: Queue reported is the number of cars per lane.

Fri Feb 22 12:35:54 2019 Page 5
2024 Thursday PM BackgroundTraffic Volumes
Traffix 8.0.0215 (c) 2008 Dowling Associates Licensed to ITS, SOUTH AFRICA
2024 Thursday PM Background Traffic Volumes
Level Of Service Computation Report2000 HCM Unsignalized Method (Base Volume Alternative)
Index #3: Harley St & Cavendish Rd
Average Delay (sec/veh): 2.9 Worst Case Level Of Service: C[16.2]
Approach: North Bound South Bound East Bound West Bound
Movement: L T R L T R L T R L T R
Control: Stop Sign Stop Sign Uncontrolled Uncontrolled
Lefts Include Include Include Include
Lanes: 0 0 0 0 0 0 0 1! 0 0 0 1 0 0 0 0 0 0 1 0
Volume Module: >> Count Date: 3 Jan 2019 <<
Base Vol: 0 0 0 6 0 128 93 282 0 0 232 7
Growth Adj: 1.00 1.00 1.00 1.00 1.00 1.00 1.00 1.00 1.00 1.00 1.00 1.00
Initial Base: 0 0 0 6 0 128 93 282 0 0 232 7
User Adj: 1.00 1.00 1.00 1.00 1.00 1.00 1.00 1.00 1.00 1.00 1.00 1.00
PHF Adj: 0.93 0.93 0.93 0.93 0.93 0.93 0.93 0.93 0.93 0.93 0.93 0.93
PHF Volume: 0 0 0 6 0 137 100 302 0 0 248 7
Reduct Vol: 0 0 0 0 0 0 0 0 0 0 0 0
Final Vol.: 0 0 0 6 0 137 100 302 0 0 248 7
Critical Gap Module:
Critical Gp: **** **** **** 6.2 6.5 6.4 **** **** **** **** **** 4.1
FollowUpTim: **** **** **** 3.3 4.0 3.5 **** **** **** **** **** 2.2
Capacity Module:
Cnflict Vol: **** **** **** 352 615 615 **** **** **** **** **** 401
Potent Cap.: **** **** **** 696 409 458 **** **** **** **** **** 1168
Move Cap.: **** **** **** 696 407 456 **** **** **** **** **** 1168
Volume/Cap: **** **** **** 0.01 0.00 0.30 **** **** **** **** **** 0.01
Level Of Service Module:
2Way95thQ: **** **** **** **** **** **** **** **** **** **** **** 0.0
Control Del: **** **** **** **** **** **** **** **** **** **** **** 8.1
LOS by Move: * * * * * * * * * * * A
Movement: LT LTR RT LT LTR RT LT LTR RT LT LTR RT
Shared Cap.: **** **** **** **** 463 **** **** **** **** **** **** 1
SharedQueue: **** **** **** **** 1.3 **** **** **** **** **** **** 0.0
Shrd ConDel: **** **** **** **** 16.2 **** **** **** **** **** **** 8.1
Shared LOS: * * * * C * * * * * * A
ApproachDel: **** 16.2 **** ****
ApproachLOS: * C * *
Note: Queue reported is the number of cars per lane.

Fri Feb 22 12:35:54 2019 Page 9
2024 Thursday PM BackgroundTraffic Volumes
Traffix 8.0.0215 (c) 2008 Dowling Associates Licensed to ITS, SOUTH AFRICA
2024 Thursday PM Background Traffic Volumes
Level Of Service Computation Report2000 HCM Unsignalized Method (Base Volume Alternative)
Index #4: Bezuidenhout St & Durban Rd
Average Delay (sec/veh): 5.7 Worst Case Level Of Service: B[11.9]
Approach: North Bound South Bound East Bound West Bound
Movement: L T R L T R L T R L T R
Control: Stop Sign Stop Sign Uncontrolled Uncontrolled
Lefts Include Include Include Include
Lanes: 1 0 1 0 0 0 0 0 1 0 0 0 1! 0 0 0 0 0 0 0
Volume Module: >> Count Date: 3 Jan 2019 <<
Base Vol: 6 17 0 0 21 224 281 0 4 0 0 0
Growth Adj: 1.00 1.00 1.00 1.00 1.00 1.00 1.00 1.00 1.00 1.00 1.00 1.00
Initial Base: 6 17 0 0 21 224 281 0 4 0 0 0
User Adj: 1.00 1.00 1.00 1.00 1.00 1.00 1.00 1.00 1.00 1.00 1.00 1.00
PHF Adj: 0.96 0.96 0.96 0.96 0.96 0.96 0.96 0.96 0.96 0.96 0.96 0.96
PHF Volume: 6 18 0 0 22 233 292 0 4 0 0 0
Reduct Vol: 0 0 0 0 0 0 0 0 0 0 0 0
Final Vol.: 6 18 0 0 22 233 292 0 4 0 0 0
Critical Gap Module:
Critical Gp: 6.2 6.5 **** **** 6.5 7.1 **** **** 4.1 **** **** ****
FollowUpTim: 3.3 4.0 **** **** 4.0 3.5 **** **** 2.2 **** **** ****
Capacity Module:
Cnflict Vol: 0 300 **** **** 154 163 **** **** 0 **** **** ****
Potent Cap.: 1091 616 **** **** 741 806 **** **** 1636 **** **** ****
Move Cap.: 1091 614 **** **** 739 783 **** **** 1636 **** **** ****
Volume/Cap: 0.01 0.03 **** **** 0.03 0.30 **** **** 0.00 **** **** ****
Level Of Service Module:
2Way95thQ: 0.0 0.1 **** **** **** **** **** **** 0.0 **** **** ****
Control Del: 8.3 11.0 **** **** **** **** **** **** 7.2 **** **** ****
LOS by Move: A B * * * * * * A * * *
Movement: LT LTR RT LT LTR RT LT LTR RT LT LTR RT
Shared Cap.: **** **** **** **** **** 779 **** **** **** **** **** ****
SharedQueue: **** **** **** **** **** 1.4 **** **** **** **** **** ****
Shrd ConDel: **** **** **** **** **** 11.9 **** **** **** **** **** ****
Shared LOS: * * * * * B * * * * * *
ApproachDel: 10.3 11.9 **** ****
ApproachLOS: B B * *
Note: Queue reported is the number of cars per lane.

Fri Feb 22 12:35:54 2019 Page 13
2024 Thursday PM BackgroundTraffic Volumes
Traffix 8.0.0215 (c) 2008 Dowling Associates Licensed to ITS, SOUTH AFRICA
2024 Thursday PM Background Traffic Volumes
Level Of Service Computation Report2000 HCM Unsignalized Method (Base Volume Alternative)
Index #5: Grafton Rd & Hendon St
Average Delay (sec/veh): 1.2 Worst Case Level Of Service: C[23.1]
Approach: North Bound South Bound East Bound West Bound
Movement: L T R L T R L T R L T R
Control: Stop Sign Stop Sign Uncontrolled Uncontrolled
Lefts Include Include Include Include
Lanes: 0 0 1! 0 0 0 0 0 1 0 0 0 1! 0 0 0 0 1! 0 0
Volume Module: >> Count Date: 3 Jan 2019 <<
Base Vol: 40 7 2 0 7 31 63 453 56 5 513 5
Growth Adj: 1.00 1.00 1.00 1.00 1.00 1.00 1.00 1.00 1.00 1.00 1.00 1.00
Initial Base: 40 7 2 0 7 31 63 453 56 5 513 5
User Adj: 1.00 1.00 1.00 1.00 1.00 1.00 1.00 1.00 1.00 1.00 1.00 1.00
PHF Adj: 0.92 0.92 0.92 0.92 0.92 0.92 0.92 0.92 0.92 0.92 0.92 0.92
PHF Volume: 43 8 2 0 8 34 68 491 61 5 556 5
Reduct Vol: 0 0 0 0 0 0 0 0 0 0 0 0
Final Vol.: 43 8 2 0 8 34 68 491 61 5 556 5
Critical Gap Module:
Critical Gp: 5.3 5.4 5.5 **** 5.4 5.5 **** **** 3.5 **** **** 3.5
FollowUpTim: 2.3 2.6 3.1 **** 2.6 3.1 **** **** 2.1 **** **** 2.1
Capacity Module:
Cnflict Vol: 431 1217 1221 **** 1181 1207 **** **** 562 **** **** 560
Potent Cap.: 836 295 291 **** 308 260 **** **** 1164 **** **** 1166
Move Cap.: 836 278 272 **** 290 231 **** **** 1164 **** **** 1166
Volume/Cap: 0.05 0.03 0.01 **** 0.03 0.15 **** **** 0.05 **** **** 0.00
Level Of Service Module:
2Way95thQ: **** **** **** **** **** **** **** **** 0.2 **** **** 0.0
Control Del: **** **** **** **** **** **** **** **** 8.3 **** **** 8.1
LOS by Move: * * * * * * * * A * * A
Movement: LT LTR RT LT LTR RT LT LTR RT LT LTR RT
Shared Cap.: **** 609 **** **** **** 240 **** **** **** **** **** ****
SharedQueue: **** 0.3 **** **** **** 0.6 **** **** **** **** **** ****
Shrd ConDel: **** 11.5 **** **** **** 23.1 **** **** **** **** **** ****
Shared LOS: * B * * * C * * * * * *
ApproachDel: 11.5 23.1 **** ****
ApproachLOS: B C * *
Note: Queue reported is the number of cars per lane.

Fri Feb 22 12:35:54 2019 Page 17
2024 Thursday PM BackgroundTraffic Volumes
Traffix 8.0.0215 (c) 2008 Dowling Associates Licensed to ITS, SOUTH AFRICA
2024 Thursday PM Background Traffic Volumes
Level Of Service Computation Report2000 HCM Operations Method (Base Volume Alternative)
Index #6: Joe Slovo Dr & Hendon St
Cycle (sec): 110 Critical Vol./Cap.(X): 1.176
Loss Time (sec): 15 Average Delay (sec/veh): 69.4
Optimal Cycle: 180 Level Of Service: E
Approach: North Bound South Bound East Bound West Bound
Movement: L T R L T R L T R L T R
Control: Protected+Permitted Protected+Permitted Permitted Permitted
Lefts Include Include Include Ovl
Min. Green: 0 0 0 0 0 0 0 0 0 0 0 0
Y+R: 5.0 5.0 5.0 5.0 5.0 5.0 5.0 5.0 5.0 5.0 5.0 5.0
Lanes: 0 1 2 0 2 1 1 1 0 1 1 0 1 1 1 0 1 0 0 1
Volume Module: >> Count Date: 3 Jan 2019 <<
Base Vol: 285 1112 295 45 1927 92 158 236 252 366 245 11
Growth Adj: 1.00 1.08 1.00 1.00 1.08 1.00 1.00 1.00 1.00 1.00 1.00 1.00
Initial Base: 285 1198 295 45 2076 92 158 236 252 366 245 11
User Adj: 1.00 1.00 1.00 1.00 1.00 1.00 1.00 1.00 1.00 1.00 1.00 1.00
PHF Adj: 0.99 0.99 0.99 0.99 0.99 0.99 0.99 0.99 0.99 0.99 0.99 0.99
PHF Volume: 287 1207 297 45 2091 93 159 238 254 369 247 11
Reduct Vol: 0 0 0 0 0 0 0 0 0 0 0 0
Reduced Vol: 287 1207 297 45 2091 93 159 238 254 369 247 11
PCE Adj: 1.00 1.00 1.00 1.00 1.00 1.00 1.00 1.00 1.00 1.00 1.00 1.00
MLF Adj: 1.00 1.00 1.00 1.00 1.00 1.00 1.00 1.00 1.00 1.00 1.00 1.00
Final Vol.: 287 1207 297 45 2091 93 159 238 254 369 247 11
Saturation Flow Module:
Sat/Lane: 1900 1900 1900 1900 1900 1900 1900 1900 1900 1900 1900 1900
Adjustment: 0.88 0.88 0.75 0.95 0.95 0.95 0.85 0.55 0.55 0.91 0.91 0.60
Lanes: 0.58 2.42 2.00 1.00 2.00 1.00 1.00 1.45 1.55 0.60 0.40 1.00
Final Sat.: 968 4069 2838 1800 3599 1805 1615 1516 1619 1036 693 1131
Capacity Analysis Module:
Vol/Sat: 0.30 0.30 0.10 0.03 0.58 0.05 0.10 0.16 0.16 0.36 0.36 0.01
Crit Moves: **** **** ****
Green/Cycle: 0.48 0.48 0.56 0.49 0.49 0.61 0.30 0.30 0.30 0.38 0.30 0.30
Green/Cycle: 0.48 0.48 0.08 0.49 0.49 0.08 0.30 0.30 0.30 0.38 0.30 0.30
Volume/Cap: 0.62 0.62 0.26 0.05 1.19 0.36 0.33 0.53 0.53 0.94 1.19 0.03
Level Of Service Module:
Uniform Del: 21.0 21.0 11.7 14.9 28.2 12.2 30.0 32.1 32.1 33.2 38.6 27.3
IncremntDel: 0.5 0.5 0.1 0.0 92.8 0.9 0.4 0.6 0.6 22.6 104.8 0.0
InitQueuDel: 0.0 0.0 0.0 0.0 0.0 0.0 0.0 0.0 0.0 0.0 0.0 0.0
Delay Adj: 1.00 1.00 1.00 1.00 1.00 1.00 1.00 1.00 1.00 1.00 1.00 1.00
Delay/Veh: 21.5 21.5 11.9 14.9 121.0 13.1 30.4 32.7 32.7 55.8 143.4 27.4
User DelAdj: 1.00 1.00 1.00 1.00 1.00 1.00 1.00 1.00 1.00 1.00 1.00 1.00
AdjDel/Veh: 21.5 21.5 11.9 14.9 121.0 13.1 30.4 32.7 32.7 55.8 143.4 27.4
LOS by Move: C C B B F B C C C E F C
HCM2kAvgQ: 13.9 13.9 3.0 0.8 61.0 2.0 4.3 5.4 5.4 25.0 35.8 0.3
Note: Queue reported is the number of cars per lane.

Fri Feb 22 12:35:54 2019 Page 31
2024 Thursday PM BackgroundTraffic Volumes
Traffix 8.0.0215 (c) 2008 Dowling Associates Licensed to ITS, SOUTH AFRICA
2024 Thursday PM Background Traffic Volumes
Level Of Service Computation Report2000 HCM Unsignalized Method (Base Volume Alternative)
Index #7: Fortesque Rd & Hendon St
Average Delay (sec/veh): 2.7 Worst Case Level Of Service: C[23.2]
Approach: North Bound South Bound East Bound West Bound
Movement: L T R L T R L T R L T R
Control: Stop Sign Stop Sign Uncontrolled Uncontrolled
Lefts Include Include Include Include
Lanes: 0 0 0 0 0 0 0 1! 0 0 0 1 0 0 0 0 0 0 1 0
Volume Module: >> Count Date: 3 Jan 2019 <<
Base Vol: 0 0 0 3 0 111 44 392 0 0 416 3
Growth Adj: 1.00 1.00 1.00 1.00 1.00 1.00 1.00 1.00 1.00 1.00 1.00 1.00
Initial Base: 0 0 0 3 0 111 44 392 0 0 416 3
User Adj: 1.00 1.00 1.00 1.00 1.00 1.00 1.00 1.00 1.00 1.00 1.00 1.00
PHF Adj: 0.94 0.94 0.94 0.94 0.94 0.94 0.94 0.94 0.94 0.94 0.94 0.94
PHF Volume: 0 0 0 3 0 118 47 416 0 0 441 3
Reduct Vol: 0 0 0 0 0 0 0 0 0 0 0 0
Final Vol.: 0 0 0 3 0 118 47 416 0 0 441 3
Critical Gap Module:
Critical Gp: **** **** **** 6.2 6.5 6.4 **** **** **** **** **** 4.1
FollowUpTim: **** **** **** 3.3 4.0 3.5 **** **** **** **** **** 2.2
Capacity Module:
Cnflict Vol: **** **** **** 344 832 832 **** **** **** **** **** 462
Potent Cap.: **** **** **** 645 282 314 **** **** **** **** **** 1109
Move Cap.: **** **** **** 645 281 313 **** **** **** **** **** 1109
Volume/Cap: **** **** **** 0.00 0.00 0.38 **** **** **** **** **** 0.00
Level Of Service Module:
2Way95thQ: **** **** **** **** **** **** **** **** **** **** **** 0.0
Control Del: **** **** **** **** **** **** **** **** **** **** **** 8.3
LOS by Move: * * * * * * * * * * * A
Movement: LT LTR RT LT LTR RT LT LTR RT LT LTR RT
Shared Cap.: **** **** **** **** 317 **** **** **** **** **** **** 1
SharedQueue: **** **** **** **** 1.7 **** **** **** **** **** **** 0.0
Shrd ConDel: **** **** **** **** 23.2 **** **** **** **** **** **** 8.3
Shared LOS: * * * * C * * * * * * A
ApproachDel: **** 23.2 **** ****
ApproachLOS: * C * *
Note: Queue reported is the number of cars per lane.

Fri Feb 22 12:35:54 2019 Page 35
2024 Thursday PM BackgroundTraffic Volumes
Traffix 8.0.0215 (c) 2008 Dowling Associates Licensed to ITS, SOUTH AFRICA
2024 Thursday PM Background Traffic Volumes
Level Of Service Computation Report2000 HCM Unsignalized Method (Base Volume Alternative)
Index #8: Hendon St & Percy St
Average Delay (sec/veh): 0.3 Worst Case Level Of Service: C[15.7]
Approach: North Bound South Bound East Bound West Bound
Movement: L T R L T R L T R L T R
Control: Stop Sign Stop Sign Uncontrolled Uncontrolled
Lefts Include Include Include Include
Lanes: 0 0 1! 0 0 0 0 0 0 0 0 0 0 1 0 0 1 0 0 0
Volume Module: >> Count Date: 3 Jan 2019 <<
Base Vol: 6 0 10 0 0 0 0 500 3 1 413 0
Growth Adj: 1.00 1.00 1.00 1.00 1.00 1.00 1.00 1.00 1.00 1.00 1.00 1.00
Initial Base: 6 0 10 0 0 0 0 500 3 1 413 0
User Adj: 1.00 1.00 1.00 1.00 1.00 1.00 1.00 1.00 1.00 1.00 1.00 1.00
PHF Adj: 0.94 0.94 0.94 0.94 0.94 0.94 0.94 0.94 0.94 0.94 0.94 0.94
PHF Volume: 6 0 11 0 0 0 0 530 3 1 438 0
Reduct Vol: 0 0 0 0 0 0 0 0 0 0 0 0
Final Vol.: 6 0 11 0 0 0 0 530 3 1 438 0
Critical Gap Module:
Critical Gp: 6.2 6.5 6.4 **** **** **** **** **** 4.1 **** **** ****
FollowUpTim: 3.3 4.0 3.5 **** **** **** **** **** 2.2 **** **** ****
Capacity Module:
Cnflict Vol: 439 975 975 **** **** **** **** **** 439 **** **** ****
Potent Cap.: 623 253 281 **** **** **** **** **** 1132 **** **** ****
Move Cap.: 623 253 281 **** **** **** **** **** 1132 **** **** ****
Volume/Cap: 0.01 0.00 0.04 **** **** **** **** **** 0.00 **** **** ****
Level Of Service Module:
2Way95thQ: **** **** **** **** **** **** **** **** 0.0 **** **** ****
Control Del: **** **** **** **** **** **** **** **** 8.2 **** **** ****
LOS by Move: * * * * * * * * A * * *
Movement: LT LTR RT LT LTR RT LT LTR RT LT LTR RT
Shared Cap.: **** 353 **** **** **** **** **** **** 1 **** **** ****
SharedQueue: **** 0.2 **** **** **** **** **** **** 0.0 **** **** ****
Shrd ConDel: **** 15.7 **** **** **** **** **** **** 8.2 **** **** ****
Shared LOS: * C * * * * * * A * * *
ApproachDel: 15.7 **** **** ****
ApproachLOS: C * * *
Note: Queue reported is the number of cars per lane.

Fri Feb 22 12:35:54 2019 Page 39
2024 Thursday PM BackgroundTraffic Volumes
Traffix 8.0.0215 (c) 2008 Dowling Associates Licensed to ITS, SOUTH AFRICA
2024 Thursday PM Background Traffic Volumes
Level Of Service Computation Report2000 HCM Unsignalized Method (Base Volume Alternative)
Index #9: Bezuidenhout St & Paddock St
Average Delay (sec/veh): 0.0 Worst Case Level Of Service: B[11.0]
Approach: North Bound South Bound East Bound West Bound
Movement: L T R L T R L T R L T R
Control: Uncontrolled Uncontrolled Stop Sign Stop Sign
Lefts Include Include Include Include
Lanes: 0 0 0 1 0 0 1 0 0 0 0 0 0 0 0 0 0 1! 0 0
Volume Module: >> Count Date: 3 Jan 2019 <<
Base Vol: 0 298 1 1 245 0 0 0 0 1 0 1
Growth Adj: 1.00 1.00 1.00 1.00 1.00 1.00 1.00 1.00 1.00 1.00 1.00 1.00
Initial Base: 0 298 1 1 245 0 0 0 0 1 0 1
User Adj: 1.00 1.00 1.00 1.00 1.00 1.00 1.00 1.00 1.00 1.00 1.00 1.00
PHF Adj: 0.96 0.96 0.96 0.96 0.96 0.96 0.96 0.96 0.96 0.96 0.96 0.96
PHF Volume: 0 310 1 1 255 0 0 0 0 1 0 1
Reduct Vol: 0 0 0 0 0 0 0 0 0 0 0 0
Final Vol.: 0 310 1 1 255 0 0 0 0 1 0 1
Critical Gap Module:
Critical Gp: **** **** 4.1 **** **** **** **** **** **** 6.2 6.5 6.4
FollowUpTim: **** **** 2.2 **** **** **** **** **** **** 3.3 4.0 3.5
Capacity Module:
Cnflict Vol: **** **** 256 **** **** **** **** **** **** 255 567 567
Potent Cap.: **** **** 1321 **** **** **** **** **** **** 788 436 488
Move Cap.: **** **** 1321 **** **** **** **** **** **** 788 436 488
Volume/Cap: **** **** 0.00 **** **** **** **** **** **** 0.00 0.00 0.00
Level Of Service Module:
2Way95thQ: **** **** 0.0 **** **** **** **** **** **** **** **** ****
Control Del: **** **** 7.7 **** **** **** **** **** **** **** **** ****
LOS by Move: * * A * * * * * * * * *
Movement: LT LTR RT LT LTR RT LT LTR RT LT LTR RT
Shared Cap.: **** **** 1 **** **** **** **** **** **** **** 603 ****
SharedQueue: **** **** 0.0 **** **** **** **** **** **** **** 0.0 ****
Shrd ConDel: **** **** 7.7 **** **** **** **** **** **** **** 11.0 ****
Shared LOS: * * A * * * * * * * B *
ApproachDel: **** **** **** 11.0
ApproachLOS: * * * B
Note: Queue reported is the number of cars per lane.

Mon Feb 25 12:01:49 2019 Page 41
2024 Thursday PM BackgroundTraffic Volumes
Traffix 8.0.0215 (c) 2008 Dowling Associates Licensed to ITS, SOUTH AFRICA
2024 Thursday PM Background Traffic Volumes
Level Of Service Computation Report2000 HCM Unsignalized Method (Base Volume Alternative)
Index #11: Highlands St & Back-of-House Access
Average Delay (sec/veh): 3.3 Worst Case Level Of Service: A[8.4]
Approach: North Bound South Bound East Bound West Bound
Movement: L T R L T R L T R L T R
Control: Stop Sign Stop Sign Uncontrolled Uncontrolled
Lefts Include Include Include Include
Lanes: 0 0 1! 0 0 1 0 0 0 0 0 0 1! 0 0 0 0 0 0 1
Volume Module: >> Count Date: 3 Jan 2019 <<
Base Vol: 0 0 0 26 0 0 0 0 0 0 0 40
Growth Adj: 1.00 1.00 1.00 1.00 1.00 1.00 1.00 1.00 1.00 1.00 1.00 1.00
Initial Base: 0 0 0 26 0 0 0 0 0 0 0 40
User Adj: 1.00 1.00 1.00 1.00 1.00 1.00 1.00 1.00 1.00 1.00 1.00 1.00
PHF Adj: 0.93 0.93 0.93 0.93 0.93 0.93 0.93 0.93 0.93 0.93 0.93 0.93
PHF Volume: 0 0 0 28 0 0 0 0 0 0 0 43
Reduct Vol: 0 0 0 0 0 0 0 0 0 0 0 0
Final Vol.: 0 0 0 28 0 0 0 0 0 0 0 43
Critical Gap Module:
Critical Gp: 6.2 6.5 7.1 6.2 **** **** **** **** **** **** **** 4.1
FollowUpTim: 3.3 4.0 3.5 3.3 **** **** **** **** **** **** **** 2.2
Capacity Module:
Cnflict Vol: 0 86 100 0 **** **** **** **** **** **** **** 0
Potent Cap.: 1091 808 886 1091 **** **** **** **** **** **** **** 1636
Move Cap.: 1091 787 846 1091 **** **** **** **** **** **** **** 1636
Volume/Cap: 0.00 0.00 0.00 0.03 **** **** **** **** **** **** **** 0.03
Level Of Service Module:
2Way95thQ: **** **** **** 0.1 **** **** **** **** **** **** **** 0.1
Control Del: **** **** **** 8.4 **** **** **** **** **** **** **** 7.3
LOS by Move: * * * A * * * * * * * A
Movement: LT LTR RT LT LTR RT LT LTR RT LT LTR RT
Shared Cap.: **** 0 **** **** **** **** **** **** **** **** **** ****
SharedQueue: **** **** **** **** **** **** **** **** **** **** **** ****
Shrd ConDel: **** **** **** **** **** **** **** **** **** **** **** ****
Shared LOS: * * * * * * * * * * * *
ApproachDel: **** 8.4 **** ****
ApproachLOS: * A * *
Note: Queue reported is the number of cars per lane.

Fri Feb 22 12:35:54 2019 Page 43
2024 Thursday PM BackgroundTraffic Volumes
Traffix 8.0.0215 (c) 2008 Dowling Associates Licensed to ITS, SOUTH AFRICA
2024 Thursday PM Background Traffic Volumes
Level Of Service Computation Report2000 HCM Unsignalized Method (Base Volume Alternative)
Index #12: Charlton Access Rd & South Ln
Average Delay (sec/veh): 1.2 Worst Case Level Of Service: A[8.4]
Approach: North Bound South Bound East Bound West Bound
Movement: L T R L T R L T R L T R
Control: Uncontrolled Uncontrolled Stop Sign Stop Sign
Lefts Include Include Include Include
Lanes: 0 0 0 0 0 0 1 0 0 0 0 0 0 0 0 1 0 0 0 0
Volume Module: >> Count Date: 3 Jan 2019 <<
Base Vol: 0 0 0 10 20 0 0 0 0 5 0 0
Growth Adj: 1.00 1.00 1.00 1.00 1.00 1.00 1.00 1.00 1.00 1.00 1.00 1.00
Initial Base: 0 0 0 10 20 0 0 0 0 5 0 0
User Adj: 1.00 1.00 1.00 1.00 1.00 1.00 1.00 1.00 1.00 1.00 1.00 1.00
PHF Adj: 0.89 0.89 0.89 0.89 0.89 0.89 0.89 0.89 0.89 0.89 0.89 0.89
PHF Volume: 0 0 0 11 23 0 0 0 0 6 0 0
Reduct Vol: 0 0 0 0 0 0 0 0 0 0 0 0
Final Vol.: 0 0 0 11 23 0 0 0 0 6 0 0
Critical Gap Module:
Critical Gp: **** **** **** **** **** **** **** **** **** 6.2 **** ****
FollowUpTim: **** **** **** **** **** **** **** **** **** 3.3 **** ****
Capacity Module:
Cnflict Vol: **** **** **** **** **** **** **** **** **** 28 **** ****
Potent Cap.: **** **** **** **** **** **** **** **** **** 1053 **** ****
Move Cap.: **** **** **** **** **** **** **** **** **** 1053 **** ****
Volume/Cap: **** **** **** **** **** **** **** **** **** 0.01 **** ****
Level Of Service Module:
2Way95thQ: **** **** **** **** **** **** **** **** **** 0.0 **** ****
Control Del: **** **** **** **** **** **** **** **** **** 8.4 **** ****
LOS by Move: * * * * * * * * * A * *
Movement: LT LTR RT LT LTR RT LT LTR RT LT LTR RT
Shared Cap.: **** **** **** **** **** **** **** **** **** **** **** ****
SharedQueue: **** **** **** **** **** **** **** **** **** **** **** ****
Shrd ConDel: **** **** **** **** **** **** **** **** **** **** **** ****
Shared LOS: * * * * * * * * * * * *
ApproachDel: **** **** **** 8.4
ApproachLOS: * * * A
Note: Queue reported is the number of cars per lane.

Fri Feb 22 12:35:54 2019 Page 47
2024 Thursday PM BackgroundTraffic Volumes
Traffix 8.0.0215 (c) 2008 Dowling Associates Licensed to ITS, SOUTH AFRICA
2024 Thursday PM Background Traffic Volumes
Level Of Service Computation Report2000 HCM Unsignalized Method (Future Volume Alternative)
Index #14:
Average Delay (sec/veh): 0.4 Worst Case Level Of Service: A[8.3]
Approach: North Bound South Bound East Bound West Bound
Movement: L T R L T R L T R L T R
Control: Stop Sign Stop Sign Uncontrolled Uncontrolled
Lefts Include Include Include Include
Lanes: 1 0 0 0 0 0 0 0 0 0 0 0 0 1 0 0 0 1 0 0
Volume Module:
Base Vol: 2 0 0 0 0 0 0 24 7 0 6 0
Growth Adj: 1.00 1.00 1.00 1.00 1.00 1.00 1.00 1.00 1.00 1.00 1.00 1.00
Initial Base: 0 0 0 0 0 0 0 0 0 0 0 0
Added Vol: 2 0 0 0 0 0 0 24 7 0 6 0
PasserByVol: 0 0 0 0 0 0 0 0 0 0 0 0
Initial Fut: 2 0 0 0 0 0 0 24 7 0 6 0
User Adj: 1.00 1.00 1.00 1.00 1.00 1.00 1.00 1.00 1.00 1.00 1.00 1.00
PHF Adj: 1.00 1.00 1.00 1.00 1.00 1.00 1.00 1.00 1.00 1.00 1.00 1.00
PHF Volume: 2 0 0 0 0 0 0 24 7 0 6 0
Reduct Vol: 0 0 0 0 0 0 0 0 0 0 0 0
Final Vol.: 2 0 0 0 0 0 0 24 7 0 6 0
Critical Gap Module:
Critical Gp: 6.2 **** **** **** **** **** **** **** 4.1 **** **** ****
FollowUpTim: 3.3 **** **** **** **** **** **** **** 2.2 **** **** ****
Capacity Module:
Cnflict Vol: 6 **** **** **** **** **** **** **** 6 **** **** ****
Potent Cap.: 1083 **** **** **** **** **** **** **** 1628 **** **** ****
Move Cap.: 1083 **** **** **** **** **** **** **** 1628 **** **** ****
Volume/Cap: 0.00 **** **** **** **** **** **** **** 0.00 **** **** ****
Level Of Service Module:
2Way95thQ: 0.0 **** **** **** **** **** **** **** 0.0 **** **** ****
Control Del: 8.3 **** **** **** **** **** **** **** 7.2 **** **** ****
LOS by Move: A * * * * * * * A * * *
Movement: LT LTR RT LT LTR RT LT LTR RT LT LTR RT
Shared Cap.: **** **** **** **** **** **** **** **** 1 **** **** ****
SharedQueue: **** **** **** **** **** **** **** **** 0.0 **** **** ****
Shrd ConDel: **** **** **** **** **** **** **** **** 7.2 **** **** ****
Shared LOS: * * * * * * * * A * * *
ApproachDel: 8.3 **** **** ****
ApproachLOS: A * * *
Note: Queue reported is the number of cars per lane.

TRAFFIC IMPACT STUDY YEOVILLE RCG CHURCH
2024 Sunday PM Background Traffic Volumes

Fri Feb 22 12:36:52 2019 Page 1
2024 Sunday Background TrafficVolumes
Traffix 8.0.0215 (c) 2008 Dowling Associates Licensed to ITS, SOUTH AFRICA
2024 Sunday Background Traffic Volumes
Level Of Service Computation Report2000 HCM Unsignalized Method (Base Volume Alternative)
Index #1: Grafton St & Percy St
Average Delay (sec/veh): 3.2 Worst Case Level Of Service: A[8.7]
Approach: North Bound South Bound East Bound West Bound
Movement: L T R L T R L T R L T R
Control: Stop Sign Stop Sign Uncontrolled Uncontrolled
Lefts Include Include Include Include
Lanes: 0 0 0 0 0 0 0 1! 0 0 0 1 0 0 0 0 0 0 1 0
Volume Module: >> Count Date: 3 Feb 2019 <<
Base Vol: 0 0 0 20 0 12 18 3 0 0 7 26
Growth Adj: 1.00 1.00 1.00 1.00 1.00 1.00 1.00 1.00 1.00 1.00 1.00 1.00
Initial Base: 0 0 0 20 0 12 18 3 0 0 7 26
User Adj: 1.00 1.00 1.00 1.00 1.00 1.00 1.00 1.00 1.00 1.00 1.00 1.00
PHF Adj: 0.96 0.96 0.96 0.96 0.96 0.96 0.96 0.96 0.96 0.96 0.96 0.96
PHF Volume: 0 0 0 21 0 13 19 3 0 0 7 27
Reduct Vol: 0 0 0 0 0 0 0 0 0 0 0 0
Final Vol.: 0 0 0 21 0 13 19 3 0 0 7 27
Critical Gap Module:
Critical Gp: **** **** **** 6.2 6.5 6.4 **** **** **** **** **** 4.1
FollowUpTim: **** **** **** 3.3 4.0 3.5 **** **** **** **** **** 2.2
Capacity Module:
Cnflict Vol: **** **** **** 13 74 74 **** **** **** **** **** 22
Potent Cap.: **** **** **** 1074 820 935 **** **** **** **** **** 1607
Move Cap.: **** **** **** 1074 806 922 **** **** **** **** **** 1607
Volume/Cap: **** **** **** 0.02 0.00 0.01 **** **** **** **** **** 0.02
Level Of Service Module:
2Way95thQ: **** **** **** **** **** **** **** **** **** **** **** 0.1
Control Del: **** **** **** **** **** **** **** **** **** **** **** 7.3
LOS by Move: * * * * * * * * * * * A
Movement: LT LTR RT LT LTR RT LT LTR RT LT LTR RT
Shared Cap.: **** **** **** **** 1012 **** **** **** **** **** **** 5
SharedQueue: **** **** **** **** 0.1 **** **** **** **** **** **** 0.1
Shrd ConDel: **** **** **** **** 8.7 **** **** **** **** **** **** 7.3
Shared LOS: * * * * A * * * * * * A
ApproachDel: **** 8.7 **** ****
ApproachLOS: * A * *
Note: Queue reported is the number of cars per lane.

Fri Feb 22 12:36:52 2019 Page 3
2024 Sunday Background TrafficVolumes
Traffix 8.0.0215 (c) 2008 Dowling Associates Licensed to ITS, SOUTH AFRICA
2024 Sunday Background Traffic Volumes
Level Of Service Computation Report2000 HCM Unsignalized Method (Base Volume Alternative)
Index #2: Percy St & Highlands St
Average Delay (sec/veh): 4.3 Worst Case Level Of Service: A[8.6]
Approach: North Bound South Bound East Bound West Bound
Movement: L T R L T R L T R L T R
Control: Stop Sign Stop Sign Uncontrolled Uncontrolled
Lefts Include Include Include Include
Lanes: 0 0 1! 0 0 0 0 0 0 0 0 0 0 1 0 0 1 0 0 0
Volume Module: >> Count Date: 3 Jan 2019 <<
Base Vol: 21 0 13 0 0 0 0 6 15 4 9 0
Growth Adj: 1.00 1.00 1.00 1.00 1.00 1.00 1.00 1.00 1.00 1.00 1.00 1.00
Initial Base: 21 0 13 0 0 0 0 6 15 4 9 0
User Adj: 1.00 1.00 1.00 1.00 1.00 1.00 1.00 1.00 1.00 1.00 1.00 1.00
PHF Adj: 0.95 0.95 0.95 0.95 0.95 0.95 0.95 0.95 0.95 0.95 0.95 0.95
PHF Volume: 22 0 14 0 0 0 0 6 16 4 9 0
Reduct Vol: 0 0 0 0 0 0 0 0 0 0 0 0
Final Vol.: 22 0 14 0 0 0 0 6 16 4 9 0
Critical Gap Module:
Critical Gp: 6.2 6.5 6.4 **** **** **** **** **** 4.1 **** **** ****
FollowUpTim: 3.3 4.0 3.5 **** **** **** **** **** 2.2 **** **** ****
Capacity Module:
Cnflict Vol: 12 50 50 **** **** **** **** **** 14 **** **** ****
Potent Cap.: 1075 846 965 **** **** **** **** **** 1618 **** **** ****
Move Cap.: 1075 837 957 **** **** **** **** **** 1618 **** **** ****
Volume/Cap: 0.02 0.00 0.01 **** **** **** **** **** 0.01 **** **** ****
Level Of Service Module:
2Way95thQ: **** **** **** **** **** **** **** **** 0.0 **** **** ****
Control Del: **** **** **** **** **** **** **** **** 7.2 **** **** ****
LOS by Move: * * * * * * * * A * * *
Movement: LT LTR RT LT LTR RT LT LTR RT LT LTR RT
Shared Cap.: **** 1027 **** **** **** **** **** **** 3 **** **** ****
SharedQueue: **** 0.1 **** **** **** **** **** **** 0.0 **** **** ****
Shrd ConDel: **** 8.6 **** **** **** **** **** **** 7.2 **** **** ****
Shared LOS: * A * * * * * * A * * *
ApproachDel: 8.6 **** **** ****
ApproachLOS: A * * *
Note: Queue reported is the number of cars per lane.
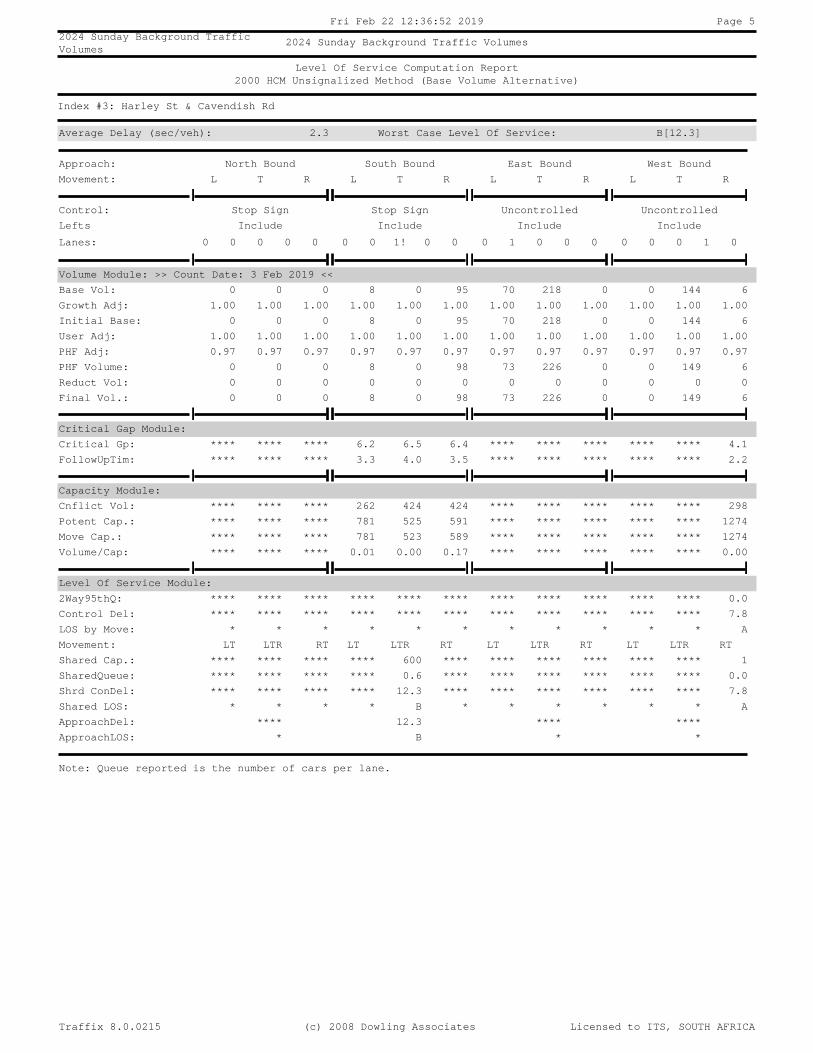
Fri Feb 22 12:36:52 2019 Page 5
2024 Sunday Background TrafficVolumes
Traffix 8.0.0215 (c) 2008 Dowling Associates Licensed to ITS, SOUTH AFRICA
2024 Sunday Background Traffic Volumes
Level Of Service Computation Report2000 HCM Unsignalized Method (Base Volume Alternative)
Index #3: Harley St & Cavendish Rd
Average Delay (sec/veh): 2.3 Worst Case Level Of Service: B[12.3]
Approach: North Bound South Bound East Bound West Bound
Movement: L T R L T R L T R L T R
Control: Stop Sign Stop Sign Uncontrolled Uncontrolled
Lefts Include Include Include Include
Lanes: 0 0 0 0 0 0 0 1! 0 0 0 1 0 0 0 0 0 0 1 0
Volume Module: >> Count Date: 3 Feb 2019 <<
Base Vol: 0 0 0 8 0 95 70 218 0 0 144 6
Growth Adj: 1.00 1.00 1.00 1.00 1.00 1.00 1.00 1.00 1.00 1.00 1.00 1.00
Initial Base: 0 0 0 8 0 95 70 218 0 0 144 6
User Adj: 1.00 1.00 1.00 1.00 1.00 1.00 1.00 1.00 1.00 1.00 1.00 1.00
PHF Adj: 0.97 0.97 0.97 0.97 0.97 0.97 0.97 0.97 0.97 0.97 0.97 0.97
PHF Volume: 0 0 0 8 0 98 73 226 0 0 149 6
Reduct Vol: 0 0 0 0 0 0 0 0 0 0 0 0
Final Vol.: 0 0 0 8 0 98 73 226 0 0 149 6
Critical Gap Module:
Critical Gp: **** **** **** 6.2 6.5 6.4 **** **** **** **** **** 4.1
FollowUpTim: **** **** **** 3.3 4.0 3.5 **** **** **** **** **** 2.2
Capacity Module:
Cnflict Vol: **** **** **** 262 424 424 **** **** **** **** **** 298
Potent Cap.: **** **** **** 781 525 591 **** **** **** **** **** 1274
Move Cap.: **** **** **** 781 523 589 **** **** **** **** **** 1274
Volume/Cap: **** **** **** 0.01 0.00 0.17 **** **** **** **** **** 0.00
Level Of Service Module:
2Way95thQ: **** **** **** **** **** **** **** **** **** **** **** 0.0
Control Del: **** **** **** **** **** **** **** **** **** **** **** 7.8
LOS by Move: * * * * * * * * * * * A
Movement: LT LTR RT LT LTR RT LT LTR RT LT LTR RT
Shared Cap.: **** **** **** **** 600 **** **** **** **** **** **** 1
SharedQueue: **** **** **** **** 0.6 **** **** **** **** **** **** 0.0
Shrd ConDel: **** **** **** **** 12.3 **** **** **** **** **** **** 7.8
Shared LOS: * * * * B * * * * * * A
ApproachDel: **** 12.3 **** ****
ApproachLOS: * B * *
Note: Queue reported is the number of cars per lane.

Fri Feb 22 12:36:52 2019 Page 9
2024 Sunday Background TrafficVolumes
Traffix 8.0.0215 (c) 2008 Dowling Associates Licensed to ITS, SOUTH AFRICA
2024 Sunday Background Traffic Volumes
Level Of Service Computation Report2000 HCM Unsignalized Method (Base Volume Alternative)
Index #4: Bezuidenhout St & Durban Rd
Average Delay (sec/veh): 5.1 Worst Case Level Of Service: B[10.7]
Approach: North Bound South Bound East Bound West Bound
Movement: L T R L T R L T R L T R
Control: Stop Sign Stop Sign Uncontrolled Uncontrolled
Lefts Include Include Include Include
Lanes: 1 0 1 0 0 0 0 0 1 0 0 0 1! 0 0 0 0 0 0 0
Volume Module: >> Count Date: 3 Feb 2019 <<
Base Vol: 9 10 0 0 31 153 213 0 7 0 0 0
Growth Adj: 1.00 1.00 1.00 1.00 1.00 1.00 1.00 1.00 1.00 1.00 1.00 1.00
Initial Base: 9 10 0 0 31 153 213 0 7 0 0 0
User Adj: 1.00 1.00 1.00 1.00 1.00 1.00 1.00 1.00 1.00 1.00 1.00 1.00
PHF Adj: 0.97 0.97 0.97 0.97 0.97 0.97 0.97 0.97 0.97 0.97 0.97 0.97
PHF Volume: 9 10 0 0 32 158 221 0 7 0 0 0
Reduct Vol: 0 0 0 0 0 0 0 0 0 0 0 0
Final Vol.: 9 10 0 0 32 158 221 0 7 0 0 0
Critical Gap Module:
Critical Gp: 6.2 6.5 **** **** 6.5 7.1 **** **** 4.1 **** **** ****
FollowUpTim: 3.3 4.0 **** **** 4.0 3.5 **** **** 2.2 **** **** ****
Capacity Module:
Cnflict Vol: 0 235 **** **** 125 130 **** **** 0 **** **** ****
Potent Cap.: 1091 669 **** **** 769 847 **** **** 1636 **** **** ****
Move Cap.: 1091 666 **** **** 766 827 **** **** 1636 **** **** ****
Volume/Cap: 0.01 0.02 **** **** 0.04 0.19 **** **** 0.00 **** **** ****
Level Of Service Module:
2Way95thQ: 0.0 0.0 **** **** **** **** **** **** 0.0 **** **** ****
Control Del: 8.3 10.5 **** **** **** **** **** **** 7.2 **** **** ****
LOS by Move: A B * * * * * * A * * *
Movement: LT LTR RT LT LTR RT LT LTR RT LT LTR RT
Shared Cap.: **** **** **** **** **** 816 **** **** **** **** **** ****
SharedQueue: **** **** **** **** **** 0.9 **** **** **** **** **** ****
Shrd ConDel: **** **** **** **** **** 10.7 **** **** **** **** **** ****
Shared LOS: * * * * * B * * * * * *
ApproachDel: 9.5 10.7 **** ****
ApproachLOS: A B * *
Note: Queue reported is the number of cars per lane.

Fri Feb 22 12:36:52 2019 Page 13
2024 Sunday Background TrafficVolumes
Traffix 8.0.0215 (c) 2008 Dowling Associates Licensed to ITS, SOUTH AFRICA
2024 Sunday Background Traffic Volumes
Level Of Service Computation Report2000 HCM Unsignalized Method (Base Volume Alternative)
Index #5: Grafton Rd & Hendon St
Average Delay (sec/veh): 1.1 Worst Case Level Of Service: B[12.6]
Approach: North Bound South Bound East Bound West Bound
Movement: L T R L T R L T R L T R
Control: Stop Sign Stop Sign Uncontrolled Uncontrolled
Lefts Include Include Include Include
Lanes: 0 0 1! 0 0 0 0 1! 0 0 0 0 1! 0 0 0 0 1! 0 0
Volume Module: >> Count Date: 3 Feb 2019 <<
Base Vol: 32 6 1 3 8 28 57 307 32 2 311 2
Growth Adj: 1.00 1.00 1.00 1.00 1.00 1.00 1.00 1.00 1.00 1.00 1.00 1.00
Initial Base: 32 6 1 3 8 28 57 307 32 2 311 2
User Adj: 1.00 1.00 1.00 1.00 1.00 1.00 1.00 1.00 1.00 1.00 1.00 1.00
PHF Adj: 0.98 0.98 0.98 0.98 0.98 0.98 0.98 0.98 0.98 0.98 0.98 0.98
PHF Volume: 33 6 1 3 8 29 58 314 33 2 318 2
Reduct Vol: 0 0 0 0 0 0 0 0 0 0 0 0
Final Vol.: 33 6 1 3 8 29 58 314 33 2 318 2
Critical Gap Module:
Critical Gp: 5.3 5.4 5.5 5.3 5.4 5.5 **** **** 3.5 **** **** 3.5
FollowUpTim: 2.3 2.6 3.1 2.3 2.6 3.1 **** **** 2.1 **** **** 2.1
Capacity Module:
Cnflict Vol: 279 736 738 304 707 726 **** **** 320 **** **** 372
Potent Cap.: 1096 572 508 1065 592 498 **** **** 1377 **** **** 1328
Move Cap.: 1096 558 492 1065 577 470 **** **** 1377 **** **** 1328
Volume/Cap: 0.03 0.01 0.00 0.00 0.01 0.06 **** **** 0.02 **** **** 0.00
Level Of Service Module:
2Way95thQ: **** **** **** **** **** **** **** **** 0.1 **** **** 0.0
Control Del: **** **** **** **** **** **** **** **** 7.7 **** **** 7.7
LOS by Move: * * * * * * * * A * * A
Movement: LT LTR RT LT LTR RT LT LTR RT LT LTR RT
Shared Cap.: **** 929 **** **** 511 **** **** **** **** **** **** ****
SharedQueue: **** 0.1 **** **** 0.3 **** **** **** **** **** **** ****
Shrd ConDel: **** 9.1 **** **** 12.6 **** **** **** **** **** **** ****
Shared LOS: * A * * B * * * * * * *
ApproachDel: 9.1 12.6 **** ****
ApproachLOS: A B * *
Note: Queue reported is the number of cars per lane.

Fri Feb 22 12:36:52 2019 Page 17
2024 Sunday Background TrafficVolumes
Traffix 8.0.0215 (c) 2008 Dowling Associates Licensed to ITS, SOUTH AFRICA
2024 Sunday Background Traffic Volumes
Level Of Service Computation Report2000 HCM Operations Method (Base Volume Alternative)
Index #6: Joe Slovo Dr & Hendon St
Cycle (sec): 110 Critical Vol./Cap.(X): 0.641
Loss Time (sec): 15 Average Delay (sec/veh): 28.4
Optimal Cycle: 60 Level Of Service: C
Approach: North Bound South Bound East Bound West Bound
Movement: L T R L T R L T R L T R
Control: Protected+Permitted Protected+Permitted Permitted Permitted
Lefts Include Include Include Ovl
Min. Green: 0 0 0 0 0 0 0 0 0 0 0 0
Y+R: 5.0 5.0 5.0 5.0 5.0 5.0 5.0 5.0 5.0 5.0 5.0 5.0
Lanes: 0 1 2 0 2 1 1 1 0 1 1 0 1 1 1 0 1 0 0 1
Volume Module: >> Count Date: 3 Feb 2019 <<
Base Vol: 215 545 191 34 605 109 133 185 218 168 189 15
Growth Adj: 1.00 1.08 1.00 1.00 1.08 1.00 1.00 1.00 1.00 1.00 1.00 1.00
Initial Base: 215 587 191 34 652 109 133 185 218 168 189 15
User Adj: 0.98 0.98 0.98 0.98 0.98 0.98 0.98 0.98 0.98 0.98 0.98 0.98
PHF Adj: 1.00 1.00 1.00 1.00 1.00 1.00 1.00 1.00 1.00 1.00 1.00 1.00
PHF Volume: 210 573 186 33 636 106 130 181 213 164 184 15
Reduct Vol: 0 0 0 0 0 0 0 0 0 0 0 0
Reduced Vol: 210 573 186 33 636 106 130 181 213 164 184 15
PCE Adj: 1.00 1.00 1.00 1.00 1.00 1.00 1.00 1.00 1.00 1.00 1.00 1.00
MLF Adj: 1.00 1.00 1.00 1.00 1.00 1.00 1.00 1.00 1.00 1.00 1.00 1.00
Final Vol.: 210 573 186 33 636 106 130 181 213 164 184 15
Saturation Flow Module:
Sat/Lane: 1900 1900 1900 1900 1900 1900 1900 1900 1900 1900 1900 1900
Adjustment: 0.87 0.87 0.84 0.94 0.94 0.95 0.85 0.22 0.22 0.93 0.93 0.64
Lanes: 0.80 2.20 2.00 1.00 2.00 1.00 1.00 1.38 1.62 0.47 0.53 1.00
Final Sat.: 1334 3644 3177 1791 3583 1805 1615 569 671 831 935 1208
Capacity Analysis Module:
Vol/Sat: 0.16 0.16 0.06 0.02 0.18 0.06 0.08 0.32 0.32 0.20 0.20 0.01
Crit Moves: **** **** ****
Green/Cycle: 0.34 0.27 0.36 0.28 0.28 0.41 0.50 0.50 0.50 0.59 0.50 0.50
Green/Cycle: 0.34 0.27 0.09 0.28 0.28 0.10 0.50 0.50 0.50 0.59 0.50 0.50
Volume/Cap: 0.46 0.59 0.29 0.07 0.64 0.37 0.16 0.64 0.64 0.34 0.40 0.02
Level Of Service Module:
Uniform Del: 28.2 35.0 27.6 29.3 34.9 23.8 15.3 20.5 20.5 11.7 17.5 14.2
IncremntDel: 0.2 0.7 0.3 0.0 1.4 0.8 0.1 2.3 2.3 0.2 0.3 0.0
InitQueuDel: 0.0 0.0 0.0 0.0 0.0 0.0 0.0 0.0 0.0 0.0 0.0 0.0
Delay Adj: 1.00 1.00 1.00 1.00 1.00 1.00 1.00 1.00 1.00 1.00 1.00 1.00
Delay/Veh: 28.4 35.6 27.9 29.3 36.3 24.6 15.3 22.8 22.8 11.9 17.8 14.2
User DelAdj: 1.00 1.00 1.00 1.00 1.00 1.00 1.00 1.00 1.00 1.00 1.00 1.00
AdjDel/Veh: 28.4 35.6 27.9 29.3 36.3 24.6 15.3 22.8 22.8 11.9 17.8 14.2
LOS by Move: C D C C D C B C C B B B
HCM2kAvgQ: 7.7 9.0 2.7 0.9 10.7 2.8 2.4 4.7 4.7 6.0 7.4 0.3
Note: Queue reported is the number of cars per lane.

Fri Feb 22 12:36:52 2019 Page 31
2024 Sunday Background TrafficVolumes
Traffix 8.0.0215 (c) 2008 Dowling Associates Licensed to ITS, SOUTH AFRICA
2024 Sunday Background Traffic Volumes
Level Of Service Computation Report2000 HCM Unsignalized Method (Base Volume Alternative)
Index #7: Fortesque Rd & Hendon St
Average Delay (sec/veh): 1.3 Worst Case Level Of Service: B[13.3]
Approach: North Bound South Bound East Bound West Bound
Movement: L T R L T R L T R L T R
Control: Stop Sign Stop Sign Uncontrolled Uncontrolled
Lefts Include Include Include Include
Lanes: 0 0 0 0 0 0 0 0 0 1 0 1 0 0 0 0 0 0 1 0
Volume Module: >> Count Date: 3 Feb 2020 <<
Base Vol: 0 0 0 0 0 60 58 246 0 0 260 4
Growth Adj: 1.00 1.00 1.00 1.00 1.00 1.00 1.00 1.00 1.00 1.00 1.00 1.00
Initial Base: 0 0 0 0 0 60 58 246 0 0 260 4
User Adj: 1.00 1.00 1.00 1.00 1.00 1.00 1.00 1.00 1.00 1.00 1.00 1.00
PHF Adj: 0.98 0.98 0.98 0.98 0.98 0.98 0.98 0.98 0.98 0.98 0.98 0.98
PHF Volume: 0 0 0 0 0 61 59 250 0 0 264 4
Reduct Vol: 0 0 0 0 0 0 0 0 0 0 0 0
Final Vol.: 0 0 0 0 0 61 59 250 0 0 264 4
Critical Gap Module:
Critical Gp: **** **** **** **** **** 6.4 **** **** **** **** **** 4.1
FollowUpTim: **** **** **** **** **** 3.5 **** **** **** **** **** 2.2
Capacity Module:
Cnflict Vol: **** **** **** **** **** 552 **** **** **** **** **** 309
Potent Cap.: **** **** **** **** **** 498 **** **** **** **** **** 1263
Move Cap.: **** **** **** **** **** 497 **** **** **** **** **** 1263
Volume/Cap: **** **** **** **** **** 0.12 **** **** **** **** **** 0.00
Level Of Service Module:
2Way95thQ: **** **** **** **** **** 0.4 **** **** **** **** **** 0.0
Control Del: **** **** **** **** **** 13.3 **** **** **** **** **** 7.9
LOS by Move: * * * * * B * * * * * A
Movement: LT LTR RT LT LTR RT LT LTR RT LT LTR RT
Shared Cap.: **** **** **** **** **** **** **** **** **** **** **** 1
SharedQueue: **** **** **** **** **** **** **** **** **** **** **** 0.0
Shrd ConDel: **** **** **** **** **** **** **** **** **** **** **** 7.9
Shared LOS: * * * * * * * * * * * A
ApproachDel: **** 13.3 **** ****
ApproachLOS: * B * *
Note: Queue reported is the number of cars per lane.

Fri Feb 22 12:36:52 2019 Page 35
2024 Sunday Background TrafficVolumes
Traffix 8.0.0215 (c) 2008 Dowling Associates Licensed to ITS, SOUTH AFRICA
2024 Sunday Background Traffic Volumes
Level Of Service Computation Report2000 HCM Unsignalized Method (Base Volume Alternative)
Index #8: Hendon St & Percy St
Average Delay (sec/veh): 0.4 Worst Case Level Of Service: B[11.1]
Approach: North Bound South Bound East Bound West Bound
Movement: L T R L T R L T R L T R
Control: Stop Sign Stop Sign Uncontrolled Uncontrolled
Lefts Include Include Include Include
Lanes: 0 0 1! 0 0 0 0 0 0 0 0 0 0 1 0 0 1 0 0 0
Volume Module: >> Count Date: 3 Feb 2019 <<
Base Vol: 7 0 10 0 0 0 0 242 4 2 257 0
Growth Adj: 1.00 1.00 1.00 1.00 1.00 1.00 1.00 1.00 1.00 1.00 1.00 1.00
Initial Base: 7 0 10 0 0 0 0 242 4 2 257 0
User Adj: 1.00 1.00 1.00 1.00 1.00 1.00 1.00 1.00 1.00 1.00 1.00 1.00
PHF Adj: 0.98 0.98 0.98 0.98 0.98 0.98 0.98 0.98 0.98 0.98 0.98 0.98
PHF Volume: 7 0 10 0 0 0 0 246 4 2 261 0
Reduct Vol: 0 0 0 0 0 0 0 0 0 0 0 0
Final Vol.: 7 0 10 0 0 0 0 246 4 2 261 0
Critical Gap Module:
Critical Gp: 6.2 6.5 6.4 **** **** **** **** **** 4.1 **** **** ****
FollowUpTim: 3.3 4.0 3.5 **** **** **** **** **** 2.2 **** **** ****
Capacity Module:
Cnflict Vol: 262 516 516 **** **** **** **** **** 263 **** **** ****
Potent Cap.: 781 466 522 **** **** **** **** **** 1313 **** **** ****
Move Cap.: 781 464 521 **** **** **** **** **** 1313 **** **** ****
Volume/Cap: 0.01 0.00 0.02 **** **** **** **** **** 0.00 **** **** ****
Level Of Service Module:
2Way95thQ: **** **** **** **** **** **** **** **** 0.0 **** **** ****
Control Del: **** **** **** **** **** **** **** **** 7.8 **** **** ****
LOS by Move: * * * * * * * * A * * *
Movement: LT LTR RT LT LTR RT LT LTR RT LT LTR RT
Shared Cap.: **** 604 **** **** **** **** **** **** 1 **** **** ****
SharedQueue: **** 0.1 **** **** **** **** **** **** 0.0 **** **** ****
Shrd ConDel: **** 11.1 **** **** **** **** **** **** 7.8 **** **** ****
Shared LOS: * B * * * * * * A * * *
ApproachDel: 11.1 **** **** ****
ApproachLOS: B * * *
Note: Queue reported is the number of cars per lane.

Fri Feb 22 12:36:52 2019 Page 39
2024 Sunday Background TrafficVolumes
Traffix 8.0.0215 (c) 2008 Dowling Associates Licensed to ITS, SOUTH AFRICA
2024 Sunday Background Traffic Volumes
Level Of Service Computation Report2000 HCM Unsignalized Method (Base Volume Alternative)
Index #9: Bezuidenhout St & Paddock St
Average Delay (sec/veh): 0.0 Worst Case Level Of Service: A[9.2]
Approach: North Bound South Bound East Bound West Bound
Movement: L T R L T R L T R L T R
Control: Uncontrolled Uncontrolled Stop Sign Stop Sign
Lefts Include Include Include Include
Lanes: 0 0 1 0 0 0 1 0 0 0 0 0 0 0 0 1 0 0 0 0
Volume Module: >> Count Date: 3 Feb 2019 <<
Base Vol: 0 223 0 1 184 0 0 0 0 1 0 0
Growth Adj: 1.00 1.00 1.00 1.00 1.00 1.00 1.00 1.00 1.00 1.00 1.00 1.00
Initial Base: 0 223 0 1 184 0 0 0 0 1 0 0
User Adj: 1.00 1.00 1.00 1.00 1.00 1.00 1.00 1.00 1.00 1.00 1.00 1.00
PHF Adj: 0.97 0.97 0.97 0.97 0.97 0.97 0.97 0.97 0.97 0.97 0.97 0.97
PHF Volume: 0 231 0 1 191 0 0 0 0 1 0 0
Reduct Vol: 0 0 0 0 0 0 0 0 0 0 0 0
Final Vol.: 0 231 0 1 191 0 0 0 0 1 0 0
Critical Gap Module:
Critical Gp: **** **** **** **** **** **** **** **** **** 6.2 **** ****
FollowUpTim: **** **** **** **** **** **** **** **** **** 3.3 **** ****
Capacity Module:
Cnflict Vol: **** **** **** **** **** **** **** **** **** 191 **** ****
Potent Cap.: **** **** **** **** **** **** **** **** **** 856 **** ****
Move Cap.: **** **** **** **** **** **** **** **** **** 856 **** ****
Volume/Cap: **** **** **** **** **** **** **** **** **** 0.00 **** ****
Level Of Service Module:
2Way95thQ: **** **** **** **** **** **** **** **** **** 0.0 **** ****
Control Del: **** **** **** **** **** **** **** **** **** 9.2 **** ****
LOS by Move: * * * * * * * * * A * *
Movement: LT LTR RT LT LTR RT LT LTR RT LT LTR RT
Shared Cap.: **** **** **** **** **** **** **** **** **** **** **** ****
SharedQueue: **** **** **** **** **** **** **** **** **** **** **** ****
Shrd ConDel: **** **** **** **** **** **** **** **** **** **** **** ****
Shared LOS: * * * * * * * * * * * *
ApproachDel: **** **** **** 9.2
ApproachLOS: * * * A
Note: Queue reported is the number of cars per lane.

Mon Feb 25 12:02:34 2019 Page 41
2024 Sunday Background TrafficVolumes
Traffix 8.0.0215 (c) 2008 Dowling Associates Licensed to ITS, SOUTH AFRICA
2024 Sunday Background Traffic Volumes
Level Of Service Computation Report2000 HCM Unsignalized Method (Base Volume Alternative)
Index #11: Highlands St & Back-of-House Access
Average Delay (sec/veh): 2.9 Worst Case Level Of Service: A[8.4]
Approach: North Bound South Bound East Bound West Bound
Movement: L T R L T R L T R L T R
Control: Stop Sign Stop Sign Uncontrolled Uncontrolled
Lefts Include Include Include Include
Lanes: 0 0 1! 0 0 1 0 0 0 0 0 0 1! 0 0 0 0 0 0 1
Volume Module: >> Count Date: 3 Feb 2019 <<
Base Vol: 0 0 0 19 0 0 0 0 0 0 0 35
Growth Adj: 1.00 1.00 1.00 1.00 1.00 1.00 1.00 1.00 1.00 1.00 1.00 1.00
Initial Base: 0 0 0 19 0 0 0 0 0 0 0 35
User Adj: 1.00 1.00 1.00 1.00 1.00 1.00 1.00 1.00 1.00 1.00 1.00 1.00
PHF Adj: 0.95 0.95 0.95 0.95 0.95 0.95 0.95 0.95 0.95 0.95 0.95 0.95
PHF Volume: 0 0 0 20 0 0 0 0 0 0 0 37
Reduct Vol: 0 0 0 0 0 0 0 0 0 0 0 0
Final Vol.: 0 0 0 20 0 0 0 0 0 0 0 37
Critical Gap Module:
Critical Gp: 6.2 6.5 7.1 6.2 **** **** **** **** **** **** **** 4.1
FollowUpTim: 3.3 4.0 3.5 3.3 **** **** **** **** **** **** **** 2.2
Capacity Module:
Cnflict Vol: 0 74 84 0 **** **** **** **** **** **** **** 0
Potent Cap.: 1091 820 908 1091 **** **** **** **** **** **** **** 1636
Move Cap.: 1091 802 876 1091 **** **** **** **** **** **** **** 1636
Volume/Cap: 0.00 0.00 0.00 0.02 **** **** **** **** **** **** **** 0.02
Level Of Service Module:
2Way95thQ: **** **** **** 0.1 **** **** **** **** **** **** **** 0.1
Control Del: **** **** **** 8.4 **** **** **** **** **** **** **** 7.3
LOS by Move: * * * A * * * * * * * A
Movement: LT LTR RT LT LTR RT LT LTR RT LT LTR RT
Shared Cap.: **** 0 **** **** **** **** **** **** **** **** **** ****
SharedQueue: **** **** **** **** **** **** **** **** **** **** **** ****
Shrd ConDel: **** **** **** **** **** **** **** **** **** **** **** ****
Shared LOS: * * * * * * * * * * * *
ApproachDel: **** 8.4 **** ****
ApproachLOS: * A * *
Note: Queue reported is the number of cars per lane.

Fri Feb 22 12:36:52 2019 Page 43
2024 Sunday Background TrafficVolumes
Traffix 8.0.0215 (c) 2008 Dowling Associates Licensed to ITS, SOUTH AFRICA
2024 Sunday Background Traffic Volumes
Level Of Service Computation Report2000 HCM Unsignalized Method (Base Volume Alternative)
Index #12: Charlton Access Rd & South Ln
Average Delay (sec/veh): 1.0 Worst Case Level Of Service: A[8.4]
Approach: North Bound South Bound East Bound West Bound
Movement: L T R L T R L T R L T R
Control: Uncontrolled Uncontrolled Stop Sign Stop Sign
Lefts Include Include Include Include
Lanes: 0 0 0 0 0 0 1 0 0 0 0 0 0 0 0 1 0 0 0 0
Volume Module:
Base Vol: 0 0 0 5 10 0 0 0 0 2 0 0
Growth Adj: 1.00 1.00 1.00 1.00 1.00 1.00 1.00 1.00 1.00 1.00 1.00 1.00
Initial Base: 0 0 0 5 10 0 0 0 0 2 0 0
User Adj: 1.00 1.00 1.00 1.00 1.00 1.00 1.00 1.00 1.00 1.00 1.00 1.00
PHF Adj: 1.00 1.00 1.00 1.00 1.00 1.00 1.00 1.00 1.00 1.00 1.00 1.00
PHF Volume: 0 0 0 5 10 0 0 0 0 2 0 0
Reduct Vol: 0 0 0 0 0 0 0 0 0 0 0 0
Final Vol.: 0 0 0 5 10 0 0 0 0 2 0 0
Critical Gap Module:
Critical Gp: **** **** **** **** **** **** **** **** **** 6.2 **** ****
FollowUpTim: **** **** **** **** **** **** **** **** **** 3.3 **** ****
Capacity Module:
Cnflict Vol: **** **** **** **** **** **** **** **** **** 13 **** ****
Potent Cap.: **** **** **** **** **** **** **** **** **** 1074 **** ****
Move Cap.: **** **** **** **** **** **** **** **** **** 1074 **** ****
Volume/Cap: **** **** **** **** **** **** **** **** **** 0.00 **** ****
Level Of Service Module:
2Way95thQ: **** **** **** **** **** **** **** **** **** 0.0 **** ****
Control Del: **** **** **** **** **** **** **** **** **** 8.4 **** ****
LOS by Move: * * * * * * * * * A * *
Movement: LT LTR RT LT LTR RT LT LTR RT LT LTR RT
Shared Cap.: **** **** **** **** **** **** **** **** **** **** **** ****
SharedQueue: **** **** **** **** **** **** **** **** **** **** **** ****
Shrd ConDel: **** **** **** **** **** **** **** **** **** **** **** ****
Shared LOS: * * * * * * * * * * * *
ApproachDel: **** **** **** 8.4
ApproachLOS: * * * A
Note: Queue reported is the number of cars per lane.

Fri Feb 22 12:36:52 2019 Page 47
2024 Sunday Background TrafficVolumes
Traffix 8.0.0215 (c) 2008 Dowling Associates Licensed to ITS, SOUTH AFRICA
2024 Sunday Background Traffic Volumes
Level Of Service Computation Report2000 HCM Unsignalized Method (Base Volume Alternative)
Index #14:
Average Delay (sec/veh): 0.0 Worst Case Level Of Service: A[0.0]
Approach: North Bound South Bound East Bound West Bound
Movement: L T R L T R L T R L T R
Control: Stop Sign Stop Sign Uncontrolled Uncontrolled
Lefts Include Include Include Include
Lanes: 0 0 0 0 0 0 0 0 0 0 0 0 1 0 0 0 0 1 0 0
Volume Module:
Base Vol: 0 0 0 0 0 0 0 23 0 0 33 0
Growth Adj: 1.00 1.00 1.00 1.00 1.00 1.00 1.00 1.00 1.00 1.00 1.00 1.00
Initial Base: 0 0 0 0 0 0 0 23 0 0 33 0
User Adj: 1.00 1.00 1.00 1.00 1.00 1.00 1.00 1.00 1.00 1.00 1.00 1.00
PHF Adj: 1.00 1.00 1.00 1.00 1.00 1.00 1.00 1.00 1.00 1.00 1.00 1.00
PHF Volume: 0 0 0 0 0 0 0 23 0 0 33 0
Reduct Vol: 0 0 0 0 0 0 0 0 0 0 0 0
Final Vol.: 0 0 0 0 0 0 0 23 0 0 33 0
Critical Gap Module:
Critical Gp: **** **** **** **** **** **** **** **** **** **** **** ****
FollowUpTim: **** **** **** **** **** **** **** **** **** **** **** ****
Capacity Module:
Cnflict Vol: **** **** **** **** **** **** **** **** **** **** **** ****
Potent Cap.: **** **** **** **** **** **** **** **** **** **** **** ****
Move Cap.: **** **** **** **** **** **** **** **** **** **** **** ****
Volume/Cap: **** **** **** **** **** **** **** **** **** **** **** ****
Level Of Service Module:
2Way95thQ: **** **** **** **** **** **** **** **** **** **** **** ****
Control Del: **** **** **** **** **** **** **** **** **** **** **** ****
LOS by Move: * * * * * * * * * * * *
Movement: LT LTR RT LT LTR RT LT LTR RT LT LTR RT
Shared Cap.: **** **** **** **** **** **** **** **** **** **** **** ****
SharedQueue: **** **** **** **** **** **** **** **** **** **** **** ****
Shrd ConDel: **** **** **** **** **** **** **** **** **** **** **** ****
Shared LOS: * * * * * * * * * * * *
ApproachDel: **** **** **** ****
ApproachLOS: * * * *
Note: Queue reported is the number of cars per lane.

TRAFFIC IMPACT STUDY YEOVILLE RCG CHURCH
2024 Thursday PM Background + Development Traffic Volumes

Fri Feb 22 12:37:34 2019 Page 2
2024 Thursday PM Total TrafficVolumes
Traffix 8.0.0215 (c) 2008 Dowling Associates Licensed to ITS, SOUTH AFRICA
2024 Thursday PM Total Traffic Volumes
Level Of Service Computation Report2000 HCM Unsignalized Method (Future Volume Alternative)
Index #1: Grafton St & Percy St
Average Delay (sec/veh): 4.8 Worst Case Level Of Service: A[8.9]
Approach: North Bound South Bound East Bound West Bound
Movement: L T R L T R L T R L T R
Control: Stop Sign Stop Sign Uncontrolled Uncontrolled
Lefts Include Include Include Include
Lanes: 0 0 0 0 0 0 0 1! 0 0 0 1 0 0 0 0 0 0 1 0
Volume Module: >> Count Date: 31 Jan 2019 <<
Base Vol: 0 0 0 65 0 16 23 5 0 0 3 38
Growth Adj: 1.00 1.00 1.00 1.00 1.00 1.00 1.00 1.00 1.00 1.00 1.00 1.00
Initial Base: 0 0 0 35 0 16 22 4 0 0 3 30
Added Vol: 0 0 0 30 0 0 1 1 0 0 0 8
PasserByVol: 0 0 0 0 0 0 0 0 0 0 0 0
Initial Fut: 0 0 0 65 0 16 23 5 0 0 3 38
User Adj: 1.00 1.00 1.00 1.00 1.00 1.00 1.00 1.00 1.00 1.00 1.00 1.00
PHF Adj: 0.89 0.89 0.89 0.89 0.89 0.89 0.89 0.89 0.89 0.89 0.89 0.89
PHF Volume: 0 0 0 73 0 18 26 6 0 0 3 43
Reduct Vol: 0 0 0 0 0 0 0 0 0 0 0 0
Final Vol.: 0 0 0 73 0 18 26 6 0 0 3 43
Critical Gap Module:
Critical Gp: **** **** **** 6.2 6.5 6.4 **** **** **** **** **** 4.1
FollowUpTim: **** **** **** 3.3 4.0 3.5 **** **** **** **** **** 2.2
Capacity Module:
Cnflict Vol: **** **** **** 19 107 107 **** **** **** **** **** 32
Potent Cap.: **** **** **** 1066 786 895 **** **** **** **** **** 1594
Move Cap.: **** **** **** 1066 765 876 **** **** **** **** **** 1594
Volume/Cap: **** **** **** 0.07 0.00 0.02 **** **** **** **** **** 0.03
Level Of Service Module:
2Way95thQ: **** **** **** **** **** **** **** **** **** **** **** 0.1
Control Del: **** **** **** **** **** **** **** **** **** **** **** 7.3
LOS by Move: * * * * * * * * * * * A
Movement: LT LTR RT LT LTR RT LT LTR RT LT LTR RT
Shared Cap.: **** **** **** **** 1022 **** **** **** **** **** **** 14
SharedQueue: **** **** **** **** 0.3 **** **** **** **** **** **** 0.1
Shrd ConDel: **** **** **** **** 8.9 **** **** **** **** **** **** 7.3
Shared LOS: * * * * A * * * * * * A
ApproachDel: **** 8.9 **** ****
ApproachLOS: * A * *
Note: Queue reported is the number of cars per lane.

Fri Feb 22 12:37:34 2019 Page 4
2024 Thursday PM Total TrafficVolumes
Traffix 8.0.0215 (c) 2008 Dowling Associates Licensed to ITS, SOUTH AFRICA
2024 Thursday PM Total Traffic Volumes
Level Of Service Computation Report2000 HCM Unsignalized Method (Future Volume Alternative)
Index #2: Percy St & Highlands St
Average Delay (sec/veh): 3.6 Worst Case Level Of Service: A[8.7]
Approach: North Bound South Bound East Bound West Bound
Movement: L T R L T R L T R L T R
Control: Stop Sign Stop Sign Uncontrolled Uncontrolled
Lefts Include Include Include Include
Lanes: 0 0 1! 0 0 0 0 0 0 0 0 0 0 1 0 0 1 0 0 0
Volume Module: >> Count Date: 3 Jan 2019 <<
Base Vol: 35 0 10 0 0 0 0 7 49 6 3 0
Growth Adj: 1.00 1.00 1.00 1.00 1.00 1.00 1.00 1.00 1.00 1.00 1.00 1.00
Initial Base: 29 0 9 0 0 0 0 7 25 1 3 0
Added Vol: 6 0 1 0 0 0 0 0 24 5 0 0
PasserByVol: 0 0 0 0 0 0 0 0 0 0 0 0
Initial Fut: 35 0 10 0 0 0 0 7 49 6 3 0
User Adj: 1.00 1.00 1.00 1.00 1.00 1.00 1.00 1.00 1.00 1.00 1.00 1.00
PHF Adj: 0.93 0.93 0.93 0.93 0.93 0.93 0.93 0.93 0.93 0.93 0.93 0.93
PHF Volume: 38 0 11 0 0 0 0 8 53 6 3 0
Reduct Vol: 0 0 0 0 0 0 0 0 0 0 0 0
Final Vol.: 38 0 11 0 0 0 0 8 53 6 3 0
Critical Gap Module:
Critical Gp: 6.2 6.5 6.4 **** **** **** **** **** 4.1 **** **** ****
FollowUpTim: 3.3 4.0 3.5 **** **** **** **** **** 2.2 **** **** ****
Capacity Module:
Cnflict Vol: 6 119 119 **** **** **** **** **** 10 **** **** ****
Potent Cap.: 1082 775 881 **** **** **** **** **** 1623 **** **** ****
Move Cap.: 1082 749 859 **** **** **** **** **** 1623 **** **** ****
Volume/Cap: 0.03 0.00 0.01 **** **** **** **** **** 0.03 **** **** ****
Level Of Service Module:
2Way95thQ: **** **** **** **** **** **** **** **** 0.1 **** **** ****
Control Del: **** **** **** **** **** **** **** **** 7.3 **** **** ****
LOS by Move: * * * * * * * * A * * *
Movement: LT LTR RT LT LTR RT LT LTR RT LT LTR RT
Shared Cap.: **** 1023 **** **** **** **** **** **** 8 **** **** ****
SharedQueue: **** 0.1 **** **** **** **** **** **** 0.1 **** **** ****
Shrd ConDel: **** 8.7 **** **** **** **** **** **** 7.3 **** **** ****
Shared LOS: * A * * * * * * A * * *
ApproachDel: 8.7 **** **** ****
ApproachLOS: A * * *
Note: Queue reported is the number of cars per lane.

Fri Feb 22 12:37:34 2019 Page 7
2024 Thursday PM Total TrafficVolumes
Traffix 8.0.0215 (c) 2008 Dowling Associates Licensed to ITS, SOUTH AFRICA
2024 Thursday PM Total Traffic Volumes
Level Of Service Computation Report2000 HCM Unsignalized Method (Future Volume Alternative)
Index #3: Harley St & Cavendish Rd
Average Delay (sec/veh): 3.0 Worst Case Level Of Service: C[16.5]
Approach: North Bound South Bound East Bound West Bound
Movement: L T R L T R L T R L T R
Control: Stop Sign Stop Sign Uncontrolled Uncontrolled
Lefts Include Include Include Include
Lanes: 0 0 0 0 0 0 0 1! 0 0 0 1 0 0 0 0 0 0 1 0
Volume Module: >> Count Date: 3 Jan 2019 <<
Base Vol: 0 0 0 6 0 133 94 282 0 0 235 7
Growth Adj: 1.00 1.00 1.00 1.00 1.00 1.00 1.00 1.00 1.00 1.00 1.00 1.00
Initial Base: 0 0 0 6 0 128 93 282 0 0 232 7
Added Vol: 0 0 0 0 0 5 1 0 0 0 3 0
PasserByVol: 0 0 0 0 0 0 0 0 0 0 0 0
Initial Fut: 0 0 0 6 0 133 94 282 0 0 235 7
User Adj: 1.00 1.00 1.00 1.00 1.00 1.00 1.00 1.00 1.00 1.00 1.00 1.00
PHF Adj: 0.93 0.93 0.93 0.93 0.93 0.93 0.93 0.93 0.93 0.93 0.93 0.93
PHF Volume: 0 0 0 6 0 142 101 302 0 0 252 7
Reduct Vol: 0 0 0 0 0 0 0 0 0 0 0 0
Final Vol.: 0 0 0 6 0 142 101 302 0 0 252 7
Critical Gap Module:
Critical Gp: **** **** **** 6.2 6.5 6.4 **** **** **** **** **** 4.1
FollowUpTim: **** **** **** 3.3 4.0 3.5 **** **** **** **** **** 2.2
Capacity Module:
Cnflict Vol: **** **** **** 352 619 619 **** **** **** **** **** 403
Potent Cap.: **** **** **** 696 407 456 **** **** **** **** **** 1167
Move Cap.: **** **** **** 696 405 453 **** **** **** **** **** 1167
Volume/Cap: **** **** **** 0.01 0.00 0.31 **** **** **** **** **** 0.01
Level Of Service Module:
2Way95thQ: **** **** **** **** **** **** **** **** **** **** **** 0.0
Control Del: **** **** **** **** **** **** **** **** **** **** **** 8.1
LOS by Move: * * * * * * * * * * * A
Movement: LT LTR RT LT LTR RT LT LTR RT LT LTR RT
Shared Cap.: **** **** **** **** 460 **** **** **** **** **** **** 1
SharedQueue: **** **** **** **** 1.4 **** **** **** **** **** **** 0.0
Shrd ConDel: **** **** **** **** 16.5 **** **** **** **** **** **** 8.1
Shared LOS: * * * * C * * * * * * A
ApproachDel: **** 16.5 **** ****
ApproachLOS: * C * *
Note: Queue reported is the number of cars per lane.

Fri Feb 22 12:37:34 2019 Page 11
2024 Thursday PM Total TrafficVolumes
Traffix 8.0.0215 (c) 2008 Dowling Associates Licensed to ITS, SOUTH AFRICA
2024 Thursday PM Total Traffic Volumes
Level Of Service Computation Report2000 HCM Unsignalized Method (Future Volume Alternative)
Index #4: Bezuidenhout St & Durban Rd
Average Delay (sec/veh): 5.8 Worst Case Level Of Service: B[12.0]
Approach: North Bound South Bound East Bound West Bound
Movement: L T R L T R L T R L T R
Control: Stop Sign Stop Sign Uncontrolled Uncontrolled
Lefts Include Include Include Include
Lanes: 1 0 1 0 0 0 0 0 1 0 0 0 1! 0 0 0 0 0 0 0
Volume Module: >> Count Date: 3 Jan 2019 <<
Base Vol: 6 18 0 0 26 227 281 0 4 0 0 0
Growth Adj: 1.00 1.00 1.00 1.00 1.00 1.00 1.00 1.00 1.00 1.00 1.00 1.00
Initial Base: 6 17 0 0 21 224 281 0 4 0 0 0
Added Vol: 0 1 0 0 5 3 0 0 0 0 0 0
PasserByVol: 0 0 0 0 0 0 0 0 0 0 0 0
Initial Fut: 6 18 0 0 26 227 281 0 4 0 0 0
User Adj: 1.00 1.00 1.00 1.00 1.00 1.00 1.00 1.00 1.00 1.00 1.00 1.00
PHF Adj: 0.96 0.96 0.96 0.96 0.96 0.96 0.96 0.96 0.96 0.96 0.96 0.96
PHF Volume: 6 19 0 0 27 236 292 0 4 0 0 0
Reduct Vol: 0 0 0 0 0 0 0 0 0 0 0 0
Final Vol.: 6 19 0 0 27 236 292 0 4 0 0 0
Critical Gap Module:
Critical Gp: 6.2 6.5 **** **** 6.5 7.1 **** **** 4.1 **** **** ****
FollowUpTim: 3.3 4.0 **** **** 4.0 3.5 **** **** 2.2 **** **** ****
Capacity Module:
Cnflict Vol: 0 300 **** **** 154 164 **** **** 0 **** **** ****
Potent Cap.: 1091 616 **** **** 741 806 **** **** 1636 **** **** ****
Move Cap.: 1091 614 **** **** 739 781 **** **** 1636 **** **** ****
Volume/Cap: 0.01 0.03 **** **** 0.04 0.30 **** **** 0.00 **** **** ****
Level Of Service Module:
2Way95thQ: 0.0 0.1 **** **** **** **** **** **** 0.0 **** **** ****
Control Del: 8.3 11.0 **** **** **** **** **** **** 7.2 **** **** ****
LOS by Move: A B * * * * * * A * * *
Movement: LT LTR RT LT LTR RT LT LTR RT LT LTR RT
Shared Cap.: **** **** **** **** **** 776 **** **** **** **** **** ****
SharedQueue: **** **** **** **** **** 1.5 **** **** **** **** **** ****
Shrd ConDel: **** **** **** **** **** 12.0 **** **** **** **** **** ****
Shared LOS: * * * * * B * * * * * *
ApproachDel: 10.4 12.0 **** ****
ApproachLOS: B B * *
Note: Queue reported is the number of cars per lane.

Fri Feb 22 12:37:34 2019 Page 15
2024 Thursday PM Total TrafficVolumes
Traffix 8.0.0215 (c) 2008 Dowling Associates Licensed to ITS, SOUTH AFRICA
2024 Thursday PM Total Traffic Volumes
Level Of Service Computation Report2000 HCM Unsignalized Method (Future Volume Alternative)
Index #5: Grafton Rd & Hendon St
Average Delay (sec/veh): 1.5 Worst Case Level Of Service: D[27.0]
Approach: North Bound South Bound East Bound West Bound
Movement: L T R L T R L T R L T R
Control: Stop Sign Stop Sign Uncontrolled Uncontrolled
Lefts Include Include Include Include
Lanes: 0 0 1! 0 0 0 0 0 1 0 0 0 1! 0 0 0 0 1! 0 0
Volume Module: >> Count Date: 3 Jan 2019 <<
Base Vol: 48 8 2 0 10 34 63 453 83 5 522 5
Growth Adj: 1.00 1.00 1.00 1.00 1.00 1.00 1.00 1.00 1.00 1.00 1.00 1.00
Initial Base: 40 7 2 0 7 31 63 453 56 5 513 5
Added Vol: 8 1 0 0 3 3 0 0 27 0 9 0
PasserByVol: 0 0 0 0 0 0 0 0 0 0 0 0
Initial Fut: 48 8 2 0 10 34 63 453 83 5 522 5
User Adj: 1.00 1.00 1.00 1.00 1.00 1.00 1.00 1.00 1.00 1.00 1.00 1.00
PHF Adj: 0.92 0.92 0.92 0.92 0.92 0.92 0.92 0.92 0.92 0.92 0.92 0.92
PHF Volume: 52 9 2 0 11 37 68 491 90 5 566 5
Reduct Vol: 0 0 0 0 0 0 0 0 0 0 0 0
Final Vol.: 52 9 2 0 11 37 68 491 90 5 566 5
Critical Gap Module:
Critical Gp: 5.3 5.4 5.5 **** 5.4 5.5 **** **** 3.5 **** **** 3.5
FollowUpTim: 2.3 2.6 3.1 **** 2.6 3.1 **** **** 2.1 **** **** 2.1
Capacity Module:
Cnflict Vol: 438 1294 1291 **** 1258 1290 **** **** 572 **** **** 560
Potent Cap.: 826 268 268 **** 280 235 **** **** 1157 **** **** 1166
Move Cap.: 826 245 242 **** 256 200 **** **** 1157 **** **** 1166
Volume/Cap: 0.06 0.04 0.01 **** 0.04 0.18 **** **** 0.08 **** **** 0.00
Level Of Service Module:
2Way95thQ: **** **** **** **** **** **** **** **** 0.3 **** **** 0.0
Control Del: **** **** **** **** **** **** **** **** 8.4 **** **** 8.1
LOS by Move: * * * * * * * * A * * A
Movement: LT LTR RT LT LTR RT LT LTR RT LT LTR RT
Shared Cap.: **** 586 **** **** **** 211 **** **** **** **** **** ****
SharedQueue: **** 0.4 **** **** **** 0.8 **** **** **** **** **** ****
Shrd ConDel: **** 11.9 **** **** **** 27.0 **** **** **** **** **** ****
Shared LOS: * B * * * D * * * * * *
ApproachDel: 11.9 27.0 **** ****
ApproachLOS: B D * *
Note: Queue reported is the number of cars per lane.

Fri Feb 22 12:37:34 2019 Page 24
2024 Thursday PM Total TrafficVolumes
Traffix 8.0.0215 (c) 2008 Dowling Associates Licensed to ITS, SOUTH AFRICA
2024 Thursday PM Total Traffic Volumes
Level Of Service Computation Report2000 HCM Operations Method (Future Volume Alternative)
Index #6: Joe Slovo Dr & Hendon St
Cycle (sec): 110 Critical Vol./Cap.(X): 1.192
Loss Time (sec): 15 Average Delay (sec/veh): 72.9
Optimal Cycle: 180 Level Of Service: E
Approach: North Bound South Bound East Bound West Bound
Movement: L T R L T R L T R L T R
Control: Protected+Permitted Protected+Permitted Permitted Permitted
Lefts Include Include Include Ovl
Min. Green: 0 0 0 0 0 0 0 0 0 0 0 0
Y+R: 5.0 5.0 5.0 5.0 5.0 5.0 5.0 5.0 5.0 5.0 5.0 5.0
Lanes: 0 1 2 0 2 1 1 1 0 1 1 0 1 1 1 0 1 0 0 1
Volume Module: >> Count Date: 3 Jan 2019 <<
Base Vol: 285 1112 303 59 1937 92 158 242 257 380 247 15
Growth Adj: 1.00 1.08 1.00 1.00 1.08 1.00 1.00 1.00 1.00 1.00 1.00 1.00
Initial Base: 285 1198 295 45 2076 92 158 236 252 366 245 11
Added Vol: 0 0 8 14 10 0 0 6 5 14 2 4
PasserByVol: 0 0 0 0 0 0 0 0 0 0 0 0
Initial Fut: 285 1198 303 59 2086 92 158 242 257 380 247 15
User Adj: 1.00 1.00 1.00 1.00 1.00 1.00 1.00 1.00 1.00 1.00 1.00 1.00
PHF Adj: 0.99 0.99 0.99 0.99 0.99 0.99 0.99 0.99 0.99 0.99 0.99 0.99
PHF Volume: 287 1207 305 59 2101 93 159 244 259 383 249 15
Reduct Vol: 0 0 0 0 0 0 0 0 0 0 0 0
Reduced Vol: 287 1207 305 59 2101 93 159 244 259 383 249 15
PCE Adj: 1.00 1.00 1.00 1.00 1.00 1.00 1.00 1.00 1.00 1.00 1.00 1.00
MLF Adj: 1.00 1.00 1.00 1.00 1.00 1.00 1.00 1.00 1.00 1.00 1.00 1.00
Final Vol.: 287 1207 305 59 2101 93 159 244 259 383 249 15
Saturation Flow Module:
Sat/Lane: 1900 1900 1900 1900 1900 1900 1900 1900 1900 1900 1900 1900
Adjustment: 0.88 0.88 0.74 0.95 0.95 0.95 0.85 0.55 0.55 0.91 0.91 0.59
Lanes: 0.58 2.42 2.00 1.00 2.00 1.00 1.00 1.45 1.55 0.61 0.39 1.00
Final Sat.: 968 4069 2816 1798 3596 1805 1615 1515 1609 1047 680 1121
Capacity Analysis Module:
Vol/Sat: 0.30 0.30 0.11 0.03 0.58 0.05 0.10 0.16 0.16 0.37 0.37 0.01
Crit Moves: **** **** ****
Green/Cycle: 0.48 0.48 0.56 0.48 0.48 0.61 0.30 0.30 0.30 0.38 0.30 0.30
Green/Cycle: 0.48 0.48 0.08 0.48 0.48 0.08 0.30 0.30 0.30 0.38 0.30 0.30
Volume/Cap: 0.62 0.62 0.27 0.07 1.21 0.37 0.33 0.53 0.53 0.96 1.21 0.04
Level Of Service Module:
Uniform Del: 21.2 21.2 11.9 15.2 28.5 12.4 29.7 31.9 31.9 33.2 38.4 27.2
IncremntDel: 0.5 0.5 0.1 0.0 100.6 0.9 0.4 0.6 0.6 25.3 111.9 0.1
InitQueuDel: 0.0 0.0 0.0 0.0 0.0 0.0 0.0 0.0 0.0 0.0 0.0 0.0
Delay Adj: 1.00 1.00 1.00 1.00 1.00 1.00 1.00 1.00 1.00 1.00 1.00 1.00
Delay/Veh: 21.7 21.7 12.0 15.2 129.1 13.3 30.1 32.5 32.5 58.5 150.3 27.2
User DelAdj: 1.00 1.00 1.00 1.00 1.00 1.00 1.00 1.00 1.00 1.00 1.00 1.00
AdjDel/Veh: 21.7 21.7 12.0 15.2 129.1 13.3 30.1 32.5 32.5 58.5 150.3 27.2
LOS by Move: C C B B F B C C C E F C
HCM2kAvgQ: 14.0 14.0 3.1 1.1 62.7 2.0 4.2 5.6 5.6 26.2 37.4 0.4
Note: Queue reported is the number of cars per lane.

Fri Feb 22 12:37:34 2019 Page 33
2024 Thursday PM Total TrafficVolumes
Traffix 8.0.0215 (c) 2008 Dowling Associates Licensed to ITS, SOUTH AFRICA
2024 Thursday PM Total Traffic Volumes
Level Of Service Computation Report2000 HCM Unsignalized Method (Future Volume Alternative)
Index #7: Fortesque Rd & Hendon St
Average Delay (sec/veh): 2.9 Worst Case Level Of Service: C[23.8]
Approach: North Bound South Bound East Bound West Bound
Movement: L T R L T R L T R L T R
Control: Stop Sign Stop Sign Uncontrolled Uncontrolled
Lefts Include Include Include Include
Lanes: 0 0 0 0 0 0 0 1! 0 0 0 1 0 0 0 0 0 0 1 0
Volume Module: >> Count Date: 3 Jan 2019 <<
Base Vol: 0 0 0 6 0 114 44 392 0 0 422 4
Growth Adj: 1.00 1.00 1.00 1.00 1.00 1.00 1.00 1.00 1.00 1.00 1.00 1.00
Initial Base: 0 0 0 3 0 111 44 392 0 0 416 3
Added Vol: 0 0 0 3 0 3 0 0 0 0 6 1
PasserByVol: 0 0 0 0 0 0 0 0 0 0 0 0
Initial Fut: 0 0 0 6 0 114 44 392 0 0 422 4
User Adj: 1.00 1.00 1.00 1.00 1.00 1.00 1.00 1.00 1.00 1.00 1.00 1.00
PHF Adj: 0.94 0.94 0.94 0.94 0.94 0.94 0.94 0.94 0.94 0.94 0.94 0.94
PHF Volume: 0 0 0 6 0 121 47 416 0 0 448 4
Reduct Vol: 0 0 0 0 0 0 0 0 0 0 0 0
Final Vol.: 0 0 0 6 0 121 47 416 0 0 448 4
Critical Gap Module:
Critical Gp: **** **** **** 6.2 6.5 6.4 **** **** **** **** **** 4.1
FollowUpTim: **** **** **** 3.3 4.0 3.5 **** **** **** **** **** 2.2
Capacity Module:
Cnflict Vol: **** **** **** 339 838 838 **** **** **** **** **** 462
Potent Cap.: **** **** **** 647 278 310 **** **** **** **** **** 1109
Move Cap.: **** **** **** 647 277 309 **** **** **** **** **** 1109
Volume/Cap: **** **** **** 0.01 0.00 0.39 **** **** **** **** **** 0.00
Level Of Service Module:
2Way95thQ: **** **** **** **** **** **** **** **** **** **** **** 0.0
Control Del: **** **** **** **** **** **** **** **** **** **** **** 8.3
LOS by Move: * * * * * * * * * * * A
Movement: LT LTR RT LT LTR RT LT LTR RT LT LTR RT
Shared Cap.: **** **** **** **** 317 **** **** **** **** **** **** 1
SharedQueue: **** **** **** **** 1.9 **** **** **** **** **** **** 0.0
Shrd ConDel: **** **** **** **** 23.8 **** **** **** **** **** **** 8.3
Shared LOS: * * * * C * * * * * * A
ApproachDel: **** 23.8 **** ****
ApproachLOS: * C * *
Note: Queue reported is the number of cars per lane.

Fri Feb 22 12:37:34 2019 Page 37
2024 Thursday PM Total TrafficVolumes
Traffix 8.0.0215 (c) 2008 Dowling Associates Licensed to ITS, SOUTH AFRICA
2024 Thursday PM Total Traffic Volumes
Level Of Service Computation Report2000 HCM Unsignalized Method (Future Volume Alternative)
Index #8: Hendon St & Percy St
Average Delay (sec/veh): 0.3 Worst Case Level Of Service: C[15.9]
Approach: North Bound South Bound East Bound West Bound
Movement: L T R L T R L T R L T R
Control: Stop Sign Stop Sign Uncontrolled Uncontrolled
Lefts Include Include Include Include
Lanes: 0 0 1! 0 0 0 0 0 0 0 0 0 0 1 0 0 1 0 0 0
Volume Module: >> Count Date: 3 Jan 2019 <<
Base Vol: 7 0 11 0 0 0 0 500 6 4 419 0
Growth Adj: 1.00 1.00 1.00 1.00 1.00 1.00 1.00 1.00 1.00 1.00 1.00 1.00
Initial Base: 6 0 10 0 0 0 0 500 3 1 413 0
Added Vol: 1 0 1 0 0 0 0 0 3 3 6 0
PasserByVol: 0 0 0 0 0 0 0 0 0 0 0 0
Initial Fut: 7 0 11 0 0 0 0 500 6 4 419 0
User Adj: 1.00 1.00 1.00 1.00 1.00 1.00 1.00 1.00 1.00 1.00 1.00 1.00
PHF Adj: 0.94 0.94 0.94 0.94 0.94 0.94 0.94 0.94 0.94 0.94 0.94 0.94
PHF Volume: 7 0 12 0 0 0 0 530 6 4 444 0
Reduct Vol: 0 0 0 0 0 0 0 0 0 0 0 0
Final Vol.: 7 0 12 0 0 0 0 530 6 4 444 0
Critical Gap Module:
Critical Gp: 6.2 6.5 6.4 **** **** **** **** **** 4.1 **** **** ****
FollowUpTim: 3.3 4.0 3.5 **** **** **** **** **** 2.2 **** **** ****
Capacity Module:
Cnflict Vol: 446 990 990 **** **** **** **** **** 449 **** **** ****
Potent Cap.: 616 249 276 **** **** **** **** **** 1122 **** **** ****
Move Cap.: 616 247 275 **** **** **** **** **** 1122 **** **** ****
Volume/Cap: 0.01 0.00 0.04 **** **** **** **** **** 0.01 **** **** ****
Level Of Service Module:
2Way95thQ: **** **** **** **** **** **** **** **** 0.0 **** **** ****
Control Del: **** **** **** **** **** **** **** **** 8.2 **** **** ****
LOS by Move: * * * * * * * * A * * *
Movement: LT LTR RT LT LTR RT LT LTR RT LT LTR RT
Shared Cap.: **** 350 **** **** **** **** **** **** 1 **** **** ****
SharedQueue: **** 0.2 **** **** **** **** **** **** 0.0 **** **** ****
Shrd ConDel: **** 15.9 **** **** **** **** **** **** 8.2 **** **** ****
Shared LOS: * C * * * * * * A * * *
ApproachDel: 15.9 **** **** ****
ApproachLOS: C * * *
Note: Queue reported is the number of cars per lane.

Fri Feb 22 12:37:34 2019 Page 40
2024 Thursday PM Total TrafficVolumes
Traffix 8.0.0215 (c) 2008 Dowling Associates Licensed to ITS, SOUTH AFRICA
2024 Thursday PM Total Traffic Volumes
Level Of Service Computation Report2000 HCM Unsignalized Method (Future Volume Alternative)
Index #9: Bezuidenhout St & Paddock St
Average Delay (sec/veh): 0.1 Worst Case Level Of Service: B[10.6]
Approach: North Bound South Bound East Bound West Bound
Movement: L T R L T R L T R L T R
Control: Uncontrolled Uncontrolled Stop Sign Stop Sign
Lefts Include Include Include Include
Lanes: 0 0 0 1 0 0 1 0 0 0 0 0 0 0 0 0 0 1! 0 0
Volume Module: >> Count Date: 3 Jan 2019 <<
Base Vol: 0 299 1 1 252 0 0 0 0 2 0 1
Growth Adj: 1.00 1.00 1.00 1.00 1.00 1.00 1.00 1.00 1.00 1.00 1.00 1.00
Initial Base: 0 298 1 1 245 0 0 0 0 1 0 1
Added Vol: 0 1 0 0 7 0 0 0 0 1 0 0
PasserByVol: 0 0 0 0 0 0 0 0 0 0 0 0
Initial Fut: 0 299 1 1 252 0 0 0 0 2 0 1
User Adj: 1.00 1.00 1.00 1.00 1.00 1.00 1.00 1.00 1.00 1.00 1.00 1.00
PHF Adj: 0.96 0.96 0.96 0.96 0.96 0.96 0.96 0.96 0.96 0.96 0.96 0.96
PHF Volume: 0 311 1 1 262 0 0 0 0 2 0 1
Reduct Vol: 0 0 0 0 0 0 0 0 0 0 0 0
Final Vol.: 0 311 1 1 262 0 0 0 0 2 0 1
Critical Gap Module:
Critical Gp: **** **** 4.1 **** **** **** **** **** **** 6.2 6.5 6.4
FollowUpTim: **** **** 2.2 **** **** **** **** **** **** 3.3 4.0 3.5
Capacity Module:
Cnflict Vol: **** **** 263 **** **** **** **** **** **** 262 575 575
Potent Cap.: **** **** 1313 **** **** **** **** **** **** 781 431 483
Move Cap.: **** **** 1313 **** **** **** **** **** **** 781 431 483
Volume/Cap: **** **** 0.00 **** **** **** **** **** **** 0.00 0.00 0.00
Level Of Service Module:
2Way95thQ: **** **** 0.0 **** **** **** **** **** **** **** **** ****
Control Del: **** **** 7.7 **** **** **** **** **** **** **** **** ****
LOS by Move: * * A * * * * * * * * *
Movement: LT LTR RT LT LTR RT LT LTR RT LT LTR RT
Shared Cap.: **** **** 1 **** **** **** **** **** **** **** 648 ****
SharedQueue: **** **** 0.0 **** **** **** **** **** **** **** 0.0 ****
Shrd ConDel: **** **** 7.7 **** **** **** **** **** **** **** 10.6 ****
Shared LOS: * * A * * * * * * * B *
ApproachDel: **** **** **** 10.6
ApproachLOS: * * * B
Note: Queue reported is the number of cars per lane.

Mon Feb 25 12:03:15 2019 Page 42
2024 Thursday PM Total TrafficVolumes
Traffix 8.0.0215 (c) 2008 Dowling Associates Licensed to ITS, SOUTH AFRICA
2024 Thursday PM Total Traffic Volumes
Level Of Service Computation Report2000 HCM Unsignalized Method (Future Volume Alternative)
Index #11: Highlands St & Back-of-House Access
Average Delay (sec/veh): 5.3 Worst Case Level Of Service: A[9.6]
Approach: North Bound South Bound East Bound West Bound
Movement: L T R L T R L T R L T R
Control: Stop Sign Stop Sign Uncontrolled Uncontrolled
Lefts Include Include Include Include
Lanes: 0 0 0 1 0 0 0 1! 0 0 1 0 0 0 0 0 0 1! 0 0
Volume Module: >> Count Date: 3 Jan 2019 <<
Base Vol: 0 6 1 26 22 7 2 0 0 5 0 40
Growth Adj: 1.00 1.00 1.00 1.00 1.00 1.00 1.00 1.00 1.00 1.00 1.00 1.00
Initial Base: 0 0 0 26 0 0 0 0 0 0 0 40
Added Vol: 0 6 1 0 22 7 2 0 0 5 0 0
PasserByVol: 0 0 0 0 0 0 0 0 0 0 0 0
Initial Fut: 0 6 1 26 22 7 2 0 0 5 0 40
User Adj: 1.00 1.00 1.00 1.00 1.00 1.00 1.00 1.00 1.00 1.00 1.00 1.00
PHF Adj: 0.93 0.93 0.93 0.93 0.93 0.93 0.93 0.93 0.93 0.93 0.93 0.93
PHF Volume: 0 6 1 28 24 8 2 0 0 5 0 43
Reduct Vol: 0 0 0 0 0 0 0 0 0 0 0 0
Final Vol.: 0 6 1 28 24 8 2 0 0 5 0 43
Critical Gap Module:
Critical Gp: **** 6.5 7.1 6.2 6.5 7.1 **** **** **** **** **** 4.1
FollowUpTim: **** 4.0 3.5 3.3 4.0 3.5 **** **** **** **** **** 2.2
Capacity Module:
Cnflict Vol: **** 91 100 0 91 92 **** **** **** **** **** 2
Potent Cap.: **** 803 886 1091 803 897 **** **** **** **** **** 1633
Move Cap.: **** 782 826 1091 781 873 **** **** **** **** **** 1633
Volume/Cap: **** 0.01 0.00 0.03 0.03 0.01 **** **** **** **** **** 0.03
Level Of Service Module:
2Way95thQ: **** **** **** **** **** **** **** **** **** **** **** 0.1
Control Del: **** **** **** **** **** **** **** **** **** **** **** 7.3
LOS by Move: * * * * * * * * * * * A
Movement: LT LTR RT LT LTR RT LT LTR RT LT LTR RT
Shared Cap.: **** **** 788 **** 916 **** **** **** **** **** **** ****
SharedQueue: **** **** 0.0 **** 0.2 **** **** **** **** **** **** ****
Shrd ConDel: **** **** 9.6 **** 9.2 **** **** **** **** **** **** ****
Shared LOS: * * A * A * * * * * * *
ApproachDel: 9.6 9.2 **** ****
ApproachLOS: A A * *
Note: Queue reported is the number of cars per lane.

Fri Feb 22 12:37:34 2019 Page 45
2024 Thursday PM Total TrafficVolumes
Traffix 8.0.0215 (c) 2008 Dowling Associates Licensed to ITS, SOUTH AFRICA
2024 Thursday PM Total Traffic Volumes
Level Of Service Computation Report2000 HCM Unsignalized Method (Future Volume Alternative)
Index #12: Charlton Access Rd & South Ln
Average Delay (sec/veh): 1.5 Worst Case Level Of Service: A[8.5]
Approach: North Bound South Bound East Bound West Bound
Movement: L T R L T R L T R L T R
Control: Uncontrolled Uncontrolled Stop Sign Stop Sign
Lefts Include Include Include Include
Lanes: 0 0 0 0 0 0 1 0 0 0 0 0 0 0 0 1 0 0 0 0
Volume Module: >> Count Date: 3 Jan 2019 <<
Base Vol: 0 0 0 37 20 0 0 0 0 12 0 0
Growth Adj: 1.00 1.00 1.00 1.00 1.00 1.00 1.00 1.00 1.00 1.00 1.00 1.00
Initial Base: 0 0 0 10 20 0 0 0 0 5 0 0
Added Vol: 0 0 0 27 0 0 0 0 0 7 0 0
PasserByVol: 0 0 0 0 0 0 0 0 0 0 0 0
Initial Fut: 0 0 0 37 20 0 0 0 0 12 0 0
User Adj: 1.00 1.00 1.00 1.00 1.00 1.00 1.00 1.00 1.00 1.00 1.00 1.00
PHF Adj: 0.89 0.89 0.89 0.89 0.89 0.89 0.89 0.89 0.89 0.89 0.89 0.89
PHF Volume: 0 0 0 42 23 0 0 0 0 14 0 0
Reduct Vol: 0 0 0 0 0 0 0 0 0 0 0 0
Final Vol.: 0 0 0 42 23 0 0 0 0 14 0 0
Critical Gap Module:
Critical Gp: **** **** **** **** **** **** **** **** **** 6.2 **** ****
FollowUpTim: **** **** **** **** **** **** **** **** **** 3.3 **** ****
Capacity Module:
Cnflict Vol: **** **** **** **** **** **** **** **** **** 43 **** ****
Potent Cap.: **** **** **** **** **** **** **** **** **** 1033 **** ****
Move Cap.: **** **** **** **** **** **** **** **** **** 1033 **** ****
Volume/Cap: **** **** **** **** **** **** **** **** **** 0.01 **** ****
Level Of Service Module:
2Way95thQ: **** **** **** **** **** **** **** **** **** 0.0 **** ****
Control Del: **** **** **** **** **** **** **** **** **** 8.5 **** ****
LOS by Move: * * * * * * * * * A * *
Movement: LT LTR RT LT LTR RT LT LTR RT LT LTR RT
Shared Cap.: **** **** **** **** **** **** **** **** **** **** **** ****
SharedQueue: **** **** **** **** **** **** **** **** **** **** **** ****
Shrd ConDel: **** **** **** **** **** **** **** **** **** **** **** ****
Shared LOS: * * * * * * * * * * * *
ApproachDel: **** **** **** 8.5
ApproachLOS: * * * A
Note: Queue reported is the number of cars per lane.

Fri Feb 22 12:37:34 2019 Page 47
2024 Thursday PM Total TrafficVolumes
Traffix 8.0.0215 (c) 2008 Dowling Associates Licensed to ITS, SOUTH AFRICA
2024 Thursday PM Total Traffic Volumes
Level Of Service Computation Report2000 HCM Unsignalized Method (Future Volume Alternative)
Index #14:
Average Delay (sec/veh): 0.4 Worst Case Level Of Service: A[8.3]
Approach: North Bound South Bound East Bound West Bound
Movement: L T R L T R L T R L T R
Control: Stop Sign Stop Sign Uncontrolled Uncontrolled
Lefts Include Include Include Include
Lanes: 1 0 0 0 0 0 0 0 0 0 0 0 0 1 0 0 0 1 0 0
Volume Module:
Base Vol: 2 0 0 0 0 0 0 24 7 0 6 0
Growth Adj: 1.00 1.00 1.00 1.00 1.00 1.00 1.00 1.00 1.00 1.00 1.00 1.00
Initial Base: 0 0 0 0 0 0 0 0 0 0 0 0
Added Vol: 2 0 0 0 0 0 0 24 7 0 6 0
PasserByVol: 0 0 0 0 0 0 0 0 0 0 0 0
Initial Fut: 2 0 0 0 0 0 0 24 7 0 6 0
User Adj: 1.00 1.00 1.00 1.00 1.00 1.00 1.00 1.00 1.00 1.00 1.00 1.00
PHF Adj: 1.00 1.00 1.00 1.00 1.00 1.00 1.00 1.00 1.00 1.00 1.00 1.00
PHF Volume: 2 0 0 0 0 0 0 24 7 0 6 0
Reduct Vol: 0 0 0 0 0 0 0 0 0 0 0 0
Final Vol.: 2 0 0 0 0 0 0 24 7 0 6 0
Critical Gap Module:
Critical Gp: 6.2 **** **** **** **** **** **** **** 4.1 **** **** ****
FollowUpTim: 3.3 **** **** **** **** **** **** **** 2.2 **** **** ****
Capacity Module:
Cnflict Vol: 6 **** **** **** **** **** **** **** 6 **** **** ****
Potent Cap.: 1083 **** **** **** **** **** **** **** 1628 **** **** ****
Move Cap.: 1083 **** **** **** **** **** **** **** 1628 **** **** ****
Volume/Cap: 0.00 **** **** **** **** **** **** **** 0.00 **** **** ****
Level Of Service Module:
2Way95thQ: 0.0 **** **** **** **** **** **** **** 0.0 **** **** ****
Control Del: 8.3 **** **** **** **** **** **** **** 7.2 **** **** ****
LOS by Move: A * * * * * * * A * * *
Movement: LT LTR RT LT LTR RT LT LTR RT LT LTR RT
Shared Cap.: **** **** **** **** **** **** **** **** 1 **** **** ****
SharedQueue: **** **** **** **** **** **** **** **** 0.0 **** **** ****
Shrd ConDel: **** **** **** **** **** **** **** **** 7.2 **** **** ****
Shared LOS: * * * * * * * * A * * *
ApproachDel: 8.3 **** **** ****
ApproachLOS: A * * *
Note: Queue reported is the number of cars per lane.

TRAFFIC IMPACT STUDY YEOVILLE RCG CHURCH
2024 Sunday PM Background + Development Traffic Volumes

Fri Feb 22 12:38:12 2019 Page 2
2024 Sunday Total TrafficVolumes
Traffix 8.0.0215 (c) 2008 Dowling Associates Licensed to ITS, SOUTH AFRICA
2024 Sunday Total Traffic Volumes
Level Of Service Computation Report2000 HCM Unsignalized Method (Future Volume Alternative)
Index #1: Grafton St & Percy St
Average Delay (sec/veh): 9.1 Worst Case Level Of Service: B[11.5]
Approach: North Bound South Bound East Bound West Bound
Movement: L T R L T R L T R L T R
Control: Stop Sign Stop Sign Uncontrolled Uncontrolled
Lefts Include Include Include Include
Lanes: 0 0 0 0 0 0 0 1! 0 0 0 1 0 0 0 0 0 0 1 0
Volume Module: >> Count Date: 3 Feb 2019 <<
Base Vol: 0 0 0 459 0 12 26 15 0 0 8 74
Growth Adj: 1.00 1.00 1.00 1.00 1.00 1.00 1.00 1.00 1.00 1.00 1.00 1.00
Initial Base: 0 0 0 20 0 12 18 3 0 0 7 26
Added Vol: 0 0 0 439 0 0 8 12 0 0 1 48
PasserByVol: 0 0 0 0 0 0 0 0 0 0 0 0
Initial Fut: 0 0 0 459 0 12 26 15 0 0 8 74
User Adj: 1.00 1.00 1.00 1.00 1.00 1.00 1.00 1.00 1.00 1.00 1.00 1.00
PHF Adj: 0.96 0.96 0.96 0.96 0.96 0.96 0.96 0.96 0.96 0.96 0.96 0.96
PHF Volume: 0 0 0 478 0 13 27 16 0 0 8 77
Reduct Vol: 0 0 0 0 0 0 0 0 0 0 0 0
Final Vol.: 0 0 0 478 0 13 27 16 0 0 8 77
Critical Gap Module:
Critical Gp: **** **** **** 6.2 6.5 6.4 **** **** **** **** **** 4.1
FollowUpTim: **** **** **** 3.3 4.0 3.5 **** **** **** **** **** 2.2
Capacity Module:
Cnflict Vol: **** **** **** 29 192 192 **** **** **** **** **** 43
Potent Cap.: **** **** **** 1051 707 802 **** **** **** **** **** 1579
Move Cap.: **** **** **** 1051 671 770 **** **** **** **** **** 1579
Volume/Cap: **** **** **** 0.46 0.00 0.02 **** **** **** **** **** 0.05
Level Of Service Module:
2Way95thQ: **** **** **** **** **** **** **** **** **** **** **** 0.2
Control Del: **** **** **** **** **** **** **** **** **** **** **** 7.4
LOS by Move: * * * * * * * * * * * A
Movement: LT LTR RT LT LTR RT LT LTR RT LT LTR RT
Shared Cap.: **** **** **** **** 1042 **** **** **** **** **** **** 10
SharedQueue: **** **** **** **** 2.6 **** **** **** **** **** **** 0.2
Shrd ConDel: **** **** **** **** 11.5 **** **** **** **** **** **** 7.4
Shared LOS: * * * * B * * * * * * A
ApproachDel: **** 11.5 **** ****
ApproachLOS: * B * *
Note: Queue reported is the number of cars per lane.

Fri Feb 22 12:38:12 2019 Page 4
2024 Sunday Total TrafficVolumes
Traffix 8.0.0215 (c) 2008 Dowling Associates Licensed to ITS, SOUTH AFRICA
2024 Sunday Total Traffic Volumes
Level Of Service Computation Report2000 HCM Unsignalized Method (Future Volume Alternative)
Index #2: Percy St & Highlands St
Average Delay (sec/veh): 1.9 Worst Case Level Of Service: B[12.5]
Approach: North Bound South Bound East Bound West Bound
Movement: L T R L T R L T R L T R
Control: Stop Sign Stop Sign Uncontrolled Uncontrolled
Lefts Include Include Include Include
Lanes: 0 0 1! 0 0 0 0 0 0 0 0 0 0 1 0 0 1 0 0 0
Volume Module: >> Count Date: 3 Jan 2019 <<
Base Vol: 60 0 22 0 0 0 0 6 366 84 9 0
Growth Adj: 1.00 1.00 1.00 1.00 1.00 1.00 1.00 1.00 1.00 1.00 1.00 1.00
Initial Base: 21 0 13 0 0 0 0 6 15 4 9 0
Added Vol: 39 0 9 0 0 0 0 0 351 80 0 0
PasserByVol: 0 0 0 0 0 0 0 0 0 0 0 0
Initial Fut: 60 0 22 0 0 0 0 6 366 84 9 0
User Adj: 1.00 1.00 1.00 1.00 1.00 1.00 1.00 1.00 1.00 1.00 1.00 1.00
PHF Adj: 0.95 0.95 0.95 0.95 0.95 0.95 0.95 0.95 0.95 0.95 0.95 0.95
PHF Volume: 63 0 23 0 0 0 0 6 386 89 9 0
Reduct Vol: 0 0 0 0 0 0 0 0 0 0 0 0
Final Vol.: 63 0 23 0 0 0 0 6 386 89 9 0
Critical Gap Module:
Critical Gp: 6.2 6.5 6.4 **** **** **** **** **** 4.1 **** **** ****
FollowUpTim: 3.3 4.0 3.5 **** **** **** **** **** 2.2 **** **** ****
Capacity Module:
Cnflict Vol: 54 832 832 **** **** **** **** **** 98 **** **** ****
Potent Cap.: 1019 307 342 **** **** **** **** **** 1508 **** **** ****
Move Cap.: 1019 207 256 **** **** **** **** **** 1508 **** **** ****
Volume/Cap: 0.06 0.00 0.09 **** **** **** **** **** 0.26 **** **** ****
Level Of Service Module:
2Way95thQ: **** **** **** **** **** **** **** **** 1.0 **** **** ****
Control Del: **** **** **** **** **** **** **** **** 8.2 **** **** ****
LOS by Move: * * * * * * * * A * * *
Movement: LT LTR RT LT LTR RT LT LTR RT LT LTR RT
Shared Cap.: **** 566 **** **** **** **** **** **** 60 **** **** ****
SharedQueue: **** 0.5 **** **** **** **** **** **** 1.0 **** **** ****
Shrd ConDel: **** 12.5 **** **** **** **** **** **** 8.2 **** **** ****
Shared LOS: * B * * * * * * A * * *
ApproachDel: 12.5 **** **** ****
ApproachLOS: B * * *
Note: Queue reported is the number of cars per lane.

Fri Feb 22 12:38:12 2019 Page 7
2024 Sunday Total TrafficVolumes
Traffix 8.0.0215 (c) 2008 Dowling Associates Licensed to ITS, SOUTH AFRICA
2024 Sunday Total Traffic Volumes
Level Of Service Computation Report2000 HCM Unsignalized Method (Future Volume Alternative)
Index #3: Harley St & Cavendish Rd
Average Delay (sec/veh): 4.0 Worst Case Level Of Service: B[14.8]
Approach: North Bound South Bound East Bound West Bound
Movement: L T R L T R L T R L T R
Control: Stop Sign Stop Sign Uncontrolled Uncontrolled
Lefts Include Include Include Include
Lanes: 0 0 0 0 0 0 0 1! 0 0 0 1 0 0 0 0 0 0 1 0
Volume Module: >> Count Date: 3 Feb 2019 <<
Base Vol: 0 0 0 8 0 175 74 218 0 0 192 6
Growth Adj: 1.00 1.00 1.00 1.00 1.00 1.00 1.00 1.00 1.00 1.00 1.00 1.00
Initial Base: 0 0 0 8 0 95 70 218 0 0 144 6
Added Vol: 0 0 0 0 0 80 4 0 0 0 48 0
PasserByVol: 0 0 0 0 0 0 0 0 0 0 0 0
Initial Fut: 0 0 0 8 0 175 74 218 0 0 192 6
User Adj: 1.00 1.00 1.00 1.00 1.00 1.00 1.00 1.00 1.00 1.00 1.00 1.00
PHF Adj: 0.97 0.97 0.97 0.97 0.97 0.97 0.97 0.97 0.97 0.97 0.97 0.97
PHF Volume: 0 0 0 8 0 181 77 226 0 0 199 6
Reduct Vol: 0 0 0 0 0 0 0 0 0 0 0 0
Final Vol.: 0 0 0 8 0 181 77 226 0 0 199 6
Critical Gap Module:
Critical Gp: **** **** **** 6.2 6.5 6.4 **** **** **** **** **** 4.1
FollowUpTim: **** **** **** 3.3 4.0 3.5 **** **** **** **** **** 2.2
Capacity Module:
Cnflict Vol: **** **** **** 264 475 475 **** **** **** **** **** 302
Potent Cap.: **** **** **** 779 491 552 **** **** **** **** **** 1270
Move Cap.: **** **** **** 779 489 550 **** **** **** **** **** 1270
Volume/Cap: **** **** **** 0.01 0.00 0.33 **** **** **** **** **** 0.00
Level Of Service Module:
2Way95thQ: **** **** **** **** **** **** **** **** **** **** **** 0.0
Control Del: **** **** **** **** **** **** **** **** **** **** **** 7.8
LOS by Move: * * * * * * * * * * * A
Movement: LT LTR RT LT LTR RT LT LTR RT LT LTR RT
Shared Cap.: **** **** **** **** 557 **** **** **** **** **** **** 1
SharedQueue: **** **** **** **** 1.5 **** **** **** **** **** **** 0.0
Shrd ConDel: **** **** **** **** 14.8 **** **** **** **** **** **** 7.8
Shared LOS: * * * * B * * * * * * A
ApproachDel: **** 14.8 **** ****
ApproachLOS: * B * *
Note: Queue reported is the number of cars per lane.

Fri Feb 22 12:38:12 2019 Page 11
2024 Sunday Total TrafficVolumes
Traffix 8.0.0215 (c) 2008 Dowling Associates Licensed to ITS, SOUTH AFRICA
2024 Sunday Total Traffic Volumes
Level Of Service Computation Report2000 HCM Unsignalized Method (Future Volume Alternative)
Index #4: Bezuidenhout St & Durban Rd
Average Delay (sec/veh): 7.3 Worst Case Level Of Service: B[12.3]
Approach: North Bound South Bound East Bound West Bound
Movement: L T R L T R L T R L T R
Control: Stop Sign Stop Sign Uncontrolled Uncontrolled
Lefts Include Include Include Include
Lanes: 1 0 1 0 0 0 0 0 1 0 0 0 1! 0 0 0 0 0 0 0
Volume Module: >> Count Date: 3 Feb 2019 <<
Base Vol: 9 17 0 0 99 201 213 0 7 0 0 0
Growth Adj: 1.00 1.00 1.00 1.00 1.00 1.00 1.00 1.00 1.00 1.00 1.00 1.00
Initial Base: 9 10 0 0 31 153 213 0 7 0 0 0
Added Vol: 0 7 0 0 68 48 0 0 0 0 0 0
PasserByVol: 0 0 0 0 0 0 0 0 0 0 0 0
Initial Fut: 9 17 0 0 99 201 213 0 7 0 0 0
User Adj: 1.00 1.00 1.00 1.00 1.00 1.00 1.00 1.00 1.00 1.00 1.00 1.00
PHF Adj: 0.97 0.97 0.97 0.97 0.97 0.97 0.97 0.97 0.97 0.97 0.97 0.97
PHF Volume: 9 18 0 0 103 208 221 0 7 0 0 0
Reduct Vol: 0 0 0 0 0 0 0 0 0 0 0 0
Final Vol.: 9 18 0 0 103 208 221 0 7 0 0 0
Critical Gap Module:
Critical Gp: 6.2 6.5 **** **** 6.5 7.1 **** **** 4.1 **** **** ****
FollowUpTim: 3.3 4.0 **** **** 4.0 3.5 **** **** 2.2 **** **** ****
Capacity Module:
Cnflict Vol: 0 235 **** **** 125 134 **** **** 0 **** **** ****
Potent Cap.: 1091 669 **** **** 769 843 **** **** 1636 **** **** ****
Move Cap.: 1091 666 **** **** 766 816 **** **** 1636 **** **** ****
Volume/Cap: 0.01 0.03 **** **** 0.13 0.26 **** **** 0.00 **** **** ****
Level Of Service Module:
2Way95thQ: 0.0 0.1 **** **** **** **** **** **** 0.0 **** **** ****
Control Del: 8.3 10.6 **** **** **** **** **** **** 7.2 **** **** ****
LOS by Move: A B * * * * * * A * * *
Movement: LT LTR RT LT LTR RT LT LTR RT LT LTR RT
Shared Cap.: **** **** **** **** **** 799 **** **** **** **** **** ****
SharedQueue: **** **** **** **** **** 1.9 **** **** **** **** **** ****
Shrd ConDel: **** **** **** **** **** 12.3 **** **** **** **** **** ****
Shared LOS: * * * * * B * * * * * *
ApproachDel: 9.8 12.3 **** ****
ApproachLOS: A B * *
Note: Queue reported is the number of cars per lane.

Fri Feb 22 12:38:12 2019 Page 15
2024 Sunday Total TrafficVolumes
Traffix 8.0.0215 (c) 2008 Dowling Associates Licensed to ITS, SOUTH AFRICA
2024 Sunday Total Traffic Volumes
Level Of Service Computation Report2000 HCM Unsignalized Method (Future Volume Alternative)
Index #5: Grafton Rd & Hendon St
Average Delay (sec/veh): 25.7 Worst Case Level Of Service: F[301.5]
Approach: North Bound South Bound East Bound West Bound
Movement: L T R L T R L T R L T R
Control: Stop Sign Stop Sign Uncontrolled Uncontrolled
Lefts Include Include Include Include
Lanes: 0 0 1! 0 0 0 0 1! 0 0 0 0 1! 0 0 0 0 1! 0 0
Volume Module: >> Count Date: 3 Feb 2019 <<
Base Vol: 84 10 1 3 48 68 57 307 431 2 438 2
Growth Adj: 1.00 1.00 1.00 1.00 1.00 1.00 1.00 1.00 1.00 1.00 1.00 1.00
Initial Base: 32 6 1 3 8 28 57 307 32 2 311 2
Added Vol: 52 4 0 0 40 40 0 0 399 0 127 0
PasserByVol: 0 0 0 0 0 0 0 0 0 0 0 0
Initial Fut: 84 10 1 3 48 68 57 307 431 2 438 2
User Adj: 1.00 1.00 1.00 1.00 1.00 1.00 1.00 1.00 1.00 1.00 1.00 1.00
PHF Adj: 0.98 0.98 0.98 0.98 0.98 0.98 0.98 0.98 0.98 0.98 0.98 0.98
PHF Volume: 86 10 1 3 49 70 58 314 441 2 448 2
Reduct Vol: 0 0 0 0 0 0 0 0 0 0 0 0
Final Vol.: 86 10 1 3 49 70 58 314 441 2 448 2
Critical Gap Module:
Critical Gp: 5.3 5.4 5.5 5.3 5.4 5.5 **** **** 3.5 **** **** 3.5
FollowUpTim: 2.3 2.6 3.1 2.3 2.6 3.1 **** **** 2.1 **** **** 2.1
Capacity Module:
Cnflict Vol: 411 1715 1705 301 1686 1735 **** **** 450 **** **** 372
Potent Cap.: 938 178 164 1066 184 152 **** **** 1258 **** **** 1328
Move Cap.: 938 95 66 1066 98 81 **** **** 1258 **** **** 1328
Volume/Cap: 0.09 0.11 0.02 0.00 0.50 0.86 **** **** 0.35 **** **** 0.00
Level Of Service Module:
2Way95thQ: **** **** **** **** **** **** **** **** 1.6 **** **** 0.0
Control Del: **** **** **** **** **** **** **** **** 9.4 **** **** 7.7
LOS by Move: * * * * * * * * A * * A
Movement: LT LTR RT LT LTR RT LT LTR RT LT LTR RT
Shared Cap.: **** 452 **** **** 90 **** **** **** **** **** **** ****
SharedQueue: **** 0.8 **** **** 9.1 **** **** **** **** **** **** ****
Shrd ConDel: **** 15.1 **** **** 301.5 **** **** **** **** **** **** ****
Shared LOS: * C * * F * * * * * * *
ApproachDel: 15.1 301.5 **** ****
ApproachLOS: C F * *
Note: Queue reported is the number of cars per lane.

Fri Feb 22 12:38:12 2019 Page 24
2024 Sunday Total TrafficVolumes
Traffix 8.0.0215 (c) 2008 Dowling Associates Licensed to ITS, SOUTH AFRICA
2024 Sunday Total Traffic Volumes
Level Of Service Computation Report2000 HCM Operations Method (Future Volume Alternative)
Index #6: Joe Slovo Dr & Hendon St
Cycle (sec): 110 Critical Vol./Cap.(X): 0.923
Loss Time (sec): 15 Average Delay (sec/veh): 35.3
Optimal Cycle: 133 Level Of Service: D
Approach: North Bound South Bound East Bound West Bound
Movement: L T R L T R L T R L T R
Control: Protected+Permitted Protected+Permitted Permitted Permitted
Lefts Include Include Include Ovl
Min. Green: 0 0 0 0 0 0 0 0 0 0 0 0
Y+R: 5.0 5.0 5.0 5.0 5.0 5.0 5.0 5.0 5.0 5.0 5.0 5.0
Lanes: 0 1 2 0 2 1 1 1 0 1 1 0 1 1 1 0 1 0 0 1
Volume Module: >> Count Date: 3 Feb 2019 <<
Base Vol: 215 545 301 233 748 109 133 275 298 355 199 37
Growth Adj: 1.00 1.08 1.00 1.00 1.08 1.00 1.00 1.00 1.00 1.00 1.00 1.00
Initial Base: 215 587 191 34 652 109 133 185 218 168 189 15
Added Vol: 0 0 110 199 143 0 0 90 80 187 10 22
PasserByVol: 0 0 0 0 0 0 0 0 0 0 0 0
Initial Fut: 215 587 301 233 795 109 133 275 298 355 199 37
User Adj: 0.98 0.98 0.98 0.98 0.98 0.98 0.98 0.98 0.98 0.98 0.98 0.98
PHF Adj: 1.00 1.00 1.00 1.00 1.00 1.00 1.00 1.00 1.00 1.00 1.00 1.00
PHF Volume: 210 573 294 227 776 106 130 268 291 346 194 36
Reduct Vol: 0 0 0 0 0 0 0 0 0 0 0 0
Reduced Vol: 210 573 294 227 776 106 130 268 291 346 194 36
PCE Adj: 1.00 1.00 1.00 1.00 1.00 1.00 1.00 1.00 1.00 1.00 1.00 1.00
MLF Adj: 1.00 1.00 1.00 1.00 1.00 1.00 1.00 1.00 1.00 1.00 1.00 1.00
Final Vol.: 210 573 294 227 776 106 130 268 291 346 194 36
Saturation Flow Module:
Sat/Lane: 1900 1900 1900 1900 1900 1900 1900 1900 1900 1900 1900 1900
Adjustment: 0.87 0.87 0.84 0.92 0.92 0.95 0.85 0.20 0.20 0.90 0.90 0.59
Lanes: 0.80 2.20 2.00 1.00 2.00 1.00 1.00 1.44 1.56 0.64 0.36 1.00
Final Sat.: 1334 3644 3177 1744 3487 1805 1615 556 603 1100 617 1115
Capacity Analysis Module:
Vol/Sat: 0.16 0.16 0.09 0.13 0.22 0.06 0.08 0.48 0.48 0.31 0.31 0.03
Crit Moves: **** **** ****
Green/Cycle: 0.31 0.25 0.39 0.24 0.24 0.33 0.52 0.52 0.52 0.62 0.52 0.52
Green/Cycle: 0.31 0.25 0.10 0.24 0.24 0.09 0.52 0.52 0.52 0.62 0.52 0.52
Volume/Cap: 0.50 0.63 0.47 0.54 0.92 0.36 0.15 0.92 0.92 0.51 0.60 0.06
Level Of Service Module:
Uniform Del: 30.7 36.9 21.1 36.4 40.8 21.5 13.6 24.2 24.2 11.4 18.3 13.0
IncremntDel: 0.3 1.1 0.6 0.3 12.8 0.8 0.1 19.9 19.9 0.4 1.2 0.0
InitQueuDel: 0.0 0.0 0.0 0.0 0.0 0.0 0.0 0.0 0.0 0.0 0.0 0.0
Delay Adj: 1.00 1.00 1.00 1.00 1.00 1.00 1.00 1.00 1.00 1.00 1.00 1.00
Delay/Veh: 31.0 38.0 21.7 36.8 53.5 22.3 13.7 44.1 44.1 11.8 19.5 13.0
User DelAdj: 1.00 1.00 1.00 1.00 1.00 1.00 1.00 1.00 1.00 1.00 1.00 1.00
AdjDel/Veh: 31.0 38.0 21.7 36.8 53.5 22.3 13.7 44.1 44.1 11.8 19.5 13.0
LOS by Move: C D C D D C B D D B B B
HCM2kAvgQ: 8.1 9.4 4.7 7.5 17.5 3.0 2.2 9.6 9.6 10.1 13.0 0.6
Note: Queue reported is the number of cars per lane.

Fri Feb 22 12:38:12 2019 Page 33
2024 Sunday Total TrafficVolumes
Traffix 8.0.0215 (c) 2008 Dowling Associates Licensed to ITS, SOUTH AFRICA
2024 Sunday Total Traffic Volumes
Level Of Service Computation Report2000 HCM Unsignalized Method (Future Volume Alternative)
Index #7: Fortesque Rd & Hendon St
Average Delay (sec/veh): 2.7 Worst Case Level Of Service: C[15.2]
Approach: North Bound South Bound East Bound West Bound
Movement: L T R L T R L T R L T R
Control: Stop Sign Stop Sign Uncontrolled Uncontrolled
Lefts Include Include Include Include
Lanes: 0 0 0 0 0 0 0 1! 0 0 0 1 0 0 0 0 0 0 1 0
Volume Module: >> Count Date: 3 Feb 2020 <<
Base Vol: 0 0 0 40 0 100 58 246 0 0 348 8
Growth Adj: 1.00 1.00 1.00 1.00 1.00 1.00 1.00 1.00 1.00 1.00 1.00 1.00
Initial Base: 0 0 0 0 0 60 58 246 0 0 260 4
Added Vol: 0 0 0 40 0 40 0 0 0 0 88 4
PasserByVol: 0 0 0 0 0 0 0 0 0 0 0 0
Initial Fut: 0 0 0 40 0 100 58 246 0 0 348 8
User Adj: 1.00 1.00 1.00 1.00 1.00 1.00 1.00 1.00 1.00 1.00 1.00 1.00
PHF Adj: 0.98 0.98 0.98 0.98 0.98 0.98 0.98 0.98 0.98 0.98 0.98 0.98
PHF Volume: 0 0 0 41 0 102 59 250 0 0 354 8
Reduct Vol: 0 0 0 0 0 0 0 0 0 0 0 0
Final Vol.: 0 0 0 41 0 102 59 250 0 0 354 8
Critical Gap Module:
Critical Gp: **** **** **** 6.2 6.5 6.4 **** **** **** **** **** 4.1
FollowUpTim: **** **** **** 3.3 4.0 3.5 **** **** **** **** **** 2.2
Capacity Module:
Cnflict Vol: **** **** **** 280 650 650 **** **** **** **** **** 309
Potent Cap.: **** **** **** 764 391 437 **** **** **** **** **** 1263
Move Cap.: **** **** **** 764 388 435 **** **** **** **** **** 1263
Volume/Cap: **** **** **** 0.05 0.00 0.23 **** **** **** **** **** 0.01
Level Of Service Module:
2Way95thQ: **** **** **** **** **** **** **** **** **** **** **** 0.0
Control Del: **** **** **** **** **** **** **** **** **** **** **** 7.9
LOS by Move: * * * * * * * * * * * A
Movement: LT LTR RT LT LTR RT LT LTR RT LT LTR RT
Shared Cap.: **** **** **** **** 496 **** **** **** **** **** **** 1
SharedQueue: **** **** **** **** 1.2 **** **** **** **** **** **** 0.0
Shrd ConDel: **** **** **** **** 15.2 **** **** **** **** **** **** 7.9
Shared LOS: * * * * C * * * * * * A
ApproachDel: **** 15.2 **** ****
ApproachLOS: * C * *
Note: Queue reported is the number of cars per lane.

Fri Feb 22 12:38:12 2019 Page 37
2024 Sunday Total TrafficVolumes
Traffix 8.0.0215 (c) 2008 Dowling Associates Licensed to ITS, SOUTH AFRICA
2024 Sunday Total Traffic Volumes
Level Of Service Computation Report2000 HCM Unsignalized Method (Future Volume Alternative)
Index #8: Hendon St & Percy St
Average Delay (sec/veh): 0.5 Worst Case Level Of Service: B[12.9]
Approach: North Bound South Bound East Bound West Bound
Movement: L T R L T R L T R L T R
Control: Stop Sign Stop Sign Uncontrolled Uncontrolled
Lefts Include Include Include Include
Lanes: 0 0 1! 0 0 0 0 0 0 0 0 0 0 1 0 0 1 0 0 0
Volume Module: >> Count Date: 3 Feb 2019 <<
Base Vol: 11 0 14 0 0 0 0 242 44 42 345 0
Growth Adj: 1.00 1.00 1.00 1.00 1.00 1.00 1.00 1.00 1.00 1.00 1.00 1.00
Initial Base: 7 0 10 0 0 0 0 242 4 2 257 0
Added Vol: 4 0 4 0 0 0 0 0 40 40 88 0
PasserByVol: 0 0 0 0 0 0 0 0 0 0 0 0
Initial Fut: 11 0 14 0 0 0 0 242 44 42 345 0
User Adj: 1.00 1.00 1.00 1.00 1.00 1.00 1.00 1.00 1.00 1.00 1.00 1.00
PHF Adj: 0.98 0.98 0.98 0.98 0.98 0.98 0.98 0.98 0.98 0.98 0.98 0.98
PHF Volume: 11 0 14 0 0 0 0 246 45 43 351 0
Reduct Vol: 0 0 0 0 0 0 0 0 0 0 0 0
Final Vol.: 11 0 14 0 0 0 0 246 45 43 351 0
Critical Gap Module:
Critical Gp: 6.2 6.5 6.4 **** **** **** **** **** 4.1 **** **** ****
FollowUpTim: 3.3 4.0 3.5 **** **** **** **** **** 2.2 **** **** ****
Capacity Module:
Cnflict Vol: 372 708 708 **** **** **** **** **** 393 **** **** ****
Potent Cap.: 678 362 404 **** **** **** **** **** 1176 **** **** ****
Move Cap.: 678 348 392 **** **** **** **** **** 1176 **** **** ****
Volume/Cap: 0.02 0.00 0.04 **** **** **** **** **** 0.04 **** **** ****
Level Of Service Module:
2Way95thQ: **** **** **** **** **** **** **** **** 0.1 **** **** ****
Control Del: **** **** **** **** **** **** **** **** 8.2 **** **** ****
LOS by Move: * * * * * * * * A * * *
Movement: LT LTR RT LT LTR RT LT LTR RT LT LTR RT
Shared Cap.: **** 482 **** **** **** **** **** **** 1 **** **** ****
SharedQueue: **** 0.2 **** **** **** **** **** **** 0.1 **** **** ****
Shrd ConDel: **** 12.9 **** **** **** **** **** **** 8.2 **** **** ****
Shared LOS: * B * * * * * * A * * *
ApproachDel: 12.9 **** **** ****
ApproachLOS: B * * *
Note: Queue reported is the number of cars per lane.

Fri Feb 22 12:38:12 2019 Page 40
2024 Sunday Total TrafficVolumes
Traffix 8.0.0215 (c) 2008 Dowling Associates Licensed to ITS, SOUTH AFRICA
2024 Sunday Total Traffic Volumes
Level Of Service Computation Report2000 HCM Unsignalized Method (Future Volume Alternative)
Index #9: Bezuidenhout St & Paddock St
Average Delay (sec/veh): 0.3 Worst Case Level Of Service: A[9.9]
Approach: North Bound South Bound East Bound West Bound
Movement: L T R L T R L T R L T R
Control: Uncontrolled Uncontrolled Stop Sign Stop Sign
Lefts Include Include Include Include
Lanes: 0 0 0 1 0 0 1 0 0 0 0 0 0 0 0 1 0 0 0 0
Volume Module: >> Count Date: 3 Feb 2019 <<
Base Vol: 0 230 1 1 284 0 0 0 0 17 0 0
Growth Adj: 1.00 1.00 1.00 1.00 1.00 1.00 1.00 1.00 1.00 1.00 1.00 1.00
Initial Base: 0 223 0 1 184 0 0 0 0 1 0 0
Added Vol: 0 7 1 0 100 0 0 0 0 16 0 0
PasserByVol: 0 0 0 0 0 0 0 0 0 0 0 0
Initial Fut: 0 230 1 1 284 0 0 0 0 17 0 0
User Adj: 1.00 1.00 1.00 1.00 1.00 1.00 1.00 1.00 1.00 1.00 1.00 1.00
PHF Adj: 0.97 0.97 0.97 0.97 0.97 0.97 0.97 0.97 0.97 0.97 0.97 0.97
PHF Volume: 0 238 1 1 294 0 0 0 0 18 0 0
Reduct Vol: 0 0 0 0 0 0 0 0 0 0 0 0
Final Vol.: 0 238 1 1 294 0 0 0 0 18 0 0
Critical Gap Module:
Critical Gp: **** **** 4.1 **** **** **** **** **** **** 6.2 **** ****
FollowUpTim: **** **** 2.2 **** **** **** **** **** **** 3.3 **** ****
Capacity Module:
Cnflict Vol: **** **** 295 **** **** **** **** **** **** 295 **** ****
Potent Cap.: **** **** 1278 **** **** **** **** **** **** 749 **** ****
Move Cap.: **** **** 1278 **** **** **** **** **** **** 749 **** ****
Volume/Cap: **** **** 0.00 **** **** **** **** **** **** 0.02 **** ****
Level Of Service Module:
2Way95thQ: **** **** 0.0 **** **** **** **** **** **** 0.1 **** ****
Control Del: **** **** 7.8 **** **** **** **** **** **** 9.9 **** ****
LOS by Move: * * A * * * * * * A * *
Movement: LT LTR RT LT LTR RT LT LTR RT LT LTR RT
Shared Cap.: **** **** 1 **** **** **** **** **** **** **** **** ****
SharedQueue: **** **** 0.0 **** **** **** **** **** **** **** **** ****
Shrd ConDel: **** **** 7.8 **** **** **** **** **** **** **** **** ****
Shared LOS: * * A * * * * * * * * *
ApproachDel: **** **** **** 9.9
ApproachLOS: * * * A
Note: Queue reported is the number of cars per lane.

Mon Feb 25 12:03:50 2019 Page 42
2024 Sunday Total TrafficVolumes
Traffix 8.0.0215 (c) 2008 Dowling Associates Licensed to ITS, SOUTH AFRICA
2024 Sunday Total Traffic Volumes
Level Of Service Computation Report2000 HCM Unsignalized Method (Future Volume Alternative)
Index #11: Highlands St & Back-of-House Access
Average Delay (sec/veh): 13.6 Worst Case Level Of Service: C[17.3]
Approach: North Bound South Bound East Bound West Bound
Movement: L T R L T R L T R L T R
Control: Stop Sign Stop Sign Uncontrolled Uncontrolled
Lefts Include Include Include Include
Lanes: 0 0 0 1 0 0 0 1! 0 0 1 0 0 0 0 0 0 1! 0 0
Volume Module: >> Count Date: 3 Feb 2019 <<
Base Vol: 0 37 7 19 330 100 11 0 0 68 0 35
Growth Adj: 1.00 1.00 1.00 1.00 1.00 1.00 1.00 1.00 1.00 1.00 1.00 1.00
Initial Base: 0 0 0 19 0 0 0 0 0 0 0 35
Added Vol: 0 37 7 0 330 100 11 0 0 68 0 0
PasserByVol: 0 0 0 0 0 0 0 0 0 0 0 0
Initial Fut: 0 37 7 19 330 100 11 0 0 68 0 35
User Adj: 1.00 1.00 1.00 1.00 1.00 1.00 1.00 1.00 1.00 1.00 1.00 1.00
PHF Adj: 0.95 0.95 0.95 0.95 0.95 0.95 0.95 0.95 0.95 0.95 0.95 0.95
PHF Volume: 0 39 7 20 348 105 12 0 0 72 0 37
Reduct Vol: 0 0 0 0 0 0 0 0 0 0 0 0
Final Vol.: 0 39 7 20 348 105 12 0 0 72 0 37
Critical Gap Module:
Critical Gp: **** 6.5 7.1 6.2 6.5 7.1 **** **** **** **** **** 4.1
FollowUpTim: **** 4.0 3.5 3.3 4.0 3.5 **** **** **** **** **** 2.2
Capacity Module:
Cnflict Vol: **** 121 284 0 145 129 **** **** **** **** **** 12
Potent Cap.: **** 773 673 1091 750 848 **** **** **** **** **** 1621
Move Cap.: **** 755 407 1091 732 801 **** **** **** **** **** 1621
Volume/Cap: **** 0.05 0.02 0.02 0.48 0.13 **** **** **** **** **** 0.02
Level Of Service Module:
2Way95thQ: **** **** **** **** **** **** **** **** **** **** **** 0.1
Control Del: **** **** **** **** **** **** **** **** **** **** **** 7.3
LOS by Move: * * * * * * * * * * * A
Movement: LT LTR RT LT LTR RT LT LTR RT LT LTR RT
Shared Cap.: **** **** 665 **** 757 **** **** **** **** **** **** ****
SharedQueue: **** **** 0.2 **** 4.4 **** **** **** **** **** **** ****
Shrd ConDel: **** **** 10.8 **** 17.3 **** **** **** **** **** **** ****
Shared LOS: * * B * C * * * * * * *
ApproachDel: 10.8 17.3 **** ****
ApproachLOS: B C * *
Note: Queue reported is the number of cars per lane.

Fri Feb 22 12:38:12 2019 Page 45
2024 Sunday Total TrafficVolumes
Traffix 8.0.0215 (c) 2008 Dowling Associates Licensed to ITS, SOUTH AFRICA
2024 Sunday Total Traffic Volumes
Level Of Service Computation Report2000 HCM Unsignalized Method (Future Volume Alternative)
Index #12: Charlton Access Rd & South Ln
Average Delay (sec/veh): 1.0 Worst Case Level Of Service: A[9.6]
Approach: North Bound South Bound East Bound West Bound
Movement: L T R L T R L T R L T R
Control: Uncontrolled Uncontrolled Stop Sign Stop Sign
Lefts Include Include Include Include
Lanes: 0 0 0 0 0 0 1 0 0 0 0 0 0 0 0 1 0 0 0 0
Volume Module:
Base Vol: 0 0 0 403 10 0 0 0 0 46 0 0
Growth Adj: 1.00 1.00 1.00 1.00 1.00 1.00 1.00 1.00 1.00 1.00 1.00 1.00
Initial Base: 0 0 0 5 10 0 0 0 0 2 0 0
Added Vol: 0 0 0 398 0 0 0 0 0 44 0 0
PasserByVol: 0 0 0 0 0 0 0 0 0 0 0 0
Initial Fut: 0 0 0 403 10 0 0 0 0 46 0 0
User Adj: 1.00 1.00 1.00 1.00 1.00 1.00 1.00 1.00 1.00 1.00 1.00 1.00
PHF Adj: 1.00 1.00 1.00 1.00 1.00 1.00 1.00 1.00 1.00 1.00 1.00 1.00
PHF Volume: 0 0 0 403 10 0 0 0 0 46 0 0
Reduct Vol: 0 0 0 0 0 0 0 0 0 0 0 0
Final Vol.: 0 0 0 403 10 0 0 0 0 46 0 0
Critical Gap Module:
Critical Gp: **** **** **** **** **** **** **** **** **** 6.2 **** ****
FollowUpTim: **** **** **** **** **** **** **** **** **** 3.3 **** ****
Capacity Module:
Cnflict Vol: **** **** **** **** **** **** **** **** **** 212 **** ****
Potent Cap.: **** **** **** **** **** **** **** **** **** 834 **** ****
Move Cap.: **** **** **** **** **** **** **** **** **** 834 **** ****
Volume/Cap: **** **** **** **** **** **** **** **** **** 0.06 **** ****
Level Of Service Module:
2Way95thQ: **** **** **** **** **** **** **** **** **** 0.2 **** ****
Control Del: **** **** **** **** **** **** **** **** **** 9.6 **** ****
LOS by Move: * * * * * * * * * A * *
Movement: LT LTR RT LT LTR RT LT LTR RT LT LTR RT
Shared Cap.: **** **** **** **** **** **** **** **** **** **** **** ****
SharedQueue: **** **** **** **** **** **** **** **** **** **** **** ****
Shrd ConDel: **** **** **** **** **** **** **** **** **** **** **** ****
Shared LOS: * * * * * * * * * * * *
ApproachDel: **** **** **** 9.6
ApproachLOS: * * * A
Note: Queue reported is the number of cars per lane.

Fri Feb 22 12:38:12 2019 Page 48
2024 Sunday Total TrafficVolumes
Traffix 8.0.0215 (c) 2008 Dowling Associates Licensed to ITS, SOUTH AFRICA
2024 Sunday Total Traffic Volumes
Level Of Service Computation Report2000 HCM Unsignalized Method (Future Volume Alternative)
Index #14:
Average Delay (sec/veh): 0.2 Worst Case Level Of Service: A[8.7]
Approach: North Bound South Bound East Bound West Bound
Movement: L T R L T R L T R L T R
Control: Stop Sign Stop Sign Uncontrolled Uncontrolled
Lefts Include Include Include Include
Lanes: 1 0 0 0 0 0 0 0 0 0 0 0 0 1 0 0 0 1 0 0
Volume Module:
Base Vol: 11 0 0 0 0 0 0 374 100 0 72 0
Growth Adj: 1.00 1.00 1.00 1.00 1.00 1.00 1.00 1.00 1.00 1.00 1.00 1.00
Initial Base: 0 0 0 0 0 0 0 23 0 0 33 0
Added Vol: 11 0 0 0 0 0 0 351 100 0 39 0
PasserByVol: 0 0 0 0 0 0 0 0 0 0 0 0
Initial Fut: 11 0 0 0 0 0 0 374 100 0 72 0
User Adj: 1.00 1.00 1.00 1.00 1.00 1.00 1.00 1.00 1.00 1.00 1.00 1.00
PHF Adj: 1.00 1.00 1.00 1.00 1.00 1.00 1.00 1.00 1.00 1.00 1.00 1.00
PHF Volume: 11 0 0 0 0 0 0 374 100 0 72 0
Reduct Vol: 0 0 0 0 0 0 0 0 0 0 0 0
Final Vol.: 11 0 0 0 0 0 0 374 100 0 72 0
Critical Gap Module:
Critical Gp: 6.2 **** **** **** **** **** **** **** 4.1 **** **** ****
FollowUpTim: 3.3 **** **** **** **** **** **** **** 2.2 **** **** ****
Capacity Module:
Cnflict Vol: 72 **** **** **** **** **** **** **** 72 **** **** ****
Potent Cap.: 996 **** **** **** **** **** **** **** 1541 **** **** ****
Move Cap.: 996 **** **** **** **** **** **** **** 1541 **** **** ****
Volume/Cap: 0.01 **** **** **** **** **** **** **** 0.06 **** **** ****
Level Of Service Module:
2Way95thQ: 0.0 **** **** **** **** **** **** **** 0.2 **** **** ****
Control Del: 8.7 **** **** **** **** **** **** **** 7.5 **** **** ****
LOS by Move: A * * * * * * * A * * *
Movement: LT LTR RT LT LTR RT LT LTR RT LT LTR RT
Shared Cap.: **** **** **** **** **** **** **** **** 1 **** **** ****
SharedQueue: **** **** **** **** **** **** **** **** 0.2 **** **** ****
Shrd ConDel: **** **** **** **** **** **** **** **** 7.5 **** **** ****
Shared LOS: * * * * * * * * A * * *
ApproachDel: 8.7 **** **** ****
ApproachLOS: A * * *
Note: Queue reported is the number of cars per lane.

TRAFFIC IMPACT STUDY YEOVILLE, RCG
Annexure H: Proposed, Functionality Improvements

125.9 m
4
6
.
6
m
5
0
.
8
m
4
9
.
4
m
4
5
.
3
m
62.2 m
9
6
.
8
m
ANNEXURE:
TITLE:
PROJECT:
PROPOSED IMPROVEMENT HK0133 - YEOVILLE RCG CHURCH TIA
SOUTH LN
PERCY ST
HENDON ST
GR
AF
TO
N R
D
FO
RT
ES
QU
E R
D
H
E
N
D
O
N
S
T
ERF
1308
ERF
67
LEGEND
EXTENT OF THE SIDEWALKS
SITE BOUNDARY
EXTENT OF ROAD MARKINGS
H
I
G
H
L
A
N
D
S
S
T
(2314 m
2
)
HENDON ST
P
E
R
C
Y
S
T
GR
AF
TO
N R
D

TRAFFIC IMPACT STUDY YEOVILLE, RCG