k39: subsurface production technology report · k39: subsurface production technology report...
TRANSCRIPT

December 2015
K39: Subsurface Production Technology Report
Transport and Storage

K39: Subsurface Production Technology Report
IMPORTANT INFORMATION
The information provided further to UK CCS Commercialisation Programme (the Competition) set out
herein (the Information) has been prepared by Capture Power Limited and its sub-contractors (the
Consortium) solely for the Department of Energy and Climate Change in connection with the Competition.
The Information does not amount to advice on CCS technology or any CCS engineering, commercial,
financial, regulatory, legal or other solutions on which any reliance should be placed. Accordingly, no
member of the Consortium makes (and the UK Government does not make) any representation, warranty
or undertaking, express or implied, as to the accuracy, adequacy or completeness of any of the Information
and no reliance may be placed on the Information. In so far as permitted by law, no member of the
Consortium or any company in the same group as any member of the Consortium or their respective
officers, employees or agents accepts (and the UK Government does not accept) any responsibility or
liability of any kind, whether for negligence or any other reason, for any damage or loss arising from any
use of or any reliance placed on the Information or any subsequent communication of the Information.
Each person to whom the Information is made available must make their own independent assessment of
the Information after making such investigation and taking professional technical, engineering, commercial,
regulatory, financial, legal or other advice, as they deem necessary.

K39: Subsurface Production Technology Report
Chapter Title Page
Executive Summary i
1 Introduction 2
2 Purpose 3
3 Overview 4
4 The Offshore Storage Facility 6
4.1 The Offshore Platform _______________________________________________________________ 6 4.2 CO2 Injection Wells __________________________________________________________________ 7 4.2.1 Completion Design __________________________________________________________________ 9 4.2.2 Wellhead ________________________________________________________________________ 12 4.2.3 Christmas Tree ____________________________________________________________________ 13
5 Formation Temperature and Pressure Prediction 14
5.1 Temperature ______________________________________________________________________ 14 5.2 Pore Pressure Prediction ____________________________________________________________ 17
6 Injectivity and Thermal Fracturing Analysis 19
6.1 PROSPER Modelling _______________________________________________________________ 19 6.1.1 Formation Properties _______________________________________________________________ 19 6.1.2 Well Trajectory and Construction ______________________________________________________ 19 6.1.3 System Performance Sensitivities and Results ___________________________________________ 22 6.2 Fracture Modelling _________________________________________________________________ 30 6.2.1 Introduction _______________________________________________________________________ 30 6.2.2 Endurance Model __________________________________________________________________ 30 6.2.3 Fracturing Data Input _______________________________________________________________ 31 6.2.4 Fluid Loss Parameters ______________________________________________________________ 33 6.2.5 Consistency with VISAGE ___________________________________________________________ 33 6.2.6 Base Case Results _________________________________________________________________ 33 6.2.7 Sensitivity to Young’s Modulus ________________________________________________________ 35 6.2.8 Shape of Fractures _________________________________________________________________ 36 6.2.9 Fracturing in L3B __________________________________________________________________ 36 6.2.10 Fracturing L1B and L1A _____________________________________________________________ 37 6.3 Perforating Strategy ________________________________________________________________ 38
7 Flowline Well Interaction 39
7.1 CO2 Flow Control Sequence _________________________________________________________ 39 7.2 Process Systems __________________________________________________________________ 40 7.2.1 CO2 Reception Facilities (Offshore Pipeline and PIG Receiver) _______________________________ 40 7.2.2 CO2 Filtration _____________________________________________________________________ 41 7.2.3 CO2 Injection Manifold and Wellheads __________________________________________________ 41 7.2.4 Future CO2 Booster Pumps __________________________________________________________ 42 7.2.5 Water Production __________________________________________________________________ 43 7.2.6 Process Venting & Process Isolation ___________________________________________________ 43
Contents

K39: Subsurface Production Technology Report
8 Operational Support 44
8.1 Storage Site Operations and Maintenance Overview _______________________________________ 44 8.2 Measurement, Monitoring and Verification Plan Instrumentation ______________________________ 45 8.2.1.1 Monitoring of Surface Pressure and Temperature _________________________________________ 45 8.2.1.2 Downhole Pressure and Temperature Gauges ___________________________________________ 45 8.2.1.3 Injection Allocation Meters ___________________________________________________________ 46
9 Glossary 47

K39: Subsurface Production Technology Report
Key Work Meaning or Explanation
Carbon An element, but used as shorthand for its gaseous oxide, carbon dioxide CO2
Capture Collection of CO2 from power station combustion process or other facilities and its process ready for transportation.
Flowline Well Interaction A control description of the main CO2 process flow scheme at the offshore storage facility from the riser up to and including the wellhead
Formation Temperature Data from appraisal wells is used to estimate the temperature gradient within the Endurance Bunter Sandstone Formation
Full Chain Reports described as “full chain” would cover the complete process from the capture of the carbon at the emitter plant to its injection into the storage reservoir
Injectivity and Thermal Fracture Analysis
Software modelling is used to design and evaluate the potential for fracturing in the Bunter Sandstone Formation and its impact on inflow performance
Key Knowledge Information that may be useful if not vital to understanding how some enterprise may be successfully undertaken
Pressure Prediction Knowledge of formation pressure was used to anticipate potential bore hole stability problems and to design suitable mitigation measures
Storage Containment in suitable pervious rock formations located under impervious rock formations usually under the sea bed
Key Words

K39: Subsurface Production Technology Report
i
This report is one of a series of reports; these “key knowledge” reports are issued here as public
information. These reports were generated as part of the Front End Engineering Design Contract agreed
with the Department of Energy and Climate Change (DECC) as part of the White Rose Project.
White Rose seeks to deliver a clean coal-fired power station using oxy-fuel technology fitted with Carbon
Capture Storage (CCS), which would generate up to 448MWe (gross) while capturing at least 90% of the
carbon dioxide (CO2) emissions. CCS technology allows the carbon dioxide produced during combustion
to be captured, processed and compressed before being transported to storage in dense phase. The
dense phase carbon dioxide would be kept under pressure while it is pumped through an underground
pipeline to the seashore and then through an offshore pipeline to be stored in a specially chosen rock
formation under the seabed of the southern North Sea.
This report describes the analysis of the interaction between reservoir, well and flowline to optimise inflow
and outflow performance of the White Rose Storage system whilst operating within design parameters. It
includes a description of (formation) temperature and pressure prediction, injectivity analysis, injection
fracturing analysis, operations support, and flowline well interaction.
Executive Summary

K39: Subsurface Production Technology Report
2
National Grid Carbon Limited (NGCL) is a wholly owned subsidiary of the National Grid group of
companies. Capture Power Limited (CPL) is a special purpose vehicle company, which has been formed
by a consortium consisting of General Electric (GE), Drax and BOC, to pursue the White Rose (WR)
Carbon Capture Storage (CCS) Project (the WR Project).
CPL have entered into an agreement (the Front End Engineering Design (FEED) Contract) with the UK
Government’s Department of Energy and Climate Change (DECC) pursuant to which it will carry out,
among other things, the engineering, cost estimation and risk assessment required to specify the budget
required to develop and operate the WR Assets. The WR Assets comprise an end-to-end electricity
generation and carbon capture and storage system comprising, broadly: a coal fired power station utilising
oxy-fuel technology, carbon dioxide capture, processing, compression and metering facilities;
transportation pipeline and pressure boosting facilities; offshore carbon dioxide reception and processing
facilities, and injection wells into an offshore storage reservoir.
CPL and NGCL have entered into an agreement (the KSC) pursuant to which NGCL will perform a project
(the WR T&S FEED Project) which will meet that part of CPL’s obligations under the FEED Contract which
are associated with the T&S Assets. The T&S Assets include, broadly: the transportation pipeline and
pressure boosting facilities; offshore carbon dioxide reception and processing facilities, and injection wells
into an offshore storage reservoir.
A key component of the WR T&S FEED Project is the Key Knowledge Transfer process. A major portion
of this is the compilation and distribution of a set of documents termed Key Knowledge Deliverables, of
which this document represents one example.
This document describes the analysis of the interaction between reservoir, well and flowline to optimise
inflow and outflow performance of the White Rose Storage system whilst operating within design
parameters. It includes a description of (Formation) Temperature and Pressure prediction, Injectivity
analysis, Injection fracturing analysis, Operations support, and Flowline well interaction.
1 Introduction

K39: Subsurface Production Technology Report
3
The purpose of this document is to provide a summary description of the subsurface production technology
and includes:
temperature and pressure prediction;
injectivity analysis;
injection fracturing analysis;
operational support; and
flowline well interaction.
2 Purpose

K39: Subsurface Production Technology Report
4
The White Rose CCS Project is to provide an example of a clean coal-fired power station of up to 448MW
gross output, built and operated as a commercial enterprise.
The project comprises a state-of-the-art coal-fired power plant that is equipped with full CCS technology.
The plant would also have the potential to co-fire biomass. The project is intended to prove CCS
technology at a commercial scale and demonstrate it as a competitive form of low-carbon power
generation and as an important technology in tackling climate change. It would also play an important role
in establishing a CO2 transportation and storage network in the Yorkshire and Humber area. Figure 3.1
below gives a geographical overview of the proposed CO2 transportation system.
Figure 3.1: Geographical overview of the transportation facility
The standalone power plant would be located at the existing Drax Power Station site near Selby, North
Yorkshire, generating electricity for export to the Electricity Transmission Network (the “Grid”) as well as
capturing approximately 2 million tonnes of CO2 per year, some 90% of all CO2 emissions produced by the
plant. The by-product CO2 from the Oxy Power Plant (OPP) would be compressed and transported via an
export pipeline for injection into an offshore saline formation (the reservoir) for permanent storage.
The power plant technology, which is known as Oxyfuel combustion, burns fuel in a modified combustion
environment with the resulting combustion gases being high in CO2 concentration. This allows the CO2
produced to be captured without the need for additional chemical separation, before being compressed
into dense phase and transported for storage.
The overall integrated control of the end-to-end CCS chain would have similarities to that of the National
Grid natural gas pipeline network. Operation of the Transport and Storage System would be undertaken by
NGCL. However, transportation of carbon dioxide presents differing concerns to those of natural gas;
suitable specific operating procedures would be developed to cover all operational aspects including start-
up, normal and abnormal operation, controlled and emergency shutdowns. These procedures would
3 Overview

K39: Subsurface Production Technology Report
5
include a hierarchy of operation, responsibility, communication procedures and protocols. Figure 3.2
below provides a schematic diagram of the overall end-to-end chain for the White Rose CCS Project.
Figure 3.2: End To End Chain Overall Schematic Diagram
The structure of interest (identified as Endurance; formally as 5/42) is a four-way dip-closure straddling
quadrants 42 and 43. This structure is a saline aquifer, approximately 22km long, 7km wide and over
200m thick. The crest of the reservoir is located at a depth of approximately 1020m below the sea bed.
Reservoir datum (at 1300m TVDSS) pressure and temperature were determined as 140.0bar and 55.9°C,
respectively. A layer of mudstone called the Rot Clay provides the primary cap rock or seal. This in turn is
overlain by more than 90m of a salt layer known as the Rot Halite which is anticipated to provide additional
seal capability.

K39: Subsurface Production Technology Report
6
The offshore storage facility of the overall White Rose Carbon Capture and Storage network is a Normally
Unmanned Installation (NUI) wellhead injection platform.
Dense phase CO2 is pumped, from the Barmston onshore facility, through a 600mm ND (24in) subsea
pipeline and up through a 600mm ND (24in) riser arriving at the offshore storage facility platform topsides.
On the platform the CO2 is filtered and routed to the injection wellheads. The wellhead and tree is the
component at the surface of a well that provides the structural and pressure-containing interface for the
equipment. The choke valves, located upstream on the tree, control the flow of the injected CO2 and
maintain sufficient back-pressure on the upstream system to ensure that the CO2 remains in the dense
phase.
The CO2 is injected into a saline aquifer storage site located in block Endurance of the southern North Sea.
Three moderately deviated (< 60o) injection wells are planned initially with space available for a further
three. Note that a moderately deviated injection well is one which is subject to a conventional well drilling
operation where the drill bit is deflected at an angle from the vertical toward a specific target.
4.1 The Offshore Platform
The platform consists of the following facilities:
PIG receiving facilities;
cartridge type fines filters;
CO2 injection manifold;
three individually metered CO2 injection wells;
utilities:
– Monoethylene Glycol (MEG) storage and pumps to prevent CO2 hydrate formation during well start-
up operations;
– seawater lift pumps and filters; primarily to supply seawater to the temporary wash water package;
– temporary wash water package skid containing injection pumps, filters, power generation and
chemicals. These are required for periodic well washing to avoid halite (rock salt) build up in the
near wellbore region when CO2 injection is shut-in;
– corrosion inhibitor injection system for downhole protection of wetted well section; and
– other utilities (drains system, diesel storage system, nitrogen system (quads), fresh water tank
system, power generation system, CO2 vent, wellhead hydraulic power unit);
support systems (crane, temporary safe refuge, battery room, marine navigation aids and helideck);
safety systems (fire and CO2 gas detection systems, life rafts, Totally Enclosed Motor Propelled
Survival Craft (TEMPSC) and helideck foam and Deck Integrated Fire Fighting System (DIFFS)
package);
Integrated Control and Safety System (ICSS) and telecoms systems, including a Very Small Aperture
Terminal (VSAT) system; and
water disposal caisson to allow disposal of produced water from the injection aquifer (future
requirement) and seawater cooling return line.
The platform substructure will be a steel jacket (a welded tubular steel frame with tubular chord legs
supporting the deck and the topsides in a fixed offshore platform with additional allowance built in to allow
for future installation of CO2 booster pumps to transport CO2 further afield). Spare risers and J-tubes;
conduits attached to the platform, will also be provided.
4 The Offshore Storage Facility

K39: Subsurface Production Technology Report
7
4.2 CO2 Injection Wells
The design of the CO2 injection wells takes into account the following main considerations, in addition to
requirements of the wells basis of design:
1. the thermodynamic characteristics and physical properties of the specific composition of the CO2 to be
injected;
2. the robustness, reliability and safety of the well design for injection of CO2 and for its isolation and
repair in the event of failure during the injection phase;
3. the ability to reliably, permanently and safely seal the wells for the secure storage of CO2; and
4. three wells are required to provide the reliability and to meet the system availability criteria of the
transport and storage system.
The main drivers for the moderate deviation (~55°) well design are:
to optimise the reservoir placement and particularly to maximise the separation between the injection
points;
to ensure that the wells are accessible for wireline intervention where electric cables are used to
transmit data about the well; and
to limit wellbore instability issues drilling.
The injection wells are designated P5W1; P5W2 and P5W3, named for the choice of the fifth platform
location and the drilling sequence number. The designations are often shortened to W1; W2 and W3.
On Figure 4.1 the co-ordinates are the target locations, the depths are based upon the penetration at the
top of Bunter Sandstone and the positional tolerance for each well is a 100m x 150m rectangle oriented
with the long side east to west.

K39: Subsurface Production Technology Report
8
Figure 4.1: Three injection wells in Plan and Section

K39: Subsurface Production Technology Report
9
4.2.1 Completion Design
The objective of the injection wells is to facilitate safe, reliable, and efficient construction, and subsequent
use of the storage site for the injection of CO2 for a period of 20 years. The wells are expected to cater for
a range of injection rates; from a minimum equivalent to 0.58MTPA to a maximum equivalent to
2.68MTPA.
Flow assurance studies indicate that the range of pressures and temperatures downstream of the choke
will under certain conditions and for relatively short duration will result in the presence of a two phase
region in the upper completion. Two phase flow will occur during certain start-up conditions, but will not
pose any risk to the mechanical integrity of the wellbore for either 4.5in or 5.5in tubing strings.
The mechanical configuration of the wells is the same as those typically used in oil and gas production
wells which can withstand continuous three phase flow, including handling of substantial fluid slugs and
consequently any oscillation/vibration due to short-term two-phase flow is not a cause for concern for the
CO2 injections wells. The design of the wells will consider:
the short-term CO2 injection ; and
the permanent store integrity with the need to monitor and verify this integrity in the post closure phase.
A perforated injection liner will be cemented in place against the sand face of the wellbore. Figure 4.2
shows a schematic of a generic completion design for the CO2 injection wells, where downhole, the sand
face of the well is completed with a 7in cemented and perforated liner.
A completion is a conduit for injection between the surface facilities and the aquifer. A 5½in upper
completion will be run comprising the following equipment:
permanent packer; note that this is a device that can be run into a wellbore with a smaller initial outside
diameter that then expands externally to seal the wellbore. It is constructed of materials that are easy
to mill out;
seal mandrel; note that this is a device which allows access to the well without removing the packer;
permanent downhole pressure;
temperature gauge system;
completion tubing; and
tubing retrievable safety valve.
Perforations will be in the lower (deeper) 50% of the Bunter Sandstone layer. The well and completion
design including material selection will be adequate for the expected minimum potential temperature
of -20°C to -30°C associated with Joule-Thomson cooling due to the surface CO2 injection choke. Note
that Joule-Thomson cooling is when a real gas expands from high to low pressure at constant enthalpy
(thermodynamic potential).
The completion and casing will be tested to a maximum of 5000psi (345bar). This is in excess of both the
anticipated final reservoir pressure (circa 200bar) and the pipeline design pressure of 200bar. The
pressure testing requirement is due to the maximum expected pressures associated with well operations
including tasks such as packer setting or perforating and are currently anticipated to be up to 4500psi
(310bar).

K39: Subsurface Production Technology Report
10
The design will allow for treatment of potential corrosion due to the periodic water wash treatments that
may be required to treat halite deposits. Halite deposits may occur in the near wellbore region of the
storage reservoir due to drying-out caused by the injected CO2.
Hydrate management, which may be required during well start-up after a long duration shut-in or after a
water wash treatment, will be by the use of MEG.

11
K39: Subsurface Production Technology Report
Figure 4.2: Generic Well Completion Design Schematic for CO2 Injection Wells

12
K39: Subsurface Production Technology Report
4.2.2 Wellhead
A standard design compact wellhead rated for 5,000 psi maximum working pressure in slim-hole configuration will be used for the injection wells; see the
schematic shown in Figure 4.3.
Figure 4.3: Typical Compact Wellhead and Injection Tree

K39: Subsurface Production Technology Report
13
4.2.3 Christmas Tree
A christmas tree, often called a production tree or dry tree, is a wellhead device installed at the surface of
the well to provide surface control of the subsurface conditions of the well.
A 5⅛in 5,000psi working pressure conventional surface tree with standard valve configuration will be
mounted after the upper completion has been installed.
The 5⅛ inch bore is compatible with 5½in tubing. The tubing hanger and wellhead will have ports to
accommodate between four and six downhole feed-throughs for hydraulic, electrical or fibre-optic functions
with redundant ports blanked. A conventional wireline plug profile would be machined into the tubing
hanger bore and the premium tubing connection below. Wetted surfaces and other internal seal surfaces
will be clad in corrosion resistant alloys to mitigate corrosion potential due to water from water wash
treatments.
Standard valve configuration will be used with manual lower master valve, remote actuated upper master,
manual swab, remote actuated production wing and manual kill valve.
The temperature rating for the tree will be API “L” (-46 C) or API “K” (-60°C). The technical difference being
that the lower temperature “K” rated tree and tubing hanger would use metal-to-metal seals whereas the
“L” tree and tubing hanger may use a combination of metal-to-metal and non-elastomeric seals. Flow
assurance and transient flow studies indicated that the minimum wellhead temperature will be
approximately -20°C.
The worst case exposure with respect to corrosion is expected at the base of the well where the
provisional recommendation is for use of high chromium material (25% Cr) with a Pitting Resistance
Equivalent Numbers (PREN) greater than 40.
Note that PREN (or PRE) numbers are a theoretical way of comparing the pitting corrosion resistance of
various types of stainless steels, based on their chemical compositions; they are useful for ranking and
comparing the different grades.

K39: Subsurface Production Technology Report
14
5.1 Temperature
A number of temperature measurements were made in the 42/25d-3 appraisal well. The reliability of the
measurement varies depending on the accuracy of the various tools and the time spent by the tools at the
depth of interest during measurement. This latter point relates to the time required for the tool to heat (if
moving down the hole) or cool (if moving up the hole) to the local temperature. The sets of measurements
at which the tools were given most time at any given depth were those associated with:
the Modular Dynamic Tester (MDT) measurements of pressure; the MDT long duration test (20
depths);
Wireline Head Thermomete (WHT) measurements (6 depths);
water sampling (3 depths);
mini-frac (1 depth in Röt Clay and 1 depth in Lower Bunter Sands); and
the Vertical Interference Tests (VIT) (3 depths).
Measurements associated with the highest tool running speeds include:
logging head thermometer measurements – made after a short circulation time and could therefore
have been affected by frictional heat generated during drilling as well as the relatively low volume of
drilling fluid used which had insufficient time to cool at the surface; and
quartz gauge measurements – MDT short duration points (20 depths)
The MDT long duration temperature measurements are considered most representative of the geothermal
gradient and a plot of the data is shown in Figure 5.1.
Re-arranging the equation shown on this figure gives:
29.160305.0 DTC
where:
TC Temperature in °C
D True Vertical Depth Sub-Sea (TVDSS) in m.
In the above equation, the temperature gradient within the Endurance Bunter Sandstone Formation is
estimated as 3.05°C/100m and this equates to a temperature of 55.9°C at a reference depth of 1300m
TVDSS.
5 Formation Temperature and Pressure Prediction

K39: Subsurface Production Technology Report
15
Figure 5.1: Temperature Gradient Measured in 42/25d-3
Temperature gradient from the MDT long duration test is considered most representative because it
incorporates the largest set of data points of all temperature measurements for the tools given the most
time at any given depth. It is also consistent with the data set that has been used for predicting pore
pressures within Endurance as discussed in the next section.
Figure 5.2 shows a regional geothermal gradient derived from a plot of bottom hole temperatures
calculated in wells within the area around the Endurance structure whilst Figure 5.3 shows a comparison of
this regional gradient with two other gradients generated from well 42/25d-3 data. The geothermal
gradient of the ‘All well (42/25d-3) data’ plot is 3.69°C/100m and incorporates data from the well test, the
Wireline Head Thermometer and the MDT measurements and includes an assumed seabed temperature
of 10°C. The ‘All well data’ plot is not considered representative because of the limited data points, issues
with tool malfunction and the insufficient time available during measurement for the tools to stabilize to
formation temperature. The regional data, on the other hand, can be misleading due to the different
lithologies found at equivalent TVDSS.
y = 32.772x - 533.93 R² = 0.8458
1300.0
1350.0
1400.0
1450.0
1500.0
1550.0
56.0 57.0 58.0 59.0 60.0 61.0 62.0 63.0 64.0 65.0
Gau
ge D
ep
th T
VD
SS (
m)
Gauge Temperature (degC)
MDT long duration points
MDT long duration points Linear (MDT long duration points)

K39: Subsurface Production Technology Report
16
Figure 5.2: Bottom Hole Temperature Calculated From Nearby Wells
Figure 5.3: Comparison of Endurance Temperature Measurements
y = 34.225x - 453.48 R² = 0.9644
0.0
500.0
1000.0
1500.0
2000.0
2500.0
3000.0
3500.0
10.00 30.00 50.00 70.00 90.00
TVD
SS (
m)
Temperature (degC)
42/25d-3 42/25-1
43/21-1 42/24-1
43/21-2 42/30-8
Seabed Linear (Area Geothermal Gradient)
0
200
400
600
800
1000
1200
1400
1600
0 10 20 30 40 50 60 70 80
Dep
th, m
TV
DSS
Temperature, oC
Regional data MDT Long Duration (well 42/25d-3)
Well Test (well 42/25d-3) at 1362.82 m TVDSS MDT (well 42/25d-3) at 1300 m TVDSS
Seabed at 62 m TVDSS All well (42/25d-3) data

K39: Subsurface Production Technology Report
17
5.2 Pore Pressure Prediction
Knowledge of formation pressure is useful for anticipating potential bore hole stability problems and to
design suitable mitigation measures. For formations that have not been penetrated by wells, a number of
methods were developed for inferring pore pressures. These usually fell into two broad approaches:
1. direct methods – the use of crossplots or overlays to estimate pore pressure deviation from a
designated normal pressure trend line;
2. effective stress methods – based on the interpretation of stress change effects; compaction and
changes in elastic wave velocities, as only a function of the vertical effective stress (𝜎) according to the
relation.
𝜎 = 𝑆 − 𝑃
where:
𝜎 vertical effective stress
𝑆 total vertical stress
𝑃 pore pressure
As the Endurance structure has been penetrated by three wells, two of which have had direct pore
pressure measurements, and given that all available information from Endurance suggest that it is highly
unlikely that the Bunter Sandstone is compartmentalised, standard pore pressure prediction techniques
were not required for the Endurance structure. Instead, the combined plot of the RFT pressure data from
well 42/25-1 and the long duration MDT pressure data from well 42/25d-3 in Figure 5.4 shows that the
pressure gradient within Endurance is well behaved and can be approximated as 0.1147 bar/m across the
Bunter Sandstone reservoir.
From Figure 5.4 the MDT pressure data, can be stated as
𝑃 = 0.1147𝑍 − 8.7057
where:
𝑃 pore pressure [bar] at a given depth 𝑍 [m TVDSS]
Therefore, the pore pressure at 1405.3m TVDSS, which is the midpoint of perforations for the well test
performed in the 42/25d-3 appraisal well, is calculated as 152 ±0.5 bar. This is in agreement with the
calculated final pressure at the end of the well test build-up period of 151.8 bar at the same depth.
A comparison of the MDT and well test pressure data is shown in Figure 5.5.

K39: Subsurface Production Technology Report
18
Figure 5.4: RFT Pressure Data from 42/25-1 and MDT Pressure Data from 42/25d-3
Figure 5.5: Comparison of Well Test and MDT Pressure Data

K39: Subsurface Production Technology Report
19
An inflow and tubing performance model was built to determine the bottom hole injection (pressure and
temperature) conditions for a variety of perforation intervals in the six zones (L3B, L3A, L2B, L2A, L1B and
L1A) identified within the Bunter. This was modelled using the PROSPER software tool.
This information was then used in determining the probability and extent of any fracturing using MPwri
software. In order to ascertain the impact on the near wellbore formation from the injection of cold CO2, a
fracture model has been developed (using the MFrac design and evaluation simulator software for fracture
design and treatment analysis) with the objective of assessing:
the potential for the extent of fracturing in the Bunter Sandstone Formation; and
the impact of fracturing on inflow performance.
6.1 PROSPER Modelling
PROSPER models were used to assess the well system performance (vertical lift and inflow). A total of six
models were created in order to assess the different zones identified within the Bunter Sandstone. These
zones exhibit slightly different properties in terms of thickness, pressure, temperature, permeability and
porosity. Each will have an impact on both the inflow performance and fracturing propensity.
6.1.1 Formation Properties
The formation properties used in both the PROSPER model and the MFrac model are shown in Table 6.1.
These properties were taken from an average of offset well data currently employed in the static (Petrel
geological) model. Note the decreasing permeability and porosity with depth. The measured depth is from
the well trajectory.
Table 6.1: Bunter Formation Properties Used in the Modelling
Bunter Zone Top (mMD)
Thickness (m)
Pressure (bar)
Temperature (°C)
Permeability (mD)
Porosity (Fraction)
L3B 1751.7 24.2 130.8 56.2 1760 0.28
L3A 1775.9 38.4 132.8 56.6 725 0.24
L2B 1814.3 102.5 136.0 57.7 710 0.24
L2A 1916.7 97.0 142.9 59.9 570 0.23
L1B 2013.7 110.2 150.6 62.4 200 0.20
L1A 2123.9 105.4 159.5 65.2 100 0.18
6.1.2 Well Trajectory and Construction
The well details were based on designs outlined in the drilling plan Note that PROSPER only allows for 20
rows of well trajectory data using measured depth, true vertical depth and angle, so the input data was
edited to remove sections of the well profile which remained constant.
The trajectory used for modelling the tubing performance is shown in Figure 6.1.
6 Injectivity and Thermal Fracturing Analysis

K39: Subsurface Production Technology Report
20
Figure 6.1: Injection Well Trajectory from 42/25d-D W1
In order to have a more accurate assessment of the changes in pressure and temperature along the
wellbore and hence at the bottom hole conditions, a full enthalpy balance model was selected in
PROSPER. This type of model requires additional input for the well construction and lithological
parameters in order to accurately determine U-values and thus heat transfer.
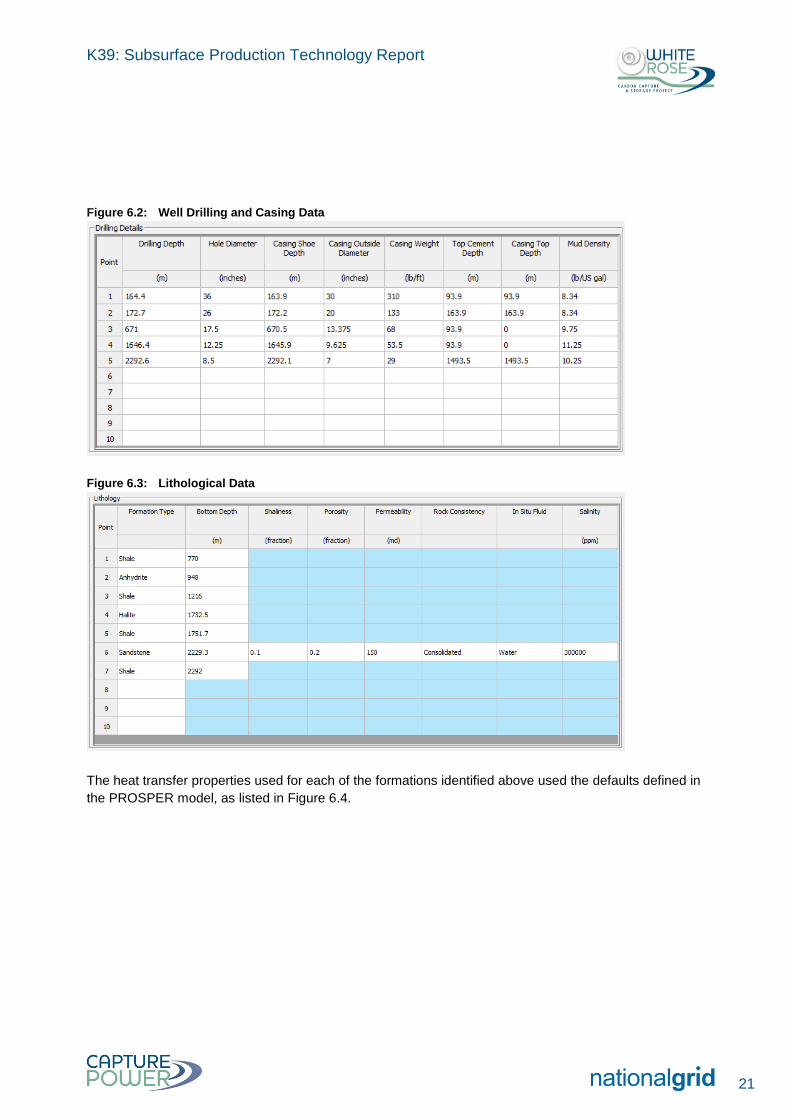
The input data was taken from the drilling design and prognosed lithology presented in the drilling plan and
is shown in Figure 6.2 and Figure 6.3. Lithological (rock formation) properties are shown in Figure 6.4.
The tubing size was 5½in tubing throughout.
K39: Subsurface Production Technology Report
21
Figure 6.2: Well Drilling and Casing Data
Figure 6.3: Lithological Data
The heat transfer properties used for each of the formations identified above used the defaults defined in
the PROSPER model, as listed in Figure 6.4.

K39: Subsurface Production Technology Report
22
Figure 6.4: Rock Properties for Heat Transfer Calculations
6.1.3 System Performance Sensitivities and Results
A sensitivity test was carried out to the length of the perforation interval for each of the six defined layers
within the sandstone to establish the impact on inflow and bottom hole injection properties of the CO2.
The perforation intervals were 5m, 10m, 20m, 30m and 50m and were are located such that their midpoint
was at the midpoint of one of the six layers. Note that due to the thickness of L3B and L3A, 30m and 50m
sensitivity tests were not included.
The input parameters for each of the sensitivities were:
wellhead injection pressure 82bar;
injected fluid temperature 5°C (at the wellhead);
injected fluid rate 141MMscf/day (2.7MTPA); and
skin 0, note that a positive skin effect indicates extra flow resistance near the wellbore, and a negative
skin effect indicates flow enhancement near the wellbore.
The results of the PROSPER modelling are shown in Table 6.2 and Table 6.3. As the thickness of the L3B
formation was less than 30m, analysis of injectivity was not carried out for the 30m and 50m perforated
cases. Similarly, for L3A the 50m case was not assessed.
Table 6.2: VLP System Injection Rates in MMscf/day (MTPA)
Bunter Zone Perforated Interval
5m 10m 20m 30m 50m
L3B 138 149 152 - -
L3A 115 135 142 144 -
L2B 125 149 157 159 160
L2A 114 140 150 152 153
L1B 73 103 122 127 130
L1A 47 70 87 92 95

K39: Subsurface Production Technology Report
23
Remember that these values are for a skin of 0. It is unlikely, for example, that 20m of perforations in L3A
will result in an injectivity of 142MMscf/day.
Using this example, with a skin of 0, 5, 10 and 20, the following reductions in inflow performance are seen:
L3A 20m perfs 0 skin 142MMscf/day;
L3A 20m perfs 5 skin 131MMscf/day;
L3A 20m perfs 10 skin 120MMscf/day; and
L3A 20m perfs 20 skin 100MMscf/day.
It is important to understand the bottom hole conditions during injection for input into the fracturing model.
Table 6.3 lists the pressures, temperatures and fluid density taken from the gradient survey for each of the
various layers.
Table 6.3: Bottom Hole Injection Conditions @141 MMscf/day (2.68 MTPA)
Bunter Zone Reservoir Pressure
(bar)
Bottom Hole Injection Pressure
(bar)
Change in Pressure
ΔP (bar)
Bottom Hole Injection
Temperature (°C)
Fluid Density
(kg/m3)
L3B 130.8 150.52 19.7 14.0 935.3
L3A 132.8 152.43 19.6 14.3 935.2
L2B 136.0 155.52 19.5 14.7 934.9
L2A 142.9 159.91 17.0 15.4 934.5
L1B 150.6 164.46 13.9 16.1 934.1
L1A 159.5 169.20 9.7 17.1 933.6
By comparison, work presented by Genesis indicated that bottom hole temperatures would vary between
10°C and 27°C depending on reservoir pressure, injection rate and season. However it is noted that in
some cases the selection of a wellhead temperature is significantly different from that used in this analysis;
WHIT ranges from 1.2°C to 10.6°C in winter. Given the length of the subsea pipeline, the arrival
temperature of the CO2 at the wellhead will not be related to the rate or exit temperature of the CO2
compressor/pump and will only be a function of the seasonal change of the seabed temperature.
The following pages (Figure 6.5 to Figure 6.10) present the system curves for each of the layers showing
the inflow performance based on the perforated interval. Note that because this is an injection well, the
Inflow Performance Relation (IPR) curves increase as they move to the left of the graph while the Vertical
Lift Performance (VLP) curve (yellow line) decreases.
Note that there is a decreasing rate of return in terms of inflow and perforation interval, with little difference
being seen in terms of injectivity between 30m and 50m.

K39: Subsurface Production Technology Report
24
Figure 6.5: Bunter Layer L3B System Performance Curves
Due to the high average permeability in layer L3B, the inflow performance is high even for short perforated
intervals. However, due to the possibility of fracturing this zone, it is not recommended that it should be
perforated at the outset.

K39: Subsurface Production Technology Report
25
Figure 6.6: Bunter Layer L3A System Performance Curves

K39: Subsurface Production Technology Report
26
Figure 6.7: Bunter Layer L2B System Performance Curves

K39: Subsurface Production Technology Report
27
Figure 6.8: Bunter Layer L2A System Performance Curves

K39: Subsurface Production Technology Report
28
Figure 6.9: Bunter Layer L1B System Performance Curves
Note that the inflow curve here is very low and shallow due to the low average permeability in this layer
and thus a greatly reduced injectivity even for a 50m perforated interval.

K39: Subsurface Production Technology Report
29
Figure 6.10: Bunter Layer L1A System Performance Curves
Note that the inflow curve here is very low and shallow due to the low average permeability in this layer
and thus a greatly reduced injectivity even for a 50m perforated interval.
Looking at the injectivity requirement, and the impact of skin, consideration should be given to perforating
in both the L1B and L1A zones of the Bunter Sandstone. This would:
ensure adequate injectivity;
allow for future perforating further up the well should perforations collapse or the formation become
damaged; and
minimise the chances of thermal fracturing compromising the seal (caprock) integrity.

K39: Subsurface Production Technology Report
30
6.2 Fracture Modelling
6.2.1 Introduction
Three aspects of fracture modelling have been considered during the FEED work. They are:
3. fracturing of the primary seal/cap rock;
4. near well thermal stress induced fracturing; and
5. near well hydraulically induced fracturing.
The first is a function of the average pressure and temperature in the reservoir; the second two are a
function of the injection of CO2 and are local to the perforations through which the CO2 is injected from the
wells to the reservoir.
The perforating strategy is to perforate only the deeper half of the wells within the reservoir zone. This
strategy is for two reasons, firstly to optimise the solution storage of CO2 in the formation brine and
secondly to minimise the cooling of the primary seal formations the cooling of which may slightly weaken
their pressure competence.
The injected CO2 is generally cooler than the reservoir rock, but the minimum expected bottom hole
injection temperature is 20°C compared to the reservoir temperature of 60°C. This temperature difference
in conjunction with the overpressure caused by the injection results in thermally induced fractures.
Hydraulically induced fractures can occur without any thermal stress and, in this case depend on the over
pressure in the near wellbore region. The higher the native permeability and the longer the perforated
interval, the lesser will be the hydraulically induced fractures. Until the injection wells are drilled and a
precise evaluation of the local permeability is made the extend of these fractures will not be known but in
all cases can be expected to have less than 100m horizontal and 10m vertical extent under the highest
thermal stress condition. Clearly then, these fractures will not affect the cap rock/seal.
The modelling of the cap rock/primary seal fracturing is based on the geomechanical model and the overall
average pressure predicted by the simulation model. Even in the worst case sensitivities using zero
adhesion fracture surfaces and where a weakening of the caprock occurs as a result of the cooling of it by
the injected CO2, no adverse effects are predicted.
6.2.2 Endurance Model
Fracture modelling was carried out using the MPwri which is software designed for evaluating the effects of
injecting large volumes of fluid over long periods of time with fracture efficiencies approaching zero. MPwri
is very similar to MFrac, but includes thermos-elastic and poro-elastic components and is designed for
analysing the long term injection of fluids. The rock properties used in the model are shown in Table 6.4
and were taken from the model developed in VISAGE. Note that VISAGE is a finite-element
geomechanics simulator, which models problems to enable the planning and mitigation of risks, is part of
the Petrel software platform.

K39: Subsurface Production Technology Report
31
Table 6.4: Endurance Geomechanical Properties
Zone Effective σh (bar)
Total σh (bar)
Stress Gradient (bar/m)
Young's Modulus (bar)
Poisson's Ratio
Röt Halite 120.3 235.0 0.211 82233 0.38
Röt Clay 101.8 224.7 0.186 138600 0.25
L3B 74.2 205.0 0.168 102400 0.26
L3A 72.3 205.1 0.168 95800 0.26
L2B 74.6 210.6 0.169 104600 0.25
L2A 79.1 221.9 0.173 105900 0.25
L1B 84.7 235.4 0.174 113600 0.25
L1A 91.8 251.4 0.177 116500 0.24
Bunter Shale 143.8 301.1 0.202 164000 0.24
As a sense check the bottom hole injection pressures were plotted, see Figure 6.11 in conjunction with the
reservoir pressure and stress data from Table 6.4. The table shows that the bottom hole injection pressure
is, in all cases lower that the minimum horizontal stress – suggesting that fracturing will not be an issue.
However, this does not take into account any thermal effects that will occur as a result of introducing cold
CO2 into a hot formation.
Figure 6.11: Reservoir Pressure, BHIP and Min Horizontal Stress
6.2.3 Fracturing Data Input
The fracture model was developed with an ellipsoidal (2D fluid loss model) with dynamic fluid loss (based
on a calculated fracture skin) and thermal and poro-elastic components. In order to allow the injectivity to
run for 20 years, all options selected for the model in MPwri are shown in Table 6.5.

K39: Subsurface Production Technology Report
32
Figure 6.12: General Fracture Model Options
A total of five fracturing models were developed to allow for analysis of injection for different perforated
intervals into each of the six layers. The tops and bottoms of these layers are shown in Table 6.5. Note
that a 30m and 50m interval in layer L3B and a 50m interval in layer L3A extends out of the interval so this
has not been considered.
Table 6.5: Top and Bottom Measured Depth of Perforated Intervals per Layer
Zone Mid Formation
(mMD)
Top and Bottom (Bott) of Perforated Interval (mMD)
5m 10m 20m 30m 50m
Top Bott Top Bott Top Bott Top Bott Top Bott
L3B 1763.8 1761.3 1766.3 1758.8 1768.8 1753.8 1773.8 - - - -
L3A 1795.1 1792.6 1797.6 1790.1 1800.1 1785.1 1805.1 1780.1 1810.1 - -
L2B 1865.5 1863.0 1868.0 1860.5 1870.5 1855.5 1875.5 1850.5 1880.5 1840.5 1890.5
L2A 1965.2 1962.7 1967.7 1960.2 1970.2 1955.2 1975.2 1950.2 1980.2 1940.2 1990.2
L1B 2068.8 2066.3 2071.3 2063.8 2073.8 2058.8 2078.8 2053.8 2083.8 2043.8 2093.8
L1A 2176.6 2174.1 2179.1 2171.6 2181.6 2166.6 2186.6 2161.6 2191.6 2151.6 2201.6
The treatment schedule is based on injection of CO2 at a rate of 2.68MTPA for a period of 20 years.
For the purposes of input, this was converted into a volumetric rate in m3/min.
2.68 MTPA = 2,680,000,000kg/yr = 5,099kg/min. The bottom hole injection pressure from the PROSPER
model was an average of 934.6kg/m3 (Table 6.3) so the injection rate used throughout was 5.45m
3/min.

K39: Subsurface Production Technology Report
33
6.2.4 Fluid Loss Parameters
Figure 6.13: Fluid Loss Parameters
6.2.5 Consistency with VISAGE
The VISAGE model assumes an average inflow across the entire Bunter. Under such conditions, no
fracturing is noted. A similar analysis was carried out in MPwri to ensure that if the entire interval was
perforated that no fracturing would occur and this was found to be the case.
6.2.6 Base Case Results
The base case is considered to be injection into each layer separately with a limited perforation interval as
noted previously; 5m, 10m, 20m, 30m and 50m. The results give the fracture lengths shown in Table 6.6
and Figure 6.14.
Table 6.6: Base Case Fracture Properties
Zone Perforated Interval
5m 10m 20m 30m 40m
L3B 6.5 7.1 7 - -
L3A 14.5 13.8 15.7 4.8 -
L2B 9.6 9.3 6.7 7.6 5.03
L2A 8.3 6.4 7.1 5.4 1.46
L1B 163 172 172 167 163
L1A 75.0 47.2 42.6 41.0 36.5

K39: Subsurface Production Technology Report
34
Figure 6.14: Comparison of Fracture Lengths and Perforated Intervals
A number of things should be noted about these results:
due to the long period of continuous injection assumed for the base case, fracturing is not greatly
affected by the length of the perforation intervals;
the exceptionally large fracture intervals seen in layers L1B and L1A, which are a result of the
combined increase in Young’s modulus for these zones along with a significant reduction in
permeability; the long period of continuous injection impacts on the fracture length; and
in all cases the height of the fracture is contained within the injected zone.
Typical times to reach the full fracture length are between 12 years and 17 years, although in L1B
extension was still continuing at the 20 year shut-off period. The volume of the cooled region is defined by:
𝑉𝑐 =(𝜌𝑐)𝑤𝑉𝑖
(𝜌𝑐)𝑟(1 − 𝜑) + (𝜌𝑐)𝑤𝜑(1 − 𝑆𝑜𝑟) + (𝜌𝑐)𝑜𝜑𝑆𝑜𝑟
where:
Vc volume of cooled zone; φ Porosity;
ρ density (w = water, r = rock, o = oil); Vi Volume of injected fluid;
c compressibility (w = water, r = rock, o = oil); and
Sor residual saturation of the in-situ fluid.
The cooled region is approximated to an elliptical inclusion with volume Vc. Reduced porosity and hence
permeability will result in a more rapid expansion of the cooled zone as the total volume of the fluid will
have to travel further to achieve the same volumetric input for the same rate of injection.
1 10 100 1000
L3B
L3A
L2B
L2A
L1B
L1A
Fracture Length (m)
Bu
nte
r S
an
dsto
ne Z
on
e
5 m
10 m
20 m
30 m
50 m
K39: Subsurface Production Technology Report
35
The governing equations for thermos-elastic and poro-elastic injection are based on numerical simulations.
The average thermal stress perpendicular to the fracture face in the interior of an elliptical cooled region of
any height is given by:
(1 − 𝜈)Δ𝜎3|𝑇
𝐸𝛽Δ𝑇= ℱ(𝑎0, 𝑏0, ℎ)
Where:
ν Poisson’s Ratio;
Δσ3│T change due to thermo-elastic stress;
E Young’s modulus;
β matrix function;
ΔT Temperature differential;
a0 major ellipsoidal thermal front axis;
b0 major ellipsoidal thermal front axis; and
h height of fracture.
Where the function is the thermos-elastic coefficient related to the fracture length, width and height. The
region of changed rock temperature is a sharp boundary interface which progresses outward in an
ellipsoidal shape.
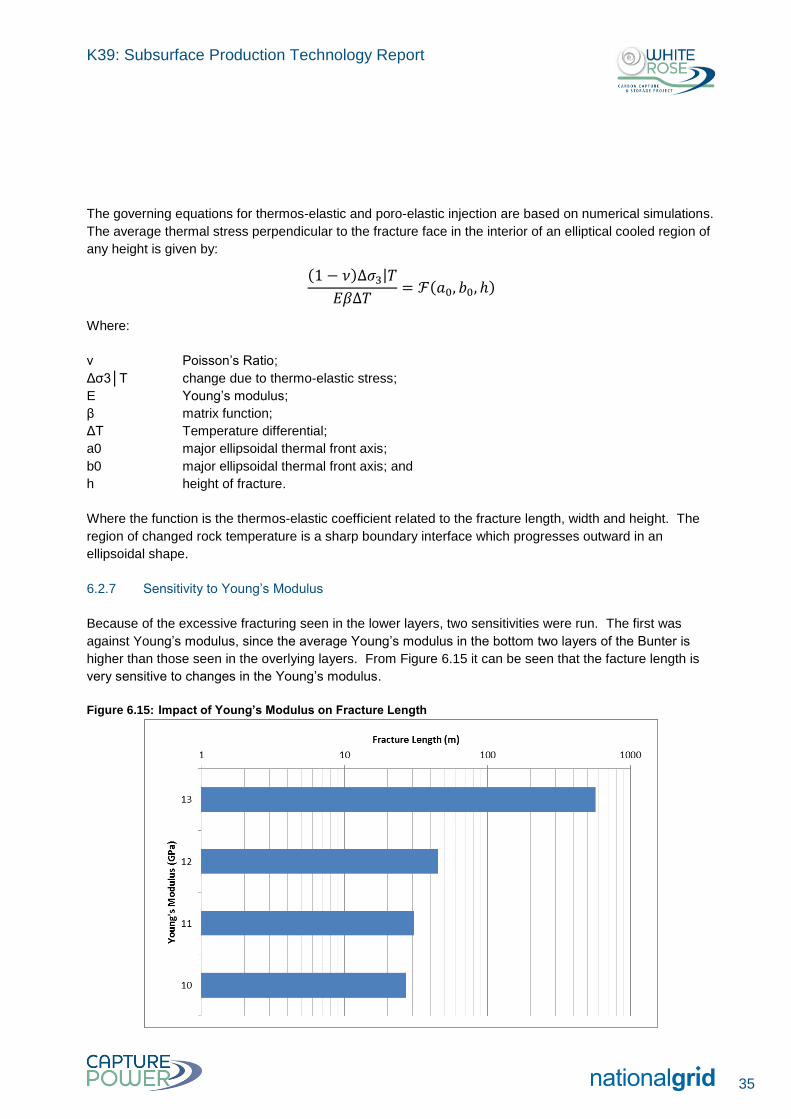
6.2.7 Sensitivity to Young’s Modulus
Because of the excessive fracturing seen in the lower layers, two sensitivities were run. The first was
against Young’s modulus, since the average Young’s modulus in the bottom two layers of the Bunter is
higher than those seen in the overlying layers. From Figure 6.15 it can be seen that the facture length is
very sensitive to changes in the Young’s modulus.
Figure 6.15: Impact of Young’s Modulus on Fracture Length

K39: Subsurface Production Technology Report
36
A second sensitivity, which accounted for no injection over a period of two months every year for twenty
years, had no significant impact on the final fracture length, although the fracture closed during each shut-
in period.
6.2.8 Shape of Fractures
The evolution of the fracture geometry is in line with what would be expected given a decreasing
permeability and increasing Young’s modulus with depth. The result is that the fracture tends to migrate
upwards from the perforation interval (as per Figure 6.16).
Figure 6.16: Typical Thermal Fracture in the Bunter
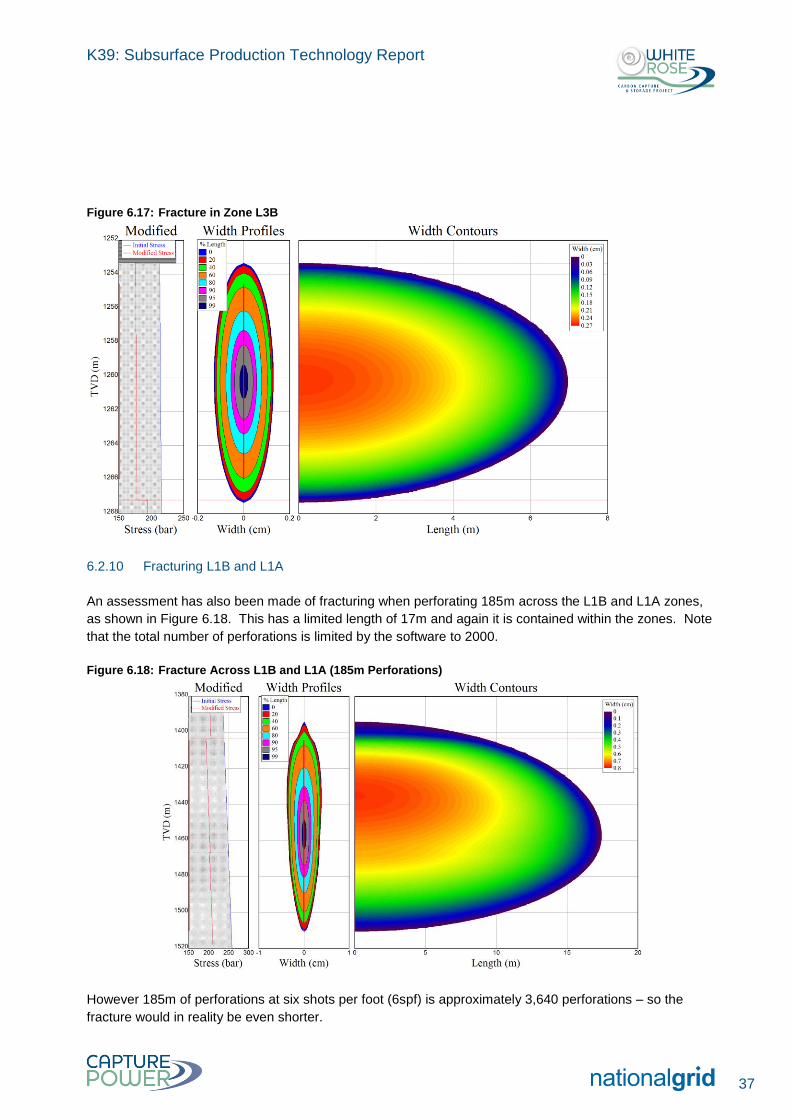
6.2.9 Fracturing in L3B
Fractures resulting from injection into the upper zone are contained within the zone as shown in Figure
6.17 However the fracture (in all perforated cases) does reach the base of the Röt Clay. As a result it
would be expected that there would be a high rate of flow near the wellbore up to the Röt Clay which could
result in integrity issues with both the caprock at the near wellbore and the casing/cement interface.
Perforating in the high permeability upper zone should be avoided.
K39: Subsurface Production Technology Report
37
Figure 6.17: Fracture in Zone L3B
6.2.10 Fracturing L1B and L1A
An assessment has also been made of fracturing when perforating 185m across the L1B and L1A zones,
as shown in Figure 6.18. This has a limited length of 17m and again it is contained within the zones. Note
that the total number of perforations is limited by the software to 2000.
Figure 6.18: Fracture Across L1B and L1A (185m Perforations)
However 185m of perforations at six shots per foot (6spf) is approximately 3,640 perforations – so the
fracture would in reality be even shorter.

K39: Subsurface Production Technology Report
38
6.3 Perforating Strategy
The perforation strategy must achieve the following criteria:
allow the injection of 2.68MTPA of CO2 into the Bunter Sandstone Formation;
prevent the fracturing of the formation outside the confines for the Bunter Sandstone thus maintaining
store integrity; and
cater for future perforating should existing perforations become plugged or collapse or the near
wellbore becomes damaged.
Based on the inflow performance and fracturing analysis shown earlier, it is suggested that a minimum of
185m of perforating be carried out across zones L1A and L1B. The perforations should be 20m to 30m
above bottom hole. In addition, to allow additional perforating to be carried out at shallower depths in the
Bunter, this will also provide ample separation between adjacent injection wells which will be at 55°
degrees deviation away from one another. Comparing this scenario with both non-fractured and fractured
formation shows that sufficient injectivity can be achieved. The calculation for the system curve shown in
Figure 6.19 includes the following assumptions:
average permeability across L1B and L1A is assumed to be 150mD; and
dimensionless conductivity of fracture for fractured well case is 10.
Figure 6.19: System Curve for Non-Fractured and Fractured Comparison
This solution provides sufficient injectivity, minimises fracture propagation should it occur and allows for
further perforating should it be required at a later date.

K39: Subsurface Production Technology Report
39
7.1 CO2 Flow Control Sequence
Figure 7.1 is a schematic of the main CO2 process flow scheme at the offshore storage facility from the
riser up to and including the wellhead.
Dense phase CO2 is received at the platform through a riser up to the injection manifold. During years 1 to
5 the arrival pressure is controlled at the injection manifold located on the platform by a master pressure
controller 15-PIC-001 (first load flow rate ranges from 0.58MTPA to 2.68MTPA). As the flow rate increases
from year 5 onwards, necessitating the requirement for CO2 Booster Pumps Onshore at Barmston, arrival
pressure at the platform becomes a function of the pressure controller at Barmston (33-PIC-018) and the
master pressure controller at the platform (15-PIC-001). Both pressure controllers will be configured to
ensure that the operating pressures in the offshore pipeline do not exceeded Maximum Allowable
Operating Pressure (MAOP). Pressure and flow rates will vary throughout the life of the facility within the
design parameter ranges.
If the Barmston pumps are not operational; bypassed during first load or turndown operation, the injection
manifold pressure at the platform as well as the upstream subsea and onshore pipeline is controlled by the
platform master pressure controller 15-PIC-001 alone.
The CO2 fluid flow to the individual well is controlled by six individual choke valves 10-HCV-
100/200/300/400/500/600 of the particular well in conjunction with injection manifold pressure controller 15-
PIC-001. When a particular well, Wellhead No. 1 for example is under CO2 injection, the wash water
Emergency Shut Down Valve (ESDV) must be closed and also the nitrogen supply must be closed.
A connection to the Future CO2 Booster Pumps (04-PU-330033-A/B/C-D200) is provided upstream of the
manifold. From year 10 onwards, the flow of dense phase CO2 to the offshore storage facility will be up to
a design maximum of 17MTPA and a portion of the CO2 will be transported to additional storage facilities
or subsea wells via the booster pumps. It is likely that the flow to the wellheads will be fixed using flow
control on the individual wellhead lines (10-FY-100/200/300/400/500/600) and the offshore future booster
pumps will operate on suction pressure control (at the manifold by 15-PIC-001), which adjusts variable
speed drive motors.
7 Flowline Well Interaction

K39: Subsurface Production Technology Report
40
Figure 7.1: Overall Process Flow Scheme (Major Control Loops)
7.2 Process Systems
The process systems of the offshore storage facility of the White Rose Carbon Capture and Storage
Project include the following:
7.2.1 CO2 Reception Facilities (Offshore Pipeline and PIG Receiver)
A maintenance valve 34-HV-009 and topsides pipeline riser 34-ESDV-005 are provided to enable isolation
of the platform topsides from the pipeline in the event of an emergency, for example, low pressure is
observed at the CO2 injection manifold.
Pressure transmitter, 34-PT-042, equipped with high and low alarms, and temperature transmitter
34-TT-017, are provided to allow operations to monitor the process conditions during topsides
depressurisation, or re-pressurisation. During re-pressurisation the temperature will be low due to the
pressure drop across the 34-HV-009 bypass valve. Operations will control the rate of depressurisation, or
re-pressurisation, to ensure minimum metal temperatures are not breached. In addition to 34-PT-042, the
pressure transmitter 34-PT-043 (equipped with high and low alarms) downstream of 34-ESDV-005 may be
used for pipeline ESD valve leak testing purposes.
When conducting PIG operations, the temperature and pressure transmitters upstream and downstream of
the throttling valve, 34-HV-011 (34-TT-018, 34-PT-043, 34-TT-019 and 34-PT-045 with high and low
alarms) enable operations to adjust the throttling rate to stay within the required operating temperature and
pressure parameters.

K39: Subsurface Production Technology Report
41
Differential pressure transmitter 35-PDIT-031 provides confirmation that the PIG is not stuck in the minor
barrel. 35-PT-032 (high operating pressure range) and 35-PT-033 (low operating pressure range) will be
used by operations to confirm that the PIG trap is completely depressurised prior to opening of the trap
door. Any trapped pressure will be observed and a high pressure alarm is provided. The PIG receiver end
closure is provided with a mechanical pressure safety interlock to prevent opening until fully depressurised.
7.2.2 CO2 Filtration
A differential pressure transmitter (32-PDIT-016) across all filters is provided to monitor filter operation.
The pressure and temperature instrumentation downstream of the filters 32-PI-019/020/021 and
32-TT-001/002/003 allow operations to control the rate of filter depressurisation to ensure minimum metal
temperatures are not breached (a low temperature alarm is provided for each transmitter); see
Section 7.2.6.
Each filter inlet isolation valve 32-XV-001/005/009 may be operated through the ICSS system or when the
platform is unmanned, supervisory control is available from the NGCL control centre SCADA (Supervisory
Control And Data Acquisition) system. The isolation valve is motorised and provided with limit switches,
which provides feedback to the operations team.
A common filter bypass 32-HV-025, locally operated, is provided at full line size. A ‘soft’ valve interlock, in
the ICSS, will be included to ensure that the flow within the CO2 transportation system is uninterrupted,
when taking a filter out of service for maintenance; a filter can only be taken offline when another filter is
brought on stream. This also prevents inadvertent closure of a filter from through the ICSS or SCADA
system.
The quick opening end closures will be fitted with mechanical safety devices to ensure filter is fully
depressurised before the closure can be opened.
7.2.3 CO2 Injection Manifold and Wellheads
Flow rates to individual injection wells will be displayed by 10-FY-100/200/300. The chokes 10-HCV-
100/200/300 will be modulated by 15-PIC-001 to ensure the upstream CO2 system remains in the dense
phase at all times (above 90 barg) and also pressure does not become too high (pressure is to remain
below the MAOP of the onshore and offshore pipelines). Failure of this control loop causing the chokes to
open could lead to vaporisation of the CO2. It is predicted that this endothermic phase change could result
in low temperatures; note that in an endothermic reaction, energy is taken in from the surroundings. A low
pressure trip from 15-PT-002 (located on the injection manifold) is therefore provided to shut-in the
wellheads where backpressure control is lost and low pressure is detected. A low temperature alarm from
15-TT-001 is located just upstream of the manifold.
The platform controls (ICSS) will automatically regulate the platforms operation within the desired safe
limits of the operating envelope. In unmanned mode, all offshore pipeline, platform and storage facilities
can also be remotely operated via a SCADA system located at the onshore NGCL control centre.
For future platform wellheads the control arrangement will be identical to the three initially installed
wellheads. For the future subsea wellheads the control philosophy will be the same as for the initially
installed platform wellheads however the design of these is outside the scope of the FEED.

K39: Subsurface Production Technology Report
42
It is likely that there will be an interface between the downhole instrumentation and the control system at
the wellhead. The following instrumentation is likely to take measurements and be relayed back to the
control system:
downhole pressure and temperature measurement;
inner annulus pressure;
outer annulus pressure; and
choke outlet pressure.
7.2.4 Future CO2 Booster Pumps
When CO2 injection into the Endurance storage reservoir is no longer operable, the CO2 booster pumps
will export the CO2 to another facility.
The pump control shall be fully developed during the detailed design phase but is expected to be on future
booster pump suction pressure control. The pressure at the manifold will be controlled by modulating the
variable speed drives of the future CO2 booster pumps. The flow to the wells will be fixed on flow control
and will be governed based on factors such as the number of available wells, pipeline operating pressure
and reservoir pressure. Any surplus flow will be routed to future storage sites outwith the Endurance
aquifer location via the future CO2 Booster Pumps. The use of flow control at the pumps is not preferred
as this may lead to potential pipeline packing or unpacking due to flowmeter inaccuracies.
When operating in this mode, in the event of a low flow/no flow scenario from onshore, and falling system
pressure, the pressure controller, 15-PIC-001 (on the manifold) will reduce pump speed and bring pumps
offline as necessary to maintain system pressure. However, choke flow controller 10 FY-100/200/300 will
then open the choke valves to maintain flow to the wells, reducing system pressure again and potentially
causing phase separation in the pipeline. Therefore 15-PIC-001 should be configured to override (via a
low signal selector) 10-FY-100/200/300 at the low pressure alarm setting 15-PIC-001 L and close the
choke valve to prevent phase separation in the pipeline.
Assuming that similar pumps as those used in the onshore pumping station are installed, the shut in head
pressure of the pumps will be higher than the export line design pressure (200barg). Hence mechanical
HIPPS valves are envisaged on the pumps common discharge to protect the pipeline from overpressure in
the event of a blocked discharge.
The pumps will be tripped and suction, discharge and recycle ESDVs will be closed on low inlet pressure
(from 33-PT-050/054/058) or low flow (from 33-FT-017/019/021). In the event that the low pressure trip
from 15-PT-002 is activated, the pump will trip and only the suction and discharge ESDVs will be closed.
The CO2 booster pumps recycle cooler is required to remove the heat from the CO2 generated whilst the
pumps are operating in recycle mode at commissioning/proving (which would otherwise heat and
potentially vaporise the CO2 and exceed system design temperatures). Only one booster pump will be
commissioned/proved at a time. During commissioning/proving, flow controller, 33-FIC-018/020/022 will
open the recycle flow control valve. The temperature of the CO2 exiting the recycle cooler and returning to
the inlet of the CO2 booster pumps will be controlled by 33-TIC-017 which will modulate the flow of
seawater coolant via 33-TV-017 until the process set point is reached. High and low temperature alarms
on the CO2 outlet provide indication that there is insufficient seawater or overcooling is occurring.

K39: Subsurface Production Technology Report
43
The CO2 booster pump recycle cooler outlet pipework is provided with a temperature transmitter 33-TT-018
on the CO2 side with a high-high temperature trip to stop the CO2 booster pump which is operating in
recycle. This ensures downstream equipment design temperatures are not breached in the event sufficient
cooling duty is not provided.
Due to the type of recycle cooler installed (shell and plate type), a leak from the high pressure CO2 side to
the low pressure seawater side is unlikely, however a high pressure trip from 45-PT-010 initiates closure of
the seawater inlet and outlet ESDVs (45-ESDV-001/002) to protect the low pressure side. In addition to
this action, both the seawater lift pumps and temporary wash water package will be tripped. A high
pressure alarm (45-PI-011) acts as a pre-warning to this trip.
7.2.5 Water Production
If deemed to be required to decrease the downhole pressure then future water production from the
reservoir will flow to the produced water caisson via flow transmitter 43-FT-001. The future design of the
water production flowlines shall include one ESDV in each incoming line (43-ESDV-001 and 43-ESDV-
002). A sampling facility for analysis of the incoming stream is also specified to monitor the CO2 content, as
breakthrough of CO2 could lead to corrosion issues and degradation of the topsides pipework.
7.2.6 Process Venting & Process Isolation
Pressure and temperature indication has been provided at various locations in the process to allow
conditions to be monitored during depressurisation. Venting is a manual activity intended to release CO2
inventory for various reasons. It can be initiated from the remote (onshore) control centre. The upstream
valve is Locked Closed (LC), due to the commercial implication of accidental release of inventory, which
has already been metered at the Barmston Pumping Facility.
The location of ESDV, SDV, motorised and manual isolation and positive isolation points are primarily
based on meeting the need for safe isolation of pipeline, equipment and instrumentation for maintenance,
operation or inspection purposes due to the high operating pressures of the system and the hazardous
nature of CO2. Throughout the offshore storage facility, isolation is provided based on an assessment of
the fluid service and flange rating of the equipment/pipework.
Actuated shutdown valves have been considered as a means for providing maintenance isolation, but only
if they are designated as tight shut-off, in line with the relevant design code and have a fail close
configuration. The shutdown valve is located furthest away from the pipeline/source of pressure that the
system is being isolated from.
Generally, pressure instruments (including differential pressure tappings on flow instruments) utilise
integral double block and bleed valves in CO2 service. Isolation shall be met with piping valves not
instrument valves.
K39: Subsurface Production Technology Report
44
The key roles and responsibilities of the storage operator of the offshore CO2 storage facility will be as
follows:
acceptance of the CO2 at the correct specification from the offshore pipeline system.; and
commissioning of the offshore storage facility, to ensure that the operation is stable and reliable,
without trips or upsets.
8.1 Storage Site Operations and Maintenance Overview
The platform is a NUI and hence all offshore facilities will normally be remotely operated and controlled
from the NGCL control centre (located onshore). Communication to the NGCL control centre will be via
satellite transmission. However, when operated in ‘manned mode’, the platform will be operated locally
from the Human Machine Interface (HMI) within the platform’s Local Equipment Room (LER).
Platform visits will be required for the following activities:
planned maintenance and / or testing of equipment and instruments;
re-supply of fuel, water, MEG and any other chemicals and consumables;
well sampling and instrument calibration;
statutory inspections and surveys;
well interventions, including wireline work;
well water wash activities;
major maintenance during platform shutdown; and
PIG operations.
The frequency for platform visits necessary to facilitate the above activities will be every 6 to 7 weeks when
all six platform wells (future requirement) are fully operational For the initial phase when only three wells
are drilled and available, visits will be less frequent e.g. every 14 to16 weeks. Platform visits are dayshift
visits only, with transport to / from the platform via helicopter. Activities taking a number of days will
require morning and evening helicopter transport each day. Staying on the platform overnight is an
emergency measure only (in response to weather conditions for instance).
When extended work campaigns are planned, it may also be feasible to have a floating
support/accommodation vessel moored alongside the platform to reduce the logistics of shuttling people to
and from the Platform via helicopter. This will be evaluated on a case by case basis by the Operations and
Maintenance teams. A suitable ‘Walk to Work’ system will be a requisite of the support vessel and the
Platform will be adequately designed for it.
It is envisaged that the well washing activity (7 day duration) will require platform visits on day 1 and day 7
only, with remote monitoring from onshore in-between.
For any activities requiring relatively large numbers of workers over an extended period (e.g. major
maintenance or future platform expansion works including drilling of additional injection wells or the
installation of future equipment), a jack-up rig will be used for accommodating workers during these
periods.
8 Operational Support

K39: Subsurface Production Technology Report
45
Unplanned interventions will be arranged as necessary in response to breakdown/failure of platform
equipment or systems. The intervention team will comprise of the following core competencies, in addition
to the required mechanical, instrument, electrical technician skills to suit the proposed maintenance work:
Offshore Installation Manager (OIM);
Nominated Responsible Person;
First Aider;
Radio Operator;
Helicopter Landing Officer;
Helideck Assistant;
TEMPSC Coxswain; and
Crane Driver.
The core competency requirements are such that a minimum intervention team will comprise of not less
than three persons. However, planned visits will be arranged to maximise the number of personnel on
each visit in order to complete all planned maintenance tasks and optimise helicopter and standby vessel
(if required) logistics. These dedicated maintenance teams would retain the specialised knowledge and
history of the equipment, augmented by long-term maintenance agreements with specialist maintenance
contractors using specialised procedures.
8.2 Measurement, Monitoring and Verification Plan Instrumentation
A key component of the operations support is the management of the instrumentation required for the
Measurement, Monitoring and Verification Plan, which will be installed in the wells. Both surface and
downhole instrumentation will be needed as described below.
8.2.1.1 Monitoring of Surface Pressure and Temperature
Sensors for pressure and temperature measurements will be incorporated at the wellhead to provide
monitoring of the tubing and annuli. Monitoring of the ‘A’ annulus pressures will indicate if there are any
integrity failures of the ‘A’ annulus envelope which is comprised of the completion packer, tubing hanger,
upper completion tubing, and individual upper completion assemblies. Monitoring for pressure in the ‘B’
annulus can provide an indication of migration of CO2 through cement or indicate casing integrity issues.
These sensors will be connected to the platform information bus, which will be powered by platform
supplies and will provide semi-continuous high accuracy data. For redundancy, multiple sensors will be
deployed as replacement of sensors would require a rig workover.
8.2.1.2 Downhole Pressure and Temperature Gauges
Pressure and temperature gauges installed downhole in each of the injection wells will provide an accurate
measure of downhole injection and annulus pressure during the injection phase.
As with the surface sensors, these gauges will be connected to the platform information bus, will be
powered by platform supplies and will provide semi-continuous high accuracy data. For redundancy,
multiple sensors will be deployed as replacement of sensors would require a rig workover.

K39: Subsurface Production Technology Report
46
The use of distributed fibre optic sensors has been discounted as the sealing integrity of the well is of
preeminent importance in the selection of downhole temperature and pressure monitoring technology.
Technologies that require feed-through wires such as Distributed Temperature Sensing (DTS) and
Distributed Acoustic Sensing (DAS) are particularly problematic as these cables are potential leakage
paths in the long-term after well abandonment. For this reason and other inherent reliability issues
associated with DTS and DAS these technologies are not considered optimum for monitoring purposes on
Endurance.
Furthermore, flow profiling by slick line or electric line production logging may be used if well performance
is substantially different to that predicted. Distributed temperature and strain measurement is unlikely to be
to provide unique definition of thermal fracturing which is expected to occur gradually during the initial
injection period and given that well performance will primarily be controlled by the reservoir and layer
properties deeper in the reservoir and beyond the near wellbore region.
8.2.1.3 Injection Allocation Meters
Allocation meters will be installed to measure the volumes of CO2 injected into each well. These meters
will be installed upstream of the well chokes and therefore can be relatively easily repaired or replaced if
they fail.

K39: Subsurface Production Technology Report
47
Abbreviations Meaning
API American Petroleum Institute
barg Bar gauge
CCS Carbon Capture and Storage
CO2 Carbon dioxide
Cr Chromium
CPL Capture Power Limited
°C Degrees Celsius
DECC Department of Energy and Climate Change
DIFFS Deck Integrated Fire Fighting System
ESD(V) Emergency Shutdown (Valve)
FEED Front End Engineering Design
HMI Human Machine Interface
ICSS Integrated Control and Safety System
IID Intelligent Inspection Device
IPR Inflow Performance Relation
kg/h Kilograms per hour
KSC Contract made between CPL and NGCL
LC Locked closed
LER Local Equipment Room
MAOP Maximum Allowable Operating Pressure
MDT Modular Dynamic Tester
MEG Mono Ethylene Glycol
m3/h Cubic Metres per Hour
mm Millimetres
MTPA Million Tonnes Per Annum
MW Mega Watt
NGCL National Grid Carbon Limited
NUI Normally Unmanned Installation
OPP Oxy Power Plant
O2 Oxygen
PIG Pipeline Inspection Gauge
ppm(v) Parts Per Million (Volume)
PREN Pitting Resistance Equivalent Numbers
RFT Repeat Formation Tester
SCADA Supervisory Control And Data Acquisition
TEMPSC Totally Enclosed Motor Propelled Survival Craft
TVDSS True Vertical Depth Sub-Sea
T&S Transportation and Storage
VIT Vertical Interference Tests
VLP Vertical Lift Performance
VSAT Very Small Aperture Terminal
WHT Wireline Head Thermometer
9 Glossary

K39: Subsurface Production Technology Report
48
WR White Rose
Term Explanation
Bunter Sandstone Sandstone deposits containing colourful rounded pebbles, widespread across central Europe
Caisson A vessel with the bottom end open through which water continuously drains into the sea
Carbon capture Collection of CO2 from power station combustion process or other facilities and its process ready for transportation
caprock A harder or more resistant rock type (like sandstone) overlying a weaker or less resistant rock type
Completion The conduit for production or injection between the surface facilities and the reservoir
Christmas Tree Often called a production tree or dry tree. Wellhead device installed at the surface of the well, including casing heads and a tubing head combined to provide surface control of the subsurface conditions of the well
Daisy chain tie backs An arrangement where a new subsea tie back is linked to an existing tie back, using excess flow line capacity to reach the platform
Dense Phase The physical properties of CO2 can vary according to temperature and pressure. It can be a gas, solid, liquid or can exist in a ‘supercritical’ state, where it behaves as a gas but has the viscosity of a liquid. The term ‘dense phase’ refers to CO2 in either the supercritical or liquid stage
Deviated Well A well drilling operation where the drill bit is deflected at an angle from the vertical toward a specific target
Dry tree Often called a production tree or Christmas tree. Wellhead device installed at the surface of the well, including casing heads and a tubing head combined to provide surface control of the subsurface conditions of the well
FEED contract CPL have entered into an agreement with the UK Government’s DECC pursuant to which it will carry out, among other things, the engineering, cost estimation and risk assessment required to specify the budget required to develop and operate the White Rose assets
Endothermic A reaction, energy is taken in from the surroundings
Enthalpy The amount of heat content used or released in a system at constant pressure
First load The amount of CO2 produced during the first year of the CO2 transportation system
Full chain The complete process from the capture of the CO2 at the emitter plant to its injection into the storage reservoir
Halite Rock salt
Integrated Control and Safety System
Regulates the production process using real-time data acquisition to guarantee the smooth operation of the equipment and ensure environmental and personnel safety
Injection well Deep subsurface rock formations identified for long-term storage
Jacket A welded tubular steel frame with tubular chord legs supporting the deck and the topsides in a fixed offshore platform
J-tube A conduit that has the shape of the letter “J” that is attached to the platform
Joule-Thomson cooling When a real gas expands from high to low pressure at constant enthalpy (thermodynamic potential)
Joule-Thomson effect Describes the temperature change of a gas or liquid when it is forced through a valve or porous plug while kept insulated so that no heat is exchanged with the environment
Key Knowledge Deliverable A series of reports Including this one) issued as public information to describe the flows and processes associated with the overall system. Also referred to as a KKD
Layer Also known as rock layers and strata; is a bed of rock that is visually distinguishable from adjacent layers
Linepack The volume of gas occupying all pressurised sections of the pipeline network
Lithology Study of rock-formation
K39: Subsurface Production Technology Report
49
MFrac Design and evaluation simulator software for fracture design and treatment analysis
Mpwri Produced water reinjection simulator software designed for evaluating the effects of injecting large volumes of fluid over long periods of time with fracture efficiencies approaching zero
ND Nominal diameter
Nitrogen quads Manifold pack holding nitrogen cylinders connected to one outlet
Oxy-fuel A power plant technology which burns fuel in a modified combustion environment with the resulting combustion gases being high in CO2 concentration which allows the CO2 produced to be captured without the need for additional chemical separation
Permanent Packer A device that can be run into a wellbore with a smaller initial outside diameter that then expands externally to seal the wellbore. It is constructed of materials that are easy to mill out
PIG operations An essential maintenance activity that optimises the smooth operation of the pipeline using a Pipeline Inspection Gauge (PIG) to traverses the pipeline to inspect and clean it
PIG launcher/receiver The PIG enters the line through a PIG trap, which includes a launcher and receiver and is driven by the process gas
Phase envelope The behaviour of a gas at different phases represented as a function of pressure and temperature
PREN Also known as PRE numbers are a theoretical way of comparing the pitting corrosion resistance of various types of stainless steels, based on their chemical compositions; they are useful for ranking and comparing the different grades
PROSPER A software tool used to model reservoir inflow performance for single, multilayer, or multilateral wells with complex and highly deviated completions, optimising all aspects of a completion design including perforation details and gravel packing. The design and evaluation of the different well completions can be studied
Riser Conduit to transfer materials between the seafloor and facilities atop the water's surface
Reservoir Containment in suitable pervious rock formations located under impervious rock formations usually under the sea bed
Seal Mandrel A device which allows access to the well without removing the packer
Supervisory Control And Data Acquisition
Or SCADA. A system operating with coded signals over communication channels to provide control of remote equipment
Two-phase A region with gas and liquid coexisting
Very Small Aperture Terminal System
A two-way satellite ground station or a stabilised maritime VSAT antenna with a dish antenna that is smaller than 3 meters. VSATs access satellites in geosynchronous orbit to relay data from small remote earth stations (terminals) to other terminals (in mesh topology) or master earth station "hubs" (in star topology)
Young’s Modulus A mechanical property of linear elastic solid materials. It measures the force (per unit area) that is needed to stretch (or compress) a material sample
VISAGE A finite-element geomechanics simulator which models problems to enable the planning and mitigation of risks
Wellhead The component at the surface of a well that provides the structural and pressure-containing interface for the equipment
Wellbore A borehole; the hole drilled by the bit
Wirelines Electric cables that transmit data about the well
White Rose Transport and Storage FEED Project
CPL and NGCL have entered into a key sub-contract agreement where NGCL will perform this project which will meet that part of CPL’s obligations under the FEED Contract which are associated with the transport and storage assets