kaiser family foundation/the economist four-country survey
TRANSCRIPT
Topline
Kaiser Family Foundation/The Economist Four-Country Survey on Aging and End-of-Life Medical Care
April 2017
Kaiser Family Foundation/The Economist Four-Country Survey on Aging and End-of-Life Medical Care, 2016 1
METHODOLOGY
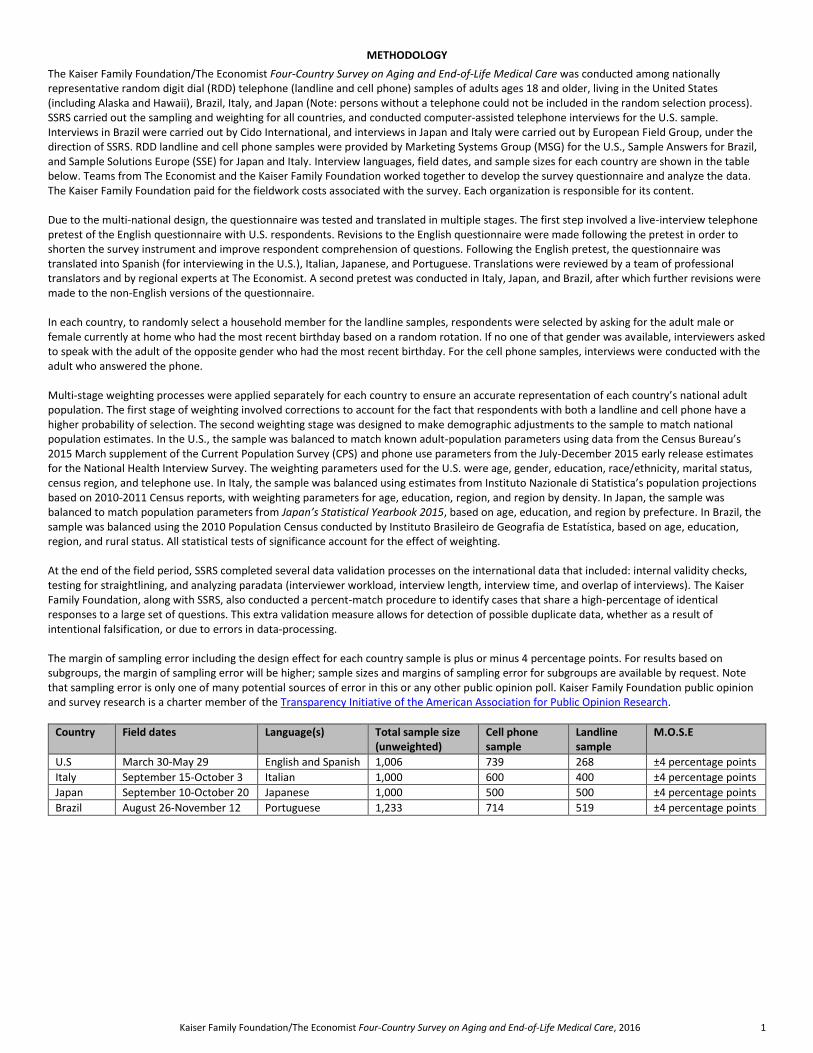
The Kaiser Family Foundation/The Economist Four-Country Survey on Aging and End-of-Life Medical Care was conducted among nationally representative random digit dial (RDD) telephone (landline and cell phone) samples of adults ages 18 and older, living in the United States (including Alaska and Hawaii), Brazil, Italy, and Japan (Note: persons without a telephone could not be included in the random selection process). SSRS carried out the sampling and weighting for all countries, and conducted computer-assisted telephone interviews for the U.S. sample. Interviews in Brazil were carried out by Cido International, and interviews in Japan and Italy were carried out by European Field Group, under the direction of SSRS. RDD landline and cell phone samples were provided by Marketing Systems Group (MSG) for the U.S., Sample Answers for Brazil, and Sample Solutions Europe (SSE) for Japan and Italy. Interview languages, field dates, and sample sizes for each country are shown in the table below. Teams from The Economist and the Kaiser Family Foundation worked together to develop the survey questionnaire and analyze the data. The Kaiser Family Foundation paid for the fieldwork costs associated with the survey. Each organization is responsible for its content. Due to the multi-national design, the questionnaire was tested and translated in multiple stages. The first step involved a live-interview telephone pretest of the English questionnaire with U.S. respondents. Revisions to the English questionnaire were made following the pretest in order to shorten the survey instrument and improve respondent comprehension of questions. Following the English pretest, the questionnaire was translated into Spanish (for interviewing in the U.S.), Italian, Japanese, and Portuguese. Translations were reviewed by a team of professional translators and by regional experts at The Economist. A second pretest was conducted in Italy, Japan, and Brazil, after which further revisions were made to the non-English versions of the questionnaire. In each country, to randomly select a household member for the landline samples, respondents were selected by asking for the adult male or female currently at home who had the most recent birthday based on a random rotation. If no one of that gender was available, interviewers asked to speak with the adult of the opposite gender who had the most recent birthday. For the cell phone samples, interviews were conducted with the adult who answered the phone. Multi-stage weighting processes were applied separately for each country to ensure an accurate representation of each country’s national adult population. The first stage of weighting involved corrections to account for the fact that respondents with both a landline and cell phone have a higher probability of selection. The second weighting stage was designed to make demographic adjustments to the sample to match national population estimates. In the U.S., the sample was balanced to match known adult-population parameters using data from the Census Bureau’s 2015 March supplement of the Current Population Survey (CPS) and phone use parameters from the July-December 2015 early release estimates for the National Health Interview Survey. The weighting parameters used for the U.S. were age, gender, education, race/ethnicity, marital status, census region, and telephone use. In Italy, the sample was balanced using estimates from Instituto Nazionale di Statistica’s population projections based on 2010-2011 Census reports, with weighting parameters for age, education, region, and region by density. In Japan, the sample was balanced to match population parameters from Japan’s Statistical Yearbook 2015, based on age, education, and region by prefecture. In Brazil, the sample was balanced using the 2010 Population Census conducted by Instituto Brasileiro de Geografia de Estatística, based on age, education, region, and rural status. All statistical tests of significance account for the effect of weighting. At the end of the field period, SSRS completed several data validation processes on the international data that included: internal validity checks, testing for straightlining, and analyzing paradata (interviewer workload, interview length, interview time, and overlap of interviews). The Kaiser Family Foundation, along with SSRS, also conducted a percent-match procedure to identify cases that share a high-percentage of identical responses to a large set of questions. This extra validation measure allows for detection of possible duplicate data, whether as a result of intentional falsification, or due to errors in data-processing. The margin of sampling error including the design effect for each country sample is plus or minus 4 percentage points. For results based on subgroups, the margin of sampling error will be higher; sample sizes and margins of sampling error for subgroups are available by request. Note that sampling error is only one of many potential sources of error in this or any other public opinion poll. Kaiser Family Foundation public opinion and survey research is a charter member of the Transparency Initiative of the American Association for Public Opinion Research.
Country Field dates Language(s) Total sample size (unweighted)
Cell phone sample
Landline sample
M.O.S.E
U.S March 30-May 29 English and Spanish 1,006 739 268 ±4 percentage points
Italy September 15-October 3 Italian 1,000 600 400 ±4 percentage points
Japan September 10-October 20 Japanese 1,000 500 500 ±4 percentage points
Brazil August 26-November 12 Portuguese 1,233 714 519 ±4 percentage points
Kaiser Family Foundation/The Economist Four-Country Survey on Aging and End-of-Life Medical Care, 2016 2
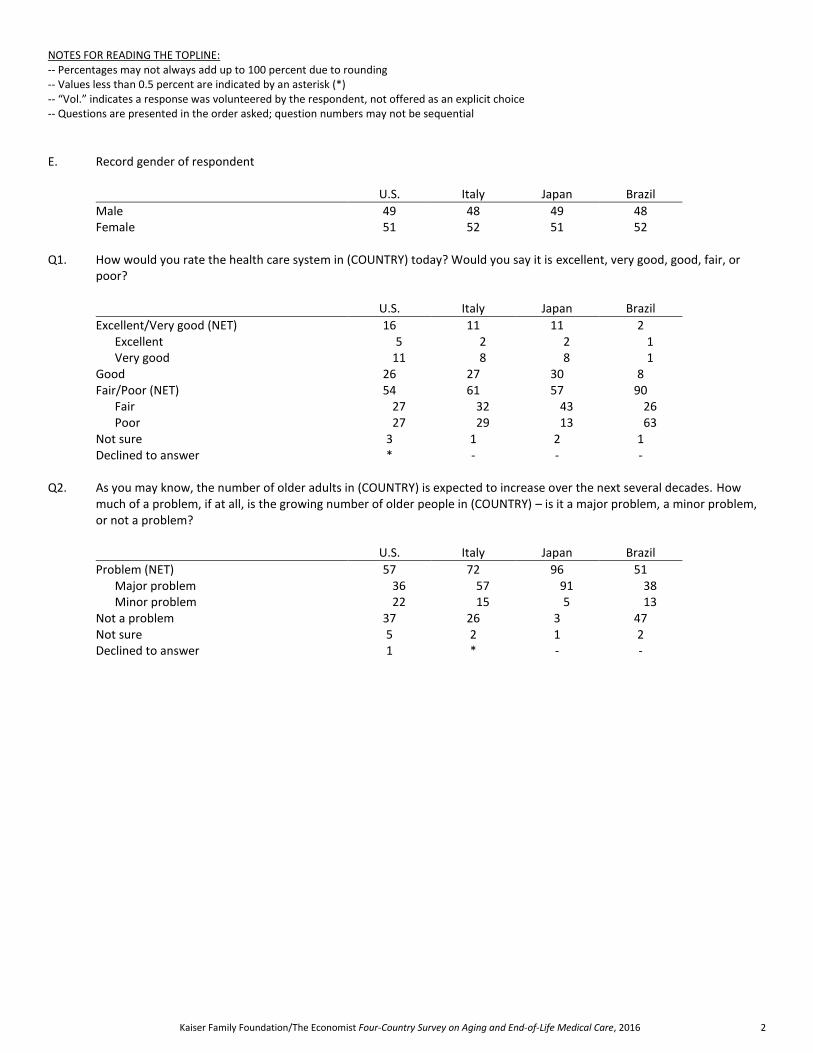
NOTES FOR READING THE TOPLINE: -- Percentages may not always add up to 100 percent due to rounding -- Values less than 0.5 percent are indicated by an asterisk (*) -- “Vol.” indicates a response was volunteered by the respondent, not offered as an explicit choice -- Questions are presented in the order asked; question numbers may not be sequential
E. Record gender of respondent
U.S. Italy Japan Brazil
Male 49 48 49 48 Female 51 52 51 52
Q1. How would you rate the health care system in (COUNTRY) today? Would you say it is excellent, very good, good, fair, or
poor?
U.S. Italy Japan Brazil
Excellent/Very good (NET) 16 11 11 2 Excellent 5 2 2 1 Very good 11 8 8 1
Good 26 27 30 8 Fair/Poor (NET) 54 61 57 90
Fair 27 32 43 26 Poor 27 29 13 63
Not sure 3 1 2 1 Declined to answer * - - -
Q2. As you may know, the number of older adults in (COUNTRY) is expected to increase over the next several decades. How
much of a problem, if at all, is the growing number of older people in (COUNTRY) – is it a major problem, a minor problem, or not a problem?
U.S. Italy Japan Brazil
Problem (NET) 57 72 96 51 Major problem 36 57 91 38 Minor problem 22 15 5 13
Not a problem 37 26 3 47 Not sure 5 2 1 2 Declined to answer 1 * - -

Kaiser Family Foundation/The Economist Four-Country Survey on Aging and End-of-Life Medical Care, 2016 3
Q3. How prepared do you think (INSERT) is/are to deal with the aging population? Very prepared, somewhat prepared, not too prepared, not at all prepared? (scramble items a-c)
------------------PREPARED-------------- --------------NOT PREPARED-----------
NET Very
prepared Somewhat prepared NET
Not too prepared
Not at all prepared Not sure
Declined to answer
a. The government U.S. 35 4 30 62 31 30 4 * Italy 11 3 8 86 37 48 3 * Japan 23 2 20 74 55 19 3 - Brazil 23 2 21 75 23 53 2 *
b. The health care system U.S. 49 9 40 48 28 20 3 * Italy 31 4 27 65 43 22 4 * Japan 44 7 38 51 44 8 4 - Brazil 28 3 24 71 25 46 1 -
c. Families in (COUNTRY) U.S. 46 5 41 50 33 17 4 * Italy 33 5 28 63 46 17 4 - Japan 26 2 24 67 54 13 7 - Brazil 40 4 36 58 31 27 2 *
Q4. Who should bear the greatest responsibility for paying for people’s health care and long-term care needs as they age?
(READ LIST) (rotate response options)
U.S. Italy Japan Brazil
The government 42 78 55 82 Charities 2 2 2 3 Individuals and families 44 13 35 11 None of these/someone else (vol.) 3 2 1 1 Not sure 9 5 6 3 Declined to answer * * * *
Q5. Do you think it is the duty of children to help take care of their parents’ needs as they get older, or not?
U.S. Italy Japan Brazil
Yes 75 80 61 91 No 22 14 36 7 Not sure 3 6 3 2 Declined to answer * * - -
Kaiser Family Foundation/The Economist Four-Country Survey on Aging and End-of-Life Medical Care, 2016 4
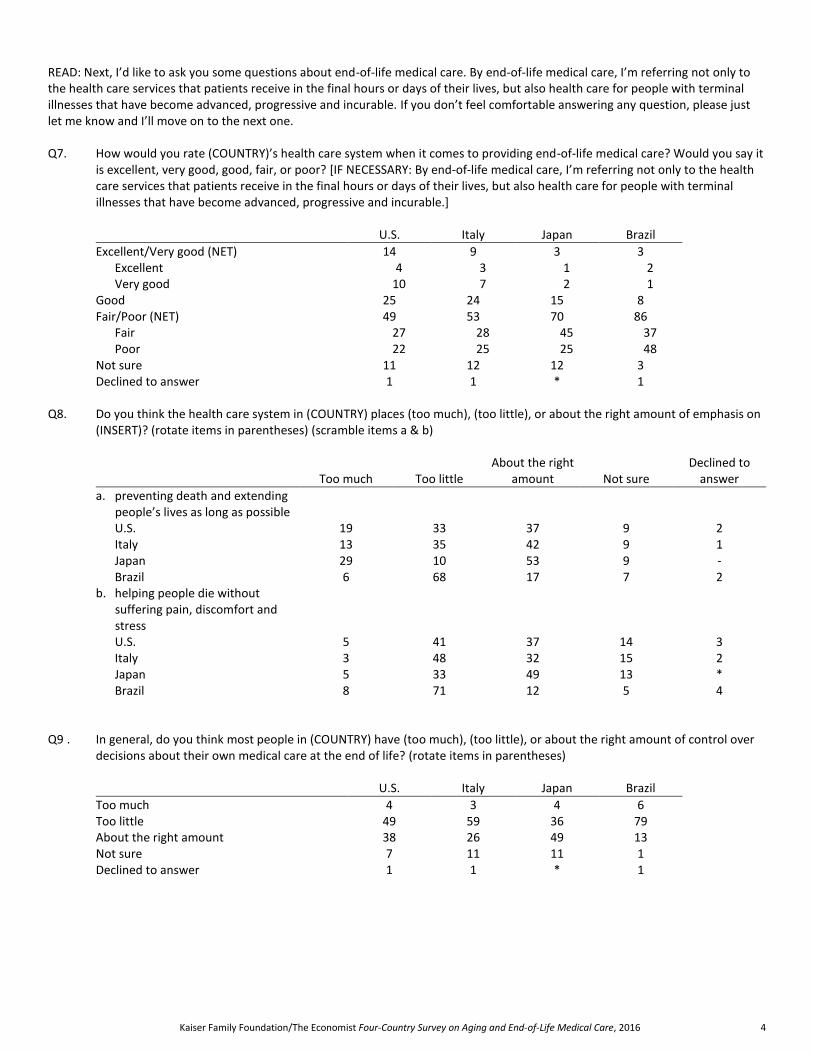
READ: Next, I’d like to ask you some questions about end-of-life medical care. By end-of-life medical care, I’m referring not only to the health care services that patients receive in the final hours or days of their lives, but also health care for people with terminal illnesses that have become advanced, progressive and incurable. If you don’t feel comfortable answering any question, please just let me know and I’ll move on to the next one. Q7. How would you rate (COUNTRY)’s health care system when it comes to providing end-of-life medical care? Would you say it
is excellent, very good, good, fair, or poor? [IF NECESSARY: By end-of-life medical care, I’m referring not only to the health care services that patients receive in the final hours or days of their lives, but also health care for people with terminal illnesses that have become advanced, progressive and incurable.]
U.S. Italy Japan Brazil
Excellent/Very good (NET) 14 9 3 3 Excellent 4 3 1 2 Very good 10 7 2 1
Good 25 24 15 8 Fair/Poor (NET) 49 53 70 86
Fair 27 28 45 37 Poor 22 25 25 48
Not sure 11 12 12 3 Declined to answer 1 1 * 1
Q8. Do you think the health care system in (COUNTRY) places (too much), (too little), or about the right amount of emphasis on
(INSERT)? (rotate items in parentheses) (scramble items a & b)
Too much Too little
About the right amount Not sure
Declined to answer
a. preventing death and extending people’s lives as long as possible
U.S. 19 33 37 9 2 Italy 13 35 42 9 1 Japan 29 10 53 9 - Brazil 6 68 17 7 2
b. helping people die without suffering pain, discomfort and stress
U.S. 5 41 37 14 3 Italy 3 48 32 15 2 Japan 5 33 49 13 * Brazil 8 71 12 5 4
Q9 . In general, do you think most people in (COUNTRY) have (too much), (too little), or about the right amount of control over
decisions about their own medical care at the end of life? (rotate items in parentheses)
U.S. Italy Japan Brazil
Too much 4 3 4 6 Too little 49 59 36 79 About the right amount 38 26 49 13 Not sure 7 11 11 1 Declined to answer 1 1 * 1

Kaiser Family Foundation/The Economist Four-Country Survey on Aging and End-of-Life Medical Care, 2016 5
Q10. Who do you think should have the greater say in decisions about which medical treatments to pursue for seriously ill patients who are near the end of their lives? (Doctors) or (patients and their families)? (rotate items in parentheses)
U.S. Italy Japan Brazil
Doctors 8 30 10 40 Patients and their families 87 52 88 47 Both equally (vol.) 4 16 1 12 Neither (vol.) * * * * Not sure 1 2 1 1 Declined to answer * * - *
Q11. When a patient is seriously ill, do you think it is more important for their doctors to (emphasize hope), or more important
for doctors to (be completely honest even if there is little chance of recovery)? (rotate items in parentheses)
U.S. Italy Japan Brazil
Emphasize hope 7 13 15 15 Be completely honest even if there is little chance of recovery
88 79 80 80
Both equally (vol.) 3 3 1 3 Neither (vol.) * * 1 * Not sure 2 3 2 2 Declined to answer * 1 - 1
Q12. Do you think Medicare should cover discussions between doctors and patients about end-of-life treatment options, or not? Asked in U.S. only (n=1006)
U.S.
Yes 78 No 15 Not sure 6 Declined to answer 1
Q13. In (U.S./Brazilian/Chinese/Italian/Japanese) society, is death a subject that people generally feel free to talk about, or is it a
subject that is generally avoided?
U.S. Italy Japan Brazil
Subject that is generally free to talk about 26 32 38 34 Subject that is generally avoided 69 61 57 63 Not sure 4 6 5 2 Declined to answer 1 1 - 1

Kaiser Family Foundation/The Economist Four-Country Survey on Aging and End-of-Life Medical Care, 2016 6
Q14. How much have you thought about (INSERT)? A great deal, some, not very much, or none at all? (scramble items a & b; always ask item c last)
-------A GREAT DEAL/SOME------- ---NOT VERY MUCH/NONE AT ALL---
NET A great
deal Some NET Not very
much None at all Not sure
Declined to answer
a. How you would pay the costs of medical care and other services you or another family member might need in old age
U.S. 70 36 34 29 19 10 1 * Italy 58 23 35 40 22 17 1 2 Japan 72 24 47 28 22 5 1 - Brazil 70 43 27 28 8 21 1 *
b. Who would help care for you or another family member if someone became seriously ill or needed special support
U.S. 75 41 35 23 15 7 1 1 Italy 55 24 31 43 21 22 2 1 Japan 76 28 49 23 18 5 1 - Brazil 72 46 26 27 7 19 1 *
c. YOUR OWN wishes for medical treatment if you were to become seriously ill
U.S. 76 44 31 23 13 11 * 1 Italy 53 21 32 44 26 18 2 1 Japan 68 26 41 32 24 8 1 - Brazil 71 44 27 28 10 18 * *

Kaiser Family Foundation/The Economist Four-Country Survey on Aging and End-of-Life Medical Care, 2016 7
Q15. Thinking about your own death, how important is each of the following to you? How about [INSERT]? Would that be extremely important, very important, somewhat important, not too important to you? [IF NECESSARY: Thinking about your own death how important is this to you?] (scramble items a-g)
---EXTREMELY/VERY
IMPORTANT--- SOMEWHAT/NOT TOO
------------IMPORTANT-----------
NET Extremely important
Very important NET
Somewhat important
Not too important
Not applicable
(vol.) Not sure Declined
to answer
a. Making sure your family is not burdened financially by your care
U.S. 88 54 33 11 7 4 * 1 * Italy 70 30 40 28 22 6 1 1 1 Japan 81 59 21 19 17 2 * * * Brazil 70 24 46 28 16 12 * 1 1
b. Being comfortable and without pain
U.S. 78 42 36 20 15 5 1 1 * Italy 73 31 43 24 20 4 * 1 1 Japan 69 47 22 30 25 5 * 1 * Brazil 85 32 53 14 9 5 * 1 1
c. Being at peace spiritually
U.S. 76 46 30 23 12 11 1 * * Italy 66 25 41 31 21 10 1 1 1 Japan 75 55 20 23 20 3 - 1 * Brazil 88 40 49 10 7 3 * * *
d. Making sure your family is not burdened by tough decisions about your care
U.S. 76 44 33 21 16 5 1 1 1 Italy 66 24 43 30 24 6 1 2 1 Japan 76 54 21 22 19 4 1 1 * Brazil 75 22 53 22 15 7 1 2 *
e. Having loved ones around you
U.S. 81 48 33 18 11 7 * 1 - Italy 80 34 47 18 14 3 * 1 1 Japan 67 47 20 31 23 8 * 2 * Brazil 83 30 53 16 9 6 * 1 *
f. Making sure your wishes for medical care are followed
U.S. 85 49 36 14 10 4 * * * Italy 74 32 42 24 20 4 * 1 1 Japan 62 41 21 37 31 6 - 1 * Brazil 78 24 54 19 14 6 - 2 1
g. Living as long as possible U.S. 47 23 23 48 24 24 1 3 1 Italy 41 14 27 49 27 22 1 8 1 Japan 17 10 6 82 41 41 * 2 * Brazil 70 26 45 26 13 13 * 2 1
Kaiser Family Foundation/The Economist Four-Country Survey on Aging and End-of-Life Medical Care, 2016 8
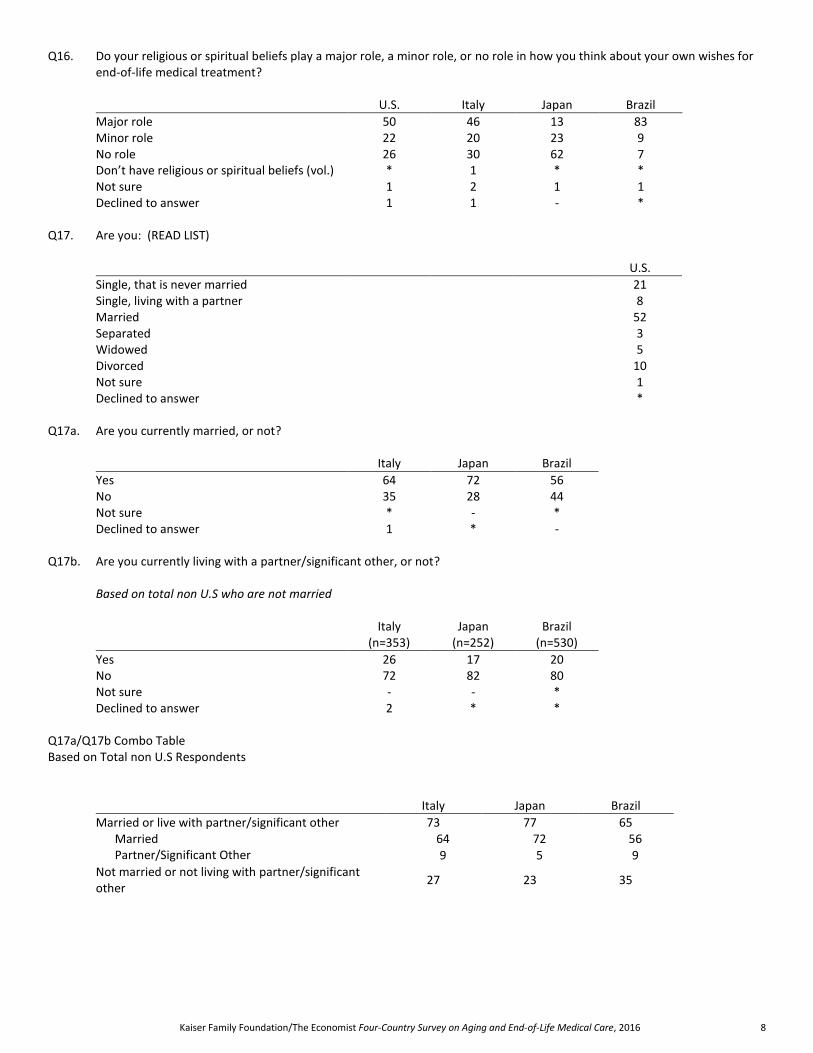
Q16. Do your religious or spiritual beliefs play a major role, a minor role, or no role in how you think about your own wishes for end-of-life medical treatment?
U.S. Italy Japan Brazil
Major role 50 46 13 83 Minor role 22 20 23 9 No role 26 30 62 7 Don’t have religious or spiritual beliefs (vol.) * 1 * * Not sure 1 2 1 1 Declined to answer 1 1 - *
Q17. Are you: (READ LIST)
U.S.
Single, that is never married 21 Single, living with a partner 8 Married 52 Separated 3 Widowed 5 Divorced 10 Not sure 1 Declined to answer *
Q17a. Are you currently married, or not?
Italy Japan Brazil
Yes 64 72 56 No 35 28 44 Not sure * - * Declined to answer 1 * -
Q17b. Are you currently living with a partner/significant other, or not? Based on total non U.S who are not married
Italy (n=353)
Japan (n=252)
Brazil (n=530)
Yes 26 17 20 No 72 82 80 Not sure - - * Declined to answer 2 * *
Q17a/Q17b Combo Table Based on Total non U.S Respondents
Italy Japan Brazil
Married or live with partner/significant other 73 77 65 Married 64 72 56 Partner/Significant Other 9 5 9
Not married or not living with partner/significant other
27 23 35

Kaiser Family Foundation/The Economist Four-Country Survey on Aging and End-of-Life Medical Care, 2016 9
Q18. Are you the parent of any children, including adult children?
U.S. Italy Japan Brazil
Yes 71 70 68 70 No 29 29 31 30 Not sure * * * * Declined to answer * 1 * *
Q19. Are either of your parents still alive, or are both your parents deceased?
U.S. Italy Japan Brazil
Either parents still alive 68 55 57 75 Both parents deceased 32 44 43 25 Not sure * - - * Declined to answer * * - *
Q20. How comfortable would you be talking about your own end-of-life medical wishes with (INSERT)? Very comfortable,
somewhat comfortable, not too comfortable, or not at all comfortable? (scramble items a-e) Item c- based on total married or living with a partner Item d- based on total who have one or more parents living Item e- based on total who have children
---------------COMFORTABLE----------- --------NOT COMFORTABLE------
NET Very
comfortable Somewhat
comfortable NET Not too
comfortable Not at all
comfortable
Not applicable
(vol.) Not sure Declined
to answer
a. A doctor or other health care provider
U.S. 92 66 26 7 4 2 * 1 1 Italy 80 47 33 16 8 7 1 2 1 Japan 85 53 31 12 10 2 * 3 * Brazil 81 57 24 17 9 8 1 1 *
b. A minister, priest, or other religious or spiritual advisor
U.S. 75 53 22 21 9 12 2 1 * Italy 53 26 28 40 17 23 2 3 2 Japan 42 19 23 49 24 25 4 5 * Brazil 81 59 22 17 8 9 1 1 *
c. Your spouse or partner
U.S. (n=540) 94 86 9 4 2 2 1 - - Italy (n=746) 83 57 26 12 6 6 2 1 1 Japan (n=794) 81 60 21 10 7 3 7 2 * Brazil (n=791) 83 69 14 14 6 8 1 2 *
d. Your parents U.S. (n=577) 81 58 23 17 11 6 1 * * Italy (n=554) 63 35 28 34 15 19 2 * 1 Japan (n=572) 81 54 27 16 13 3 1 2 - Brazil (n=943) 80 57 24 18 8 10 * 1 1
e. Your children U.S. (n=715) 82 60 22 14 6 9 1 1 1 Italy (n=707) 73 46 28 22 9 12 3 1 1 Japan (n=714) 83 56 27 16 12 4 * 1 * Brazil (n=832) 78 60 18 19 9 10 2 1 *
Kaiser Family Foundation/The Economist Four-Country Survey on Aging and End-of-Life Medical Care, 2016 10
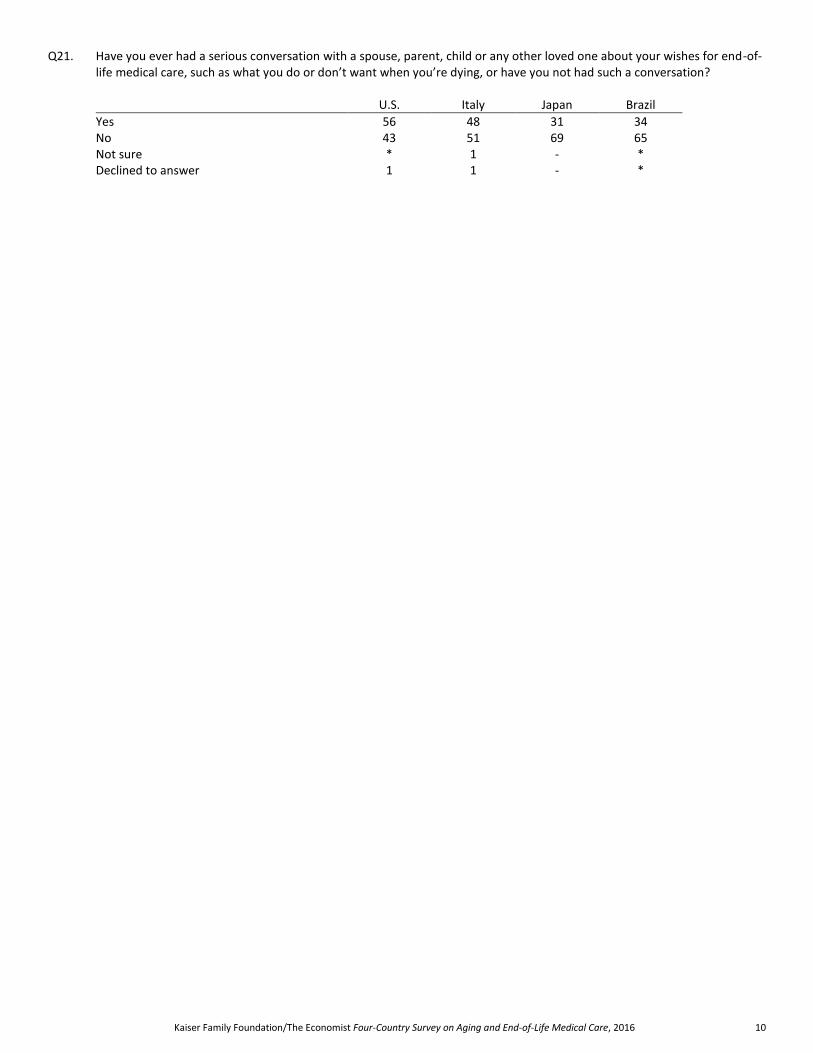
Q21. Have you ever had a serious conversation with a spouse, parent, child or any other loved one about your wishes for end-of-life medical care, such as what you do or don’t want when you’re dying, or have you not had such a conversation?
U.S. Italy Japan Brazil
Yes 56 48 31 34 No 43 51 69 65 Not sure * 1 - * Declined to answer 1 1 - *
Kaiser Family Foundation/The Economist Four-Country Survey on Aging and End-of-Life Medical Care, 2016 11
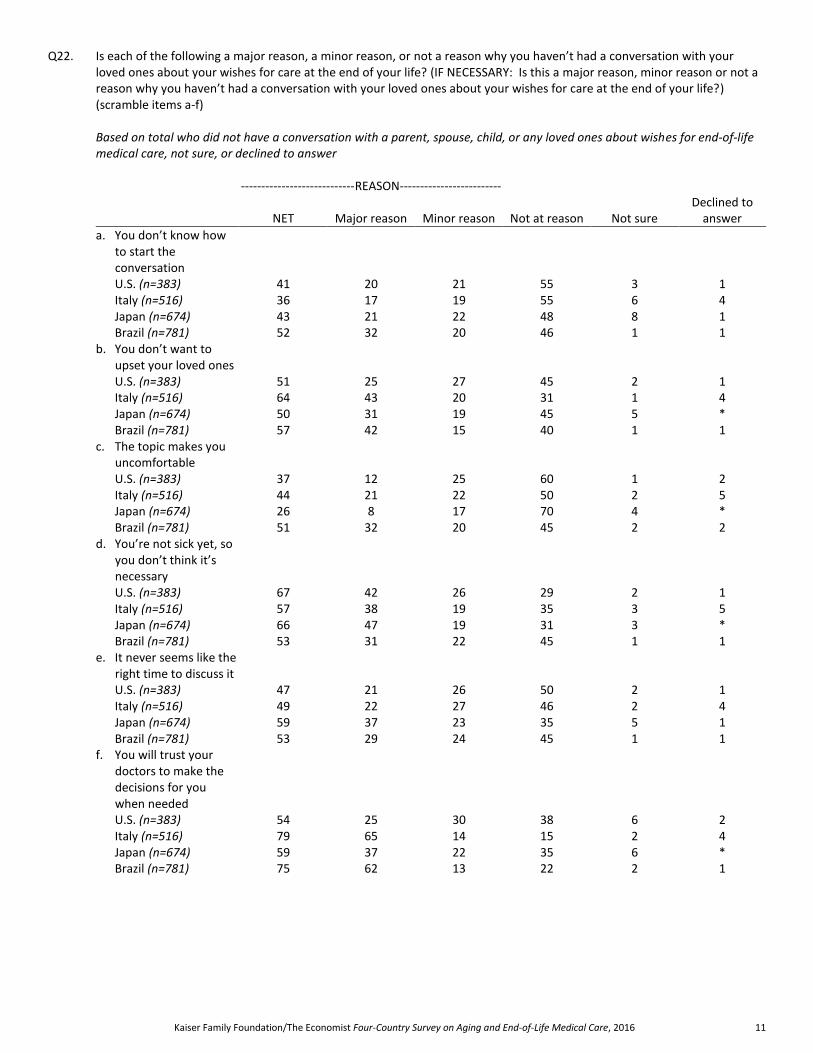
Q22. Is each of the following a major reason, a minor reason, or not a reason why you haven’t had a conversation with your loved ones about your wishes for care at the end of your life? (IF NECESSARY: Is this a major reason, minor reason or not a reason why you haven’t had a conversation with your loved ones about your wishes for care at the end of your life?) (scramble items a-f)
Based on total who did not have a conversation with a parent, spouse, child, or any loved ones about wishes for end-of-life
medical care, not sure, or declined to answer
----------------------------REASON-------------------------
NET Major reason Minor reason Not at reason Not sure Declined to
answer
a. You don’t know how to start the conversation
U.S. (n=383) 41 20 21 55 3 1 Italy (n=516) 36 17 19 55 6 4 Japan (n=674) 43 21 22 48 8 1 Brazil (n=781) 52 32 20 46 1 1
b. You don’t want to upset your loved ones
U.S. (n=383) 51 25 27 45 2 1 Italy (n=516) 64 43 20 31 1 4 Japan (n=674) 50 31 19 45 5 * Brazil (n=781) 57 42 15 40 1 1
c. The topic makes you uncomfortable
U.S. (n=383) 37 12 25 60 1 2 Italy (n=516) 44 21 22 50 2 5 Japan (n=674) 26 8 17 70 4 * Brazil (n=781) 51 32 20 45 2 2
d. You’re not sick yet, so you don’t think it’s necessary
U.S. (n=383) 67 42 26 29 2 1 Italy (n=516) 57 38 19 35 3 5 Japan (n=674) 66 47 19 31 3 * Brazil (n=781) 53 31 22 45 1 1
e. It never seems like the right time to discuss it
U.S. (n=383) 47 21 26 50 2 1 Italy (n=516) 49 22 27 46 2 4 Japan (n=674) 59 37 23 35 5 1 Brazil (n=781) 53 29 24 45 1 1
f. You will trust your doctors to make the decisions for you when needed
U.S. (n=383) 54 25 30 38 6 2 Italy (n=516) 79 65 14 15 2 4 Japan (n=674) 59 37 22 35 6 * Brazil (n=781) 75 62 13 22 2 1
Kaiser Family Foundation/The Economist Four-Country Survey on Aging and End-of-Life Medical Care, 2016 12
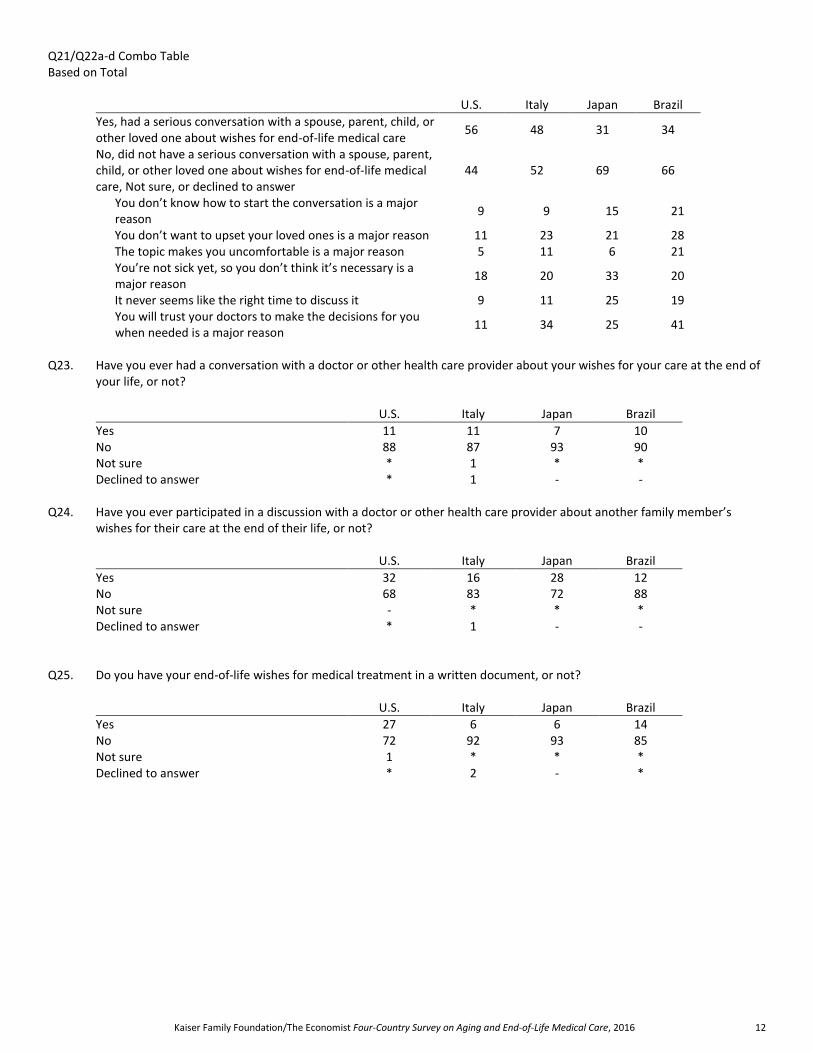
Q21/Q22a-d Combo Table Based on Total
U.S. Italy Japan Brazil
Yes, had a serious conversation with a spouse, parent, child, or other loved one about wishes for end-of-life medical care
56 48 31 34
No, did not have a serious conversation with a spouse, parent, child, or other loved one about wishes for end-of-life medical care, Not sure, or declined to answer
44 52 69 66
You don’t know how to start the conversation is a major reason
9 9 15 21
You don’t want to upset your loved ones is a major reason 11 23 21 28 The topic makes you uncomfortable is a major reason 5 11 6 21 You’re not sick yet, so you don’t think it’s necessary is a major reason
18 20 33 20
It never seems like the right time to discuss it 9 11 25 19 You will trust your doctors to make the decisions for you when needed is a major reason
11 34 25 41
Q23. Have you ever had a conversation with a doctor or other health care provider about your wishes for your care at the end of
your life, or not?
U.S. Italy Japan Brazil
Yes 11 11 7 10 No 88 87 93 90 Not sure * 1 * * Declined to answer * 1 - -
Q24. Have you ever participated in a discussion with a doctor or other health care provider about another family member’s
wishes for their care at the end of their life, or not?
U.S. Italy Japan Brazil
Yes 32 16 28 12 No 68 83 72 88 Not sure - * * * Declined to answer * 1 - -
Q25. Do you have your end-of-life wishes for medical treatment in a written document, or not?
U.S. Italy Japan Brazil
Yes 27 6 6 14 No 72 92 93 85 Not sure 1 * * * Declined to answer * 2 - *
Kaiser Family Foundation/The Economist Four-Country Survey on Aging and End-of-Life Medical Care, 2016 13
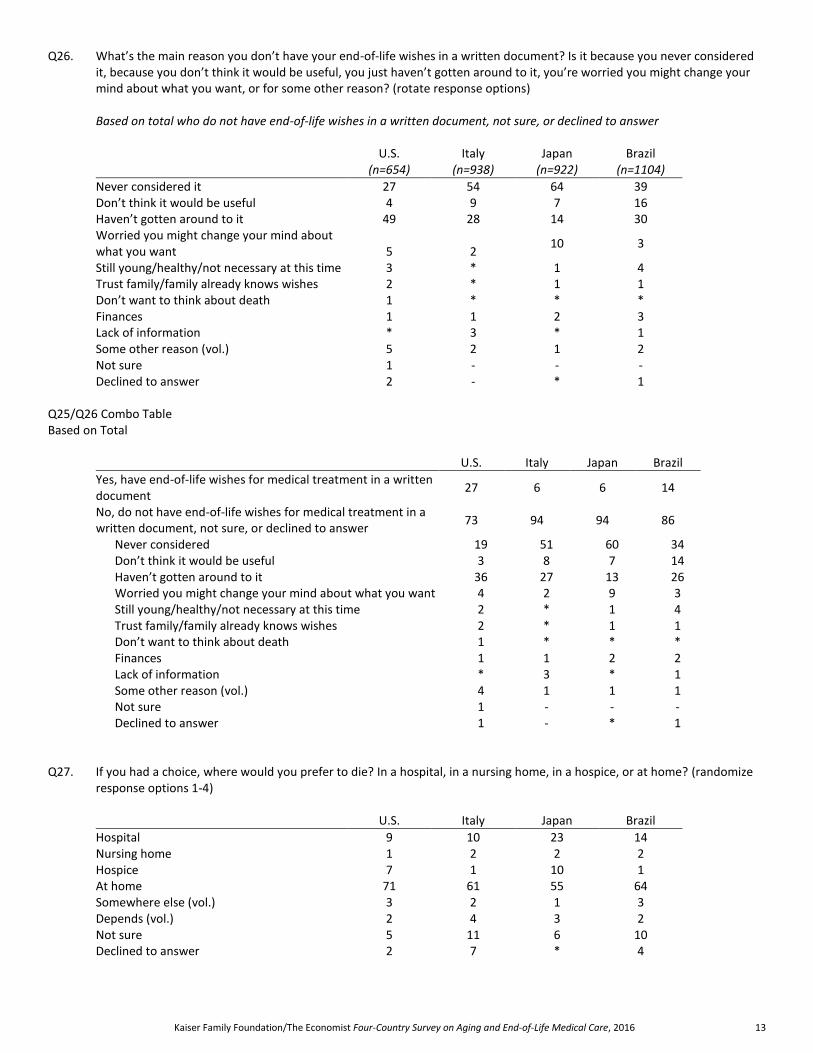
Q26. What’s the main reason you don’t have your end-of-life wishes in a written document? Is it because you never considered it, because you don’t think it would be useful, you just haven’t gotten around to it, you’re worried you might change your mind about what you want, or for some other reason? (rotate response options)
Based on total who do not have end-of-life wishes in a written document, not sure, or declined to answer
U.S. (n=654)
Italy (n=938)
Japan (n=922)
Brazil (n=1104)
Never considered it 27 54 64 39 Don’t think it would be useful 4 9 7 16 Haven’t gotten around to it 49 28 14 30 Worried you might change your mind about what you want 5
2
10 3
Still young/healthy/not necessary at this time 3 * 1 4 Trust family/family already knows wishes 2 * 1 1 Don’t want to think about death 1 * * * Finances 1 1 2 3 Lack of information * 3 * 1 Some other reason (vol.) 5 2 1 2 Not sure 1 - - - Declined to answer 2 - * 1
Q25/Q26 Combo Table Based on Total
U.S. Italy Japan Brazil
Yes, have end-of-life wishes for medical treatment in a written document
27 6 6 14
No, do not have end-of-life wishes for medical treatment in a written document, not sure, or declined to answer
73 94 94 86
Never considered 19 51 60 34 Don’t think it would be useful 3 8 7 14 Haven’t gotten around to it 36 27 13 26 Worried you might change your mind about what you want 4 2 9 3 Still young/healthy/not necessary at this time 2 * 1 4 Trust family/family already knows wishes 2 * 1 1 Don’t want to think about death 1 * * * Finances 1 1 2 2 Lack of information * 3 * 1 Some other reason (vol.) 4 1 1 1 Not sure 1 - - - Declined to answer 1 - * 1
Q27. If you had a choice, where would you prefer to die? In a hospital, in a nursing home, in a hospice, or at home? (randomize
response options 1-4)
U.S. Italy Japan Brazil
Hospital 9 10 23 14 Nursing home 1 2 2 2 Hospice 7 1 10 1 At home 71 61 55 64 Somewhere else (vol.) 3 2 1 3 Depends (vol.) 2 4 3 2 Not sure 5 11 6 10 Declined to answer 2 7 * 4
Kaiser Family Foundation/The Economist Four-Country Survey on Aging and End-of-Life Medical Care, 2016 14
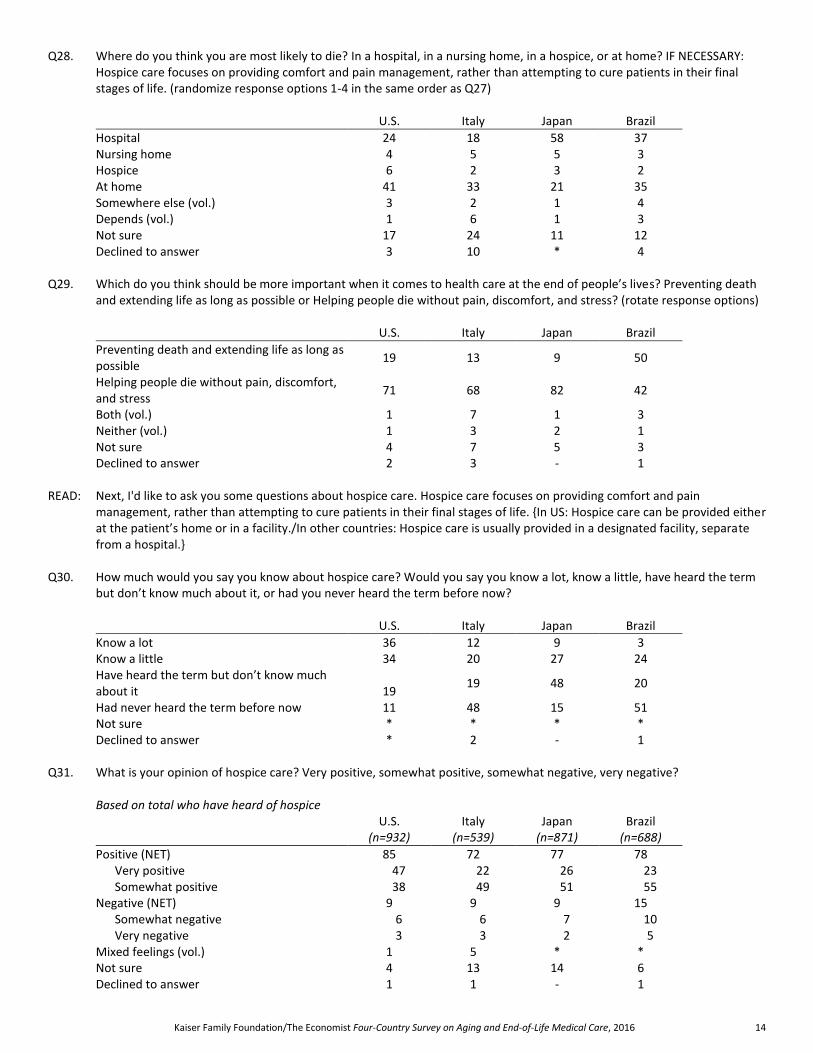
Q28. Where do you think you are most likely to die? In a hospital, in a nursing home, in a hospice, or at home? IF NECESSARY: Hospice care focuses on providing comfort and pain management, rather than attempting to cure patients in their final stages of life. (randomize response options 1-4 in the same order as Q27)
U.S. Italy Japan Brazil
Hospital 24 18 58 37 Nursing home 4 5 5 3 Hospice 6 2 3 2 At home 41 33 21 35 Somewhere else (vol.) 3 2 1 4 Depends (vol.) 1 6 1 3 Not sure 17 24 11 12 Declined to answer 3 10 * 4
Q29. Which do you think should be more important when it comes to health care at the end of people’s lives? Preventing death
and extending life as long as possible or Helping people die without pain, discomfort, and stress? (rotate response options)
U.S. Italy Japan Brazil
Preventing death and extending life as long as possible
19 13 9 50
Helping people die without pain, discomfort, and stress
71 68 82 42
Both (vol.) 1 7 1 3 Neither (vol.) 1 3 2 1 Not sure 4 7 5 3 Declined to answer 2 3 - 1
READ: Next, I'd like to ask you some questions about hospice care. Hospice care focuses on providing comfort and pain
management, rather than attempting to cure patients in their final stages of life. {In US: Hospice care can be provided either at the patient’s home or in a facility./In other countries: Hospice care is usually provided in a designated facility, separate from a hospital.}
Q30. How much would you say you know about hospice care? Would you say you know a lot, know a little, have heard the term
but don’t know much about it, or had you never heard the term before now?
U.S. Italy Japan Brazil
Know a lot 36 12 9 3 Know a little 34 20 27 24 Have heard the term but don’t know much about it 19
19 48 20
Had never heard the term before now 11 48 15 51 Not sure * * * * Declined to answer * 2 - 1
Q31. What is your opinion of hospice care? Very positive, somewhat positive, somewhat negative, very negative? Based on total who have heard of hospice
U.S. (n=932)
Italy (n=539)
Japan (n=871)
Brazil (n=688)
Positive (NET) 85 72 77 78 Very positive 47 22 26 23 Somewhat positive 38 49 51 55
Negative (NET) 9 9 9 15 Somewhat negative 6 6 7 10 Very negative 3 3 2 5
Mixed feelings (vol.) 1 5 * * Not sure 4 13 14 6 Declined to answer 1 1 - 1
Kaiser Family Foundation/The Economist Four-Country Survey on Aging and End-of-Life Medical Care, 2016 15
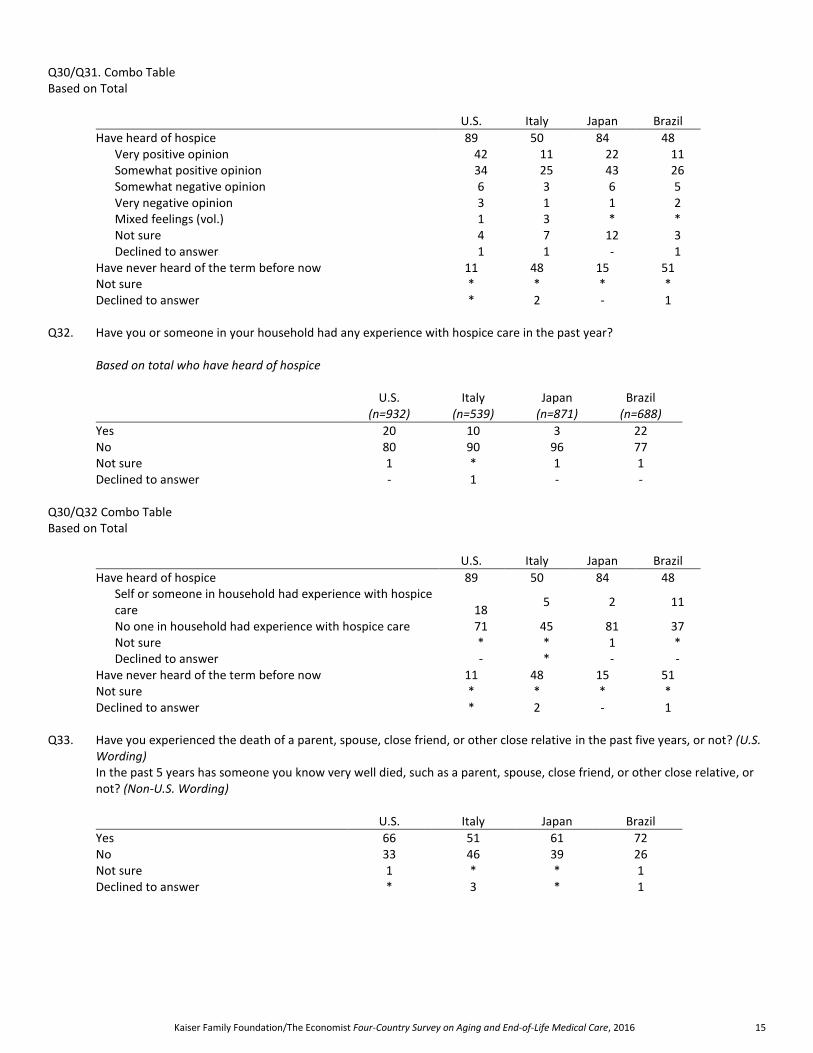
Q30/Q31. Combo Table Based on Total
U.S. Italy Japan Brazil
Have heard of hospice 89 50 84 48 Very positive opinion 42 11 22 11 Somewhat positive opinion 34 25 43 26 Somewhat negative opinion 6 3 6 5 Very negative opinion 3 1 1 2 Mixed feelings (vol.) 1 3 * * Not sure 4 7 12 3 Declined to answer 1 1 - 1
Have never heard of the term before now 11 48 15 51 Not sure * * * * Declined to answer * 2 - 1
Q32. Have you or someone in your household had any experience with hospice care in the past year? Based on total who have heard of hospice
U.S. (n=932)
Italy (n=539)
Japan (n=871)
Brazil (n=688)
Yes 20 10 3 22 No 80 90 96 77 Not sure 1 * 1 1 Declined to answer - 1 - -
Q30/Q32 Combo Table Based on Total
U.S. Italy Japan Brazil
Have heard of hospice 89 50 84 48 Self or someone in household had experience with hospice care 18
5 2 11
No one in household had experience with hospice care 71 45 81 37 Not sure * * 1 * Declined to answer - * - -
Have never heard of the term before now 11 48 15 51 Not sure * * * * Declined to answer * 2 - 1
Q33. Have you experienced the death of a parent, spouse, close friend, or other close relative in the past five years, or not? (U.S.
Wording) In the past 5 years has someone you know very well died, such as a parent, spouse, close friend, or other close relative, or
not? (Non-U.S. Wording)
U.S. Italy Japan Brazil
Yes 66 51 61 72 No 33 46 39 26 Not sure 1 * * 1 Declined to answer * 3 * 1
Kaiser Family Foundation/The Economist Four-Country Survey on Aging and End-of-Life Medical Care, 2016 16
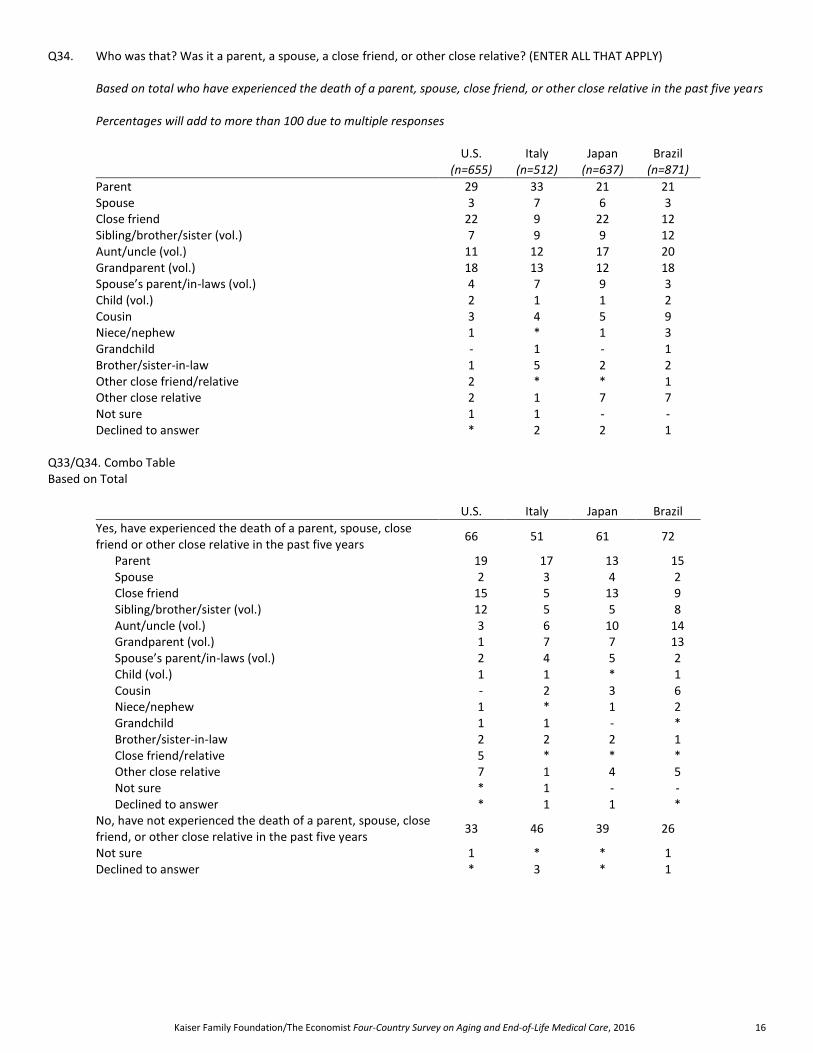
Q34. Who was that? Was it a parent, a spouse, a close friend, or other close relative? (ENTER ALL THAT APPLY) Based on total who have experienced the death of a parent, spouse, close friend, or other close relative in the past five years Percentages will add to more than 100 due to multiple responses
U.S. (n=655)
Italy (n=512)
Japan (n=637)
Brazil (n=871)
Parent 29 33 21 21 Spouse 3 7 6 3 Close friend 22 9 22 12 Sibling/brother/sister (vol.) 7 9 9 12 Aunt/uncle (vol.) 11 12 17 20 Grandparent (vol.) 18 13 12 18 Spouse’s parent/in-laws (vol.) 4 7 9 3 Child (vol.) 2 1 1 2 Cousin 3 4 5 9 Niece/nephew 1 * 1 3 Grandchild - 1 - 1 Brother/sister-in-law 1 5 2 2 Other close friend/relative 2 * * 1 Other close relative 2 1 7 7 Not sure 1 1 - - Declined to answer * 2 2 1
Q33/Q34. Combo Table Based on Total
U.S. Italy Japan Brazil
Yes, have experienced the death of a parent, spouse, close friend or other close relative in the past five years
66 51 61 72
Parent 19 17 13 15 Spouse 2 3 4 2 Close friend 15 5 13 9 Sibling/brother/sister (vol.) 12 5 5 8 Aunt/uncle (vol.) 3 6 10 14 Grandparent (vol.) 1 7 7 13 Spouse’s parent/in-laws (vol.) 2 4 5 2 Child (vol.) 1 1 * 1 Cousin - 2 3 6 Niece/nephew 1 * 1 2 Grandchild 1 1 - * Brother/sister-in-law 2 2 2 1 Close friend/relative 5 * * * Other close relative 7 1 4 5 Not sure * 1 - - Declined to answer * 1 1 *
No, have not experienced the death of a parent, spouse, close friend, or other close relative in the past five years
33 46 39 26
Not sure 1 * * 1 Declined to answer * 3 * 1

Kaiser Family Foundation/The Economist Four-Country Survey on Aging and End-of-Life Medical Care, 2016 17
Q34a. Think about the person who you were close to who died most recently… Who would that person be? Based on total who have experienced the death of more than one parent, spouse, close friend, or other close relative in the
past five years
U.S. (n=42)
Italy (n=35)
Japan (n=75)
Brazil (n=83)
Parent 34 29 22 11 Spouse 5 10 7 5 Close friend 15 6 14 16 Sibling/brother/sister (vol.) 11 14 5 5 Aunt/uncle (vol.) 16 12 18 27 Grandparent (vol.) 14 3 9 8 Spouse’s parent/in-laws (vol.) 6 12 10 1 Child (vol.) - 5 1 3 Cousin - 4 3 10 Niece/nephew - 1 1 1 Grandchild - 4 - 1 Brother/sister-in-law - - 4 1 Other close friend/relative - - 1 3 Other close relative - - 4 6 Not sure - - 1 - Declined to answer - - - 2
Q35. Where did your (RELATIONSHIP) die? In a hospital, in a nursing home, in a hospice, at home, or somewhere else? Based on total who have experienced the death of a parent, spouse, close friend, or other close relative in the past five years
U.S. (n=655)
Italy (n=512)
Japan (n=637)
Brazil (n=871)
Hospital 29 39 69 63 Nursing home 10 5 7 1 Hospice 15 6 5 * At home 34 41 15 23 Somewhere else 10 3 3 13 Currently experiencing/person has not died yet (vol.) * - - - Not sure 1 * 1 1 Declined to answer * 6 1 *
Q33/Q35. Combo Table Based on Total
U.S. Italy Japan Brazil
Yes have experienced the death of a parent, spouse, close friend, or other close relative in the past five years
66 51 61 72
Died in Hospital 19 20 42 45 Died in Nursing home 7 3 5 1 Died in Hospice 10 3 3 * Died at home 23 21 9 16 Died somewhere else 6 1 2 9 Currently experiencing/person has not died yet (vol.) * - - Not sure 1 * * 1 Declined to answer * 3 * *
No, have not experienced the death of a parent, spouse, close friend, or other close relative in the past five years
33 46 39 26
Not sure 1 * * 1 Declined to answer * 3 * 1
Kaiser Family Foundation/The Economist Four-Country Survey on Aging and End-of-Life Medical Care, 2016 18
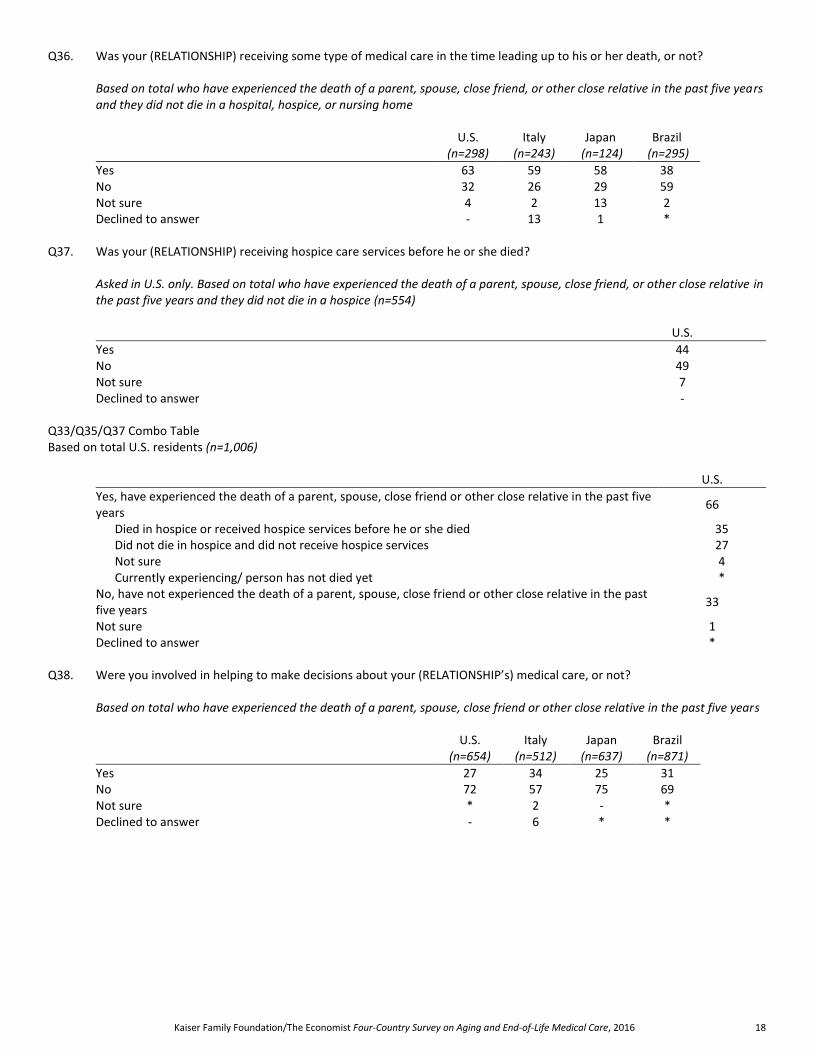
Q36. Was your (RELATIONSHIP) receiving some type of medical care in the time leading up to his or her death, or not? Based on total who have experienced the death of a parent, spouse, close friend, or other close relative in the past five years
and they did not die in a hospital, hospice, or nursing home
U.S. (n=298)
Italy (n=243)
Japan (n=124)
Brazil (n=295)
Yes 63 59 58 38 No 32 26 29 59 Not sure 4 2 13 2 Declined to answer - 13 1 *
Q37. Was your (RELATIONSHIP) receiving hospice care services before he or she died? Asked in U.S. only. Based on total who have experienced the death of a parent, spouse, close friend, or other close relative in
the past five years and they did not die in a hospice (n=554)
U.S.
Yes 44 No 49 Not sure 7 Declined to answer -
Q33/Q35/Q37 Combo Table Based on total U.S. residents (n=1,006)
U.S.
Yes, have experienced the death of a parent, spouse, close friend or other close relative in the past five years
66
Died in hospice or received hospice services before he or she died 35 Did not die in hospice and did not receive hospice services 27 Not sure 4 Currently experiencing/ person has not died yet *
No, have not experienced the death of a parent, spouse, close friend or other close relative in the past five years
33
Not sure 1 Declined to answer *
Q38. Were you involved in helping to make decisions about your (RELATIONSHIP’s) medical care, or not? Based on total who have experienced the death of a parent, spouse, close friend or other close relative in the past five years
U.S. (n=654)
Italy (n=512)
Japan (n=637)
Brazil (n=871)
Yes 27 34 25 31 No 72 57 75 69 Not sure * 2 - * Declined to answer - 6 * *

Kaiser Family Foundation/The Economist Four-Country Survey on Aging and End-of-Life Medical Care, 2016 19
Q33/Q38. Combo Table Based on Total
U.S. Italy Japan Brazil
Yes, have experienced the death of a parent, spouse, close friend or other close relative in the past five years
66 51 61 72
Yes, involved in helping to make decisions about medical care
18 17 15 22
No, not involved in helping to make decisions about medical care
47 29 46 50
Not sure * 1 - * Declined to answer - 3 * *
No, have not experienced the death of a parent, spouse, close friend or other close relative in the past five years
33 46 39 26
Not sure 1 * * 1 Declined to answer * 3 * 1
Q39. Were you involved in providing care for your (RELATIONSHIP) before he/she died, or not? Based on total who have experienced the death of a parent, spouse, close friend or other close relative in the past five years
U.S. (n=654)
Italy (n=512)
Japan (n=637)
Brazil (n=871)
Yes 35 49 30 48 No 64 44 69 51 Not sure 1 * 1 1 Declined to answer * 6 * *
Q33/Q39. Combo Table Based on Total
U.S. Italy Japan Brazil
Yes, have experienced the death of a parent, spouse, close friend or other close relative in the past five years
66 51 61 72
Yes, involved in providing care before he/she died 23 25 18 34 No, not involved in providing care before he/she died 42 22 43 37 Not sure 1 * * 1 Declined to answer * 3 * *
No, have not experienced the death of a parent, spouse, close friend or other close relative in the past five years
33 46 39 26
Not sure 1 * * 1 Declined to answer * 3 * *
Q40. How well did you know your (RELATIONSHIP)’s wishes for end-of-life treatment? Did you know exactly what he/she wanted,
you had a pretty good idea, or you didn’t really know what his/her wishes were? Based on total who have experienced the death of a parent, spouse, close friend or other close relative in the past five years
U.S. (n=654)
Italy (n=512)
Japan (n=637)
Brazil (n=871)
Knew exactly what he/she wanted 30 25 10 18 Had a pretty good idea 28 17 16 14 Didn’t really know what his/her wishes were 40 47 72 66 Not sure 2 4 2 2 Declined to answer * 7 * *
Kaiser Family Foundation/The Economist Four-Country Survey on Aging and End-of-Life Medical Care, 2016 20
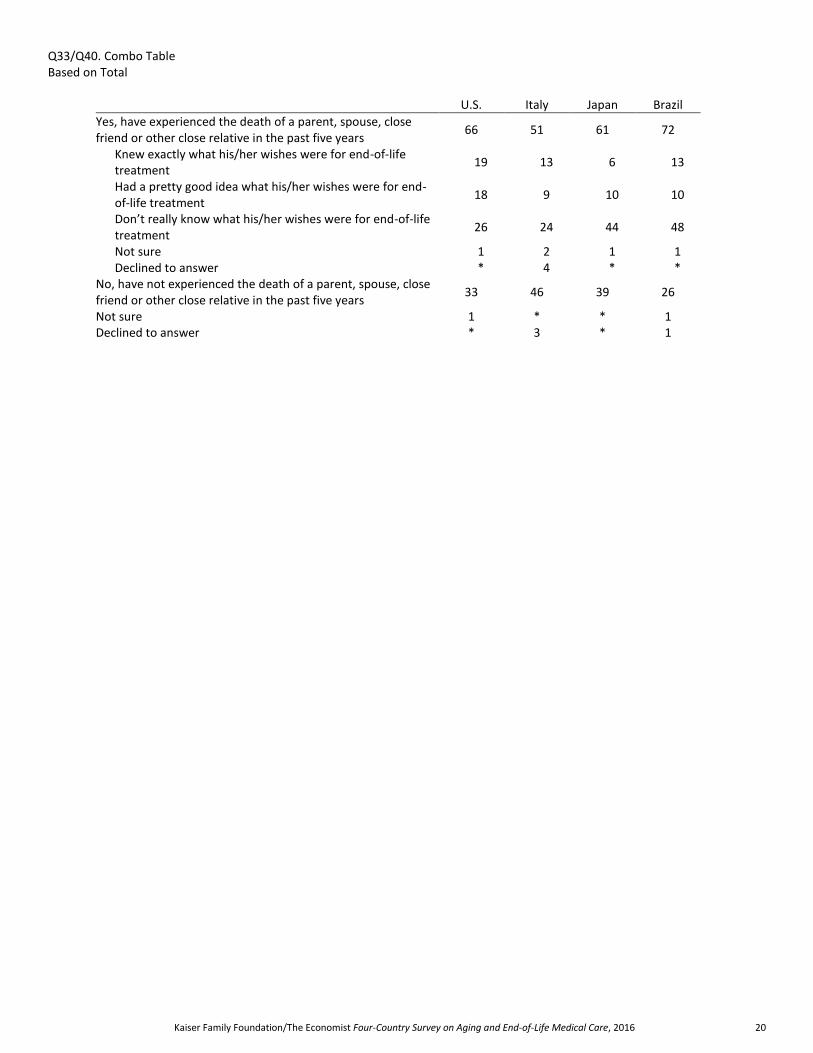
Q33/Q40. Combo Table Based on Total
U.S. Italy Japan Brazil
Yes, have experienced the death of a parent, spouse, close friend or other close relative in the past five years
66 51 61 72
Knew exactly what his/her wishes were for end-of-life treatment
19 13 6 13
Had a pretty good idea what his/her wishes were for end-of-life treatment
18 9 10 10
Don’t really know what his/her wishes were for end-of-life treatment
26 24 44 48
Not sure 1 2 1 1 Declined to answer * 4 * *
No, have not experienced the death of a parent, spouse, close friend or other close relative in the past five years
33 46 39 26
Not sure 1 * * 1 Declined to answer * 3 * 1

Kaiser Family Foundation/The Economist Four-Country Survey on Aging and End-of-Life Medical Care, 2016 21
Q41. Please tell me whether each of the following descriptions applied to your (RELATIONSHIP)’s death. (First/Next), (INSERT), or not? (scramble items a-f)
Based on total who have experienced the death of a parent, spouse, close friend or other close relative in the past five years
Yes No Not sure
Declined to answer
a. Did your (RELATIONSHIP) experience more pain than was necessary
U.S. (n=654) 25 59 15 * Italy (n=512) 25 50 17 8 Japan (n=637) 31 50 19 * Brazil (n=871) 38 47 15 1
b. Did your (RELATIONSHIP) Have access to appropriate medical treatments for prolonging life
U.S. (n=654) 71 18 10 1 Italy (n=512) 52 32 8 8 Japan (n=637) 42 42 16 * Brazil (n=871) 54 40 5 *
c. Were your (RELATIONSHIP)’S wishes about medical care followed
U.S. (n=654) 71 12 16 1 Italy (n=512) 68 8 17 8 Japan (n=637) 57 17 25 * Brazil (n=871) 63 24 12 1
d. Did your (RELATIONSHIP) die with friends or family present
U.S. (n=654) 81 16 3 1 Italy (n=512) 73 18 2 7 Japan (n=637) 72 22 6 * Brazil (n=871) 77 21 2 *
e. Were your (RELATIONSHIP)’s spiritual or religious beliefs respected
U.S. (n=654) 86 7 6 * Italy (n=512) 83 2 7 8 Japan (n=637) 54 18 28 * Brazil (n=871) 81 12 6 1
f. Did your (RELATIONSHIP) receive medical care that placed an undue financial burden on the patient’s family
U.S. (n=654) 17 71 12 * Italy (n=512) 21 65 7 7 Japan (n=637) 15 73 12 * Brazil (n=871) 18 76 6 1
Kaiser Family Foundation/The Economist Four-Country Survey on Aging and End-of-Life Medical Care, 2016 22
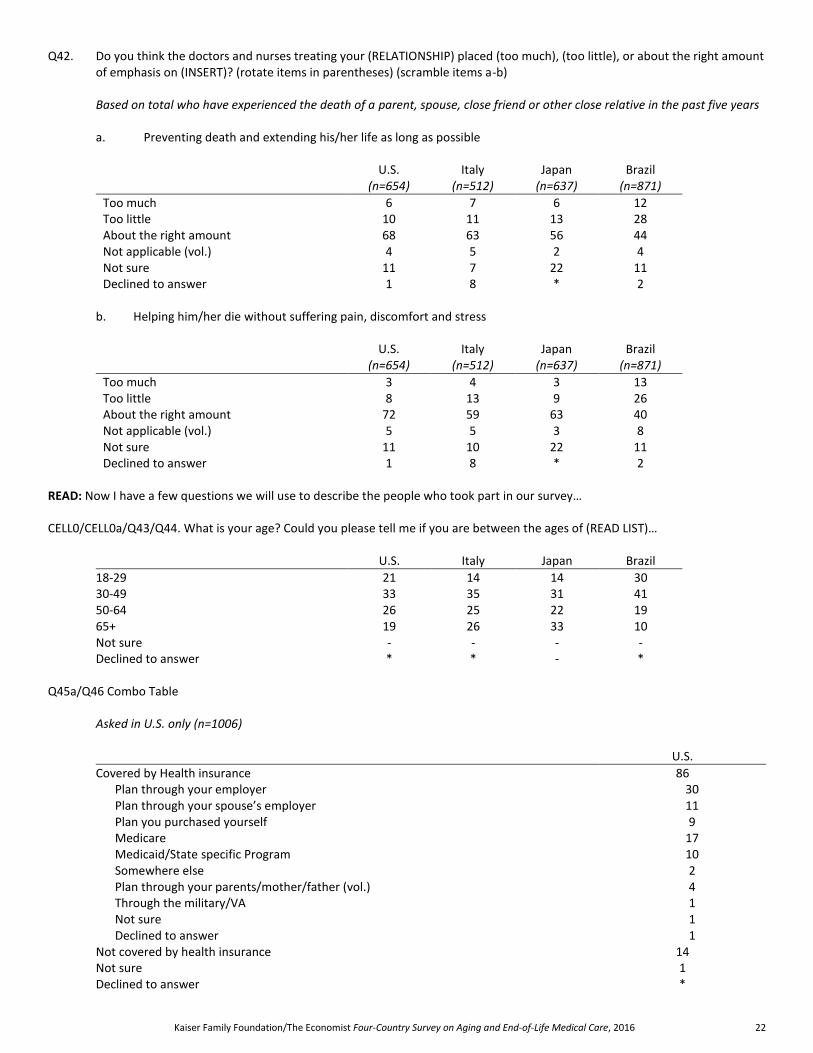
Q42. Do you think the doctors and nurses treating your (RELATIONSHIP) placed (too much), (too little), or about the right amount of emphasis on (INSERT)? (rotate items in parentheses) (scramble items a-b)
Based on total who have experienced the death of a parent, spouse, close friend or other close relative in the past five years a. Preventing death and extending his/her life as long as possible
U.S. (n=654)
Italy (n=512)
Japan (n=637)
Brazil (n=871)
Too much 6 7 6 12 Too little 10 11 13 28 About the right amount 68 63 56 44 Not applicable (vol.) 4 5 2 4 Not sure 11 7 22 11 Declined to answer 1 8 * 2
b. Helping him/her die without suffering pain, discomfort and stress
U.S. (n=654)
Italy (n=512)
Japan (n=637)
Brazil (n=871)
Too much 3 4 3 13 Too little 8 13 9 26 About the right amount 72 59 63 40 Not applicable (vol.) 5 5 3 8 Not sure 11 10 22 11 Declined to answer 1 8 * 2
READ: Now I have a few questions we will use to describe the people who took part in our survey… CELL0/CELL0a/Q43/Q44. What is your age? Could you please tell me if you are between the ages of (READ LIST)…
U.S. Italy Japan Brazil
18-29 21 14 14 30 30-49 33 35 31 41 50-64 26 25 22 19 65+ 19 26 33 10 Not sure - - - - Declined to answer * * - *
Q45a/Q46 Combo Table Asked in U.S. only (n=1006)
U.S.
Covered by Health insurance 86 Plan through your employer 30 Plan through your spouse’s employer 11 Plan you purchased yourself 9 Medicare 17 Medicaid/State specific Program 10 Somewhere else 2 Plan through your parents/mother/father (vol.) 4 Through the military/VA 1 Not sure 1 Declined to answer 1
Not covered by health insurance 14 Not sure 1 Declined to answer *
Kaiser Family Foundation/The Economist Four-Country Survey on Aging and End-of-Life Medical Care, 2016 23
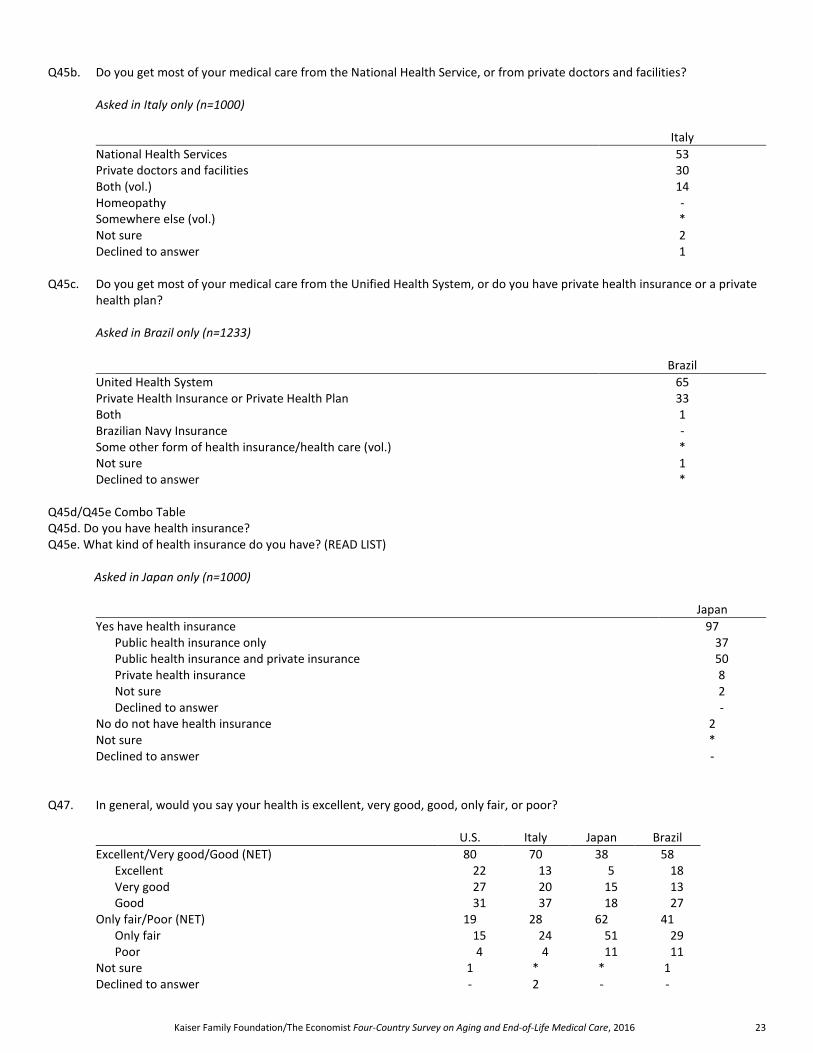
Q45b. Do you get most of your medical care from the National Health Service, or from private doctors and facilities? Asked in Italy only (n=1000)
Italy
National Health Services 53 Private doctors and facilities 30 Both (vol.) 14 Homeopathy - Somewhere else (vol.) * Not sure 2 Declined to answer 1
Q45c. Do you get most of your medical care from the Unified Health System, or do you have private health insurance or a private
health plan? Asked in Brazil only (n=1233)
Brazil
United Health System 65 Private Health Insurance or Private Health Plan 33 Both 1 Brazilian Navy Insurance - Some other form of health insurance/health care (vol.) * Not sure 1 Declined to answer *
Q45d/Q45e Combo Table Q45d. Do you have health insurance? Q45e. What kind of health insurance do you have? (READ LIST) Asked in Japan only (n=1000)
Japan
Yes have health insurance 97 Public health insurance only 37 Public health insurance and private insurance 50 Private health insurance 8 Not sure 2 Declined to answer -
No do not have health insurance 2 Not sure * Declined to answer -
Q47. In general, would you say your health is excellent, very good, good, only fair, or poor?
U.S. Italy Japan Brazil
Excellent/Very good/Good (NET) 80 70 38 58 Excellent 22 13 5 18 Very good 27 20 15 13 Good 31 37 18 27
Only fair/Poor (NET) 19 28 62 41 Only fair 15 24 51 29 Poor 4 4 11 11
Not sure 1 * * 1 Declined to answer - 2 - -

Kaiser Family Foundation/The Economist Four-Country Survey on Aging and End-of-Life Medical Care, 2016 24
Q48. Does any disability, handicap, or chronic disease keep you from participating fully in work, school, housework, or other
activities?
U.S. Italy Japan Brazil
Yes 20 10 10 17 No 79 89 90 82 Not sure * * * 1 Declined to answer * 1 - *
Q49. What best describes your employment situation today? (READ IN ORDER)
U.S. Italy Japan Brazil
Employed full-time 46 39 37 41 Employed part-time 11 9 14 10 Not employed (NET) 42 49 49 47
Unemployed and currently seeking employment 4 3 1 16 Unemployed and not seeking employment 3 4 1 3 A student 5 5 6 5 Retired 17 28 13 10 On disability and can’t work 6 1 3 3 Or, a homemaker or stay at home parent 7 7 25 9
Not sure * * * 2 Declined to answer * 2 * *
Q50. In politics today, do you consider yourself a [ROTATE: Republican, Democrat/Democrat, Republican], an Independent, or
what? Asked in U.S. only (n=1006)
U.S.
Republican 24 Democrat 31 Independent 25 Other/None (vol.) 10 Not sure 6 Declined to answer 5

Kaiser Family Foundation/The Economist Four-Country Survey on Aging and End-of-Life Medical Care, 2016 25
Q50b. To which political party, if any, do you personally feel closest? Asked in Brazil only (n=1233)
Brazil
DEM – Democratas * PCB - Partido Comunista Brasileiro - PCdoB - Partido Comunista do Brasil * PCO - Partido da Causa Operária - PDT - Partido Democrático Trabalhista 1 PHS - Partido Humanista da Solidariedade * PMDB - Partido do Movimento Democrático Brasileiro 2 PMN – Partido da Mobilização Nacional - PP - Partido Progressista 1 PPS - Partido Popular Socialista - PR - Partido da República * PRB - Partido Republicano Brasileiro 1 PRP - Partido Republicano Progressista - PRTB - Partido Renovador Trabalhista Brasileiro - PSB - Partido Socialista Brasileiro 1 PSC - Partido Social Cristão 1 PSDB - Partido da Social Democracia Brasileira 3 PSDC - Partido Social Democrata Cristão - PSL - Partido Social Liberal - PSOL - Partido Socialismo e Liberdade * PT - Partido dos Trabalhadores 7 PTB - Partido Trabalhista Brasileiro - PTdoB - Partido Trabalhista do Brasil - PV - Partido Verde * PSD - Partido Social Democrático * PEN – Partido Ecológico Nacional * Other (vol.) 1 None/No party (vol.) 75 Not sure 5 Declined to answer 2
Kaiser Family Foundation/The Economist Four-Country Survey on Aging and End-of-Life Medical Care, 2016 26
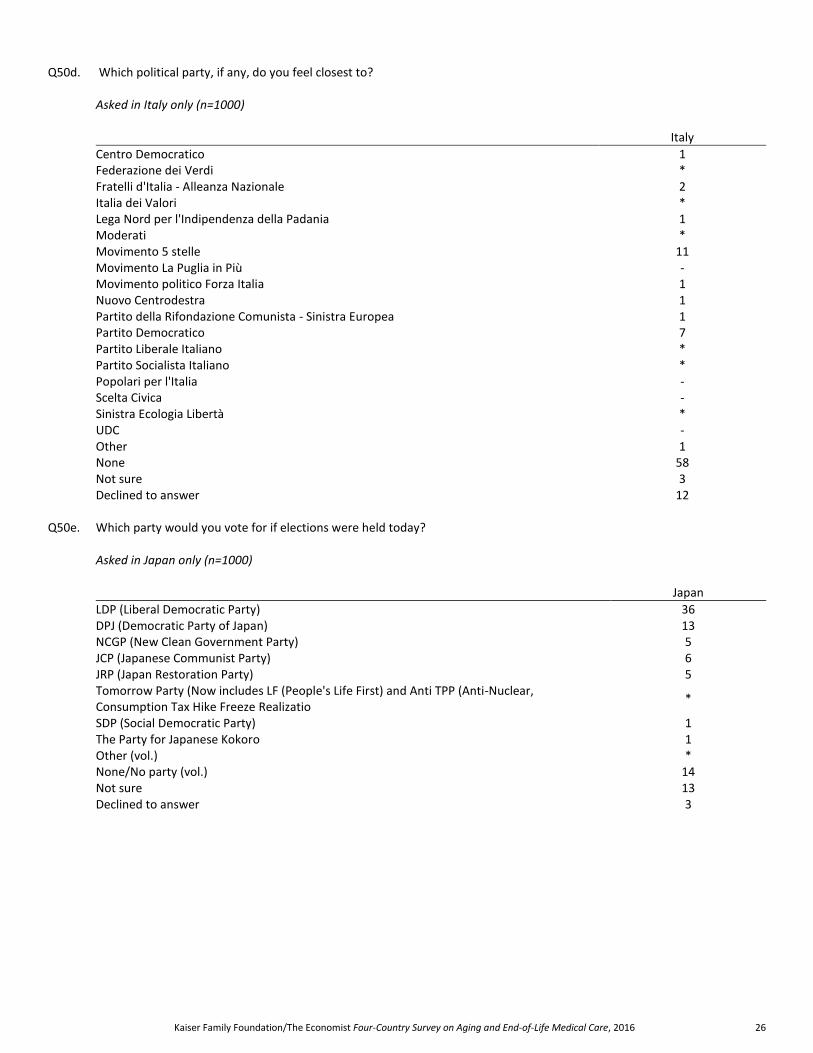
Q50d. Which political party, if any, do you feel closest to? Asked in Italy only (n=1000)
Italy
Centro Democratico 1 Federazione dei Verdi * Fratelli d'Italia - Alleanza Nazionale 2 Italia dei Valori * Lega Nord per l'Indipendenza della Padania 1 Moderati * Movimento 5 stelle 11 Movimento La Puglia in Più - Movimento politico Forza Italia 1 Nuovo Centrodestra 1 Partito della Rifondazione Comunista - Sinistra Europea 1 Partito Democratico 7 Partito Liberale Italiano * Partito Socialista Italiano * Popolari per l'Italia - Scelta Civica - Sinistra Ecologia Libertà * UDC - Other 1 None 58 Not sure 3 Declined to answer 12
Q50e. Which party would you vote for if elections were held today? Asked in Japan only (n=1000)
Japan
LDP (Liberal Democratic Party) 36 DPJ (Democratic Party of Japan) 13 NCGP (New Clean Government Party) 5 JCP (Japanese Communist Party) 6 JRP (Japan Restoration Party) 5 Tomorrow Party (Now includes LF (People's Life First) and Anti TPP (Anti-Nuclear, Consumption Tax Hike Freeze Realizatio
*
SDP (Social Democratic Party) 1 The Party for Japanese Kokoro 1 Other (vol.) * None/No party (vol.) 14 Not sure 13 Declined to answer 3
Kaiser Family Foundation/The Economist Four-Country Survey on Aging and End-of-Life Medical Care, 2016 27
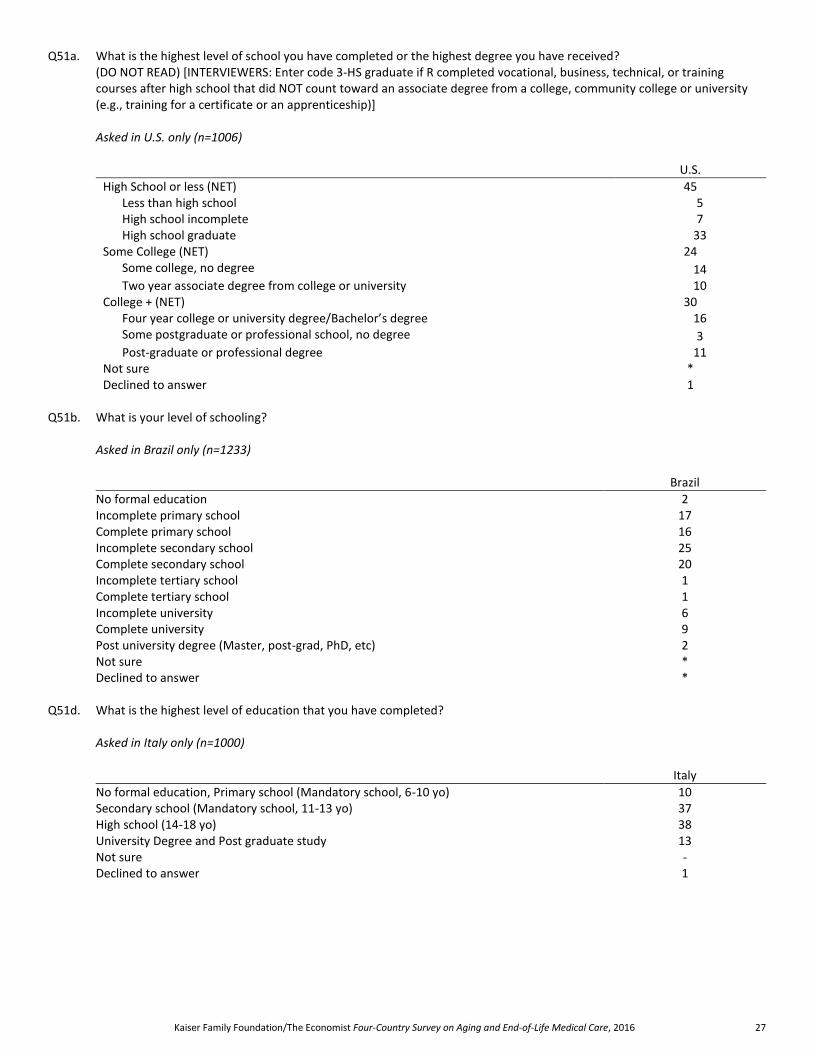
Q51a. What is the highest level of school you have completed or the highest degree you have received? (DO NOT READ) [INTERVIEWERS: Enter code 3-HS graduate if R completed vocational, business, technical, or training
courses after high school that did NOT count toward an associate degree from a college, community college or university (e.g., training for a certificate or an apprenticeship)]
Asked in U.S. only (n=1006)
U.S.
High School or less (NET) 45 Less than high school 5 High school incomplete 7 High school graduate 33
Some College (NET) 24 Some college, no degree 14 Two year associate degree from college or university 10
College + (NET) 30 Four year college or university degree/Bachelor’s degree 16 Some postgraduate or professional school, no degree 3 Post-graduate or professional degree 11
Not sure * Declined to answer 1
Q51b. What is your level of schooling? Asked in Brazil only (n=1233)
Brazil
No formal education 2 Incomplete primary school 17 Complete primary school 16 Incomplete secondary school 25 Complete secondary school 20 Incomplete tertiary school 1 Complete tertiary school 1 Incomplete university 6 Complete university 9 Post university degree (Master, post-grad, PhD, etc) 2 Not sure * Declined to answer *
Q51d. What is the highest level of education that you have completed? Asked in Italy only (n=1000)
Italy
No formal education, Primary school (Mandatory school, 6-10 yo) 10 Secondary school (Mandatory school, 11-13 yo) 37 High school (14-18 yo) 38 University Degree and Post graduate study 13 Not sure - Declined to answer 1
Kaiser Family Foundation/The Economist Four-Country Survey on Aging and End-of-Life Medical Care, 2016 28
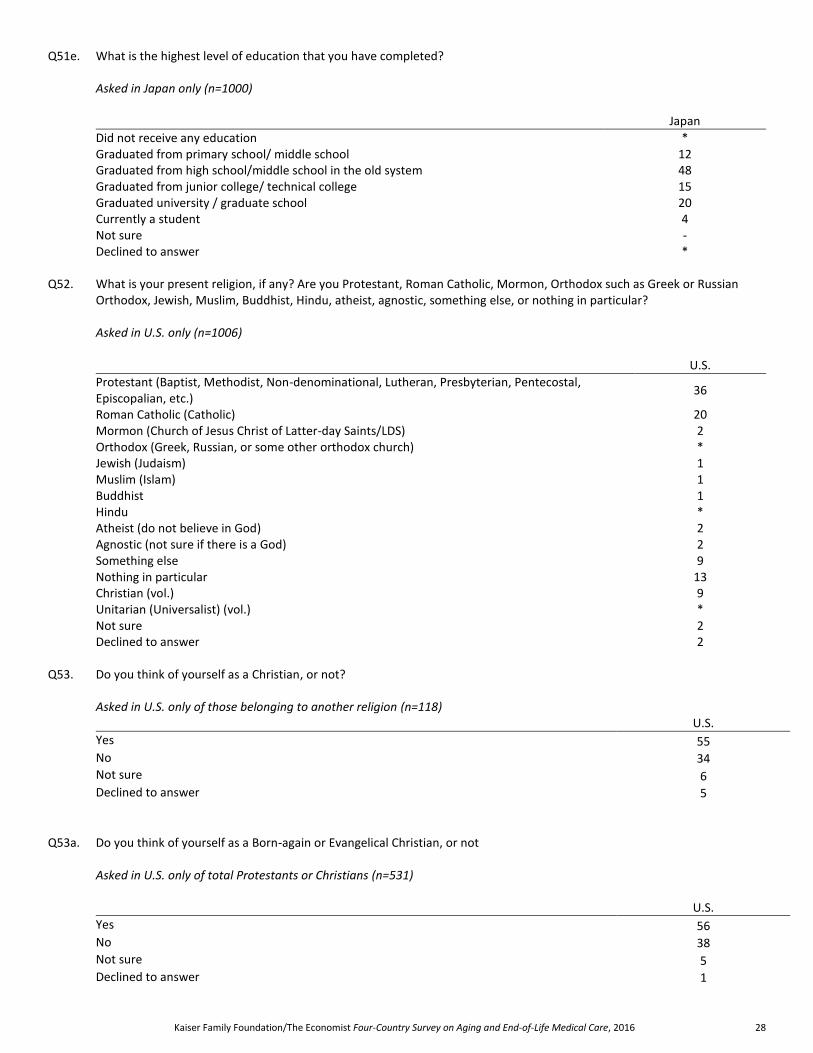
Q51e. What is the highest level of education that you have completed? Asked in Japan only (n=1000)
Japan
Did not receive any education * Graduated from primary school/ middle school 12 Graduated from high school/middle school in the old system 48 Graduated from junior college/ technical college 15 Graduated university / graduate school 20 Currently a student 4 Not sure - Declined to answer *
Q52. What is your present religion, if any? Are you Protestant, Roman Catholic, Mormon, Orthodox such as Greek or Russian
Orthodox, Jewish, Muslim, Buddhist, Hindu, atheist, agnostic, something else, or nothing in particular? Asked in U.S. only (n=1006)
U.S.
Protestant (Baptist, Methodist, Non-denominational, Lutheran, Presbyterian, Pentecostal, Episcopalian, etc.)
36
Roman Catholic (Catholic) 20 Mormon (Church of Jesus Christ of Latter-day Saints/LDS) 2 Orthodox (Greek, Russian, or some other orthodox church) * Jewish (Judaism) 1 Muslim (Islam) 1 Buddhist 1 Hindu * Atheist (do not believe in God) 2 Agnostic (not sure if there is a God) 2 Something else 9 Nothing in particular 13 Christian (vol.) 9 Unitarian (Universalist) (vol.) * Not sure 2 Declined to answer 2
Q53. Do you think of yourself as a Christian, or not? Asked in U.S. only of those belonging to another religion (n=118)
U.S.
Yes 55 No 34 Not sure 6 Declined to answer 5
Q53a. Do you think of yourself as a Born-again or Evangelical Christian, or not Asked in U.S. only of total Protestants or Christians (n=531)
U.S.
Yes 56 No 38 Not sure 5 Declined to answer 1

Kaiser Family Foundation/The Economist Four-Country Survey on Aging and End-of-Life Medical Care, 2016 29
Q52/Q53/Q53a Combo Table Asked in U.S. Only (n=1006)
U.S.
Protestant/Christian 52 Born Again Christian 29 Not Born Again Christian 19 Not Sure 3 Declined to answer * Not Protestant/Christian 48
Q52b. Now, a quick question about religion. Do you consider yourself as belonging to some specific religion? (IF YES) Which one? Asked in Brazil only (n=1233)
Brazil
Catholic 44 Evangelical 30 Spiritism 3 Afro-Brasilian (Candomblé / Umbanda) 1 Protestant 1 Jewish * Other 4 None 16 Not sure * Declined to answer *
Q52d. I have a short question on religion. Do you feel like you belong in a particular religion? (IF YES) Which one? Asked in Italy only (n=1000)
Italy
Catholic 75 Protestant * Orthodox 1 Jewish * Muslim * Buddhist * Other 2 None 21 Not sure 1 Declined to answer 1
Q52e. Please tell us briefly about your religion. Please tell us your religion. Asked in Japan only (n=1000)
Japan
Buddhism 44 Shintoism 3 Christianity 2 Islam * No Religion 49 Other (vol.) 1 Not sure 1 Declined to answer *
Kaiser Family Foundation/The Economist Four-Country Survey on Aging and End-of-Life Medical Care, 2016 30
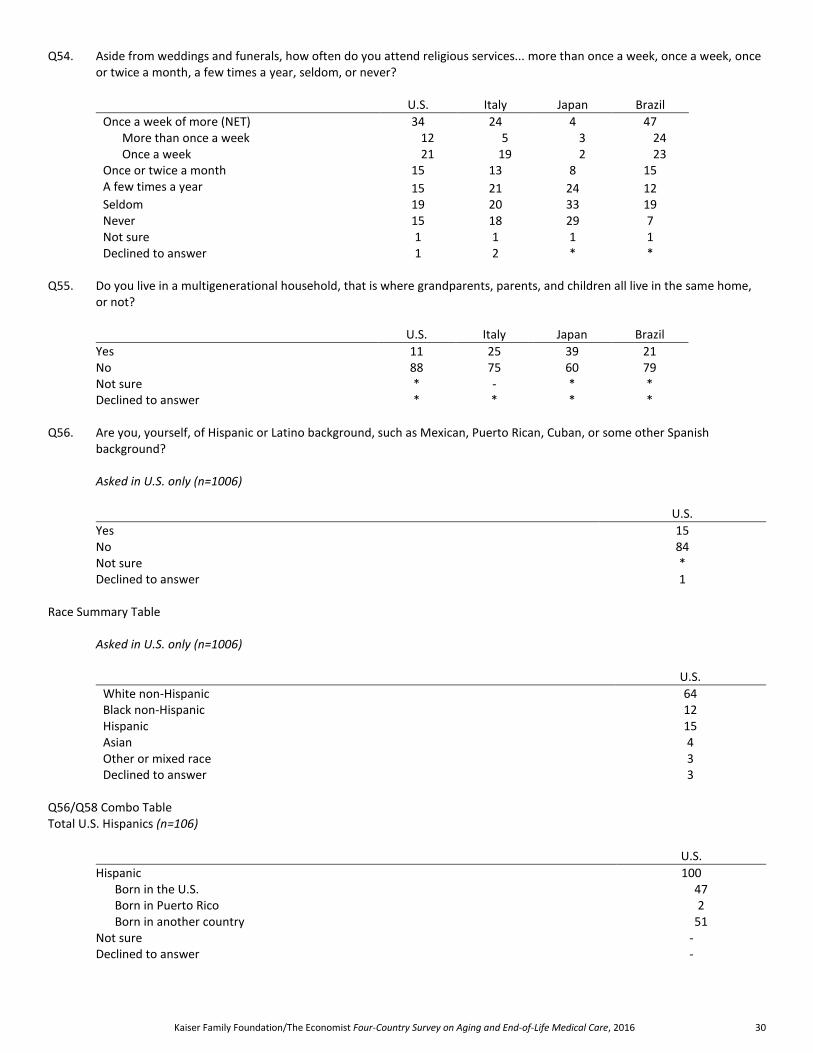
Q54. Aside from weddings and funerals, how often do you attend religious services... more than once a week, once a week, once or twice a month, a few times a year, seldom, or never?
U.S. Italy Japan Brazil
Once a week of more (NET) 34 24 4 47 More than once a week 12 5 3 24 Once a week 21 19 2 23
Once or twice a month 15 13 8 15 A few times a year 15 21 24 12 Seldom 19 20 33 19 Never 15 18 29 7 Not sure 1 1 1 1 Declined to answer 1 2 * *
Q55. Do you live in a multigenerational household, that is where grandparents, parents, and children all live in the same home,
or not?
U.S. Italy Japan Brazil
Yes 11 25 39 21 No 88 75 60 79 Not sure * - * * Declined to answer * * * *
Q56. Are you, yourself, of Hispanic or Latino background, such as Mexican, Puerto Rican, Cuban, or some other Spanish
background? Asked in U.S. only (n=1006)
U.S.
Yes 15 No 84 Not sure * Declined to answer 1
Race Summary Table Asked in U.S. only (n=1006)
U.S.
White non-Hispanic 64 Black non-Hispanic 12 Hispanic 15 Asian 4 Other or mixed race 3 Declined to answer 3
Q56/Q58 Combo Table Total U.S. Hispanics (n=106)
U.S.
Hispanic 100 Born in the U.S. 47 Born in Puerto Rico 2 Born in another country 51
Not sure - Declined to answer -
Kaiser Family Foundation/The Economist Four-Country Survey on Aging and End-of-Life Medical Care, 2016 31
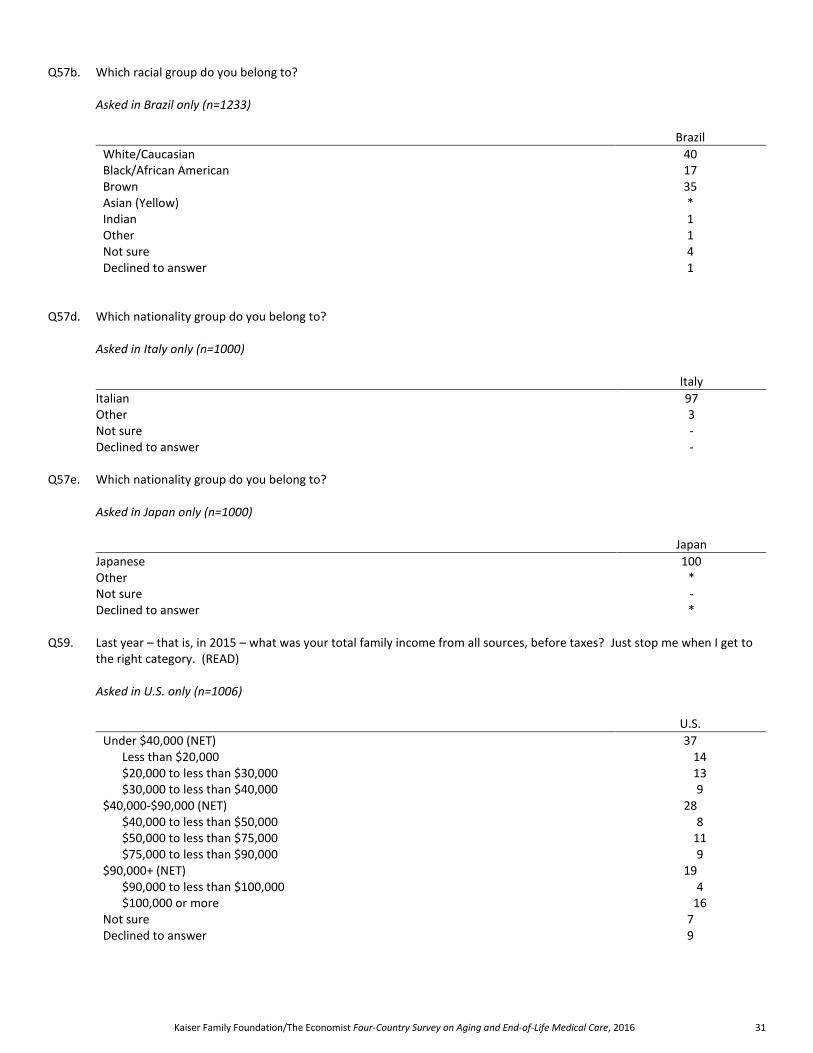
Q57b. Which racial group do you belong to? Asked in Brazil only (n=1233)
Brazil
White/Caucasian 40 Black/African American 17 Brown 35 Asian (Yellow) * Indian 1 Other 1 Not sure 4 Declined to answer 1
Q57d. Which nationality group do you belong to? Asked in Italy only (n=1000)
Italy
Italian 97 Other 3 Not sure - Declined to answer -
Q57e. Which nationality group do you belong to? Asked in Japan only (n=1000)
Japan
Japanese 100 Other * Not sure - Declined to answer *
Q59. Last year – that is, in 2015 – what was your total family income from all sources, before taxes? Just stop me when I get to
the right category. (READ) Asked in U.S. only (n=1006)
U.S.
Under $40,000 (NET) 37 Less than $20,000 14 $20,000 to less than $30,000 13 $30,000 to less than $40,000 9
$40,000-$90,000 (NET) 28 $40,000 to less than $50,000 8 $50,000 to less than $75,000 11 $75,000 to less than $90,000 9
$90,000+ (NET) 19 $90,000 to less than $100,000 4 $100,000 or more 16
Not sure 7 Declined to answer 9

Kaiser Family Foundation/The Economist Four-Country Survey on Aging and End-of-Life Medical Care, 2016 32
Q59b. Which of these does your monthly family income fall into, counting all salaries, pensions, and other incomes received. Just give the group that your household falls into, before taxes and other deductions
Asked in Brazil only (n=1233)
Brazil
Up to R$ 880 23 From R$ 881 to 1.760 21 From R$ 1.761 to 2.640 16 From R$ 2.641 to 3.520 11 From R$ 3.521 to 4.400 7 From R$ 4.401 to 8.800 7 From R$ 8.801 to 13.200 2 From R$ 13.201 to 17.600 1 R$ 17.601 or more 1 Not sure 6 Declined to answer 4
Q59d. What is the total monthly income of your household, taking into account all wages, annuities, pensions and other income,
after taxes? Asked in Italy only (n=1000)
Italy
Less than € 1000 14 € 1001 - € 1500 18 € 1501 – € 2000 10 € 2001 - € 2500 8 € 2501 - € 4000 8 More than € 4000 5 Not sure 11 Declined to answer 26
Q59e. Here is a list of annual household incomes. Which of these does your household fall into counting all wages, salaries,
pensions and other incomes that come in? Asked in Japan only (n=1000)
Japan
Less than 1 million yen 6 1 to less than 2 million yen 12 2 to less than 3 million yen 14 3 to less than 4 million yen 13 4 to less than 5 million yen 11 5 to less than 6 million yen 7 6 to less than 7 million yen 4 7 to less than 8 million yen 5 8 to less than 9 million yen 3 9 to less than 10 million yen 2 10 to less than 12 million yen 3 12 to less than 15 million yen 1 15 to less than 20 million yen 1 20 million yen or higher * Not sure 12 Declined to answer 6
Kaiser Family Foundation/The Economist Four-Country Survey on Aging and End-of-Life Medical Care, 2016 33
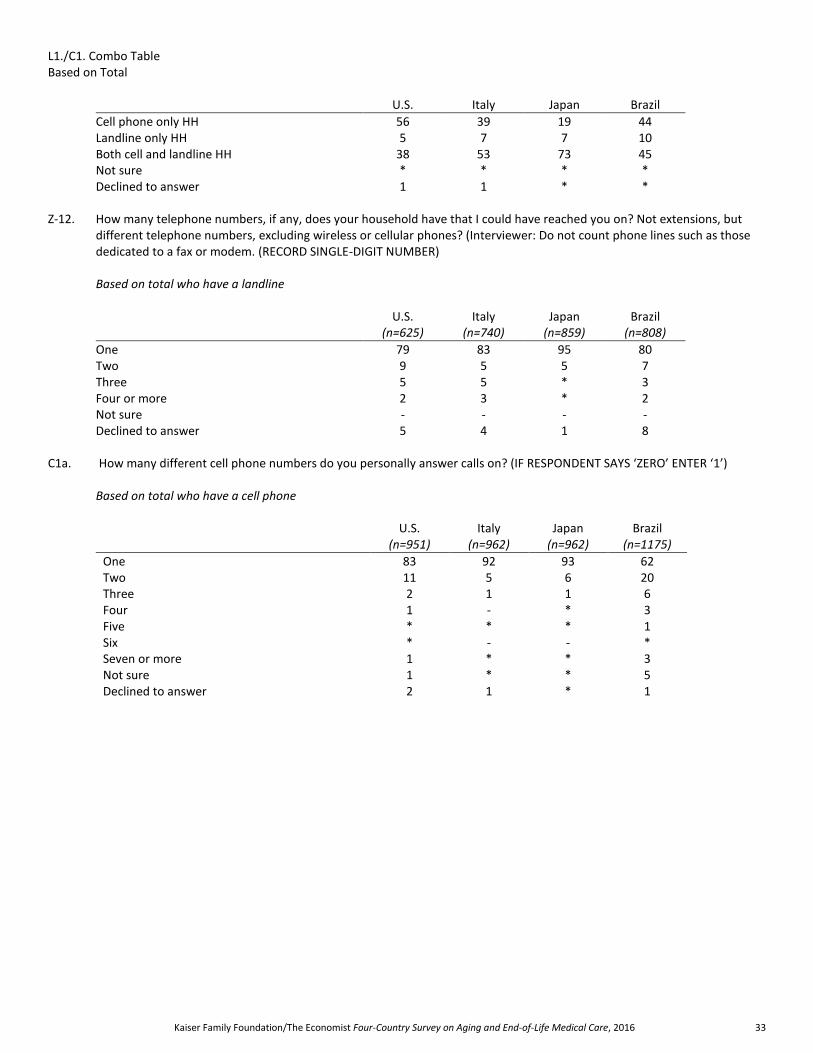
L1./C1. Combo Table Based on Total
U.S. Italy Japan Brazil
Cell phone only HH 56 39 19 44 Landline only HH 5 7 7 10 Both cell and landline HH 38 53 73 45 Not sure * * * * Declined to answer 1 1 * *
Z-12. How many telephone numbers, if any, does your household have that I could have reached you on? Not extensions, but
different telephone numbers, excluding wireless or cellular phones? (Interviewer: Do not count phone lines such as those dedicated to a fax or modem. (RECORD SINGLE-DIGIT NUMBER)
Based on total who have a landline
U.S. (n=625)
Italy (n=740)
Japan (n=859)
Brazil (n=808)
One 79 83 95 80 Two 9 5 5 7 Three 5 5 * 3 Four or more 2 3 * 2 Not sure - - - - Declined to answer 5 4 1 8
C1a. How many different cell phone numbers do you personally answer calls on? (IF RESPONDENT SAYS ‘ZERO’ ENTER ‘1’) Based on total who have a cell phone
U.S. (n=951)
Italy (n=962)
Japan (n=962)
Brazil (n=1175)
One 83 92 93 62 Two 11 5 6 20 Three 2 1 1 6 Four 1 - * 3 Five * * * 1 Six * - - * Seven or more 1 * * 3 Not sure 1 * * 5 Declined to answer 2 1 * 1
Kaiser Family Foundation/The Economist Four-Country Survey on Aging and End-of-Life Medical Care, 2016 34
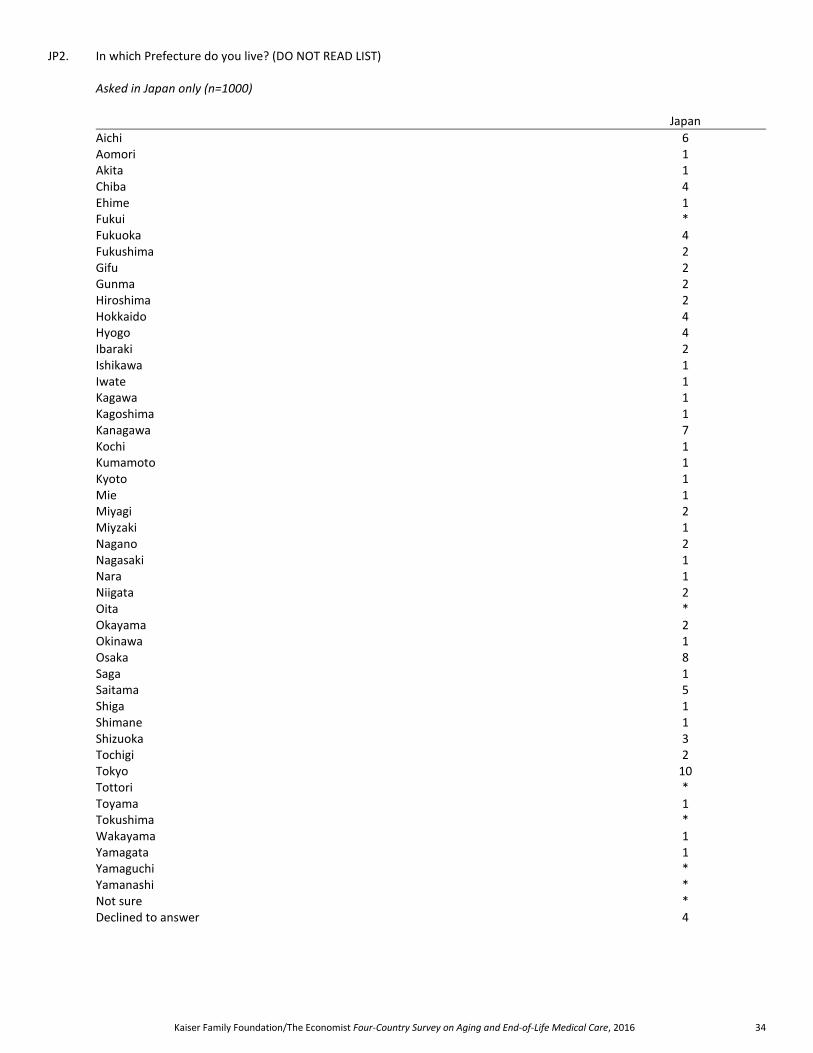
JP2. In which Prefecture do you live? (DO NOT READ LIST) Asked in Japan only (n=1000)
Japan
Aichi 6 Aomori 1 Akita 1 Chiba 4 Ehime 1 Fukui * Fukuoka 4 Fukushima 2 Gifu 2 Gunma 2 Hiroshima 2 Hokkaido 4 Hyogo 4 Ibaraki 2 Ishikawa 1 Iwate 1 Kagawa 1 Kagoshima 1 Kanagawa 7 Kochi 1 Kumamoto 1 Kyoto 1 Mie 1 Miyagi 2 Miyzaki 1 Nagano 2 Nagasaki 1 Nara 1 Niigata 2 Oita * Okayama 2 Okinawa 1 Osaka 8 Saga 1 Saitama 5 Shiga 1 Shimane 1 Shizuoka 3 Tochigi 2 Tokyo 10 Tottori * Toyama 1 Tokushima * Wakayama 1 Yamagata 1 Yamaguchi * Yamanashi * Not sure * Declined to answer 4
Kaiser Family Foundation/The Economist Four-Country Survey on Aging and End-of-Life Medical Care, 2016 35
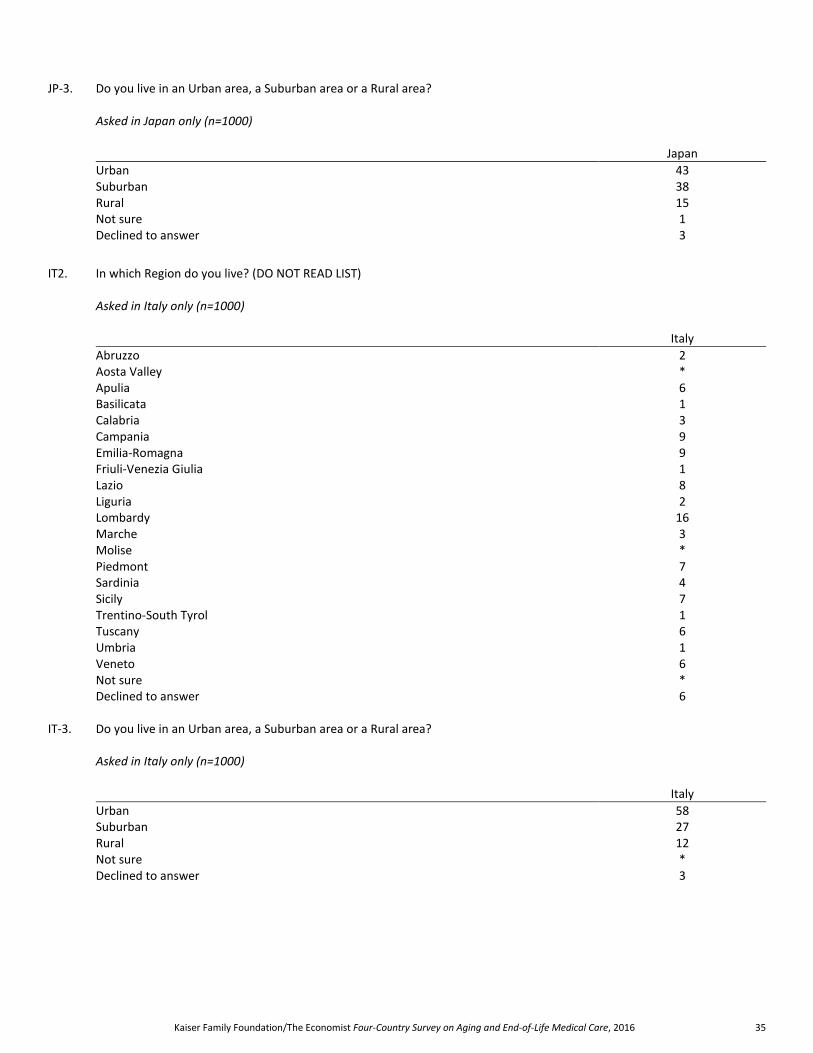
JP-3. Do you live in an Urban area, a Suburban area or a Rural area? Asked in Japan only (n=1000)
Japan
Urban 43 Suburban 38 Rural 15 Not sure 1 Declined to answer 3
IT2. In which Region do you live? (DO NOT READ LIST) Asked in Italy only (n=1000)
Italy
Abruzzo 2 Aosta Valley * Apulia 6 Basilicata 1 Calabria 3 Campania 9 Emilia-Romagna 9 Friuli-Venezia Giulia 1 Lazio 8 Liguria 2 Lombardy 16 Marche 3 Molise * Piedmont 7 Sardinia 4 Sicily 7 Trentino-South Tyrol 1 Tuscany 6 Umbria 1 Veneto 6 Not sure * Declined to answer 6
IT-3. Do you live in an Urban area, a Suburban area or a Rural area? Asked in Italy only (n=1000)
Italy
Urban 58 Suburban 27 Rural 12 Not sure * Declined to answer 3
Kaiser Family Foundation/The Economist Four-Country Survey on Aging and End-of-Life Medical Care, 2016 36
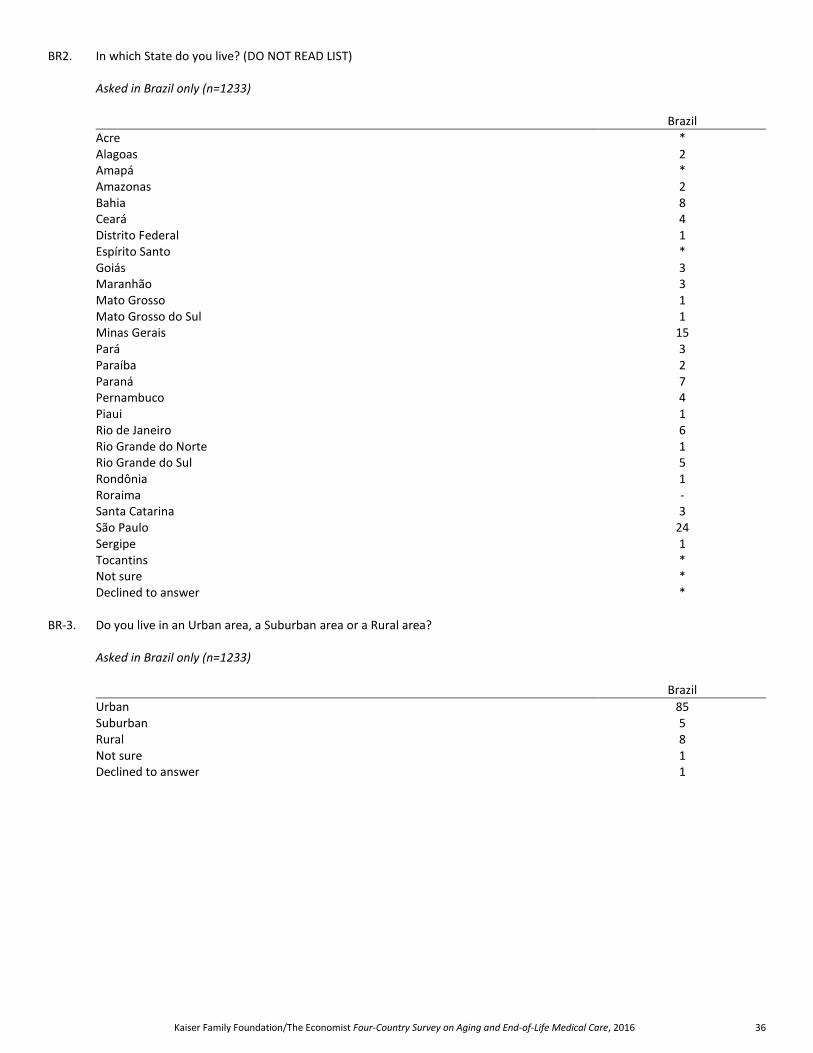
BR2. In which State do you live? (DO NOT READ LIST) Asked in Brazil only (n=1233)
Brazil
Acre * Alagoas 2 Amapá * Amazonas 2 Bahia 8 Ceará 4 Distrito Federal 1 Espírito Santo * Goiás 3 Maranhão 3 Mato Grosso 1 Mato Grosso do Sul 1 Minas Gerais 15 Pará 3 Paraíba 2 Paraná 7 Pernambuco 4 Piaui 1 Rio de Janeiro 6 Rio Grande do Norte 1 Rio Grande do Sul 5 Rondônia 1 Roraima - Santa Catarina 3 São Paulo 24 Sergipe 1 Tocantins * Not sure * Declined to answer *
BR-3. Do you live in an Urban area, a Suburban area or a Rural area? Asked in Brazil only (n=1233)
Brazil
Urban 85 Suburban 5 Rural 8 Not sure 1 Declined to answer 1

Kaiser Family Foundation/The Economist Four-Country Survey on Aging and End-of-Life Medical Care, 2016 37
HH1./DHH1. How many adults 18 or older live in your household? Please include yourself and all the adults who live with you.
U.S. Italy Japan Brazil
1 22 15 17 9 2 49 50 45 43 3 15 18 21 24 4 9 10 10 13 5 2 2 3 6 6 1 1 1 2 7 * - 1 1 8 * - - * 9 - - - * 10 * - - * Not sure * * - * Declined to answer 1 4 1 1
The Henry J. Kaiser Family Foundation
Headquarters
2400 Sand Hill Road Menlo Park, CA 94025
Phone: (650) 854-9400 Fax: (650) 854-4800
Washington Offices and Barbara Jordan Conference Center
1330 G Street, NW Washington, DC 20005
Phone: (202) 347-5270 Fax: (202) 347-5274
www.kff.org
This publication (#9013-T) is available on the Kaiser Family Foundation website at www.kff.org.
Filling the need for trusted information on national health issues, the Kaiser Family Foundation is a nonprofit organization based in Menlo Park, California.