kansas board of regents_foresight2020_2015 progress report
TRANSCRIPT
FORESIGHT 2020
ANNUAL PROGRESS REPORT
January 2015 Progress Report Foresight 2020
January 2015
THE COVER: Adopted in 1925, the Kansas Board of Regents seal has been the visual identity of the higher education system in Kansas since the Board’s creation and appears on all state university diplomas to this day. Cover work created by Garrett Brown (MFA, Northern Illinois University; BFA, University of Kansas), Resource Lab Coordinator in the Department of Visual Art at the University of Kansas; assisted by Haley Crouch, Senior Industrial Design student. The Visual Art Studio Technology “VAST” Lab is a new facility at KU, focusing on the use of technology in studio art practice. Along with the Visual Art Common Shop – a traditional wood, plastics, and metal fabrication lab – the VAST Lab provides resources and support for student use and faculty research. The Laser system used to precision cut the walnut and cherry wood is the first of its kind for the Department.
We are pleased to present the fourth update on the Board’s strategic agenda for higher education, Foresight 2020. The Board first adopted this agenda in September of 2010 and made some modifications in 2012 to improve the clarity of focus in the goals and metrics used. You will find that we continue to make progress on most metrics but have started to experience some softening of results in a few areas. Overall, it is clear that even with challenging financial times over the past several years, institutions have utilized the goals of this strategic agenda to focus their efforts on student success.
As you may know, we have made upgrades to the Kansas Board of Regents website, and the tools now available allow for improved access to data and information. Because of these improvements, this report focuses on the progress of the system on the various metrics and provides links to the website for results of specific institutions.
During the past year, most of the metrics in the strategic agenda were implemented. The selection of assessments by institutions were finalized for the three core workplace skills identified by business and industry leaders as critical for employers: oral and written communications, mathematics/analytical reasoning, and critical thinking/problem solving. Current and aspirational peers approved for each of the universities last year were reported on using a set of metrics to gauge comparative progress. Lastly, technical program outcome metrics were explored through a pilot study implemented to gain progress on quality improvement. One metric that has been hard to implement has been getting the results of student performance on third party assessments in technical programs, but there have been efforts both regionally and nationally to make this information available.
Additionally, our persistence in pursuing this agenda has resulted in four or five years of data on most metrics. This is extremely helpful in seeing patterns and trends and determining areas where adjustments need to be made.
As always, I want to say a special thanks to Breeze Richardson, the Kansas Board of Regents staff, and especially the data, research, and planning team for their work in gathering and vetting the data as well as providing summary information so that it is consumable and useful.
I applaud the Board for its persistence in pursuing a strategic agenda for higher education and for the impact this vision has had on ensuring student success and continuous improvement of an outstanding higher education system. Clearly, this is a system that is performing well while seeking excellence.

January 2015 Progress Report Foresight 2020 | Page 1
Foresight 2020Goal 1: Increase Higher Education Attainment Among Kansans
10,000
20,000
30,000
40,000
50,000
60,000
2012-13 2013-14 2014-15 2015-16 2016-17 2017-18 2018-19 2019-20
Num
ber o
f Cre
denti
als A
war
ded
37,951
33,324
53,002
41,417
40,636
In 2009, the Kansas Board of Regents began assessing trends in higher education and gathering data across the state and nation to assist it in determining a strategic vision for higher education in Kansas. In September of 2010, the Board of Regents adopted its first strategic plan entitled Foresight 2020, which included at that time six goals and a number of activities and data points. In 2012, the Board refined and clarified its strategic plan which resulted in moving from six to three goals and identifying a set of metrics to be used in judging progress.
The first annual progress report on Foresight 2020 was presented to the Board in January 2012 and an annual report has been made each year since then.
FORESIGHT 2020
The Board’s first goal reflects the realization that in order for Kansas and Kansans to prosper, more adults must achieve a postsecondary certificate, associate, or bachelor’s degree than they have in the past. The need for the goal was best captured by the initial study from the Georgetown University Center on Education and the Workforce entitled “Help Wanted: Projections of Jobs and Education Requirements Through 2018” which indicated that by 2018 Kansas needed 64% of its workforce to have a postsecondary credential or degree. The Board ultimately set its goal at 60%, which it felt was more realistic and achievable.
In order to judge the progress it was making on this goal, the Board identified 11 metrics that it wanted to review annually. Additionally, in the fall of 2013, the Board decided that it wanted to get a better idea of what progress was needed in credential and degree production in order to achieve this goal.
Last year the Kansas Board of Regents collaborated with the National Center for Higher Education Management Systems (NCHEMS) to create a model for Kansas which identifies the current gap in degree/certificate attainment. The graph below notes in red the path for progress that is needed to meet the 60% goal. The blue path is thestate’s expected path without making any changes to current practice. Results from the 2013-2014 academic year indicate that the number of undergraduate degrees and certificates awarded continues to exceed expectations of progress. The projection was that institutions needed to award 40,101 certificates and degrees; instead 41,417 awards were granted. As a reminder, this figure includes data from both Kansas public and independent colleges.
In order to meet expectations for 2014-2015, an additional 800 undergraduate certificates and degrees will need to be awarded to remain on the red path and reach this goal.
January 2015 Progress Report Foresight 2020 | Page 2
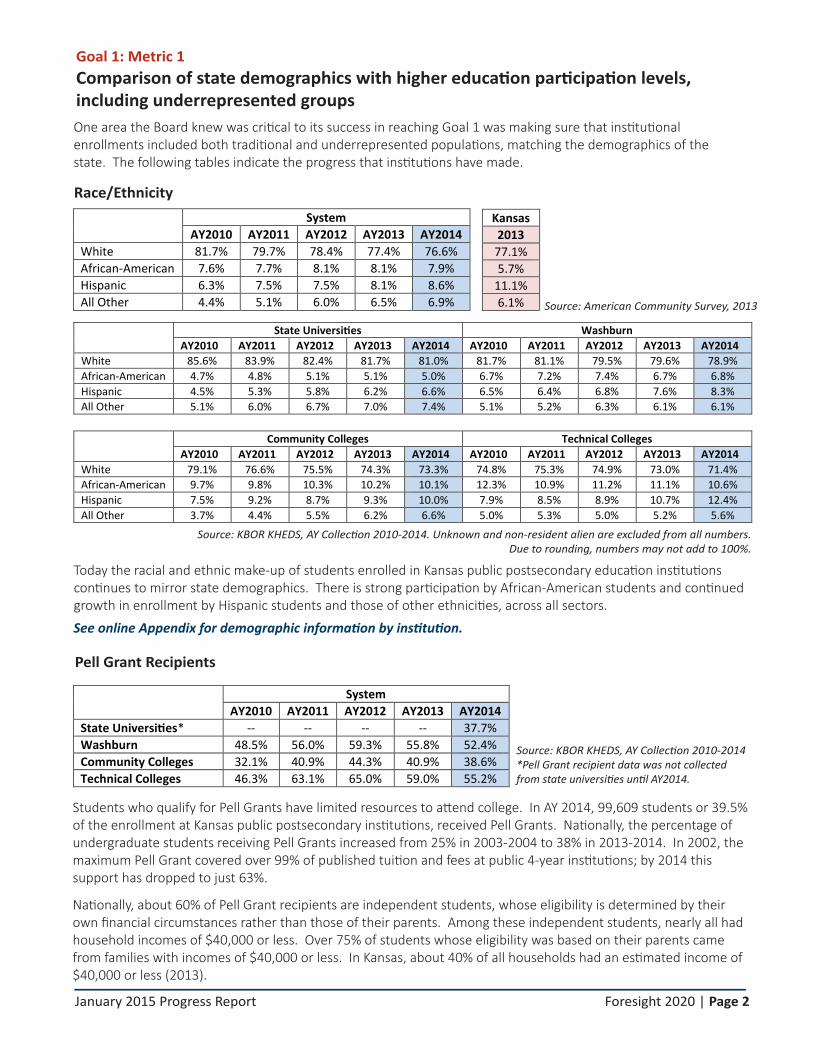
Goal 1: Metric 1 Comparison of state demographics with higher education participation levels, including underrepresented groups
Today the racial and ethnic make-up of students enrolled in Kansas public postsecondary education institutions continues to mirror state demographics. There is strong participation by African-American students and continued growth in enrollment by Hispanic students and those of other ethnicities, across all sectors.
Pell Grant Recipients
Students who qualify for Pell Grants have limited resources to attend college. In AY 2014, 99,609 students or 39.5% of the enrollment at Kansas public postsecondary institutions, received Pell Grants. Nationally, the percentage of undergraduate students receiving Pell Grants increased from 25% in 2003-2004 to 38% in 2013-2014. In 2002, the maximum Pell Grant covered over 99% of published tuition and fees at public 4-year institutions; by 2014 this support has dropped to just 63%.
Nationally, about 60% of Pell Grant recipients are independent students, whose eligibility is determined by their own financial circumstances rather than those of their parents. Among these independent students, nearly all had household incomes of $40,000 or less. Over 75% of students whose eligibility was based on their parents came from families with incomes of $40,000 or less. In Kansas, about 40% of all households had an estimated income of $40,000 or less (2013).
Race/Ethnicity System
AY2010 AY2011 AY2012 AY2013 AY2014 White 81.7% 79.7% 78.4% 77.4% 76.6% African-American 7.6% 7.7% 8.1% 8.1% 7.9% Hispanic 6.3% 7.5% 7.5% 8.1% 8.6% All Other 4.4% 5.1% 6.0% 6.5% 6.9%
Source: KBOR KHEDS, AY Collection 2010-2014. Unknown and non-resident alien are excluded from all numbers.Due to rounding, numbers may not add to 100%.
State Universities Washburn AY2010 AY2011 AY2012 AY2013 AY2014 AY2010 AY2011 AY2012 AY2013 AY2014
White 85.6% 83.9% 82.4% 81.7% 81.0% 81.7% 81.1% 79.5% 79.6% 78.9% African-American 4.7% 4.8% 5.1% 5.1% 5.0% 6.7% 7.2% 7.4% 6.7% 6.8% Hispanic 4.5% 5.3% 5.8% 6.2% 6.6% 6.5% 6.4% 6.8% 7.6% 8.3% All Other 5.1% 6.0% 6.7% 7.0% 7.4% 5.1% 5.2% 6.3% 6.1% 6.1%
Community Colleges Technical Colleges AY2010 AY2011 AY2012 AY2013 AY2014 AY2010 AY2011 AY2012 AY2013 AY2014
White 79.1% 76.6% 75.5% 74.3% 73.3% 74.8% 75.3% 74.9% 73.0% 71.4% African-American 9.7% 9.8% 10.3% 10.2% 10.1% 12.3% 10.9% 11.2% 11.1% 10.6% Hispanic 7.5% 9.2% 8.7% 9.3% 10.0% 7.9% 8.5% 8.9% 10.7% 12.4% All Other 3.7% 4.4% 5.5% 6.2% 6.6% 5.0% 5.3% 5.0% 5.2% 5.6%
Kansas 2013
77.1% 5.7%
11.1% 6.1%
See online Appendix for demographic information by institution.
One area the Board knew was critical to its success in reaching Goal 1 was making sure that institutional enrollments included both traditional and underrepresented populations, matching the demographics of the state. The following tables indicate the progress that institutions have made.
Source: KBOR KHEDS, AY Collection 2010-2014*Pell Grant recipient data was not collected from state universities until AY2014.
System AY2010 AY2011 AY2012 AY2013 AY2014
State Universities* -- -- -- -- 37.7% Washburn 48.5% 56.0% 59.3% 55.8% 52.4% Community Colleges 32.1% 40.9% 44.3% 40.9% 38.6% Technical Colleges 46.3% 63.1% 65.0% 59.0% 55.2%
Source: American Community Survey, 2013

January 2015 Progress Report Foresight 2020 | Page 3
Source: U.S. Census Bureau, American Community Survey, 2010, 2011, 2012 and 2013 (1-Year Estimates)
Goal 1: Metric 2Review of higher education participation levels by age groups, including traditional students (18-24), and adults ages 25-34, 35-44, and 45-64
Goal 1: Metric 3Comparison of Kansans’ postsecondary attainment to the nation by age groups
Source: KBOR KHEDS, AY Collection 2010-2014
System AY2010 AY2011 AY2012 AY2013 AY2014
Age < 18 4.1% 4.2% 4.4% 4.9% 5.3% Age 18-19 16.6% 16.5% 16.4% 16.9% 17.8% Age 20-24 39.9% 39.9% 39.9% 39.6% 39.6% Age 25-34 22.3% 22.8% 23.1% 22.6% 22.3% Age 35-44 8.6% 8.6% 8.6% 8.5% 8.1% Age 45-64 7.6% 7.1% 6.8% 6.6% 6.1%
State Universities Washburn AY2010 AY2011 AY2012 AY2013 AY2014 AY2010 AY2011 AY2012 AY2013 AY2014
Age < 18 0.7% 0.9% 1.1% 1.1% 0.6% 2.3% 3.1% 4.1% 3.9% 4.9% Age 18-19 13.5% 13.3% 13.5% 14.0% 14.3% 11.9% 14.7% 15.2% 15.6% 15.5% Age 20-24 49.2% 49.0% 48.5% 48.1% 48.2% 41.2% 39.8% 39.1% 40.7% 41.1% Age 25-34 23.0% 23.6% 24.0% 23.9% 24.1% 28.5% 27.8% 27.0% 26.2% 24.7% Age 35-44 7.2% 7.3% 7.4% 7.5% 7.4% 8.8% 8.4% 8.8% 7.9% 8.3% Age 45-64 6.0% 5.6% 5.2% 5.1% 5.0% 7.0% 6.1% 5.7% 5.6% 5.4%
Community Colleges Technical Colleges AY2010 AY2011 AY2012 AY2013 AY2014 AY2010 AY2011 AY2012 AY2013 AY2014
Age < 18 6.7% 6.8% 7.0% 7.8% 8.4% 9.9% 7.6% 7.1% 10.7% 15.4% Age 18-19 19.7% 19.3% 19.0% 19.4% 20.7% 14.3% 15.6% 15.4% 17.1% 20.7% Age 20-24 33.0% 33.2% 33.6% 33.5% 33.5% 27.3% 28.5% 28.1% 26.1% 23.9% Age 25-34 21.2% 21.7% 21.8% 21.2% 20.6% 24.4% 25.3% 25.7% 24.0% 22.4% Age 35-44 9.4% 9.4% 9.4% 9.2% 8.5% 11.6% 12.0% 12.1% 11.8% 9.4% Age 45-64 8.6% 8.3% 7.8% 7.7% 6.9% 12.1% 10.6% 11.2% 10.0% 8.0%
Since 2009-2010, participation by those under 18 and ages 18-19 has increased across the system. This increase is notable at Kansas Technical Colleges, largely due to the Excel in Career Technical Education initiative (2012 SB 155). More attention and explicit recruitment strategies should be considered to increase the participation of students over 25 years old, in order to meet the overall attainment goal for the system.
Among adults with an associate degree or higher, there has been notable growth over the past year for Kansas adults 18-24, exceeding the national percentage. Across all four age groups, attainment in Kansas grew or remained stable over the past year, and was higher than national percentages.
Kansas U.S. 2010 2011 2012 2013 2010 2011 2012 2013
Adults 18-24 16% 15% 13% 17% 14% 14% 14% 15% Adults 25-34 43% 44% 43% 43% 40% 40% 41% 42% Adults 35-44 44% 43% 44% 45% 40% 41% 42% 42% Adults 45-64 38% 39% 39% 40% 37% 37% 38% 38%
Adults with Associate Degree or Higher
Since the number of high school graduates in Kansas over the next decade is projected to remain relatively stable, there is a need for institutions to serve a greater number of non-traditional students. The tables on this page indicate the trends in age of the students being served in Kansas public institutions.
Whereas the previous metric assists the Board in assessing progress of students by age group enrolled in Kansas public institutions, this table shows how adult postsecondary attainment in Kansas compares with the nation:
January 2015 Progress Report Foresight 2020 | Page 4
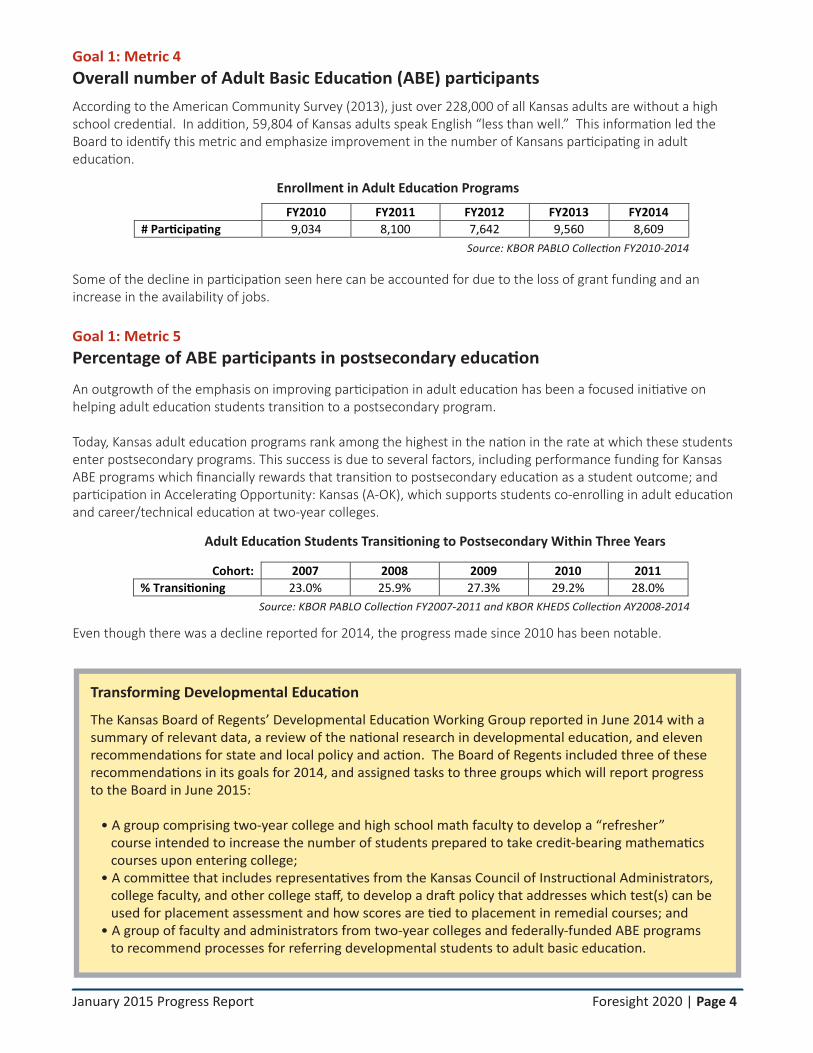
Transforming Developmental Education
The Kansas Board of Regents’ Developmental Education Working Group reported in June 2014 with a summary of relevant data, a review of the national research in developmental education, and eleven recommendations for state and local policy and action. The Board of Regents included three of these recommendations in its goals for 2014, and assigned tasks to three groups which will report progress to the Board in June 2015: • A group comprising two-year college and high school math faculty to develop a “refresher” course intended to increase the number of students prepared to take credit-bearing mathematics courses upon entering college; • A committee that includes representatives from the Kansas Council of Instructional Administrators, college faculty, and other college staff, to develop a draft policy that addresses which test(s) can be used for placement assessment and how scores are tied to placement in remedial courses; and • A group of faculty and administrators from two-year colleges and federally-funded ABE programs to recommend processes for referring developmental students to adult basic education.
Enrollment in Adult Education Programs
Source: KBOR PABLO Collection FY2010-2014
Goal 1: Metric 4Overall number of Adult Basic Education (ABE) participants
Goal 1: Metric 5Percentage of ABE participants in postsecondary education
Adult Education Students Transitioning to Postsecondary Within Three Years
According to the American Community Survey (2013), just over 228,000 of all Kansas adults are without a high school credential. In addition, 59,804 of Kansas adults speak English “less than well.” This information led the Board to identify this metric and emphasize improvement in the number of Kansans participating in adult education.
Some of the decline in participation seen here can be accounted for due to the loss of grant funding and an increase in the availability of jobs.
An outgrowth of the emphasis on improving participation in adult education has been a focused initiative on helping adult education students transition to a postsecondary program.
Today, Kansas adult education programs rank among the highest in the nation in the rate at which these students enter postsecondary programs. This success is due to several factors, including performance funding for Kansas ABE programs which financially rewards that transition to postsecondary education as a student outcome; and participation in Accelerating Opportunity: Kansas (A-OK), which supports students co-enrolling in adult education and career/technical education at two-year colleges.
Even though there was a decline reported for 2014, the progress made since 2010 has been notable.
FY2010 FY2011 FY2012 FY2013 FY2014 # Participating 9,034 8,100 7,642 9,560 8,609
Source: KBOR PABLO Collection FY2007-2011 and KBOR KHEDS Collection AY2008-2014
Cohort: 2007 2008 2009 2010 2011 % Transitioning 23.0% 25.9% 27.3% 29.2% 28.0%
January 2015 Progress Report Foresight 2020 | Page 5
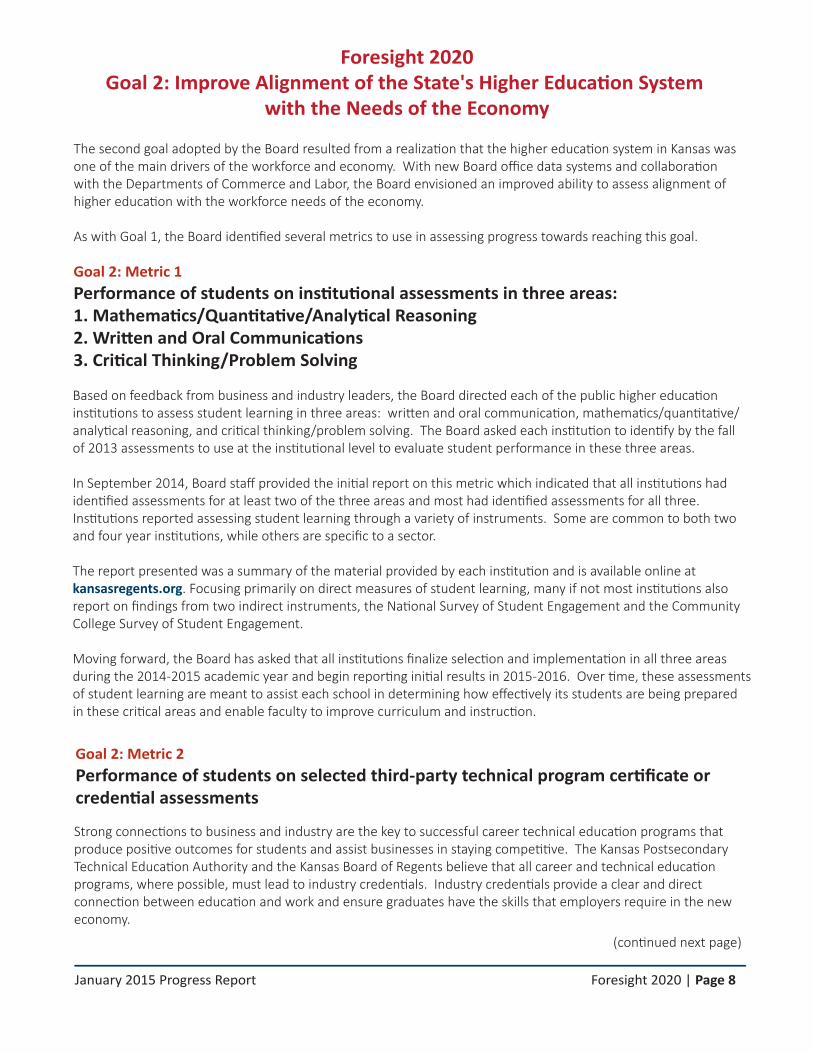
Source: KBOR KHEDS AY Collection 2010-2014, KHEDS Fall 2010-2014 (One Year Retention Rate)
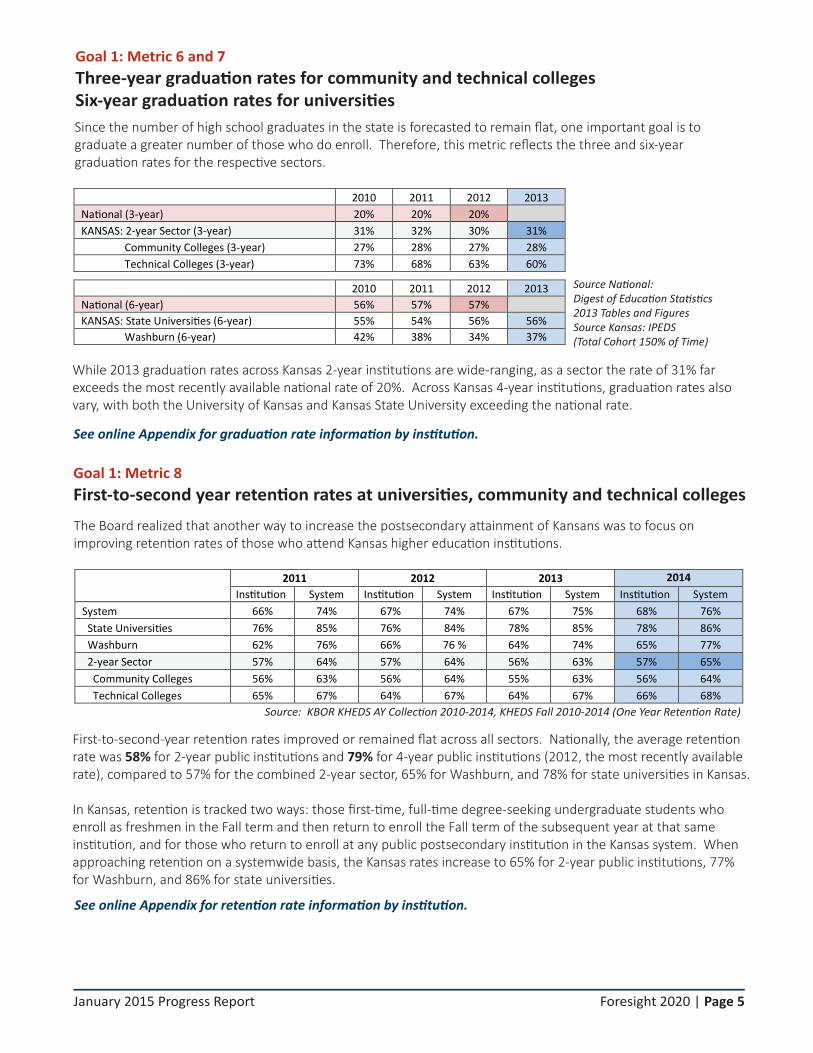
Goal 1: Metric 6 and 7Three-year graduation rates for community and technical collegesSix-year graduation rates for universities
Goal 1: Metric 8First-to-second year retention rates at universities, community and technical colleges
First-to-second-year retention rates improved or remained flat across all sectors. Nationally, the average retention rate was 58% for 2-year public institutions and 79% for 4-year public institutions (2012, the most recently available rate), compared to 57% for the combined 2-year sector, 65% for Washburn, and 78% for state universities in Kansas.
In Kansas, retention is tracked two ways: those first-time, full-time degree-seeking undergraduate students who enroll as freshmen in the Fall term and then return to enroll the Fall term of the subsequent year at that same institution, and for those who return to enroll at any public postsecondary institution in the Kansas system. When approaching retention on a systemwide basis, the Kansas rates increase to 65% for 2-year public institutions, 77% for Washburn, and 86% for state universities.
Source National: Digest of Education Statistics 2013 Tables and Figures Source Kansas: IPEDS (Total Cohort 150% of Time)
While 2013 graduation rates across Kansas 2-year institutions are wide-ranging, as a sector the rate of 31% far exceeds the most recently available national rate of 20%. Across Kansas 4-year institutions, graduation rates alsovary, with both the University of Kansas and Kansas State University exceeding the national rate.
Since the number of high school graduates in the state is forecasted to remain flat, one important goal is to graduate a greater number of those who do enroll. Therefore, this metric reflects the three and six-year graduation rates for the respective sectors.
The Board realized that another way to increase the postsecondary attainment of Kansans was to focus on improving retention rates of those who attend Kansas higher education institutions.
2010 2011 2012 2013 National (6-year) 56% 57% 57% KANSAS: State Universities (6-year) 55% 54% 56% 56% Washburn (6-year) 42% 38% 34% 37%
See online Appendix for graduation rate information by institution.
See online Appendix for retention rate information by institution.
2010 2011 2012 2013 National (3-year) 20% 20% 20% KANSAS: 2-year Sector (3-year) 31% 32% 30% 31% Community Colleges (3-year) 27% 28% 27% 28% Technical Colleges (3-year) 73% 68% 63% 60%
2011 2012 2013 2014 Institution System Institution System Institution System Institution System
System 66% 74% 67% 74% 67% 75% 68% 76% State Universities 76% 85% 76% 84% 78% 85% 78% 86% Washburn 62% 76% 66% 76 % 64% 74% 65% 77% 2-year Sector 57% 64% 57% 64% 56% 63% 57% 65% Community Colleges 56% 63% 56% 64% 55% 63% 56% 64% Technical Colleges 65% 67% 64% 67% 64% 67% 66% 68%

January 2015 Progress Report Foresight 2020 | Page 6
Goal 1: Metric 9Student Success Index
The Kansas higher education system can now monitor the success of a greater number of students than those traditionally represented in published graduation rates by accounting for the movement of students between institutions and those who are still pursuing an education. Looking at full and part-time degree-seeking students who started at a given institution or transferred to that institution, we see a combined success rate for each sector far above what the published graduation rate suggests (which only tracks full-time students who started and completed at a given institution).
Source: KBOR KHEDS AY Collection and National Student Clearinghouse
Go online to explore the Student Success Index by institution.
When considering the data on graduation and retention rates, the Board wanted to look at a broader indicator of student success that accounted for students who graduated from their home or another institution as well as those who were still attending school – both considered to be 'success.' The student success index was developed to provide a more complete picture of student success across sectors.
Reporting Year
2010 2011 2012 2013
State Universities 76% 75% 76% 76%
Washburn 67% 73% 67% 63%
Community Colleges 57% 56% 52% 51%
Technical Colleges 80% 68% 73% 69%
Completed Home Institution Completed System Institution Completed Elsewhere
Retained ElsewhereRetained System InstitutionRetained Home Institution
52%
40%
21%
60%
9%
9%
5%
6%
3%
4%
5%
10%
3%
3%
4%
8%
4%
2%
5%
2%2%
2% 0.6%0.2%
Expanding Course Transfer and Adopting Systemwide Reverse Transfer
Crucial to the success of Goal 1 is the increased attention towards mobility throughout the public highereducation system. The Kansas Board of Regents has now approved 46 courses for guaranteed transfer,with another ten courses to be review by the Board in January 2015.
Important progress was also made this year when all 32 university and college Presidents and the Chancellor signed an agreement to establish systemwide reverse transfer in Kansas. Students who transfer to a Kansas public university from a Kansas public community or technical college are noweligible for the attainment of any associate degree completed through coursework at the university. These students will be notified if they can be considered for reverse transfer degree status and whichcourses are needed to finish the related degree. Upon successful completion of the needed courses, the university will automatically communicate back to the community or technical college the student last attended and the degree will be awarded.

January 2015 Progress Report Foresight 2020 | Page 7
Goal 1: Metric 10Number of certificates and degrees awarded by universities, community colleges and technical colleges
Goal 1: Metric 11Number of adults with college credit but no certificate or degree who are returningto complete a certificate, associate, or bachelor’s degree
Source: KBOR KHEDS AY Collection 2010-2014
While there was a slight decrease in the total number of awards granted by universities, the state’s community college and technical college sectors both saw increases sufficient to raise for the fifth consecutive year the total number of credentials awarded by the Kansas higher education system. State universities produced additional master’s and doctoral degrees in 2014, and Washburn increased the number of associate and master’s degrees granted in 2014 over the previous year.See online Appendix for credential production by institution.
Since the number of jobs in Kansas has returned to prerecession levels, a drop in the number of adults returning for additional education was anticipated. However, the focus on this area has resulted in significant progress since 2010.
This metric reports on the actual number of degrees awarded, including certificates, associate, bachelor’s, master’s, and doctoral degrees. Progress on this metric is critical to the overall success of Goal 1.
One final key to achieving Goal 1 will be to attract adults back to college who did not completed a certificate or degree. This metric helps track the success in attracting returning adults.
Source: KBOR KHEDS AY Collection 2010-2014
State Universities Washburn AY2010 AY2011 AY2012 AY2013 AY2014 AY2010 AY2011 AY2012 AY2013 AY2014
Certificates* 45 69 113 130 89 121 126 131 133 86 Associate Degrees 225 188 177 213 206 88 106 122 140 200 Bachelor's Degrees 13,656 13,619 13,925 15,140 14,788 785 763 774 830 819 Master's Degrees 4,610 4,952 5,128 4,811 5,049 115 141 144 123 133 Doctoral Degrees 1,125 1,204 1,164 1,206 1,208 139 140 159 142 116 Total 19,661 20,032 20,507 21,500 21,340 1,248 1,276 1,330 1,368 1,354
Community Colleges Technical Colleges AY2010 AY2011 AY2012 AY2013 AY2014 AY2010 AY2011 AY2012 AY2013 AY2014
Certificates* 6,200 6,976 7,089 6,820 7,700 3,045 3,112 3,204 3,512 3,746 Associate Degrees 6,929 7,491 7,967 8,406 8,623 379 457 517 524 631 Total 13,129 14,467 15,056 15,226 16,323 3,424 3,569 3,721 4,036 4,377
System
AY2010 AY2011 AY2012 AY2013 AY2014 State Universities 19,661 20,032 20,507 21,500 21,340 Washburn 1,248 1,276 1,330 1,368 1,354 Community Colleges 13,129 14,467 15,056 15,226 16,323 Technical Colleges 3,424 3,569 3,721 4,036 4,377 Total 37,462 39,344 40,614 42,130 43,394
AY2010 AY2011 AY2012 AY2013 AY2014 State Universities 916 1,081 1,261 1,259 1,221 Washburn 132 168 178 165 166 Community Colleges 3,034 3,125 3,816 3,362 3,118 Technical Colleges 297 311 285 438 401 Total 4,379 4,685 5,540 5,224 4,906
January 2015 Progress Report Foresight 2020 | Page 8
Foresight 2020Goal 2: Improve Alignment of the State's Higher Education System
with the Needs of the Economy
Goal 2: Metric 1Performance of students on institutional assessments in three areas:1. Mathematics/Quantitative/Analytical Reasoning2. Written and Oral Communications3. Critical Thinking/Problem Solving
Goal 2: Metric 2Performance of students on selected third-party technical program certificate orcredential assessments
Based on feedback from business and industry leaders, the Board directed each of the public higher education institutions to assess student learning in three areas: written and oral communication, mathematics/quantitative/analytical reasoning, and critical thinking/problem solving. The Board asked each institution to identify by the fall of 2013 assessments to use at the institutional level to evaluate student performance in these three areas.
In September 2014, Board staff provided the initial report on this metric which indicated that all institutions had identified assessments for at least two of the three areas and most had identified assessments for all three. Institutions reported assessing student learning through a variety of instruments. Some are common to both two and four year institutions, while others are specific to a sector.
The report presented was a summary of the material provided by each institution and is available online at kansasregents.org. Focusing primarily on direct measures of student learning, many if not most institutions also report on findings from two indirect instruments, the National Survey of Student Engagement and the Community College Survey of Student Engagement.
Moving forward, the Board has asked that all institutions finalize selection and implementation in all three areas during the 2014-2015 academic year and begin reporting initial results in 2015-2016. Over time, these assessments of student learning are meant to assist each school in determining how effectively its students are being prepared in these critical areas and enable faculty to improve curriculum and instruction.
Strong connections to business and industry are the key to successful career technical education programs that produce positive outcomes for students and assist businesses in staying competitive. The Kansas Postsecondary Technical Education Authority and the Kansas Board of Regents believe that all career and technical education programs, where possible, must lead to industry credentials. Industry credentials provide a clear and direct connection between education and work and ensure graduates have the skills that employers require in the new economy.
The second goal adopted by the Board resulted from a realization that the higher education system in Kansas was one of the main drivers of the workforce and economy. With new Board office data systems and collaboration with the Departments of Commerce and Labor, the Board envisioned an improved ability to assess alignment of higher education with the workforce needs of the economy.
As with Goal 1, the Board identified several metrics to use in assessing progress towards reaching this goal.
(continued next page)
January 2015 Progress Report Foresight 2020 | Page 9
Accelerating Opportunity in Kansas
Accelerating Opportunity: Kansas (AO-K) is a national initiative launched in 2011, now available at 14 Kansas colleges. Basic skills and career/technical education instructors team teach classes in a career pathway program, with supplemental instruction focused on helping students increase skills in reading, writing, and math and/or pass the GED® while earning a technical certificate. Funded by six national philanthropies, Kansas leads the nation in this initiative. Among the 7 participating states, Kansas has more enrollments, college and industry credentials earned, and job placements than any other – with over 3,100 students enrolled, 1,350 college credentials earned, nearly 4,000 industry-recognized credentials earned, and over 840 participants employed (self-reported) since January 2012. Led jointly by the Kansas Board of Regents and the Kansas Department of Commerce, tuition support is also provided via a cooperative agreement with the Department for Children and Families (DCF) which uses Temporary Assistance for Needy Families (TANF) funds to provide tuition scholarships for TANF-eligible students. To-date, over $1.7 million has been allocated by DCF for this program.
In 2014, the Kansas Legislature passed two new measures to provide continued support to AO-K programs and their students by offering additional tuition assistance to adults enrolling in the program and incentives to colleges for each GED® and technical credential earned. A statewide promotional campaign has been launched to help publicize the program and encourage Kansans without a high school credential or postsecondary education to “Get Unstuck!” Over 1,600 posters were distributed to over 600 locations, including DCF offices, Workforce Centers, GED Testing Centers, Adult Education Centers, public libraries and Head Start Programs across Kansas, and a robust social media campaign utilizing short videos is helping to spread the word online.
There are now 25 aligned technical education programs, following two national partnerships which have led efforts to better connect Kansas programs with industry. Using the National Association of Manufacturers-Endorsed Manufacturing Skills Certification system, programs are aligning traditional education pathways with the requirements of industry-based certifications. Students earn not only education certification, but also industry-validated, nationally-portable credentials recognized in the job market.
However, securing accurate counts of the industry-recognized credentials earned by program graduates continues to be a challenge because of the large number of entities issuing credentials and the lack of a national clearinghouse of credential information for verification.
To address this need, Board staff have contracted with Workcred, an affiliate of the American National Standards Institute, to develop a process to ensure validity of recognized credentials by adopting ISO/IEC 17024 Conformity Assessment requirements for certifying bodies. Reporting will focus specifically on evaluation of credentials included in Outcome Metrics and earned by program graduates who exit postsecondary education.
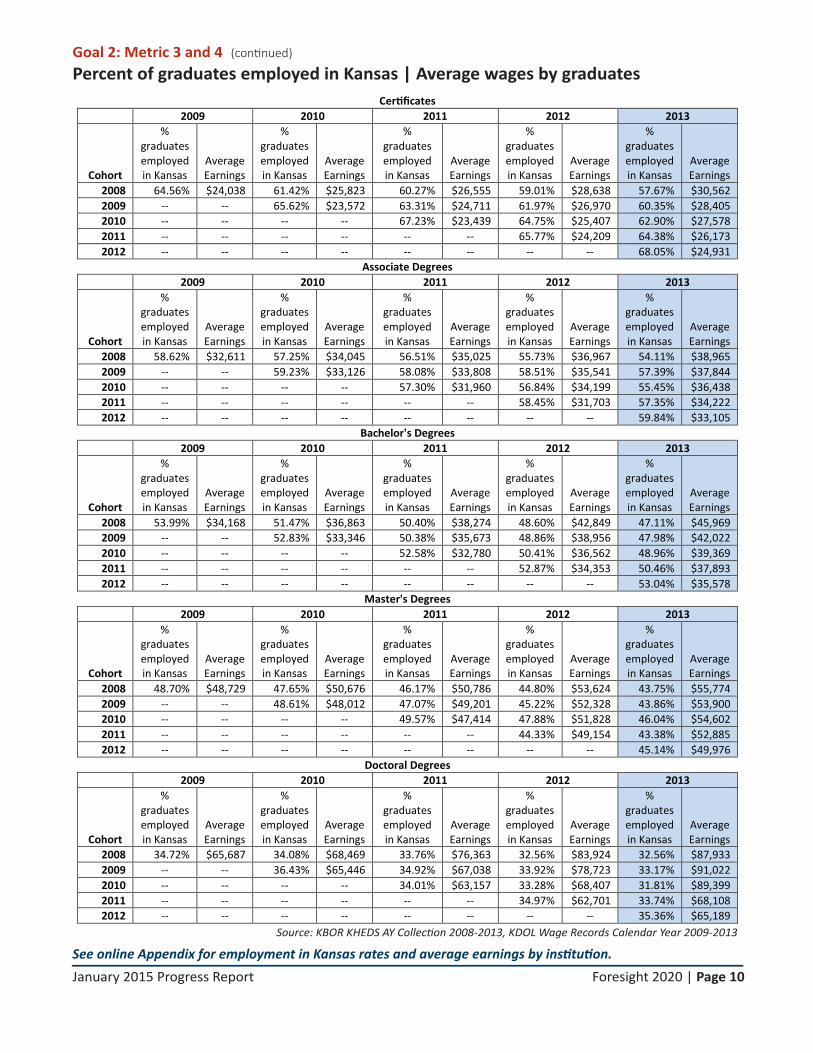
Goal 2: Metric 3 and 4Percent of graduates employed in Kansas | Average wages by graduatesThis pair of metrics envisioned by Board staff became possible with the cooperation of the Department of Labor and initial research conducted by Dr. Donna Ginther, Professor of Economics and Director of the Center for Science, Technology, and Economic Policy at the Institute for Policy and Social Research at the University of Kansas.
The following table (next page), produced by Kansas Board of Regents staff, indicates employment in Kansas (byaward type) and the average wages of graduates at each level of education from public higher education institutions in Kansas. Now able to review five years of data, it is clear that average earnings are generally better with each subsequent level of education. Earnings also appear to increase with each subsequent year employed in Kansas. However, the percentage of graduates staying in Kansas diminishes with each subsequent level of education.
Related research is needed into the employment of Kansas graduates in contiguous states.
January 2015 Progress Report Foresight 2020 | Page 10
Goal 2: Metric 3 and 4Percent of graduates employed in Kansas | Average wages by graduates
Source: KBOR KHEDS AY Collection 2008-2013, KDOL Wage Records Calendar Year 2009-2013
Certificates 2009 2010 2011 2012 2013
Cohort
% graduates employed in Kansas
Average Earnings
% graduates employed in Kansas
Average Earnings
% graduates employed in Kansas
Average Earnings
% graduates employed in Kansas
Average Earnings
% graduates employed in Kansas
Average Earnings
2008 64.56% $24,038 61.42% $25,823 60.27% $26,555 59.01% $28,638 57.67% $30,562 2009 -- -- 65.62% $23,572 63.31% $24,711 61.97% $26,970 60.35% $28,405 2010 -- -- -- -- 67.23% $23,439 64.75% $25,407 62.90% $27,578 2011 -- -- -- -- -- -- 65.77% $24,209 64.38% $26,173 2012 -- -- -- -- -- -- -- -- 68.05% $24,931
Associate Degrees 2009 2010 2011 2012 2013
Cohort
% graduates employed in Kansas
Average Earnings
% graduates employed in Kansas
Average Earnings
% graduates employed in Kansas
Average Earnings
% graduates employed in Kansas
Average Earnings
% graduates employed in Kansas
Average Earnings
2008 58.62% $32,611 57.25% $34,045 56.51% $35,025 55.73% $36,967 54.11% $38,965 2009 -- -- 59.23% $33,126 58.08% $33,808 58.51% $35,541 57.39% $37,844 2010 -- -- -- -- 57.30% $31,960 56.84% $34,199 55.45% $36,438 2011 -- -- -- -- -- -- 58.45% $31,703 57.35% $34,222 2012 -- -- -- -- -- -- -- -- 59.84% $33,105
Bachelor's Degrees 2009 2010 2011 2012 2013
Cohort
% graduates employed in Kansas
Average Earnings
% graduates employed in Kansas
Average Earnings
% graduates employed in Kansas
Average Earnings
% graduates employed in Kansas
Average Earnings
% graduates employed in Kansas
Average Earnings
2008 53.99% $34,168 51.47% $36,863 50.40% $38,274 48.60% $42,849 47.11% $45,969 2009 -- -- 52.83% $33,346 50.38% $35,673 48.86% $38,956 47.98% $42,022 2010 -- -- -- -- 52.58% $32,780 50.41% $36,562 48.96% $39,369 2011 -- -- -- -- -- -- 52.87% $34,353 50.46% $37,893 2012 -- -- -- -- -- -- -- -- 53.04% $35,578
Master's Degrees 2009 2010 2011 2012 2013
Cohort
% graduates employed in Kansas
Average Earnings
% graduates employed in Kansas
Average Earnings
% graduates employed in Kansas
Average Earnings
% graduates employed in Kansas
Average Earnings
% graduates employed in Kansas
Average Earnings
2008 48.70% $48,729 47.65% $50,676 46.17% $50,786 44.80% $53,624 43.75% $55,774 2009 -- -- 48.61% $48,012 47.07% $49,201 45.22% $52,328 43.86% $53,900 2010 -- -- -- -- 49.57% $47,414 47.88% $51,828 46.04% $54,602 2011 -- -- -- -- -- -- 44.33% $49,154 43.38% $52,885 2012 -- -- -- -- -- -- -- -- 45.14% $49,976
Doctoral Degrees 2009 2010 2011 2012 2013
Cohort
% graduates employed in Kansas
Average Earnings
% graduates employed in Kansas
Average Earnings
% graduates employed in Kansas
Average Earnings
% graduates employed in Kansas
Average Earnings
% graduates employed in Kansas
Average Earnings
2008 34.72% $65,687 34.08% $68,469 33.76% $76,363 32.56% $83,924 32.56% $87,933 2009 -- -- 36.43% $65,446 34.92% $67,038 33.92% $78,723 33.17% $91,022 2010 -- -- -- -- 34.01% $63,157 33.28% $68,407 31.81% $89,399 2011 -- -- -- -- -- -- 34.97% $62,701 33.74% $68,108 2012 -- -- -- -- -- -- -- -- 35.36% $65,189
See online Appendix for employment in Kansas rates and average earnings by institution.
(continued)
January 2015 Progress Report Foresight 2020 | Page 11
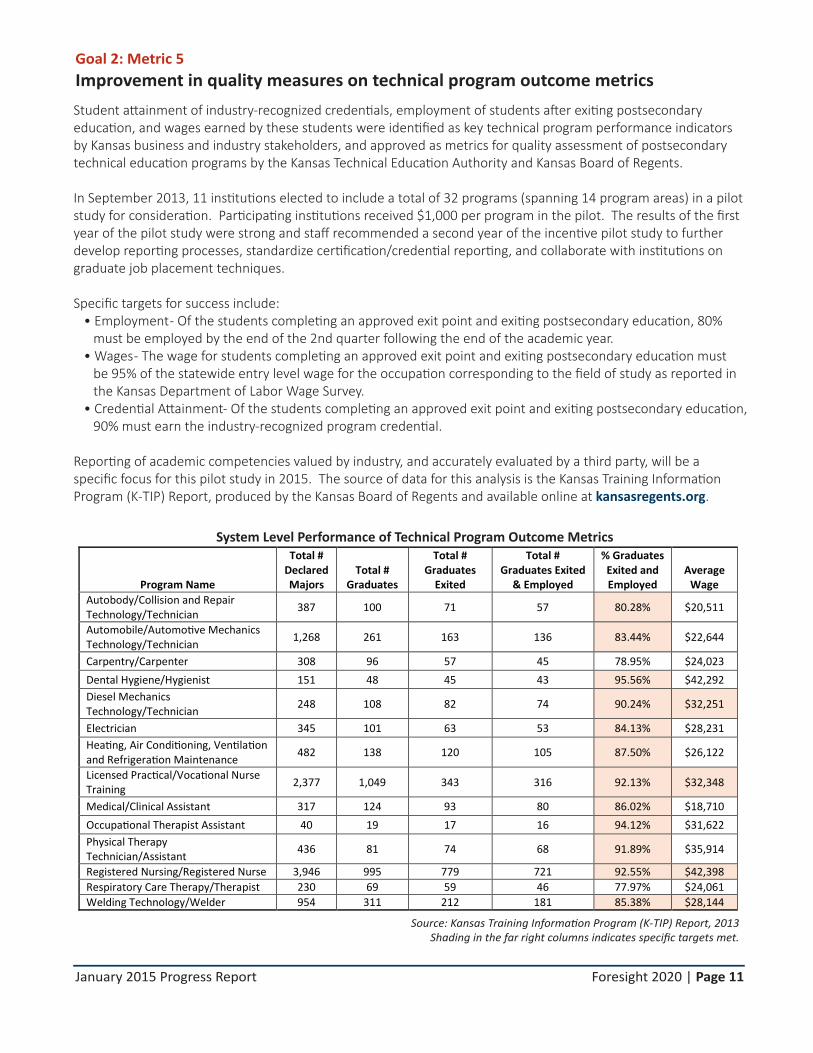
Goal 2: Metric 5Improvement in quality measures on technical program outcome metricsStudent attainment of industry-recognized credentials, employment of students after exiting postsecondary education, and wages earned by these students were identified as key technical program performance indicators by Kansas business and industry stakeholders, and approved as metrics for quality assessment of postsecondary technical education programs by the Kansas Technical Education Authority and Kansas Board of Regents.
In September 2013, 11 institutions elected to include a total of 32 programs (spanning 14 program areas) in a pilotstudy for consideration. Participating institutions received $1,000 per program in the pilot. The results of the first year of the pilot study were strong and staff recommended a second year of the incentive pilot study to further develop reporting processes, standardize certification/credential reporting, and collaborate with institutions on graduate job placement techniques.
Specific targets for success include: • Employment - Of the students completing an approved exit point and exiting postsecondary education, 80% must be employed by the end of the 2nd quarter following the end of the academic year. • Wages - The wage for students completing an approved exit point and exiting postsecondary education must be 95% of the statewide entry level wage for the occupation corresponding to the field of study as reported in the Kansas Department of Labor Wage Survey. • Credential Attainment- Of the students completing an approved exit point and exiting postsecondary education, 90% must earn the industry-recognized program credential.
Reporting of academic competencies valued by industry, and accurately evaluated by a third party, will be a specific focus for this pilot study in 2015. The source of data for this analysis is the Kansas Training Information Program (K-TIP) Report, produced by the Kansas Board of Regents and available online at kansasregents.org.
System Level Performance of Technical Program Outcome Metrics
Source: Kansas Training Information Program (K-TIP) Report, 2013Shading in the far right columns indicates specific targets met.
Program Name
Total # Declared Majors
Total # Graduates
Total # Graduates
Exited
Total # Graduates Exited
& Employed
% Graduates Exited and Employed
Average Wage
Autobody/Collision and Repair Technology/Technician 387 100 71 57 80.28% $20,511
Automobile/Automotive Mechanics Technology/Technician 1,268 261 163 136 83.44% $22,644
Carpentry/Carpenter 308 96 57 45 78.95% $24,023 Dental Hygiene/Hygienist 151 48 45 43 95.56% $42,292 Diesel Mechanics Technology/Technician 248 108 82 74 90.24% $32,251
Electrician 345 101 63 53 84.13% $28,231 Heating, Air Conditioning, Ventilation and Refrigeration Maintenance 482 138 120 105 87.50% $26,122
Licensed Practical/Vocational Nurse Training 2,377 1,049 343 316 92.13% $32,348
Medical/Clinical Assistant 317 124 93 80 86.02% $18,710 Occupational Therapist Assistant 40 19 17 16 94.12% $31,622 Physical Therapy Technician/Assistant 436 81 74 68 91.89% $35,914
Registered Nursing/Registered Nurse 3,946 995 779 721 92.55% $42,398 Respiratory Care Therapy/Therapist 230 69 59 46 77.97% $24,061 Welding Technology/Welder 954 311 212 181 85.38% $28,144

January 2015 Progress Report Foresight 2020 | Page 12
Source: Kansas Department of Labor, LMIS; KBOR KHEDS Collection AY2014* Includes both new and replacement job projections
^ Figure suppressed to protect student privacy in accordance with FERPA and HEOA guidelines.
Reimagining Career Technical Education
In 2012, Senate Bill 155 became law, providing free college tuition for high school students in postsecondary technical education courses and incentives to school districts for students earning industry-recognized credentials in high-demand occupations.
In the second full year of the program, 8,528 secondary students were enrolled (120% over the baseline year, prior to the new law), earning 62,787 credit hours (123% over the baseline year). Upon graduation in May 2014, 1,419 industry-recognized credentials in high-demand occupations were awarded (159% over the baseline year).
In 2013-2014 a total of 160 school districts participated in this initiative, an increase of 52 districts over the previous year, and incentive payouts totaled over $1.4 million. Since FY2013, the Kansas Legislature has invested $55 million in this initiative.
Goal 2: Metric 6Number of certificates and degrees awarded in selected high-demand occupations
In collaboration with Labor Market Information Services, a division of the Kansas Department of Labor, the Board is working to be better informed about the needs of the Kansas economy. Reviewing the state’s “high-demand occupations” list, comparisons can be made between the projected market need and the number of awards granted in these fields. The occupations below appear on the high-demand list, are reported to have an average annual wage of at least 70% of the average wage for all occupations in Kansas, and can be directly related to a postsecondary education award-type so that specific numbers can be tracked and reported.
While it may appear that the higher education system is producing enough graduates to address total demand for many of the high-demand occupations, the number of awards granted is not a predictor of whether a student will stay in Kansas and seek employment in these fields or locate within Kansas to where the need is greatest.
Occupational Title Total
Job Demand 2010 - 2020*
2014 Average
Annual Wage
AY2014 Awards Granted
Awards Granted Change (%)
Registered Nurses 12,808 $55,780 1,738 2.54% Accountants and Auditors 4,057 $57,750 682 0.74% Electricians 2,173 $47,300 124 2.48% Network and Computer Systems Architects and Administrators 1,809 $62,550 174 6.10%
Computer Systems Analysts 1,698 $74,450 215 -10.04% Lawyers 1,431 $82,490 297 -8.33% Pharmacists 1,300 $120,760 351 -25.79% Physicians and Surgeons 1,223 ^ 187 16.88% Software Developers, Systems Software 1,143 $90,850 253 -10.28% Radiologic Technologists and Technicians 1,032 $47,590 124 -20.00% Aircraft Mechanics and Service Technicians 982 $58,080 165 -14.06% Mechanical Engineers 968 $70,240 376 27.46% Dental Hygienists 955 $69,470 91 8.33% Electrical Engineers 833 $83,230 215 7.50% Physical Therapists 764 $75,630 81 6.58% Civil Engineers 732 $72,440 157 -1.88% Industrial Engineers 578 $74,210 140 52.17%

January 2015 Progress Report Foresight 2020 | Page 13
Source: KBOR KHEDS AY Collection 2010-2014, IPEDS Regional Data
Goal 2: Metric 7Percent of certificates and degrees awarded in STEM fields
Goal 2: NarrativeEnhance understanding of the role of university research in supporting the economy.One additional area the Board included under Goal 2 is the annual reporting on the results of university research directly linked to improving the Kansas economy. Two ongoing initiatives bring together university partners and related entrepreneurial organizations focused on the state’s core strengths to expand the connection between these and the state universities.
The Innovation Growth Program – $1.2 million in FY2015This program brings to the university President or Chancellor’s office visibility and focus on commercialization, with noted outcomes including:
• 42 companies have established new offices in Kansas to partner with universities (2010 to present) • 177 active license agreements are in place across the three research universities (2010 to present) •$12.5 million in total revenue from active license agreements was received this year alone
University Research Grants – $5 million annually to each of the three research universities
Requiring a 1:1 match from each university, these grants provide valuable state support in order to double investment in new research. In November 2014, the Board discussed how to best track and report on research outcomes and concluded a Regents-Commerce Steering Committee will continue to work with representatives from the University of Kansas, Kansas State University, and Wichita State University to report annually on:
• Cancer Center research at the University of Kansas • Global Food Systems and Veterinary Medicine research at Kansas State University • Aviation research at Wichita State University
The Board understands that graduates in science, technology, engineering, and mathematics (STEM) fields are extremely valuable to the Kansas economy. Therefore, one of the metrics used to assess progress toward Goal 2 is the percent of certificates and degrees produced in STEM fields. Results indicate a positive trend in the percent of STEM certificates and degrees awarded.
AY2010 AY2011 AY2012 AY2013 AY2014
STEM % STEM % STEM % STEM % STEM % Certificates 6,623 70.7% 7,184 70.3% 7,240 69.5% 7,181 68.6% 8,300 71.4% Associate Degrees 2,004 26.3% 2,069 25.1% 2,219 25.3% 2,258 24.3% 2,366 24.5% Bachelor’s Degrees 3,575 24.9% 3,682 25.9% 4,012 27.7% 4,487 28.5% 4,483 28.7% Advanced Degrees 1,900 31.7% 2,074 32.2% 2,169 32.9% 2,076 33.0% 2,193 33.7% Total 14,102 37.8% 15,009 38.4% 15,640 38.8% 16,002 38.3% 17,342 40.0%
University Engineering Initiative Act
Beginning in FY2013, this act committed $3.5 million annually to each of the three research universities for a period of 10 years aiming to increase the combined number of engineering graduates by 2021. With a goal of 1,365 graduates annually by this date, progress is being made: there has been a 36% increase in engineering enrollments since 2008 (the baseline year), a 30% increase in engineering graduates since 2008, over $18 million in scholarships for engineering students (up from $15 million in AY2013), and an increase in average starting wage for engineering graduates to $48,343, up from $47,629 in AY2013.
January 2015 Progress Report Foresight 2020 | Page 14
Foresight 2020Goal 3: Ensure State University Excellence
Goal 3: Metric 1Institutional performance on quality measures compared to peers, includingselect regional and national rankings
Finally, the Board concluded that university excellence is a cornerstone for a healthy and prosperous state. The three metrics identified by the Board for this goal were comparison with peers, strength in philanthropy, and strength in research. Each of these are widely used indicators in gauging university success and excellence.
As reported in the January 2014 Foresight 2020 report, the Board has now approved five current and five aspirational peers for each university and identified performance metrics each use in making comparisons with its peers. Metrics that were common to all universities included graduation rates, first-to-second year retention rates, number of degrees awarded, and endowment size; additional metrics identified for research universities included annual research and federal research expenditures, faculty awards and national academy members, and progress toward university and Board approved ranking aspirations. Additional metrics used for regional universities included enrollment and average ACT scores of the highest and lowest quartiles.
In the Spring of 2014, university Presidents and the Chancellor included initial comparisons in their evaluation reports and have since included additional information in progress reports on institutional strategic plans.
Some general conclusions from these initial comparisons indicate:
• Graduation rates for research universities are higher among peers and are more comparable for regional universities. The selectivity of a research university can have a major impact on this metric.
• Retention rates for research universities are near their peers and are comparable to peers for regional universities.
• The number of degrees awarded is in some part a reflection of the size of an institution. However, it is also a measure of the trend that an institution is experiencing. In general, both research and regional universities are seeing a slight increase the number of degrees awarded as are most of their peers.
• In terms of endowment size, Kansas universities distinguish themselves among their peers especially when enrollment and endowment increases are considered. Clearly, Kansas universities are above the median among peers.
• In comparison to peers on research expenditures, Kansas research universities have had excellent success in increasing this, some by more than $40 million over the past four years. However, there is a wide range of research expenditures reported among peers, with some peers expending over $100 million more.
• Kansas research universities have some national academy members and have over the past year added some new academy members, and faculty awards remain impressive. Some peer institutions have a comparable number of academy members, while others have dramatically more.
• Enrollment figures show Kansas regional universities are smaller than most peers, but in regards to the student population they are serving, ACT scores show similar populations are being served.

January 2015 Progress Report Foresight 2020 | Page 15
Source FY2005 to FY2013: National Association of College and University Business Officers (NACUBO) and Commonfund Institute*Source FY2014: Individual University Endowment/Foundations
Note: The significant increase in FY2013 for Pittsburg State University Foundation, Inc., reflects a substantial capital campaign. As projects are undertaken and these funds are expended market value may decrease.
Goal 3: Metric 2Increase in private giving to universities
Market Value and Percentage Change in Value
$0
$200,000
$400,000
$600,000
$800,000
$1,000,000
$1,200,000
$1,400,000
$1,600,000
FY 2005 FY 2006 FY 2007 FY 2008 FY 2009 FY 2010 FY 2011 FY 2012 FY 2013 FY 2014*
Research Universities Ten-Year Trend
KU
KSU
WSU
$0
$10,000
$20,000
$30,000
$40,000
$50,000
$60,000
$70,000
$80,000
$90,000
FY 2005 FY 2006 FY 2007 FY 2008 FY 2009 FY 2010 FY 2011 FY 2012 FY 2013 FY 2014*
Regional Universities Ten-Year Trend
ESU
PSU
FHSU
Each of the six universities have experienced significant growth in their respective endowments since 2010. The Board realizes the importance of this growth in achieving university excellence and believes that this metric is a direct reflection of the confidence that alumni and friends have in the university.
FY2010 FY2011 FY2012 FY2013 FY2014*
10-year % Change Endowment Endowment Endowment Endowment Endowment
Change (%) FY2013 to
FY2014 KU $1,054,739,000 $1,250,443,000 $1,182,333,000 $1,288,995,000 $1,470,786,000 30.0% 51.8% KSU $277,584,000 $337,460,000 $329,240,000 $364,675,000 $473,969,000 14.1% 76.9% WSU $177,017,000 $208,667,000 $199,316,000 $212,178,000 $237,002,000 11.7% 63.8% ESU $62,795,000 $67,569,000 $67,291,000 $71,009,000 $79,992,000 12.7% 46.9% PSU $48,101,000 $59,333,000 $57,241,000 $73,912,000 $69,414,000 -6.1% 94.0% FHSU $47,464,000 $50,624,000 $50,457,000 $53,852,000 $64,303,000 19.4% 61.6%

January 2015 Progress Report Foresight 2020 | Page 16
Goal 3: Metric 3Increase in proportion of federal research dollars awarded
Source: Higher Education Research and Development (HERD) Survey, FY2010-2012*Source FY2013: Individual Universities
Federal Research & Development Dollars Awarded, Percent of Total
Although total research dollars increased at four of the six universities, the percentage and total dollar amount of research and development funding coming from federal sources decreased at nearly all receiving institutions. This increase in total research funding, in spite of the decline in federal research funding, reflects a redirection of efforts by the university to partner with business and industry, in light of future anticipated reductions in federal research funding.
KU KSU WSU PSU ESU FHSU FY2010 Total R&D dollars $267,961,000 $160,679,000 $51,524,000 $1,759,000 -- -- Federal R&D dollars $147,598,000 $68,560,000 $13,751,000 $999,000 -- -- % of total 55% 43% 27% 57% -- -- FY2011 Total R&D dollars $274,727,000 $169,167,000 $63,538,000 $1,687,000 $525,000 -- Federal R&D dollars $162,721,000 $76,953,000 $20,569,000 $1,280,000 $304,000 -- % of total 59% 45% 32% 76% 58% -- FY2012 Total R&D dollars $286,262,000 $176,141,000 $61,279,000 $1,479,000 $479,000 $578,000 Federal R&D dollars $171,043,000 $77,689,000 $19,078,000 $989,000 $218,000 $236,000 % of total 60% 44% 31% 67% 46% 41% FY2013* Total R&D dollars $298,498,000 $183,096,000 $61,388,000 $1,536,000 $326,000 $450,000 Federal R&D dollars $174,021,000 $70,167,000 $13,434,000 $791,000 $187,000 $141,000 % of total 58% 38% 22% 51% 57% 31%

January 2015 Progress Report Foresight 2020
Foresight 2020 is a 10-year strategic agenda for the state’s public higher education system.
Performance of students on institutional assessments in three areas:1. Mathematics/Quantitative/Analytical Reasoning2. Written and Oral Communication3. Critical Thinking/Problem Solving
Performance of students on selected third-party technical program certificate/credential assessments
Percent of graduates employed in Kansas
Average wages earned by graduates
Improvement in quality measures on technical program outcome metrics
Number of certificates and degrees awarded in selected high-demand occupations
Percent of certificates and degrees awarded in STEM fields
Institutional performance on quality measures compared to peers, including select regional and national rankings
Increase in private giving to universities
Increase in proportion of federal research dollars awarded
SCORECARD
Goal 2: Improve Alignment of the State's Higher Education System with the Needs of the Economy
Goal 3: Ensure State University Excellence
Goal 1: Increase Higher Education Attainment Among KansansComparison of state demographics with higher education participation levels, including underrepresented groups
Review of higher education participation levels by age groups, including traditional students (18-24), and adults between the ages of 25-34, 35-44, and 45-64
Comparison of Kansans’ postsecondary attainment to the nation by age groups
Overall number of Adult Basic Education (ABE) participants
Percentage of ABE participants in postsecondary education
Three-year graduation rates for community and technical colleges
Six-year graduation rates for universities
First to second year retention rates
Student Success Index
Number of certificates and degrees awarded
Number of adults with college credit but no certificate or degree who are returning to complete a certificate, associate or bachelor’s degree
new
new
new
new
LEGEND
new
Increase from 2014(change in direction)
Improvement over 2014,but not strong growth(change in direction)
Decrease from 2014(change in direction)
Increase from 2014(same direction)
Reporting for the first time
Public Higher Education in KansasKansas has seven public universities, 19 community colleges, and six technical colleges. These institutions employ nearly 29,000 of our friends and neighbors. Public colleges and universities benefit from a system that brings accountability, advocacy, and resources to public higher education in Kansas.
The Kansas Board of RegentsThe Kansas Board of Regents is a nine-member governing board working for Kansans. The Board advocates for continuous improvement in public higher education while making it accessible to all qualified Kansans.
KANSAS BOARD OF REGENTS1000 SW Jackson Street, Suite 520Topeka, KS 66612-1368
785-296-3421www.kansasregents.org ©Kansas Board of Regents