karamoja total population districtdate source ubos agr since 2002 2006/20072007/20082008/2009 abim...
TRANSCRIPT

KARAMOJA TOTAL POPULATIONDISTRICT Date source UBOS
AGRSince 2002
2006/2007 2007/2008 2008/2009
Abim District Planning Office
67,385 69,685 85,787
UBOS 1,7% 53,244 54,000 54,900
Kaabong District Planning Office
240,370 248,573 266,707
UBOS 5,1% 285,537 301,200 316,600
Kotido UBOS 4,9% 162,359 167,900 179,300
Moroto UBOS 4 % 242,330 250,600 265,300
Nakapiripirit UBOS 4,2% 185,870 192,612 217,500
KARAMOJARegion
National3,5%
898,314 929,370 1,014,594

Abim Kaabong Kotido Moroto Nakapiripirit Karamoja Reg.0
20
40
60
80
100
120
140
160
114
44
106
81
56
72
142
50
111
98
56
82
91
67.4
86.691.8
52.3
75.95
DPT 3 (pentavalent vaccines)coverage < 1 year Karamoja districts and Region.
Financial Years 2006/2007, 2007/2008 & 2008/2009
2006/2007
2007/2008
2008/2009
National average 2007/08 82% AHSPR
National target 2007/08 100% AHSPR
%
Karamoja Health Data Center
For Abim and Kaabong Districts not used UBOS population.
AHSPR: Annual Health Sector Performance Report - MoH Uganda

Karamoja Health Data Center
For Abim and Kaabong Districts not used UBOS population.
Abim
Kaabo
ng
Kotid
o
Mor
oto
Nakap
iripiri
t
Karam
oja0
20
40
60
80
100
120
140
91
67
8792
52
76
93.5
71.4
113.9
88
118
95.2
77.5
49.9
85.3
73.2
60.166.7
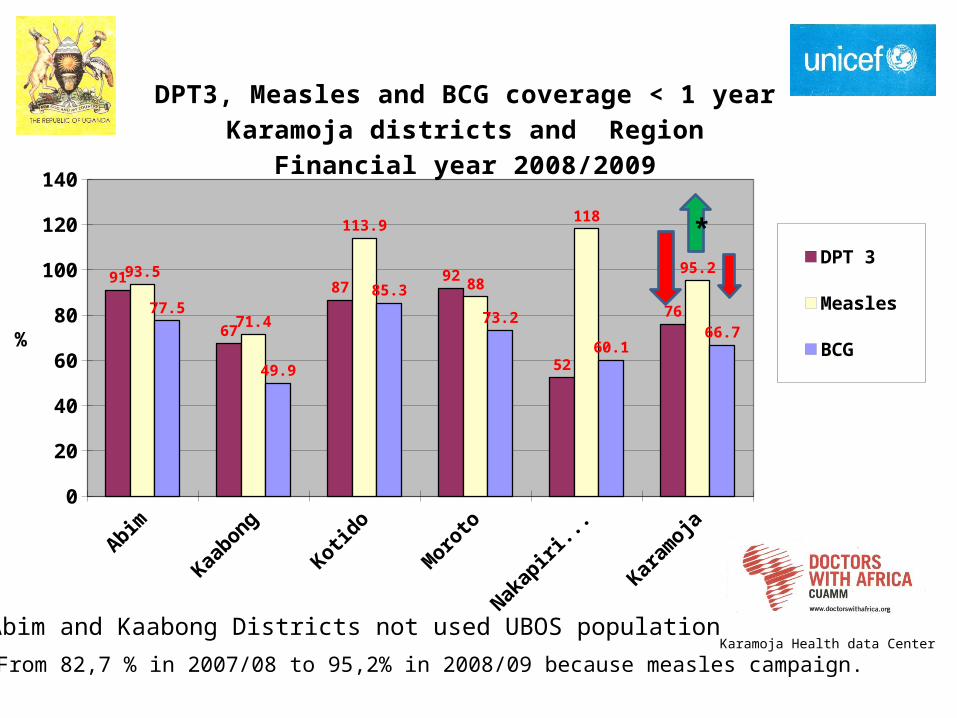
DPT3, Measles and BCG coverage < 1 year Karamoja districts and Region
Financial year 2008/2009
DPT 3
Measles
BCG%
Karamoja Health data CenterFor Abim and Kaabong Districts not used UBOS population
*
* From 82,7 % in 2007/08 to 95,2% in 2008/09 because measles campaign.

Abim
Kaabong
Kotido
Moro
to
Nakap
iripiri
t
Karam
oja0
20
40
60
80
100
120
140
73.5
52
125
6255
70.2
103
54
118
96
62
82
66.370.6
84.679.9
121.2
85.8
Pregnant women TT2-5 coverage Karamoja districts and Region Financial Years 2006/2007, 2007/2008 & 2008/2009
2006/2007
2007/2008
2008/2009
National average 2007/08 AHSPR 52%
National target 2007/08 AHSPR 90%
%
Karamoja Health Data CenterFor Abim and Kaabong Districts not used UBOS population.

Abim
Kaabong
Kotido
Moro
to
Nakap
iripiri
t
Karam
oja0
10
20
30
40
50
60
70
80
41
17.5
53.4
27
14.5
27.5525.5
14
26.630
14
21.27
29.5
18.8
30 30.6
25.7 26.13
TT2-5 WCBA (women in child bearing age-13-49 years) coverage Karamoja districts and Region Financial Years
2006/2007, 2007/2008 & 2008/2009
2006/2007
2007/2008
2008/2009
National target 2008/09 70%
%
Karamoja Health Data CenterFor Abim and Kaabong Districts not used UBOS population

Abim
Kaabong
Kotido
Moro
to
Nakap
iripiri
t
Karam
oja0
20
40
60
80
100
120
87.5
43.7
95
59.9 58.7563.55
93
59.75
109.5
73.179.75 79.8
113
82
110
74
94.890.16
Percentage of children (6-59 months) received 2 doses vitamin A in Karamoja districts and Region.
Financial years 2006/07, 2007/08 and 2008/09
2006/07 63,5%
2007/08 79,8%
2008/09 90,16%
National average 2007/08 60%
National target 70%
%
Included Child Day results.
Karamoja Health Data Center

Abim
Kaabong
Kotido
Moro
to
Nakap
iripiri
t
Karam
oja0
10
20
30
40
50
60
70
80
90
31.635.35
39.5
25.6 27.525.05
70,9
36.5
73.25
46.75
5450.7
71.6
45.5
81
49
64.5
58.11
Percentage of children (1-14 years) received 2 doses Albendazole in Karamoja districts and Region.
Financial years 2006/07-2007/08 and 2008/09.
2006/07 25%
2007/08 50%
2008/09 58,11%
National target 70%
%
Included Child Day results.Karamoja Health Data Center

Karamoja Health Data Center
For Abim and Kaabong Districts not used UBOS population.
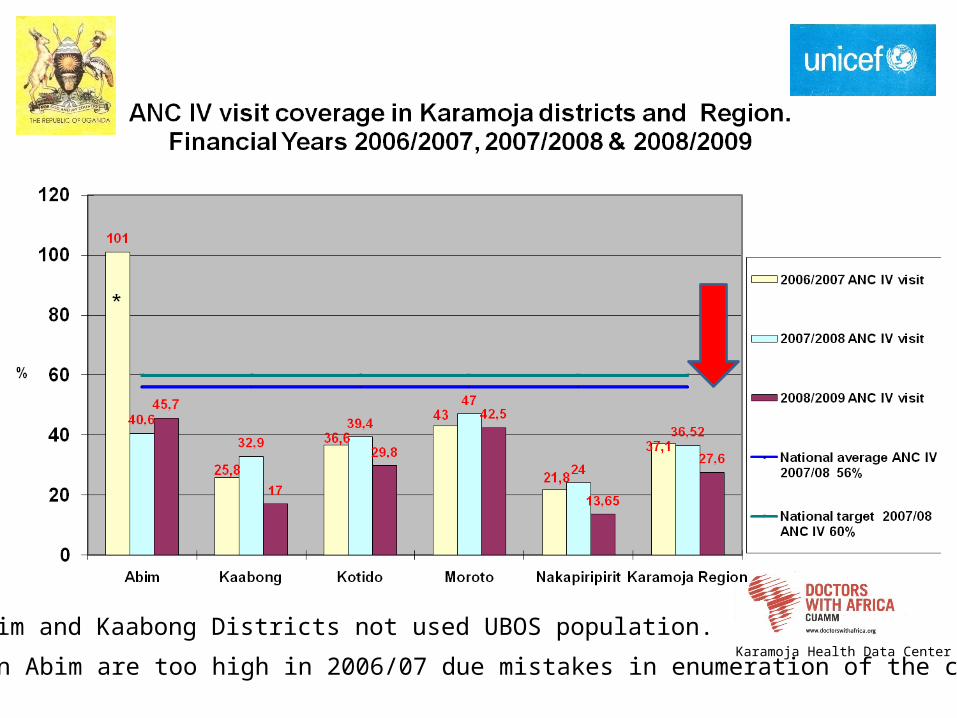
Karamoja Health Data Center* ANC IV visits in Abim are too high in 2006/07 due mistakes in enumeration of the cases.
For Abim and Kaabong Districts not used UBOS population.

Karamoja Health Data CenterFor Abim and Kaabong Districts not used UBOS population.
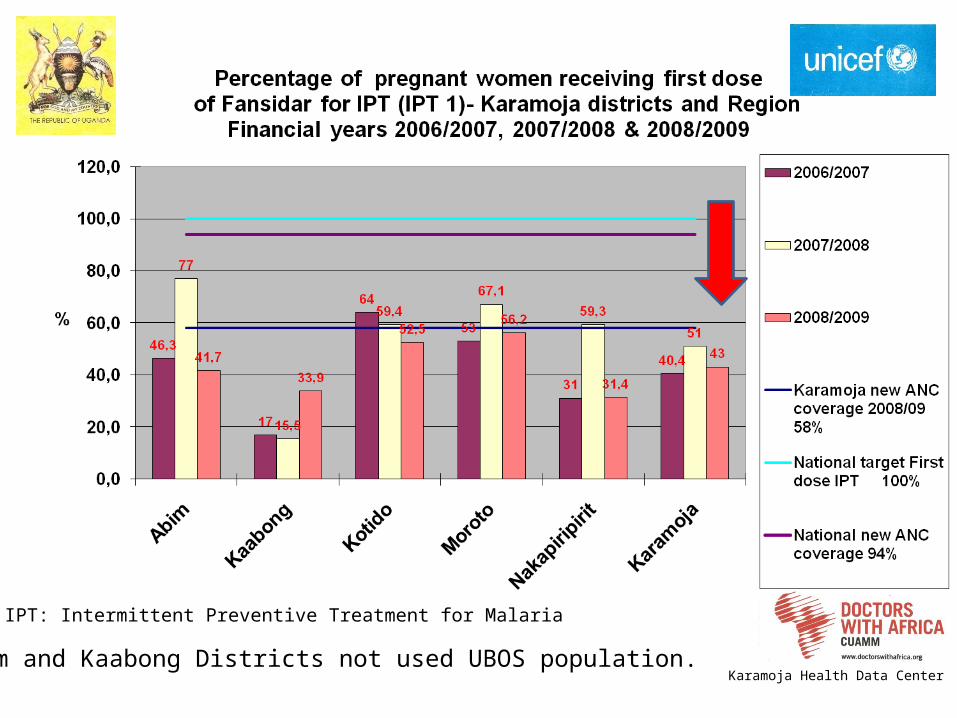
IPT: Intermittent Preventive Treatment for Malaria
Karamoja Health Data CenterFor Abim and Kaabong Districts not used UBOS population.

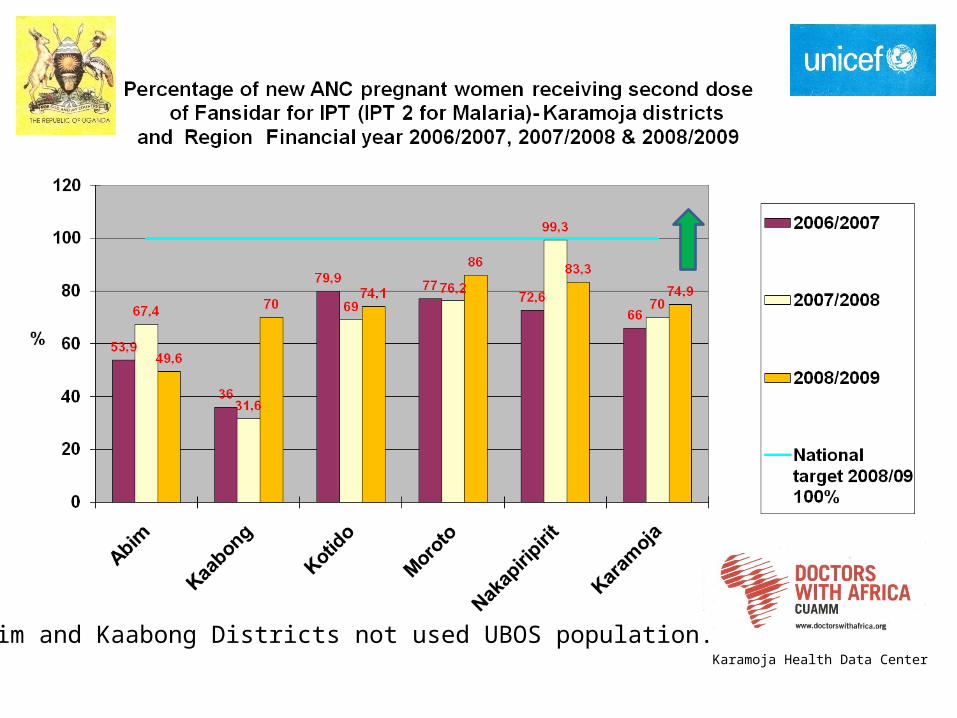
Karamoja Health Data CenterFor Abim and Kaabong Districts not used UBOS population.
Karamoja Health Data Center
For Abim and Kaabong Districts not used UBOS population.

Karamoja Health Data CenterFor Abim and Kaabong Districts not used UBOS population.

Karamoja Health Data Center
For Abim and Kaabong Districts not used UBOS population.

Karamoja Health Data CenterFor Abim and Kaabong Districts not used UBOS population.

Karamoja Health Data CenterFor Abim and Kaabong Districts not used UBOS population.

” Continuum of care for maternal, newborn, and child health: from slogan to service delivery Lancet, 2007; 370: 1358-69
Performance results at district level: continuum of care for maternal, newborn and child health (MNCH)

Health System Strengthening: improving performance
TYP Guidelines, pg. 6

Identify and address missed opportunitiesand coverage gaps for MNH

Cesarian sections in Karamoja 2008-09
• Moroto: 230• Kotido: 30• Abim: 46• Kaabong: 53• Nakapiripirit 0• Karamoja: 359
Minimum target 5% ( 2,300 Cesarian sections)CS done in 2008/09 : 359% done 15,6%CS not done: 1,941% not done 84,4%What’s happen with these
mothers?

Strategies to deliver effective HCPwithin the existing programs