kate levin university of edinburgh how healthy are scotland’s children? a european overview
TRANSCRIPT

KATE LEVINUNIVERSITY OF EDINBURGH
How healthy are Scotland’s children? A European overview

Policy developments related to children and young people’s health
• National Programme for Improving Mental Health and Well-being (2001) Action Plan (Scottish Executive, 2003)
• Schools (Health Promotion and Nutrition) (Scotland) Act 2007 requires education authorities to ensure schools are health-promoting
• ‘Creating confident kids’ programme is based on SEAL (Social and Emotional Aspects of Learning programme, in England)
• Equally Well: Report of the Ministerial Task Force on Health Inequalities (2008) aims to reduce health inequalities among children and young people
• Curriculum for Excellence (2009) to take a holistic approach to health and wellbeing across the school curriculum to improve mental, emotional, social and physical health and to promote resilience, confidence, independent thinking and positive attitudes.

The Health Behaviour in School-aged Children (HBSC) Study
An international study that gathers data from young people about their health and well-being
• Physical activity• Consumption of food & drinks/weight control• TV & computer use/electronic communication• Sexual health• Body image/BMI• Fighting/bullying/injuries• Self-rated health/health complaints/life satisfaction• Risk behaviours: tobacco/alcohol/cannabis

HBSC: background
• Initiated in 1982 by three countries and shortly afterwards became a WHO collaborative study
• Now has 43 member countries/regions in Europe and North America
• International network of >260 researchers from different disciplines
• A collaborative project between national research teams and in partnership with WHO

Growth of HBSC study: countries by survey year
1983/1984 1985/1986 1989/1990 1993/1994 1997/1998 2001/2002 2005/6
1. England2. Finland3. Norway4. Austria5. Denmark
1. Finland 2. Norway 3. Austria 4. Denmark 5. Belgium 6. Hungary 7. Israel
8. Scotland 9. Spain10. Sweden11. Switzerland12. Wales13. Netherlands
1. Finland 2. Norway 3. Austria 4. Belgium (French) 5. Hungary
6. Scotland 7. Spain 8. Sweden 9. Switzerland10. Wales11.Denmark12. Netherlands13. Canada14. Latvia15. N. Ireland16. Poland
1. Finland 2. Norway 3. Austria 4. Belgium (French) 5. Hungary 6. Israel
7. Scotland 8. Spain 9. Sweden10. Switzerland11. Wales12. Denmark13. Canada14. Latvia15. Northern Ireland16. Poland17. Belgium (Flemish)18. Czech Republic19. Estonia20. France21. Germany22. Greenland23. Lithuania24. Russia25. Slovakia
1. Finland 2. Norway 3. Austria 4. Belgium (French) 5. Hungary 6. Israel
7. Scotland 8. Sweden 9. Switzerland10. Wales11. Denmark12. Canada13. Latvia14. Northern Ireland15. Poland16. Belgium (Flemish)17. Czech Republic18. Estonia19. France20. Germany21. Greenland22. Lithuania23. Russia24. Slovakia25. England26. Greece27. Portugal28. Ireland29. USA
1. Finland 2. Norway 3. Austria 4. Belgium (French) 5. Hungary 6. Israel
7. Scotland 8. Spain 9. Sweden10. Switzerland11. Wales12. Denmark13. Canada14. Latvia15. Poland16. Belgium (Flemish)17. Czech Republic18. Estonia19. France20. Germany21. Greenland22. Lithuania23. Russia24. England25. Greece26. Portugal27. Ireland28. USA29. tfyr Macedonia30. Netherlands31. Italy32. Croatia33. Malta34. Slovenia35. Ukraine
1. Finland 2. Norway 3. Austria 4. Belgium (French) 5. Hungary 6. Israel
7. Scotland 8. Spain 9. Sweden10. Switzerland11. Wales12. Denmark13. Canada14. Latvia15. Poland16. Belgium (Flemish)17. Czech Republic18. Estonia19. France20. Germany21. Greenland22. Lithuania23. Russia24. England25. Greece26. Portugal27. Ireland28. USA29. tfyr Macedonia30. Netherlands31. Italy32. Croatia33. Malta34. Slovenia35. Ukraine36. Luxemburg37. Turkey38. Slovakia39. Romania40. Iceland41. Bulgaria


HBSC: methods
• Surveys conducted every 4 years using standard international questionnaire in all countries (latest survey 2005– 2006)
• School–based, pupil self-complete questionnaire, teacher or researcher administered
• Class is sampling unit
• Three age groups with mean age 11.5, 13.5 and 15.5 years
• Sample size in each country: minimum of 4,500 (1,500 per age group)

Some results from the 2005/06 HBSC survey
Inequalities in Young People’s Health
•Report from the Health Behaviour in School-Aged Children 2005/06 Survey in 41 countries
•Currie et al, 2008. WHO, Copenhagen Health Policy for Children and Adolescents, No. 5

Scottish data: Mental health and well-being
• Happiness• Confidence• Perception of looks • Life satisfaction • Multiple Health complaints• Self-rated health

Scottish data: Mental health and well-being
• Happiness: Very happy • Confidence: Always confident• Perception of looks: Good looking • Life satisfaction: High life satisfaction • Multiple Health complaints: MHC• Self-rated health: Poor/fair health
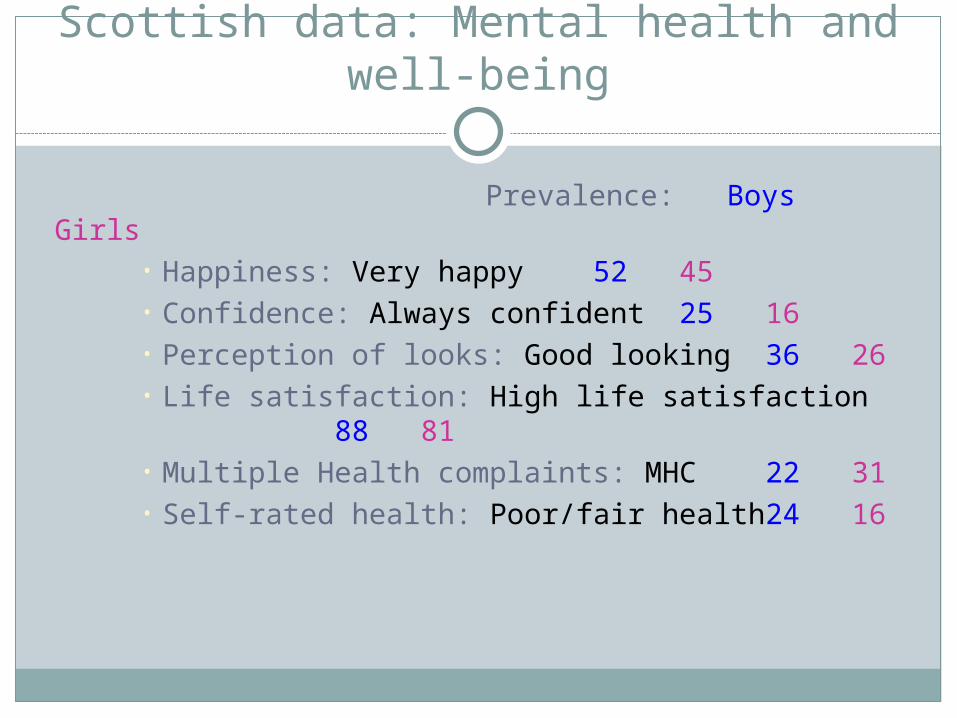
Scottish data: Mental health and well-being
Prevalence: Boys Girls• Happiness: Very happy 52 45• Confidence: Always confident 25 16• Perception of looks: Good looking 36 26 • Life satisfaction: High life satisfaction 88 81• Multiple Health complaints: MHC 22 31• Self-rated health: Poor/fair health 24 16

Scottish data: 1994-2006 trends
Proportion of boys and girls who are very happy
0
10
20
30
40
50
60
1994 1998 2002 2006
Boys
Girls

Scottish data: 1994-2006 trends
0
10
20
30
40
50
1994 1998 2002 2006
Proportion of boys and girls who think they are good looking
Boys
Girls

Scottish data: Mental well-being
• Happiness• Confidence• Perception of looks • Life satisfaction• Multiple Health complaints• Self-rated health

Self rated health poor/fair at age 11 & 15
At age 11 ranges from3% to 37%
At age 15 ranges from4% to 50%
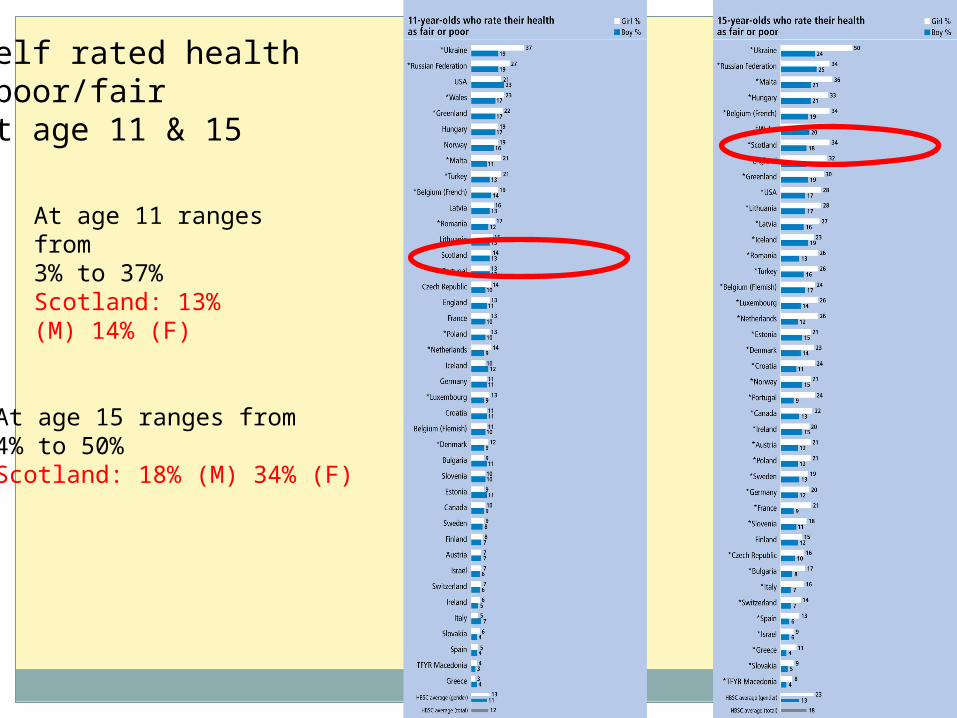
Self rated health poor/fair at age 11 & 15
At age 11 ranges from3% to 37%Scotland: 13% (M) 14% (F)
At age 15 ranges from4% to 50%Scotland: 18% (M) 34% (F)

Scottish data: Risk behaviours (15 yrs)
Prevalence: Boys Girls • Weekly smoking 14 23• Weekly drinking 40 37• Drunkeness (2+ times) 43 48• Cannabis use (ever) 29 27• Sexual intercourse (ever) 30 34

Scottish data: 1990-2006 trends
Trends in 15 yr olds weekly smoking
14
23
16
2221
16
17
23
2826
0
10
20
30
40
1990 1994 1998 2002 2006% r
epor
ting
that
they
sm
oke
at le
ast o
nce
a w
eek
Boys Girls

Weekly smoking at age 15:
• Ranges from 8% to 48%

Weekly smoking at age 15:
• Ranges from 8% to 48%Scotland: 14% (M) 23% (F)

Sexual Intercourseaged 15
Ranges from 12%to 61%Scotland: 30% (M) 34% (F)

Scottish data: Health behaviours
Prevalence: Boys Girls • Brushing teeth twice a day 65 80• Daily breakfast consumption 57 49• Daily fruit consumption 36 43• Daily vegetable consumption 33 43• Daily physical activity 29 16

Scottish data: 1990-2006 trends
0
20
40
60
80
1990 1994 1998 2002 2006
Proportion of boys and girls who eat breakfast daily
Boys
Girls

Daily fruit consumptionat age 11 & 15
At age 11 ranges from 19% to 52%Scotland: 46% (M) 55% (F)
At age 15 ranges from 11% to 42%Scotland: 29% (M) 34% (F)
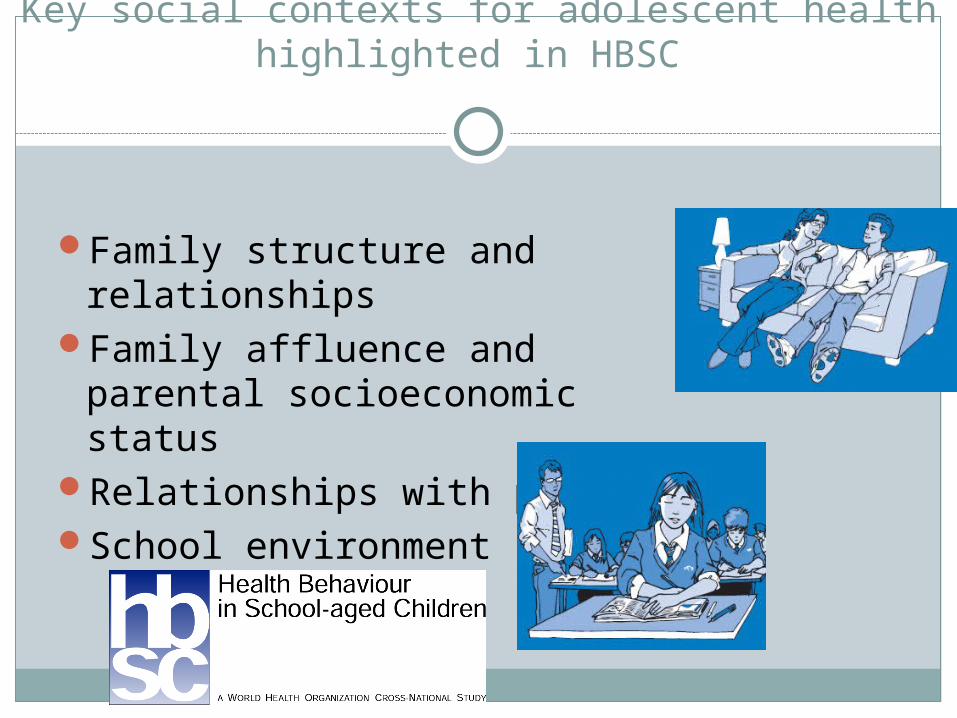
Key social contexts for adolescent health highlighted in HBSC
Family structure and relationshipsFamily affluence and parental
socioeconomic status Relationships with peersSchool environment

Economic disadvantage and health: key points
Effects of economic disadvantage:Social exclusion and lack of opportunity in activities
that promote or support healthPsychological effect of perceived low social and
economic statusDirect effects of material deprivation and poverty on
social and living conditionsLocal and global social and economic conditions
impact on aspirations and sense of achievement which affects mental health

Variation in levels of Family Affluenceacross Europe in 2006

Variation in levels of Family Affluenceacross Europe in 2006

Across Europe: key points
Injuries are leading cause of death in young people and more prevalent in middle income countries and among lower socioeconomic groups
There is an increasing trend in overweight among children and young people
Overweight rates are higher among lower socioeconomic groups in richer countries and reverse is true in poorer countries
Fruit and vegetable consumption fall below recommended levels; missing breakfast is common; soft drink consumption high
Physical activity, mental well-being and eating habits are interconnected aspects of adolescent health

Scotland: key points
Positive long-term trends in emotional well-being and oral health
Short-term improvements between 2002 and 2006 in fruit and vegetable consumption, physical activity and condom use
Areas of concern: weekly smoking and drinking, particularly among girls
Breakfast consumption (at age 15) relatively low compared with the rest of Europe. Sexual experience, alcohol and cannabis use relatively high.
MHC and bullying relatively low, fruit consumption (at age 11) relatively high.

FOR MORE INFORMATION, PLEASE VISIT:http://www.education.ed.ac.uk/cahru/
How healthy are Scotland’s children? A European overview