kegalle plantations plc - arpico...kegalle lanta c 2 0 1 6 17 2 the largest rubber producer of sri...
TRANSCRIPT
Kegalle Plantations PLC A n n u a l R e p o r t 2 0 1 6 - 1 7
1
ANNUAL REPORT 2016 / 2017
KEGALLE PLANTATIONS PLC
Kegalle Plantations PLC
Kegalle Plantations PLC
No. 310, High Level Road, Nawinna, Maharagama, Sri Lanka.Tel : +94 11 4310500Fax : +94 11 4310799Website : www.arpico.comEmail : [email protected]
An
nual Report 2016 / 2017

Kegalle Plantations PLC A n n u a l R e p o r t 2 0 1 6 - 1 7
2
The largest rubber producer of Sri Lanka, Kegalle Plantations PLC, made a radical change to its tradi-tional stance through moving onto a new lucrative crop, Oil Palm Cultivation. This radical move was made with the focus of being competitive in the cur-rent global economic scenario in order to be a pro-vider of high value to all our stakeholders. In a care-ful analysis of the current market trends in the plan-tation industry, it is obvious that there is a downturn trend in respect of traditional crops.
Under such situations, a Company which seeks to achieve a sustainable development and which aspires to be an outstanding performer in the industry requires to move its focus on a growing market.
Recognizing this reality, KPL took a competitive and challenging move to diversify its business and oil palm will be included in its product portfolio with the intention of capitalizing on the improving market conditions of the Palm Oil industry that will offer four major crops of economically important. This radical transformation will be a turning point of KPL which will direct the future growth of the Company.
Kegalle Plantations PLC A n n u a l R e p o r t 2 0 1 6 - 1 7
1
Governance Review
Board of Directors 62Management Team 64Corporate Governance 66Report of the Audit Committee 69Report of the Remuneration Committee 71Report of the Related Party Transactions Review Committee 72Risk Management 73
Financial Reports
Annual Report of the Board of Directors 80Statement of the Directors’ Responsibility 84Independent Auditors’ Report 85Statement of Profit or Loss 86Statement of Comprehensive Income 87Statement of Financial Position 88Statement of Changes in Equity 89Cash Flow Statement 90Notes to the Cash Flow Statement 91Notes to the Financial Statements 92
Supplementary Reports
Ten Year Summary 138 Historical Note 139Shareholder & Investor Information 142Glossary of Financial Terminology 145Notice of Meeting 147Form of Proxy 149
Corporate Information back inner cover
CO
NT
EN
TS
About Us
Vision, Mission & Objectives 2Introduction to the Report 4Company Profile 5Milestones 6Financial Highlights 7Chairman’s Review 9Our Estates 12Financial Calendar 14
Management Discussion & Analysis
Operating Environment 16Segmental Information 20Review of Operations 22Financial Review 29
Sustainability Report
Managing Our Impact 36Economic Sustainability 40Social Sustainability 44 Environmental Sustainability 50 Our Achievements 54GRI Index 56
Scan to viewThe digital version of this annual reporthttps:/www.arpico.com/contents/kpl_financial_reports.php

Kegalle Plantations PLC A n n u a l R e p o r t 2 0 1 6 - 1 7
2
VISIONTo seek excellence in all our pursuits.
To achieve excellence in the man-agement of plantations by optimum utilization of resources.
To enhance the quality of life of our employees and the neighboring villagers.
To assure our shareholders optimum returns and to be an exemplary corporate citizen.
We will endeavour to be the most techno-logically advanced producer of agricultural products and their value-added forms, by means of innovations and inventions through Research and Development.
We seek to be acknowledged in Sri Lanka and Overseas as a Producer and Supplier of quality agricultural products and their derivatives through superior customer services.
We will be a model employer in the planta-tion sector committed to achieve Leader-ship in every sphere of business activity.
We will provide our employee with the necessary training to enhance their skills and enable them to be a part of a highly motivated and dedicated workforce.
We seek to provide our shareholders with the maximum return on investment.
We intend to ensure continued liquidity and growth of the Company.
MISSION
OBJECTIVES
Abo
ut U
s

Kegalle Plantations PLC A n n u a l R e p o r t 2 0 1 6 - 1 7
3
Abo
ut U
s
Brief introduction of Oil Palm Cultivation and why it is important for KPL
Soil condition, weather pattern, temperature meets within the low country of KPL.
Soil & Climatic Requirements for Oil Palm Cultivation;
● Welldrainedsoilwithhighhumuscontent● Terrainbelow20%● Rainfallabove2,000mm● Temperature29-33oC● Altitude-Upto300AMSL● Sunlightminimum5hoursperday
Continuedinpageno.15...
Tra
nsf
orm
ing
fro
m t
he T
rad
itio
n...
Vision, Mission & Objectives ......................... 2Introduction to the Report ............................. 4Company Profile .......................................... 5Milestones ................................................... 6Financial Highlights ..................................... 7Chairman’s Review....................................... 9Our Estates ................................................ 12Financial Calendar ..................................... 14
Contents

Kegalle Plantations PLC A n n u a l R e p o r t 2 0 1 6 - 1 7
4
INTRODUCTION TO THE REPORT
This is the 24th annual report of Kegalle PlantationsPLC which is presented for the year ended 31March2017. The report has mainly been prepared with theaimofprovidingtherelevantfinancialandnon-financialinformation related to the ended year so as to facilitate theunderstandinganddecisionmakingofstakeholdersof the Company. Due to the inherent nature of theplantation industry, the Company has to experience awide range of economic, environmental, social andother challenges and the operations of the Companywere carried out amidst these challenges. Accordingly,this report is intended to reflect how the Companymanaged its operations in spite of these challengesandwhat theCompany achievedduring the year andwhatconsequencesemergedonthesocietyduetotheoperationsoftheCompany.
The Financial Statements contained in the report havebeen prepared in accordance with Sri Lanka FinancialReportingStandardstocomplywiththeCompaniesActNo. 07 of 2007, the continuing listing requirements ofColomboStockExchange.
The adoption of the Global Reporting Initiatives G4Core Criteria (GRI) for sustainability reporting for thefirst time in the history of Kegalle Plantations PLC canbe recognizedas a specialdevelopmentwhich shouldbe emphasized during the current year. This can beconsidered a progressive movement towards thesustainable growth of the Company. However, theseare carried out on voluntary basis and content of thesustainabilityreporthasnotbeenexternallyassured.
Wehopethatyouwillfindthisreportasabasisfortheinformed decision making and other useful purposes.Please direct all your compliments or criticisms on our annual report.
KegallePlantationsPLCNo310,HighLevelRoad,Nawinna,Maharagama.
[email protected]:+94114310500
About Us | Introduction to the Report
Kegalle Plantations PLC A n n u a l R e p o r t 2 0 1 6 - 1 7
5
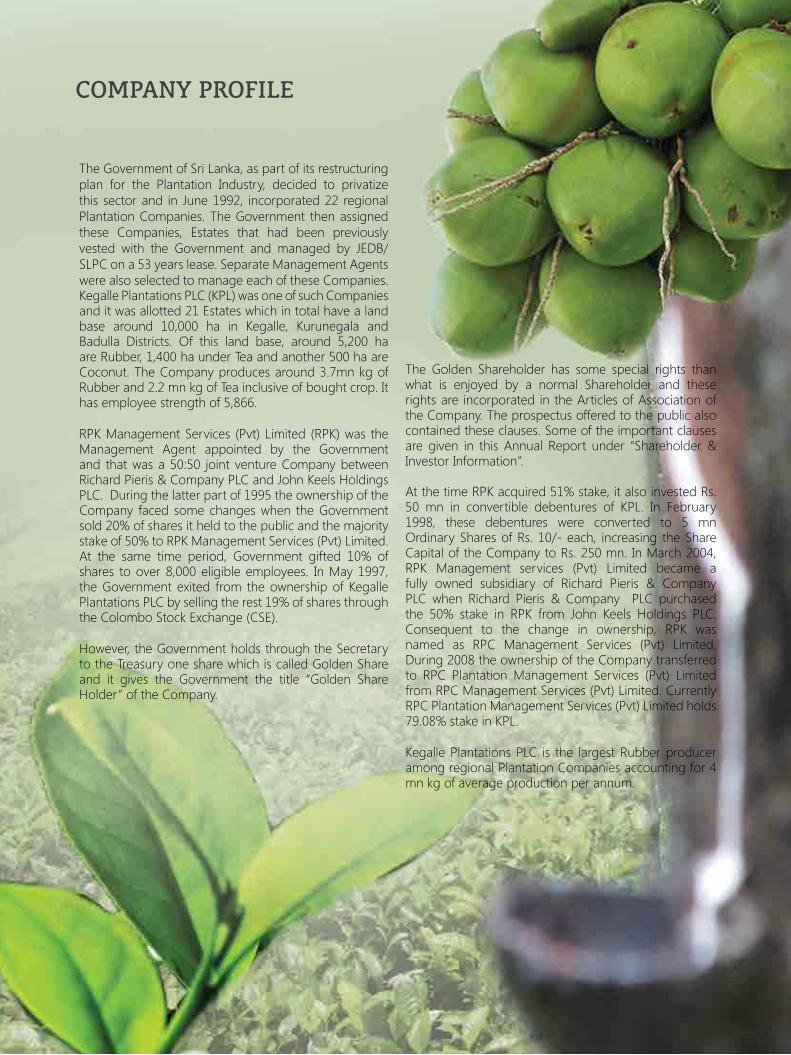
TheGovernmentofSriLanka,aspartofitsrestructuringplan for the Plantation Industry, decided to privatizethissectorand inJune1992, incorporated22regionalPlantationCompanies.TheGovernment thenassignedthese Companies, Estates that had been previouslyvested with the Government and managed by JEDB/SLPCona53yearslease.SeparateManagementAgentswerealsoselectedtomanageeachoftheseCompanies.KegallePlantationsPLC(KPL)wasoneofsuchCompaniesanditwasallotted21Estateswhichintotalhavealandbase around 10,000 ha in Kegalle, Kurunegala andBadulla Districts. Of this land base, around 5,200 haareRubber,1,400haunderTeaandanother500haareCoconut.TheCompanyproducesaround3.7mnkgofRubberand2.2mnkgofTeainclusiveofboughtcrop.Ithasemployeestrengthof5,866.
RPKManagementServices (Pvt)Limited (RPK)was theManagement Agent appointed by the Governmentand thatwasa50:50 joint ventureCompanybetweenRichardPieris&CompanyPLCandJohnKeelsHoldingsPLC.Duringthelatterpartof1995theownershipoftheCompany faced somechangeswhen theGovernmentsold20%ofsharesitheldtothepublicandthemajoritystakeof50%toRPKManagementServices(Pvt)Limited.At the same time period, Government gifted 10% ofshares toover8,000eligibleemployees. InMay1997,theGovernmentexited from theownershipofKegallePlantationsPLCbysellingtherest19%ofsharesthroughtheColomboStockExchange(CSE).
However,theGovernmentholdsthroughtheSecretarytotheTreasuryonesharewhichiscalledGoldenShareand it gives the Government the title “Golden ShareHolder”oftheCompany.
The Golden Shareholder has some special rights thanwhat is enjoyed by a normal Shareholder and theserightsare incorporated intheArticlesofAssociationoftheCompany.Theprospectusofferedtothepublicalsocontained these clauses. Some of the important clauses are given in this Annual Report under “Shareholder&InvestorInformation”.
AtthetimeRPKacquired51%stake,italsoinvestedRs.50 mn in convertible debentures of KPL. In February1998, these debentures were converted to 5 mnOrdinarySharesofRs.10/-each, increasing theShareCapitaloftheCompanytoRs.250mn.InMarch2004,RPK Management services (Pvt) Limited became afully owned subsidiary of Richard Pieris & CompanyPLC when Richard Pieris & Company PLC purchasedthe 50% stake in RPK from John Keels Holdings PLC.Consequent to the change in ownership, RPK wasnamed as RPC Management Services (Pvt) Limited.During2008theownershipoftheCompanytransferredto RPC Plantation Management Services (Pvt) LimitedfromRPCManagementServices(Pvt)Limited.CurrentlyRPCPlantationManagementServices(Pvt)Limitedholds79.08%stakeinKPL.
KegallePlantationsPLC is the largestRubberproduceramongregionalPlantationCompaniesaccountingfor4mnkgofaverageproductionperannum.
COMPANY PROFILE
Kegalle Plantations PLC A n n u a l R e p o r t 2 0 1 6 - 1 7
6
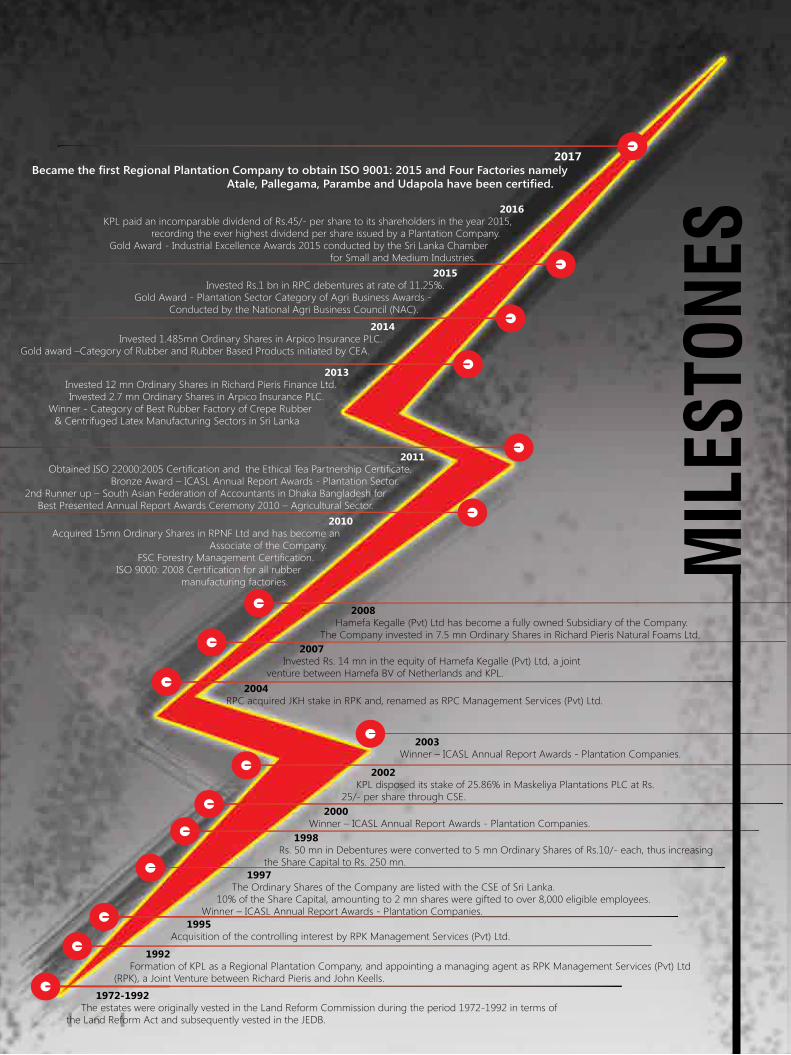
1972-1992The estates were originally vested in the Land Reform Commission during the period 1972-1992 in terms of
the Land Reform Act and subsequently vested in the JEDB.
1992 Formation of KPL as a Regional Plantation Company, and appointing a managing agent as RPK Management Services (Pvt) Ltd
(RPK), a Joint Venture between Richard Pieris and John Keells.
1995Acquisition of the controlling interest by RPK Management Services (Pvt) Ltd.
1997The Ordinary Shares of the Company are listed with the CSE of Sri Lanka.
10% of the Share Capital, amounting to 2 mn shares were gifted to over 8,000 eligible employees. Winner – ICASL Annual Report Awards - Plantation Companies.
1998Rs. 50 mn in Debentures were converted to 5 mn Ordinary Shares of Rs.10/- each, thus increasing
the Share Capital to Rs. 250 mn.
2000Winner – ICASL Annual Report Awards - Plantation Companies.
2002KPL disposed its stake of 25.86% in Maskeliya Plantations PLC at Rs.
25/- per share through CSE.
2003Winner – ICASL Annual Report Awards - Plantation Companies.
2004RPC acquired JKH stake in RPK and, renamed as RPC Management Services (Pvt) Ltd.
2007Invested Rs. 14 mn in the equity of Hamefa Kegalle (Pvt) Ltd, a joint
venture between Hamefa BV of Netherlands and KPL.
2008Hamefa Kegalle (Pvt) Ltd has become a fully owned Subsidiary of the Company.
The Company invested in 7.5 mn Ordinary Shares in Richard Pieris Natural Foams Ltd.
2010Acquired 15mn Ordinary Shares in RPNF Ltd and has become an
Associate of the Company.FSC Forestry Management Certification.
ISO 9000: 2008 Certification for all rubber manufacturing factories.
2011Obtained ISO 22000:2005 Certification and the Ethical Tea Partnership Certificate.
Bronze Award – ICASL Annual Report Awards - Plantation Sector.2nd Runner up – South Asian Federation of Accountants in Dhaka Bangladesh for
Best Presented Annual Report Awards Ceremony 2010 – Agricultural Sector.
2013Invested 12 mn Ordinary Shares in Richard Pieris Finance Ltd.Invested 2.7 mn Ordinary Shares in Arpico Insurance PLC.
Winner - Category of Best Rubber Factory of Crepe Rubber & Centrifuged Latex Manufacturing Sectors in Sri Lanka
2014Invested 1.485mn Ordinary Shares in Arpico Insurance PLC.
Gold award –Category of Rubber and Rubber Based Products initiated by CEA.
2015Invested Rs.1 bn in RPC debentures at rate of 11.25%.
Gold Award - Plantation Sector Category of Agri Business Awards - Conducted by the National Agri Business Council (NAC).
2016KPL paid an incomparable dividend of Rs.45/- per share to its shareholders in the year 2015,
recording the ever highest dividend per share issued by a Plantation Company.Gold Award - Industrial Excellence Awards 2015 conducted by the Sri Lanka Chamber
for Small and Medium Industries.
2017Became the first Regional Plantation Company to obtain ISO 9001: 2015 and Four Factories namely
Atale, Pallegama, Parambe and Udapola have been certified.
MILESTONES
Financial Highlights | About Us

Kegalle Plantations PLC A n n u a l R e p o r t 2 0 1 6 - 1 7
7
1972-1992The estates were originally vested in the Land Reform Commission during the period 1972-1992 in terms of
the Land Reform Act and subsequently vested in the JEDB.
1992 Formation of KPL as a Regional Plantation Company, and appointing a managing agent as RPK Management Services (Pvt) Ltd
(RPK), a Joint Venture between Richard Pieris and John Keells.
1995Acquisition of the controlling interest by RPK Management Services (Pvt) Ltd.
1997The Ordinary Shares of the Company are listed with the CSE of Sri Lanka.
10% of the Share Capital, amounting to 2 mn shares were gifted to over 8,000 eligible employees. Winner – ICASL Annual Report Awards - Plantation Companies.
1998Rs. 50 mn in Debentures were converted to 5 mn Ordinary Shares of Rs.10/- each, thus increasing
the Share Capital to Rs. 250 mn.
2000Winner – ICASL Annual Report Awards - Plantation Companies.
2002KPL disposed its stake of 25.86% in Maskeliya Plantations PLC at Rs.
25/- per share through CSE.
2003Winner – ICASL Annual Report Awards - Plantation Companies.
2004RPC acquired JKH stake in RPK and, renamed as RPC Management Services (Pvt) Ltd.
2007Invested Rs. 14 mn in the equity of Hamefa Kegalle (Pvt) Ltd, a joint
venture between Hamefa BV of Netherlands and KPL.
2008Hamefa Kegalle (Pvt) Ltd has become a fully owned Subsidiary of the Company.
The Company invested in 7.5 mn Ordinary Shares in Richard Pieris Natural Foams Ltd.
2010Acquired 15mn Ordinary Shares in RPNF Ltd and has become an
Associate of the Company.FSC Forestry Management Certification.
ISO 9000: 2008 Certification for all rubber manufacturing factories.
2011Obtained ISO 22000:2005 Certification and the Ethical Tea Partnership Certificate.
Bronze Award – ICASL Annual Report Awards - Plantation Sector.2nd Runner up – South Asian Federation of Accountants in Dhaka Bangladesh for
Best Presented Annual Report Awards Ceremony 2010 – Agricultural Sector.
2013Invested 12 mn Ordinary Shares in Richard Pieris Finance Ltd.Invested 2.7 mn Ordinary Shares in Arpico Insurance PLC.
Winner - Category of Best Rubber Factory of Crepe Rubber & Centrifuged Latex Manufacturing Sectors in Sri Lanka
2014Invested 1.485mn Ordinary Shares in Arpico Insurance PLC.
Gold award –Category of Rubber and Rubber Based Products initiated by CEA.
2015Invested Rs.1 bn in RPC debentures at rate of 11.25%.
Gold Award - Plantation Sector Category of Agri Business Awards - Conducted by the National Agri Business Council (NAC).
2016KPL paid an incomparable dividend of Rs.45/- per share to its shareholders in the year 2015,
recording the ever highest dividend per share issued by a Plantation Company.Gold Award - Industrial Excellence Awards 2015 conducted by the Sri Lanka Chamber
for Small and Medium Industries.
2017Became the first Regional Plantation Company to obtain ISO 9001: 2015 and Four Factories namely
Atale, Pallegama, Parambe and Udapola have been certified.
MILESTONES
FINANCIAL HIGHLIGHTS
15.3
2%
10.3
6%
3.76
%
3.44
%
5.00%
10.00%
15.00%
20.00%
12/13 13/14 14/15 15/16 16/17
2,58
8
2,41
4
2,02
4
1,93
3
-
500
1,000
1,500
2,000
2,500
3,000
12/13 13/14 14/15 15/16 16/17
2,28
7 8.
59%
18.9
3
13.8
4
5.08
4.06
8.69
-
5
10
15
20
12/13 13/14 14/15 15/16 16/17
113.
48
133.
70
136.
63
97.4
5
104.
87
- 20 40 60 80
100 120 140 160
12/13 13/14 14/15 15/16 16/17
5.92
7.59
16.8
9
12.4
9
5.98
- 2 4 6 8
10 12 14 16 18 20
12/13 13/14 14/15 15/16 16/17
473
346
127
101
-
100
200
300
400
500
600
12/13 13/14 14/15 15/16 16/17
60.00
19.00 47.00
207.50
103.00 112.00 105.00 85.50
50.70 52.00
-
50
100
150
200
250
07/08 08/09 09/10 10/11 11/12 12/13 13/14 14/15 15/16 16/17
Share Price (Rs.)
217
-
Return on Average Equity (%)
Turnover (Rs. mn)
Earnings Per Share (Rs.)
Net Assets Per Share (Rs.) Price Earnings Ratio (Times)
Profit After Tax (Rs. mn)
Financial Highlights | About Us

Kegalle Plantations PLC A n n u a l R e p o r t 2 0 1 6 - 1 7
8
-
500
1,000
1,500
2,000
2,500
3,000
3,500
4,000
4,500
12/13 13/14 14/15 15/16 16/17
Production (kg/nuts’ 000)
CoconutRubber Tea
Turnover (Rs. mn)
1,63
0
1,39
1
1,04
3
942
1,05
7
805
882
848
877
-
500
1,000
1,500
2,000
2,500
3,000
12/13 13/14 14/15 15/16 16/17
Rubber Tea
1,03
0
Performance - Year Ended 31 March 2017 2016 Variance
Rs.'000 Rs.'000 %
TurnoverProfitbeforeInterestandTaxProfitAfterTaxGrossDividendsCapitalExpenditure
2,287,161457,275217,263125,000175,924
1,933,063262,085101,330
1,125,000220,648
18%74%114%(89%)(20%)
Financial Position - As at 31 March
FixedAssetsCurrentAssetsTotalAssetsCurrentLiabilitiesShareholders’FundsStatedCapitalCapitalEmployed
4,315,0572,089,3236,404,3811,879,0472,621,695250,000
5,198,191
4,189,7912,168,5636,358,3531,476,5102,436,309250,000
5,163,821
3%(4%)1%27%8%-
1%
Key Indicators
EarningspershareNetAssetspershareDividendpershareMarketPricepershareReturnonCapitalEmployedMarketCapitalisationReturnonAverageEquity
Rs.Rs.Rs.Rs.%
Rs.’000%
8.69104.875.0052.008.80%
1,300,0008.59%
4.0697.4545.0050.705.08%
1,267,5003.44%
114%8%
(89%)3%73%3%
150%
About Us | Financial Highlights Chairman’s Review Chairman’s Review | About Us

Kegalle Plantations PLC A n n u a l R e p o r t 2 0 1 6 - 1 7
9
DearShareholders,
ItiswithgreatpleasurethatIwelcomeyoutothe24thAnnualGeneralMeetingofKegallePlantationsPLC,atwhichIpresenttheAnnualReportandAuditedFinancialStatements of your Company for the year ended 31March2017.
ItiswithgreatpridethatIremindyouthatyourCompanycontinuedtobethelargestnaturalrubberproducerinSri Lanka, a title which we have successfully securedoverthepastyears.Theyearunderreviewhasbeenachallengingyearfortheplantationindustryasawhole,with irregular weather patterns hampering the sector.Thereductionindemandduetogeopoliticaltensioninkeyexportmarketswasyetanotherfactorwhichplaceditsnegative footprinton the rubber industry.HoweveryourCompanywas able towithstand thesedifficultiesto a greater extent due to timely focus and effectivemanagementofresources.
During the year, Kegalle Plantations PLC recordedrevenueofRs. 2.3bnandaprofit after taxofRs. 217mn. Effective cost and finance management enabledtheCompanytostandstrong inyetanotherextremelychallengingyearfortheplantationindustry.
ECONOMIC ENVIRONMENT
Continueduncertainties in theglobaleconomyaswellasvolatility in internationalpolitics shroudedeconomicdecision making for policymakers as well as privateinvestors.Pricesofmostcommoditiesincludingfoodandbasemetals displayed an increasing trend, particularlytowards the latter part of the year. Themomentum intheglobaleconomyisexpectedtopersist in2017and2018with theongoingcyclical recovery in investment,manufacturing and trade. For the first time since theonsetofthegreatrecession,thefirstquarterof2017hasseenasynchronizedupturn in theUSA,Europe, Japanandsomekeyemergingmarkets.
Chairman’s Review Chairman’s Review | About Us
CHAIRMAN’S REVIEW

Kegalle Plantations PLC A n n u a l R e p o r t 2 0 1 6 - 1 7
10 About Us | Chairman’s Review
Unfavorable weather conditions and sluggish globaleconomic recovery caused the economy to grow ata slower rate of 4.4 per cent in 2016 in real terms, incomparison to 4.8 per cent in the previous year. TheGovernment’srevenuebasedfiscalconsolidationprocess,helpedcontaintheoverallbudgetdeficitatthetargetedlevelof5.4percentofGDP in2016 incomparison tothedeficitof7.6percentinthepreviousyear.ThetradedeficitasapercentageofGDPexpandedto11.2percentin2016comparedto10.4percentin2015.SriLanka’sgross reserveassetpositiondeclined toUSdollars 6.0billion,asatend2016.Therupeedepreciatedagainstallmajorcurrenciesexceptthepoundsterlingin2016.AnoveralldepreciationoftherupeeagainsttheUSdollarby3.83percentin2016
INDUSTRY REVIEW
TEA
Teaproductionin2016witnessedasubstantialdeclineduetobothsupplyanddemandsidefactors.Theprolongeddrought in tea growing areas during early 2016, thechangesinweatherpatternswithovercastconditionsinmid-2016andtheseveredroughtconditioninlate2016hadanegativeeffectonteaproduction.Reductions intheapplicationoffertilizerandweedicidesmayalsohavecontributedtothisdecline.Totalteaproductionin2016declinedby11percentto292.6millionkilogramsfrom328.8millionkilograms in2015.Thedemandsidewasaffectedby,lowglobalcommoditypricesandthedeclineinoilandgas revenuesofkey tea importingcountriesspeciallyinthe1sthalfoftheyear.
The prices of high, medium and low grown teasat the Colombo Tea Auction (CTA) were above thecorrespondingpricesrecordedin2015.Accordingly,theaveragepriceof teaat theCTA increasedby17.8percenttoRs.473.15perkilogramin2016,fromRs.401.46perkilogramrecordedinthepreviousyear.Thehighestyear-on-yearincreaseinaverageteapricesatCTAwasrecordedformediumgrowntea(17.6percent),followedby lowgrown tea (17.4 per cent) andhighgrown tea(16.5percent).
RUBBER
Rubber production at 79.1 million kilograms in 2016declinedby10.7percenttorecordthelowestproductionvolumereported in thepast50years.Thiswasmainlydue to reductionof the extent under tapping and thenumberoftappingdaysinresponsetothelowerpricesmainly in the smallholder sector.
YPHincreasedby3.9percentto851kgin2016,mainlydue to the reduction of the extent under tapping inmarginallands.Domesticconsumptionofrubberintheindustrial sector, which has stagnated during the lastfewyears, increasedmarginally to reach69millionkg,
accounting for 87.2 per cent of the domestic rubberproduction.
Naturalrubberexportsdeclinedby55.8percentto16.2millionkgandthecostofproductionofrubberincreasedby5.9percent toRs.180.00perkg in2016.PricesattheColomboRubberAuctiondecreasedduringtheyearas a result of a slowdown in global demandowing tohighinventoriesinmajorconsumingcountries,includingChinaandJapan,andthesubduedglobalpricescausedmainlybylowinternationalcrudeoilprices.TheaveragepriceofRibbedSmokedSheet1(RSS1)atRs.239.28perkgattheColomboRubberAuctionin2016witnesseda3.6percentdeclineovertheaveragepricerecordedin2015.
Thepriceoflatexrubberalsodecreasedby13.0percenttoRs.262.31perkgduringtheyear.Theaveragepriceofnaturalrubberperkgdeclinedby30.1percenttoUSdollars1.6in2016fromUSdollars2.2recordedin2015.Asa resultof thedecrease inprices, theprofitmarginavailabletotheproducerremainedlow,makingrubbercultivationlessattractive.
COCONUT
Coconut production in 2016, was 3,011 million nuts,declined by 1.5 per cent over the output recordedlast year mainly due to the low rainfall received inmain coconut growing areas during the year in linewith increased industrial demand, desicated coconut productionwhichreporteda17.1percentcontractionin2015,reboundedwithagrowthof22.3percentwhichisthehighestquantumofdesiccatedcoconutproductioninthelastdecade.Coconutoilproductiondecreasedby7.5per cent, causedmainlyby the increasedpricesoffreshnuts.Desiccatedcoconutexportsof72,000metrictons,recordedasignificantgrowthof56.7percentfromthe previous year. High domestic prices for coconut,amidstthelowproductionwerepartlyattributedtotheincreaseddemandfromcoconutsbased industriesandhighexportprices. In2016, theaverage retail priceoffreshnutsdecreasedby8.3percenttoRs.45.82pernut.
COMPANY PERFORMANCE
During the year under review, the Company recordedrevenue of Rs. 2.29 billion; indicating a 18% per centincrease over the previous year reported value of Rs.1.93billion.Thus,profitafter taxofKegallePlantationsPLC increased by 114% to record Rs. 217 mn fromRs. 101 mn in the corresponding period. Total assetsof the Company were Rs. 6.404 bn in 2017 while theShareholdersfundwasRs.2.6bn.TheCompanyincurredacapitalexpenditureofRs.176mnduringtheyear,outofwhichRs.173mnwasallocatedforfielddevelopment.Outofthefielddevelopmentexpenses,Rs.139mnandRs.23mnwereincurredrespectivelyforrubberandtea.
The Company’s operations in the rubber industryachievedagrowthof12percentin2016/17althoughthe
Chairman’s Review Chairman’s Review | About Us

Kegalle Plantations PLC A n n u a l R e p o r t 2 0 1 6 - 1 7
11Chairman’s Review Chairman’s Review | About Us
nationalrubberproductionoftheeconomyrecordedthelowestproductionvolumereportedinthelast50years.In2016/17,theCompany’sproductionofrubberhasrisento 3.74 million kilograms from 3.35 million kilogramsin2015/16.Ontheotherhand,theNSAofrubberhasrisentoRs.276.34byjust1percentfromRs.274.04in2016.Undersuchcircumstances,financialperformanceoftherubbersectorstoodatabetterpositioncomparedto the previous year. Furthermore, the revenue fromrubber segment has increased to Rs. 1.06 billion fromRs.942mnpreviousyearanditisa12percentincreasecomparedtothepreviousyear.BasicallythegrossprofitsfromrubbersectorhaveincreasedtoRs.32mnfromRs.10mnpreviousyearwhich isalmost two fold increaseoverthecorrespondingperiod.
Duringtheyearunderreview,theCompany’sproductionof teadroppedby8.8percent to2.2millionkilogramcompared to 2.4 mn in 2015/16. This drop of theproduction was mainly driven by adverse weatherconditionprevailedduringtheyear2016/17.Despitethedeclineintheproductionoftea,theCompanywasabletoachieveagrossprofitfromtheteabusinesswhichwasa gross loss in the last year. The increase in the grossprofit was mainly driven by the increase in the NSAcomparedtothepreviousyear.
Financial resultsof the coconutplantationexperiencedadownturn in the yearunder review. TheCompany’sproductionofcoconutshasdroppedto1.47mnnutsin2016/17comparisonto1.56mnnutsin2015/16whichisareductionof6percent.Ontheotherhand,theNSAofcoconutoperationhasdeclinedtoRs.24.11in2016/17fromRs.31.95in2015/16.
SUSTAINABILITY
Duringtheensuingyear,theCompanyintendstoallocatecircaRs.400mnforthefielddevelopment.OutofwhichRs. 200mnwill be allocated to the field developmentin the rubber sector. As a whole, these resources areexpected to be allocated to the field development of1,130haincludingthepreliminarywork,replantingandupkeepoftheseareas.
Investment in oil palm sector can be considered as asignificant step taken inorder toachievea sustainabledevelopment from theperspectiveof the shareholdersoftheCompany.
PRODUCTIVITY & VALUE ADDITION
TheCompanyexpectstoincreaseTeayieldto1,171kg/hacomparedtotheactualyieldof808kg/hain2016/17.On the other hand Company expects to enhance theyieldof rubber up to 1,059 kg/hawhich is 6 per centabovetheactualyieldof998kg/haduringtheyear.Alsowith respect to the Company’s responsibility towardsthe community and the environment, the Companyhas initiated a bio latex project which focuses on thereductionofusageofchemical fertilizer.TheCompany
intends to enhance the quality of the rubber throughtechnologicalandagriculturalenhancements.
FUTURE OUTLOOK
The Sri Lankan economy is expected to grow at amoderaterateofaround5percentin2017amidsttheadverseimpactofunfavorableweatherconditions,andisexpectedtoimprovegraduallythereaftertorecordanannualgrowth rateof7percentby2020.Theprivatesector is expected to play a key role in achieving thishighergrowthmomentumbyexploitingpotentialgrowthopportunitiesintheeconomyandtheexternalmarkets.Foreigninvestorsarealsoexpectedtocontributetowardsahigherlevelofinvestmentwithparticularemphasisonservicerelatedactivitiesandexportorientedindustries.Monetary policy measures are expected to maintaininflationataround5.0percent,onaverage.Evenifglobalmarket improved teaprices are continued, rigidities inthedomestic supplyandascendingcostofproductioncouldmakeitchallengingforthecountry’steaindustrytoreapthefullbenefitofglobalmarketimprovement.
ACKNOWLEDGMENTS
IwouldliketoextendmysinceregratitudetotheBoardofDirectors,ActingCEO&ManagementTeamfortheircommitmentanddedicationdisplayedduringourjourneytowardssuccessamidstchallengingenvironment.Allthehardworkandeffortofemployeesacrossall levelsarealso greatly acknowledged. I would like to thank ourvalued customers, suppliers and business partners fortheir continued loyalty and support.
MysinceregratitudealsogoesouttoallourShareholders,fortheirtrustandsupportplacedinourCompany.Ihopeyouwillcontinuetobeourlongtermpartners,whowilljoinusintakingourCompanytothenextlevel.
Dr.SenaYaddehigeChairman
31May2017Colombo

Kegalle Plantations PLC A n n u a l R e p o r t 2 0 1 6 - 1 7
12
OUR ESTATES
TotalusageofCompanybuildingsis3,507,810sq.ft.
EstateName
Planting District Location
Cultivated Area ( hectare ) Elevation Production - kg/nut’000 Factory Details Certification No. of
Rubber Tea Coconut Others TotalTotalArea
( hectare )(Metres)
EstateName Rubber Tea Coconut Crop
Manufactured Factory Type RatedKg’000/pa
ISO 9001 : 2015
Rubber
EU & USDA-NOP
Organic Rubber
ISO 22000 : 2005 Tea
Ethical Tea Partnership
Execu-tives Staff Workers
Allagolla Badulla Udapussellawa - 174.78 - 39.61 214.39 243.75 1311 Allagolla - 131 - - - - - - - - 1 14 217
Ambadeniya Kegalle Aranayake 418.09 0.75 20.60 33.79 473.23 583.25 244-355 Ambadeniya 325 - 31 - - - - - - - 2 17 319
Atale Kegalle Atale 908.51 - 28.66 39.06 976.23 1,150.36 119-154 Atale 413 - 83 Rubber SoleCrepe 950 √ - - - 3 34 458
Doteloya Kegalle Dolosbage - 187.10 - 271.65 458.75 572.64 825-955 Doteloya - 542 - Tea Leafy/Orthodox 1,394 - - √ √ 2 16 309
Eadella Kurunegala Polgahawela 336.24 - 325.59 20.88 682.71 801.79 91-122 Eadella 264 - 1,082 - - - - - - - 3 17 262
Etana Kegalle Warakapola 373.80 - 1.82 11.21 386.83 483.26 76-244 Etana 315 - 4 Rubber Scrap 228 - √ - - 1 14 308
Gampaha Badulla Udapussellawa - 213.52 - 62.13 275.65 348.99 1538 Gampaha - 316 - Tea Leafy/Orthodox 929 - - √ √ 2 20 352
Hathbawa Kegalle Rambukkana 259.22 - - 5.00 264.22 477.79 122-244 Hathbawa 234 - - - - - - - - - 1 14 169
Higgoda Kegalle Undugoda 222.29 - - 0.80 223.09 302.23 146-411 Higgoda 181 - - - - - - √ - - 1 9 155
Kirklees Badulla Udapussellawa - 246.75 - 93.96 340.71 480.70 1446 Kirklees - 442 - Tea Rotorvane 1,239 - - √ √ 2 21 326
Luckyland Badulla Udapussellawa - 369.98 - 74.88 444.86 488.75 1500 Luckyland - 302 - Tea DualManufacture 1,355 - - √ √ 3 35 577
Madeniya Kegalle Warakapola 394.22 - - 56.09 450.31 551.92 80-229 Madeniya 227 - - - - - - √ - - 1 13 332
Pallegama Kegalle Niyadurupola 564.82 - 1.88 127.28 693.98 863.91 90-200 Pallegama 370 - 7 Rubber SoleCrepe 800 √ - - - 3 22 372
Parambe Kegalle Undugoda 513.66 30.02 - 40.00 583.68 795.41 122-274 Parambe 337 22 - Rubber Crepe 636 √ - - - 2 24 388
Udapola Kurunegala Polgahawela 346.29 - 37.36 14.57 398.22 577.78 107-195 Udapola 230 - 142 - - - - √ - - 2 18 236
Weniwella Kegalle Alawwa 408.13 - 13.19 95.88 517.20 709.90 152-183 Weniwella 233 - 29 - - - - - - - 2 14 215
Yataderiya Kegalle Undugoda 137.78 121.00 25.90 7.35 292.03 324.30 244-290 Yataderiya 89 409 93 Tea Leafy/Orthodox 1,239 - - √ √ 2 21 425
UdapolaCLP Kurunegala Polgahawela - - - - - - - UdapolaCLP 524 - - Rubber CentrifugedLatex 5,000 √ √ - - 5 13 45
4,883.05 1,343.90 455.00 994.14 7,676.09 9,756.73 3,742 2,165 1,471 38 336 5,465
About Us | Our Estates Our Estates | About Us
Parambe
Higgoda
Etana
Madeniya
Pallegama
Yataderiya
Atale
Udapola / Udapola CLP
Eadella
Hathbawa
Weniwella
Ambadeniya
Doteloya
Gampaha
Allagolla
Kirklees
Luckyland
BadullaNuwaraEliya
Kegalle
Kurunegala
KurunegalaDistrict
BadullaDistrict
KegalleDistrict
Our Estates - Locations

Kegalle Plantations PLC A n n u a l R e p o r t 2 0 1 6 - 1 7
13
Land Base Extent %
Rubber 4,883.05 50%
Tea 1,343.90 14.0%
Coconut 455.00 5%
Other Crops 976.82 10%
Forestry 17.32 0.0%
Others 2,080.64 21.0%
Our Estates - Land Base / Utilisation
TOTAL EXTENT9,756.73Hectares
EstateName
Planting District Location
Cultivated Area ( hectare ) Elevation Production - kg/nut’000 Factory Details Certification No. of
Rubber Tea Coconut Others TotalTotalArea
( hectare )(Metres)
EstateName Rubber Tea Coconut Crop
Manufactured Factory Type RatedKg’000/pa
ISO 9001 : 2015
Rubber
EU & USDA-NOP
Organic Rubber
ISO 22000 : 2005 Tea
Ethical Tea Partnership
Execu-tives Staff Workers
Allagolla Badulla Udapussellawa - 174.78 - 39.61 214.39 243.75 1311 Allagolla - 131 - - - - - - - - 1 14 217
Ambadeniya Kegalle Aranayake 418.09 0.75 20.60 33.79 473.23 583.25 244-355 Ambadeniya 325 - 31 - - - - - - - 2 17 319
Atale Kegalle Atale 908.51 - 28.66 39.06 976.23 1,150.36 119-154 Atale 413 - 83 Rubber SoleCrepe 950 √ - - - 3 34 458
Doteloya Kegalle Dolosbage - 187.10 - 271.65 458.75 572.64 825-955 Doteloya - 542 - Tea Leafy/Orthodox 1,394 - - √ √ 2 16 309
Eadella Kurunegala Polgahawela 336.24 - 325.59 20.88 682.71 801.79 91-122 Eadella 264 - 1,082 - - - - - - - 3 17 262
Etana Kegalle Warakapola 373.80 - 1.82 11.21 386.83 483.26 76-244 Etana 315 - 4 Rubber Scrap 228 - √ - - 1 14 308
Gampaha Badulla Udapussellawa - 213.52 - 62.13 275.65 348.99 1538 Gampaha - 316 - Tea Leafy/Orthodox 929 - - √ √ 2 20 352
Hathbawa Kegalle Rambukkana 259.22 - - 5.00 264.22 477.79 122-244 Hathbawa 234 - - - - - - - - - 1 14 169
Higgoda Kegalle Undugoda 222.29 - - 0.80 223.09 302.23 146-411 Higgoda 181 - - - - - - √ - - 1 9 155
Kirklees Badulla Udapussellawa - 246.75 - 93.96 340.71 480.70 1446 Kirklees - 442 - Tea Rotorvane 1,239 - - √ √ 2 21 326
Luckyland Badulla Udapussellawa - 369.98 - 74.88 444.86 488.75 1500 Luckyland - 302 - Tea DualManufacture 1,355 - - √ √ 3 35 577
Madeniya Kegalle Warakapola 394.22 - - 56.09 450.31 551.92 80-229 Madeniya 227 - - - - - - √ - - 1 13 332
Pallegama Kegalle Niyadurupola 564.82 - 1.88 127.28 693.98 863.91 90-200 Pallegama 370 - 7 Rubber SoleCrepe 800 √ - - - 3 22 372
Parambe Kegalle Undugoda 513.66 30.02 - 40.00 583.68 795.41 122-274 Parambe 337 22 - Rubber Crepe 636 √ - - - 2 24 388
Udapola Kurunegala Polgahawela 346.29 - 37.36 14.57 398.22 577.78 107-195 Udapola 230 - 142 - - - - √ - - 2 18 236
Weniwella Kegalle Alawwa 408.13 - 13.19 95.88 517.20 709.90 152-183 Weniwella 233 - 29 - - - - - - - 2 14 215
Yataderiya Kegalle Undugoda 137.78 121.00 25.90 7.35 292.03 324.30 244-290 Yataderiya 89 409 93 Tea Leafy/Orthodox 1,239 - - √ √ 2 21 425
UdapolaCLP Kurunegala Polgahawela - - - - - - - UdapolaCLP 524 - - Rubber CentrifugedLatex 5,000 √ √ - - 5 13 45
4,883.05 1,343.90 455.00 994.14 7,676.09 9,756.73 3,742 2,165 1,471 38 336 5,465
Our Estates | About Us

Kegalle Plantations PLC A n n u a l R e p o r t 2 0 1 6 - 1 7
14
FINANCIAL CALENDAR
Annual Report Published Meetings Date
2005/06
2006/07
2007/08
2008/09
2009/10
2010/11
2011/12
2012/13
2013/14
2014/15
2015/16
2016/17
29May2006
21May2007
15May2008
09June2009
19May2010
27May2011
29May2012
30May2013
30May2014
28May2015
31May2016
31 May 2017
13thAnnualGeneralMeeting
14thAnnualGeneralMeeting
15thAnnualGeneralMeeting
16thAnnualGeneralMeeting
17thAnnualGeneralMeeting
18thAnnualGeneralMeeting
19thAnnualGeneralMeeting
20thAnnualGeneralMeeting
21stAnnualGeneralMeeting
22ndAnnualGeneralMeeting
23rdAnnualGeneralMeeting
24th Annual General Meeting
29June2006
29June2007
23July2008
28July2009
29June2010
30June2011
29June2012
28June2013
30June2014
30June2015
30June2016
30 June 2017
11 August 2016
09 November 2016
13 February 2017
13 August 2015
10 November 2015
11 February 2016
26 May 201630 May 2017
16 March 2017 (Rs. 5/- per Share)
10 July 2015 (Rs. 45/- per Share)
1stQuarterReports
2ndQuarterReports
3rdQuarterReports
4thQuarterReports
InterimDividend
2016/17 2015/16
About Us | Financial Calendar
Man
agem
ent
Dis
cuss
ion
& A
nal
ysis

Kegalle Plantations PLC A n n u a l R e p o r t 2 0 1 6 - 1 7
15
Man
agem
ent
Dis
cuss
ion
& A
nal
ysis
Planting Material / Nurseries
Selected high quality seeds are imported fromthe world most reputed Palm Seeds Supplier. The germinated seeds are airfreighted undercareful packing conditions, meeting all quarantinerequirementsofSriLanka.
Theseseedsare initiallyplanted in insectproofnethousesfor06months.ThisstageiscalledtheStageIPalmOilNursery.Theselectedvigorousseedlingsare then transferred to the Stage IINurseries, andtheseplantsarewellcaredintheStageIInurseriesforaperiodof6–9monthsbeforetheygettransferredtotheFieldforplanting.
Although the financial outflows are greater at thisstageruthlesscullingofundesiredplantsaredone,asthisisthemostimportantexerciseofracinghighproductiveOilPalmCultivation.
Tra
nsf
orm
ing
fro
m t
he T
rad
itio
n...
Continuedinpageno.35...
Operating Environment .............................. 16Segmental Information............................... 20Review of Operations ................................ 22Financial Review ........................................ 29
Contents

Kegalle Plantations PLC A n n u a l R e p o r t 2 0 1 6 - 1 7
16
The operations of theCompany are often affected bytheuncontrollableexternalenvironmentfactorsinbothfavorableandunfavorablemanners.Economicgrowth,Exchange rates, Unemployment levels, Fiscal andMonetarypolicychangesarethemorecrucialfactors.
The global environmental factors have also hinderedthe operations of the Company for a greater extent.Speciallytheglobaldemandandsupplyconditionsseemtobeadversesincepastfewyears.Theexcesssupplyofnaturalrubberandthelowdemandfrommajorexportdestinationshasresultedinalowpricefornaturalrubberintheglobalmarket.
Current government activities achieve advantageousopportunities in Euro zone and it will generate futureeconomic developments. In the local market contexttheproductionissloweddownduetolowmarketpricesandlowdemand.Thissituationhasresultedinreducingnationalproductionduringtheyearunderreview.
Sri Lankan Economic Performance
Economic Growth
Economic Growth over Last Five Years
Sector\Year 2016 2015 2014 2013 2012AgriculturalIndustrialService
(4.2%)6.7%4.2%
4.8%2.1%5.7%
4.6%4.7%4.8%
3.2%4.1%3.8%
3.9%9.0%11.2%
TotalEconomy 4.4% 4.8% 5.0% 3.4% 9.1%
The recordedGDPgrowth in2016 is4.4%and this is areductioningrowthratewhenitiscomparedtothe2015figurewhichwas4.8%.AtthesametimeGDPpercapitadecreasedfromUSD3,843toUSD3,835.Specially,therateofgrowthintheAgriculturesectorhasbecomenegativein 2016. Due to the declined production in Agriculturesector and the grown production in other sectors, thecontributionofAgriculturesectortotheGDPhasbecomevery low. It isadeclinefrom7.8%to7.1%comparedto2015.
In2016therubberproductionhasfacedadeclineforthefifth consecutive year recording the lowest productionvolume in thepast50years.Therubberproduction in2016is79.1millionKilograms.Thisisa10.7%reductioncompared to the 2015 figure, which was 88.6 millionKilograms. The low demand and price for rubber inglobalmarkethas resulted in thedecliningproductionfromsmallholders.Inadditiontothat,thereductionofbothextentundertappingandthetappingdayshasalsoled to the declined production.
OPERATING ENVIRONMENT
The tea production in 2016 witnessed a substantialdeclinedue toboth supply anddemand factors. Thetea production has declined by 11% to 292.6 millionkilogramsfrom328.8millionkilogramsduringtheperiodunderreview.Bothsupplyanddemandconditionshaveimpactedtothedeclinedproduction.Onthesupplyside,drought in teagrowingareas inmid2016hasmajorlyresultedinthereductionofteasupply.Onthedemandside,thedemandarisesfrommajorexportdestinationsseemtobedecliningthroughthepastfewyears.
The supply of coconut and coconut products hasexperiencedaslowdownduringtheyearunderreview.Coconutproductionin2016,estimatedat3,011millionnuts, declined by 1.5%over the output recorded. Thedecrease in coconut production was mainly due to low rainfallreceivedinmaincoconutgrowingareasin2016.
Despite the fact that Agriculture sector has shown adecline in production, fishing sector alone has shown agrowthof1.6%.Theindustrialsectorhasgrownatarateof 6.7% through the year 2016.Mining, Electricity, Gas,WaterandConstructionsectorsalonehaveshowngrowthratesover10%whilemanufacturingsectorhasgrownat1.7%.Duetotheinclinedrateofgrowth,thecontributionof industrial sector toGDPhas also increased to 26.8%from26.2% through the year under review.Mining andConstructions sectors have gained positive changes inproductionwipingoutthenegativechangesrecordedin2015.TheServicesectorhasgrownatarateof4.2%butthecontributiontoGDPhasreducedduetothedeclinedgrowthratecomparedto5.7%in2015.Thecontributionof Service sector towards the GDP is 22.9% and it was23.1%in2015.Publicadministrationanddefenseactivitiesrecordedanacceleratedgrowthwhileallothersubsectorsunder service sector have recorded a declined growthrate.
Sector Wise Contribution to the Total GDP
Agricultural Sector7%
Industrial Sector27%Service Sector
56%
Taxes Less Subsidies10%
Sector Wise Contribution to the Total GDP
Interest, Inflation & Exchange Rate
Management Discussion & Analysis | Operating Environment Operating Environment | Management Discussion & Analysis

Kegalle Plantations PLC A n n u a l R e p o r t 2 0 1 6 - 1 7
17
The National Consumer Price Index (NCPI 2013=100)was 112 in January 2016 and increased to 118 inDecember2016.TheNCPI,whichdeclinedfromJanuary2016toMarch2016,increasedfromApril2016toJune2016.However,itdeclinedinJuly2016andAugust2016,afterwhichitreverseditstrendandmovedonagradualincreasingpath.NCIPmajorlyfollowedthemovementsofthepricesoffoodcategory.
Rupee liquidity in the money market, which was insurplus during the first quarter of 2016, turned to adeficit thereafter. Average Weighted call money ratehas increasedthroughtheyear2016.MonthlyaverageAWCMRwas6.4%atthebeginningandithasincreasedto8.4%through2016
Year 2016 2015 2014 2013 2012
InflationInterestRate(AWPR)
4.0%11.7%
2.8%7.5%
3.3%6.3%
6.9%10.1%
7.6%14.4%
SriLankancurrencyhasdepreciatedsubstantiallyin2016whencomparedtocurrenciesofmajorbuyers.SriLankanRupeehasdepreciatedagainstUSDollarby3.8%astheexchangeratewas recorded1USD=149LKRat theendoftheyear.AtthesametimevalueofLKRhasincreasedcompared to GBP. It has become 1GBP=186LKR atthe end of the year and it was 1GBP=215LKR at thebeginning.
LKR Against Major Buyers’ Currencies
Currency Rupee Depreciated/ Appreciated
Amount As %
USDEUROJapanese yenPoundsterling
DepreciatedDepreciatedDepreciatedAppreciated
(3.79%)(0.59%)(9.01%)13.70%
LKR Against Our Major Competitors’ Currencies
Currency Rupee Depreciated/ Appreciated
Amount As %
IndianRupeePakistanRupeeKenyanSchillingThailandBahtChineseYuan
DepreciatedDepreciatedDepreciatedDepreciatedAppreciated
(0.75%)(3.62%)(5.20%)(3.84%)3.66%
Global Economic Performance
Global economic performance has been affected to agreaterextentbyJuneduetoU.K.voteinfavorofleavingtheEuropeanUnion(Brexit)andweaker-than-expectedgrowth intheUnitedStates.Thesedevelopmentshavecreated further downward pressure on global interestrates, as monetary policy is now expected to extend.
Although themarket reaction to the Brexit shock wasreassuringly orderly, the ultimate impact remains veryunclear,asthefateofinstitutionalandtradearrangementsbetweentheUnitedKingdomandtheEuropeanUnionisuncertain.Financialmarketsentimenttowardemergingmarket economies has improved with expectations oflower interest rates in advanced economies, reducedconcern about China’s near-term prospects followingpolicy support to growth, and some firming ofcommodity prices. But prospects differ sharply acrosscountriesandregions,withAsiaingeneralandIndiainparticularshowingrobustgrowthandsub-SaharanAfricaexperiencingasharpslowdown.Inadvancedeconomies,a subdued outlook subject to sizable uncertainty anddownsiderisksmayfuelfurtherpoliticaldiscontent,withanti-integrationpolicyplatformsgainingmore traction.Severalemergingmarketanddevelopingeconomiesstillfacedauntingpolicy challenges in adjusting toweakercommodityprices.Thesegrimprospectsmaketheneedforabroad-basedpolicyresponsetoraisegrowthandmanagevulnerabilitiesmoreurgentthanever.
Economic Growth of 5 Major Economies
Country 2016 2015
USAChinaEuropeanUnionIndiaRussia
1.6%6.7%1.8%7.1%(3.0%)
2.5%6.9%1.5%7.3%(3.8%)
Government Policies
The government is planning to improve productivity,valueadditionandcompetivenessofteaindustrywhileconcentratingonexpansiontonontraditionalcultivationareas and improving productivity through promotinggood agricultural practices. As a powerful stakeholderwhoisholdingtheownershipofthelandonwhichtheCompanyholdsitsprosperity,thegovernmentcontinuedthe subsidy schemes for rubber, tea and coconut newplanting and replanting to encourage the traditionalexportproductions.Theshorttermworkingcapitalloanschemesprovidedfortheregisteredteafactoryholdershelped them to muddle through short term financialdifficulties. New technological practices of improvedtapping knives, powermats, single day drying systemandnew,highyieldingclonesinthesmallholdersectorhavebeenintroducedtoimprovetheproductquality.
Nevertheless,removingfertilizersubsidiesandimposingsubsidiesonlyonpaddycultivationnegativelyaffectedthePlantationIndustryasawholeandincreasedthecostof production.
Employment & Wages
TwomajoractsontheNationalMinimumwageandthe
Operating Environment | Management Discussion & Analysis

Kegalle Plantations PLC A n n u a l R e p o r t 2 0 1 6 - 1 7
18
Budgetary Relief Allowance which were introduced bythegovernmentledtoanincreaseinthenominalwagesof employees in private sector. Nominal wages of theemployees in the formal private sector, as measuredby theminimumwagerate indexofemployeeswhosewagesaregovernedbytheWagesBoardsTrades(1978Dec=100),increasedmarginally.Further,nominalwagesof informal private sector employees, asmeasured bytheInformalPrivateSectorWageRateIndex(2012=100)increasedmodestly in 2016. Consequently, real wagesof employees in the formal private sector declined in2016,as thepercentage increase in thenominalwagerate index remained insignificant during the period,whileemployees inthe informalprivatesectorenjoyeda real wage growth in 2016. With the expansion ofthe construction sector, an increase of the wages inmasonryandcarpentry tradeswasobservedowing totheincreaseddemandforlaborinthesesectors.Ontheotherhand,thegrowthinwagespartlysuggestshigherlevelsofbargainingpowerofworkersinrelatedactivities,duetotheshortageoflaborsupplywithrequiredquality.
The labor force, which is defined as the economicallyactivepopulationaged15 years andabove, increasedby1.2percentduring2016to8.311million,from8.214millionin2015.However,theLFPR,whichistheratioofthelaborforcetothehouseholdpopulationaged15yearsandabove,remainedatthesamelevelof53.8percentin2016asin2015.Thiswasduetothesimilarincreaseinboththehouseholdpopulationaged15yearsandthelaborforce.Thegendergapinlaborforceparticipationcontinued to remain in favor of the male labor forcein theCountry.The femaleLFPRwas recordedas35.9percentduringtheyear2016,whilethemaleLFPRwas75.1 per cent during the same period, which reflectsthatthewillingnessof thefemalestoparticipate inthelabor force is less thanhalf of thatofmales.Over theyears,thefemaleLFPRhasshownsignsofonlymarginalimprovements,leadingtoasteadylevelofoverallLFPRofaround54percent.ThereasonsforlowfemaleLFPRarelackofprovisionsforflexibleworkinghoursorwork-from-homefacilities,lackofregularizedandproperchildcarefacilities,ahighershareofhouseholdresponsibilitiesbeingshoulderedbyfemalesandlimitationsonmobilityto and from work due to difficulties associated withpublic transport. However, the remuneration levels ofworkersinTea,Rubbersectorarenotshowingagenderinequality.
17.09%20.19%
27.75%
39.92%
12.08%
5.%
10.%
15.%
20.%
25.%
30.%
35.%
40.%
45.%
100
200
300
400
500
600
700
800
900
2016 2013 2011 2009 2007
Rate per worker Increase
Change of Wage per Employee
Rs. p
er D
ay
805.
00
687.
50
572.
00
447.
75
320.
00
The labor wages in the plantation sector is decidedby the Collective Agreements with Trade unions. Theindustrial activities, suchas “Go slow”, asking forwage
hikeshinderedthenationalteaproductionlastyear.Theincrease of wage rates directly affects the profitabilitythroughincreaseincostofsalesandalsoaffectsthecashflowoftheCompany.
Technology
Thetechnologicalchangesintheinternationalplantationindustry lead the Organizations to be cost effective,efficientandqualityproductionprocess.ThesechangeshavenotimpactedheavilyontheSriLankanplantationsector due to less likely hood to changing behaviorand, dominantly, the high level of labor power overthe plantation sector. Resulting through these the SriLankan Plantation Companies still use the technologyimplementedincolonialera.Hencetheothercountrieswho use new technology have the competitiveadvantageovertheSriLankanproductsintermsofcosteffectiveness.
Weather Conditions
Since theplantation sectoraffixedwith theagriculturalViabilityofPlantationscontributemainlyonsupplyanddemand factors. In this context the supplyof tea cropdeclinedduetoprolongeddroughtinteagrowingareasduringearly2016withovercastconditions in themid-yearandtheseveredroughtconditionscontinuedduringendyearhinderedtheproduction.Onthedemandfactorthefeverdemandgloballyduetolowcommoditypricesandthedeclineintheoilandgasrevenuesinthekeyteaimportingcountriesadverselyaffectedthepricesfortea.Rubber crop declined to 79.1 Mn; Kilos, which is thelowestproductionreportedinthelast50years,duetoadecreaseinextentundertappingandthenumberoftappingdays.
In the localmarket thepricesof tea increased in2016by18%toRs.473.15perkiloasagainstRS.401.46perkilorecordedintheyear2015.Accordingthegreenleafpricesof thesmallholders increasedtoRs.68.53 fromRs.58.80.Therubberpricesdeclinedduetothepoordemand, globally, owing to high inventories in majorconsumingcountriesinclusiveofChinaandJapan.
OurCompanyproduced2.165MnKilosofteaasagainst2.375MnKilospreviousseason.ThedropwasduetotheinconsistentweatherpatternsprevailedespeciallyintheUvaRegion.Thecontinuousdroughtthatprolongedforaperiodofoverfivemonthswasthemaincontributor.In addition the overcast conditions, the high daytemperatureandblowingmadefurtherdamagetotheharvestofcrop.
In the rubber sector the production for the year was3.742 Kilos as against 3.353 Mn kilos in the previousseason, despite the loss of tapping days due to tradeunionand “goslow”action takenby theworkersonademandforhigherwages.
Management Discussion & Analysis | Operating Environment Operating Environment | Management Discussion & Analysis

Kegalle Plantations PLC A n n u a l R e p o r t 2 0 1 6 - 1 7
19
RubberpricesadvantageouslyascendedduringthesecondhalfoftheseasonthereforetheCompanywasabletorecordanNSAofRs.276.34duringtheyearasagainstRs.274.04lastyear.
Outlook
ThegovernmentexpectstosustainarealGDPgrowthof5percentin2017.Thefuturegrowthplanswillbeinitiatedthroughimprovementsofinvestorsentimentsandnewpolicyinitiativestoincreaseprivatesectorparticipationinallmajorsectorsintheeconomyviainvestorfriendlyenvironments.
WiththeadverseeffectofthestructuraltransitionoftheSriLankaneconomy,itisexpectedtoachieveandsustainhighgrowthtrajectoryinthemediumtermanditwillopenseveralopportunitiestoupliftthestandardofliving.
Inthemediumterm, inflation isexpectedtobemaintainedwithinthedesiredrangeof3-5percentonaverage,byappropriatelyadjustingmonetarypolicyinstruments,particularlymaintainingbroadliquidmoneymarket,highexchangerateflexibilityandpublicmonetaryconcentration.
Rubber Crop Vs Rainfall
0
200
400
600
800
1000
1200
0
50
100
150
200
250
300
350
400
450
500
Rain
fall
(mm
)
Rain
fall
(mm
)
Rain
fall
(mm
)
Rain
fall
(mm
)
-
50
100
150
200
250
300
350
400
450
-
20
40
60
80
100
120
140
160
180
200
-
200
400
600
800
1,000
1,200
1,400
1,600
1,800
2,000
-
10
20
30
40
50
60
70
-
200
400
600
800
1,000
1,200
1,400
-
5
10
15
20
25
30
35
40
45
50
Crop Rainfall
Crop Rainfall
Crop Rainfall
Crop Rainfall
Crop
(kg
'000)
Crop
(kg
'000)
Crop
(kg
'000)
Crop
(kg
'000)
TeaCrop Vs Rainfall - Udapussellawa Region
TeaCrop Vs Rainfall - Yataderiya & Parambe EstatesTea
Crop Vs Rainfall - Doteloya Estate
Operating Environment | Management Discussion & Analysis

Kegalle Plantations PLC A n n u a l R e p o r t 2 0 1 6 - 1 7
20
SEGMENTAL INFORMATION
Tea MixAs a Percentage
Cultivated ExtentAs a Percentage
Rubber - 70%
Tea - 18%
Coconut - 6%
Others - 6%
High Grown - 55%
Low Grown - 20%
Medium Grown - 25%
Centrifuged Latex - 54%
Skim & Scrap - 16%
Sole Crepe - 6%
Latex Crepe - 24%
Rubber MixAs a Percentage
TurnoverAs a Percentage
Rubber Tea Coconut Others
20% 40% 60% 80% 100%
16/17
15/16
Land Leased Assets Tangible Assets
Biological Assets Investments Stocks
Receivables & Others
Segmental AssetAs a Percentage
Utilization of ResourcesAs a Percentage
Rubber - 30%
Tea - 15%
Others Crops - 3%
Unallocated - 52%
Rubber Mix - 2016/17 Vs 2015/16
2016/17
Sole Crepe - 6%
Latex Crepe - 24%
Centrifuged Latex - 54%
Skim & Scrap - 16%
2015/16
Sole Crepe - 10%
Latex Crepe - 22%
Centrifuged Latex - 51%
Skim & Scrap - 17%
46
49
45
45
2
2
7
4
20% 40% 60% 80% 100%
16/17
15/16
2
2
1
1
4
5
33
32
49
52
4
4
6
4
6%
24%
54%
16%
10%
22%
51%
17% 2015/16
Management Discussion & Analysis | Segmental Information Segmental Information | Management Discussion & Analysis

Kegalle Plantations PLC A n n u a l R e p o r t 2 0 1 6 - 1 7
21
RUBBER2016/17 2015/16 2014/15 2013/14 2012/13 2011/12 2010/11 2009/10
Production - kg'000 3,742 3,353 3,534 4,016 4,076 4,155 4,082 4,578NSA - Rs./kg 276.34 274.04 291.26 353.16 415.14 459.76 481.15 279.12COP - Rs./kg 248.13 249.26 261.23 254.21 257.27 247.47 207.24 177.47Yield - kg/ha 998 872 883 1,011 977 1,016 936 976RevenueExtent - ha 3,224 3,489 3,535 3,591 3,653 3,764 3,798 3,971
TEAPRODUCTION - Kg '000 2016/17 2015/16 2014/15 2013/14 2012/13 2011/12 2010/11 2009/10
Uva
1,191 1,286 1,074 1,143 1,065 1,364 1,428 1,109Medium 542 583 523 600 549 652 630 634Low 431 505 496 500 548 614 715 736
NSA - Rs./Kg 2016/17 2015/16 2014/15 2013/14 2012/13 2011/12 2010/11 2009/10
Uva
460.53 365.93 381.53 380.19 361.39 282.39 307.23 324.06Medium 467.95 356.95 413.35 436.38 383.36 311.66 341.69 361.08Low 482.48 373.23 416.60 427.58 375.62 323.62 356.75 368.73
COP - Rs./Kg 2016/17 2015/16 2014/15 2013/14 2012/13 2011/12 2010/11 2009/10
Uva
457.05 409.88 449.37 415.00 405.49 353.47 289.30 316.82Medium 408.53 360.25 368.09 374.81 329.34 291.77 285.17 287.61Low 440.56 381.36 401.52 400.23 371.36 299.73 303.27 302.14
YIELD - Kg/ha 2016/17 2015/16 2014/15 2013/14 2012/13 2011/12 2010/11 2009/10
Uva
677 806 858 1,021 840 1,023 1,126 952Medium 1,356 1,265 1,582 1,652 1,690 1,746 1,573 1,413Low 1,001 1,068 1,178 1,204 1,337 1,445 1,396 1,255
REVENUE EXTENT - ha 2016/17 2015/16 2014/15 2013/14 2012/13 2011/12 2010/11 2009/10
Uva 967 952 952 952 951 946 956 972Medium 178 177 173 173 173 174 184 189Low 148 150 149 149 148 148 149 157
COCONUT2016/17 2015/16 2014/15 2013/14 2012/13 2011/12 2010/11 2009/10
Production - nut'000 1,471 1,559 1,549 1,596 1,713 1,731 1,413 1,572NSA - Rs./nut 24.11 31.95 31.71 32.62 23.31 26.78 26.45 17.99COP - Rs./nut 16.57 14.69 15.15 13.16 13.23 15.17 13.37 10.62Yield - nut/ha 3,241 3,569 3,379 3,652 4,205 4,268 3,582 3,986RevenueExtent - ha 454 437 437 437 408 406 394 394
Segmental Information | Management Discussion & Analysis
Kegalle Plantations PLC A n n u a l R e p o r t 2 0 1 6 - 1 7
22
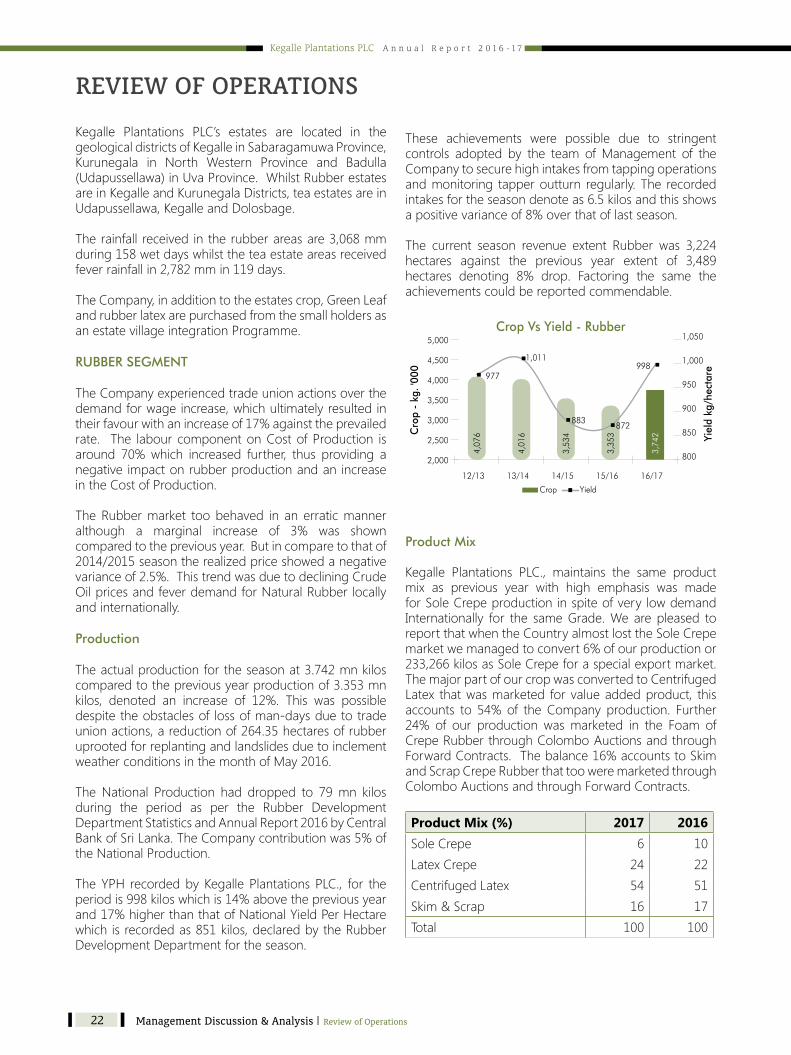
These achievements were possible due to stringentcontrols adopted by the team ofManagement of theCompanytosecurehighintakesfromtappingoperationsandmonitoring tapperoutturn regularly.The recordedintakesfortheseasondenoteas6.5kilosandthisshowsapositivevarianceof8%overthatoflastseason.
The current season revenue extent Rubber was 3,224hectares against the previous year extent of 3,489hectares denoting 8% drop. Factoring the same theachievementscouldbereportedcommendable.
Crop Vs Yield - Rubber
Crop Yield
Yiel
d kg
/hec
tare
Cro
p -
kg. '
000
4,07
6
4,01
6
3,53
4
3,35
3
3,74
2
977
1,011
883 872
998
800
850
900
950
1,000
1,050
2,000
2,500
3,000
3,500
4,000
4,500
5,000
12/13 13/14 14/15 15/16 16/17
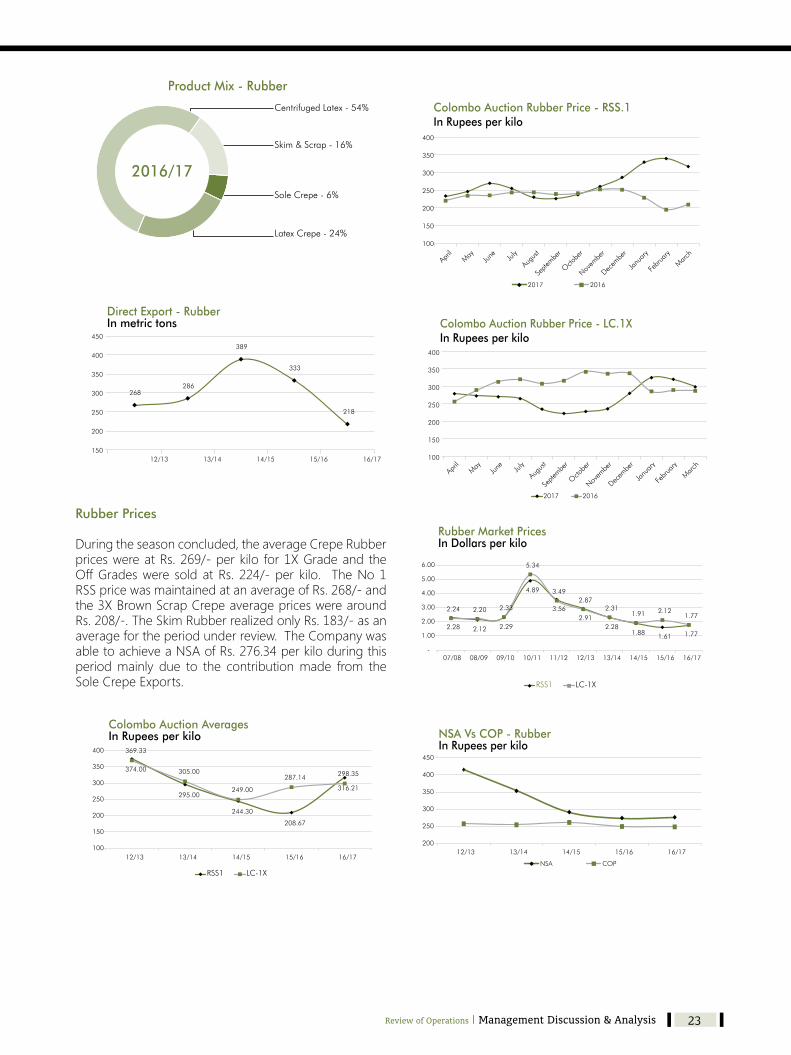
Product Mix
Kegalle Plantations PLC., maintains the same productmix as previous year with high emphasis was madeforSoleCrepeproductioninspiteofverylowdemandInternationally for the sameGrade.Wearepleased toreportthatwhentheCountryalmostlosttheSoleCrepemarketwemanagedtoconvert6%ofourproductionor233,266kilosasSoleCrepeforaspecialexportmarket.ThemajorpartofourcropwasconvertedtoCentrifugedLatex thatwasmarketed forvalueaddedproduct, thisaccounts to 54% of the Company production. Further24% of our production wasmarketed in the Foam ofCrepeRubberthroughColomboAuctionsandthroughForwardContracts.Thebalance16%accountstoSkimandScrapCrepeRubberthattooweremarketedthroughColomboAuctionsandthroughForwardContracts.
Product Mix (%) 2017 2016SoleCrepe 6 10LatexCrepe 24 22CentrifugedLatex 54 51Skim&Scrap 16 17Total 100 100
Kegalle Plantations PLC’s estates are located in thegeologicaldistrictsofKegalleinSabaragamuwaProvince,Kurunegala in North Western Province and Badulla(Udapussellawa)inUvaProvince.WhilstRubberestatesareinKegalleandKurunegalaDistricts,teaestatesareinUdapussellawa,KegalleandDolosbage. Therainfall received intherubberareasare3,068mmduring158wetdayswhilsttheteaestateareasreceivedfeverrainfallin2,782mmin119days.
TheCompany,inadditiontotheestatescrop,GreenLeafandrubberlatexarepurchasedfromthesmallholdersasanestatevillageintegrationProgramme.
RUBBER SEGMENT
TheCompanyexperiencedtradeunionactionsoverthedemandforwageincrease,whichultimatelyresultedintheirfavourwithanincreaseof17%againsttheprevailedrate. The labour componentonCostofProduction isaround 70%which increased further, thus providing anegative impactonrubberproductionandanincreaseintheCostofProduction.
TheRubbermarket toobehaved in an erraticmanneralthough a marginal increase of 3% was showncomparedtothepreviousyear.Butincomparetothatof2014/2015seasontherealizedpriceshowedanegativevarianceof2.5%.ThistrendwasduetodecliningCrudeOilpricesandfeverdemandforNaturalRubberlocallyand internationally.
Production
Theactualproductionfortheseasonat3.742mnkiloscomparedtothepreviousyearproductionof3.353mnkilos, denoted an increase of 12%. This was possibledespitetheobstaclesof lossofman-daysduetotradeunionactions,areductionof264.35hectaresofrubberuprootedforreplantingandlandslidesduetoinclementweatherconditionsinthemonthofMay2016.
The National Production had dropped to 79mn kilosduring the period as per the Rubber DevelopmentDepartmentStatisticsandAnnualReport2016byCentralBankofSriLanka.TheCompanycontributionwas5%ofthe National Production.
TheYPH recordedbyKegalle PlantationsPLC., for theperiodis998kiloswhichis14%abovethepreviousyearand17%higherthanthatofNationalYieldPerHectarewhichisrecordedas851kilos,declaredbytheRubberDevelopmentDepartmentfortheseason.
REVIEW OF OPERATIONS
Management Discussion & Analysis | Review of Operations Review of Operations | Management Discussion & Analysis
Kegalle Plantations PLC A n n u a l R e p o r t 2 0 1 6 - 1 7
23
Sole Crepe - 6%
Latex Crepe - 24%
Centrifuged Latex - 54%
Skim & Scrap - 16%
Product Mix - Rubber
2016/17
Direct Export - RubberIn metric tons
268286
389
333
218
150
200
250
300
350
400
450
12/13 13/14 14/15 15/16 16/17
Rubber Prices
Duringtheseasonconcluded,theaverageCrepeRubberpriceswereatRs.269/-perkilo for1XGradeandtheOffGradeswere soldatRs. 224/-per kilo. TheNo1RSSpricewasmaintainedatanaverageofRs.268/-andthe3XBrownScrapCrepeaveragepriceswerearoundRs.208/-.TheSkimRubberrealizedonlyRs.183/-asanaveragefortheperiodunderreview.TheCompanywasabletoachieveaNSAofRs.276.34perkiloduringthisperiodmainly due to the contributionmade from theSoleCrepeExports.
Colombo Auction AveragesIn Rupees per kilo
RSS1 LC-1X
374.00
295.00
244.30
208.67
316.21
369.33
305.00
249.00
287.14 298.35
100
150
200
250
300
350
400
12/13 13/14 14/15 15/16 16/17
100
150
200
250
300
350
400
Colombo Auction Rubber Price - RSS.1In Rupees per kilo
2017 2016
Colombo Auction Rubber Price - LC.1XIn Rupees per kilo
2017 2016
100
150
200
250
300
350
400
RSS1 LC-1X
2.28 2.12 2.29
4.89
3.56 2.91
2.28 1.88 1.61 1.77
2.24 2.20 2.33
5.34
3.49 2.87
2.31 1.91 2.12
1.77
-
1.00
2.00
3.00
4.00
5.00
6.00
07/08 08/09 09/10 10/11 11/12 12/13 13/14 14/15 15/16 16/17
Rubber Market PricesIn Dollars per kilo
NSA Vs COP - RubberIn Rupees per kilo
NSA COP
200
250
300
350
400
450
12/13 13/14 14/15 15/16 16/17
Review of Operations | Management Discussion & Analysis

Kegalle Plantations PLC A n n u a l R e p o r t 2 0 1 6 - 1 7
24
Profitability
The Gross Profit recorded was Rs. 32 mn from whichthis sector recorded an increase of 198% against lastseason Rs. 10.8mn gross profit, despite the obstaclesof 17% increase in Labour Wages, material cost andthestringentcontrolsmadeinoutgoingsandimprovedtappingintakes.
607
322
36 11 32 -
100
200
300
400
500
600
700
12/13 13/14 14/15 15/16 16/17
Gross Profit - Rubber - Rupees Mn
Gross Profit - Rubber
Market Outlook
WithcontinuousCrudeOilpricesfluctuatingnegativelyandincreasedproductionofNaturalRubberinSouthEast Asian Countries’ the prices are not expected tomoveupward in the near future. However, if Chinesemarketsreopened,therewillbeapossibilitythemarkettoimprovetowardsthe3rdand4thquarterofthenewseason.IftheSriLankanGovernmentbroughtrestrictionsonimportationofNaturalRubbertoBOI industries,animprovementinpriceslocallycouldalsobeseen.
AlthoughtheDollarhasfluctuatedpositivelyduringtheseasonsimilarimprovementwasnotseenintheRubbermarket. However, the Dollar appreciation has affectedourinputrawmaterialssuchasFertilizerandProcessingChemicals.
TEA SEGMENT
With changing of world affairs and political scenariosassociated with low production in Kenya. Sri Lankanteasonceagaingotanedgeovertheotherstosustainthe industries. Thepricesrealized in the3rdand04thquarter for all elevations of tea were attractive andencouraging.Thepriceimpactwasrelatedtocurrencyfluctuationandsupplyanddemand.Although,SriLankawas historically producing over 329 mn kilos annuallywas dropped down to 293 mn kilos denoting a 11%dropinproduction.Allelevationsteaproductionswerereportedbelowcorrespondingperiodoflastseasonandtheprevious.Weatherfactorwasthemajorimpactand
the trade union actions associated with the demand for increasedLabourWagestoohadanimpact.
The01stand2ndquartersof theyear teapriceswerestagnating inparwith thepreviousprices.However,atthebeginningof3rdquarterprice improvements inallGradesofteasofallelevationswererecordedintheteamarket.Theproductionofteaat2.165mnkilosrecordeda drop of 9% against the crop of 2.375mn kilos lastseason. This impactwasdue to inconsistentweatherpatternsprevailedintheteagrowingareas,especiallyintheUvaSector.Thecontinuousdroughtthatprolongedforaperiodof5½monthsfromMay2016toOctober2016 was the main contributory factor. In additionthe high day temperatures and blowingmade furtherdestructiontocropharvest.HowevertheMidGrownteaestatewasabletoincreasethecropintakewithaYPHof1,356asagainsttheYPHof1,265lastseason.
Yiel
d kg
/hec
tare
Cro
p -
kg. '
000
Crop Yield
Crop Vs Yield - Tea
2,16
2
2,24
3
2,09
4
2,37
5
2,16
5
1,012
1,129
993
901
808
600
700
800
900
1,000
1,100
1,200
1,500
1,700
1,900
2,100
2,300
2,500
12/13 13/14 14/15 15/16 16/17
Product Mix
Outof the total productionof theCompany theHighGrownUvaaccountsfor55%andMidGrown25%andthebalance20%comesfromtheLowGrownregion.Thedemandingeneralintheteamarketwasforleafygradesfor which the estates were equipped. However thepricesofsmallleafgradesmovedupwardsunexpectedlyin the second half and therefore the estates graduallyincreasedthecategoryupto30%.
Product Mix - Tea 2017 2016
UvaHigh 55% 54%WesternMedium 25% 25%LowGrown 20% 21%Total 100% 100%
Management Discussion & Analysis | Review of Operations Review of Operations | Management Discussion & Analysis

Kegalle Plantations PLC A n n u a l R e p o r t 2 0 1 6 - 1 7
25
Medium Grown - 25%
Low Grown - 20%
High Grown - 55%
Product Mix - Tea
2016/17
Western Medium - 25%
Low Grown - 21%
Uva High - 54%
Product Mix - Tea
2015/16
Market Outlook
Theteamarketasexplainedearlier,behaveddifferentlyinthe01stand2ndhalfoftheyear.Thedemandduringthe 01st six months was only for selected well-madeteasofLowGrown.However,duringthesecondhalfthistrendchangedcompletelyandthepricesofallelevationsmovedupnarrowingthepricedifferencesbetweenwell-madeandaveragemadeteas.
Thechangeinthemarkettrendwasduetoshortsupplyof tea with a drop in production in Kenya, appreciation ofDollarandtheincreaseddemandintheMiddleEastbuyingCountriesforSriLankanteasfollowingthestablepoliticalenvironmentinthosecountries.
Top Prices
It is pleasing to report that our estates were able toachieveTopPriceson301occasionsduringtheseasonoutofwhichKirkleesEstaterecordedtwoall-timerecordsforDustNo.1Grades.KirkleesEstatehasrecordedthemost denoting 137 times and the second highest isGampahaEstatewith97toppricesandLuckylandEstateachieving41TopPrices.
Tea Market PricesIn Dollars per kilo
High Medium Low
2.23 2.41
2.86 2.81
2.27
2.84 2.91 2.91
2.42
3.17
2.34 2.48
3.03 2.95
2.42
2.87
3.09 2.97
2.52
3.09 2.95
3.29
3.52 3.55
2.87
3.30
3.70 3.51
2.85
3.58
1.50
2.00
2.50
3.00
3.50
4.00
07/08 08/09 09/10 10/11 11/12 12/13 13/14 14/15 15/16 16/17
In Rupees per kiloColombo Auction Tea Price - Low Orthodox
2017 2016
200
300
400
500
600
700
Apr May Jun Jul Aug Sep Oct Nov Dec Jan Feb Mar
In Rupees per kiloColombo Auction Tea Price - Uva High
2017 2016
200
300
400
500
600
700
Apr May Jun Jul Aug Sep Oct Nov Dec Jan Feb Mar
Colombo Auction Tea Price - Western MediumIn Rupees per kilo
2017 2016
200
300
400
500
600
700
Apr May Jun Jul Aug Sep Oct Nov Dec Jan Feb Mar
Review of Operations | Management Discussion & Analysis
Kegalle Plantations PLC A n n u a l R e p o r t 2 0 1 6 - 1 7
26
NSA Vs COP - TeaIn Rupees per kg
NSA COP
300
350
400
450
500
12/13 13/14 14/15 15/16 16/17
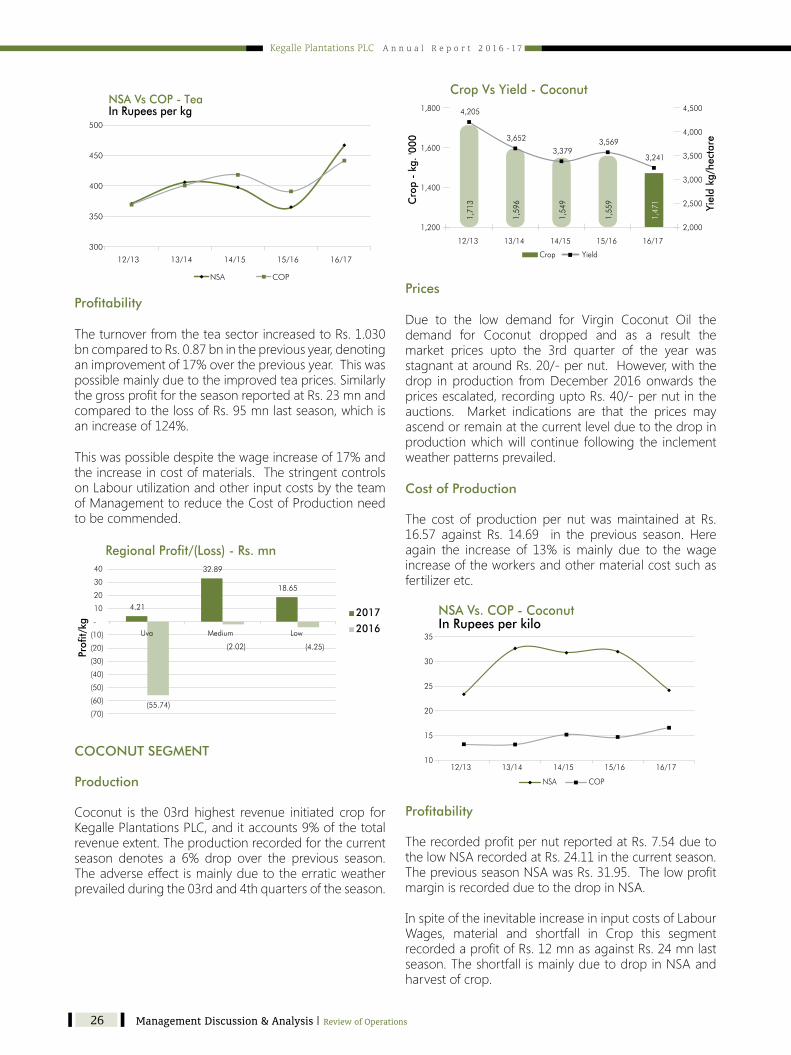
Profitability
TheturnoverfromtheteasectorincreasedtoRs.1.030bncomparedtoRs.0.87bninthepreviousyear,denotinganimprovementof17%overthepreviousyear.Thiswaspossiblemainlyduetotheimprovedteaprices.SimilarlythegrossprofitfortheseasonreportedatRs.23mnandcomparedtothelossofRs.95mnlastseason,whichisanincreaseof124%.
Thiswaspossibledespitethewageincreaseof17%andtheincreaseincostofmaterials.ThestringentcontrolsonLabourutilizationandotherinputcostsbytheteamofManagementtoreducetheCostofProductionneedtobecommended.
4.21
32.89
18.65
(55.74)
(2.02) (4.25)
(70)
(60)
(50)
(40)
(30)
(20)
(10)
-
10
20
30
40
Uva Medium Low
2017
2016
Prof
it/kg
Regional Profit/(Loss) - Rs. mn
COCONUT SEGMENT
Production
Coconut is the 03rd highest revenue initiated crop forKegallePlantationsPLC,anditaccounts9%ofthetotalrevenueextent.Theproductionrecordedforthecurrentseason denotes a 6% drop over the previous season.Theadverseeffect ismainlyduetotheerraticweatherprevailedduringthe03rdand4thquartersoftheseason.
Yiel
d kg
/hec
tare
Cro
p -
kg. '
000
1,71
3
1,59
6
1,54
9
1,55
9
1,47
1
4,205
3,652
3,379 3,569
3,241
2,000
2,500
3,000
3,500
4,000
4,500
1,200
1,400
1,600
1,800
12/13 13/14 14/15 15/16 16/17
Crop Yield
Crop Vs Yield - Coconut
Prices
Due to the low demand for Virgin Coconut Oil thedemand for Coconut dropped and as a result themarket prices upto the 3rd quarter of the year wasstagnantataroundRs.20/-pernut.However,withthedrop inproduction fromDecember 2016onwards thepricesescalated,recordinguptoRs.40/-pernutintheauctions. Market indications are that the prices mayascendorremainatthecurrentlevelduetothedropinproductionwhichwill continue following the inclementweatherpatternsprevailed.
Cost of Production
The cost of production per nut wasmaintained at Rs.16.57 against Rs. 14.69 in the previous season. Hereagain the increase of 13% ismainly due to the wageincreaseoftheworkersandothermaterialcostsuchasfertilizeretc.
10
15
20
25
30
35
12/13 13/14 14/15 15/16 16/17
NSA COP
NSA Vs. COP - CoconutIn Rupees per kilo
Profitability
TherecordedprofitpernutreportedatRs.7.54duetothelowNSArecordedatRs.24.11inthecurrentseason.ThepreviousseasonNSAwasRs.31.95.ThelowprofitmarginisrecordedduetothedropinNSA.
InspiteoftheinevitableincreaseininputcostsofLabourWages, material and shortfall in Crop this segmentrecordedaprofitofRs.12mnasagainstRs.24mnlastseason.Theshortfall ismainlyduetodropinNSAandharvestofcrop.
Management Discussion & Analysis | Review of Operations Review of Operations | Management Discussion & Analysis
Kegalle Plantations PLC A n n u a l R e p o r t 2 0 1 6 - 1 7
27
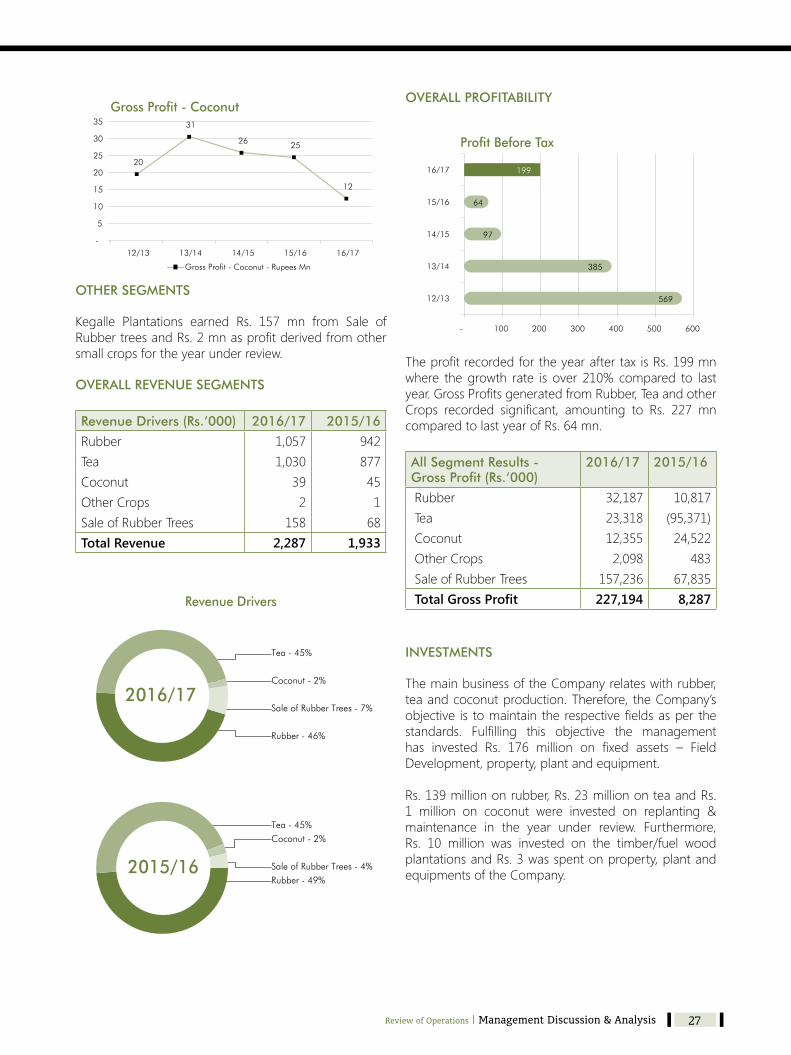
OVERALL PROFITABILITY
569
385
97
64
199
- 100 200 300 400 500 600
12/13
13/14
14/15
15/16
16/17
Profit Before Tax
Profit Before Tax
TheprofitrecordedfortheyearaftertaxisRs.199mnwhere thegrowth rate is over 210% compared to lastyear.GrossProfitsgeneratedfromRubber,TeaandotherCrops recorded significant, amounting to Rs. 227 mncomparedtolastyearofRs.64mn.
All Segment Results - Gross Profit (Rs.‘000)
2016/17 2015/16
Rubber 32,187 10,817Tea 23,318 (95,371)Coconut 12,355 24,522OtherCrops 2,098 483SaleofRubberTrees 157,236 67,835 Total Gross Profit 227,194 8,287
INVESTMENTS
ThemainbusinessoftheCompanyrelateswithrubber,teaandcoconutproduction.Therefore, theCompany’sobjective is tomaintain therespectivefieldsasper thestandards. Fulfilling this objective the managementhas invested Rs. 176 million on fixed assets – FieldDevelopment,property,plantandequipment.
Rs.139milliononrubber,Rs.23milliononteaandRs.1 million on coconut were invested on replanting &maintenance in the year under review. Furthermore,Rs. 10 million was invested on the timber/fuel woodplantationsandRs.3wasspentonproperty,plantandequipmentsoftheCompany.
Gross Profit - Coconut
20
31
26 25
12
-
5
10
15
20
25
30
35
12/13 13/14 14/15 15/16 16/17
Gross Profit - Coconut - Rupees Mn
OTHER SEGMENTS
Kegalle Plantations earned Rs. 157 mn from Sale ofRubbertreesandRs.2mnasprofitderivedfromothersmallcropsfortheyearunderreview.
OVERALL REVENUE SEGMENTS
Revenue Drivers (Rs.‘000) 2016/17 2015/16
Rubber 1,057 942Tea 1,030 877Coconut 39 45OtherCrops 2 1SaleofRubberTrees 158 68Total Revenue 2,287 1,933
Tea - 45%
Coconut - 2%
Sale of Rubber Trees - 7%
Rubber - 46%
Revenue Drivers
2016/17
Tea - 45%Coconut - 2%
Sale of Rubber Trees - 4%Rubber - 49%
2015/16
Review of Operations | Management Discussion & Analysis

Kegalle Plantations PLC A n n u a l R e p o r t 2 0 1 6 - 1 7
28
Sector 16/17 15/16 14/15
Rubber 139 175 206
Tea 23 32 43
Coconut 1 1 0.25
Timber/FuelWood 10 11 14
PPE 3 2 43
Total Capex 176 221 306
The Company’ investments on field developments &othercapitalexpenditureoverlastdecadeareasfollows,asdepictedinthegraph.
Capital Expenditure In Rupees Million
119
166183
200
250 254
294306
221
176
100
150
200
250
300
350
07/0
8
08/0
9
09/1
0
10/1
1
11/1
2
12/1
3
13/1
4
14/1
5
15/1
6
16/1
7
Comparative Economic Indicators
For the Year Ended 31 December 2015 2016 Change %
Gross Domestic ProductGDPatCurrentMarketPrice Rs.bn 10,952 11,839 8.1
RealGDPGrowth % 4.8 4.4 (8.3)GDPDeflator % 0.8 3.6 350.0
Agriculture CropsRubber Rs.mn 14,218 10,643 (25.1)Tea(GreenLeaves) Rs.mn 75,746 82,321 8.7GrowingofOleaginousFruits(Coconut/KingCoconut/OilPalm) Rs.mn 95,573 70,860 (25.9)
Agriculture Production Index (2007-2010 = 100)AgricultureCropsRubber 66.0 59.0 (10.6)Tea 105.5 93.9 (11.0)Coconut 107.9 106.3 (1.5)
Agriculture Crops Rubber Production kgmn 88.6 79.1 (10.7)TotalExtent ha’000 137 136 (0.7)ExtentunderTapping ha’000 108 93 (13.9)CostofProduction Rs./kg 170.00 180.00 5.9AveragePrice
ColomboAuction-RSS1 Rs./kg 248.17 239.28 (3.6)Export-FOB Rs./kg 342.03 294.33 (13.9)
Replanting hectares 621 591 (4.8)NewPlanting hectares 769 592 (23.0)
Valueaddedas%ofGDP 0.3 0.3 -
Tea Production kgmn 328.8 292.6 (11.0)TotalExtent ha’000 203 203 -ExtentBearing ha’000 195 195 -CostofProduction Rs./kg 458.84 469.24 2.3AveragePrice
ColomboAuction Rs./kg 401.46 473.15 17.9Export-FOB Rs./kg 593.08 639.88 7.9
Replanting hectares 1,226 1,044 (14.8)NewPlanting hectares 495 115 (76.8)
Valueaddedas%ofGDP 0.8 0.7 (12.5)
Coconut Production nuts mn 3,056 3,011 (1.5)TotalExtent ha’000 455 466 2.4CostofProduction Rs./nut 16.39 16.70 1.9AveragePrice
Producer Price Rs./nut 33.88 32.13 (5.2)Export-FOBh Rs./nut 54.54 41.16 (24.5)
Replanting/UnderPlanting hectares 4,919 5,000 1.6NewPlanting hectares 14,408 10,996 (23.7)
Valueaddedas%ofGDP 0.8 0.7 (12.5) Source: Annual Report 2016 - Central Bank of Sri Lanka
Financial Review | Management Discussion & AnalysisManagement Discussion & Analysis | Review of Operations

Kegalle Plantations PLC A n n u a l R e p o r t 2 0 1 6 - 1 7
29Financial Review | Management Discussion & Analysis
The reporting financial year for Kegalle PlantationsPLChasbeenachallengingyearduetomanyadverseinfluences from the external environment. Prolongeddroughtconditioninfluencedtheagriculturaloperationsof the Company. Despite such adverse impacts theCompanywasabletoachieveasoundfinancialstandinginthefinancialyear2016/2017.
Rubber
The national rubber production declined for the fifthconsecutive year and reported the lowest productionvolume reported in the last 50 years. Annual rubberproduction declined by 10.7 per cent. Such a declinein the rubber industrywas experiencedmainly due tothereductionofboththeextentundertappingandthenumberoftappingdays,inresponsetothelowerpricesmainly in the smallholder sector.
Despite thedeclining trend in the rubber industry, theCompany recorded a production of 3,742metric tonsof rubber during the yearwith a 12per cent increasein comparison to3,353metric tons in 2015/2016. Thenetsalesaverage(NSA)ofrubberalsoexperiencedanincrease from Rs. 274.04 in 2015/2016 to Rs. 276.34in2016/2017speakingto1percent increaseover thecorrespondingyear.Thecombinedeffectoftheincreasedproductionvolumeandthe improvedNSAcontributedtowardsthetotalrevenueofRs.1.05billionin2016/2017,recordingan increaseof12percent incomparison totherevenueofRs.942millionin2015/2016.
Even though the adverseweather condition exerted anegativeimpacttowardstheoperationsoftheCompany,theCompanywasabletomaintainitscostofproductionatarelativelyconstantlevel.Duringtheyearunderreview,costofproductionperkgwasRs.248.86comparedtoRs.249.26in2015/2016.
Accordingly, theCompanywas able to record a grossprofit of Rs. 32.2 million from rubber in 2016/2017indicatinga two fold increaseagainst thegrossprofitof Rs. 10.8 million in 2015/2016. Such a considerableimprovementintherubbersectorwasmainlydrivenbythe increasedproduction, increasedNSAand relativelylow cost of production.
Tea
The national tea production witnessed a substantialdecline in 2016/2017 for the consecutive third yearduetobothsupplyanddemandsidefactors.Total teaproductioninthisyeardeclinedby11.0percentto292.6millionkilogramsfrom328.8millionkilogramlastyear.
FINANCIAL REVIEW
The operations of the tea business of KPL unfoldeda pattern which was in conformity with the national behavioroftheteaindustry.Accordingly,theproductionof tea declined to 2,165 metric tons in 2016/2017indicatingareductionof9percentincomparisontotheproductionof2,375metrictonsreportedin2015/2016.Suchadeclinehasmainlybeendrivenby theadverseweatherconditionssuchasprolongeddroughts.Inspiteofsuchadeclineintheproductionofteain2016/2017,the Company recorded an increase in revenue incomparisontotheyear2015/2016duetotheincreaseofNSA fromRs. 365.23 in2015/2016 toRs. 466.81 in2016/2017,speakingtoa27.8percentincreasebetweenthese two time periods.
The cost of production at Rs. 441.56 per kg recordeda 13 per cent increase compared to previous year ofRs.391.05perkg.Eventhoughthecostofproductionincreased compared to the last year, the Companywasable to recordagrossprofitofRs. 23.3million in2016/2017 in comparison to thegross lossofRs. 95.4million reported in 2015/2016. In spite of unfavorableconditionsprevailed in the industry, theCompanywasin a position to achieve a sound financial standing in2016/2017relatingtotheteabusiness.
Operating Highlights
2016/17Rs.’000
2015/16Rs.’000
Variance Rs.’000
Variance %
Revenue 2,287,1611,933,063354,098 18%
CostofSales 2,059,9681,924,776135,192 7%
GrossProfit 227,193 8,287218,906 2,642%
NetProfit-Group 330,112 135,015195,097 145%
NetProfit-Company 217,263 101,330115,933 114%
Duringtheperiodunderreview,KPLrecordedgrossprofitof Rs. 227.2million speaking to over 20 fold increaseCompared to the gross profit of Rs. 8.3 mn reportedin2015/2016.Theproportionate increaseof18.32percent in the revenuehasmainly influenced inachievingsuchimprovedfinancialperformance.Inadditiontotheincreaseinrevenue,significantimprovementinmarginsduring relevant two financial periods also contributedtowards increase in the gross profit compared to thepreviousyear.
Asaresultoftheimprovedgrossprofit,thenetprofitoftheCompanyhasincreasedby114percentcomparedtothelastyear,andtheGroup’snetprofitalsoincreasedby145percentcomparedtothelastyear.

Kegalle Plantations PLC A n n u a l R e p o r t 2 0 1 6 - 1 7
30 Management Discussion & Analysis | Financial Review Financial Review | Management Discussion & Analysis
Revenue
Rubber - 46%Sale of Rubber Trees - 7%
Other Crops - 0%Coconut - 2%
Tea - 45% Revenue Composition
2016/17
Despite of various global and local challenges, theCompany was able to achieve combined revenue ofRs. 2.29 billion in 2016/2017 which indicates 18 percent increase incomparisonto therevenueofRs.1.93billionin2015/2016.Suchanincreasehasmainlybeendrivenbyincreaseinturnoverinthesegmentsofrubber,tea,othercropsandsaleofrubbertreewhichreportedproportionateincreasesof12percent,17percent,345percentand131percentrespectively.
Revenue Overlook
In Million Rupees
-
500
1,000
1,500
2,000
2,500
3,000
Reve
nue
-Rs
.mn
Years
2,5
88
2,4
14
2,0
24
1,9
33
2,2
87
12/13 13/14 14/15 15/16 16/17
Profitability
Grossprofitfortheyearindicatedanincreaseof2,642percentoverthepreviousyearasaresultoftheimprovedfinancial performance achieved in certain businesssegments incomparisontothepreviousyear.Specially,the teasegmentof theCompany’soperation recordedagrossprofitofRs.23.3million thisyearcomparedtoagrosslossofRs.95.4millionreportedinlastyear.Duetothe increases intherevenue inthesegmentsoftea,rubberandrubbertreessalealongwiththeincreasesingrossmarginscomparedtothepreviousyear,netprofitoftheCompanyreportedanincreaseof114percenttoreportRs.217millioncomparedtothepreviousyear.
ThefinanceincomewasRs.199millionwhichisa9percentdecreasecomparedtothepreviousyear.Thefinancecost has increased by 30 per cent compared to thepreviousyearmainlyduetotheutilizationofshorttermfacilitiesandthehigherlevelofinterestratesprevailedintheeconomyduringtheperiodunderreview.
Segmental Profit - 2017In Thousand Rupees
(120,000) (100,000) (80,000) (60,000) (40,000) (20,000)
- 20,000 40,000
Rubber Tea Coconut
Profit
Rs.'0
00
20162017
Segments
2,58
8
2,41
4
2,02
4
1,93
3
2,28
7
473
346
127 101
217
-
50
100
150
200
250
300
350
400
450
500
-
500
1,000
1,500
2,000
2,500
3,000
12/13 13/14 14/15 15/16 16/17
Net Cash Flow Operational Cash Flow
In Million RupeesRevenue Vs Profit After Tax
Assets Base
Theassetbaseof theCompanyhas increasedby0.72percentto6.404billionin2016/2017from6.358billionin2015/2016.Theincreaseinthenon-currentassetbasehasmainly driven the increase in the total asset base.Non-current assets of the Company has increased by3percent toRs.4.32billion fromRs.4.19billion.Thelargest portion of the non-current assets consists ofbearerbiologicalassetsrecordingRs.2.02billionwhichisa6percent increasecomparedtothe lastyearduetoinvestmentinfielddevelopmentactivitiesamountingtoRs.172.8millionwhich lead to increaseyieldof theCompanyinthefuture.
The current asset base of the Company declined toRs.2.09billionin2016/2017whichisareductionof4percentincomparisontoRs.2.17billionin2015/2016.

Kegalle Plantations PLC A n n u a l R e p o r t 2 0 1 6 - 1 7
31Financial Review | Management Discussion & Analysis
Composition of Assets
Current Assets33%
Leasehold PPE3%
Freehold PPE4%
Bearer Biological Assets31%
Consumable Biologicalassets2%
Financial Assets19%
Long Term Investments8%
2016/17
Current Assets
Short Term Investments - 68%
Cash and Bank Balances - 1%
Inventories - 13%
Trade and Other
Receivables - 14%
VAT Recoverable - 1%
ESC Recoverable - 1%
Amounts due from RelatedCompanies - 2%
2016/17
Net Assets per Share
During the year under review, net assets per shareincreased from Rs. 97.45 in 2015/2016 to Rs. 104.87in 2016/2017 which indicates an increase of 8 percentbetween these two timeperiods. The total assetsincreased by 0.72 per cent whereas total liabilitiesdecreasedby4%.Thishasledtoincreasethenetassetspershareduringtheyear2016/2017.
Debt Position
Total debt (Gross borrowings) of the Company hasdecreased by 6 per cent to Rs. 2,576million fromRs.2,728millionreportedintheprioryear.Despitethe22percentreduction innon-current liabilities, thecurrentliabilitiesincreasedby27percenttoRs.1,879million.
Total Assets Vs Net BorrowingsIn Million Rupees
Total Assets Net Borrowings
(1,000)
-
1,000
2,000
3,000
4,000
5,000
6,000
7,000
8,000
2013 2014 2015 2016 2017
Liquidity Position
Theworkingcapitalof theCompany recordedRs.210million speaking toa70per cent reduction comparedto last year amount of Rs. 692million.The increase incurrent liabilities by 27 per centwhile the decrease incurrentassetsby4percentcomparedtothepreviousyear contributed towards the decrease in the overallliquidityoftheCompanycomparedtolastyear.
Cash Flows
Net Operating Cash Flows
During the year under review, the Company hasexperienced a negative net operating cash flowof Rs.64millionwhichwasRs.49.6millionpositiveinlastyear.Accordingly,netoperatingcashflowshavedecreasedby229percentcomparedtolastyear.Eventhoughthenetoperatingcashflowsrecordeda229percentdrop,thecash flowsgenerated fromoperations havedecreasedonlyby15percentcomparedtolastyear.
Cash Generated After Investing and Financing Activities
TheCompanyhasrecordedacashandcashequivalentbalanceofRs.425millionasattheyearend.

Kegalle Plantations PLC A n n u a l R e p o r t 2 0 1 6 - 1 7
32
237
279
481
460 415
353
291 274 276
153 177
207
247 257 254 261 249 248
237
360
544
462
374
302
244
209
316
-
100
200
300
400
500
600
08/09 09/10 10/11 11/12 12/13 13/14 14/15 15/16 16/17
Rs/k
g
Net Sale Average Vs Cost of Production Vs RSS1 Price - Rubber -
NSA COP RSS1-Market
200
250
300
350
400
450
500
550
600
08/09 09/10 10/11 11/12 12/13 13/14 14/15 15/16 16/17
Rs/k
g
Net Sale Average Vs Cost of Production - Tea
NSA - Company COP - Company
Market Price - Uva High Market Price - Western Medium Market Price - Low Grown
19.31 17.99
26.45 26.78 23.31
32.62 31.71 31.95
24.11
10.93 10.62 13.37
15.17 13.23 13.16
15.15 14.69 16.57
25.00 25.44
29.60 22.89
33.04 32.30 33.64 33.88
32.13
-
5.00
10.00
15.00
20.00
25.00
30.00
35.00
40.00
08/09 09/10 10/11 11/12 12/13 13/14 14/15 15/16 16/17Rs
/nut
Net Sale Average Vs Cost of Production Vs CDA Market Price - Coconut
NSA COP CDA - Market Price
Management Discussion & Analysis | Financial Review Financial Review | Management Discussion & Analysis
Capital Expenditure
During the year, the Company has invested Rs. 173millioninthefielddevelopmentsinclusiveofupkeepofimmatureplantations.Duringtheyear,CompanyinvestedRs.139millionon218.2hectaresofrubberfields,Rs.23millionon13hectaresof teafieldsdevelopments.Theinvestments on factory developments and acquisitionsofproperty,plantandequipmentamounted toRs.3.2million.
Capital Expenditure In Rupees Million
119
166183
200
250 254
294306
221
176
100
150
200
250
300
350
07/0
8
08/0
9
09/1
0
10/1
1
11/1
2
12/1
3
13/1
4
14/1
5
15/1
6
16/1
7
KPL has financed the above investments mainlythroughcombinationofcashflowsfromoperationsandborrowings.
Total Debts Finance Cost Finance income
Total Debts Vs Finance Cost and Finance IncomeIn Million Rupees
1,10
8
2,33
1
2,39
6
2,72
8
2,57
6
142 179 177
198
258
166
230 228
183 199
-
500
1,000
1,500
2,000
2,500
3,000
-
50
100
150
200
250
300
12/13 13/14 14/15 15/16 16/17
Rs. M
nMarket Capitalization
ThemarketpriceoftheKPLsharestoodatRs.52/-pershare as at 31March 2017 against Rs. 50.70 per shareas of 31 March 2016. The market capitalization wasreportedtobeRs.1,300millionduringtheyearindicatingareductionof2.5percentcomparedtoRs.1,268millionreportedinthepreviousyear.
Market CapitalizationIn Million Rupees
2,80
0
2,62
5
2,14
5
1,26
8
1,30
0
-
500
1,000
1,500
2,000
2,500
3,000
12/13 13/14 14/15 15/16 16/17
Earnings per Share (EPS)
TheearningspersharerecordedatRs.8.69in2016/2017asagainstpreviousyearofRs.4.06.TheCompanyshareswere traded at Colombo Stock Exchange at a pricemultipleof5.98timesasof31March2017.
18.9
3
13.8
4
5.08
4.06
8.69
-2.004.006.008.00
10.0012.0014.0016.0018.0020.00
Earnings Per ShareIn Rupees per Share
12/13 13/14 14/15 15/16 16/17
7.50 13
.50
2.00 45
.00
5.00
0.00
5.00
10.00
15.00
20.00
25.00
30.00
35.00
40.00
45.00
50.00
11/12 13/14 14/15 15/16 16/17
Dividends Per ShareIn Rupees per Share
4
6
8
10
12
14
2,000
3,000
4,000
5,000
6,000
7,000
12/13 13/14 14/15 15/16 16/17
ROC
E %
Cap
ital E
mpl
oyed
Rs.
mn
ROCE Vs Capital Employed

Kegalle Plantations PLC A n n u a l R e p o r t 2 0 1 6 - 1 7
33
237
279
481
460 415
353
291 274 276
153 177
207
247 257 254 261 249 248
237
360
544
462
374
302
244
209
316
-
100
200
300
400
500
600
08/09 09/10 10/11 11/12 12/13 13/14 14/15 15/16 16/17
Rs/k
g
Net Sale Average Vs Cost of Production Vs RSS1 Price - Rubber -
NSA COP RSS1-Market
200
250
300
350
400
450
500
550
600
08/09 09/10 10/11 11/12 12/13 13/14 14/15 15/16 16/17
Rs/k
g
Net Sale Average Vs Cost of Production - Tea
NSA - Company COP - Company
Market Price - Uva High Market Price - Western Medium Market Price - Low Grown
19.31 17.99
26.45 26.78 23.31
32.62 31.71 31.95
24.11
10.93 10.62 13.37
15.17 13.23 13.16
15.15 14.69 16.57
25.00 25.44
29.60 22.89
33.04 32.30 33.64 33.88
32.13
-
5.00
10.00
15.00
20.00
25.00
30.00
35.00
40.00
08/09 09/10 10/11 11/12 12/13 13/14 14/15 15/16 16/17
Rs/n
ut
Net Sale Average Vs Cost of Production Vs CDA Market Price - Coconut
NSA COP CDA - Market Price
Financial Review | Management Discussion & Analysis

Kegalle Plantations PLC A n n u a l R e p o r t 2 0 1 6 - 1 7
34
PERFORMANCE MEASUREMENT Quarterly Performance TabulatedbelowisthequarterlyperformanceoftheCompany.
1st
Quarter2nd
Quarter3rd
Quarter4th
Quarter Total
Revenue Rs.‘000 510,121 563,487 493,061 720,492 2,287,162GrossProfit/(Loss) Rs.‘000 (15,937) 56,332 49,397 137,401 227,194ProfitBeforeInterest&Tax Rs.‘000 25,064 93,700 86,308 252,203 457,276Profit/(Loss)BeforeTax Rs.‘000 (35,811) 27,072 18,703 189,210 199,175Profit/(Loss)AfterTax Rs.‘000 (36,413) 26,271 17,950 209,455 217,263
Earnings/(Loss)PerShare Rs. (1.46) 1.05 0.72 8.38 8.69
NetAssetValuePerShare Rs. 98.16 99.21 99.92 104.87 104.87
LastTradedMarketPricePerShare Rs. 61.80 55.00 48.50 52.00 52.00
HighestMarketPricePerShare Rs. 72.50 61.50 58.00 60.00 72.50
LowestMarketPricePerShare Rs. 51.00 54.10 45.00 46.50 45.00
TotalAssets Rs.‘000 6,479,717 6,473,670 6,398,413 6,404,381 6,404,381
TotalEquity Rs.‘000 2,453,884 2,480,155 2,498,105 2,621,695 2,621,695
TotalDebt Rs.‘000 2,826,827 2,786,184 2,623,802 2,576,496 2,576,496
DebtEquityRatio % 54 53 51 50 50
Equity/AssetRatio % 38 38 39 41 41
PriceEarningsRatio Times (42.43) 52.34 67.55 6.21 5.98
Management Discussion & Analysis | Financial Review Financial Review | Management Discussion & Analysis
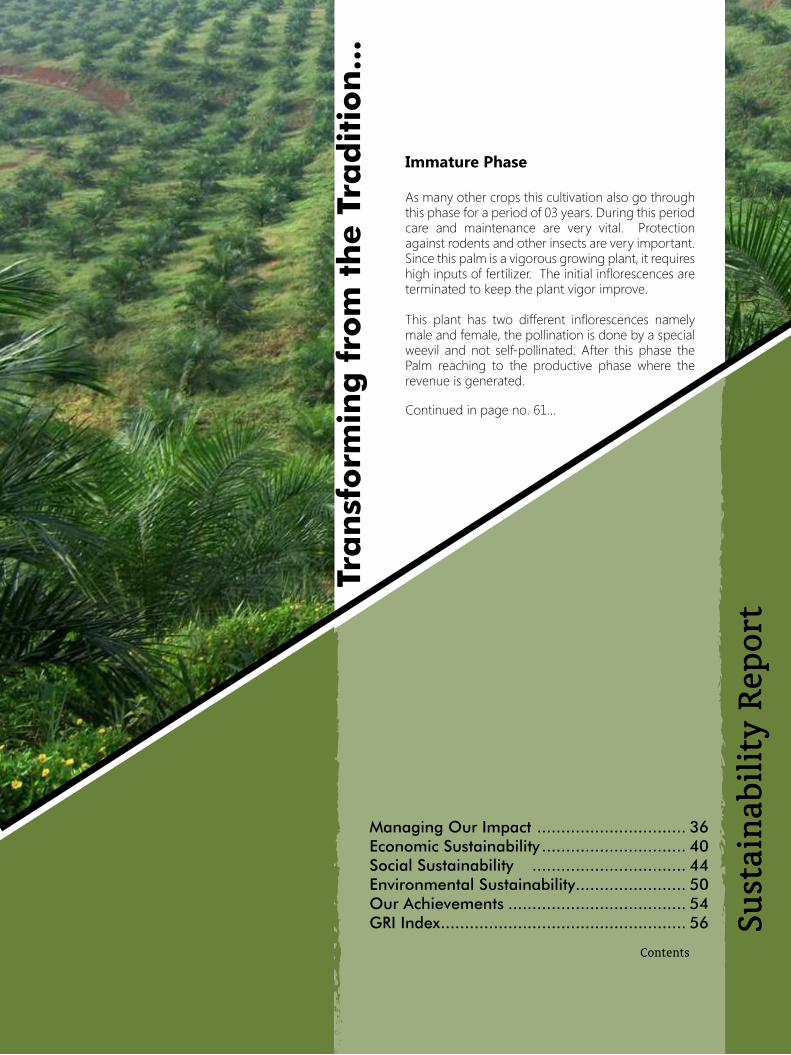
Kegalle Plantations PLC A n n u a l R e p o r t 2 0 1 6 - 1 7
35Financial Review | Management Discussion & Analysis
Gov
ern
ance
Rev
iew
Sust
ain
abil
ity
Rep
ort
Managing Our Impact ............................... 36Economic Sustainability .............................. 40Social Sustainability ................................ 44 Environmental Sustainability ....................... 50 Our Achievements ..................................... 54GRI Index ................................................... 56
Immature Phase
Asmanyothercropsthiscultivationalsogothroughthisphaseforaperiodof03years.Duringthisperiodcare and maintenance are very vital. Protectionagainstrodentsandotherinsectsareveryimportant.Sincethispalmisavigorousgrowingplant,itrequireshighinputsoffertilizer.Theinitialinflorescencesareterminatedtokeeptheplantvigorimprove.
This plant has two different inflorescences namelymaleandfemale,thepollinationisdonebyaspecialweevil and not self-pollinated.After this phase thePalm reaching to the productive phase where therevenueisgenerated.
Tra
nsf
orm
ing
fro
m t
he T
rad
itio
n...
Continuedinpageno.61...
Contents
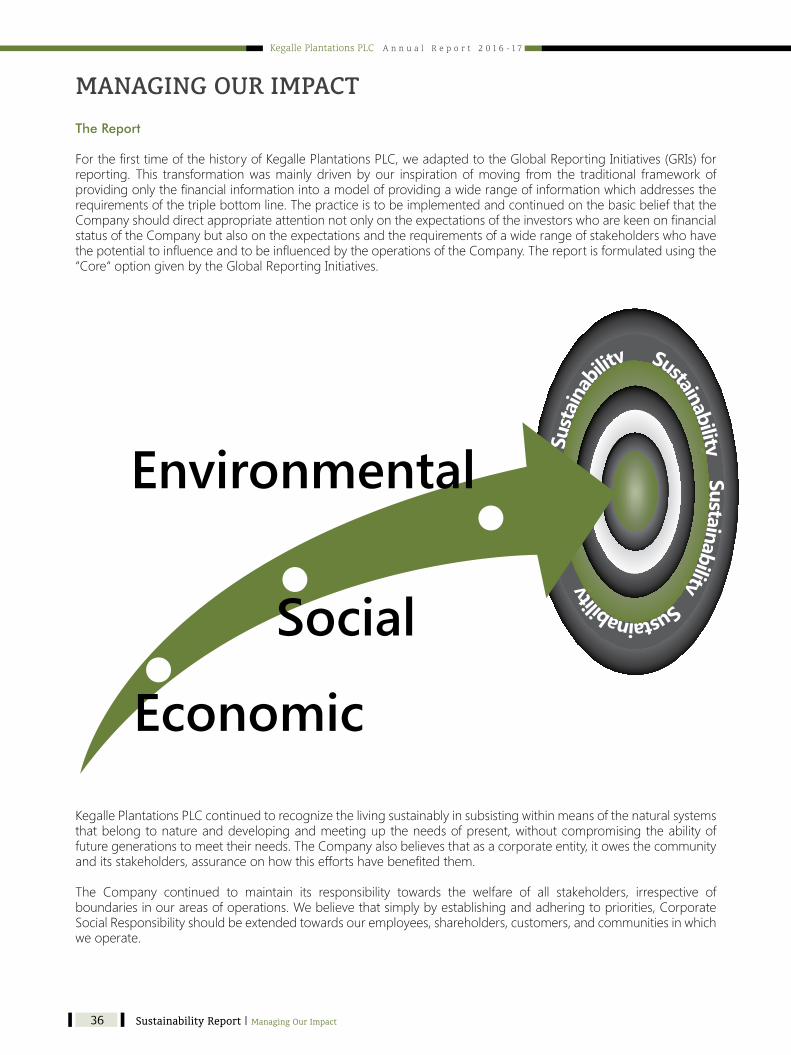
Kegalle Plantations PLC A n n u a l R e p o r t 2 0 1 6 - 1 7
36
The Report
ForthefirsttimeofthehistoryofKegallePlantationsPLC,weadaptedtotheGlobalReportingInitiatives(GRIs)forreporting. This transformationwasmainlydrivenbyour inspirationofmoving from the traditional frameworkofprovidingonlythefinancialinformationintoamodelofprovidingawiderangeofinformationwhichaddressestherequirementsofthetriplebottomline.ThepracticeistobeimplementedandcontinuedonthebasicbeliefthattheCompanyshoulddirectappropriateattentionnotonlyontheexpectationsoftheinvestorswhoarekeenonfinancialstatusoftheCompanybutalsoontheexpectationsandtherequirementsofawiderangeofstakeholderswhohavethepotentialtoinfluenceandtobeinfluencedbytheoperationsoftheCompany.Thereportisformulatedusingthe“Core“optiongivenbytheGlobalReportingInitiatives.
Sust
ainab
ility Sustainability Sustainability Sustainabilit
y
Social
Economic
Environmental
KegallePlantationsPLCcontinuedtorecognizethelivingsustainablyinsubsistingwithinmeansofthenaturalsystemsthatbelongtonatureanddevelopingandmeetinguptheneedsofpresent,withoutcompromisingtheabilityoffuturegenerationstomeettheirneeds.TheCompanyalsobelievesthatasacorporateentity,itowesthecommunityanditsstakeholders,assuranceonhowthiseffortshavebenefitedthem.
The Company continued to maintain its responsibility towards the welfare of all stakeholders, irrespective ofboundariesinourareasofoperations.Webelievethatsimplybyestablishingandadheringtopriorities,CorporateSocialResponsibilityshouldbeextendedtowardsouremployees,shareholders,customers,andcommunitiesinwhichwe operate.
MANAGING OUR IMPACT
Sustainability Report | Managing Our Impact Managing Our Impact | Sustainability Report

Kegalle Plantations PLC A n n u a l R e p o r t 2 0 1 6 - 1 7
37
Identified Material Aspects & Boundaries
Weusethefollowingprocesstoidentify,prioritizeandvalidatetheaspectsthatexertssignificantinfluenceonourbusiness.Onthebasisofthisprocess,wereporteachandeveryaspectcomprehensivelytoourstakeholders.
Step 1Identification
SustainabilityContext Materiality Completeness
Step 2Prioritization
Step 4Review
Step 3Validation
Stakeholder Inclusiveness
REPORT
Sustainability Context Sustainability Context
PRINCIPLES FOR DEFINING REPORT CONTENT
Asaresponsiblecorporatecitizen,wearealwayskeenoneachandeveryaspectwhichhasorisexpectedtohavepotentialtoaffectthebusinessaswellasawiderangeofstakeholdersaroundthebusiness.WehavedulyappliedthefollowingprinciplesinthedeterminingthemattersthataffecttheCompanyandultimatelythestakeholdersoftheCompany.
Stakeholder Inclusiveness
Inthereportingprocess,awiderangeofforcesandactorswhohavethepotentialtoaffectandbeaffectedbytheoperationsoftheCompany.Accordingly,StakeholdersofourCompanyincludenotonlytheinvestorswhohavecontributedtothefinancialcapitalbutalsootherwhohaverelationshipswiththeCompany.Inthepreparationofourreport,priorityhasbeengiventothereasonableexpectationsandinterestsofourstakeholders.
Sustainability Context
Ourreport isexpected toprovidecomprehensivedetails related to theperformanceof theCompany fromabroaderperspectiveconsideringthewidersocioeconomiccontext.Accordingly,wereporthowwecontribute,oraimtocontributeinthefuturetotheimprovementordeteriorationofeconomic,environmental,andsocialconditions,developmentsatthelocal,regionalorgloballevel.
Materiality
Under our report, we report the relevant topics thatmay reasonably be considered important for reflectingthe organization’s economic, environmental and social impacts or substantively influencing the decisions ofstakeholders.
Completeness
Thereporthascoveredmaterialaspectsandtheirboundaries,sufficienttoreflecteconomic,environmental,andsocialimpacts,andtoenablestakeholderstoassesstheorganization’sperformanceinthereportingperiod.
Managing Our Impact | Sustainability Report

Kegalle Plantations PLC A n n u a l R e p o r t 2 0 1 6 - 1 7
38
PRINCIPLES FOR DEFINING REPORT QUALITY
In theprocessofpreparationof the sustainability report, the followingprincipleshavebeenapplied inorder toenhancethequalityoftheinformationprovidedthroughthereport.AsaCompanydedicatedtoqualityofeachandeveryaspect,weareintheopinionthattheprovisionofqualityinformationwillfacilitatetheeffectivedecisionmakingofourstakeholders.
Balance
ThereportconsistsofallthepositiveandnegativeaspectsoftheCompany’sperformancetoreflectanunbiasedpictureoftheorganizationwhichenablesareasonableassessmentoftheoverallperformanceoftheCompany.
Comparability
Ourreporthaspresentedinformationinaconsistentmannerwhichenablesstakeholderstomakemeaningfulcomparisonsagainst theCompany’spastperformance, itsobjectives,and to thedegreepossible,against theperformanceofotherorganizations.
Accuracy
The report consists of information that is sufficiently accurate and detailed for stakeholders to assess theperformanceoftheCompany.
Timeliness
Informationisreportedonaregularbasisinordertoensurethatinformationisavailableontimeforstakeholderstomakeinformeddecisions.
Clarity
Thereporthaspresentedinformationinamannerthatisunderstandableandaccessibletostakeholdersusingthe report.
Reliability
Theprocessofgathering,recording,analyzinganddisclosinginformationcontainedinourreportissubjecttoaccuracyandestablishesqualityandmaterialityofinformation.
Prioritization of Material Issues
TheaspectsthathaveahighpotentialtoexertinfluenceonourCompanycanberecognizedbasedonthefollowingmatrixandthoseaspectsareprioritizedsothatstakeholderscanunderstandthesignificantaspectsthatmattermostthebusinessprocessofourCompany.
1
1 22
3
3 4
4
5
5
6
6
7
7
Natural Environment
Infl
uenc
e of
Sta
keho
lder
s
Influence on KPL
Work Environmet
Local Development
Suplier Management
Product Responsibility
Creating Value For Shareholders & Profitability
CSR Activities
H
M
L
Sustainability Report | Managing Our Impact Managing Our Impact | Sustainability Report

Kegalle Plantations PLC A n n u a l R e p o r t 2 0 1 6 - 1 7
39
Material Issue for KPL Corresponding GRI G4 Material Aspect Aspect BoundaryInternal External
NaturalEnvironment
Materials *Energy *Water *Biodiversity *Emissions *EffluentandWaste *ProductsandServices *Compliance *Transport *Overall *SupplierEnvironmentalAssessment *EnvironmentalGrievanceMechanisms *
WorkEnvironment
Employment *Labour/ManagementRelations *OccupationalHealthandSafety *TrainingandEducation *DiversityandEqualOpportunity *EqualRemunerationforWomenandMen *SupplierAssessmentforLabourPractices *LabourPracticesGrievanceMechanisms *Investment *Non-discrimination *FreedomofAssociationandCollectiveBargaining *ChildLabour *ForcedorCompulsoryLabour *Security Practices *IndigenousRightsAssessment *HumanRightsGrievanceMechanisms *
LocalDevelopment
LocalCommunities *Anti-corruption *PublicPolicyAnti-competitiveBehavior *Compliance *GrievanceMechanismsforImpactsonSociety *
SupplierManagementSupplierAssessmentforImpactsonSociety *SupplierHumanRightsAssessment *
ProductResponsibility
CustomerHealthandSafety *ProductandServiceLabelling *MarketingCommunications *CustomerPrivacyCompliance *
CreatingValueforShareholders&Profitability
EconomicPerformance *MarketPresence *IndirectEconomicImpactsProcurement Practices *
CSRActivities *
Managing Our Impact | Sustainability Report

Kegalle Plantations PLC A n n u a l R e p o r t 2 0 1 6 - 1 7
40
Our Stakeholders
AsacorporatecitizenwhoishandlingconsiderableamountofresourcesofSriLankaincludingover9,000hectaresandaround6,000workforce,itisnaturaltoinfluenceandtobeinfluencedbyandtoexternalandinternalpartiescalledstakeholders.
ItisvitaltounderstandtheimplicationsuponKPLduetotheactivitiesandresponsesofstakeholders,bothinternalandexternalforthefuturebettermentofbothKPLandthestakeholders.GroupswhichhaveanimpactbyoperationsofKPLorwhicharelikelytoinfluenceKPL’soperationsareconsideredasourstakeholders.WehaveidentifiedandcategorizedourstakeholdershavinglegitimateinterestontheCompany’sperformanceintoeightkeygroups.Overtheyearswehaverecognizedallthestakeholdersequallyandit’sintuitivewiththereputationKegallePlantationsPLCdevelopedasahighvalueaddingCompanytoitsstakeholders.
1
2
3
45
6
7
8
Shar
ehol
ders
Management
Employees& Unions
Com
mun
ity
Gov
ernm
entCusto
mers
Lenders
Suppliers
Weanalyzeeachstakeholder’sexpectationsperiodicallywithanongoingdialoguewithstakeholdersatallthestagesoftheprocess.Theviewsandexpectationsofallstakeholdersareobtainedthroughanengagementprocessthatallowsthemtobeexpressedwithoutanyrestrictioninordertoprovidemaximumsatisfactionaswealwaysbelievethatoursuccessdependsupontheirsupport.Weclassifyourstakeholdersasfollows;
ECONOMIC SUSTAINABILITY
Sustainability Report | Economic Sustainability Economic Sustainability | Sustainability Report

Kegalle Plantations PLC A n n u a l R e p o r t 2 0 1 6 - 1 7
41
1. Shareholders:
Weconsidershareholdersasapartywithhighinfluencingpowerforoursuccess.Inspiteofthecurrentyearbeingchallenging financial year, due to adverse macro-economic factors, we were in a position to improveour financial performance compared to the previousyear. Due to improved financial conditions, we havedistributeddividendsamountingtoRs.125millionwhichis6%ofthetotalvalue.
2. Management:
The Senior Management has been granted theauthority of strategic decisions making on operations.Therefore theyareheld responsible for theresultsandtheir performance is evaluated based on their results.In recognition of their skills, experience, and servicesKegalle Plantations PLC has always treated them withcompetitive emoluments, based on their performanceandtheresponsibilitytheyhold.
3. Employees & Trade Unions:
CommittedworkforceisoneofourmainassetsandKPLalwaysfocusestheattentionontheirdevelopmentandwellbeing. Our Company distributed Rs. 1,135 mn asremunerationwhichis56%ofthetotalvalue.Inaddition,wealwaysattempttoprotecttherightsoftheemployeeswiththeviewthattheyareentitledtoenjoythehumanrights irrespective of whether relevant regulationsaddress such rights. Accordingly, as a corporate bodywhichconsistsofadiversifiedworkforceintermsofage,ethnicity,religion,regionetc.,thecultureoftheCompanyalways strives to resist the discriminating practices.FollowinggraphsandCertificatesprovideevidenceonourcommitmenttoaddhighvaluetoemployees.
• Ethical Tea Partnership Certification (ETP) for allTeaManufacturingFactoriesoftheCompany.
• Scope-Continuousimprovementofthewelfareandworkingconditionsof itsworkers,aswellasonenvironmentalsustainability.
Classification of Stakeholders based on Power and Interest
1
2 3
7
8
4
5
6
H
L
POW
ER
INTEREST
The Company created a value of Rs. 2,035mn for allthe above identified stakeholders including voicelessstakeholders such as environmental groups andcommunity and they are to be best served eitherfinanciallyorsocially.
Following graph exhibits the value distribution amongourstakeholders.
Distribution of Value Added - 2017 Vs 2016
70%
3%
11%
68%
7%
59%
56%
2%
12%
6% 6% 19%
-80%
-60%
-40%
-20%
-
20%
40%
60%
80%
20162017
Remun
eratio
n
Govern
ment
Lend
ers
Divide
nd
Deprec
iation
Retai
ned P
rofit
Economic Sustainability | Sustainability Report
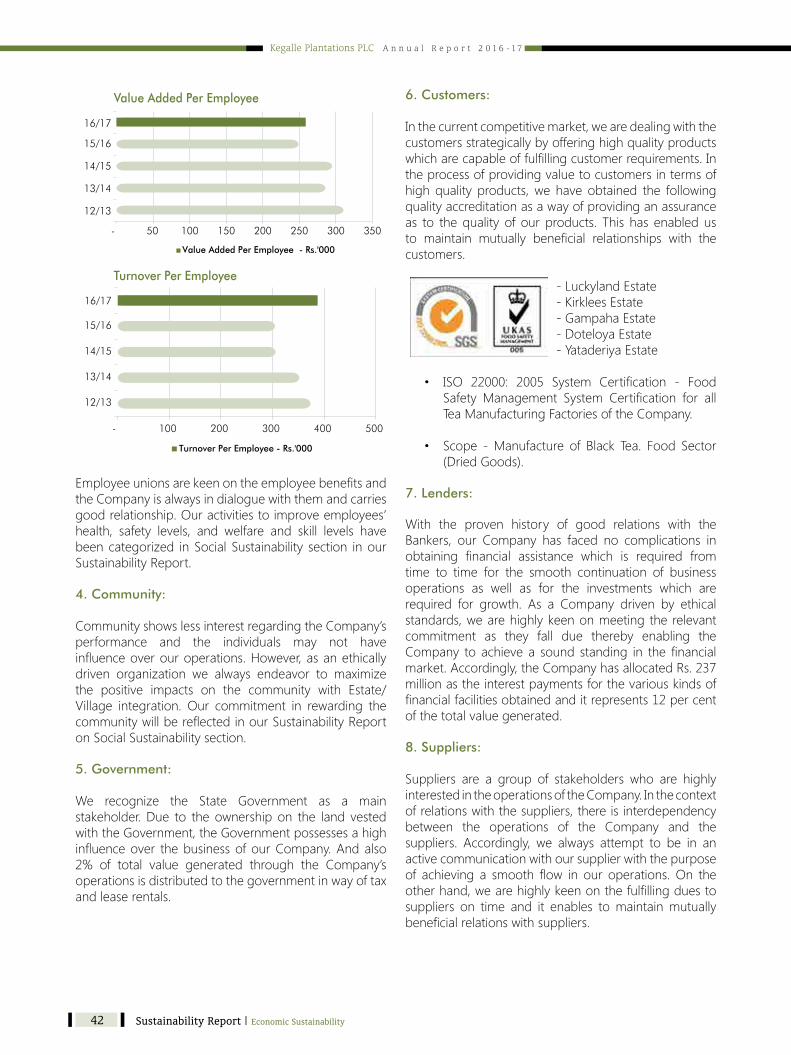
Kegalle Plantations PLC A n n u a l R e p o r t 2 0 1 6 - 1 7
42
Value Added Per Employee - Rs.'000
Turnover Per Employee - Rs.'000
Turnover Per Employee
Value Added Per Employee
- 50 100 150 200 250 300 350
12/13
13/14
14/15
15/16
16/17
- 100 200 300 400 500
12/13
13/14
14/15
15/16
16/17
EmployeeunionsarekeenontheemployeebenefitsandtheCompanyisalwaysindialoguewiththemandcarriesgoodrelationship.Ouractivitiestoimproveemployees’health, safety levels, and welfare and skill levels havebeencategorized inSocialSustainability section inourSustainabilityReport.
4. Community:
CommunityshowslessinterestregardingtheCompany’sperformance and the individuals may not haveinfluenceoverouroperations.However,asanethicallydriven organization we always endeavor to maximizethe positive impacts on the community with Estate/Village integration. Our commitment in rewarding thecommunitywillbereflectedinourSustainabilityReportonSocialSustainabilitysection.
5. Government:
We recognize the State Government as a mainstakeholder.Due to the ownership on the land vestedwiththeGovernment,theGovernmentpossessesahighinfluenceover thebusinessofourCompany.Andalso2% of total value generated through the Company’soperationsisdistributedtothegovernmentinwayoftaxand lease rentals.
6. Customers:
Inthecurrentcompetitivemarket,wearedealingwiththecustomersstrategicallybyofferinghighqualityproductswhicharecapableoffulfillingcustomerrequirements.Intheprocessofprovidingvaluetocustomersintermsofhigh quality products,we have obtained the followingqualityaccreditationasawayofprovidinganassuranceas to thequality of our products. This has enabledusto maintain mutually beneficial relationships with thecustomers.
-LuckylandEstate-KirkleesEstate-GampahaEstate-DoteloyaEstate-YataderiyaEstate
• ISO 22000: 2005 System Certification - FoodSafety Management System Certification for allTeaManufacturingFactoriesoftheCompany.
• Scope -Manufacture of Black Tea. Food Sector(DriedGoods).
7. Lenders:
With the proven history of good relations with theBankers, our Company has faced no complications inobtaining financial assistance which is required fromtime to time for the smooth continuation of businessoperations as well as for the investments which arerequired for growth. As a Company driven by ethicalstandards,wearehighlykeenonmeetingtherelevantcommitment as they fall due thereby enabling theCompany to achievea sound standing in the financialmarket.Accordingly,theCompanyhasallocatedRs.237millionastheinterestpaymentsforthevariouskindsoffinancialfacilitiesobtainedanditrepresents12percentofthetotalvaluegenerated.
8. Suppliers:
Suppliers are a group of stakeholders who are highlyinterestedintheoperationsoftheCompany.Inthecontextof relations with the suppliers, there is interdependency between the operations of the Company and thesuppliers. Accordingly, we always attempt to be in anactivecommunicationwithoursupplierwiththepurposeof achieving a smooth flow in our operations.On theotherhand,wearehighlykeenonthefulfillingduestosuppliers on time and it enables tomaintainmutuallybeneficialrelationswithsuppliers.
Sustainability Report | Economic Sustainability Economic Sustainability | Sustainability Report

Kegalle Plantations PLC A n n u a l R e p o r t 2 0 1 6 - 1 7
43
Statement of Value Added
Rupees in Millions 2016/17 2015/16
Turnover 2,287 1,933OtherIncome 316 298
2,603 2,231CostofMaterials&Services (567) (587)Value Added 2,035 1,644
DISTRIBUTION OF VALUE ADDED
ToEmployeesasRemuneration 1,135 56% 1,158 70%ToGovernmentasTaxesandLeaseRent 47 2% 53 3%ToLendersofCapitalasInterest 237 12% 175 11%ToShareholdersasDividend 125 6% 1,125 68%
Retained in the Business as;
ProvisionforDepreciation 112 6% 110 7%ProfitRetained/(Utilized) 379 19% (977) (59%)Value Added 2,035 100% 1,644 100%
ValueAddedperEmployee Rs. 346,980 259,053TurnoverperEmployee Rs. 389,901 304,659
Economic Sustainability | Sustainability Report
Ourfinancialcommitmenttostakeholderscanbesummarizedasfollows.
Sources and Utilisation of Income
Rupees in Millions 2016/17 % 2015/16 %
Sources of Income
Rubber 1,057 41% 942 42%Tea 1,030 40% 877 39%Coconut 39 2% 45 2%OtherCrops 2 0% 1 0%SaleofRubberTrees 158 6% 68 3%OtherIncome 316 12% 298 13%
2,603 100% 2,231 100%
Utilisation of Income
ToEmployeesasRemuneration 1,135 44% 1,158 52%ToGovernmentasTaxes&LeaseRent 47 2% 53 2%ToLendersofCapitalasInterest 237 9% 175 8%ToSuppliers&ServiceProviders 567 22% 587 26%ToShareholdersasDividend 125 5% 1,125 50%ToExpansion&Growth 491 19% (867) (39%)
2,603 100% 2,231 100%
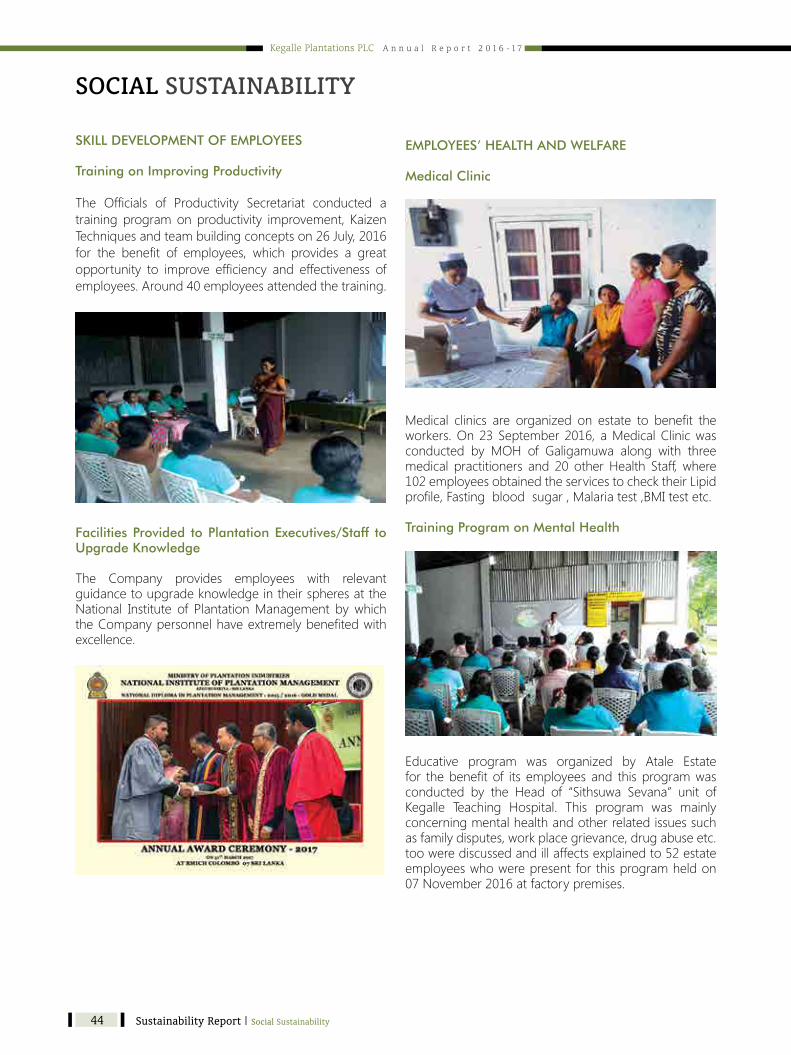
Kegalle Plantations PLC A n n u a l R e p o r t 2 0 1 6 - 1 7
44
SOCIAL SUSTAINABILITY
SKILL DEVELOPMENT OF EMPLOYEES
Training on Improving Productivity
The Officials of Productivity Secretariat conducted atraining programonproductivity improvement, KaizenTechniquesandteambuildingconceptson26July,2016for the benefit of employees, which provides a greatopportunity to improve efficiency and effectiveness ofemployees.Around40employeesattendedthetraining.
Facilities Provided to Plantation Executives/Staff to Upgrade Knowledge
The Company provides employees with relevantguidancetoupgradeknowledgeintheirspheresattheNational Institute of PlantationManagement by whichtheCompanypersonnelhaveextremelybenefitedwithexcellence.
EMPLOYEES’ HEALTH AND WELFARE
Medical Clinic
Medical clinics are organized on estate to benefit theworkers.On23September2016, aMedicalClinicwasconducted by MOH of Galigamuwa along with threemedical practitioners and 20 otherHealth Staff, where102employeesobtainedtheservicestochecktheirLipidprofile,Fastingbloodsugar,Malariatest,BMItestetc.
Training Program on Mental Health
Educative program was organized by Atale Estatefor thebenefitof its employeesand thisprogramwasconducted by the Head of “Sithsuwa Sevana” unit ofKegalle Teaching Hospital. This program was mainlyconcerningmentalhealthandotherrelatedissuessuchasfamilydisputes,workplacegrievance,drugabuseetc.toowerediscussedandillaffectsexplainedto52estateemployeeswhowerepresentforthisprogramheldon07November2016atfactorypremises.
Sustainability Report | Social Sustainability Social Sustainability | Sustainability Report
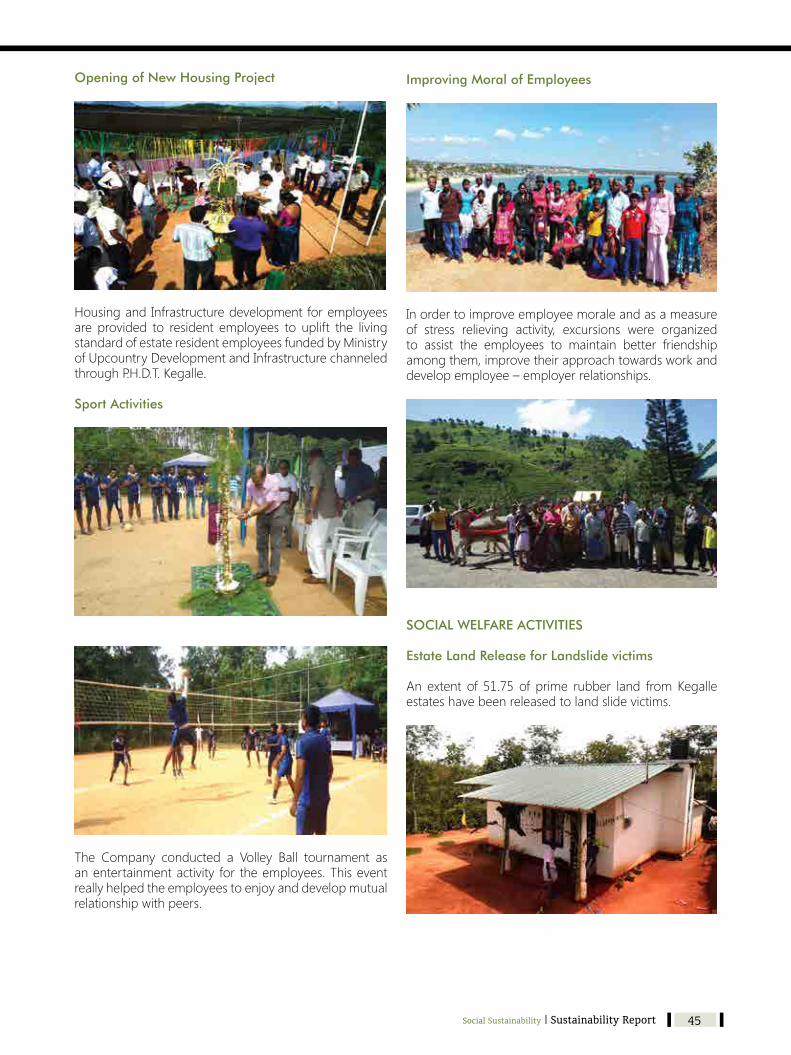
Kegalle Plantations PLC A n n u a l R e p o r t 2 0 1 6 - 1 7
45
Improving Moral of Employees
Inordertoimproveemployeemoraleandasameasureof stress relieving activity, excursions were organizedto assist the employees to maintain better friendshipamongthem,improvetheirapproachtowardsworkanddevelopemployee–employerrelationships.
SOCIAL WELFARE ACTIVITIES
Estate Land Release for Landslide victims
An extent of 51.75 of prime rubber land fromKegalleestateshavebeenreleasedtolandslidevictims.
Opening of New Housing Project
HousingandInfrastructuredevelopmentforemployeesare provided to resident employees to uplift the livingstandardofestateresidentemployeesfundedbyMinistryofUpcountryDevelopmentandInfrastructurechanneledthroughP.H.D.T.Kegalle. Sport Activities
The Company conducted a Volley Ball tournament asanentertainmentactivity for theemployees.Thiseventreallyhelpedtheemployeestoenjoyanddevelopmutualrelationship with peers.
Social Sustainability | Sustainability Report

Kegalle Plantations PLC A n n u a l R e p o r t 2 0 1 6 - 1 7
46
Assistance for Landslide Victims
As a part of Social Responsibility of the Company,arrangements were made to distribute food items tolandslidevictims.
Religious Activities
TheCompanyencouragesreligiousactivitiesonestatesandassistanceprovidedtoconducteventsontheestateand financial and material supports are extended toactivitiesinthevillage. Financial assistancehasbeengiven to conduct annualprocessionatArandaraDewalaya thatwasheldon29March, 2017. Estateemployeesparticipated voluntarilytocarrylightsattheprocession.
Cultural Activities
InternationalWomen’sDaywascelebratedinAtaleEstatewithactiveparticipationofover100femaleemployees.Bank ofCeylon , Kegalle arranged to open 44 KanthaRan Ginum a saving scheme specially designed forfemales and they contributed Rs. 500/- each for thefirst15applicantstogetherwithseveralgiftitems.TheChiefManagerofBankofCeylon,Kegalletooattendedthis program and delivered a lecture on productivityenhancement.
Sustainability Report | Social Sustainability Social Sustainability | Sustainability Report
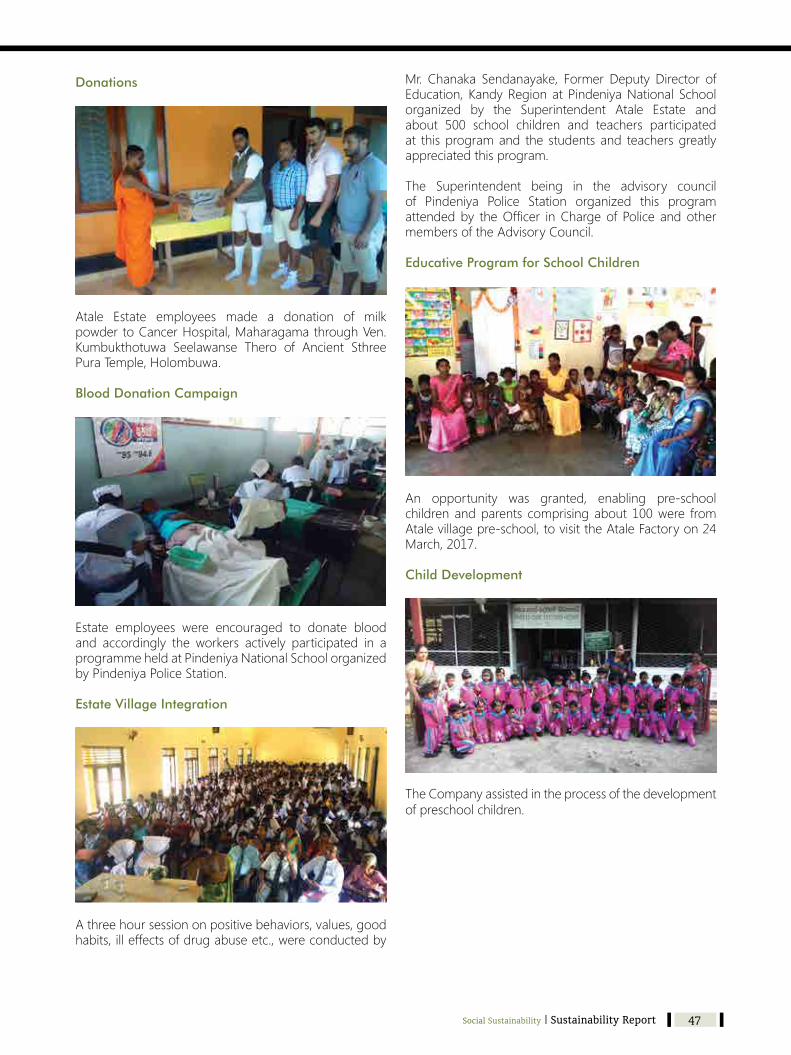
Kegalle Plantations PLC A n n u a l R e p o r t 2 0 1 6 - 1 7
47
Mr. Chanaka Sendanayake, Former Deputy Director ofEducation, KandyRegionatPindeniyaNational Schoolorganized by the Superintendent Atale Estate andabout 500 school children and teachers participatedat thisprogramand the studentsand teachersgreatlyappreciatedthisprogram.
The Superintendent being in the advisory councilof Pindeniya Police Station organized this programattendedby theOfficer inChargeof Police andothermembersoftheAdvisoryCouncil. Educative Program for School Children
An opportunity was granted, enabling pre-schoolchildren andparents comprising about 100were fromAtalevillagepre-school,tovisittheAtaleFactoryon24March,2017.
Child Development
TheCompanyassistedintheprocessofthedevelopmentof preschool children.
Donations
Atale Estate employees made a donation of milkpowdertoCancerHospital,MaharagamathroughVen.Kumbukthotuwa Seelawanse Thero of Ancient SthreePuraTemple,Holombuwa.
Blood Donation Campaign
Estate employees were encouraged to donate bloodand accordingly the workers actively participated in aprogrammeheldatPindeniyaNationalSchoolorganizedbyPindeniyaPoliceStation.
Estate Village Integration
Athreehoursessiononpositivebehaviors,values,goodhabits,illeffectsofdrugabuseetc.,wereconductedby
Social Sustainability | Sustainability Report
Kegalle Plantations PLC A n n u a l R e p o r t 2 0 1 6 - 1 7
48
Assistance for Higher Studies
The Company continues to assist the children of theemployees who pursue higher studies in the NationalUniversities.Afixedmonthly scholarship is awarded toall beneficiaries throughout the period of their highereducation.Severalchildrenhavebeenbenefitedbythisschemeandthosewhohavecompletedtheirstudiesaregainfullyemployedatpresent.
Current Scholarship holders
W.D.MRathnayakeL.K.RKumariP.W.N.LGunawardhanaR.A.J.TRanasingheK.S SamarapalaR.I.PHarischandraN.L.A.K.WBandaraA.Y.VGunasiriS.P.M.SSenakaR.P.S.SRajarathnaR.IRasaliWeerasekaraK.A.U.SKodisingheL.P.CKanchanaH.G.O.NMunasingheK.P.I.PGunarathnaK.R.S.SPathiranaGanesanSarojani
Sustainable Procurement Practices
In the current competitive context, theCompanies aremoving towards the sustainable practices in order tosurvive and achieve a growth. Accordingly, each andevery activity of the Company should align with theconceptofsustainability if theCompany isplanning tobeoutstanding in the industry.HencesuchsustainablepracticesareconsideredasdriverofvaluecreationnotonlyfortheCompanybutalsofortheotherstakeholdersand also for the society at large. The procurementpractice is such area that needs sustainable approach.Accordingly,thesustainableprocurementpracticeshavebecomeprominenceinthevaluecreationofthecurrentcompetitivecontext.
As a socially responsibleCompany,wealways attemptto carry on our business activities in a sustainablemanner.Accordingly,wefocusnotonlyonthe internaloperations of the Company but also on the activitiesrelated to the inbound and outbound logistics. HencetheCompany is highly keenonmaintaining close andmutually beneficial relationships with our supplier.Maintainingsuchrelationshipswithsupplierswillenablethe Company to effectively manage the economic,socialandenvironmentalimpacts.Accordingly,asapartof the Company’s sustainable procurement practices,we always encourageour supply chain toprocure therequired items locally if the required items are locally available. Accordingly, such local procurements willstimulate thewellbeingof those local suppliers in onehand which represents the contribution to the societyfromtheCompany.OntheotherhandsuchpracticehelptheCompanydevelopandmaintainmutuallybeneficialrelationships with the local community which is essential forthesuccessoftheoperationsoftheCompany.
On the other hand, our factories process boththe agricultural produce of our estates as well asthe bought produce from the small holders. Suchprocurementpractices leads towards thedevelopmentandthewellbeingofthelocalcommunityensuringthesustainablerelationshipsbetweentheCompanyandthelocal community.
Accordingly, following these sustainable procurementpracticeswillenabletheCompanytoachieveasustainablegrowth and ultimately achieve the predeterminedobjectivesoftheCompany.
Industrial Relations & Collective Agreements
As a socially responsible Company, we are alwayskeen on maintaining mutually beneficial relationshipswith our employees. The Company is operating onthe principle that “we cannot satisfy our customerswithout satisfied employees”. Therefore the Companyadoptsaproactiveapproachinrelationtotheindustrialrelations.Accordingly,theCompanyattemptstoprovidevalue to its employees in various aspects which areessentialforbuildingandmaintaininghealthyindustrialrelations. Company establishes its policies with regardto employees through the collective agreements. Ouremployeesbelongtoworkerandstafftradeunions.Theestateworkers are covered by a collective agreement.These collective agreements are subject to revisionperiodically.
Sustainability Report | Social Sustainability Social Sustainability | Sustainability Report
Kegalle Plantations PLC A n n u a l R e p o r t 2 0 1 6 - 1 7
49
TheCompanyhasmadeprovision forbenefitssuchasresidence, crèches, hospitals, preschools, schools and other welfare facilities.
The Company provides value to employees in mostaspects of their lives as part of the discharging of theresponsibilityoftheCompanytowardsthesociety.
Accordingly, there are nomaterial issues in relation totheemployeeandindustrialrelationsoftheCompany.
Product Responsibility
KegallePlantationsPLCasadiversifiedCompanyintheareasof tea, rubber and coconuts is alwaysdedicatedtoquality.EachandeveryactivitywithintheCompanycontext iscarriedoutwiththefocusonquality.Duetothisdedicatedpracticeonquality,wehavebeenabletoestablish adistinct image in themarket related toourproductquality. Inorder tomaintainandenhance thisrecognitioninthemarketplace,weconstantlycarryonmakinginnovativereformswithintheCompanycontextwhichisrequiredtoensurethesustainabledevelopment.As a practice, we always attempt to make minorimprovementsineveryaspectoftheCompanyandwestronglybelieveintheconceptthatachieving1percentimprovementineveryaspectisbetterthanachieving100percentimprovementinoneaspect.Accordingly,wearedriventomakecontinuousimprovementthroughouttheCompanyandtoachievezerodefectsineachandeveryactivitytheCompanyisinvolved.
Asamovetowardstheachievementoftheseinspirations,we regularly conduct employee training program toensure that the employees are well capable enoughofdischarging their responsibility toensure thequalityof products. The training information of employees isdisclosed in the chapter, “Skill Development – EstateEmployees”.
Also the Company has successfully initiated a biolatex project in order to reduce the use of chemicals,stimulators and inorganic fertilizers in order to ensurethattheCompanyiscomplyingwiththefocusonquality.In addition to above moves, Company is closelyinteracting with the following organizations and hasachieved themembership of those organizations with
theviewofimprovingquality.
● TheColomboTeaTradersAssociation(CTTA)● ThePlantersAssociationofCeylon(PA)● TheEmployer’sFederationofCeylon(EFC)● TheColomboRubberTradersAssociation(CRTA)● PlantationHumanDevelopmentTrust(PHDT)● TheRubberResearchInstituteofSriLanka(RRISL)● RubberDevelopmentDepartment(RDD)● SriLankaTeaBoard(SLTB)
Additionally we have been able to obtain followingcertificatesandthesecertificatesprovideanindependentthird party assurance on the quality of the products and theoperationsoftheCompany.
EU & USDA _ NOP Certification (European Union &NationalOrganic Program (NOP) of the United StatesDepartmentofAgriculture).
ISO 9001 : 2015 System Certification – QualityManagement System Certification for all RubberManufacturingFactoriesoftheCompany.
Product Labeling
AsaCompanyresponsibleforwhatwedo,weundertakeallthelabelingandpackagingactivitiesofourproductsin accordance with the standards and guidelinesimposedbyColomboTeaAuctionsandCeylonTeaTradeAssociation.ThislabelingrequiresEstateName,gardenmark,grade,invoicenumber,grossandnetweighttobeincludedinthelabel.Accordinglywehavecompliedwiththese requirements.
Ethical Behavior
The values embedded in the culture of the Companyalways emphasize the necessity of considering theappropriatenessofeachactivityweundertakeintermsofmoralprinciplesofgoodandbadbehavior.Accordingly,all the members of the Company are required andencouraged to be highly ethical in each and everyactivityandrelationship.Accordingly,theCompanyhasdevelopedaculturewhichseeks tocomplywithmoralprinciples beyond the general laws and regulationimposedbythebusiness.
Social Sustainability | Sustainability Report
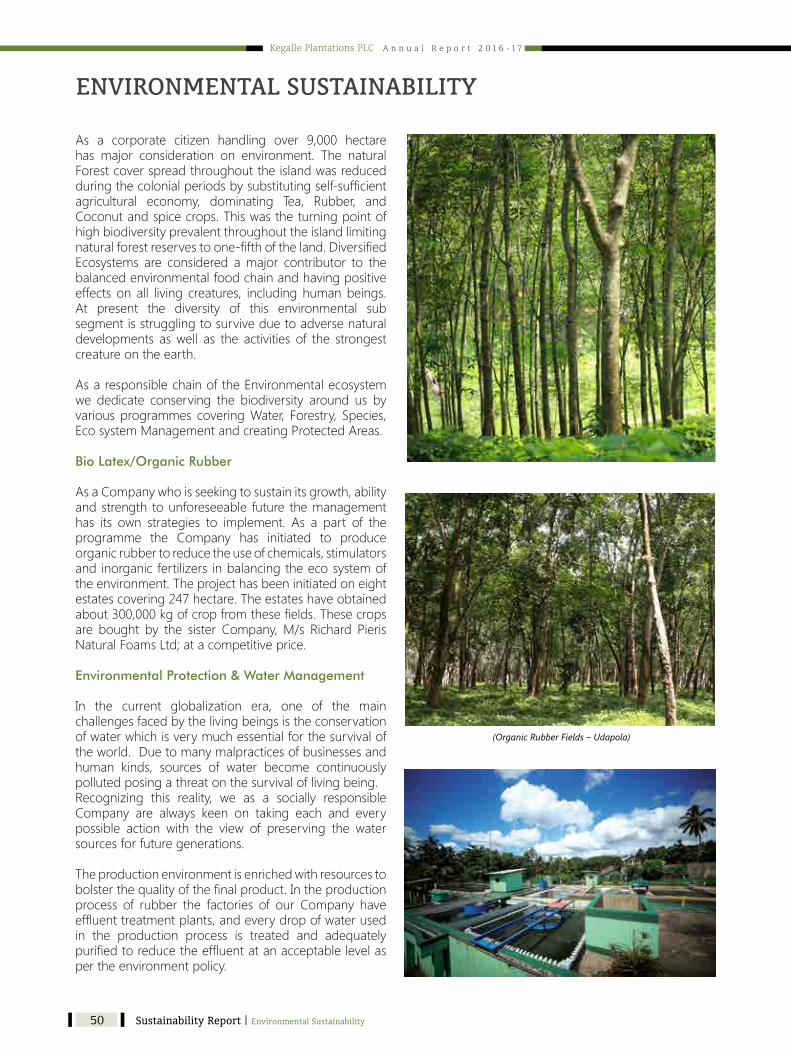
Kegalle Plantations PLC A n n u a l R e p o r t 2 0 1 6 - 1 7
50
As a corporate citizen handling over 9,000 hectarehas major consideration on environment. The naturalForestcoverspreadthroughouttheislandwasreducedduringthecolonialperiodsbysubstitutingself-sufficientagricultural economy, dominating Tea, Rubber, andCoconutandspicecrops.Thiswastheturningpointofhighbiodiversityprevalentthroughouttheislandlimitingnaturalforestreservestoone-fifthoftheland.DiversifiedEcosystems are considered amajor contributor to thebalancedenvironmentalfoodchainandhavingpositiveeffectson all living creatures, includinghumanbeings.At present the diversity of this environmental subsegmentisstrugglingtosurviveduetoadversenaturaldevelopments aswell as the activities of the strongestcreature on the earth.
AsaresponsiblechainoftheEnvironmentalecosystemwe dedicate conserving the biodiversity around us byvarious programmes coveringWater, Forestry, Species,EcosystemManagementandcreatingProtectedAreas.
Bio Latex/Organic Rubber
AsaCompanywhoisseekingtosustainitsgrowth,abilityandstrength tounforeseeable future themanagementhas its own strategies to implement. As a part of theprogramme the Company has initiated to produceorganicrubbertoreducetheuseofchemicals,stimulatorsandinorganicfertilizers inbalancingtheecosystemoftheenvironment.Theprojecthasbeeninitiatedoneightestatescovering247hectare.Theestateshaveobtainedabout300,000kgofcropfromthesefields.Thesecropsare bought by the sister Company,M/s Richard PierisNaturalFoamsLtd;atacompetitiveprice.
Environmental Protection & Water Management
In the current globalization era, one of the mainchallengesfacedbythelivingbeingsistheconservationofwaterwhichisverymuchessentialforthesurvivaloftheworld.Duetomanymalpracticesofbusinessesandhuman kinds, sources of water become continuouslypollutedposingathreatonthesurvivaloflivingbeing.Recognizing this reality, we as a socially responsibleCompany are always keen on taking each and everypossible action with the view of preserving the watersourcesforfuturegenerations.
Theproductionenvironmentisenrichedwithresourcestobolsterthequalityofthefinalproduct.Intheproductionprocess of rubber the factories of our Company haveeffluenttreatmentplants,andeverydropofwaterusedin the production process is treated and adequately purifiedtoreducetheeffluentatanacceptablelevelaspertheenvironmentpolicy.
ENVIRONMENTAL SUSTAINABILITY
Sustainability Report | Environmental Sustainability Environmental Sustainability | Sustainability Report
(Organic Rubber Fields – Udapola)

Kegalle Plantations PLC A n n u a l R e p o r t 2 0 1 6 - 1 7
51
Certificates Obtained by Our Rubber Estates
Our Company possesses certificates from globallyrecognized organizations for organic agriculturalpracticesinrubberprocessingandqualitymaintenanceinmanufacturingprocess.Followingarethecertificatesobtained.
EU & USDA – NOP Certification (European Union &NationalOrganic Program (NOP) of the United StatesDepartmentofAgriculture).
● Scope – Organic production of agriculturalproducts.
ISO 9001: 2015 System Certification – QualityManagement System Certification for all RubberManufacturingFactoriesoftheCompany.
● Estatesobtained-AtaleEstate,PallegamaEstate,Parambe Estate, Udapola Centrifuged LatexProject.
● Scope-ProductionandSaleofSoleCrepe,PaleCrepe,BrownCrepeandCentrifugedLatex.
Timber & Forestry
As a plantation Company who depends on theenvironmentwehaveusedsignificantextentofnaturalforestry. The Company believes in their responsibilitytomaintain the environment and its living beings and
has paid its attention to protect same. Our Companymaintains170hectareasconservationforestryandoutofwhich145hectaresareintheDoteloyaEstatewhichissituatedinthetransitionareabetweendryandwetzoneinDolosbage.MoreoverCompanymaintains69hectareof forestry and140hectareofPinus andother timbermainlyintheUdapussellawaRegion.
Forestry Management and Soil Conservation
The Company’s forestry management plans forsustainable management of forest and harvestabletimber extents one states continued to be in force.Guidelines have been issued to the Superintendentspertaining to the selection of land, species, cultivationpractices and the need to preserve the environment,having in mind the need to protect the environment.Plantingofdendroidthermalforestryonverysteeporinaccessible land has been prohibited. As a Companyengaged in Plantation, we are deeply involved inforestry conservation. The Company manages rubberplantationsinanextentof5,400hectaresitselfisinfactaforestcover.Riversandstreambanksinconservationforestryareinperpetuity.Thesameprincipleappliestosources of water for industrial and domestic purposes. We are conscious of the importance of preventing
Environmental Sustainability | Sustainability Report

Kegalle Plantations PLC A n n u a l R e p o r t 2 0 1 6 - 1 7
52
accidentalordeliberateforestfireandextremevigilanceis being exercised. Soil conservation methods, suchas proliferation of leguminous cover crops, terracingincluding “live terraces” and draining have beenundertakeninallextentsreplantedandinotherareasonanannualbasis.
Compost Project
Otherthanthesoilconservationmethodandbio latexprojecttheCompanyfurtherextendeditscontributiontotheenvironmentbyusingcompostmanure.AcompostingprojectwasinitiatedatLuckylandEstate,UdapussellawawiththeobjectivetoIncreasecropproductivity,improvesoilfertility,andreducechemicalfertilizerimportsinlongterm,andtocultivategreenmanurecropsinshortterm.
Harvesting TimberAll operations including felling, clearing, extraction &transportation of timber is undertaken in conformityto the environmental standards stipulated under theNational Environmental Act with all precautionarymeasures planned out to minimize soil erosion andrunoff fluctuation of the ground water table. It is alsomandatory on the part of the Company to replantthe harvested extents almost immediately during thesucceedingmonsoon, in addition to theestablishmentof conservation forest extents in vulnerable areas.The Inter-Ministerial Committee under the patronageof the Minister of Plantation Industries together withthe Conservator of Forests regulates all forms of treeharvesting on estates. Clear felling of trees in extentsexceeding2hectares,fellingofwindbeltsoranyformoffellingoftreesincatchmentareasorinlandswithhighgradientsaretotallyavoided.
OurestatesspreadoverthewetzonecoveringKegalle,Kurunagala and Badulla districts with ample annualaveragerainfallof2,500mm.MostofourrubberestatesinKegalle,wedgedinbetweenthecentralhighlandsandwesternsouthernplanesvaryinginheightfrom500feetabovesea level to1,000 feet.Other thanthebeautifulDoteloya teaestate,our teaplantationsaresituated intheUdapussellawa region, of theUvaProvinceon theeasternslopesofthehillcountry.Thisregionisfamousfor endemic and rare wildlife and plant species with the HakgallaStrictNaturalReserve,providingevidenceastohowourestateareasaresensitivetobiodiversity.As an estate Doteloya has the highest conservationforestry area amounting 145.48 hectare fortifying the
Compost Project in Progress Luckyland Estate
Sustainability Report | Environmental Sustainability Environmental Sustainability | Sustainability Report
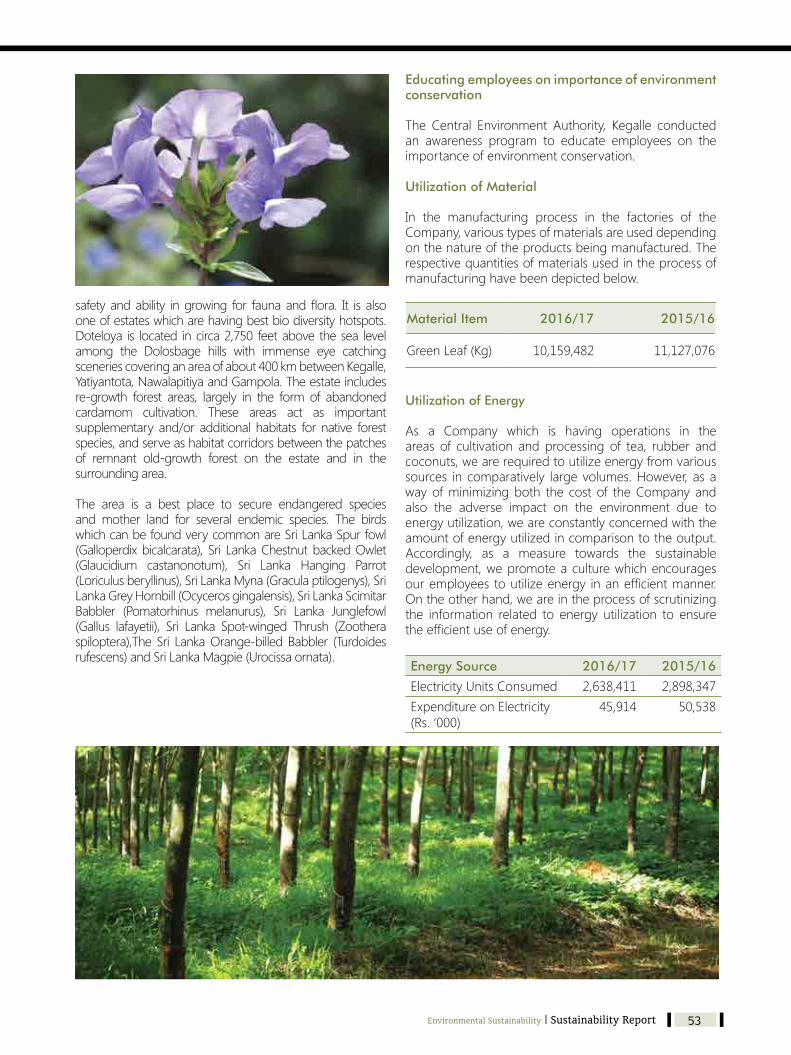
Kegalle Plantations PLC A n n u a l R e p o r t 2 0 1 6 - 1 7
53
safetyandability ingrowing for faunaandflora. It isalsooneofestateswhicharehavingbestbiodiversityhotspots.Doteloya is located incirca2,750 feetabovethesea levelamong the Dolosbage hills with immense eye catchingsceneriescoveringanareaofabout400kmbetweenKegalle,Yatiyantota,NawalapitiyaandGampola.Theestateincludesre-growth forest areas, largely in the form of abandonedcardamom cultivation. These areas act as importantsupplementary and/or additional habitats for native forestspecies,andserveashabitatcorridorsbetweenthepatchesof remnant old-growth forest on the estate and in thesurroundingarea.
The area is a best place to secure endangered speciesand mother land for several endemic species. The birdswhichcanbefoundverycommonareSriLankaSpurfowl(Galloperdixbicalcarata), Sri LankaChestnutbackedOwlet(Glaucidium castanonotum), Sri Lanka Hanging Parrot(Loriculusberyllinus),SriLankaMyna(Graculaptilogenys),SriLankaGreyHornbill(Ocycerosgingalensis),SriLankaScimitarBabbler (Pomatorhinus melanurus), Sri Lanka Junglefowl(Gallus lafayetii), Sri Lanka Spot-winged Thrush (Zootheraspiloptera),TheSri LankaOrange-billedBabbler (Turdoidesrufescens)andSriLankaMagpie(Urocissaornata).
Environmental Sustainability | Sustainability Report
Educating employees on importance of environment conservation
The Central Environment Authority, Kegalle conductedan awareness program to educate employees on theimportanceofenvironmentconservation.
Utilization of Material
In the manufacturing process in the factories of theCompany,varioustypesofmaterialsareuseddependingonthenatureoftheproductsbeingmanufactured.Therespectivequantitiesofmaterialsusedintheprocessofmanufacturinghavebeendepictedbelow.
Material Item 2016/17 2015/16
GreenLeaf(Kg) 10,159,482 11,127,076
Utilization of Energy
As a Company which is having operations in theareas of cultivation and processing of tea, rubber andcoconuts,wearerequiredtoutilizeenergyfromvarioussources incomparatively largevolumes.However,asawayofminimizingboth the costof theCompanyandalso the adverse impact on the environment due toenergyutilization,weareconstantlyconcernedwiththeamountofenergyutilizedincomparisontotheoutput.Accordingly, as a measure towards the sustainabledevelopment,wepromoteaculturewhichencouragesouremployeestoutilizeenergy inanefficientmanner.Ontheotherhand,weareintheprocessofscrutinizingthe information related to energy utilization to ensuretheefficientuseofenergy.
Energy Source 2016/17 2015/16
ElectricityUnitsConsumed 2,638,411 2,898,347ExpenditureonElectricity(Rs.‘000)
45,914 50,538

Kegalle Plantations PLC A n n u a l R e p o r t 2 0 1 6 - 1 7
54
ISO 9001:2015 System Certification
Kegalle Plantations PLC established a new record bybecoming the first Regional Plantation Company toobtainISO9001:2015CertificationinSeptember,2016and Four Rubber Factories namely Atale, Pallegama,ParambeandUdapolahavebeencertified.
Annual Report Award
Identifying the responsibility and undergoing self-compliance to its corporate ethics. Kegalle PlantationsPLCperformsitsmaximumeffortoncomplyingwithlawsandregulations.Thecertificateofcompliancehasbeenawarded by the Institute of Chartered Accountants toKegallePlantationsPLCfortheAnnualReportoftheyear2015/16atthe52ndAnnualReportAwardsCeremony.
OUR ACHIEVEMENTS
Industrial Excellence Awards – 2016
KegallePlantationsPLC’sAtaleEstatewastheGoldAwardWinnerofthe“IndustrialExcellenceAward2016”forthesecond consecutive year and the Award presentationwas held at Waters Edge on 16th November, 2016underthedistinguishedpatronageofHisExcellencythePresidentofSriLanka,Hon.MaithripalaSirisena.ThiswasconductedbySriLankaChamberforSmallandMediumIndustries.
Entrepreneur of the year Award 2016Kegalle – Business Excellence Award
KegallePlantationsPLC’sAtaleEstateclinchedthesecondpositionunderExtraLargeCategoryformanufactureinSabaragamuwaProvince.
Sustainability Report| Our Achievements Our Achievements | Sustainability Report
Mr Sriyan Eriyagama, Acting CEO of KPL accepting the ISO 9001 : 2015
System Certification from SGS Lanka

Kegalle Plantations PLC A n n u a l R e p o r t 2 0 1 6 - 1 7
55
Recieving the award - Enterpreneur of the year 2nd place - from Hon. Ranil
Wickramasinghe, Prime Minister
24th NCE Export Awards – 2016
KegallePlantationsPLCwaspresentedtheSilverAwardintheSmallCategoryunderAgriculturebulk–RubberProducts sub, for Sole Crepe Factory on Atale Estate,whichisanachievementbyanestateforthefirsttimeintheHistory,obtainedatNCEExportAwards.ThiswasinrecognitionoftheExportperformanceintheyear2015.
SLCBCC Business Star Awards – 2016
Silver Star Award
Sri Lanka – China Business Co-operation Council(SLCBCC)conductsAnnualAwardscompetitionamongcompaniesthatundertakeexportstoChina.AtaleEstateofKegallePlantationsPLCwonthePrestigiousSilverStarAwardunderLargeCategorymanufacturingSector forthesecondconsecutiveyear in recognitionofBusinessachievements.
National Energy Efficiency Awards - 2016
KegallePlantationsPLC’sAtaleEstate,SoleCrepeRubberFactory won the merit award under manufacturingSector – Small Scale Category at the National EnergyEfficiencyAwards.
ThisisthefirsttimeinSriLankanHistoryanestatehaswon an award at National Energy Efficiency awardsconducted by Sri Lanka Sustainable Energy AuthorityundertheMinistryofPowerandRenewableEnergy.
Our Achievements | Sustainability Report

Kegalle Plantations PLC A n n u a l R e p o r t 2 0 1 6 - 1 7
56
GENERAL STANDARD DISCLOSURES
GRI Indicator
DescriptionPage Reference
Page No.
External Assurance
STRATEGY AND ANALYSIS
G4-1 Statementfromthemostseniordecisionmakerfromtheorganization ChairmanReview 09 No
ORGANIZATIONAL PROFILE
G4-3 Reportthenameoftheorganization CorporateInformation B.I.C.* No
G4-4 Reporttheprimarybrands,products,andservices OperatingEnvironment 16 No
G4-5 Reportthelocationoftheorganization’sheadquarters CorporateInformation B.I.C.* No
G4-6 Report thenumberofcountrieswhere theorganizationoperates,andnamesofcountrieswhereeithertheorganizationhassignificantoperationsorthatarespecificallyrelevanttothesustainabilitytopicscoveredinthereport
OurEstates-Locations 12 No
G4-7 Reportthenatureofownershipandlegalform CorporateInformation B.I.C.* No
G4-8 Reportthemarketsserved OperatingEnvironment 16 No
G4-9 Reportthescaleoftheorganization FinancialHighlights 07 No
G4-10 Totalworkforcebyemploymenttype,employmentcontractandregionbrokendownbygender
EmploymentStrength 65 No
G4-11 Report the percentage of total employees covered by collective bargainingagreements
IndustrialRelations&CollectiveAgreements
48 No
G4-12 Describetheorganization’ssupplychain SustainableProcurement Practices
48 No
G4-13 Significant changes during the reporting period regarding the organization’ssize,structure&ownership
Milestones/Chairman’sReview
06/09 No
G4-14 Reportwhetherandhowtheprecautionaryapproachorprincipleisaddressedbytheorganization
RiskManagement 73 No
G4-15 Listexternallydevelopedeconomic,environmentalandsocialcharters,principles,orotherinitiativestowhichtheorganizationsubscribesorwhichitendorses
EnvironmentalSustainability
50 No
G4-16 Memberships in associations (such as industry associations) and national orinternationaladvocacyorganizations
ProductResponsibility 48 No
IDENTIFIED MATERIAL ASPECTS & BOUNDARIES
G4-17 Organisation’sentitiescoveredbythereport IdentifiedMaterialAspects&Boundaries
37 No
G4-18 Processfordefiningthereportcontent IdentifiedMaterialAspects&Boundaries
37 No
G4-19 ListallthematerialAspectsidentifiedintheprocessfordefiningreportcontent IdentifiedMaterialAspects&Boundaries
37 No
G4-20 ForeachmaterialAspect,reporttheAspectBoundarywithintheorganization IdentifiedMaterialAspects&Boundaries
37 No
G4-21 AspectBoundaryforeachmaterialaspectreportoutsidetheorganization IdentifiedMaterialAspects&Boundaries
37 No
G4-22 Report the effect of any restatements of information provided in previousreports, and the reasons for such restatements
NotestoFinancialStatements
133 No
G4-23 Significant changes fromprevious reportingperiods in theScopeandAspectBoundaries
FirstTimeAdoption - -
Stakeholder Engagement
G4-24 Providealistofstakeholdergroupsengagedbytheorganization OurStakeholders 40 No
G4-25 Report thebasis for identification and selectionof stakeholderswithwhom toengage
OurStakeholders 40 No
Sustainability Report | GRI Content Index GRI Content Index | Sustainability Report
*BackInnerCover
GRI CONTENT INDEX : “In accordance” - Core

Kegalle Plantations PLC A n n u a l R e p o r t 2 0 1 6 - 1 7
57
G4-26 Approachtostakeholderengagement, includingfrequencyofengagementbytypeandbystakeholdergroup
OurStakeholders 40 No
G4-27 Keytopicsandconcernsthathavebeenraisedthroughstakeholderengagement,andhowtheorganizationhasrespondedtothosekeytopicsandconcerns
OurStakeholders 40 No
Report Profile
G4-28 Reportingperiod IntroductiontotheReport
04 No
G4-29 Dateofmostrecentpreviousreport FinancialCalendar 14 No
G4-30 Reportingcycle IntroductiontotheReport
04 No
G4-31 Contactpointforquestionsregardingthereportoritscontents IntroductiontotheReport
04 No
G4-32 ‘Inaccordance’optiontheorganizationhaschosen&GRIContentIndexforthechosen option
IntroductiontotheReport
04 No
G4-33 Policyandcurrentpracticeswith regard to seekingexternalassurance for theReport
IntroductiontotheReport
04 No
Governance
G4-34 GovernanceStrucureoftheOrganisation, includingcommitteesofthehighestgovernancebody
CorporateGovernance 66 No
Ethics & Integrity
G4-56 Organization’svalues,principles,standardsandnormsofbehaviorsuchascodesof conduct and codes of ethics
EthicalBehaviour 49 No
STANDARD SPECIFIC DISCLOSURES
Category : Economic
Material Aspect : Economic Performance
G4-DMA GenericdisclosureonEconomicperformance FinancialReview 29 No
G4-EC1 Directeconomicvaluegeneratedanddistributed Statement of Valued Added
43 No
G4-EC2 Financial implications andother risks andopportunities for theorganization’sactivitiesduetoclimatechange
RiskManagement 73 No
G4-EC3 Coverageoftheorganization’sdefinedbenefitplanobligations NotestotheFinancialStatements
128 No
G4-EC4 Financialassistancereceivedfromgovernment NotestotheFinancialStatements
129 No
Material Aspect : Market Presence
G4-DMA Generaldisclosuresonmarketpresence EmployeeStrength 65 No
G4-EC5 Ratiosofstandardentrylevelwagebygendercomparedtolocalminimumwageatsignificantlocationsofoperation
NotReported - -
Material Aspect : Indirect Economic Impacts
G4-DMA GeneralDisclosuresonIndirecteconomicimpacts IndustrialRelations&CollectiveAgreements
48 No
G4-EC7 Developmentandimpactofinfrastructureinvestmentsandservicessupported Employees’Health&Welfare
44 No
G4-EC8 Significantindirecteconomicimpacts,includingtheextentofimpacts RiskManagement 73 No
Material Aspect : Procurement Practice
G4-DMA GeneralDisclosuresonprocurementpractices SustainableProcurement Practices
48 No
G4-EC9 Proportionofspendingonlocalsuppliersatsignificantlocationsofoperation NotReported - -
GENERAL STANDARD DISCLOSURES
GRI Indicator
Description Page Reference Page No.
E x t e r n a l Assurance
GRI Content Index | Sustainability Report
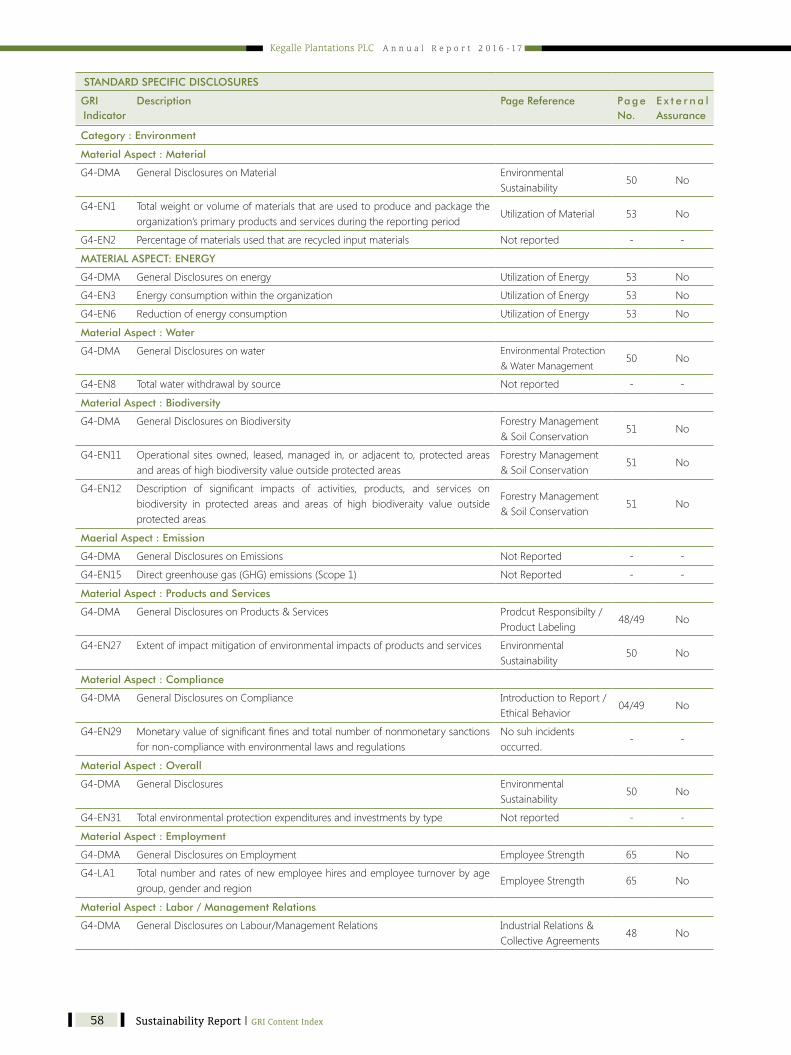
Kegalle Plantations PLC A n n u a l R e p o r t 2 0 1 6 - 1 7
58
Category : Environment
Material Aspect : Material
G4-DMA GeneralDisclosuresonMaterial EnvironmentalSustainability
50 No
G4-EN1 Totalweightorvolumeofmaterialsthatareusedtoproduceandpackagetheorganization’sprimaryproductsandservicesduringthereportingperiod
UtilizationofMaterial 53 No
G4-EN2 Percentageofmaterialsusedthatarerecycledinputmaterials Not reported - -
MATERIAL ASPECT: ENERGY
G4-DMA GeneralDisclosuresonenergy UtilizationofEnergy 53 No
G4-EN3 Energyconsumptionwithintheorganization UtilizationofEnergy 53 No
G4-EN6 Reductionofenergyconsumption UtilizationofEnergy 53 No
Material Aspect : Water
G4-DMA GeneralDisclosuresonwater EnvironmentalProtection&WaterManagement
50 No
G4-EN8 Totalwaterwithdrawalbysource Not reported - -
Material Aspect : Biodiversity
G4-DMA GeneralDisclosuresonBiodiversity ForestryManagement&SoilConservation
51 No
G4-EN11 Operational sitesowned, leased,managed in,oradjacent to,protectedareasandareasofhighbiodiversityvalueoutsideprotectedareas
ForestryManagement&SoilConservation
51 No
G4-EN12 Description of significant impacts of activities, products, and services onbiodiversity in protected areas and areas of high biodiveraity value outsideprotected areas
ForestryManagement&SoilConservation
51 No
Maerial Aspect : Emission
G4-DMA GeneralDisclosuresonEmissions NotReported - -
G4-EN15 Directgreenhousegas(GHG)emissions(Scope1) NotReported - -
Material Aspect : Products and Services
G4-DMA GeneralDisclosuresonProducts&Services ProdcutResponsibilty/ProductLabeling
48/49 No
G4-EN27 Extentofimpactmitigationofenvironmentalimpactsofproductsandservices EnvironmentalSustainability
50 No
Material Aspect : Compliance
G4-DMA GeneralDisclosuresonCompliance IntroductiontoReport/EthicalBehavior
04/49 No
G4-EN29 Monetaryvalueofsignificantfinesandtotalnumberofnonmonetarysanctionsfornon-compliancewithenvironmentallawsandregulations
No suh incidents occurred.
- -
Material Aspect : Overall
G4-DMA GeneralDisclosures EnvironmentalSustainability
50 No
G4-EN31 Totalenvironmentalprotectionexpendituresandinvestmentsbytype Not reported - -
Material Aspect : Employment
G4-DMA GeneralDisclosuresonEmployment EmployeeStrength 65 No
G4-LA1 Totalnumberandratesofnewemployeehiresandemployeeturnoverbyagegroup,genderandregion
EmployeeStrength 65 No
Material Aspect : Labor / Management Relations
G4-DMA GeneralDisclosuresonLabour/ManagementRelations IndustrialRelations&CollectiveAgreements
48 No
STANDARD SPECIFIC DISCLOSURES
GRI Indicator
Description Page Reference Page No.
E x t e r n a l Assurance
Sustainability Report | GRI Content Index GRI Content Index | Sustainability Report
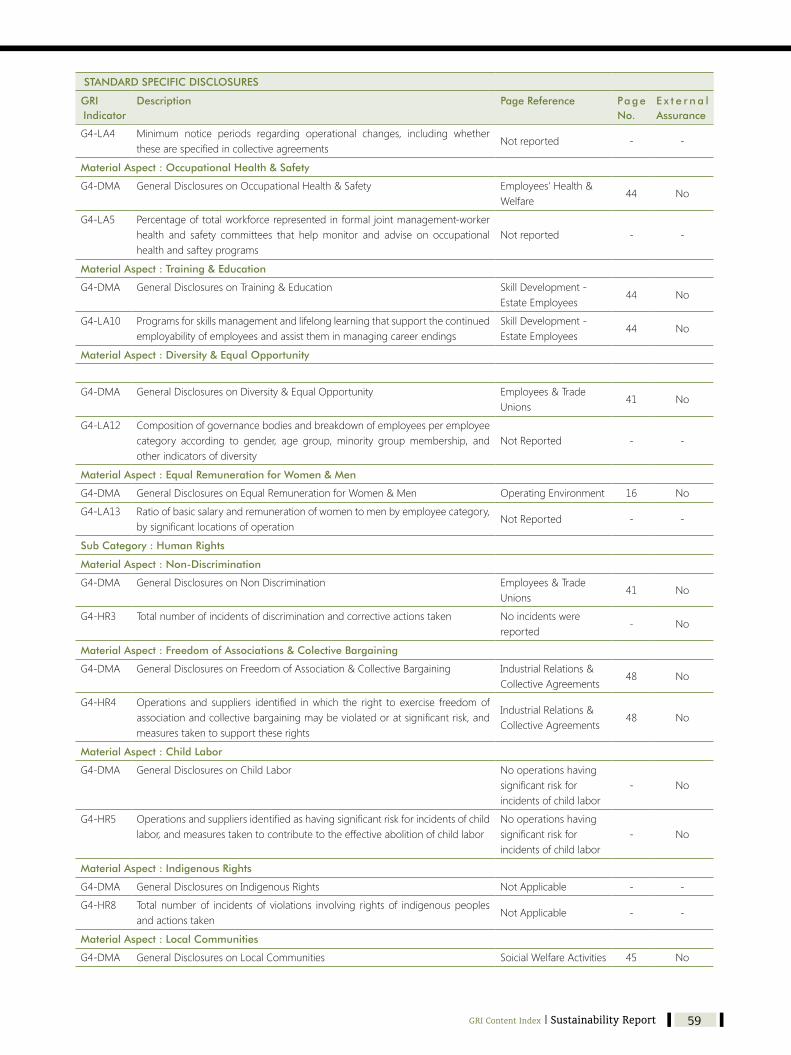
Kegalle Plantations PLC A n n u a l R e p o r t 2 0 1 6 - 1 7
59
G4-LA4 Minimum notice periods regarding operational changes, including whetherthesearespecifiedincollectiveagreements
Not reported - -
Material Aspect : Occupational Health & Safety
G4-DMA GeneralDisclosuresonOccupationalHealth&Safety Employees’Health&Welfare
44 No
G4-LA5 Percentageoftotalworkforcerepresentedinformal jointmanagement-workerhealth and safety committees that helpmonitor and advise on occupationalhealthandsafteyprograms
Not reported - -
Material Aspect : Training & Education
G4-DMA GeneralDisclosuresonTraining&Education SkillDevelopment-EstateEmployees
44 No
G4-LA10 Programsforskillsmanagementandlifelonglearningthatsupportthecontinuedemployabilityofemployeesandassisttheminmanagingcareerendings
SkillDevelopment-EstateEmployees
44 No
Material Aspect : Diversity & Equal Opportunity
G4-DMA GeneralDisclosuresonDiversity&EqualOpportunity Employees&TradeUnions
41 No
G4-LA12 Compositionofgovernancebodiesandbreakdownofemployeesperemployeecategory according to gender, age group, minority group membership, andotherindicatorsofdiversity
NotReported - -
Material Aspect : Equal Remuneration for Women & Men
G4-DMA GeneralDisclosuresonEqualRemunerationforWomen&Men OperatingEnvironment 16 No
G4-LA13 Ratioofbasicsalaryandremunerationofwomentomenbyemployeecategory,bysignificantlocationsofoperation
NotReported - -
Sub Category : Human Rights
Material Aspect : Non-Discrimination
G4-DMA GeneralDisclosuresonNonDiscrimination Employees&TradeUnions
41 No
G4-HR3 Totalnumberofincidentsofdiscriminationandcorrectiveactionstaken No incidents were reported
- No
Material Aspect : Freedom of Associations & Colective Bargaining
G4-DMA GeneralDisclosuresonFreedomofAssociation&CollectiveBargaining IndustrialRelations&CollectiveAgreements
48 No
G4-HR4 Operations and suppliers identified inwhich the right to exercise freedomofassociationandcollectivebargainingmaybeviolatedoratsignificantrisk,andmeasurestakentosupporttheserights
IndustrialRelations&CollectiveAgreements
48 No
Material Aspect : Child Labor
G4-DMA GeneralDisclosuresonChildLabor Nooperationshavingsignificantriskforincidentsofchildlabor
- No
G4-HR5 Operationsandsuppliersidentifiedashavingsignificantriskforincidentsofchildlabor,andmeasurestakentocontributetotheeffectiveabolitionofchildlabor
Nooperationshavingsignificantriskforincidentsofchildlabor
- No
Material Aspect : Indigenous Rights
G4-DMA GeneralDisclosuresonIndigenousRights NotApplicable - -
G4-HR8 Total numberof incidents of violations involving rights of indigenouspeoplesandactionstaken
NotApplicable - -
Material Aspect : Local Communities
G4-DMA GeneralDisclosuresonLocalCommunities SoicialWelfareActivities 45 No
STANDARD SPECIFIC DISCLOSURES
GRI Indicator
Description Page Reference Page No.
E x t e r n a l Assurance
GRI Content Index | Sustainability Report

Kegalle Plantations PLC A n n u a l R e p o r t 2 0 1 6 - 1 7
60
G4-SO1 Percentage of operations with implemented local community engagement,impactassessments,anddevelopmentprograms
NotReported - -
Material Aspect : Public Policy
G4-DMA GeneralDisclosuresonPublicPolicy NotReported - -
G4-SO6 Totalvalueofpoliticalcontributionsbycountryandrecipient/beneficiary NotReported - -
Material Aspect : Anti Competitive Behaviour
G4-DMA GeneralDisclosuresonAnti-CompetitorBehaviour NoincidentsReported - No
G4-SO7 Total number of legal actions for anti-competitive behaviour, antitrust, andmonopoly practices and their outcomes
NoincidentsReported - No
Material Aspect : Compliance
G4-DMA GeneralDisclosuresonCompliance IntroductiontotheReport/EthicalBehaviour
04/49 No
G4-SO8 Monetaryvalueofsignificantfinesandtotalnumberofnonmonetarysanctionsfornon-compliancewithlawsandregulations
NoincidentsReported - No
Material Aspects : Supplier Assessment for Impacts on Society
G4-DMA GeneralDisclosuresonSupplierAssessmentforImpactsonSociety SustainableProcurement Practices
48 No
G4-SO9 Percentageof new suppliers thatwere screenedusing criteria for impactsonsociety
NotReported - -
Material Aspect : Grievance Mechanism for Impacts on the society
G4-DMA GeneralDisclosuresonGrievanceMechanismsforImpactsonSociety NotReported - -
G4-SO11 Numberofgrievancesaboutimpactsonsocietyfiled,addressed,andresolvedthroughformalgrievancemechanisms
NotReported - -
Sub Category : Product Responsibility
Material Aspect : Customer Health & Safety
G4-DMA GeneralDisclosuresonCustomerHealth&Safety ProductResponsibility - No
G4-PR2 Total number of incidents of non-compliance with regulations and voluntarycodesconcerningthehealthandsafetyimpactsofproductsandservicesduringtheirlifecycle,bytypeofoutcomes
No such incidents occurred
- No
Material Aspect : Product & Service Labeling
G4-DMA GeneralDisclosuresonProduct&ServiceLabeling ProductResponsibility 48 No
G4-PR3 Typeofproductandserviceinformationrequiredbytheorganization’sproceduresforproductandserviceinformationandlabelling,andpercentageofsignificantproductandservicecategoriessubjecttosuchinformationrequirements
ProductResponsibility 48 No
Material Aspect : Customer Privacy
G4-DMA GeneralDisclosuresonCustomerPrivacy No incident reported - No
G4-PR8 Total number of substantiated complaints regarding breaches of customerprivacyandlossesofcustomerdata
No incident reported - No
Material Aspect : Compliance
G4-DMA GeneralDisclosuresonCompliance No incident reported - No
G4-PR9 Monetaryvalueofsignificantfinesfornon-compliancewithlawsandregulationsconcerningtheprovisionanduseofproductsandservices
No incident reported - No
STANDARD SPECIFIC DISCLOSURES
GRI Indicator
Description Page Reference Page No.
E x t e r n a l Assurance
Sustainability Report | GRI Content Index GRI Report | Management Discussion & Analysis
Gov
ern
ance
Rev
iew

Kegalle Plantations PLC A n n u a l R e p o r t 2 0 1 6 - 1 7
61GRI Report | Management Discussion & Analysis
Gov
ern
ance
Rev
iew
Board of Directors ...................................... 62Management Team .................................... 64Corporate Governance .............................. 66Report of the Audit Committee ................... 69Report of the Remuneration Committee ...... 71Report of the Related Party Transactions Review Committee .................. 72Risk Management ...................................... 73
Mature Stage
Having gone through the immature phase on the03rd year Palm start producing economical cropsrecording 3.5 – 4 tons of Fresh Fruit Bunches peryearperhectare.Theharvestingroundsarespreadbetween 10 – 15 days interval and approximately30 rounds harvesting is possible per year. Theharvesterselectonlythewellripebunchesonvisualobservation of the colour and lose sockets of thebunch. A bunch is weighing in the first year of itsharvestaround5–6kilos.
The ripeness is importantas theoilquality andoilyieldisdirectlyrelatedtotheripenessofthebunch.Thiscultivationwithastandofover110Palmsperhectarehasapotentialofgiving25tonsofFFB(freshfruitbunches)or06tonsofPalmOilperhectareatitspeakorinthe10thyearaftertheplanting.
Tra
nsf
orm
ing
fro
m t
he T
rad
itio
n...
Continuedinpageno.79...
Contents

Kegalle Plantations PLC A n n u a l R e p o r t 2 0 1 6 - 1 7
62
HecurrentlyholdsthepositionofManagingDirectorofthePlantationsSectoroftheRichardPierisGroupandisaDirectorofKegallePlantationsPLC,NamunukulaPlantationsPLCandMaskeliyaPlantationsPLC.HehasoverthreedecadesofexperienceinthePlantationIndustry,havingcommencedhiscareer
asanAssistantSuperintendentandthereafterservedasSuperintendentuptothetimehejoinedthecorporatemanagementofKegallePlantationsPLCin1998.
HeisthecurrentChairmanofthePlanters’AssociationofCeylonandtheColomboRubberTraders’Association.HeisalsoaDirectorofRichardPierisNaturalFoamsLtd.,ExoticHorticulture(Pvt)Ltd.,AENOilPalmProcessing(Pvt)Ltd.,andamemberoftheBoardsofDirectorsoftheSriLankaTeaBoardandRubberResearchBoard.HealsoservesasaCouncilMemberoftheCeylonChamberofCommerce,theAdvisoryCommitteeonRubber&PlasticsSectoroftheExportDevelopmentBoardandtheExecutiveCommitteeofTheSriLankaSocietyofRubber Industry.HealsoservesontheWagesBoardsfortheRubberGrowingandManufacturingTrade,CoconutGrowingTrade,Cocoa,Cardamom&PepperGrowing&ManufacturingTrade.
Prof.Nugawela joined theRubberResearch Institute in thecapacityofanAssistantBotanist in1980.HewasawardedaColomboPlanScholarshipin1981toreadforhisMastersDegreeandin1982hesuccessfullycompleteditinthefieldofAppliedPlantSciencesattheUniversityofLondon.Hehasextensive
experienceover30yearsinthecapacitiesofaBotanist,HeadofPlantScienceDepartment,DeputyDirectorResearch(Biology)andasaDirectorattheRubberResearchInstitute.InJanuary2011,Prof.NugawelaresignedfromthepostofDirectorofRubberResearchInstitutetoassumedutiesasaProfessorintheDepartmentofPlantationManagement,WayambaUniversityofSriLanka.
In1985hewasofferedascholarshipbytheFoodandAgriculturalOrganizationoftheUnitedNationstoobtainhisprofessionalqualifications.ForhisresearchworkonPlantPhysiologyandBioProductivityinHeveabrasiliensis(thenaturalrubberplant)hewasawardedaPhDfromtheUniversityofEssex,UKin1989.
Histhrustareasofresearchanddevelopmentwereonnurseryandplantingpractices,exploitation,useofyieldstimulantsandrainguards.Hehasmorethan130publicationsinbothlocalandforeignresearchjournalsandhasaddressedmanylocalandinternationalconferencesonnaturalrubber.ForhisResearchandDevelopmentworkhehaswonaNationalScienceandTechnologyAwardin2009andthePresidentialAwardforinventionsinthecategoryofenvironmentin2012.FurtherhehasalsobeenawardedwithPresidentialAwardsforhisresearchpublicationsinreputedinternationaljournals.
Prof.NugawelawasappointedtotheBoardofKegallePlantationsPLCwitheffectfrom26May2008.
Dr. Sena Yaddehige is a Sri Lankan born British Scientist/Engineer and a Swiss based industrialist.Dr. Yaddehige is the Chairman of the Richard Pieris Group of Companies comprising seven ListedCompanies,includingthreePlantationCompanies,andover50Companieswhollyormajorityowned
byRichardPierisandCompanyPLC.HeservedasaDirectorintheBoardofDirectorsofNationalDevelopmentBankPLCduringtheperiodbetween2007and2010.
Dr. Yaddehige is a brilliant scientist and a high energy radiation specialist who innovated and developed contactless sensortechnology,drivebywiresystemsandmadenumerousinventionsinradiationprocessingforwhichheholdsworldwidepatents. Inadditionhealsoholds thepatent for slow release fertilizer inSriLanka.
He is a Founder, Chairman andDirector of numerousCompanies in Sri Lanka, USA, Japan, UK,Germany, SwitzerlandandSingapore.He is also the foundingManagingDirectorof aEuropeanCompany,whichmanufacturesandexportsautomotivecomponentsandsystems,developedbasedonhisowninnovations,toEurope,Japan,ChinaandtheUnitedStates.
Dr.YaddehigewasconferredwithDoctorofScience(D.Sc.) inconsiderationofhisoriginal researchworkinthefieldsofRadiation,Radiationprocessing,ElectromechanicalSensortechnology,noncontactsensortechnologyandautomotivepedalsystemsalongwithnumerouspatentsintheabovefields.
Governance Review | Board of Directors Board of Directors Board of Directors Board of Directors | Governance Review
BOARD OF DIRECTORS

Kegalle Plantations PLC A n n u a l R e p o r t 2 0 1 6 - 1 7
63
Dr.SSBDGJayawardenaobtainedhisB.Sc.DegreeonAgriculturewithHonoursfromUniversityofCeylon.HisM.Sc.isonAgronomywasobtainedinKyoto,andhisPh.D.onAgronomy&PhysiologyfromUniversityofKyoto.
Dr.JayawardenacurrentlyservesasthechairmanoftheSriLankaCouncilforAgriculturalResearchPolicyandadvisortotheHon.MinisterofAgriculture.HehasservedtheDepartmentofAgricultureover03decadesandretiredastheDirectorGeneraloftheAgriculture.AfterretirementhehasservedtheplantationsectorasDirectorofTeaResearchInstitute,ChairmanofTeaResearchBoard,ChairmanofCoconutResearchBoardandadvisortotheMinisterofPlantationIndustry.HehasalsoservedasamemberofmanytaskforcesappointedbythegovernmentofSriLankaandcontinuestoserveasmemberoftheNationalSalariesandCadreCommission.In2010hewasappointedasadirectortotheBoardofDirectorsofKegallePlantationsPLC.
Inaddition to theabove,Dr. Jayawardenawas theFAOrepresentative to theConsultativeGroupinInternationalAgricultureResearchandhasservedasaFAOConsultantinBio-diversityandJICAConsultanttotheGovernmentofGhanaonHorticultureSectorDevelopment.
Hehasover46yearsofprofessionalexperiencecoveringagricultural researchanddevelopmentactivities, human resource development, development of foreign funded projects, and directinvolvementinfoodsecurityandpovertyalleviationprogramsofthecountry.
HehasparticipatedinmanyInternationalConferencesrelatedtoagriculturedevelopment,researchmanagement,foodsecurity,bio-diversityandsustainableAgricultureinmanyCountriesintheworld.
Mr.ShamindaYaddehigehasbeenappointedtotheDirectorateofKegallePlantationsPLCwitheffectfrom1March2016asaNonExecutiveDirector.
Mr.YaddehigewaseducatedatCharterHouse,UnitedKingdomandgraduatedinChemicalEngineeringfromUniversityCollegeLondon.AfterestablishinghimselfinbusinessinEuropeandUSA,hefurthergraduatedinMasterofBusinessAdministrationatIEBusinessSchool,aglobaltop10rankedbusinessschool.
HeworkedasaManagementConsultantatPriceWaterhouseCoopers,UnitedKingdomandalsoatworldrenownedInternationalUltraHighNetWorthbankinggiant,CreditSuisseofSwitzerland.Hehasanextensiveexperience in InternationalMarketingandhasbuiltaverystrongmarketingnetworkinEurope.
Mr.YaddehigeisintheDirectorateofRichardPieris&CompanyPLCasanExecutiveDirector/ChiefOperatingOfficeroftheCompanyandalso intheDirectoratesofRichardPierisExportsPLCandSubsidiaryCompaniesoftheRichardPierisGroup.
Board of Directors Board of Directors | Governance Review
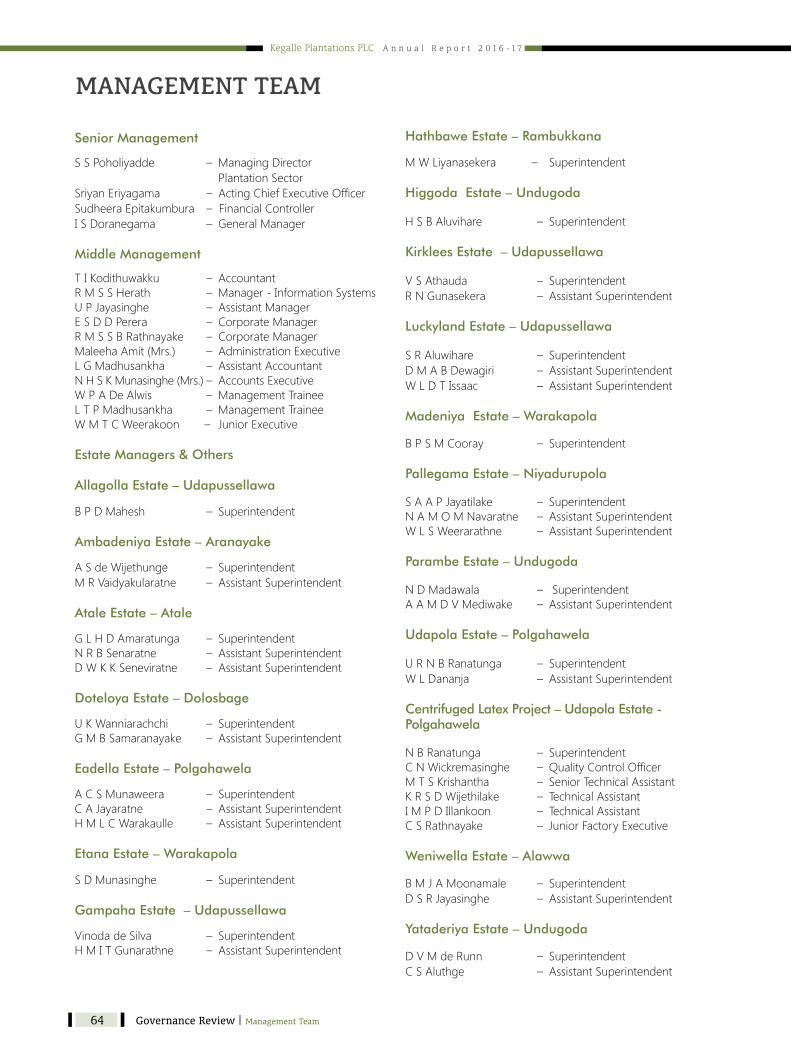
Kegalle Plantations PLC A n n u a l R e p o r t 2 0 1 6 - 1 7
64
MANAGEMENT TEAM
Senior Management
SSPoholiyadde – ManagingDirector Plantation SectorSriyanEriyagama – ActingChiefExecutiveOfficerSudheeraEpitakumbura –FinancialControllerISDoranegama – GeneralManager
Middle Management
TIKodithuwakku –AccountantRMSSHerath – Manager-InformationSystemsUPJayasinghe – AssistantManagerESDDPerera – CorporateManagerRMSSBRathnayake – CorporateManagerMaleehaAmit(Mrs.) – AdministrationExecutiveLGMadhusankha – AssistantAccountantNHSKMunasinghe(Mrs.)– AccountsExecutiveWPADeAlwis –ManagementTraineeLTPMadhusankha –ManagementTraineeWMTCWeerakoon – JuniorExecutive
Estate Managers & Others
Allagolla Estate – Udapussellawa
BPDMahesh – Superintendent
Ambadeniya Estate – Aranayake
ASdeWijethunge – SuperintendentMRVaidyakularatne –AssistantSuperintendent
Atale Estate – Atale GLHDAmaratunga – SuperintendentNRBSenaratne – AssistantSuperintendentDWKKSeneviratne – AssistantSuperintendent
Doteloya Estate – Dolosbage
UKWanniarachchi – SuperintendentGMBSamaranayake – AssistantSuperintendent
Eadella Estate – Polgahawela
ACSMunaweera –SuperintendentCAJayaratne – AssistantSuperintendentHMLCWarakaulle –AssistantSuperintendent
Etana Estate – Warakapola
S DMunasinghe – Superintendent
Gampaha Estate – Udapussellawa
VinodadeSilva – SuperintendentHMITGunarathne – AssistantSuperintendent
Hathbawe Estate – Rambukkana
MWLiyanasekera – Superintendent
Higgoda Estate – Undugoda
HSBAluvihare – Superintendent
Kirklees Estate – Udapussellawa
VSAthauda – SuperintendentRNGunasekera – AssistantSuperintendent
Luckyland Estate – Udapussellawa
SRAluwihare – SuperintendentDMABDewagiri –AssistantSuperintendentWLDTIssaac –AssistantSuperintendent
Madeniya Estate – Warakapola
BPSMCooray – Superintendent
Pallegama Estate – Niyadurupola
SAAPJayatilake – SuperintendentNAMOMNavaratne – AssistantSuperintendentWLSWeerarathne –AssistantSuperintendent
Parambe Estate – Undugoda
NDMadawala – SuperintendentAAMDVMediwake – AssistantSuperintendent
Udapola Estate – Polgahawela
URNBRanatunga – SuperintendentWLDananja –AssistantSuperintendent
Centrifuged Latex Project – Udapola Estate - Polgahawela
NBRanatunga – SuperintendentCNWickremasinghe – QualityControlOfficerMTSKrishantha – SeniorTechnicalAssistantKRSDWijethilake – TechnicalAssistantIMPDIllankoon – TechnicalAssistantCSRathnayake – JuniorFactoryExecutive Weniwella Estate – Alawwa
BMJAMoonamale – SuperintendentDSRJayasinghe –AssistantSuperintendent
Yataderiya Estate – Undugoda
DVMdeRunn – SuperintendentCSAluthge – AssistantSuperintendent
Governance Review | Management Team Management Team | Governance Review

Kegalle Plantations PLC A n n u a l R e p o r t 2 0 1 6 - 1 7
65
Year Senior Management
MiddleManagement
EstateManagers&Executives
HeadOfficeStaff
EstateStaff Harvestors&Others
Total
2015/162016/17
44
1011
3638
912
341336
5,9455,465
6,3455,866
Categorization of Employees
Age Analysis - Executives Service Analysis - Executives
Service Analysis - Staff and WorkersAge Analysis - Staff and Workers
Executives - 53
Staff - 348
Workers - 5,465
21-30 Years - 28%, 15
31-40 Years - 25%, 13
Above 40 Years - 47%, 25
Below 5 Years - 36%, 19
Above 15 Years - 17%, 9
6 -15 Years - 47%, 25
Below 5 Years - 1,749
Above 15 Years - 2,109
6 -15 Years - 2,008
Below 20 Years - 17
21-30 Years - 565
31-40 Years - 1,570
Above 40 Years - 3,714
Employment Strength
Management Team | Governance Review

Kegalle Plantations PLC A n n u a l R e p o r t 2 0 1 6 - 1 7
66
CORPORATE GOVERNANCE
ARPICOINSURANCE PLC
KEGALLE PLANTATIONS PLC
100%
79%
35% 40%
Parent
Associate
RPC PLANTATION MANAGEMENT SERVICES (PVT) LTD
RICHARD PIERISNATURAL FOAMS LTD
HAMEFA KEGALLE(PVT) LTD
100%
RICHARD PIERIS & COMPANY PLCUltimate Parent
RICHARD PIERIS PLANTATIONS (PVT) LTD100%
Subsidiary
The Board of Directors of Kegalle Plantations PLC iscommitted and takes responsibility to maintain thehigheststandardsofCorporateGovernance.
Kegalle Plantations PLC has designed its CorporateGovernance policies and practices to ensure thatthe Company is focused on its responsibilities to itsstakeholders and on creating long term shareholdervalue. The Company recognizes the interests of allits stakeholders including shareholders, employees,customers, suppliers, consumers and the other communitiesinwhichitoperates.TheCompanycomplieswiththerulesonCorporateGovernance,includedintheListingRulesof theColomboStockExchange,and theCompany is guided by the principles included in theCodeofBestPracticeonCorporateGovernanceissuedjointlybytheSecuritiesandExchangeCommissionofSriLankaandtheInstituteofCharteredAccountantsofSriLanka.ThisstatementsetsouttheCorporateGovernancepolicies,practicesandprocessesadoptedbytheBoard.
Group Structure
The Board of Directors
TheCompanyisgovernedbyitsBoardofDirectors,whodirects and supervises the business and affairs of theCompanyonbehalfoftheshareholders.
The Board comprises five Directors, of which two areExecutive Directors whilst three are Non-ExecutiveDirectors. Out of three Non-Executive Directors, twoare Independent, ensuring an independent outlook totemper the expediencyof the experts. Brief profilesoftheDirectorsaresetoutonpages62and63.TheBoardmakesanassessmentannuallyontheindependenceornon-independence of each Non-Executive Director incompliancewithlistingrules.
DuringtheyeartheBoardmetontwooccasions.Priortoeachmeeting,theDirectorsareprovidedwithallrelevantmanagement information and background materialrelevant to the agenda to enable informed decisions.
Board Papers are submitted in advance on Companyperformance, new investments, capital projects andother issues which require specific Board approval. Aseparate information memorandum is provided onstatutorypaymentsateachBoardMeeting.
TheChairmanisresponsibleformattersrelatingtopolicy,maintaining regular contact with the other Directors,shareholdersandexternalstakeholdersoftheCompany.He is responsible for overall commercial, operationalandstrategicdevelopmentandassistedbyanExecutiveManagementCommitteecomprisingExecutiveDirectorsandHeadsofCompaniesoftheStrategicBusinessUnits (SBU) of the Ultimate Parent Company. The Financefunctiondevolveson theGroupChief FinancialOfficerandtheFinancialController,whoispresentbyinvitation
atboardmeetingswhenfinancialmattersarediscussed.The Board of Directors has access to independentprofessionaladviceasandwhendeemednecessaryfordecisionmaking.
The main functions of the Board are to:
● DirectthebusinessandaffairsoftheCompany.● Formulate short and long term strategies, as a
basis for theoperational plans of theCompanyand monitor implementation.
● Reportontheirstewardshiptoshareholders.● Identify the principal risks of the business and
ensure adequate risk management systems inplace.
Governance Review | Corporate Governance Corporate Governance | Governance Review
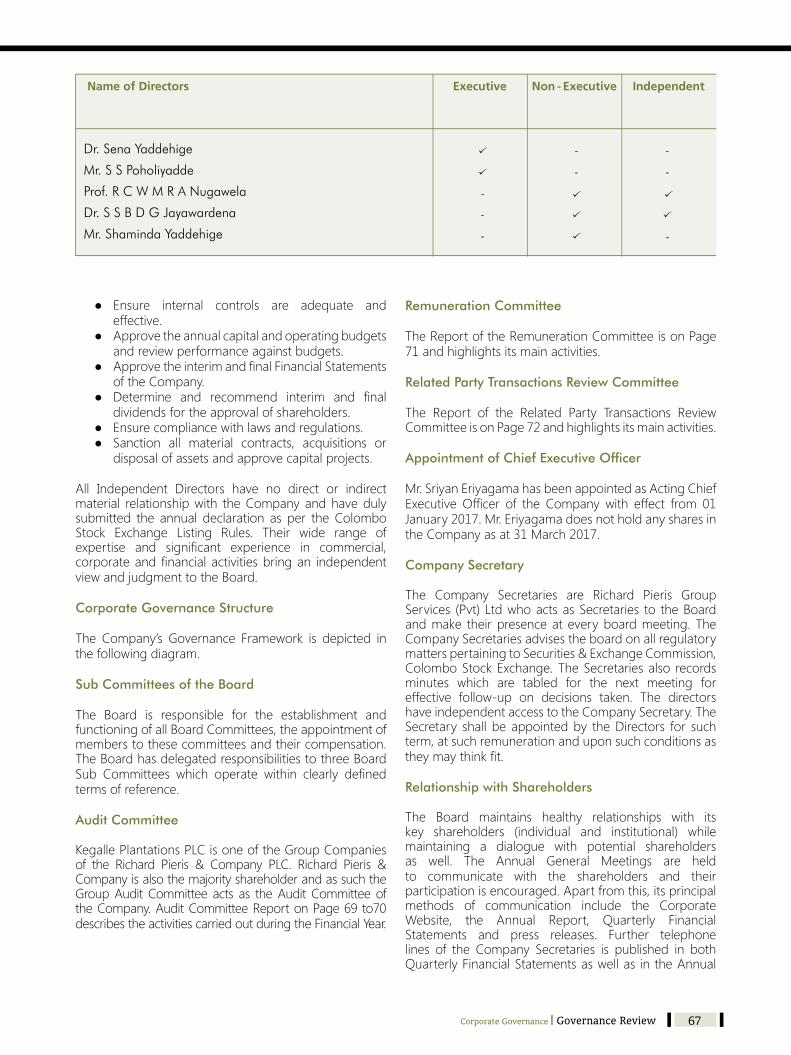
Kegalle Plantations PLC A n n u a l R e p o r t 2 0 1 6 - 1 7
67
Dr. Sena Yaddehige
Mr. S S Poholiyadde
Prof. R C W M R A Nugawela
Dr. S S B D G Jayawardena
Mr. Shaminda Yaddehige
● Ensure internal controls are adequate andeffective.
● Approvetheannualcapitalandoperatingbudgetsandreviewperformanceagainstbudgets.
● ApprovetheinterimandfinalFinancialStatementsoftheCompany.
● Determine and recommend interim and finaldividendsfortheapprovalofshareholders.
● Ensurecompliancewithlawsandregulations.● Sanction all material contracts, acquisitions or
disposalofassetsandapprovecapitalprojects.
All Independent Directors have no direct or indirectmaterial relationshipwith theCompanyandhavedulysubmitted the annual declaration as per theColomboStock Exchange Listing Rules. Their wide range ofexpertise and significant experience in commercial,corporateandfinancialactivitiesbringan independentviewandjudgmenttotheBoard.
Corporate Governance Structure
The Company’s Governance Framework is depicted inthefollowingdiagram.
Sub Committees of the Board
The Board is responsible for the establishment andfunctioningofallBoardCommittees,theappointmentofmemberstothesecommitteesandtheircompensation.TheBoardhasdelegatedresponsibilitiestothreeBoardSub Committees which operate within clearly definedterms of reference.
Audit Committee
KegallePlantationsPLCisoneoftheGroupCompaniesof the Richard Pieris & Company PLC. Richard Pieris &CompanyisalsothemajorityshareholderandassuchtheGroupAuditCommittee acts as theAuditCommitteeoftheCompany.AuditCommitteeReportonPage69to70describestheactivitiescarriedoutduringtheFinancialYear.
Remuneration Committee
TheReportoftheRemunerationCommitteeisonPage71andhighlightsitsmainactivities.
Related Party Transactions Review Committee
The Report of the Related Party Transactions ReviewCommitteeisonPage72andhighlightsitsmainactivities.
Appointment of Chief Executive Officer
Mr.SriyanEriyagamahasbeenappointedasActingChiefExecutiveOfficer of the Company with effect from 01January2017.Mr.EriyagamadoesnotholdanysharesintheCompanyasat31March2017.
Company Secretary
The Company Secretaries are Richard Pieris GroupServices (Pvt)LtdwhoactsasSecretaries to theBoardandmake theirpresenceateveryboardmeeting.TheCompanySecretariesadvisestheboardonallregulatorymatterspertainingtoSecurities&ExchangeCommission,ColomboStockExchange.TheSecretariesalso recordsminutes which are tabled for the next meeting foreffective follow-up on decisions taken. The directorshaveindependentaccesstotheCompanySecretary.TheSecretary shallbeappointedby theDirectors for suchterm, at such remuneration and upon such conditions as theymaythinkfit.
Relationship with Shareholders
The Board maintains healthy relationships with itskey shareholders (individual and institutional) whilemaintaining a dialogue with potential shareholdersas well. The Annual General Meetings are heldto communicate with the shareholders and their participationisencouraged.Apartfromthis,itsprincipalmethods of communication include the CorporateWebsite, the Annual Report, Quarterly FinancialStatements and press releases. Further telephonelines of the Company Secretaries is published in bothQuarterlyFinancialStatementsaswellas intheAnnual
Corporate Governance | Governance Review
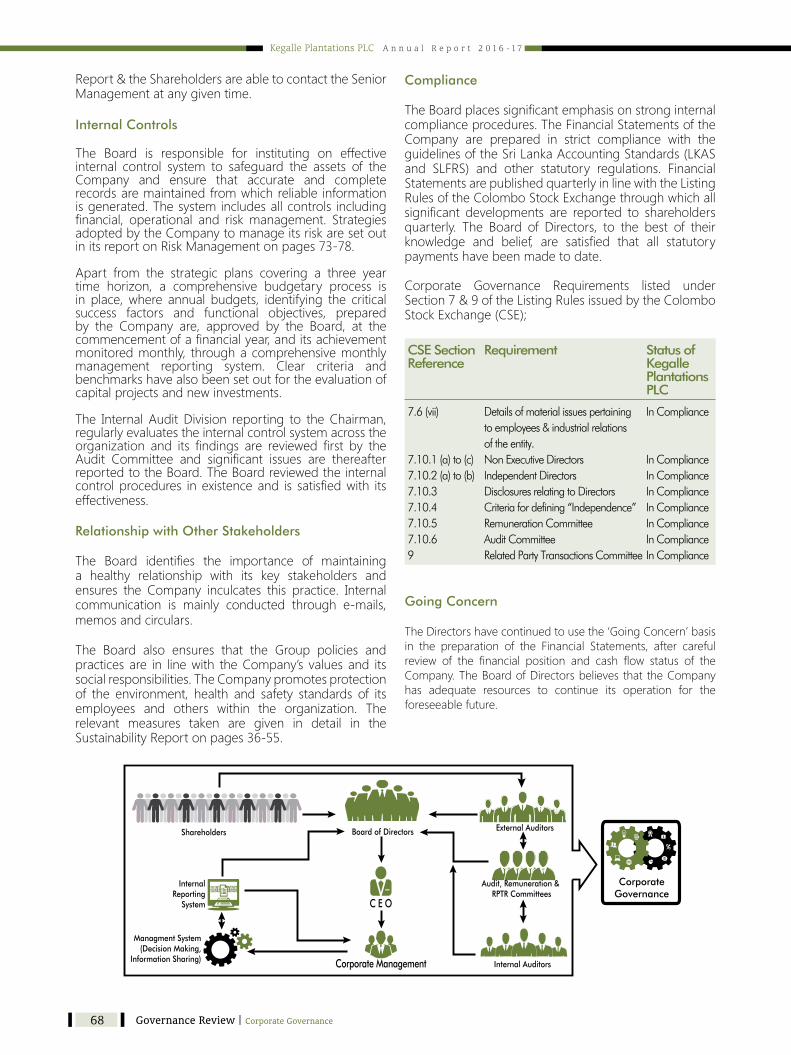
Kegalle Plantations PLC A n n u a l R e p o r t 2 0 1 6 - 1 7
68
Report&theShareholdersareabletocontacttheSeniorManagementatanygiventime.
Internal Controls
The Board is responsible for instituting on effectiveinternal control system to safeguard the assets of theCompany and ensure that accurate and completerecordsaremaintainedfromwhichreliable informationisgenerated.Thesystemincludesallcontrols includingfinancial, operational and riskmanagement. StrategiesadoptedbytheCompanytomanageitsriskaresetoutinitsreportonRiskManagementonpages73-78.
Apart from the strategic plans covering a three yeartime horizon, a comprehensive budgetary process isin place,where annual budgets, identifying the criticalsuccess factors and functional objectives, preparedby the Company are, approved by the Board, at thecommencementofafinancialyear,anditsachievementmonitoredmonthly, throughacomprehensivemonthlymanagement reporting system. Clear criteria andbenchmarkshavealsobeensetoutfortheevaluationofcapitalprojectsandnewinvestments.
The Internal AuditDivision reporting to theChairman,regularlyevaluatestheinternalcontrolsystemacrosstheorganization and its findings are reviewed first by theAudit Committee and significant issues are thereafterreportedtotheBoard.TheBoardreviewedtheinternalcontrolprocedures inexistenceand is satisfiedwith itseffectiveness.
Relationship with Other Stakeholders
The Board identifies the importance of maintaininga healthy relationship with its key stakeholders andensures the Company inculcates this practice. Internalcommunication is mainly conducted through e-mails,memos and circulars.
The Board also ensures that the Group policies andpracticesare in linewith theCompany’s valuesand itssocialresponsibilities.TheCompanypromotesprotectionof the environment, health and safety standards of itsemployees and others within the organization. Therelevant measures taken are given in detail in theSustainabilityReportonpages36-55.
Compliance
TheBoardplacessignificantemphasisonstronginternalcomplianceprocedures.TheFinancialStatementsoftheCompany are prepared in strict compliance with theguidelinesoftheSriLankaAccountingStandards(LKASand SLFRS) and other statutory regulations. FinancialStatementsarepublishedquarterlyinlinewiththeListingRulesoftheColomboStockExchangethroughwhichallsignificant developments are reported to shareholdersquarterly. The Board of Directors, to the best of theirknowledge and belief, are satisfied that all statutorypaymentshavebeenmadetodate.
Corporate Governance Requirements listed underSection7&9oftheListingRulesissuedbytheColomboStockExchange(CSE);
CSE Section Requirement Status of Reference Kegalle Plantations PLC
7.6 (vii) Details of material issues pertaining In Compliance to employees & industrial relations of the entity.7.10.1 (a) to (c) Non Executive Directors In Compliance7.10.2 (a) to (b) Independent Directors In Compliance7.10.3 Disclosures relating to Directors In Compliance7.10.4 Criteria for defining “Independence” In Compliance7.10.5 Remuneration Committee In Compliance7.10.6 Audit Committee In Compliance9 Related Party Transactions Committee In Compliance
Going Concern
TheDirectorshavecontinuedtousethe‘GoingConcern’basisin the preparation of the Financial Statements, after carefulreview of the financial position and cash flow status of theCompany.TheBoardofDirectorsbelievesthattheCompanyhas adequate resources to continue its operation for the foreseeablefuture.
Board of DirectorsShareholders
C E O
Corporate Management
External Auditors
Audit, Remuneration & RPTR Committees
InternalReporting
System
Internal Auditors
CorporateGovernance
Managment System(Decision Making,
Information Sharing)
Governance Review | Corporate Governance Report of the Audit Committee | Governance Review

Kegalle Plantations PLC A n n u a l R e p o r t 2 0 1 6 - 1 7
69
REPORT OF THE AUDIT COMMITTEE
TheAudit CommitteeCharter, approvedby the BoardofDirectorsdefinesthepurpose,authority,composition,meeting,andresponsibilitiesoftheCommittee.
ThepurposeoftheAuditCommitteeisto:
1. AssisttheBoardofDirectorsinfulfillingitsoverallresponsibilitiesforthefinancialreportingprocess.
2. Review the system of internal control and riskmanagement.
3. Monitor the effectiveness of the internal auditfunction.
4. Review the Company’s process for monitoringcompliancewithlawsandregulations.
5. Review the independence and performance oftheexternalauditors.
6. Tomake recommendations to theBoardon theappointmentofexternalauditorsandrecommendtheirremunerationandtermsofengagement.
TheAuditCommitteeconsistsofthreeIndependentNonExecutive Directors of the Richard Pieris & CompanyPLC, the Ultimate Parent Company, namelyMr. JagathC.Korale,Chairman,Dr.JayatissaDeCostaP.C.andMr.PrasannaFernando.Allthreememberswereappointedwith effect from 28 October 2016. The Chairman oftheCommittee is a Senior CharteredAccountant. TheCompanySecretaryfunctionsasSecretarytotheAuditCommittee.
The principal activities of the Committee are detailedbelow;
Meetings
The Audit Committee held eight meetings during theyearunderreview.
The Group Chief Financial Officer, Managing Directorof Plantation Sector, Chief Executive Officer, FinancialController,AccountantandGroupInternalAuditManagerwere invited if deemednecessary for audit committeemeetings.
Meetingswereheldwiththeexternalauditorsregarding
the scope and the conduct of the annual audits.
Internal Audit and Risk Management
The Internal Audit Programme was reviewed bythe Committee to ensure that it covered the majoroperationalaspectsoftheCompany.
The Group Internal Audit Manager was invited tobe present at all Audit Committee deliberations. Hepresentedasummaryofthesalientfindingsofallinternalauditsandinvestigationscarriedoutbyhisdepartmentfortheperiod.TheresponsesfromtheChiefExecutiveOfficer of the Company to the internal audit findingswere reviewed and where necessary corrective actionwas recommended and implementation monitored.
TheCommitteealsohadtheresponsibilitytoreviewthelossmakingEstatesof theCompanyandstrategies forturningroundtheseEstatesandrecommendingsuitablecorrectiveaction.
Internal Controls
During its meetings, the Committee reviewed theadequacy and effectiveness of the internal controlsystemsandtheCompany’sapproachtoitsexposuretothebusinessandfinancialrisks.ProcessesareinplacetosafeguardtheassetsoftheorganizationandtoensurethatthefinancialreportingsystemcanberelieduponinthepreparationandpresentationofFinancialStatements.AcomprehensiveManagementReportandAccountsareproducedatmonthendhighlightingallkeyperformancecriteriapertainingtotheKegallePlantationsPLCanditsSubsidiarywhichisreviewedbytheSeniorManagementonamonthlybasis.
BoardofDirectorsreviewsperformanceonaquarterlybasisormoreoften,ifrequired.
Financial Statements
The Committee reviewed the Company’s QuarterlyFinancial Statements, theAnnualReport andAccountsfor reliability, consistency and compliance with the SriLankaFinancialReportingStandardsandotherstatutoryrequirements, including the Companies Act, No 7 of2007,priortoissuance.ItalsoreviewedtheadequacyofdisclosureinthepublishedFinancialStatements.
Report of the Audit Committee | Governance Review

Kegalle Plantations PLC A n n u a l R e p o r t 2 0 1 6 - 1 7
70
TheGrouphassuccessfullyadoptedthenewSriLankaAccountingStandards(newSLAS)comprisingLKASandSLFRSapplicableforfinancialperiodscommencingfrom01 April 2012 as issued by the Institute of CharteredAccountantsofSriLanka.
External Auditors
The Audit Committee has reviewed the other servicesprovided by the External Auditors to the Company toensure their independence as Auditors has not beencompromised.
TheCommitteereviewedtheManagementLettersissuedby the External Auditors, the Management responsethereto and also attended to matters specificallyaddressedtothem.TheexternalauditorskepttheAuditCommitteeinformedonanon-goingbasisofallmatters
of significance. The Committee met with the Auditorsanddiscussedissuesarisingfromtheauditandcorrectiveactiontakenwherenecessary.
TheAuditCommitteehas recommended to theBoardofDirectorsthatMessrs.Ernst&Youngbere-appointedasAuditorsforthefinancialyearending31March,2018subjecttotheapprovaloftheshareholdersatthenextAnnualGeneralMeeting.
Conclusion
The Audit Committee is satisfied that the controlenvironment prevailing in the organization providesreasonable assurance regarding the reliability of thefinancial reporting of the Company, the assets aresafeguardedandthattheListingRulesoftheColomboStockExchangehavebeenmet.
JagathC.KoraleChairman-AuditCommittee
31May2017
Governance Review | Report of the Audit Committee Report of the Remuneration Committee | Governance Review
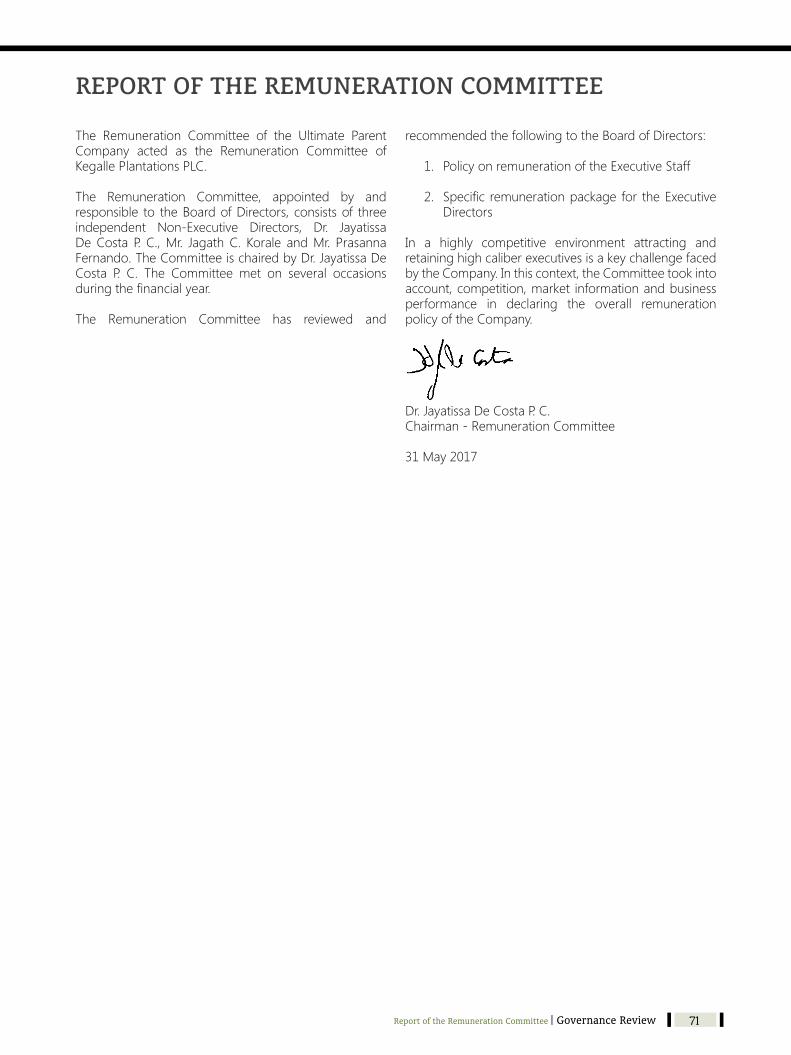
Kegalle Plantations PLC A n n u a l R e p o r t 2 0 1 6 - 1 7
71
REPORT OF THE REMUNERATION COMMITTEE
The Remuneration Committee of the Ultimate ParentCompany acted as the Remuneration Committee ofKegallePlantationsPLC.
The Remuneration Committee, appointed by andresponsible to theBoardofDirectors, consistsof threeindependent Non-Executive Directors, Dr. JayatissaDeCosta P. C.,Mr. JagathC. Korale andMr. PrasannaFernando.TheCommitteeischairedbyDr.JayatissaDeCosta P. C. The Committee met on several occasionsduringthefinancialyear.
The Remuneration Committee has reviewed and
recommendedthefollowingtotheBoardofDirectors:
1. PolicyonremunerationoftheExecutiveStaff
2. Specific remunerationpackage for theExecutiveDirectors
In a highly competitive environment attracting andretaininghighcaliberexecutivesisakeychallengefacedbytheCompany.Inthiscontext,theCommitteetookintoaccount,competition,market informationandbusinessperformance in declaring the overall remunerationpolicyoftheCompany.
Dr.JayatissaDeCostaP.C.Chairman-RemunerationCommittee
31May2017
Report of the Remuneration Committee | Governance Review

Kegalle Plantations PLC A n n u a l R e p o r t 2 0 1 6 - 1 7
72
REPORT OF THE RELATED PARTY TRANSACTIONS REVIEW COMMITTEETheRelatedPartyTransactionsReviewCommitteeoftheUltimate Parent Company acted as the Related PartyTransactions Review Committee of Kegalle PlantationsPLC.
The Committee consists of three Independent Non-ExecutiveDirectorsof theUltimateParentCompanyasfollows,
Dr.JayatissaDeCostaP.C.(Chairman)Mr.JagathC.KoraleMr.PrasannaFernando
All threememberswereappointedwitheffect from28October2016.
TheGroupChiefFinancialOfficer,ManagingDirectorofPlantationSector,Chief ExecutiveOfficer, andFinancialControllerattendedmeetingsbyinvitation.TheCompanySecretary functions as Secretary to the Related PartyTransactionsReviewCommittee.
The Objectives of the Committee,
● ToexerciseoversightonbehalfoftheBoard,thatallRelatedPartyTransactions (“RPTs”,other thanthoseexemptedbytheCSEListingRulesontheRelatedPartyTransactions)ofKegallePlantationsPLC is carried out and disclosed in a mannerconsistentwiththeCSEListingRules.
● Toadviseandupdate theBoardofDirectorsontherelatedpartytransactionsoftheCompanyonaquarterlybasis.
● ToensurecompliancewiththeCSEListingRulesontheRelatedPartyTransactions.
● ToreviewpoliciesandproceduresofRelatedPartyTransactionsoftheCompany.
● Toensureshareholderinterestsareprotectedandthat fairness and transparency are maintained.
TheCommitteearticulatedandrecommendedapolicyframeworkforadoptiononRelatedPartyTransactionsfortheCompany.InsuchprocesstheCommitteeconsideredRelatedPartyTransactionswhichrequireapprovaloftheBoard of Directors, various thresholds set out by theColombo Stock Exchange Listing Rules and disclosurerequirements, etc.
TheCommitteeheld threemeetingsduring theperiodunderreview.TheactivitiesandviewsoftheCommitteehave been communicated to the Board of Directorswhere appropriate.
Related Party Transactions during the year 2016/17
DetailsoftherelatedpartytransactionsenteredintobytheCompany/Grouparedisclosedonpage132.
Declaration
Refer: Annual Report of the Board of Directors onthe Affairs of the Company, Pages 80 to 83 for thedeclaration by the Board of Directors that no relatedparty transaction fallingwithin theambitof the ListingRuleswasenteredintobytheCompanyduring2016/17,exceptwhatwasdisclosedinthenoteno.36.
Dr.JayatissaDeCostaP.C.Chairman-RelatedPartyTransactionsReviewCommittee
31May2017
Governance Review | Report of the Related Party Transactions Review Committee Risk Management | Governance Review
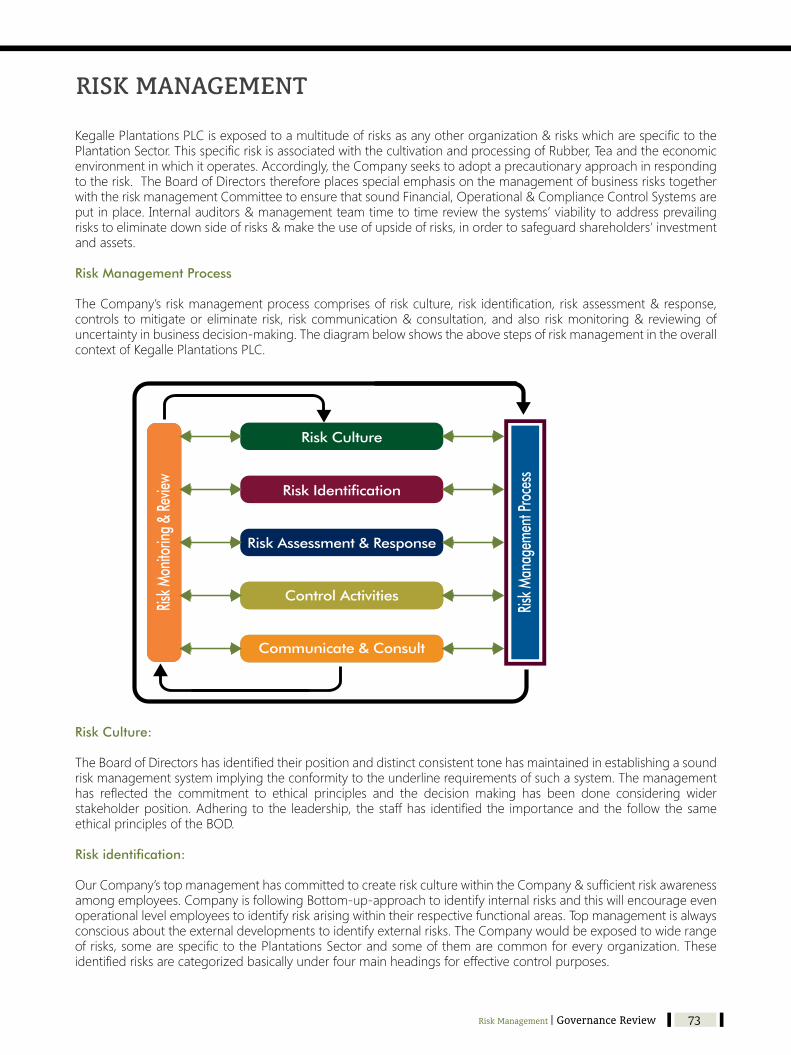
Kegalle Plantations PLC A n n u a l R e p o r t 2 0 1 6 - 1 7
73
RISK MANAGEMENT
KegallePlantationsPLCisexposedtoamultitudeofrisksasanyotherorganization&riskswhicharespecifictothePlantationSector.ThisspecificriskisassociatedwiththecultivationandprocessingofRubber,Teaandtheeconomicenvironmentinwhichitoperates.Accordingly,theCompanyseekstoadoptaprecautionaryapproachinrespondingtotherisk.TheBoardofDirectorsthereforeplacesspecialemphasisonthemanagementofbusinessriskstogetherwiththeriskmanagementCommitteetoensurethatsoundFinancial,Operational&ComplianceControlSystemsareputinplace.Internalauditors&managementteamtimetotimereviewthesystems’viabilitytoaddressprevailingriskstoeliminatedownsideofrisks&maketheuseofupsideofrisks,inordertosafeguardshareholders’investmentand assets.
Risk Management Process
TheCompany’sriskmanagementprocesscomprisesofriskculture,riskidentification,riskassessment&response,controls tomitigateoreliminaterisk, riskcommunication&consultation,andalsoriskmonitoring&reviewingofuncertaintyinbusinessdecision-making.ThediagrambelowshowstheabovestepsofriskmanagementintheoverallcontextofKegallePlantationsPLC.
Risk Culture
Risk Identification
Risk Assessment & Response
Risk M
onito
ring &
Revie
w
Control Activities
Communicate & Consult
Risk M
anag
emen
t Pro
cess
Risk Culture:
TheBoardofDirectorshasidentifiedtheirpositionanddistinctconsistenttonehasmaintainedinestablishingasoundriskmanagementsystemimplyingtheconformitytotheunderlinerequirementsofsuchasystem.Themanagementhas reflected the commitment to ethical principles and the decision making has been done considering widerstakeholderposition.Adheringtothe leadership, thestaffhas identifiedthe importanceandthefollowthesameethicalprinciplesoftheBOD.
Risk identification:
OurCompany’stopmanagementhascommittedtocreateriskculturewithintheCompany&sufficientriskawarenessamongemployees.CompanyisfollowingBottom-up-approachtoidentifyinternalrisksandthiswillencourageevenoperationallevelemployeestoidentifyriskarisingwithintheirrespectivefunctionalareas.Topmanagementisalwaysconsciousabouttheexternaldevelopmentstoidentifyexternalrisks.TheCompanywouldbeexposedtowiderangeofrisks,somearespecifictothePlantationsSectorandsomeofthemarecommonforeveryorganization.Theseidentifiedrisksarecategorizedbasicallyunderfourmainheadingsforeffectivecontrolpurposes.
Risk Management | Governance Review

Kegalle Plantations PLC A n n u a l R e p o r t 2 0 1 6 - 1 7
74
Risk Assessment & Response:
ThisallowsKegallePlantationsPLCtoconsidertheextenttowhichpotentialeventsmighthaveanimpactonachievementofobjectivesandbaseon thatdeterminehow the identified riskwill respond.Followingdiagramdepictspreviouslyidentifiedrisksupontheirlikelihoodofoccurrence&theMonitoryimpacttotheCompany.
Like
lihoo
d
Moderate
Moderate
Low
Low
Low High
Hig
h
Impact
High
Topmanagementmaydecidetheappropriateactionsdependingonthetoleranceofrisktoaddressthedifferenttypesofrisksidentifiedasabove.
• HighRisk :Riskavoidancebynotundertakingriskyactivities.• ModerateRisk :Riskreductionbyestablishinginternalcontrols&Risktransfertothirdpartieswhoare
morecapableofhandlingthosesuchastakinginsurancepolicies.• LowRisk :Riskacceptancesinceitisworthwhilerathertryingtomitigatetheserisks.
TheCompanyiswillingtotakeevenhighrisksaftercarefulinvestigationiftheseactivitiesaddcompetitiveedgetotheCompany.Howeverultimateriskacceptabilitywilldependontheriskappetitethereforemanagementisrequiredtooperatewithinthelimitstoavoidsurpassingriskappetite.
RISKL
L
L
H L H
H
H
Impact Impact
Prob
ab
ility
Prob
ab
ility
ECONOMIC RISK OPERATIONAL RISK
STRATEGIC RISKFINANCIAL RISK
Human Capital & Labour Risk
Inventory & Asset Risks
Global Economic Changes
Fiscal Policy Changing Risk
Liqudity & Cash Management Risk
Capital Investment Risk
Credit Risk Technological Risk Reputation Risk
Product & Risk of Competition
Environmental Risk
Currency Risk
Interest Rate & Gearing Risk
Procurement Risk
Information Systems Risk
- Low Risk - Moderate Risk - High Risk
Governance Review | Risk Management Risk Management | Governance Review

Kegalle Plantations PLC A n n u a l R e p o r t 2 0 1 6 - 1 7
75
Index
Risk Exposure
Company Objectives
Risk Minimisation Strategy
Control Activities:
Control activities are thepolicies&procedures that help ensure thatmanagement risk responses are effectivelycarriedout.KPL’scontrolactivitiesoccur throughout theorganization,atall levelscoveringall functions.Basicallycontrols includea rangeofactivities suchas segregationofduties,personal controls, approvals&authorization,managementcontrols,supervision,organizationalcontrols,accounting&arithmeticchecksandphysicalcontrols.Companyhasplacedfollowingcontrolsforeachrisksidentifiedattheearlystage.
Economic Risk
Global Economic Changes
To minimize the risk associated with Changes due to Global Recession,sanctionsonCountriesorchangeininternationalMarkets.
Spreadtheriskbyattemptingtomarkettheproductsindifferentglobalmarketsandfindingreliablenewcustomers. Continues to match the supply with global demand. For an exampleconcentratemoreonbiorubber.
Fiscal Policy Changing Risk
To minimize risks associated with changing government policies oninternational trade and plantation sector.Companyhasemployedtax&legalconsultantstoadviceontheseissues.Government lobbyingthroughtheministerbymaintaininggoodformalrelationship. Willingtodealwithfinancialriskarisingwithgovernmentpolicychanges.
Operational Risk
Inventory & Asset Risk
Toreducestockobsolescence,risksfromfire,theftandmanagestock holdingcostsandtominimizemachinery&equipmentbreakdown. Reducingtheriskassociatedwiththeftandshrinkagebyfrequentphysicalcheck. Adoptingamonthlydeclarationpolicy. Identifyingshowmovingstocksandeffectively layingoutachannel forthesetobesoldoff. Obtainingcomprehensiveinsurancecoversforalltangibleassets. Adoptionofstringentprocedureswithregardtothemovingofassetsfrom one location to another. Carryingoutmandatorypreventivemaintenanceprograms. Carryingout frequentemployeetrainingprograms inareassuchasfireprevention.
Risk Rating
Low Moderate High
2016/17 2015/16
Probability
Impact
Rating
2016/17 2015/16
Probability
Impact
Rating
2016/17 2015/16
Probability
Impact
Rating
Risk Management | Governance Review

Kegalle Plantations PLC A n n u a l R e p o r t 2 0 1 6 - 1 7
76
Human Capital & Labor Risk
Toensureasmoothflowofoperationswithoutanyunduedisruptions.Maintaining healthy relationships with trade unions through regulardialogues. Enteringintocollectiveagreementswithtradeunions. Ensure compliance with all regulatory requirements with regard to thebenefitsapplicabletoworkersatestates. Toprotectourselfasahumanemployerbeingsuccessfulinmotivating,developing,retainingandattractingthebestofhumancapital. Improvingemployeebenefitsbywayoffinancial incentivesandwelfareactivities.Arrangein-houseandexternaltraininginordertodevelopthehuman resources.
Product & Risk of Competition
To maximize our market share and maintain leadership in the respectiveindustries. Ensuringhighstandardsofqualityintheeyesofthecustomer. Increasing productivity and efficiency in order to ensure an adequatemargindespiteincreasingwage,energyandtransportationcost. CarryingoutResearch&Developmentactivitieswhenevernecessary inordertoidentifykeyareastobefocused.
Procurement Risk
Tominimizeriskassociatedwithpriceandavailabilityofmaterials. Continuousreplantingactivitiesofallcrops. Establishingrelationshipswithmanysuppliersforlatexandboughtleafinordertoreduceover-dependencyonasinglesupplier. Enteringintoforwardcontractsforpurchasesofcertainrawmaterialitems.
Information Systems Risk
TominimizeriskassociatedwithDataSecurity,Hardware,CommunicationandSoftware.Maintainingofspareservers.Mirroringofharddiskswithcriticaldata. Databack-upsstoredinoffsitelocations. Vendoragreementsforsupportserviceandmaintenance. RegularupdatingofVirusscanners,Firewallsetc. Compliancewithstatutoryrequirementsforenvironmentalpreservations.CarryingoutApplicationControlAudits.
Strategic Risks
Environmental Risk
Companycannotcompletelyeliminatetheriskarisingwithclimatechangesandnaturaldisasters.Followingactionshavebeentakenbythemanagementinordertominimizetheimpactsonproductquality&pricesduetoadverseweather conditions. HavinginplaceSustainableagriculturalpractices. Plantingshadytreesfortea. DiversifiedcropinRubber,Tea,andCardamom&Timber. Ensureclosemonitoringofcrop&pricevarianceduringextremeweather conditions.
2016/17 2015/16
Probability
Impact
Rating
2016/17 2015/16
Probability
Impact
Rating
2016/17 2015/16
Probability
Impact
Rating
2016/17 2015/16
Probability
Impact
Rating
2016/17 2015/16
Probability
Impact
Rating
Governance Review | Risk Management Risk Management | Governance Review

Kegalle Plantations PLC A n n u a l R e p o r t 2 0 1 6 - 1 7
77
Reputation Risk
Topreventthecausesthatdamagesourreputation. Havinginplaceabudgetaryprocess&abudgetarycontrolmechanismonamonthlybasistoensurethattheCompany’sperformanceiscontinuouslyinlinewithitstargets. Adopting stringent quality assurance policies with regard to raw andpackingmaterialsboughtoutfromthirdparties. Ensure quality in manufacturing process and compliance with thestandards. Work towards obtaining at least HACCP standard in everyfactory. Ensuring effective communication with various stakeholders such asemployees,bankers,regulators,customers,suppliersandtheshareholders.
Technological Risk
To keep pacewith the current technological developments and safeguardagainstobsolescence.The continuous investments in newmachineries and experiments on newmethods.Mechanizationofestatefunctionsuptothehighestpossibleextent. InvestinginResearch&Developmentactivitieswhenevernecessary. Implementation of the new computer system in head office and theestates. Investinginhardwareresources.
Financial Risk
Currency Risk
Tominimizeriskassociatedwith thefluctuation in foreigncurrencyrates inrelation to export proceeds, import payments and foreign currency debttransactions.
Ensuringeffectiveutilizationbycoordinatingwithtreasuryoperationsactasanaturalhedge.suchasforwardbookings,forwardsales,swapsetc Export proceeds exceeding the import payments and foreign currencydebtpaymentsthroughvarioushedgingtechniques.
Interest Rate Risk & Gearing Risk
To minimize adverse effects of interest rate volatility and currency denominated borrowings. Structuringtheloanportfoliotocombineforeigncurrencyandlocal.Minimize interest rate risk through internalhedging techniques suchasmatchingbyhavingbalancebetweenvariable&fixedportionofinterestincome&expense. Effectiveutilizationofexternalhedging techniques suchas interest rateswaps.MaximumutilizationoftheconcessionaryfundingavailabletoPlantationCompanies. To ensure cost of borrowing is at the optimum level,appropriategearingratiowillbemaintainedwiththeassistanceofGroupTreasury.
2016/17 2015/16
Probability
Impact
Rating
2016/17 2015/16
Probability
Impact
Rating
2016/17 2015/16
Probability
Impact
Rating
2016/17 2015/16
Probability
Impact
Rating
Risk Management | Governance Review

Kegalle Plantations PLC A n n u a l R e p o r t 2 0 1 6 - 1 7
78
Liquidity & Cash Management Risk
Capitalizeonopportunitiestoraisefundsatlowestpossiblecost. FundingoflongtermassetsthroughEquityandLongTermLoans. Ensure availability and effective utilization of short term facilitieswherenecessary. Toensureastrongliquidityposition. Ensuringpropermanagementofworkingcapital.MaximumutilizationoftheconcessionaryfundingavailabletoPlantationCompanies.
Capital Investments Risk
Tominimizeriskofnotmeetingprofitexpectations. Adoptingastringentapprovalprocedure forCapitalexpenditurebasedonthelevelofinvestmentandtheexpectedpayback.
Credit Risk
Tominimizerisksassociatedwithdebtordefaults. Obtaininginsurancecoversforexportdebtors. Salesaremadethroughauctionandbrokersassurethesettlement.Worktowardsobtainingcollateralsfrommajorlocalcustomerswithhighoutstanding. Followstringentassessmentprocedurestoensurecreditworthinessofthecustomerspriortothegrantingofcredit.
Communicate & Consult:
The risk management process is concerned with identifying specific stakeholders, the level of accountability,understanding their riskperceptionsanddecisionmakingduringall stagesof the riskmanagementprocess.Thecommunication process consists of the procedures to report risk to risk and control owners and also to otherstakeholders.Furthermore,thetreatmentplansandchangemanagementprocessesarealsodeliveredtotherightpartiesatrighttime.
Risk Monitoring & Review:
Thisistheprocessofassessingthepresence&functioningofCompany’sriskmanagementcomponentsovertimewiththepurposeofidentifyingweaknessesinthecontrolsinaddressingtointernal&externalchanges.Theultimateresponsibility for ongoing monitoring activities or separate evaluations lies with the top management & auditcommittee.Ourgroup internalaudit teamcarriesout frequentsystembaseauditsbyvisiting toeachestateandreportingtotheriskmanagementcommitteeonmattersrequireimmediateresponses.
Effectivenessoftheaboveriskmanagementprocesswillbereviewedannually&makeadjustmentstothecurrentprocessbytheriskmanagementcommittee.Atthisstagerelevant informationis identifiedandcommunicatedinordertofacilitatethepeoplewhoareresponsibleforriskmanagementwithintheCompany.
2016/17 2015/16
Probability
Impact
Rating
2016/17 2015/16
Probability
Impact
Rating
2016/17 2015/16
Probability
Impact
Rating
Governance Review | Risk Management Management Team | Governance Review

Kegalle Plantations PLC A n n u a l R e p o r t 2 0 1 6 - 1 7
79Management Team | Governance Review
Fin
anci
al R
epor
tsAnnual Report of the Board of Directors ...... 80Statement of the Directors’ Responsibility ... 84Independent Auditors’ Report ..................... 85Statement of Profit or Loss .......................... 86Statement of Comprehensive Income ......... 87Statement of Financial Position ................... 88Statement of Changes in Equity .................. 89Cash Flow Statement ................................. 90Notes to the Cash Flow Statement .............. 91Notes to the Financial Statements .............. 92
Oil Palm Processing
The harvested fresh fruit bunches should betransferredtotheprocessingMillwithin24hourstoproducehighqualitycrudePalmOilasotherwisetheFFA(freefattyacids)levelsincreaseandthevalueoftheOilwillcomedown.Atthefactorythefruitsaregradedandsterilizedtoenlargetheoilcellsof thefruitsandtoeasetheremovalofthebunchfromthefruitless.ThenthesterilizedfruitsaresenttoapresstosqueezeofftheOilwhichisthereafterwashedandpurifiedtoconvertintotocrudeOil.
ThisportionofOiliscalledthevegetablecrudePalmOilandtheMesocarportheKernel isseparated inthisprocessfromwhichKernelOil isextracted.ThetotalOilextractionvariesfrom23%-26%dependingontheripenessofthefreshfruitbunches,qualityofthemachineryandstringentqualitycontrolsof thefactoryinselectingofFFB.
Tra
nsf
orm
ing
fro
m t
he T
rad
itio
n...
Continuedinpageno.137...
Contents
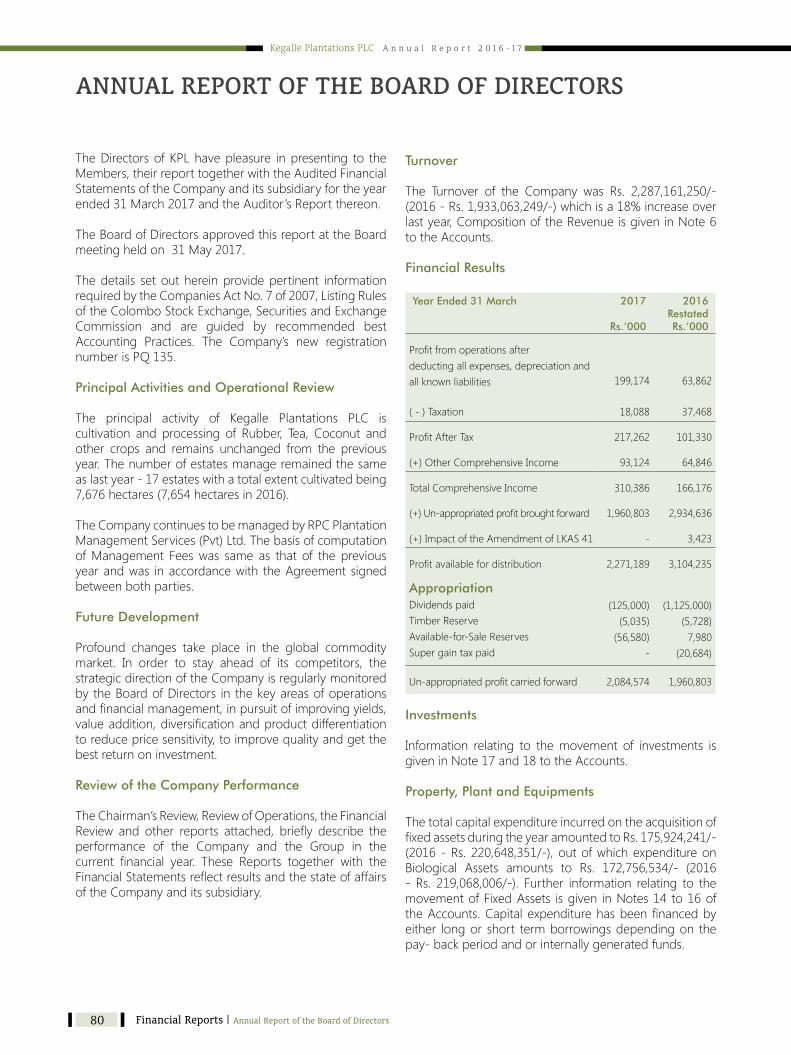
Kegalle Plantations PLC A n n u a l R e p o r t 2 0 1 6 - 1 7
80
ANNUAL REPORT OF THE BOARD OF DIRECTORS
TheDirectorsofKPLhavepleasure inpresenting to theMembers,theirreporttogetherwiththeAuditedFinancialStatementsoftheCompanyanditssubsidiaryfortheyearended31March2017andtheAuditor’sReportthereon.
TheBoardofDirectorsapprovedthisreportattheBoardmeetingheldon31May2017.
Thedetails setouthereinprovidepertinent informationrequiredbytheCompaniesActNo.7of2007,ListingRulesoftheColomboStockExchange,SecuritiesandExchangeCommission and are guided by recommended bestAccounting Practices. The Company’s new registrationnumberisPQ135.
Principal Activities and Operational Review
The principal activity of Kegalle Plantations PLC iscultivation and processing of Rubber, Tea, Coconut andother crops and remains unchanged from the previousyear.Thenumberofestatesmanageremainedthesameaslastyear-17estateswithatotalextentcultivatedbeing7,676hectares(7,654hectaresin2016).
TheCompanycontinuestobemanagedbyRPCPlantationManagementServices(Pvt)Ltd.ThebasisofcomputationofManagement Feeswas same as that of the previousyearandwas inaccordancewith theAgreementsignedbetweenbothparties.
Future Development
Profound changes take place in the global commoditymarket. In order to stay ahead of its competitors, thestrategicdirectionoftheCompanyisregularlymonitoredbytheBoardofDirectors in thekeyareasofoperationsandfinancialmanagement,inpursuitofimprovingyields,valueaddition,diversificationandproductdifferentiationtoreducepricesensitivity,toimprovequalityandgetthebestreturnoninvestment.
Review of the Company Performance
TheChairman’sReview,ReviewofOperations,theFinancialReview and other reports attached, briefly describe theperformance of the Company and the Group in thecurrent financial year. These Reports together with theFinancialStatementsreflectresultsandthestateofaffairsoftheCompanyanditssubsidiary.
Turnover
The Turnover of the Company was Rs. 2,287,161,250/-(2016-Rs.1,933,063,249/-)whichisa18%increaseoverlastyear,CompositionoftheRevenueisgiveninNote6totheAccounts.
Financial Results
Year Ended 31 March 2017
Rs.’000
2016 RestatedRs.’000
Profitfromoperationsafterdeductingallexpenses,depreciationandallknownliabilities 199,174 63,862
(-)Taxation 18,088 37,468
ProfitAfterTax 217,262 101,330
(+)OtherComprehensiveIncome 93,124 64,846
TotalComprehensiveIncome 310,386 166,176
(+)Un-appropriatedprofitbroughtforward 1,960,803 2,934,636
(+)ImpactoftheAmendmentofLKAS41 - 3,423
Profitavailablefordistribution 2,271,189 3,104,235
AppropriationDividendspaidTimberReserveAvailable-for-SaleReservesSupergaintaxpaid
(125,000)(5,035)(56,580)
-
(1,125,000)(5,728)7,980
(20,684)
Un-appropriatedprofitcarriedforward 2,084,574 1,960,803
Investments
Information relating to themovement of investments isgiveninNote17and18totheAccounts.
Property, Plant and Equipments
ThetotalcapitalexpenditureincurredontheacquisitionoffixedassetsduringtheyearamountedtoRs.175,924,241/-(2016-Rs.220,648,351/-),outofwhichexpenditureonBiological Assets amounts to Rs. 172,756,534/- (2016- Rs. 219,068,006/-). Further information relating to themovementofFixedAssets isgiven inNotes14 to16oftheAccounts.Capitalexpenditurehasbeenfinancedbyeither longor short termborrowingsdependingon thepay-backperiodandorinternallygeneratedfunds.
Financial Reports | Annual Report of the Board of Directors Annual Report of the Board of Directors | Financial Reports

Kegalle Plantations PLC A n n u a l R e p o r t 2 0 1 6 - 1 7
81
Loans & Borrowings
A breakdown of the total loans outstanding as at theStatementofFinancialPositiondateisgiveninNote24totheAccounts.
Stated Capital
TheStatedCapitaloftheCompanyasat31March2017wasRs.250,000,010/-.Adetailof theStatedCapital isgiveninNote23totheFinancialStatements.
Reserves
TheReservesoftheCompanyasat31March2017wasRs. 2,371,695,174/- (2016 - Rs. 2,186,308,570/-). ThedetailsaregivenintheStatementofChangesinEquityonPage89totheFinancialStatements.
Donations
NoDonationsweremadeduringtheyearunderreviewbytheCompany(2016–Rs.5,000/-).
Taxation
The Company is liable for income tax at the rate of28% on profits from manufacture & 10% on profitsfromagriculturebeginningfromtheyearofassessment2011/12.
Share Information
Information on Earnings, Dividend, Net Assets andMarketValuepershareisgivenonPages142to144ofthis report.
Major Shareholders
The twenty largest shareholdersof theCompanyasat31March2017togetherwithpercentagesheldaregivenunderthecaption“Shareholder&InvestorInformation”onPage142.
Directors
The Names of the Directors who held Office duringtheyeararegivenbelow.TheirbriefprofileappearsonPages62to63.
Dr.SenaYaddehige Chairman
S S Poholiyadde Director
Prof.RCWMRANugawela Director
Dr.SSBDGJayawardena Director
ShamindaYaddehige Director
Pursuant toSection211of theCompaniesActNo.07of2007,aNoticeof the followingOrdinaryResolutionhasbeenreceivedbytheCompany,fromRPCPlantationManagementServices(Private)Limited,310,HighLevelRoad, Nawinna, Maharagama, a shareholder of theCompany.
“That Dr. Sena Yaddehige of Le Neuf , Chemin, St.Saviours, Guernsey, United Kingdom who is 71 yearsof age be and is hereby appointed a Director of theCompanyintermsofsection211oftheCompaniesActNo.07of2007,andit isfurtherspeciallydeclaredthattheagelimitof70yearsreferredtoinSection210oftheCompaniesActno.07of2007shallnotapplytothesaidDr.SenaYaddehige”
Pursuant toSection211of theCompaniesActNo.07of2007,aNoticeof the followingOrdinaryResolutionhasbeenreceivedbytheCompany,fromRPCPlantationManagementServices(Private)Limited,310,HighLevelRoad, Nawinna, Maharagama, a shareholder of theCompany.
“That Dr. Gerry Jayawardena of No. 134, Batagama(North)Ja-Ela,whois74yearsofagebeandisherebyappointedaDirectoroftheCompanyintermsofsection211oftheCompaniesActNo.07of2007,anditisfurtherspeciallydeclaredthattheagelimitof70yearsreferredtoinSection210oftheCompaniesActno.07of2007shallnotapplytothesaidDr.GerryJayawardena”
In accordance with the Provisions of the Article 92 ofthe Articles of Association of the Company,Mr. SunilPoholiyadde, who retires by rotation at the AnnualGeneralMeetingwillofferhimselfforre-election.
Directors’ Interest in Contracts
Directors’interestinContractsinrelationtotransactionswithrelatedentities,transactionswithKeyManagementPersonnel and other related disclosures are stated in Note 36(RelatedPartyDisclosures)totheFinancialStatements.Inaddition,theCompanycarriedouttransactionsintheordinary course of business with the following entitieshaving one ormore directors in common is shown inPage82.
Annual Report of the Board of Directors | Financial Reports

Kegalle Plantations PLC A n n u a l R e p o r t 2 0 1 6 - 1 7
82
Name of Director2017
No.of shares2016
No.of shares
Mr.SSPoholiyadde 3,307 3,307
Transactions with related undertakings;
Company Name of Director Position Nature of Transaction
AmountRs. ‘000
2017 2016
EasternBrokersLtd Mr.SSPoholiyadde Director Brokerage/LotMoney&InterestIncome 5,198 (9,197)
(Resignedw.e.f5 January2017)
Interest Register
TheCompanymaintainsaninterestregisterasrequiredbytheCompanies’ActNo.07of2007.Informationpertainingtodirectors’interestincontracts,theirremunerationandtheirshareownershiparedisclosedintheinterestregister.
Directors’ Interest in Shares
ShareholdingofDirectorswhoheldofficeduringthefinancialyearisasfollows:-
Directors’ Remuneration and Other Benefits
TheRemunerationoftheDirectorsfortheyearended31March2017isgiveninNote8oftheFinancialStatements.
Vision, Mission & Objectives
TheCompany’sVision,MissionandLongTermObjectivesaregiveninPage02ofthisreport.
Environmental Protection
The Companies activities can have both direct andindirecteffectsontheenvironment.ItisthepolicyoftheCompanytominimizeanyadverseeffectsbyrecyclingresourcesasmuchaspossibleandcreatingawarenessamongstaffoncurrentglobalenvironmentalthreats.
The Company’s efforts in relation to environmentalprotectionaresetoutonPage36under“SustainabilityReport”. Employment Policy
The Company’s recruitment and employment policy isnon discriminatory. Appraisals of individual employeesare carried out by the respective departmental headsin order to evaluate their performances and realisetheir potential and through this process tobenefit theCompanyandthemselves.
Statutory Payments
TheDirectors,tothebestoftheirknowledgeandbelief,aresatisfiedthatallstatutorypaymentshavebeenmadeup to date.
Events after the Reporting Date
No circumstances have arisen since the Statement ofFinancialPositiondate,whichwouldrequireadjustmentordisclosureintheAccounts.
Board Committees
TheBoardhasdelegatedresponsibilitiestothreeBoardSub Committees which operate within clearly definedtermsofreference.TheircompositionsandfunctionsaregiveninPages69to72ofthisreport.
Related Party Transactions
There are no non recurrent related party transactionswhichexceed10percentof theEquityor5percentofthetotalassetswhicheverislowerandtheCompanyhascompliedwiththerequirementsoftheListingRulesoftheColomboStockExchangeonRelatedPartyTransactions.However, theDirectorshavedisclosed the transactionsthat could be classified as related party transactionswhichareadopted in thepresentationof theFinancialStatementsandaccordinglygiven innote36onPages132to133.
Financial Reports | Annual Report of the Board of Directors Annual Report of the Board of Directors | Financial Reports
Kegalle Plantations PLC A n n u a l R e p o r t 2 0 1 6 - 1 7
83
Corporate Governance and Internal Control
ThepoliciesadoptedbytheCompanyinrelationtoBestPracticesandGoodCorporateGovernancearegivenonPages66to68.
TheBoardhasoverallresponsibilityfortheGroup’ssystemof Internal Financial Control. Although no system ofInternal Control can provide absolute assurance againstmaterialmisstatementorlosstheGroup’sinternalcontrolsystem has been designed to provide the Directorswith reasonable assurance that assets are safeguarded,transactions authorized and properly recorded andmaterial errors and irregularities either prevented ordetectedwithinareasonableperiodoftime.
Directors’ Responsibility for Financial Reporting
The Statement of Directors’ Responsibility for financialreporting of the Company and the Group is set out inPage84ofthisreport.
Compliance with Laws and Regulations
TheDirectors, tothebestof theirknowledgeandbelief,confirmthattheCompanyhasnotengagedinanyactivitiesthatcontravenetheLawsandtheregulationsapplicableinSriLanka.FinancialStatementsarepublishedquarterlyinlinewiththeListingRulesoftheColomboStockExchange.
The Company is in compliance with the CSE rules onrelated party transactions which was made mandatory witheffectfrom1stofJanuary2016.
Auditors
The Financial Statements for the year ended 31March2017 have been audited by Messrs. Ernst & Young,CharteredAccountants.TheAuditorsReport isgivenonPage85.
Inaccordancewith theCompaniesActNo.7of2007,aresolution proposing their re-appointment as Auditors
to the Company and authorizing the Directors of theCompanytofixtheirremunerationwillbeproposedattheAnnualGeneralMeeting.
TheAuditFeeofMessrs.Ernst&YoungforthecurrentyearwasRs.3,946,800/-(2016Rs.3,528,068/-).InadditionRs.527,961/-(2016Rs.881,248/-)waspaidbytheCompanyfor non-audit related work which consists mainly ofcertificationsissuedtotheDepartmentofInlandRevenueandTaxrelatedwork.AsfarastheDirectorswereawaretheAuditorsdonothaveanyrelationshipotherthanthatofanAuditorwiththeCompany.
Annual General Meeting
TheAnnualGeneralMeetingwillbeheldon30June2017attheregisteredofficeoftheCompanyat310,HighLevelRoad,Nawinna,Maharagama.Thenoticeof theAnnualGeneralMeetingisonPage147ofthereport.
OnbehalfoftheBoard,
SSPoholiyadde Dr.SSBDGJayawardenaDirector Director
Mrs.RJSiriweeraCompanySecretary
RichardPierisGroupServices(Pvt)LtdSecretaries310,HighLevelRoadNawinnaMaharagama.
31May2017
Annual Report of the Board of Directors | Financial Reports
Kegalle Plantations PLC A n n u a l R e p o r t 2 0 1 6 - 1 7
84
TheDirectorshaveprovidedtheAuditorsMessrs.Ernst&Young,CharteredAccountants,witheveryopportunitytocarryoutreviewsandteststhattheyconsiderappropriateandnecessaryfortheperformanceoftheirresponsibilities.TheCompany’sAuditors,Messrs.Ernst&Young,CharteredAccountants have examined the Financial Statementstogetherwith all financial records and related data andexpresstheiropinionwhichappearsasreportedbythemonpage85ofthisreport.Inarrivingattheiropinion,theyhavecarriedoutreviewsandsamplechecksonthesystemof internal controls.
OnbehalfoftheBoard,
Mrs.RJSiriweeraCompanySecretary
RichardPierisGroupServices(Pvt)LtdSecretaries310,HighLevelRoadNawinnaMaharagama.
31May2017
STATEMENT OF DIRECTORS’ RESPONSIBILITY
InkeepingwiththeprovisionsundertheCompaniesActNo.7 of 2007, the Directors of Kegalle Plantations PLC,acknowledge their responsibility in relation to financialreporting of both, the Company and that of its Group.These responsibilities differ from those of its Auditors,Messrs.Ernst&Young,whicharesetout intheirreport,appearingonpage85ofthisreport.
TheFinancialStatementsoftheCompanyanditssubsidiaryfortheyearended31March2017includedinthisreporthave been prepared and presented in accordance withtheSriLankaFinancialReportingStandards.TheyprovidetheinformationasrequiredbytheCompaniesActNo.7of2007,SriLankaAccountingStandardsandtheListingRules of the Colombo Stock Exchange. The Directorsconfirmthatsuitableaccountingpolicieshavebeenusedandappliedconsistentlyandthatallapplicableaccountingstandards havebeen followed in thepreparationof theFinancial Statements given on pages from 86 to 136inclusive. Allmaterial deviations from these standards ifanyhavebeendisclosed andexplained. The judgmentsandestimatesmadeinthepreparationoftheseFinancialStatementsarereasonableandprudent.
The Directors confirm their responsibility for ensuringthat allCompanieswithin theGroupmaintain adequateaccounting records, which are sufficient enough toprepareFinancialStatementsthatdisclosewithreasonableaccuracy, the financial position of the Company and itssubsidiary.Theyalsoconfirm their responsibility towardsensuring that the Financial Statements presented in theAnnual Report give a true and fair view of the state ofaffairsoftheCompanyanditssubsidiaryasat31March2017andthatoftheprofitfortheyearthenended.
The overall responsibility for the Company’s internalcontrolsystemslieswiththeDirectors.Whilstrecognizingthefactthatthereisnosinglesystemofinternalcontrolthat could provide absolute assurance against materialmisstatementsandfraud,theDirectorsconfirmthattheprevalentinternalcontrolsystemsinstitutedbythemwhichcomprise internal checks, internal audit, financial andother controls are sodesigned that, there is reasonableassurancethatallassetsaresafeguardedandtransactionsproperly authorized and recorded, so that materialmisstatements and irregularities are either prevented ordetectedwithinareasonableperiodoftime.
TheDirectorsareof theview that theCompanyand itssubsidiaryhaveadequateresourcestocontinueoperationsintheforeseeablefuture,asagoingconcern.Accordingly,theDirectors have continued to use the going-concernbasisinthepreparationoftheseFinancialStatements.
Financial Reports | Statement of Directors’ Responsibility Independent Auditors’ Report | Financial Reports

Kegalle Plantations PLC A n n u a l R e p o r t 2 0 1 6 - 1 7
85
Webelievethattheauditevidencewehaveobtainedissufficientandappropriatetoprovideabasisforourauditopinion.
Opinion
Inouropinion,theconsolidatedFinancialStatementsgiveatrueandfairviewofthefinancialpositionoftheGroupasat31March2017,andofitsfinancialperformanceandcashflowsfortheyearthenendedinaccordancewithSriLankaAccountingStandards.
Report on Other Legal and Regulatory Requirements
Asrequiredbysection163(2)oftheCompaniesActNo.07of2007,westatethefollowing:
a) Thebasisofopinion,scopeandlimitationsoftheauditareasstatedabove.
b) Inouropinion:
• wehaveobtainedalltheinformationandexplanationsthat were required for the audit and, as far as appears from our examination, proper accounting recordshavebeenkeptbytheCompany,
• theFinancialStatementsoftheCompanygiveatrueandfairviewofitsfinancialpositionasat31March2017,andofitsfinancialperformanceandcashflowsfortheyearthenendedinaccordancewithSriLankaAccountingStandards,and
• the Financial Statements of the Company and theGroupcomplywiththerequirementsofsections151and153oftheCompaniesActNo.07of2007.
31May2017Colombo
INDEPENDENT AUDITORS’ REPORT
INDEPENDENT AUDITORS’ REPORT TO THE SHAREHOLDERS OF KEGALLE PLANTATIONS PLC
Report on the Financial Statements
We have audited the accompanying Financial Statements ofKegallePlantationsPLC (“theCompany”)and theconsolidatedFinancialStatementsoftheCompanyanditssubsidiary(“Group”)whichcomprisetheStatementofFinancialPositionasat31March2017,StatementofProfitorLoss,StatementofComprehensiveIncome, Statement of Changes in Equity and Cash FlowStatementfortheyearthenended,andasummaryofsignificantAccountingPoliciesandotherexplanatoryinformation.
Board’s Responsibility for the Financial Statements
TheBoardofDirectors(“Board”)isresponsibleforthepreparationof these Financial Statements thatgive a true and fair view inaccordancewithSri LankaAccountingStandardsand for suchinternalcontrolsasBoarddeterminesisnecessarytoenablethepreparationofFinancialStatements thatare freefrommaterialmisstatements, whether due to fraud or error.
Auditor’s Responsibility
Our responsibility is to express an opinion on these FinancialStatements based on our audit. We conducted our audit inaccordancewithSriLankaAuditingStandards.Thosestandardsrequire that we comply with ethical requirements and plan and performtheaudittoobtainreasonableassuranceaboutwhethertheFinancialStatementsarefreefrommaterialmisstatements.
AnauditinvolvesperformingprocedurestoobtainauditevidenceabouttheamountsanddisclosuresintheFinancialStatements.The procedures selected depend on the auditor’s judgment,including the assessmentof the risksofmaterialmisstatementof the Financial Statements, whether due to fraud or error. Inmaking those risk assessments, the auditor considers internalcontrols relevant to the entity’s preparation of the FinancialStatementsthatgiveatrueandfairviewinordertodesignauditprocedures that are appropriate in the circumstances, but notfor thepurposeof expressing anopinionon the effectivenessoftheentity’sinternalcontrols.Anauditalsoincludesevaluatingthe appropriateness of accounting policies used and thereasonablenessofaccountingestimatesmadebyBoard,aswellasevaluatingtheoverallpresentationoftheFinancialStatements.
Independent Auditors’ Report | Financial Reports

Kegalle Plantations PLC A n n u a l R e p o r t 2 0 1 6 - 1 7
86
TheaccountingpoliciesandnotesonPages93through136formanintegralpartoftheFinancialStatements.
Year Ended 31 March Company Group
Notes 2017Rs.'000
2016Rs.'000
2017Rs.'000
2016Rs.'000
Revenue 6 2,287,161 1,933,063 2,287,161 1,933,063
CostofSale (2,059,967) (1,924,776) (2,059,967) (1,924,776)
Gross Profit 227,194 8,287 227,194 8,287
Gain/(Loss)onFairValueofBiologicalAssets 16.4 5,914 5,617 5,914 5,617
OtherIncomeandGain 7 116,408 114,607 37,238 35,651
AdministrativeExpenses (46,712) (43,166) (52,705) (50,761)
ManagementFee (44,660) (6,543) (44,660) (6,543)
Profit from Operations 8 258,144 78,801 172,982 (7,750)
FinanceIncome 9 199,131 183,284 199,131 183,284
FinanceCost 10 (258,101) (198,223) (258,101) (198,223)
ShareofResultofEquityAccountedInvestees 11 - - 228,756 140,827
Profit Before Taxation 199,174 63,862 342,768 118,138
TaxExpenses 12.1 18,088 37,468 (12,656) 16,876
Profit After Taxation 217,263 101,330 330,112 135,014
BasicEarningsPerShare 13 8.69 4.06 13.20 5.41
Financial Reports | Statement of Profit or Loss Statement of Comprehensive Income | Financial Reports
STATEMENT OF PROFIT OR LOSS

Kegalle Plantations PLC A n n u a l R e p o r t 2 0 1 6 - 1 7
87
TheaccountingpoliciesandnotesonPages93through136formanintegralpartoftheFinancialStatements.
Year Ended 31 March Company Group
Notes 2017Rs.'000
2016Rs.'000
2017Rs.'000
2016Rs.'000
Profitfortheyear 217,263 101,330 330,112 135,014
Other Comprehensive Income
Other Comprehensive income not to be reclassified to profit or loss in Subsequent periods (net of tax)
ActuarialGains/(Losses)onDefinedBenefitPlans 25 43,381 86,451 43,381 86,451
IncomeTaxEffect 12.2 (6,837) (13,625) (6,837) (13,625)
36,544 72,827 36,544 72,827
Share of Other Comprehensive Income of EquityAccounted Investees
Other Comprehensive income not to be reclassified to profit or loss in Subsequent periods (net of tax)
ActuarialGains/(Losses)onDefinedBenefitPlans 11.2 - - (506) 125
IncomeTaxEffect 11.2 - - 40 (6)
- - (466) 119
Other Comprehensive income to be reclassified to profit or loss in Subsequent periods (net of tax)
NetGain/(Loss)onAvailable-for-SaleFinancialAssets 17.2 56,580 (7,980) 56,580 (7,980)
IncomeTaxEffect - - - -
56,580 (7,980) 56,580 (7,980)
Other Comprehensive Income for the year, net of tax 93,124 64,846 92,658 64,965
Total Comprehensive Income for the year, net of tax 310,387 166,176 422,770 199,980
Statement of Comprehensive Income | Financial Reports
STATEMENT OF COMPREHENSIVE INCOME

Kegalle Plantations PLC A n n u a l R e p o r t 2 0 1 6 - 1 7
88
TheseFinancialStatementsareincompliancewiththerequirementsoftheCompaniesActNo.07of2007.
SudheeraEpitakumbura FinancialController TheBoardofDirectorsisresponsibleforthepreparationandpresentationoftheseFinancialStatements. SignedforandonbehalfoftheBoardofDirectorsofKegallePlantationsPLC.
SSPoholiyadde Dr.SSBDGJayawardena Director Director TheaccountingpoliciesandnotesonPages93through136formanintegralpartoftheFinancialStatements. 31May2017 Colombo
STATEMENT OF FINANCIAL POSITIONAs at 31 March Company Group
ASSETS
Non Current Assets
Notes 2017
Rs.’000
2016RestatedRs.’000
2015RestatedRs.’000
2017
Rs.’000
2016RestatedRs.’000
2015RestatedRs.’000
LeaseholdProperty,PlantandEquipmentFreeholdProperty,PlantandEquipmentBearerBiologicalAssetsConsumableBiologicalAssetsFinancialAssetsLongTermInvestments
1415
16.116.217
18.3
208,326284,038
2,022,742107,220
1,200,880491,850
224,154323,978
1,910,58994,919
1,144,300491,850
239,983365,251
1,753,21678,746
1,000,000611,850
208,326321,573
2,022,742107,220
1,200,880833,616
224,154366,631
1,910,58994,919
1,144,300718,285
239,983414,245
1,753,21678,746
1,000,000802,918
Total Non Current Assets 4,315,057 4,189,791 4,049,045 4,694,358 4,458,879 4,289,108
Current AssetsProduceonBearerBiologicalAssetInventoriesTradeandOtherReceivablesVATRecoverableESCRecoverableIncomeTaxRecoverableAmountsduefromRelatedCompaniesShortTermInvestmentsCashandBankBalances
16.31920
2122
4,191
268,121287,94623,65217,70311,25538,271
1,420,89217,293
3,311
235,954134,51826,0237,8484,77339,874
1,692,86723,395
3,423272,365210,17625,340
-5,77249,213
2,492,29722,888
4,191
267,449296,24023,66017,70311,2552,315
1,420,89217,293
3,311
235,281142,81326,0307,8484,7732,794
1,692,86723,395
3,423
271,693215,77628,182
-5,77211,489
2,492,29722,900
Total Current Assets 2,089,323 2,168,563 3,081,474 2,060,998 2,139,113 3,051,532
TOTAL ASSETS 6,404,381 6,358,353 7,130,520 6,755,354 6,597,992 7,340,640
EQUITY AND LIABILITIESEquityStatedCapitalGeneralReserveTimberReserveAvailableforSaleReserveRetainedEarnings
2323.1
250,000225,00013,52148,600
2,084,575
250,000225,0008,485(7,980)
1,960,803
250,000225,0002,758
-2,938,059
250,000225,00013,52148,588
2,422,325
250,000225,0008,485(7,992)
2,186,170
250,000225,0002,758(12)
3,129,621Total Equity 2,621,694 2,436,309 3,415,817 2,959,434 2,661,663 3,607,367
Non Current LiabilitiesInterest-bearingLoans&BorrowingsRetiringBenefitObligationsDeferredIncomeDeferredTaxLiabilityLiabilitytomakeLeasePaymentafteroneyear
2425262728
1,021,294380,800196,17846,861258,284
1,496,162429,478203,03753,369263,489
1,901,956486,075207,12679,555268,493
1,021,294380,895196,17846,861258,284
1,496,162429,573204,26253,369263,489
1,901,956486,169212,70479,555268,493
Total Non Current Liabilities 1,903,419 2,445,534 2,943,205 1,903,513 2,446,855 2,948,877
Current LiabilitiesTradeandOtherPayablesInterest-bearingLoans&BorrowingsLiabilitytomakeLeasePaymentwithinoneyearDividendPayableAmountsduetoRelatedCompanies
2924283031
251,1111,555,202
5,20526,57641,174
202,6851,231,351
5,00421,35416,116
221,621493,7904,81249,0382,237
259,1331,555,201
5,20526,57646,293
210,5291,231,351
5,00421,35421,235
229,405493,7904,81249,0387,351
Total Current Liabilities 1,879,268 1,476,510 771,498 1,892,408 1,489,474 784,396
TOTAL EQUITY AND LIABILITIES 6,404,381 6,358,353 7,130,520 6,755,354 6,597,992 7,340,640
Financial Reports | Statement of Financial Position Statement of Changes in Equity | Financial Reports
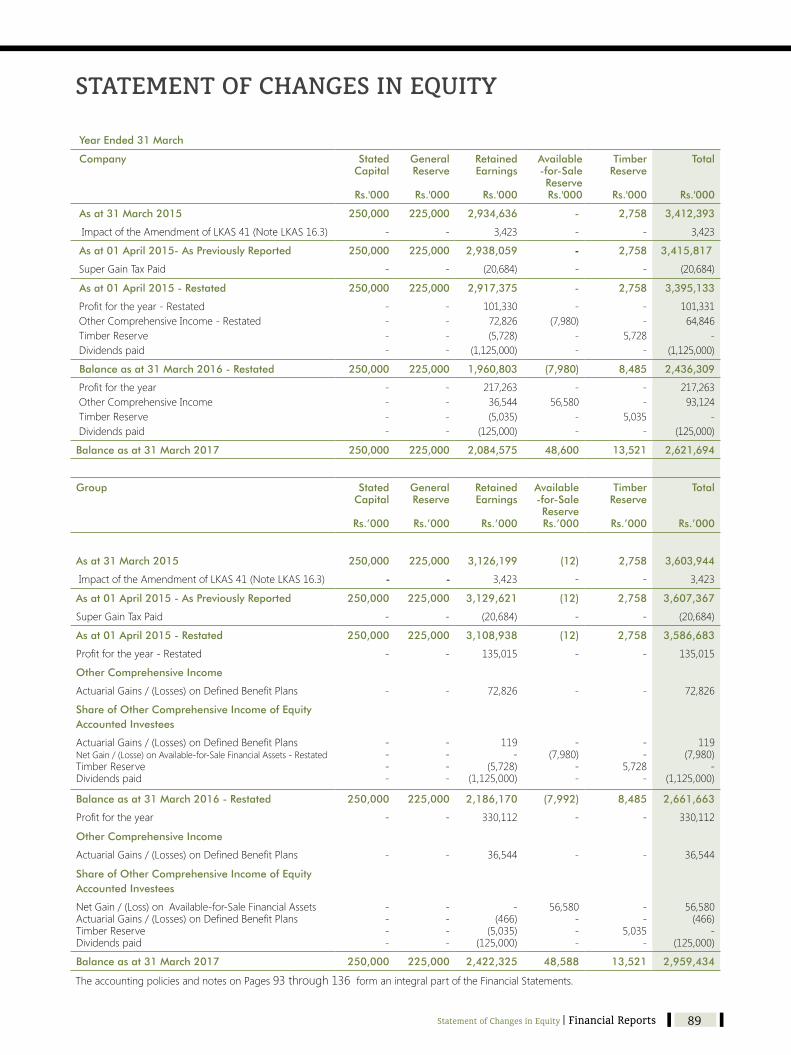
Kegalle Plantations PLC A n n u a l R e p o r t 2 0 1 6 - 1 7
89
STATEMENT OF CHANGES IN EQUITY
Year Ended 31 March
Company Stated Capital
Rs.'000
General Reserve
Rs.'000
Retained Earnings
Rs.'000
Available-for-Sale Reserve Rs.'000
Timber Reserve
Rs.'000
Total
Rs.'000
As at 31 March 2015 250,000 225,000 2,934,636 - 2,758 3,412,393
ImpactoftheAmendmentofLKAS41(NoteLKAS16.3) - - 3,423 - - 3,423
As at 01 April 2015- As Previously Reported 250,000 225,000 2,938,059 - 2,758 3,415,817
SuperGainTaxPaid - - (20,684) - - (20,684)
As at 01 April 2015 - Restated 250,000 225,000 2,917,375 - 2,758 3,395,133
Profitfortheyear-RestatedOtherComprehensiveIncome-RestatedTimberReserveDividendspaid
----
----
101,33072,826(5,728)
(1,125,000)
-(7,980)
--
--
5,728-
101,33164,846
-(1,125,000)
Balance as at 31 March 2016 - Restated 250,000 225,000 1,960,803 (7,980) 8,485 2,436,309
ProfitfortheyearOtherComprehensiveIncomeTimberReserveDividends paid
----
----
217,26336,544(5,035)
(125,000)
-56,580
--
--
5,035-
217,26393,124
-(125,000)
Balance as at 31 March 2017 250,000 225,000 2,084,575 48,600 13,521 2,621,694
Group Stated Capital
Rs.’000
General Reserve
Rs.’000
Retained Earnings
Rs.’000
Available-for-Sale Reserve Rs.’000
Timber Reserve
Rs.’000
Total
Rs.’000
As at 31 March 2015 250,000 225,000 3,126,199 (12) 2,758 3,603,944
ImpactoftheAmendmentofLKAS41(NoteLKAS16.3) - - 3,423 - - 3,423
As at 01 April 2015 - As Previously Reported 250,000 225,000 3,129,621 (12) 2,758 3,607,367
SuperGainTaxPaid - - (20,684) - - (20,684)
As at 01 April 2015 - Restated 250,000 225,000 3,108,938 (12) 2,758 3,586,683
Profitfortheyear-Restated - - 135,015 - - 135,015
Other Comprehensive Income
ActuarialGains/(Losses)onDefinedBenefitPlans - - 72,826 - - 72,826
Share of Other Comprehensive Income of Equity Accounted Investees
ActuarialGains/(Losses)onDefinedBenefitPlansNetGain/(Losse)onAvailable-for-SaleFinancialAssets-RestatedTimberReserveDividendspaid
----
----
119-
(5,728)(1,125,000)
-(7,980)
--
--
5,728-
119(7,980)
-(1,125,000)
Balance as at 31 March 2016 - Restated 250,000 225,000 2,186,170 (7,992) 8,485 2,661,663
Profitfortheyear - - 330,112 - - 330,112
Other Comprehensive Income
ActuarialGains/(Losses)onDefinedBenefitPlans - - 36,544 - - 36,544
Share of Other Comprehensive Income of Equity Accounted Investees
NetGain/(Loss)on Available-for-SaleFinancialAssetsActuarialGains/(Losses)onDefinedBenefitPlansTimberReserveDividendspaid
----
----
-(466)
(5,035)(125,000)
56,580---
--
5,035-
56,580(466)
-(125,000)
Balance as at 31 March 2017 250,000 225,000 2,422,325 48,588 13,521 2,959,434
TheaccountingpoliciesandnotesonPages93through136formanintegralpartoftheFinancialStatements.
Statement of Changes in Equity | Financial Reports

Kegalle Plantations PLC A n n u a l R e p o r t 2 0 1 6 - 1 7
90
Year Ended 31 March Company Group
Notes 2017Rs.'000
2016Rs.'000
2017Rs.'000
2016Rs.'000
CASH FLOWS FROM / (USED IN) OPERATING ACTIVITIESNetProfitBeforeTaxation
199,174
63,863
342,768
118,139
ADJUSTMENTS FOR FinanceIncomeDepreciation/AmortisationProvisionforDefinedBenefitPlanCostsAmortisationofGrantsFinanceCostsDividendReceivedfromAssociatesImpairmentofProperty,Plant&Equipment(Profit)/LossonDisposalofAssetsGains/(Losses)onFairValueofBiologicalAssetsGains/(Losses)onSaleofBiologicalAssetsDeemedDisposal(Gain)/LossShareofResultofAssociates
982526107
716.2
7
(199,131)112,27375,681(13,257)258,101(82,215)
-(1,959)(5,914)
---
(183,284)109,54979,623(15,636)198,223(45,765)
-(2,439)(5,617)(4,598)(32,280)
-
(199,131)112,27375,681(14,483)258,101
-5,118(1,959)(5,914)
--
(228,756)
(183,284)109,54979,623(19,988)198,223
-6,341(2,439)(5,617)(4,598)6,943
(140,827)
Operating Profit before Working Capital Changes 342,753 161,639 343,698 162,065
(Increase)/DecreaseinInventories(Increase)/DecreaseinTradeandOtherReceivablesIncrease/(Decrease)inTradeandOtherPayables(Increase)/DecreaseinamountsduefromRelatedCompaniesIncrease/(Decrease)inamountsduetoRelatedCompanies
(32,167)(151,056)48,4251,60225,058
36,41274,975(18,936)9,33913,879
(32,168)(151,057)48,603480
25,058
36,41275,115(18,875)8,69513,884
Cash Generated from / (used in) Operations 234,615 277,308 234,614 277,296
FinanceCostsPaidDefinedBenefitPlanCostsPaidESC/SGT/IncomeTaxPaid
25
(206,163)(80,978)(11,593)
(147,263)(49,768)(30,626)
(206,163)(80,978)(11,593)
(147,263)(49,768)(30,626)
Net Cash from / (used in) Operating Activities (64,119) 49,651 (64,120) 49,638
CASH FLOWS FROM / (USED IN) INVESTING ACTIVITIES
FinanceIncomeGrant/SubsidyReceivedProceedsfromDisposalofProperty,Plant&EquipmentProceedsfromDisposalofBiologicalAssetsFieldDevelopmentExpenditurePurchaseofProperty,Plant&Equipment
926
NoteANoteB
199,1316,3991,959
-(172,757)(3,168)
183,28411,5462,4394,980
(219,068)(1,581)
199,1316,3991,959
-(172,757)(3,168)
183,28411,5462,4394,980
(219,068)(1,581)
Net Cash from / (used in) Investing Activities 31,564 (18,399) 31,564 (18,399)
CASH FLOWS FROM / (USED IN) FINANCING ACTIVITIES
DividendPaidDividendReceivedfromAssociatesPaymentofGovernmentLeaseRentals-InterestPaymentofGovernmentLeaseRentals-Capital Proceeds from Loans RepaymentofLoans
(119,778)82,215(51,938)(5,004)23,000
(635,157)
(1,151,934)45,765(50,960)(4,812)148,000(368,302)
(119,778)82,215(51,938)(5,004)23,000
(635,157)
(1,151,934)45,765(50,960)(4,812)148,000(368,302)
Net Cash from / (used in) Financing Activities (706,662) (1,382,243) (706,663) (1,382,243)
Net Increase / (Decrease) in Cash & Cash Equivalents (739,217) (1,350,991) (739,218) (1,351,004)
Cash&CashEquivalentsatthebeginningoftheyear NoteC 1,164,194 2,515,185 1,164,194 2,515,197
Cash&CashEquivalentsattheendoftheyear NoteD 424,977 1,164,194 424,976 1,164,194
CASH FLOW STATEMENT
TheaccountingpoliciesandnotesonPages93through136formanintegralpartoftheFinancialStatements.
Financial Reports | Cash Flow Statement Notes to the Cash Flow Statement | Financial Reports

Kegalle Plantations PLC A n n u a l R e p o r t 2 0 1 6 - 1 7
91
NOTES TO THE CASH FLOW STATEMENT
Year Ended 31 March Company Group
NOTE A 2017Rs.'000
2016Rs.'000
2017Rs.'000
2016Rs.'000
Investment in Field Development Expenditure
InvestmentinImmaturePlantations
Rubber 139,148 175,190 139,148 175,190
Tea 22,878 31,536 22,878 31,536
Coconut 1,004 1,346 1,004 1,346
Unallocated 9,727 10,996 9,727 10,996
Total 172,757 219,068 172,757 219,068
Company Group
NOTE B 2017Rs.'000
2016Rs.'000
2017Rs.'000
2016Rs.'000
Investment in Property, Plant & Equipment
Rubber 1,609 802 1,609 802
Tea 1,458 779 1,458 779
Coconut - - - -
Unallocated 101 - 101 -
Total 3,168 1,581 3,168 1,581
Company Group
NOTE C 2017Rs.'000
2016Rs.'000
2017Rs.'000
2016Rs.'000
Cash & Cash Equivalents at the beginning of the year
Cash&BankBalances 23,395 22,888 23,395 22,900
BankOverdrafts (552,069) - (552,069) -
ShorttermInvestments 1,692,867 2,492,297 1,692,867 2,492,297
Total 1,164,194 2,515,185 1,164,194 2,515,197
Company Group
NOTE D 2017Rs.'000
2016Rs.'000
2017Rs.'000
2016Rs.'000
Cash & Cash Equivalents at the end of the year
Cash&BankBalances 17,293 23,395 17,293 23,395
BankOverdrafts (1,013,209) (552,069) (1,013,209) (552,069)
ShortTermInvestments 1,420,892 1,692,867 1,420,892 1,692,867
Total 424,977 1,164,194 424,976 1,164,194
Notes to the Cash Flow Statement | Financial Reports

Kegalle Plantations PLC A n n u a l R e p o r t 2 0 1 6 - 1 7
92
NOTES TO THE FINANCIAL STATEMENTS
Index to the notes to the Financial Statements
Note No. Page No.
1.
2.
3.
4.
5.
6.
7.
8.
9.
10.
11.
12.
13.
14.
15.
16.
17.
18.
Reportingentity Basisofpreparation
Summaryofsignificantaccountingpolicies
Useofjudgments,estimatesandassumptions
Standardsissuedbutnotyeteffective
Revenue
Otherincome&gain
Profitbeforetaxation
Financeincome
Financecost
Share of result of associates
Currenttaxexpenses
Earningspershare
Leaseholdproperty,plant&equipment
Freeholdproperty,plantandequipment
Biologicalassets
16.1.BearerBiologicalAssets
16.2.ConsumableBiologicalAssets-TimberPlantations
16.3.ProduceonBearerBiologicalAssets
Financialassets
17.1.Quotedinvestment
17.2.Unquotedinvestment
Longterminvestments
18.1InvestmentsinSubsidiaries
18.2.InvestmentsinAssociates
18.3.Otherlongterminvestments
18.4.SummarisedFinancialInformationofAssociates
93
93
94
110
111
112
114
114
114
114
115
116
117
117
119
120
120
121
122
122
122
123
124
124
124
124
125
Note No. Page No.
19.
20.
21.
22.
23.
24.
25.
26.
27.
28.
29.
30.
31.
32.
33.
34.
35.
36.
37.
38.
Inventories
Tradeandotherreceivables
AmountsduefromrelatedCompanies
Shortterminvestments
Stated capital
Interestbearingloansandborrowings
Retiringbenefitobligations
Deferredincome
Deferredtaxassetandliabilities
Liabilitytomakeleasepayment
Tradeandotherpayables
Dividendpayable
AmountsduetorelatedCompanies
Assetspledgedassecurities
Capitalcommitments
Commitmentsandcontingencies
Eventsafterreportingperiod
Relatedpartydisclosures
ImpactofamendmentstoLKAS16andLKAS41
Financialriskmanagementobjectivesand policies
126
126
126
126
126
127
128
129
129
130
130
130
131
131
131
131
131
132
133
134
Financial Reports | Notes to the Financial Statements Notes to the Financial Statements | Financial Reports
Kegalle Plantations PLC A n n u a l R e p o r t 2 0 1 6 - 1 7
93
1. REPORTING ENTITY
1.1 Domicile and Legal Form
Kegalle Plantations PLC is a limited liabilityCompany incorporated and domiciled in SriLanka, under the Companies Act No. 17 of1982 (The Company was re-registered underthe Companies Act No. 07 of 2007) in termsof the provisions of the Conversion of PublicCorporations or Government Owned BusinessUndertakingintoPublicCompaniesActNo.23of1987.
TheregisteredofficeoftheCompanyislocatedatNo.310,HighLevelRoad,Nawinna,Maharagama,and Plantations are situated in the plantingdistrictsofKegalle,Kurunegala&Badulla.
TheordinarysharesoftheCompanyarelistedontheColomboStockExchangeofSriLanka.
All companies in the Group are limited liabilitycompanies incorporated and domiciled in Sri Lanka.
The Financial Statements of the Companycomprise with the Statement of FinancialPosition, Statement of Profit or Loss, StatementofComprehensiveIncome,StatementofChangesin Equity, Statement of Cash Flows togetherwith Accounting Policies andNotes to FinancialStatements.
1.2 Principal Activities and Nature of Operations
During the year, the principal activities of theCompanywerethecultivation,manufactureandsaleofRubber,Tea,andCoconut.
Principal activities of other Companies in theGroupareasfollows.
1.3 Parent Enterprise and Ultimate Parent Enterprise
The Company’s parent undertaking is RPCPlantationManagementServices(Pvt)Ltd.Intheopinionofthedirectors,theCompany’sultimateparent undertaking and controlling party isRichardPieris&Co.PLC.,whichisincorporatedinSriLanka.
1.4 Date of Authorization for issue
TheConsolidatedFinancialStatementsofKegallePlantationsPLCand its Subsidiaries for theyearended31March2017wereauthorizedfor issuein accordancewith a resolutionof theboardofdirectorson31May2017.
2. BASIS OF PREPARATION 2.1 Statement of Compliance
The Financial Statements of the Company andtheGroupwhichcomprisetheStatementofProfitor Loss , Statement of Comprehensive Income,Statement of Financial Position, Statement ofChanges in Equity, and Cash Flows StatementtogetherwithAccountingPoliciesandNotestotheFinancialStatements(the“ConsolidatedFinancialStatements”)havebeenprepared inaccordancewithSriLankaAccountingandAuditingStandardsAct No. 15 of 1995, which requires compliancewithSriLankaAccountingStandardspromulgatedbyThe InstituteofCharteredAccountantsofSriLanka (CASL), andwith the requirements of theCompaniesActNo.07of2007.
2.2 Basis of Measurement
These Consolidated Financial Statements havebeenprepared inaccordancewith thehistoricalcostconventionotherthanfollowingitemsintheFinancialStatements.
Company Relationship Nature of the business
HamefaKegalle(Pvt)Ltd Subsidiary Currentlynobusinessoperationsotherthanrent income
RichardPierisNaturalFoamsLtd Associate Manufactureofbestlatexfoamproducts
ArpicoInsurancePLC Associate Providinglifeinsuranceservices
Notes to the Financial Statements | Financial Reports
Kegalle Plantations PLC A n n u a l R e p o r t 2 0 1 6 - 1 7
94
• Right to Use of Land and leased assets ofJEDB/SLSPCatrevaluedamount.
• Managed Consumable biological assets aremeasuredatfairvalue.
• Financial instruments (includingthosecarriedatamortisedcost)
NoadjustmentshavebeenmadeforinflationaryfactorsintheConsolidatedFinancialStatements.
2.3 Functional and Presentation Currency
The Financial Statements are presented inSri Lankan Rupees (Rs.), which is the Group’sfunctionalandpresentationcurrency.Allfinancialinformationpresented inSri LankanRupeeshasbeen given to the nearest rupee, unless statedotherwise.
3. SUMMARY OF SIGNIFICANT ACCOUNTING POLICIES
The Accounting Policies set out below areconsistentwiththoseusedinthepreviousyear.
3.1 Going Concern
TheConsolidatedfinancialstatementshavebeenprepared on the assumption that theCompanyisagoingconcern.TheDirectorshavemadeanassessmentoftheGroup’sabilitytocontinueasagoingconcernintheforeseeablefuture,andtheydo not foresee a need for liquidation or cessation oftrading,tojustifyadoptingthegoingconcernbasisinpreparingtheseFinancialStatements.
3.2 Basis of Consolidation
The consolidated Financial Statements comprisethe Financial Statements of the Group and itssubsidiaries as at 31 March 2017. Control isachieved when the Group is exposed, or hasrights, to variable returns from its involvementwith the investee and has the ability to affectthosereturnsthroughitspowerovertheinvestee.Specifically,theGroupcontrolsaninvesteeif,andonlyif,theGrouphas:
• Power over the investee (i.e., existing rightsthat give it the current ability to direct therelevantactivitiesoftheinvestee)
• Exposure,orrights,tovariablereturnsfromitsinvolvementwiththeinvestee
• Theabilitytouseitspowerovertheinvesteeto affect its returns
Generally,thereisapresumptionthatamajorityofvoting rights result incontrol.Tosupport thispresumptionandwhen theGrouphas less thana majority of the voting or similar rights of aninvestee, the Group considers all relevant factsand circumstances in assessing whether it haspoweroveraninvestee,including:
• The contractual arrangement with the othervoteholdersoftheinvestee
• Rights arising from other contractualarrangements
• TheGroup’svotingrightsandpotentialvotingrights
TheGroupre-assesseswhetherornotitcontrolsan investee if facts and circumstances indicatethat there are changes to one or more of thethree elements of control. Consolidation of asubsidiarybeginswhentheGroupobtainscontrolover thesubsidiaryandceaseswhentheGrouploses control of the subsidiary. Assets, liabilities,incomeandexpensesofasubsidiaryacquiredordisposedofduring the year are included in theconsolidatedFinancialStatements fromthedatetheGroupgainscontroluntilthedatetheGroupceasestocontrolthesubsidiary.
Profit or loss and each component of OtherComprehensive Income (OCI) are attributed totheequityholdersoftheparentoftheGroupandtothenon-controllinginterests,evenifthisresultsin the non-controlling interests having a deficitbalance.Whennecessary,adjustmentsaremadetotheFinancialStatementsofsubsidiariestobringtheiraccountingpoliciesintolinewiththeGroup’saccounting policies. All intra-group assets andliabilities,equity,income,expensesandcashflowsrelatingtotransactionsbetweenmembersoftheGroupareeliminatedinfullonconsolidation.
Achangeintheownershipinterestofasubsidiary,without a loss of control, is accounted for as an equity transaction.
If the Group loses control over a subsidiary,it derecognises the related assets (includinggoodwill), liabilities, non-controlling interest andother components of equity while any resultant gain or loss is recognised in profit or loss. Anyinvestmentretainedisrecognisedatfairvalue.
Financial Reports | Notes to the Financial Statements Notes to the Financial Statements | Financial Reports

Kegalle Plantations PLC A n n u a l R e p o r t 2 0 1 6 - 1 7
95
3.2.1 Business Combinations and Goodwill
Business combinations are accounted for usingtheacquisitionmethod.Thecostofanacquisitionismeasuredastheaggregateoftheconsiderationtransferred,measuredatacquisitiondatefairvalueandtheamountofanyNon-Controlling Interestin theacquiree. For eachbusiness combination,theGroupelectswhether itmeasures theNon-Controlling Interest in the acquiree either atfair value or at the proportionate share of theacquiree’s identifiable net assets. Acquisition-related costs are expensed as incurred andincludedinadministrativeexpenses.
WhentheGroupacquiresabusiness, itassessesthe financial assets and liabilities assumed forappropriate classification and designation inaccordance with the contractual terms, economic circumstances and pertinent conditions as at the acquisition date.
Ifthebusinesscombinationisachievedinstages,anypreviouslyheldequityinterestisremeasuredatitsacquisitiondatefairvalueandanyresultinggainorlossisrecognisedinprofitorloss.
Any contingent consideration to be transferredby the acquirer will be recognised at fair valueattheacquisitiondate.Contingentconsiderationclassifiedasanassetorliabilitythatisafinancialinstrument and within the scope of LKAS39 Financial Instruments: Recognition andMeasurement, is measured at fair value withchanges in fair value recognised either in profitor lossorasachangetoOCI. If thecontingentconsiderationisnotwithinthescopeofLKAS39,it is measured in accordance with the appropriate SLFRS.Contingentconsiderationthatisclassifiedas equity is not remeasured and subsequentsettlement is accounted for within equity.
Goodwill is initiallymeasured at cost, being theexcess of the aggregate of the considerationtransferredandtheamountrecognisedfornon-controlling interests, and any previous interestheld, over the net identifiable assets acquiredand liabilities assumed. If the fair value of thenetassetsacquiredisinexcessoftheaggregateconsideration transferred, theGroup re-assesseswhetherithascorrectlyidentifiedalloftheassetsacquired and all of the liabilities assumed andreviews the procedures used to measure theamounts to be recognised at the acquisitiondate.Ifthereassessmentstillresultsinanexcessof the fair valueofnetassetsacquiredover theaggregate consideration transferred, then thegainisrecognisedinprofitorloss.
After initial recognition,goodwill ismeasuredatcost less any accumulated impairment losses. For thepurposeof impairment testing,goodwillacquired in abusiness combination is, from theacquisitiondate,allocatedtoeachoftheGroup’scash-generatingunitsthatareexpectedtobenefitfrom the combination, irrespective of whetherother assets or liabilities of the acquiree areassignedtothoseunits.
Where goodwill has been allocated to a cash-generatingunitandpartoftheoperationwithinthatunitisdisposedof,thegoodwillassociatedwiththedisposedoperationisincludedinthecarryingamount of theoperationwhendetermining thegain or loss on disposal. Goodwill disposed inthese circumstances is measured based on therelativevaluesofthedisposedoperationandtheportionofthecash-generatingunitretained.
3.2.2 Investment in Associates
An associate is an entity over which the Grouphas significant influence. Significant influenceis the power to participate in the financial andoperatingpolicydecisionsofthe investee,but isnotcontroloverthosepolicies.
The considerations made in determiningsignificantinfluencearesimilartothosenecessarytodeterminecontroloversubsidiaries.
The Group’s investments in its associate areaccountedforusingtheequitymethod.
Under the equity method, the investment inan associate is initially recognised at cost. Thecarrying amount of the investment is adjustedtorecognisechangesintheGroup’sshareofnetassets of the associate since the acquisition date. Goodwill relating to the associate is included inthecarryingamountoftheinvestmentandisnottestedforimpairmentindividually.
ThestatementofprofitorlossreflectstheGroup’sshare of the results of operations of the associate. AnychangeinOCIofthoseinvesteesispresentedas part of the Group’s OCI. In addition, whenthere has been a change recognised directly intheequityoftheassociate,theGrouprecognisesitsshareofanychanges,whenapplicable,inthestatementofchanges inequity.Unrealisedgainsand losses resulting from transactions betweentheGroupandtheassociateareeliminatedtotheextentoftheinterestintheassociate.
Notes to the Financial Statements | Financial Reports

Kegalle Plantations PLC A n n u a l R e p o r t 2 0 1 6 - 1 7
96
The aggregate of theGroup’s share of profit orloss of an associate is shown on the face of the statement of profit or loss outside operatingprofitand representsprofitor lossafter taxandnon-controllinginterestsinthesubsidiariesoftheassociate.
The Financial Statements of the associate areprepared for the same reporting period as theGroup.Whennecessary,adjustmentsaremadetobringtheaccountingpoliciesinlinewiththoseoftheGroup.
After application of the equity method, the
Group determines whether it is necessary torecogniseanimpairmentlossonitsinvestmentinits associate.At each reportingdate, theGroupdetermines whether there is objective evidencethat the investment in theassociate is impaired.Ifthereissuchevidence,theGroupcalculatestheamountofimpairmentasthedifferencebetweenthe recoverableamountof theassociateand itscarrying value, and then recognises the loss as‘Shareofprofitofanassociateinthestatementofprofitorloss.
Upon loss of significant influence over theassociate, the Group measures and recognisesany retained investment at its fair value. Anydifference between the carrying amount of theassociate upon loss of significant influence andthe fair value of the retained investment andproceedsfromdisposalisrecognisedinprofitorloss.
3.3 Current versus Non-Current Classification
The Group presents assets and liabilities instatementoffinancialpositionbasedoncurrent/non - current classification. An asset as currentwhenitis:
• Expectedtoberealisedorintendedtosoldorconsumedinnormaloperatingcycle
• Heldprimarilyforthepurposeoftrading• Expectedtoberealisedwithintwelvemonths
afterthereportingperiod
Or
• Cashorcashequivalentunlessrestrictedfrombeing exchanged or used to settle a liabilityforatleasttwelvemonthsafterthereportingperiod
Allotherassetsareclassifiedasnon-current.
Aliabilityiscurrentwhen:
• Itisexpectedtobesettledinnormaloperatingcycle
• Itisheldprimarilyforthepurposeoftrading
• Itisduetobesettledwithintwelve monthsafterthereportingperiod
Or
• Thereisnounconditionalrighttodeferthesettlement of the liability for at least twelvemonthsafterthereportingperiod
TheGroupclassifiesallotherliabilitiesasnon-current.
Deferredtaxassetsandliabilitiesareclassifiedasnon-currentassetsandliabilities.
3.4 Fair Value Measurement
The Group measures financial instruments andnon-financialassetsatfairvalueateachstatementof financial position date. Fair value relateddisclosures for financial instruments and non-financialassetsthataremeasuredatfairvalueorwherefairvaluesaredisclosedaresummarisedinthefollowingnotes:
• ManagedConsumableBiologicalAssets• ProduceonBearerBiologicalAssets• FinancialInstruments
Fairvalueisthepricethatwouldbereceivedto sell an asset or paid to transfer a liabilityin an orderly transaction between marketparticipants at the measurement date. Thefair value measurement is based on thepresumption that the transaction to sell the assetortransfertheliabilitytakesplaceeither:
• Intheprincipalmarketfortheassetorliability Or
• Intheabsenceofaprincipalmarket,inthemostadvantageousmarketfortheassetorliability
Theprincipalor themost advantageousmarketmustbeaccessiblebytheGroup.
Thefairvalueofanassetoraliabilityismeasuredusing the assumptions that market participantswould use when pricing the asset or liability,assuming that market participants act in theireconomicbestinterest.
Afairvaluemeasurementofanon-financialasset
Financial Reports | Notes to the Financial Statements Notes to the Financial Statements | Financial Reports

Kegalle Plantations PLC A n n u a l R e p o r t 2 0 1 6 - 1 7
97
takesintoaccountamarketparticipant’sabilitytogenerateeconomicbenefitsbyusingtheassetinitshighestandbestuseorbysellingittoanothermarketparticipantthatwouldusetheassetinitshighestandbestuse.
The Group uses valuation techniques that areappropriate in the circumstances and for which sufficientdataareavailabletomeasurefairvalue,maximisingtheuseofrelevantobservableinputsandminimisingtheuseofunobservableinputs.
All assets and liabilities for which fair value ismeasuredordisclosedintheFinancialStatementsare categorised within the fair value hierarchy,described as follows, based on the lowestlevel input that is significant to the fair valuemeasurementasawhole:
• Level 1 — Quoted (unadjusted) marketpricesinactivemarketsforidenticalassetsorliabilities
• Level2 — Valuation techniques for which the lowestlevelinputthatissignificanttothefairvalue measurement is directly or indirectlyobservable
• Level3 — Valuation techniques for which the lowestlevelinputthatissignificanttothefairvaluemeasurementisunobservable
For assets and liabilities that are recognised inthe financial statements on a recurring basis,the Group determines whether transfers haveoccurredbetween levels in the hierarchy by re-assessing categorisation (based on the lowestlevel input that is significant to the fair valuemeasurement as a whole) at the end of eachreportingperiod.
External valuers are involved for valuation ofsignificant assets, such as managed biologicalassets,andsignificantliabilities,suchasretirementbenefitobligation.Involvementofexternalvaluersis decided upon annually by the ManagementCommittee after discussion with and approvalby the Company’s Audit Committee. Selectioncriteria include market knowledge, reputation,independence and whether professional standards are maintained. The Management Committeedecides,afterdiscussionswiththeGroup’sexternalvaluers,whichvaluationtechniquesandinputstouse for each case.
Forthepurposeoffairvaluedisclosures,theGrouphasdeterminedclassesofassetsandliabilitiesonthebasisofthenature,characteristicsandrisksoftheassetorliabilityandthelevelofthefairvaluehierarchyasexplainedabove.
3.5 Foreign Currency Translation
Transactions in foreign currencies are initiallyrecordedbytheGroup’sentitiesattheirrespectivefunctional currency spot rates at the date the transactionfirstqualifiesforrecognition.Monetaryassets and liabilities denominated in foreigncurrencies are translated at the functional currency spot rates of exchange at the reporting date.Differencesarisingonsettlementortranslationofmonetary items are recognised in profit or losswith the exception of monetary items that aredesignated as part of the hedgeof theGroup’snetinvestmentofaforeignoperation.Thesearerecognised inothercomprehensive incomeuntilthenet investmentisdisposedof,atwhichtime,the cumulative amount is reclassified to profitor loss. Tax charges and credits attributable toexchange differences on those monetary itemsarealsorecordedinothercomprehensiveincome.
Non-monetary assets and liabilities which arecarried in terms of historical cost in a foreigncurrency are retranslated at the exchange ratethatprevailedatthedateofthetransaction.Non-monetaryitemsmeasuredatfairvalueinaforeigncurrencyaretranslatedusingtheexchangeratesat the date when the fair value is determined.The gain or loss arising on retranslation ofnon-monetary items is treated in line with therecognitionofgainorlossonchangeinfairvalueof the item (i.e., translationdifferenceson itemswhose fair value gain or loss is recognised inother comprehensive incomeorprofitor loss isalso recognised inother comprehensive incomeorprofitorloss,respectively).
3.6 Property, Plant and Equipment
Thegroupapplies the requirementsof LKAS16on‘PropertyPlantandEquipment’inaccountingfor its owned assets which are held for and use in theprovisionoftheservices,forrentaltootherorfor administrationpurpose and are expected tobeusedformorethanoneyear.
3.6.1 Basis of Recognition
PropertyPlantandEquipmentisrecognisedifitisprobablethatfutureeconomicbenefitassociatedwiththeassetswillflowtotheGroupandcostoftheassetcanbereliablymeasured.
3.6.2 Measurement
Items of Property, Plant & Equipment aremeasured at cost (or at fair value in the caseof land) less accumulated depreciation andaccumulated impairment losses, if any.
Notes to the Financial Statements | Financial Reports

Kegalle Plantations PLC A n n u a l R e p o r t 2 0 1 6 - 1 7
98
3.6.3 Owned Assets
ThecostofProperty,Plant&Equipmentincludesexpenditures thataredirectlyattributable to theacquisition of the asset. Such costs includes the costofreplacingpartoftheproperty,plantandequipment and borrowing costs for long termsconstructionprojectsiftherecognitioncriteriaaremet.Thecostofself-constructedassets includesthecostofmaterialsanddirectlabour,anyothercostdirectlyattributabletobringingtheassettoaworkingconditionforitsintendeduse,andthecostsofdismantlingandremovingtheitemsandrestoringthesiteonwhichtheyarelocated.
Purchased software that is integral to thefunctionalityoftherelatedequipmentiscapitalizedas a part of that equipment.
When significant parts of property, plant andequipmentarerequiredtobereplacedatintervals,theentityrecognisessuchpartsasindividualassets(majorcomponents)withspecificusefullivesanddepreciation,respectively.Likewise,whenamajorinspection isperformed, itscost isrecognised inthecarryingamountoftheplantandequipmentas a replacement if the recognition criteria aresatisfied.Allother repairandmaintenancecostsarerecognisedintheStatementofProfitorLossas incurred. The present value of the expectedcostforthedecommissioningoftheassetafteritsuseisincludedinthecostoftherespectiveassetiftherecognitioncriteriaforaprovisionaremet.
Capital work-in-progress is transferred to therespective asset accounts at the time of firstutilisation or at the time the asset is commissioned.
3.6.4 Leased Assets
Thedeterminationofwhetheranarrangementis(orcontains)aleaseisbasedonthesubstanceofthearrangementattheinceptionofthelease.Thearrangement is, or contains, a lease if fulfilmentof thearrangement isdependenton theuseofa specific asset or assets and the arrangementconveys a right to use the asset or assets,even if that right is not explicitly specified in anarrangement.
Group as a lessee
A lease is classified at the inception date as afinanceleaseoranoperatinglease.Aleasethattransfers substantially all the risks and rewardsincidentaltoownershiptotheGroupisclassifiedasafinancelease.
Finance leases are capitalised at the
commencement of the lease at the inception date fairvalueoftheleasedpropertyor,iflower,atthepresent value of the minimum lease payments.Lease payments are apportioned betweenfinancechargesandreductionoftheleaseliabilitysoastoachieveaconstantrateofinterestontheremainingbalanceoftheliability.Financechargesarerecognised infinancecosts in thestatementofprofitorloss.
Aleasedasset isdepreciatedovertheuseful lifeof the asset. However, if there is no reasonablecertaintythattheGroupwillobtainownershipbythe end of the lease term, the asset is depreciated overtheshorteroftheestimatedusefullifeoftheasset and the lease term.
Operating leasepaymentsare recognisedasanoperating expense in the statement of profit orlossonastraight-linebasisovertheleaseterm.
3.6.5 Derecognition
Anitemofproperty,plantandequipmentandanysignificantpartinitiallyrecognisedisderecognisedupon disposal or when no future economic benefits are expected from its use or disposal.Anygainor lossarisingonderecognitionof theasset (calculated as the difference between thenetdisposal proceeds and the carrying amountoftheasset)isincludedintheStatementofProfitorLosswhentheassetisderecognizedandgainsare not classified as revenue. When revaluedassets are sold, any related amount included in theRevaluationReserveistransferredtoRetainedEarnings.
3.6.6 Land Development Cost
Permanent land development costs are thosecosts incurred in making major infrastructuredevelopmentandbuildingnewaccess roadsonleasehold lands.
Thesecostshavebeencapitalisedandamortisedovertheremainingleaseperiod. Permanent impairments to land developmentcosts are charged to the Statement of Profitor Loss in full or reduced to the net carryingamounts of such assets in the year of occurrence afterascertainingtheloss.
3.6.7 Biological Assets
Biological assets are classified into maturebiologicalassetsand immaturebiologicalassets.Mature biological assets are those that haveattained harvestable specifications or are able
Financial Reports | Notes to the Financial Statements Notes to the Financial Statements | Financial Reports

Kegalle Plantations PLC A n n u a l R e p o r t 2 0 1 6 - 1 7
99
to sustain regular harvests. Immature biologicalassets are those that have not yet attainedharvestable specification. Tea, Rubber andother plantations and nurseries are classified asbiologicalassets.
Biological assets are further classified as bearerbiological assets and consumable biologicalassets. Bearer biological assets include Tea,Rubber and Coconut plants, those that are notintendedtobesoldorharvested,howeverusedto grow for harvesting agricultural produce.Consumable biological assets include managedtimber trees those that are to be harvested asagriculturalproducefrombiologicalassetsorsoldasbiologicalassets.
Theentity recognize thebiologicalassetswhen,and only when, the entity controls the assets as a result of past event, it is probable that futureeconomicbenefitsassociatedwiththeassetswillflow to the entity and the fair value or cost ofthe assets can bemeasured reliably. Permanentimpairments toBiologicalAssetsare charged totheStatementofProfitorLossinfullandreducedtothenetcarryingamountsofsuchassetintheyearofoccurrenceafterascertainingtheloss.
(a) Bearer Biological Assets
Thebearerbiologicalassetsaremeasuredatcostless accumulated depreciation and accumulated impairment losses, ifany, in termsofLKAS16–PropertyPlant&Equipment.
Thecostof landpreparation, rehabilitation,newplanting, replanting, crop diversification, interplantingandfertilizingetc.,incurredbetweenthetimeofplantingandharvesting(whentheplantedareaattainsmaturity),areclassifiedas immatureplantations. These immature plantations areshownatdirectcostsplusattributableoverheads,includinginterestattributabletolong-termloansused for financing immature plantations. Theexpenditure incurredonbearerbiologicalassets(Tea,RubberandTimberfields)whichcomesintobearingduringtheyear, istransferredtomatureplantations.
(b) Consumable Biological Assets
Consumable biological assets include managedtimber that are to be harvested as agriculturalproduceorsoldasbiologicalassets.
Themanagedtimbertreesaremeasuredoninitial
recognition and at the end of each reportingperioditsfairvaluelesscosttosellintermsofLKAS41.The cost is treated as approximation to fairvalueofyoungplantsastheimpactonbiologicaltransformationofsuchplantstopriceduringthisperiodisimmaterial.Thefairvalueoftimbertreesare measured using DCF method taking in toconsiderationthecurrentmarketpricesoftimber,appliedtoexpectedtimbercontentofatreeatthematurity by an independent professional valuer.AllotherassumptionsandsensitivityanalysisaregiveninNote16.2.
The Main Variables in DCF Model Concerns
Nursery cost includes the cost of direct materials, directlyattributableoverheads, lessprovisionforovergrownplants.
Thegainor loss arisingon initial recognitionofconsumablebiologicalassetsatfairvaluelesscosttosellandfromachangeinfairvaluelesscosttosellofconsumablebiologicalassetsareincludedinprofitorlossfortheperiodinwhichitarises.
(c) Produce Growing on Bearer Biological Assets
InaccordancewithLKAS41,Companyrecogniseagriculturalproducegrowingonbearerplantsatfairvaluelesscosttosell.Changeinthefairvalueofsuchagriculturalproducerecognizedinprofitorlossattheendofeachreportingperiod.
Variable Comment
Timbercontent
Estimatebasedonphysicalverificationofgirth, height and considering the growthoftheeachspicesindifferentgeographicalregions.Factor all the prevailing statutoryregulations enforced against harvestingoftimbercoupledwithforestryplanoftheCompany.
Economicuseful life
EstimatedbasedonthenormallifespanofeachspicesbyfactoringtheforestryplanoftheCompany.
Sellingprice
EstimatedbasedonprevailingSri Lankanmarket prices. Factor all the conditionsto be fulfilled in bringing the trees intosaleablecondition.
Plantingcost
Estimatedcostsforthefurtherdevelopmentof immature areas are deducted.
Discountrate
Futurecashflowsarediscountedat14%
Notes to the Financial Statements | Financial Reports
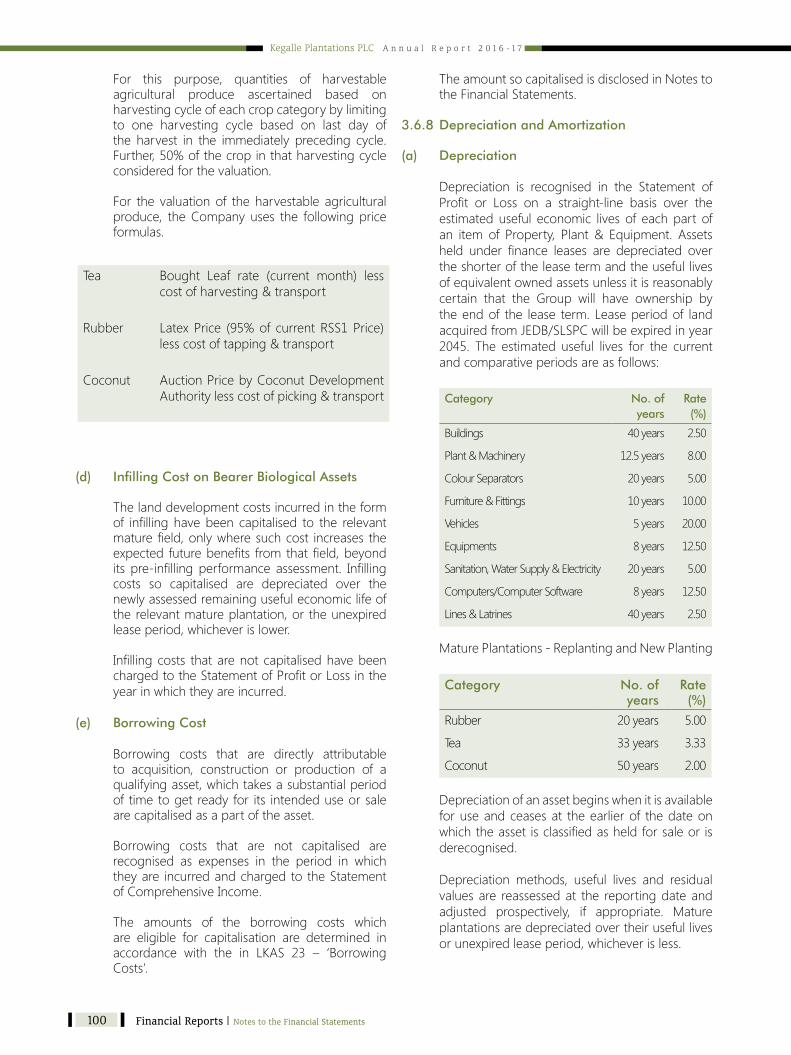
Kegalle Plantations PLC A n n u a l R e p o r t 2 0 1 6 - 1 7
100
For this purpose, quantities of harvestableagricultural produce ascertained based onharvestingcycleofeachcropcategorybylimitingto one harvesting cycle based on last day ofthe harvest in the immediately preceding cycle.Further,50%ofthecropinthatharvestingcycleconsideredforthevaluation.
For the valuationof the harvestable agriculturalproduce, theCompany uses the followingpriceformulas.
(d) Infilling Cost on Bearer Biological Assets
Thelanddevelopmentcostsincurredintheformof infillinghavebeen capitalised to the relevantmaturefield,onlywheresuchcost increases theexpected futurebenefits fromthatfield,beyondits pre-infilling performance assessment. Infillingcosts so capitalised are depreciated over thenewlyassessedremainingusefuleconomiclifeoftherelevantmatureplantation,ortheunexpiredleaseperiod,whicheverislower.
Infillingcosts thatarenot capitalisedhavebeenchargedtotheStatementofProfitorLossintheyear in which they are incurred.
(e) Borrowing Cost
Borrowing costs that are directly attributableto acquisition, construction or production of a qualifyingasset,whichtakesasubstantialperiodof timetogetreadyfor its intendeduseorsaleare capitalised as a part of the asset.
Borrowing costs that are not capitalised arerecognised as expenses in the period in whichtheyare incurredandchargedtotheStatementofComprehensiveIncome.
The amounts of the borrowing costs whichare eligible for capitalisation are determined inaccordance with the in LKAS 23 – ‘BorrowingCosts’.
TheamountsocapitalisedisdisclosedinNotestotheFinancialStatements.
3.6.8 Depreciation and Amortization
(a) Depreciation
Depreciation is recognised in the Statement ofProfit or Loss on a straight-line basis over theestimateduseful economic lives of eachpart ofan item of Property, Plant & Equipment. Assetsheld under finance leases are depreciated overtheshorteroftheleasetermandtheusefullivesofequivalentownedassetsunlessitisreasonablycertain that the Group will have ownership bythe end of the lease term. Lease period of land acquiredfromJEDB/SLSPCwillbeexpiredinyear2045. The estimated useful lives for the currentandcomparativeperiodsareasfollows:
Category No. of years
Rate (%)
Buildings 40years 2.50
Plant&Machinery 12.5years 8.00
ColourSeparators 20years 5.00
Furniture&Fittings 10years 10.00
Vehicles 5years 20.00
Equipments 8years 12.50
Sanitation,WaterSupply&Electricity 20years 5.00
Computers/ComputerSoftware 8years 12.50
Lines&Latrines 40years 2.50
MaturePlantations-ReplantingandNewPlanting
Category No. of years
Rate (%)
Rubber 20years 5.00
Tea 33years 3.33
Coconut 50years 2.00
Depreciationofanassetbeginswhenitisavailablefor use and ceases at the earlier of the date on whichtheasset isclassifiedasheldforsaleor isderecognised.
Depreciation methods, useful lives and residualvaluesare reassessedat the reportingdateandadjusted prospectively, if appropriate. Matureplantationsaredepreciatedovertheirusefullivesorunexpiredleaseperiod,whicheverisless.
Tea Bought Leaf rate (current month) lesscostofharvesting&transport
Rubber LatexPrice (95%of currentRSS1Price)lesscostoftapping&transport
Coconut AuctionPricebyCoconutDevelopmentAuthoritylesscostofpicking&transport
Financial Reports | Notes to the Financial Statements Notes to the Financial Statements | Financial Reports

Kegalle Plantations PLC A n n u a l R e p o r t 2 0 1 6 - 1 7
101
No depreciation is provided for immatureplantations.
(b) Amortisation
The leasehold rights of assets taken over fromJEDB/SLSPCareamortisedinequalamountsovertheshorteroftheremainingleaseperiodsandtheusefullivesasfollows:
Category No. of years
Rate (%)
Leasehold Property 53years 1.89
MaturePlantations 30years 3.33
Buildings 25years 4.00
Machinery 15years 6.67
ImprovementstoLand 30years 3.33
3.7 Intangible Assets
Intangibleassetsacquiredseparatelyaremeasuredoninitialrecognitionatcost.Thecostofintangibleassetsacquiredinabusinesscombinationistheirfair value at the date of acquisition. Followinginitial recognition, intangible assets are carriedat cost less any accumulated amortisation and accumulated impairment losses. Internallygenerated intangibles, excluding capitaliseddevelopment costs, are not capitalised and therelatedexpenditureisreflectedinprofitorlossintheperiodinwhichtheexpenditureisincurred.
Theuseful livesof intangibleassetsareassessedaseitherfiniteorindefinite.
Intangible assets with finite lives are amortisedover the useful economic life and assessed forimpairment whenever there is an indicationthat the intangible asset may be impaired. Theamortisation period and the amortisation method foranintangibleassetwithafiniteusefullifearereviewed at least at the end of each reportingperiod. Changes in the expected useful life orthe expected pattern of consumption of futureeconomic benefits embodied in the asset areconsidered to modify the amortisation period or method, as appropriate, and are treated as changesinaccountingestimates.Theamortisationexpense on intangible assets with finite lives isrecognised in the statement of profit or loss intheexpensecategory that isconsistentwith thefunctionoftheintangibleassets.
Intangibleassetswithindefiniteusefullivesarenot
amortised,butaretestedforimpairmentannually,either individuallyoratthecash-generatingunitlevel.Theassessmentofindefinitelifeisreviewedannually todeterminewhether the indefinite lifecontinues tobe supportable. If not, the changeinusefullifefromindefinitetofiniteismadeonaprospectivebasis.
Gainsor lossesarising fromderecognitionofanintangible asset aremeasured as the differencebetween the net disposal proceeds and thecarryingamountoftheassetandarerecognisedinthestatementofprofitorlosswhentheassetisderecognised.
3.8 Research and Development Costs
Research costs are expensed as incurred.Development expenditures on an individualproject are recognised as an intangible assetwhentheGroupcandemonstrate:
• The technical feasibility of completing theintangible asset so that the asset will beavailableforuseorsale
• Its intention to complete and its ability andintention to use or sell the asset
• Howtheassetwillgenerate futureeconomicbenefits
• The availability of resources to complete theasset
• Theabilitytomeasurereliablytheexpenditureduringdevelopment
Following initial recognitionof thedevelopmentexpenditure as an asset, the asset is carried atcost less any accumulated amortisation and accumulated impairment losses.Amortisationoftheassetbeginswhendevelopmentiscompleteandtheasset isavailableforuse. It isamortisedover the period of expected future benefit.Amortisation isrecorded incostofsales.Duringtheperiodofdevelopment,theassetistestedforimpairment annually.
3.9 Financial Instruments
Afinancial instrument is any contract that givesrisetoafinancialassetofoneentityandafinancialliabilityorequityinstrumentofanotherentity.
3.9.1 Financial Assets
3.9.1.1 Initial Recognition and Measurement
Financialassetsareclassified,atinitialrecognition,asfinancialassetsat fair value throughprofitorloss, loans and receivables, held-to-maturity
Notes to the Financial Statements | Financial Reports

Kegalle Plantations PLC A n n u a l R e p o r t 2 0 1 6 - 1 7
102
investments,AFSfinancialassets,orasderivativesdesignatedashedginginstrumentsinaneffectivehedge, as appropriate. All financial assets arerecognisedinitiallyatfairvalueplus,inthecaseoffinancialassetsnotrecordedatfairvaluethroughprofitorloss,transactioncoststhatareattributabletotheacquisitionofthefinancialasset.
Purchasesorsalesoffinancialassetsthatrequiredeliveryofassetswithinatimeframeestablishedbyregulationorconvention in themarketplace(regularwaytrades)arerecognisedi.e.,thedatethat theGroup commits topurchaseor sell theasset.
TheGroup’sfinancialassetsincludecashandshort-termdeposits,shortterminvestments,tradeandother receivables, loans and other receivables,quotedandunquotedfinancialinstruments.
3.9.1.2 Subsequent Measurement
Thesubsequentmeasurementoffinancialassetsdependsontheirclassificationasdescribedbelow:
(a) Financial assets at fair value through profit or loss
Financial assets at fair value through profit orloss include financial assets held-for-tradingand financial assets designated upon initialrecognition at fair value through profit or loss.Financial assets are classifiedasheld-for-tradingiftheyareacquiredforthepurposeofsellingorrepurchasinginthenearterm.
Financial assets at fair value through profit andloss are carried in the Statement of FinancialPositionatfairvaluewithnetchangesinfairvaluepresentedasfinance incomeorfinancecosts intheStatementofProfitorLoss.
TheGrouphasnotdesignatedanyfinancialassetsasatfairvaluethroughprofitorloss.
(b) Loans and receivables
Loansandreceivablesarenon-derivativefinancialassets with fixed or determinable paymentsthat are not quoted in an active market. Afterinitial measurement, such financial assets aresubsequentlymeasuredatamortizedcostusingthe Effective Interest Rate (EIR) method, lessimpairment. Amortized cost is calculated bytakingintoaccountanydiscountorpremiumonacquisitionandfeesorcoststhatareanintegral
partoftheEIR.TheEIRamortizationisincludedinfinanceincomeintheStatementofProfitorLoss.ThelossesarisingfromimpairmentarerecognisedintheStatementofProfitorLossinfinancecosts.
Loans and receivables comprise of tradereceivables, amounts due from related parties,deposits, advances and other receivables andcashandcashequivalents.
(c) Held-to-maturity investments
Non-derivative financial assets with fixed ordeterminablepayments and fixedmaturities areclassified as held-to-maturity when the Grouphasthepositiveintentionandabilitytoholdthemto maturity. After initial measurement, held-to-maturityinvestmentsaremeasuredatamortisedcost using the effective interest method, lessimpairment.
Amortisedcostiscalculatedbytakingintoaccountany discount or premium on acquisition and fees orcoststhatareanintegralpartoftheEIR.TheEIRamortisationisincludedinfinanceincomeintheStatementofProfitorLoss.ThelossesarisingfromimpairmentarerecognisedintheStatementofProfitorLossinfinancecosts.
(d) Available-for-sale financial investments
AFS financial assets include equity investmentsanddebtsecurities.Equity investmentsclassifiedasAFSarethosethatareneitherclassifiedasheldfor tradingnordesignatedat fair value throughprofitorloss.Debtsecuritiesinthiscategoryarethosethatareintendedtobeheldforanindefiniteperiodoftimeandthatmaybesoldinresponsetoneedsforliquidityorinresponsetochangesinthemarketconditions.
After initial measurement, AFS financial assetsare subsequently measured at fair value withunrealisedgainsorlossesrecognisedinOCIandcreditedintheAFSreserveuntiltheinvestmentisderecognised,atwhichtimethecumulativegainor loss is recognised inotheroperating income,orthe investment isdeterminedtobe impaired,whenthecumulative loss isreclassifiedfromtheAFSreserve to thestatementofprofitor loss infinancecosts. InterestearnedwhilstholdingAFSfinancial assets is reported as interest incomeusingtheEIRmethod.
The Group evaluates whether the ability andintention to sell its AFS financial assets in thenear term is still appropriate. When, in rare
Financial Reports | Notes to the Financial Statements Notes to the Financial Statements | Financial Reports

Kegalle Plantations PLC A n n u a l R e p o r t 2 0 1 6 - 1 7
103
circumstances,theGroupisunabletotradethesefinancialassetsduetoinactivemarkets,theGroupmayelecttoreclassifythesefinancialassetsifthemanagementhastheabilityandintentiontoholdtheassetsforforeseeablefutureoruntilmaturity.
For a financial asset reclassified from the AFScategory, the fair value carrying amount at thedateofreclassificationbecomesitsnewamortisedcostandanypreviousgainor losson theassetthathasbeen recognised inequity isamortisedto profit or loss over the remaining life of theinvestmentusingtheEIR.Anydifferencebetweenthe new amortised cost and the maturity amount is also amortised over the remaining life of theasset using the EIR. If the asset is subsequentlydetermined to be impaired, then the amountrecordedinequityisreclassifiedtothestatementofprofitorloss.
3.9.1.3 Derecognition
A financial asset (or, where applicable, a partofafinancialassetorpartofagroupof similarfinancialassets)isderecognisedwhen:
• Therightstoreceivecashflowsfromtheassethaveexpired
• TheGrouphastransferreditsrightstoreceivecashflowsfromtheassetorhasassumedanobligationtopaythereceivedcashflowsinfullwithout material delay to a third party under a ‘pass-through’arrangement;andeither(a)theGrouphastransferredsubstantiallyalltherisksandrewardsoftheasset,or(b)theGrouphasneither transferred nor retained substantiallyalltherisksandrewardsoftheasset,buthastransferred control of the asset.
When the Group has transferred its rights toreceivecashflowsfromanassetorhasenteredintoapass-througharrangement,itevaluatesifandtowhatextentithasretainedtherisksandrewardsofownership.Whenithasneithertransferrednorretainedsubstantiallyalloftherisksandrewardsof the asset, nor transferred control of the asset, theassetisrecognisedtotheextentoftheGroup’scontinuinginvolvementintheasset.Inthatcase,theGroupalsorecognisesanassociated liability.The transferredassetand theassociated liabilityaremeasuredon a basis that reflects the rightsandobligationsthattheGrouphasretained.
Continuinginvolvementthattakestheformofa
guaranteeoverthetransferredassetismeasuredattheloweroftheoriginalcarryingamountoftheassetandthemaximumamountofconsiderationthattheGroupcouldberequiredtorepay.
3.9.1.4 Impairment of financial assets
The Group assesses at each reporting datewhether there is any objective evidence thata financial asset or a group of financial assetsis impaired and if such has been incurred, theamount of the loss is measured as the difference between the assets carrying amount and thepresentvalueofestimatedfuturecashflows.
Evidenceof impairmentmay include indicationsthat the debtors or a group of debtors isexperiencing significant financial difficulty,default or delinquency in interest or principal payments, the probability that they will enterbankruptcyorotherfinancial reorganisationandwhen observable data indicate that there is ameasurabledecreaseintheestimatedfuturecashflows, such as changes in arrears or economicconditions that correlate with defaults.
3.9.1.4.1 Financial assets carried at amortised cost
For financial assets carried at amortised cost,the Group first assesses whether impairmentexists individually for financial assets that areindividuallysignificant,orcollectivelyforfinancialassets that are not individually significant. If theGroup determines that no objective evidenceof impairmentexists foran individuallyassessedfinancial asset, whether significant or not, itincludes the asset in a groupof financial assetswith similar credit risk characteristics andcollectivelyassessesthemforimpairment.Assetsthatareindividuallyassessedforimpairmentandfor which an impairment loss is, or continues to be, recognised are not included in a collectiveassessment of impairment.
The amount of any impairment loss identifiedis measured as the difference between theasset’s carrying amount and the present valueof estimated future cash flows (excluding futureexpected credit losses that have not yet beenincurred). The present value of the estimatedfuture cash flows is discounted at the financialasset’soriginaleffectiveinterestrate.
The carrying amount of the asset is reducedthroughtheuseofanallowanceaccountandtheloss is recognised in the statement of profit orloss.Interestincome(recordedasfinanceincome
Notes to the Financial Statements | Financial Reports

Kegalle Plantations PLC A n n u a l R e p o r t 2 0 1 6 - 1 7
104
in the statement of profit or loss) continues tobe accrued on the reduced carrying amountandisaccruedusingtherateofinterestusedtodiscountthefuturecashflowsforthepurposeofmeasuring the impairment loss. Loans togetherwith the associated allowance are written off when there is no realistic prospect of future recoveryandall collateral hasbeen realisedorhasbeentransferred to the Group. If, in a subsequentyear, the amount of the estimated impairment loss increasesordecreasesbecauseofaneventoccurring after the impairment was recognised,the previously recognised impairment loss isincreasedorreducedbyadjustingtheallowanceaccount. If a write-off is later recovered, therecovery is credited to finance costs in thestatementofprofitorloss.
3.9.1.4.2 Available-for-sale financial Assets
For AFS financial assets, the Group assesses ateach reporting date whether there is objectiveevidence that an investment or a group ofinvestmentsisimpaired.
InthecaseofequityinvestmentsclassifiedasAFS,objectiveevidencewouldincludeasignificantorprolongeddeclineinthefairvalueoftheinvestmentbelowitscost.‘Significant’isevaluatedagainsttheoriginal cost of the investment and ‘prolonged’againsttheperiodinwhichthefairvaluehasbeenbelowitsoriginalcost.Whenthereisevidenceofimpairment, the cumulative loss –measured asthedifferencebetween the acquisition cost andthe current fair value, less any impairment losson that investment previously recognised in thestatementofprofitorloss–isremovedfromOCIandrecognisedinthestatementofprofitorloss.Impairmentlossesonequityinvestmentsarenotreversedthroughprofitorloss;increasesintheirfairvalueafterimpairmentarerecognisedinOCI.
The determination of what is ‘significant’ or‘prolonged’ requires judgement. In making thisjudgement, the Group evaluates, among otherfactors, the duration or extent towhich the fairvalueofaninvestmentislessthanitscost.
InthecaseofdebtinstrumentsclassifiedasAFS,the impairment is assessed based on the samecriteriaasfinancialassetscarriedatamortisedcost.However,theamountrecordedforimpairmentisthe cumulative loss measured as the differencebetweentheamortisedcostandthecurrentfairvalue,lessanyimpairmentlossonthatinvestmentpreviously recognised in the statement of profitor loss.
Future interest income continues to be accruedbased on the reduced carrying amount ofthe asset, using the rate of interest used todiscount the future cash flows for the purposeof measuring the impairment loss. The interestincome is recorded as part of finance income.If, ina subsequent year, the fair valueofadebtinstrument increases and the increase can beobjectivelyrelatedtoaneventoccurringaftertheimpairmentlosswasrecognisedinthestatementofprofitor loss, the impairment loss is reversedthroughthestatementofprofitorloss.
3.9.2 Financial Liabilities
3.9.2.1 Initial recognition and measurement
Financial liabilities are classified as financialliabilitiesatfairvaluethroughprofitorloss,loansandborrowings,or asderivativesdesignatedashedging instruments in an effective hedge, asappropriate.
Allfinancialliabilitiesarerecognisedinitiallyatfairvalueand,inthecaseofloansandborrowingsandpayables net of directly attributable transactioncosts.
The Group’s financial liabilities include tradeand other payables, bank overdrafts, loans andborrowings.
3.9.2.2 Subsequent measurement
The subsequent measurement of financialliabilities depends on their classification asdescribedbelow:
(a) Financial liabilities at fair value through profit or loss
Financial liabilities at fair value throughprofitorloss include financial liabilities held for tradingand financial liabilities designated upon initialrecognitionasatfairvaluethroughprofitorloss.
Financialliabilitiesareclassifiedasheldfortradingiftheyareincurredforthepurposeofrepurchasingin the near term. This category also includesderivative financial instruments entered into bythe Group that are not designated as hedginginstrumentsinhedgerelationshipsasdefinedbyLKAS 39. Separated embedded derivatives arealsoclassifiedasheldfortradingunlesstheyaredesignatedaseffectivehedginginstruments.
Financial Reports | Notes to the Financial Statements Notes to the Financial Statements | Financial Reports

Kegalle Plantations PLC A n n u a l R e p o r t 2 0 1 6 - 1 7
105
Gainsor losseson liabilitiesheld for tradingarerecognisedinthestatementofprofitorloss.
Financial liabilities designated upon initialrecognitionatfairvaluethroughprofitorlossaredesignatedattheinitialdateofrecognition,andonly if the criteria in LKAS 39 are satisfied. TheGrouphasnotdesignatedanyfinancialliabilityasatfairvaluethroughprofitorloss.
(b) Loans and borrowings
After initial recognition, interest bearing loansand borrowings are subsequently measured atamortized cost using the effective interest ratemethod.Gainsand lossesare recognised in theStatement of Profit or Loss when the liabilitiesarederecognisedaswellasthroughtheeffectiveinterestratemethod(EIR)amortizationprocess.
Amortisedcostiscalculatedbytakingintoaccountany discount or premium on acquisition and fees orcoststhatareanintegralpartoftheEIR.TheEIRamortisationisincludedasfinancecostsinthestatementofprofitorloss.
3.9.2.3 Derecognition
A financial liability is derecognised when theobligation under the liability is discharged orcancelledorexpires.
Whenanexistingfinancial liability isreplacedbyanother from the same lender on substantiallydifferentterms,orthetermsofanexistingliabilityare substantiallymodified, such an exchangeormodification is treated as the derecognition oftheoriginalliabilityandtherecognitionofanewliability.Thedifference in therespectivecarryingamountsisrecognisedintheStatementofProfitor Loss.
3.9.3 Offsetting of financial instruments
Financialassetsandfinancialliabilitiesareoffsetif,andonly if, there isacurrentlyenforceable legalrighttooffsettherecognisedamountsandthereisanintentiontosettleonanetbasis,ortorealizetheassetsandsettletheliabilitiessimultaneously
3.10 Inventories
Finish Goods Manufactured from AgriculturalProduceofBiologicalAssets
These are valued at the lower of cost andestimatednet realisablevalue,aftermakingdue
allowance for obsolete and slowmoving items.Netrealisablevalueistheestimatedsellingpriceatwhichstockscanbesoldintheordinarycourseof business after allowing for cost of realisationand/orcostofconversionfromtheirexistingstatetosaleablecondition.
Input Material, Spares and Consumables
Atactualcostonweightedaveragebasis.
Agricultural Produce Harvested from Biological Assets
Thesearemeasuredattheirfairvaluelesscosttosellatthepointofharvest.Thefinishedandsemi-finishedinventoriesfromagriculturalproductsarevaluedbyaddingthecostofconversiontothefairvalueoftheagriculturalproduce.
3.11 Trade and Other Receivables
Trade and other receivables are stated at theirestimated realisable amounts inclusive ofprovisionsforbadanddoubtfuldebts.
3.12 Cash and Cash Equivalents
CashandCashEquivalentsaredefinedascashinhand, call deposits and short-term highly liquidinvestmentsreadilyconvertibletoknownamountsofcashandsubjecttoinsignificantriskofchangesinvalue.
For the purpose of Cash Flow Statement Cashand Cash Equivalent consists of cash in handand deposits in banks net of outstanding bankoverdrafts.Investmentswithshorttermmaturitiesi.e. three months or less from the date of acquisitionsarealsotreatedasCashEquivalents.
3.13 Provisions
Provisions are recognised when the Group hasa present obligation (legal or constructive) as aresultofapastevent,itisprobablethatanoutflowof resources embodying economic benefitswill be required to settle the obligation and areliable estimate can be made of the amountof the obligation. When the Group expectssomeorallofaprovisiontobereimbursed,thereimbursementisrecognisedasaseparateasset,but only when the reimbursement is virtuallycertain.Theexpense relating toanyprovision ispresentedintheStatementofProfitorLossnetofanyreimbursement.
Notes to the Financial Statements | Financial Reports

Kegalle Plantations PLC A n n u a l R e p o r t 2 0 1 6 - 1 7
106
3.14 Employees’ Benefits
a) Defined Benefit Plan
A defined benefit plan is a post-employmentbenefit plan other than a defined contributionplan. The liability recognised in the FinancialStatements in respect of defined benefit planis the present value of the defined benefitobligation at the Reporting date. The definedbenefitobligationiscalculatedannuallyusingtheprojectedunit creditmethod.Thepresent valueofthedefinedbenefitobligationisdeterminedbydiscountingtheestimatedfuturecashflowsusingthe interest rates that are denominated in the currency inwhich thebenefitswill bepaid, andthathavetermstomaturityapproximatingtothetermsof the related liability.Actuarial gains andlosses arising from experience adjustments andchangesinactuarialassumptionsarerecognisedin other comprehensive income in the periodin which they arise. Actuarial gains & lossesrecognised in other comprehensive income arerecognisedimmediatelyinretainedearningsandarenot reclassified toprofitor loss.Past servicecostsarerecognisedimmediatelyinStatementofProfitorLoss.
The provision has been made for retirementgratuities from the first year of service for allemployees,inconformitywithLKAS19,“EmployeeBenefits”.However,underthePaymentofGratuityActNo.12of1983, the liability toanemployeearisesonlyoncompletionof5yearsofcontinuedservice.
TheLiabilityisnotexternallyfunded.
The key assumptions used in determiningthe retirement benefit obligations include thefollowings:
No Key Assumption 2017 2016
i) RateofDiscount 12.25%(perannum) 11.5%(perannum)
ii) RateofSalaryIncreaseWorkersStaff
16%(everytwoyears)8%(perannum)
16%(everytwoyears)8%(perannum)
iii) RetirementAgeEstateWorkersEstateStaffHeadOfficeStaff
60years58years55years
60years58years55years
iv) TheCompanywillcontinueasagoingconcern. Theactuarialpresentvalueoftheaccruedbenefitsas at 31March2017 isRs. 380,800,362/- (2016–Rs.429,477,999/-).ThisitemisgroupedunderretirementbenefitobligationsintheStatementofFinancialPosition.
b) Defined Contribution Plans – Provident Funds & Employees’ Trust Fund
Adefinedcontributionplanisapost-employmentbenefit plan under which an entity pays fixedcontributions into a separate entity and willhave no legal or constructive obligation to payfurtheramounts.ObligationsforcontributionstoProvidentandTrustFundscoveringallemployeesarerecognisedasanexpenseinprofitandlossinthe periods during which services are renderedbyemployees.
The Group contributes 12% on consolidatedsalary of the employees to Ceylon Planters’Provident Society (CPPS)/Estate Staff ProvidentSociety(ESPS)/Employees’ProvidentFund(EPF).
AlltheemployeesoftheGrouparemembersofthe Employees’ Trust Fund (ETF), to which theCompany contributes 3% on the consolidatedsalary of such employees.
3.15 Deferred Income - Grants and Subsidies
Government grants are recognised where thereis reasonable assurance that the grant will bereceived and all attached conditions will becomplied with. When the grant relates to anexpense item, it is recognised as income overthe period necessary to match the grant on asystematicbasistothecoststhatitisintendedtocompensate.Wherethegrantrelatestoanasset,itisrecognisedasdeferredincomeandreleasedto income in equal amounts over the expecteduseful life of the related asset.
WheretheGroupreceivesnon-monetarygrants,the asset and the grant are recorded gross atnominal amounts and released to the Statement of Profit or Loss over the expected useful lifeandpatternofconsumptionofthebenefitoftheunderlying asset by equal annual instalments.
Financial Reports | Notes to the Financial Statements Notes to the Financial Statements | Financial Reports
Kegalle Plantations PLC A n n u a l R e p o r t 2 0 1 6 - 1 7
107
Where loans or similar assistance are providedby governments or related institutions with aninterestratebelowthecurrentapplicablemarketrate, the effect of this favourable interest isregardedasadditionalgovernmentgrant.
Grants related to Property, Plant & Equipmentother than grants received for forestry areinitially deferred and allocated to income on a systematicbasisovertheusefullifeoftherelatedProperty, Plant & Equipment as follows: Assetsareamortisedovertheirusefullivesorunexpiredleaseperiod,whicheverisless.
Buildings 40years
Grants received for forestryare initiallydeferredand credited to income once when the related blocksoftreesareharvested.
3.16 Trade and Other Payables
Tradeandotherpayablesarestatedattheircosts.
3.17 Capital Commitments and Contingencies
CapitalcommitmentsandcontingentliabilitiesoftheGrouphavebeendisclosedintherespectiveNotestotheFinancialStatements.
3.18 Events Occurring after Reporting Period
All material post events after the Statement ofFinancial Position date have been consideredwhereappropriate;eitheradjustmentshavebeenmade or adequately disclosed in the FinancialStatements.
3.19 Earnings Per Share
TheGrouppresentsbasicearningspershare(EPS)foritsordinaryshares.BasicEPSiscalculatedbydividingtheprofitorlossattributabletoordinaryshareholders of the Group by the weightedaveragenumberofordinary sharesoutstandingduringtheperiod.
3.20 Impairment of Non Financial Assets
The Group assesses, at each reporting date,whetherthereisanindicationthatanassetmaybeimpaired.Ifanyindicationexists,orwhenannualimpairment testing for an asset is required, the
Groupestimatestheasset’srecoverableamount.An asset’s recoverable amount is the higher ofan asset’s or cash-generating unit’s (CGU) fairvalue less costsofdisposal and its value inuse.The recoverable amount is determined for anindividualasset,unlesstheassetdoesnotgeneratecashinflowsthatarelargelyindependentofthosefromotherassetsorgroupsofassets.Whenthecarrying amount of an asset or CGU exceedsits recoverable amount, the asset is consideredimpaired and iswritten down to its recoverableamount.
Inassessingvalueinuse,theestimatedfuturecashflowsarediscountedtotheirpresentvalueusingapre-taxdiscountratethatreflectscurrentmarketassessmentsofthetimevalueofmoneyandtherisksspecifictotheasset.Indeterminingfairvaluelesscostsofdisposal,recentmarkettransactionsare taken into account. If no such transactionscanbeidentified,anappropriatevaluationmodelis used. These calculations are corroboratedby valuation multiples, quoted share prices forpubliclytradedcompaniesorotheravailablefairvalueindicators.
The Group bases its impairment calculation ondetailedbudgetsandforecastcalculations,whichareprepared separately for eachof theGroup’sCGUstowhichtheindividualassetsareallocated.Thesebudgetsandforecastcalculationsgenerallycoveraperiodoffiveyears.Forlongerperiods,along-termgrowth rate is calculatedandappliedtoprojectfuturecashflowsafterthefifthyear.
Impairment losses of continuing operations,including impairment on inventories, arerecognised in the statement of profit or loss inexpensecategoriesconsistentwiththefunctionoftheimpairedasset,exceptforpropertiespreviouslyrevaluedwith the revaluation taken toOCI. Forsuchproperties,theimpairment isrecognisedinOCIuptotheamountofanypreviousrevaluation.
For assets excluding goodwill, an assessmentis made at each reporting date to determinewhether there is an indication that previouslyrecognised impairment losses no longer existor have decreased. If such indication exists, theGroupestimatestheasset’sorCGU’srecoverableamount. A previously recognised impairmentloss is reversedonly if therehasbeenachangein the assumptions used to determine the asset’s recoverableamountsincethelastimpairmentlosswasrecognised.Thereversalislimitedsothatthecarrying amount of the asset does not exceed
Notes to the Financial Statements | Financial Reports

Kegalle Plantations PLC A n n u a l R e p o r t 2 0 1 6 - 1 7
108
itsrecoverableamount,norexceedthecarryingamount that would have been determined, netof depreciation, had no impairment loss beenrecognised for the asset in prior years. Suchreversal is recognised in the statement of profitor loss unless the asset is carried at a revaluedamount,inwhichcase,thereversalistreatedasarevaluationincrease.
Goodwill is tested for impairmentannuallyasat31Marchandwhencircumstances indicate thatthecarryingvaluemaybeimpaired.
Impairment is determined for goodwill byassessing the recoverable amount of each CGU(orgroupofCGUs)towhichthegoodwillrelates.WhentherecoverableamountoftheCGUislessthan its carrying amount, an impairment loss isrecognised.Impairmentlossesrelatingtogoodwillcannotbereversedinfutureperiods.
Intangible assets with indefinite useful lives aretested for impairment annually as at 31 Marchat the CGU level, as appropriate, and whencircumstances indicate that the carrying valuemaybeimpaired.
3.21 Statement of profit or Loss
ForthepurposeofpresentationoftheStatementofProfitorLoss,thefunctionofexpensesmethodis adopted, as it represents fairly the elements of theGroup’sperformance.
3.21.1 Revenue Recognition
Revenue is recognized to the extent that it isprobable that the economic benefits will flowto the Group and the revenue and associatedcosts incurred or to be incurred can be reliablymeasured.Revenueismeasuredatthefairvalueof the consideration received or receivable netoftradediscountsandsalestaxes.Thefollowingspecific criteria are used for the purpose ofrecognitionofrevenue.
(a) Sale of Goods
Revenue from the sale of goods is recognisedwhenthesignificantrisksandrewardsofownershipof the goods have passed to the buyer, usuallyondeliveryofthegoods.Revenueisrecordedatinvoicevaluenetofbrokerage,saleexpensesandotherleviesrelatedtorevenue.
(b) Interest
Interest Income is recognized as the interestaccrues(takingintoaccounttheeffectiveyieldontheasset)unlesscollectabilityisindoubt.
(c) Dividends
Dividend income is recognised in theStatementofProfitorLossonthedatetheentity’srighttoreceivepaymentisestablished,whichinthecaseofquotedsecuritiesistheex-dividenddate.
(d) Rental income
Rentalincomeisrecognizedonanaccrualbasis.
(e) Royalties
Royalties are recognized on an accrual basis inaccordance with the substance of the relevantagreement.
(f) Others
Otherincomeisrecognizedonanaccrualbasis.
NetGainsandlossesofarevenuenatureonthedisposal of property, plant & equipment andother noncurrent assets including investmentshave been accounted for in the Statement ofprofitorloss,havingdeductedfromproceedsondisposal, the carryingamountof theassetsandrelatedsellingexpenses.Ondisposalofrevaluedproperty,plantandequipment,amountremainingin Revaluation Reserve relating to that asset istransferreddirectlytoRetainedProfit/(Loss).
Gainsandlossesarisingfromincidentalactivitiestomain revenuegeneratingactivities and thosearisingfromagroupofsimilartransactionswhichare notmaterial, are aggregated, reported andpresentedonanetbasis.
3.21.2 Expenditure Recognition
Expenses are recognized in the Statement ofProfitorLossonthebasisofadirectassociationbetween the cost incurred and the earning ofspecificitemsofincome.Allexpenditureincurredintherunningofthebusinessandinmaintainingthe property, plant & equipment in a state ofefficiencyhasbeenchargedtoincomeinarrivingattheProfit/(Loss)fortheyear.
Financial Reports | Notes to the Financial Statements Notes to the Financial Statements | Financial Reports

Kegalle Plantations PLC A n n u a l R e p o r t 2 0 1 6 - 1 7
109
a) Financing Income and Expenses
Finance income comprises interest income onfundsinvested,andgainsontranslationofforeigncurrency. Interest income is recognised in theStatementofProfitorLossasitaccrues.
Finance expenses comprise interest payableon loans and borrowings. The interest expensecomponentoffinanceleasepaymentsisallocatedto each period during the lease term so as toproduce a constant periodic rate of interest on theremainingbalanceoftheliability.
b) Taxes
Income tax expense comprises current anddeferredtax.Incometaxexpenseisrecognisedinprofitor loss except to theextent that it relatesto items recogniseddirectly inequity,when it isrecognisedinequity.
Current Income Tax
Current income tax assets and liabilities aremeasuredattheamountexpectedtoberecoveredfromorpaid to the taxationauthorities.The taxratesandtaxlawsusedtocomputetheamountare those that are enacted or substantivelyenacted, at the reporting date in the countrieswheretheGroupoperatesandgeneratestaxableincome.
Current income tax relating to items recogniseddirectly inequityisrecognisedinequityandnotin the statement of profit or loss. Managementperiodically evaluates positions taken in thetax returns with respect to situations in whichapplicable tax regulations are subject tointerpretation and establishes provisions whereappropriate.
Deferred Tax
Deferredtaxisprovidedusingtheliabilitymethodontemporarydifferencesbetweenthetaxbasesofassetsandliabilitiesandtheircarryingamountsforfinancial reportingpurposesat thereportingdate.
Deferred tax liabilities are recognised for alltaxabletemporarydifferences,except:
• When the deferred tax liability arises fromthe initial recognition of goodwill or anassetor liability ina transaction that isnota
businesscombinationand,atthetimeofthetransaction, affects neither the accountingprofitnortaxableprofitorloss
• In respect of taxable temporary differencesassociated with investments in subsidiaries,associatesandinterestsinjointventures,whenthe timing of the reversal of the temporarydifferencescanbecontrolledanditisprobablethatthetemporarydifferenceswillnotreverseintheforeseeablefuture.
Deferred tax assets are recognised for alldeductible temporary differences, the carryforwardofunusedtaxcreditsandanyunusedtaxlosses.Deferredtaxassetsarerecognisedtotheextentthatitisprobablethattaxableprofitwillbeavailableagainstwhichthedeductibletemporarydifferences,andthecarryforwardofunusedtaxcredits and unused tax losses can be utilised,except:
• When the deferred tax asset relating to thedeductible temporary difference arises fromtheinitialrecognitionofanassetorliabilityinatransactionthatisnotabusinesscombinationand, at the time of the transaction, affects neithertheaccountingprofitnortaxableprofitor loss
• Inrespectofdeductibletemporarydifferencesassociated with investments in subsidiaries,associates and interests in joint ventures,deferredtaxassetsarerecognisedonlytotheextent that it isprobable that the temporarydifferences will reverse in the foreseeablefuture and taxable profit will be availableagainstwhich the temporarydifferences canbeutilized.
The carrying amount of deferred tax assets isreviewed at each reporting date and reducedto the extent that it is no longer probable thatsufficient taxableprofitwillbeavailable toallowallorpartofthedeferredtaxassettobeutilised.Unrecogniseddeferredtaxassetsarere-assessedateachreportingdateandarerecognisedtotheextent that it has become probable that futuretaxableprofitswillallowthedeferredtaxassettoberecovered.
Deferredtaxassetsandliabilitiesaremeasuredatthetaxratesthatareexpectedtoapplyintheyearwhentheassetisrealisedortheliabilityissettled,basedontaxrates(andtaxlaws)thathavebeenenactedorsubstantivelyenactedatthereportingdate.
Notes to the Financial Statements | Financial Reports

Kegalle Plantations PLC A n n u a l R e p o r t 2 0 1 6 - 1 7
110
Deferredtaxrelatingtoitemsrecognisedoutsideprofitor loss isrecognisedoutsideprofitor loss.Deferred tax itemsare recognised in correlationto the underlying transaction either in OCI ordirectly in equity.
Deferredtaxassetsanddeferredtaxliabilitiesareoffset if a legally enforceable right exists to setoffcurrenttaxassetsagainstcurrenttaxliabilitiesandthedeferredtaxesrelatetothesametaxableentityandthesametaxationauthority.
Tax benefits acquired as part of a businesscombination, but not satisfying the criteria forseparaterecognitionatthatdate,arerecognisedsubsequently ifnewinformationaboutfactsandcircumstances change. The adjustment is eithertreated as a reduction in goodwill (as long asit does not exceed goodwill) if it was incurredduringthemeasurementperiodorrecognisedinprofitorloss.
3.22 Statement of Cash Flow
The Cash Flow Statement has been preparedusing the ‘indirect method’. Interest paid isclassified as operating cash flows, interest andgovernment grants received are classified asinvesting cash flows while dividends paid andreceivedareclassifiedasfinancingcashflows infinancialactivities, for thepurposeofpresentingtheCashFlowStatement.
3.23 Segment Reporting
Segmental information is provided for thedifferent business segments of the Group.Business segmentation has been determinedbased on the nature of goods provided by theGroupafter considering the risk and rewardsofeach type of product.
Since the individual segments are locatedclose to each other and operate in the same industrialenvironment,theneedforgeographicalsegmentationhasnomaterialimpact.
The activities of the segments are describedonNote6intheNotestotheFinancialStatement.
Revenueandexpensesdirectlyattributabletoeachsegmentareallocatedtotherespectivesegments.Revenue and expenses not directly attributabletoasegmentareallocatedonthebasisof theirresourceutilisation,whereverpossible.
Assetsand liabilitiesdirectlyattributable toeachsegmentareallocatedtotherespectivesegments.Assets and liabilities, which are not directlyattributable to a segment, are allocated on areasonablebasiswhereverpossible.Unallocateditems comprise mainly interest bearing loans,borrowings,andexpenses.
Segment capital expenditure is the total costincurred during the period to acquire segmentassetsthatareexpectedtobeusedformorethanoneaccountingperiod.
3.24 Change in Accounting Policies and Disclosures
Amendment to LKAS 41 & 16 - HarvestableProduceGrowingonBearerBiologicalAssets
Amendments to LKAS 16 - Property, Plant &Equipment and LKAS 41 - Agriculture, requireentitytorecognizeagriculturalproducegrowingon Bearer Plants at fair value less cost to sellseparatelyfromitsbearerplantspriortoharvest.Afterinitialrecognition,changesinthefairvalueof such agricultural produce growing on BearerPlants, recognised inprofitor lossat theendofeachreportingperiod.
Accordingly, the Company has applied theseamendments retrospectively in the FinancialStatements.ForthedetailsreferNote37.
4 USE OF JUDGMENTS, ESTIMATES AND ASSUMPTIONS
The preparation of Financial Statements inconformitywithSLFRS/LKASrequiresmanagementtomake judgments, estimates and assumptionsthatinfluencetheapplicationofaccountingpoliciesand the reported amounts of assets, liabilities,incomeandexpenses. Judgmentsandestimatesare based on historical experience and otherfactors, including expectations that are believedtobereasonableunderthecircumstances.Hence,actual experience and results may differ fromthesejudgmentsandestimates.
Estimates and underlying assumptions arereviewed on an ongoing basis. Revisions toaccountingestimatesarerecognisedintheperiodin which the estimate is revised, if the revisionaffects only that period and any future periods affected.Informationaboutsignificantareasofestimationuncertainty and critical judgments in applyingaccountingpoliciesthathavethemostsignificanteffectontheamountsrecognisedintheFinancial
Financial Reports | Notes to the Financial Statements Notes to the Financial Statements | Financial Reports
Kegalle Plantations PLC A n n u a l R e p o r t 2 0 1 6 - 1 7
111
Statementsisincludedinthefollowingnotes:
• DeferredTaxation• Measurement of the Defined Benefit
Obligations• BiologicalAssets
4.1 Deferred Taxation
Deferredtaxassetsarerecognisedforunusedtaxlossestotheextentthatitisprobablethattaxableprofitwillbeavailableagainstwhichthelossescanbeutilised.Significantmanagementjudgementisrequiredtodeterminetheamountofdeferredtaxassets that can be recognised, based upon thelikelytimingandtheleveloffuturetaxableprofitstogether with future tax planning strategies.Unusedtaxlossesasof31March2017aregiveninNote27.
4.2 Retirement Benefit Obligations
The present value of the retirement benefitobligationsdependsonanumberoffactorsthatare determined on an actuarial basis using anumberofassumptions.KeyassumptionsusedindeterminingtheretirementbenefitobligationsaregiveninaccordingpolicyNote3.14.Anychangesin these assumptions will impact the carryingamountofretirementbenefitobligations.
4.3 Biological Assets
Thefairvalueofmanagedtimbertreesdependsonanumberof factors that aredeterminedonadiscountedmethodusingvariousfinancialandnon financial assumptions. The growth of thetrees isdeterminedbyvariousbiological factorsthat are highly unpredictable. Any change tothe assumptionswill impact to the fair value ofbiologicalassets.Keyassumptionsandsensitivityanalysisof thebiologicalassetsaregiven in theNote16.
5 STANDARDS ISSUED BUT NOT YET EFFECTIVE
Standards issuedbutnotyeteffectiveup to thedate of issuance of the Company’s FinancialStatements are listed below. This listing ofstandards and interpretations issued are those that the Company reasonably expects to havean impact on disclosures, financial position orperformancewhenappliedatafuturedate.TheCompanyintendstoadoptthesestandardswhentheybecomeeffective.
SLFRS 9 Financial Instruments
SLFRS9,asissuedreflectsthefirstphaseofworkon measurement of LKAS 39 and applies toclassificationandmeasurementoffinancialassetsand liabilities. This standard is effective for theannualperiodsbeginningonorafter01January2018.
SLFRS 15 Revenue from Contracts with Customers
SLFRS15establishesacomprehensiveframeworkfor determining whether, how much and whenrevenueisrecognized.Itreplacesexistingrevenuerecognitionguidance,includingLKAS18Revenue,LKAS 11 Construction Contracts and IFRIC 13Customer Loyalty Programs. This standard iseffectivefortheannualperiodsbeginningonorafter01January2018.
SLFRS 16 - Leases
SLFRS16setsouttheprinciplesfortherecognition,measurement, presentation and disclosure of leases and requires lessees to account for all leases under a single on balance sheet modelsimilartotheaccountingforfinanceleases,underLKAS17exceptforfewexemptionsforleasesfor“low value” assets and short term leaseswith aleasetermof12monthsorless.Thisstandardiseffectivefortheannualperiodsbeginningonorafter01January2019.
Notes to the Financial Statements | Financial Reports
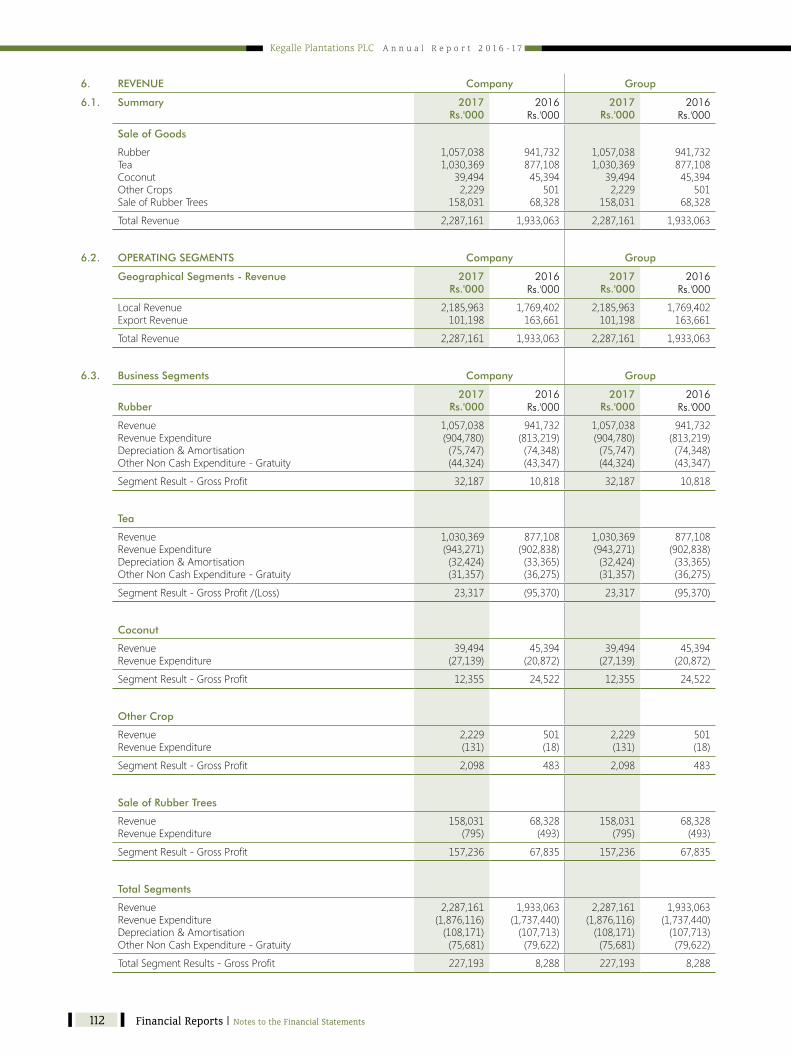
Kegalle Plantations PLC A n n u a l R e p o r t 2 0 1 6 - 1 7
112
6. REVENUE Company Group
6.1. Summary 2017Rs.'000
2016 Rs.'000
2017 Rs.'000
2016Rs.'000
Sale of Goods
RubberTeaCoconutOtherCropsSaleofRubberTrees
1,057,0381,030,36939,4942,229
158,031
941,732877,10845,394501
68,328
1,057,0381,030,36939,4942,229
158,031
941,732877,10845,394501
68,328
TotalRevenue 2,287,161 1,933,063 2,287,161 1,933,063
6.2. OPERATING SEGMENTS Company Group
Geographical Segments - Revenue 2017Rs.'000
2016 Rs.'000
2017 Rs.'000
2016Rs.'000
LocalRevenueExportRevenue
2,185,963101,198
1,769,402163,661
2,185,963101,198
1,769,402163,661
TotalRevenue 2,287,161 1,933,063 2,287,161 1,933,063
6.3. Business Segments Company Group
Rubber2017
Rs.'000 2016
Rs.'000 2017
Rs.'000 2016
Rs.'000
RevenueRevenueExpenditureDepreciation&AmortisationOtherNonCashExpenditure-Gratuity
1,057,038(904,780)(75,747)(44,324)
941,732(813,219)(74,348)(43,347)
1,057,038(904,780)(75,747)(44,324)
941,732(813,219)(74,348)(43,347)
SegmentResult-GrossProfit 32,187 10,818 32,187 10,818
Tea
RevenueRevenueExpenditureDepreciation&AmortisationOtherNonCashExpenditure-Gratuity
1,030,369(943,271)(32,424)(31,357)
877,108(902,838)(33,365)(36,275)
1,030,369(943,271)(32,424)(31,357)
877,108(902,838)(33,365)(36,275)
SegmentResult-GrossProfit/(Loss) 23,317 (95,370) 23,317 (95,370)
Coconut
RevenueRevenueExpenditure
39,494(27,139)
45,394(20,872)
39,494(27,139)
45,394(20,872)
SegmentResult-GrossProfit 12,355 24,522 12,355 24,522
Other Crop
RevenueRevenueExpenditure
2,229(131)
501(18)
2,229(131)
501(18)
SegmentResult-GrossProfit 2,098 483 2,098 483
Sale of Rubber Trees
RevenueRevenueExpenditure
158,031(795)
68,328(493)
158,031(795)
68,328(493)
SegmentResult-GrossProfit 157,236 67,835 157,236 67,835
Total Segments
RevenueRevenueExpenditureDepreciation&AmortisationOtherNonCashExpenditure-Gratuity
2,287,161(1,876,116)(108,171)(75,681)
1,933,063(1,737,440)(107,713)(79,622)
2,287,161(1,876,116)(108,171)(75,681)
1,933,063(1,737,440)(107,713)(79,622)
TotalSegmentResults-GrossProfit 227,193 8,288 227,193 8,288
Financial Reports | Notes to the Financial Statements Notes to the Financial Statements | Financial Reports

Kegalle Plantations PLC A n n u a l R e p o r t 2 0 1 6 - 1 7
113
Company Group
2017Rs.'000
2016 Rs.'000
2017 Rs.'000
2016Rs.'000
Total Segment Results - Gross Profit 227,193 8,288 227,193 8,288
Gains/(Loss)onfairvalueofbiologicalassetsOtherIncome&GainAdministrativeExpensesManagementFeeFinanceIncomeFinanceCostShareofResultofAssociates
5,914116,407(46,710)(44,660)199,131(258,101)
-
5,617114,607(43,166)(6,543)183,284(198,223)
-
5,91437,238(52,703)(44,660)199,131(258,101)228,756
5,61735,651(50,761)(6,543)183,284(198,223)140,827
ProfitBeforeTax 199,174 63,862 342,768 118,139
6.4. Business Segments - Assets Company Group
2017Rs.'000
2016 Rs.'000
2017 Rs.'000
2016Rs.'000
Non Current Assets
RubberTeaOtherCropsUnallocated
1,668,334745,617145,553
1,755,554
1,596,398713,258145,959
1,734,176
1,668,334745,617145,553
2,134,853
1,596,398713,258145,959
2,003,263
TotalNonCurrentAssets 4,315,058 4,189,791 4,694,357 4,458,878
Current Assets
RubberTeaOtherCropsUnallocated
280,003193,13521,173
1,595,013
773,407740,68330,902623,571
280,003193,13521,173
1,566,687
773,407740,68330,902594,121
TotalCurrentAssets 2,089,324 2,168,563 2,060,998 2,139,113
6.5. Business Segments - Liabilities Company Group
2017Rs.'000
2016 Rs.'000
2017 Rs.'000
2016Rs.'000
Non Current Liabilities
RubberTeaOtherCropsUnallocated
198,960261,15451,082
1,392,221
1,045,416518,94552,038829,136
198,960261,15451,082
1,392,318
1,045,416518,94552,038830,456
TotalNonCurrentLiabilities 1,903,417 2,445,535 1,903,514 2,446,855
Current Liabilities RubberTeaOtherCropsUnallocated
112,048111,41321,842
1,633,963
667,737337,27233,096438,406
112,048111,41321,842
1,647,104
667,737337,27233,096451,369
TotalCurrentLiabilities 1,879,266 1,476,511 1,892,407 1,489,474
6.6. Segment Capital Expenditure Company Group
2017Rs.'000
2016 Rs.'000
2017 Rs.'000
2016Rs.'000
RubberTeaOtherCropsUnallocated
140,75724,3361,0049,828
175,99132,3151,34610,996
140,75724,3361,0049,828
175,99132,3151,34610,996
TotalCapitalExpenditure 175,925 220,648 175,925 220,648
Notes to the Financial Statements | Financial Reports

Kegalle Plantations PLC A n n u a l R e p o r t 2 0 1 6 - 1 7
114
7. OTHER INCOME AND GAIN Company Group
2017Rs.'000
2016 Rs.'000
2017 Rs.'000
2016Rs.'000
SaleofProperty,Plant&Equipment 1,959 2,439 1,959 2,439
AmortisationofCapitalGrants 13,257 15,636 14,483 19,988
DividendIncome 82,215 45,765 - -
DeemedDisposalGain - 32,280 - 5,818
DeemedDisposalLoss - - - (12,761)
SundryIncome 18,976 18,487 20,796 20,167
TotalOtherIncome&Gain 116,408 114,607 37,238 35,651
Therearenounfulfilledconditionsorcontingenciesattachedtothegrants.
8. PROFIT BEFORE TAXATION IS STATED
AFTER CHARGING FOLLOWINGS Company Group
2017Rs.'000
2016 Rs.'000
2017 Rs.'000
2016Rs.'000
Auditors'Remuneration 2,818 2,610 2,890 2,679
Depreciation&Amortization 112,273 109,549 112,273 109,549
Directors'Remuneration 800 800 800 800
DefinedBenefitPlanCost 75,681 79,623 75,681 79,623
DefinedContributionPlans-EPF&ETF 117,108 120,780 117,108 120,780
Others-StaffCost 941,573 957,107 941,573 957,107
9. FINANCE INCOME Company Group
2017Rs.'000
2016 Rs.'000
2017 Rs.'000
2016Rs.'000
InterestIncome 199,131 183,284 199,131 183,284
TotalInterestIncome 199,131 183,284 199,131 183,284
10. FINANCE COST Company Group
2017Rs.'000
2016 Rs.'000
2017 Rs.'000
2016Rs.'000
OverdraftInterest 79,913 19,074 79,913 19,074
InterestonGovernmentLease 10,740 10,932 10,740 10,932
VariableLeaseRental 41,198 40,028 41,198 40,028
TermLoanInterest 157,039 155,603 157,039 155,603
288,890 225,637 288,890 225,637
Less:InterestCapitalised (30,789) (27,414) (30,789) (27,414)
TotalFinanceCost 258,101 198,223 258,101 198,223
Financial Reports | Notes to the Financial Statements Notes to the Financial Statements | Financial Reports

Kegalle Plantations PLC A n n u a l R e p o r t 2 0 1 6 - 1 7
115
11. SHARE OF RESULT OF ASSOCIATES
TheGroupcaninfluenceupto35.11%ofthevotingrightsoftheRichardPierisNaturalFoamsLtdandupto40.29%ofthevotingrightsoftheArpicoInsurancePLC. TheGroup’sshareoftheincomeoftheentitiesfortheyearsending31March2017and2016,whichareaccountedundertheequitymethod are as follows.
Group
11.1. Statement of Profit or Loss 2017Rs.’000
2016Rs.’000
Richard Pieris Natural Foams Ltd
Group'sShareofProfit/(Loss)BeforeTax 184,734 128,608
Taxonassociateresults (21,610) (15,507)
GroupShareofProfit/(Loss)AfterTax 163,124 113,101
Arpico Insurance PLC
Group'sShareofProfit/(Loss)BeforeTax 44,022 12,219
Taxonassociateresults - -
GroupShareofProfit/(Loss)AfterTax 44,022 12,219
ThereisnoincometaxexpensesrecognisedaslifeinsurancedoesnothaveanincometaxexpensesofarasArpicoInsurancePLCisconcerned.
Group
Total Group Share of Result 2017Rs.’000
2016Rs.’000
Group'sShareofProfit/(Loss)BeforeTax 228,756 140,827
Taxonassociateresults (21,610) (15,507)
GroupShareofProfit/(Loss)AfterTax 207,146 125,321
Group
11.2. Statement of Other Comprehensive Income (OCI) 2017Rs.’000
2016Rs.’000
Richard Pieris Natural Foams Ltd
Gain/(Loss)onActurialValuation (332) 33
IncomeTaxEffect 40 (6)
GroupShareofOtherComprehensiveIncome/(Loss) (292) 27
Arpico Insurance PLC
Gain(/Loss)onActurialValuation (174) 92
IncomeTaxEffect - -
GroupShareofOtherComprehensiveIncome/(Loss) (174) 92
Total Group Share of Result
Gain/(Loss)onActurialValuation (506) 125
IncomeTaxEffect 40 (6)
GroupShareofOtherComprehensiveIncome/(Loss) (466) 119
Notes to the Financial Statements | Financial Reports
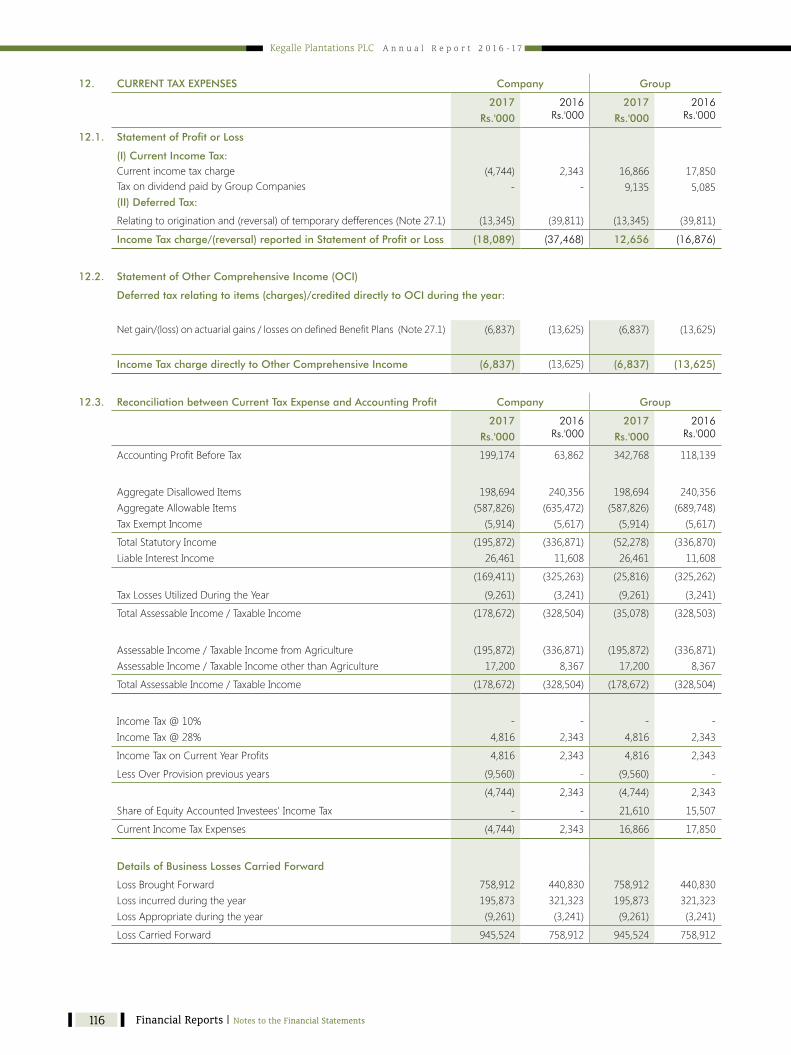
Kegalle Plantations PLC A n n u a l R e p o r t 2 0 1 6 - 1 7
116
12. CURRENT TAX EXPENSES Company Group
2017
Rs.'000
2016 Rs.'000
2017
Rs.'000
2016Rs.'000
12.1. Statement of Profit or Loss
(I) Current Income Tax:CurrentincometaxchargeTaxondividendpaidbyGroupCompanies(II) Deferred Tax:
(4,744)-
2,343-
16,8669,135
17,8505,085
Relatingtooriginationand(reversal)oftemporarydefferences(Note27.1) (13,345) (39,811) (13,345) (39,811)
Income Tax charge/(reversal) reported in Statement of Profit or Loss (18,089) (37,468) 12,656 (16,876)
12.2. Statement of Other Comprehensive Income (OCI)
Deferred tax relating to items (charges)/credited directly to OCI during the year:
Netgain/(loss)onactuarialgains/lossesondefinedBenefitPlans(Note27.1) (6,837) (13,625) (6,837) (13,625)
Income Tax charge directly to Other Comprehensive Income (6,837) (13,625) (6,837) (13,625)
12.3. Reconciliation between Current Tax Expense and Accounting Profit Company Group
2017
Rs.'000
2016 Rs.'000
2017
Rs.'000
2016Rs.'000
AccountingProfitBeforeTax 199,174 63,862 342,768 118,139
AggregateDisallowedItemsAggregateAllowableItemsTaxExemptIncome
198,694(587,826)(5,914)
240,356(635,472)(5,617)
198,694(587,826)(5,914)
240,356(689,748)(5,617)
TotalStatutoryIncomeLiableInterestIncome
(195,872)26,461
(336,871)11,608
(52,278)26,461
(336,870)11,608
(169,411) (325,263) (25,816) (325,262)
TaxLossesUtilizedDuringtheYear (9,261) (3,241) (9,261) (3,241)
TotalAssessableIncome/TaxableIncome (178,672) (328,504) (35,078) (328,503)
AssessableIncome/TaxableIncomefromAgricultureAssessableIncome/TaxableIncomeotherthanAgriculture
(195,872)17,200
(336,871)8,367
(195,872)17,200
(336,871)8,367
TotalAssessableIncome/TaxableIncome (178,672) (328,504) (178,672) (328,504)
IncomeTax@10%IncomeTax@28%
-4,816
-2,343
-4,816
-2,343
IncomeTaxonCurrentYearProfits 4,816 2,343 4,816 2,343
LessOverProvisionpreviousyears (9,560) - (9,560) -
(4,744) 2,343 (4,744) 2,343
ShareofEquityAccountedInvestees'IncomeTax - - 21,610 15,507
CurrentIncomeTaxExpenses (4,744) 2,343 16,866 17,850
Details of Business Losses Carried Forward
LossBroughtForwardLossincurredduringtheyearLossAppropriateduringtheyear
758,912195,873(9,261)
440,830321,323(3,241)
758,912195,873(9,261)
440,830321,323(3,241)
LossCarriedForward 945,524 758,912 945,524 758,912
Financial Reports | Notes to the Financial Statements Notes to the Financial Statements | Financial Reports

Kegalle Plantations PLC A n n u a l R e p o r t 2 0 1 6 - 1 7
117
13. EARNINGS PER SHARE
13.1. ThecalculationofthebasicearningspershareisbasedonaftertaxprofitfortheyeardividedbytheweightedaveragenumberofOrdinarySharesoutstandingduringtheperiod.
13.2. Thefollowingreflectstheincomeandsharedatausedinthebasicearningspersharecomputations.
Company Group
2017Rs.'000
2016 Rs.'000
2017 Rs.'000
2016Rs.'000
Amounts used as the Numerator :
Net profit/ (loss) applicable to Ordinary Shareholders for basicearningspershare 217,263 101,330 330,112 135,014
217,263 101,330 330,112 135,014
Amounts used as the Denominator : Nos’000 Nos’000 Nos’000 Nos’000
WeightedaveragenumberofOrdinarySharesinissueapplicabletobasicearningspershare
25,000
25,000
25,000
25,000
25,000 25,000 25,000 25,000
Earnings Per Share (EPS) 8.69 4.06 13.20 5.41
14. LEASEHOLD PROPERTY, PLANT & EQUIPMENT
Company Group
Asat31March Notes 2017Rs.'000
2016 Rs.'000
2017 Rs.'000
2016Rs.'000
Right-to-useoflandImmovableleasedbearerbiologicalassetsImmovable Leased assets (other than right-to-use landandbearerbiologicalassets)
14.114.214.3
138,58769,158580
143,49578,0022,657
138,58769,157580
143,49578,0022,657
208,326 224,154 208,326 224,154
14.1. RIGHT-TO-USE OF LAND (REVALUED)
“Right-To-UseofLandonLease”asabovewaspreviouslytitled“LeaseholdRighttoBareLand”.ThechangeisinordertocomplywithStatementofRecommendedPractice(SoRP)issuedbytheInstituteofCharteredAccountantsofSriLankadated21August2013.Suchleaseshavebeenexecutedforallestatesforaperiodof53years.
Thisright-to-uselandisamortizedovertheremainingleasetermorusefullifeoftherightwhicheverisshorterandisdisclosedundernon-currentassets.TheStatementofRecommendedPractice(SoRP)forright-to-useof landdoesnotpermitfurtherrevaluationofright-to-useland.ThevaluestakenintotheStatementofFinancialPositionasat22June1992andamortizationoftherighttouseoflandupto31March2017areasfollows.
Company Group
2017Rs.'000
2016 Rs.'000
2017 Rs.'000
2016Rs.'000
CapitalisedValueAsat22.06.1992 260,142 260,142 260,142 260,142
Accumulated Amortization
AtthebeginningoftheYearAmortizationchargefortheyear
116,6474,908
111,7394,908
116,6474,908
111,7394,908
Asat31March 121,555 116,647 121,555 116,647
Carrying Amount 138,587 143,495 138,587 143,495
Notes to the Financial Statements | Financial Reports
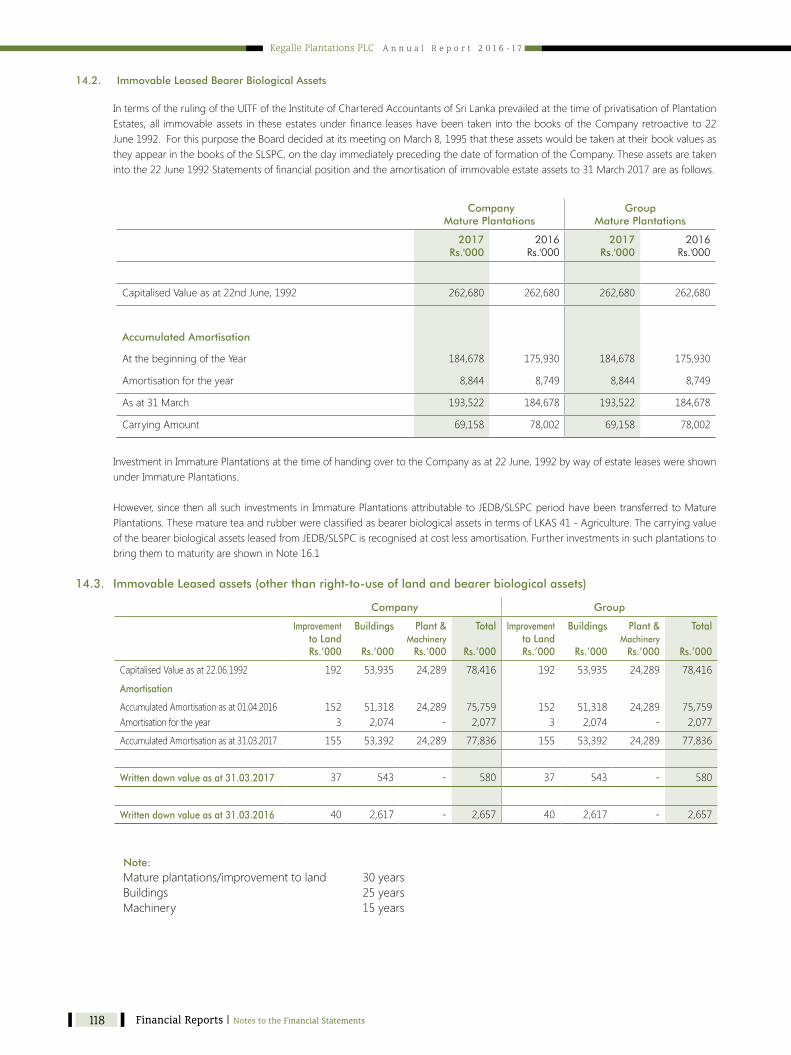
Kegalle Plantations PLC A n n u a l R e p o r t 2 0 1 6 - 1 7
118
14.2. Immovable Leased Bearer Biological Assets IntermsoftherulingoftheUITFoftheInstituteofCharteredAccountantsofSriLankaprevailedatthetimeofprivatisationofPlantationEstates,all immovableassets intheseestatesunderfinanceleaseshavebeentakenintothebooksoftheCompanyretroactiveto22June1992.ForthispurposetheBoarddecidedatitsmeetingonMarch8,1995thattheseassetswouldbetakenattheirbookvaluesastheyappearinthebooksoftheSLSPC,onthedayimmediatelyprecedingthedateofformationoftheCompany.Theseassetsaretakenintothe22June1992Statementsoffinancialpositionandtheamortisationofimmovableestateassetsto31March2017areasfollows.
InvestmentinImmaturePlantationsatthetimeofhandingovertotheCompanyasat22June,1992bywayofestateleaseswereshownunderImmaturePlantations. However,sincethenallsuchinvestments inImmaturePlantationsattributabletoJEDB/SLSPCperiodhavebeentransferredtoMaturePlantations.ThesematureteaandrubberwereclassifiedasbearerbiologicalassetsintermsofLKAS41-Agriculture.ThecarryingvalueofthebearerbiologicalassetsleasedfromJEDB/SLSPCisrecognisedatcostlessamortisation.FurtherinvestmentsinsuchplantationstobringthemtomaturityareshowninNote16.1
14.3. Immovable Leased assets (other than right-to-use of land and bearer biological assets)
Note: Matureplantations/improvementtoland 30years Buildings 25years Machinery 15years
CompanyMature Plantations
GroupMature Plantations
2017Rs.'000
2016Rs.'000
2017Rs.'000
2016Rs.'000
CapitalisedValueasat22ndJune,1992 262,680 262,680 262,680 262,680
Accumulated Amortisation
AtthebeginningoftheYear 184,678 175,930 184,678 175,930
Amortisationfortheyear 8,844 8,749 8,844 8,749
Asat31March 193,522 184,678 193,522 184,678
CarryingAmount 69,158 78,002 69,158 78,002
Company Group
Improvement to LandRs.’000
Buildings
Rs.’000
Plant &Machinery
Rs.’000
Total
Rs.’000
Improvement to LandRs.’000
Buildings
Rs.’000
Plant &Machinery
Rs.’000
Total
Rs.’000
CapitalisedValueasat22.06.1992 192 53,935 24,289 78,416 192 53,935 24,289 78,416
Amortisation
AccumulatedAmortisationasat01.04.2016Amortisationfortheyear
1523
51,3182,074
24,289-
75,7592,077
1523
51,3182,074
24,289-
75,7592,077
AccumulatedAmortisationasat31.03.2017 155 53,392 24,289 77,836 155 53,392 24,289 77,836
Written down value as at 31.03.2017 37 543 - 580 37 543 - 580
Written down value as at 31.03.2016 40 2,617 - 2,657 40 2,617 - 2,657
Financial Reports | Notes to the Financial Statements Notes to the Financial Statements | Financial Reports

Kegalle Plantations PLC A n n u a l R e p o r t 2 0 1 6 - 1 7
119
Company Group
Balanceas at
01.04.2016
Rs.'000
Additions for the year
Rs.'000
Disposals during the
year
Rs.'000
Balance as at
31.03.2017
Rs.'000
Balance as at
01.04.2016
Rs.'000
Additions for the year
Rs.'000
Disposals during the
year
Rs.'000
Balance as at
31.03.2017
Rs.'000
Cost/Valuation
BuildingsMotorVehiclesFurniture&FittingsEquipmentWaterSanitationComputers&ComputerSoftwarePlant&MachineryOtherAssetsonGrants
71,255127,6255,55658,8182,15015,833337,126214,593
445--
166-
4712,02660
-(4,825)
------
71,700122,8005,55658,9842,15016,304339,152214,653
111,805127,6255,63359,4912,15016,211406,157214,593
445--
166-
4712,02660
-(4,825)
------
112,250122,8005,63359,6572,15016,682408,183214,653
832,956 3,168 (4,825) 831,299 943,665 3,168 (4,825) 942,008
Balanceas at
01.04.2016
Rs.'000
Chargefor theYear
Rs.'000
Accumlated deprecitionon disposal
Rs.'000
Balanceas at
31.03.2017
Rs.'000
Balanceas at
01.04.2016
Rs.'000
Chargefor theYear
Rs.'000
Disposal/Impairment Loss during
the year Rs.'000
Balanceas at
31.03.2017
Rs.'000
Depreciation
BuildingsMotorVehiclesFurniture&FittingsEquipmentWaterSanitationComputers&ComputerSoftwarePlant&MachineryOtherAssetsonGrants
16,524104,1103,71653,7191,75814,449233,55282,658
4,6039,828183
1,03430370
19,0737,791
-(4,825)
------
21,127109,1143,89954,7531,78814,819252,62590,449
37,520104,1103,76854,0121,75814,957279,75982,658
4,6039,828183
1,03430370
19,0737,791
2,346(4,825)
----
2,772-
44,469109,1143,95155,0461,78815,327301,60490,449
510,486 42,912 (4,825) 548,574 578,542 42,912 293 621,748
Written Down Value 322,470 282,725 365,123 320,260
Assets acquired on Finance Leases
Cost
Plant&Machinery 8,417 - - 8,417 8,417 - - 8,417
8,417 - - 8,417 8,417 - - 8,417
Depreciation
Plant&Machinery 8,222 195 - 8,417 8,222 195 - 8,417
8,222 195 - 8,417 8,222 195 - 8,417
Written Down Value 195 - 195 -
Capital Work-in-Progress
Balanceas at
01.04.2016
Rs.'000
Additions for the year
Rs.'000
Capitalised/Transfer
during theyear
Rs.'000
Balance as at
31.03.2017
Rs.'000
Balance as at
01.04.2016
Rs.'000
Additions for the year
Rs.'000
Capitalised/Transfer
during theyear
Rs.'000
Balance as at
31.03.2017
Rs.'000
CapitalWork-in-Progress 1,313 - 1,313 1,313 - - 1,313
Total Written Down Value 323,978 284,038 366,631 321,573
TheassetsshownabovearethosemovableassetsvestedintheCompanybyGazetteNotificationatthedateofformationofheCompany(22June1992)andallinvestmentsintangibleassetsbytheCompanysinceitsformation.TheassetstakenoverbywayofestateleasesaresetoutinNotes14.
Further,thevaluationofimmovableJEDBestateassetsonfinancelease(otherthanleaseholdland)andtangibleassetsotherthanimmature/matureplantationstakenoverasatJune22,1992isbasedonnetbookvalueasatsuchdate.ThesevalueswerenotavailabletoCompanybyindividualasset.
NoborrowingcostshavebeencapitalisedintoCapitalWork-in-Progress.
15. FREEHOLD PROPERTY, PLANT AND EQUIPMENT
Notes to the Financial Statements | Financial Reports
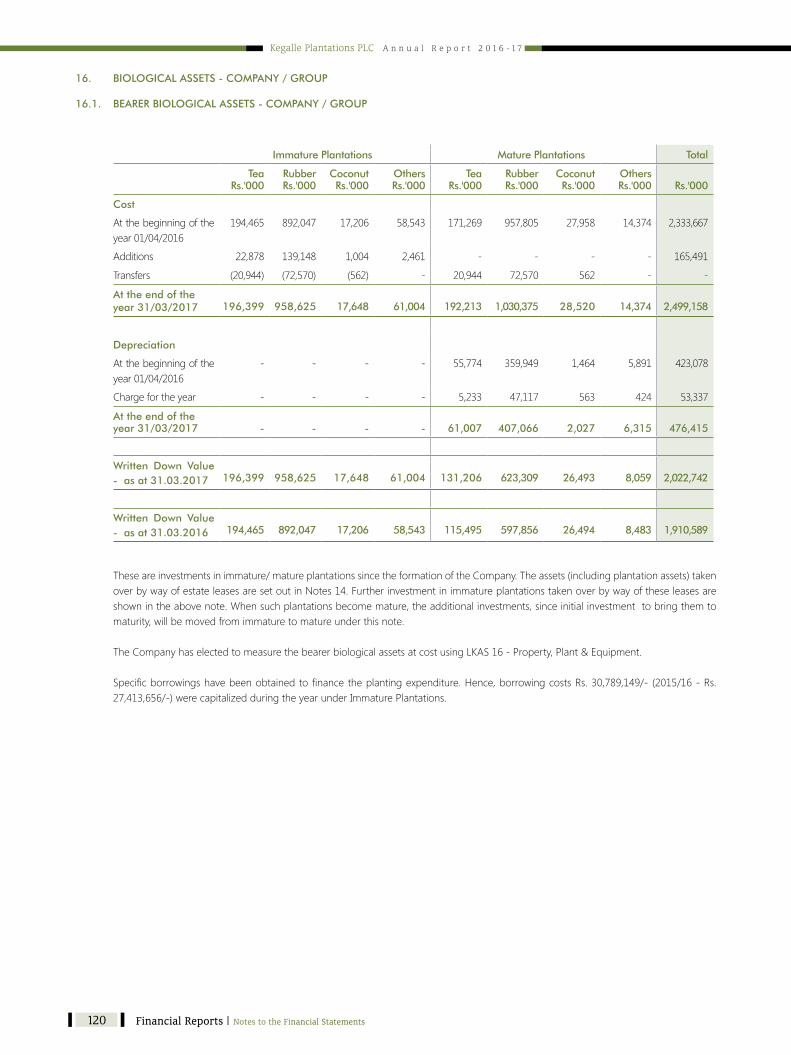
Kegalle Plantations PLC A n n u a l R e p o r t 2 0 1 6 - 1 7
120
Immature Plantations Mature Plantations Total
TeaRs.'000
RubberRs.'000
CoconutRs.'000
OthersRs.'000
TeaRs.'000
RubberRs.'000
CoconutRs.'000
OthersRs.'000 Rs.'000
Cost
Atthebeginningoftheyear01/04/2016
194,465 892,047 17,206 58,543 171,269 957,805 27,958 14,374 2,333,667
Additions 22,878 139,148 1,004 2,461 - - - - 165,491
Transfers (20,944) (72,570) (562) - 20,944 72,570 562 - -
At the end of the year 31/03/2017
196,399
958,625
17,648
61,004
192,213
1,030,375 28,520
14,374 2,499,158
Depreciation
Atthebeginningoftheyear01/04/2016
- - - - 55,774 359,949 1,464 5,891 423,078
Chargefortheyear - - - - 5,233 47,117 563 424 53,337
At the end of the year 31/03/2017 - - - - 61,007 407,066 2,027 6,315 476,415
Written Down Value - as at 31.03.2017 196,399 958,625 17,648 61,004 131,206 623,309 26,493 8,059 2,022,742
Written Down Value - as at 31.03.2016 194,465 892,047 17,206 58,543 115,495 597,856 26,494 8,483 1,910,589
16. BIOLOGICAL ASSETS - COMPANY / GROUP 16.1. BEARER BIOLOGICAL ASSETS - COMPANY / GROUP
Theseareinvestmentsinimmature/matureplantationssincetheformationoftheCompany.Theassets(includingplantationassets)takenoverbywayofestateleasesaresetoutinNotes14.Furtherinvestmentinimmatureplantationstakenoverbywayoftheseleasesareshownintheabovenote.Whensuchplantationsbecomemature,theadditionalinvestments,sinceinitialinvestmenttobringthemtomaturity,willbemovedfromimmaturetomatureunderthisnote.
TheCompanyhaselectedtomeasurethebearerbiologicalassetsatcostusingLKAS16-Property,Plant&Equipment. Specificborrowingshavebeenobtainedtofinancetheplantingexpenditure.Hence,borrowingcostsRs.30,789,149/- (2015/16-Rs.27,413,656/-)werecapitalizedduringtheyearunderImmaturePlantations.
Financial Reports | Notes to the Financial Statements Notes to the Financial Statements | Financial Reports
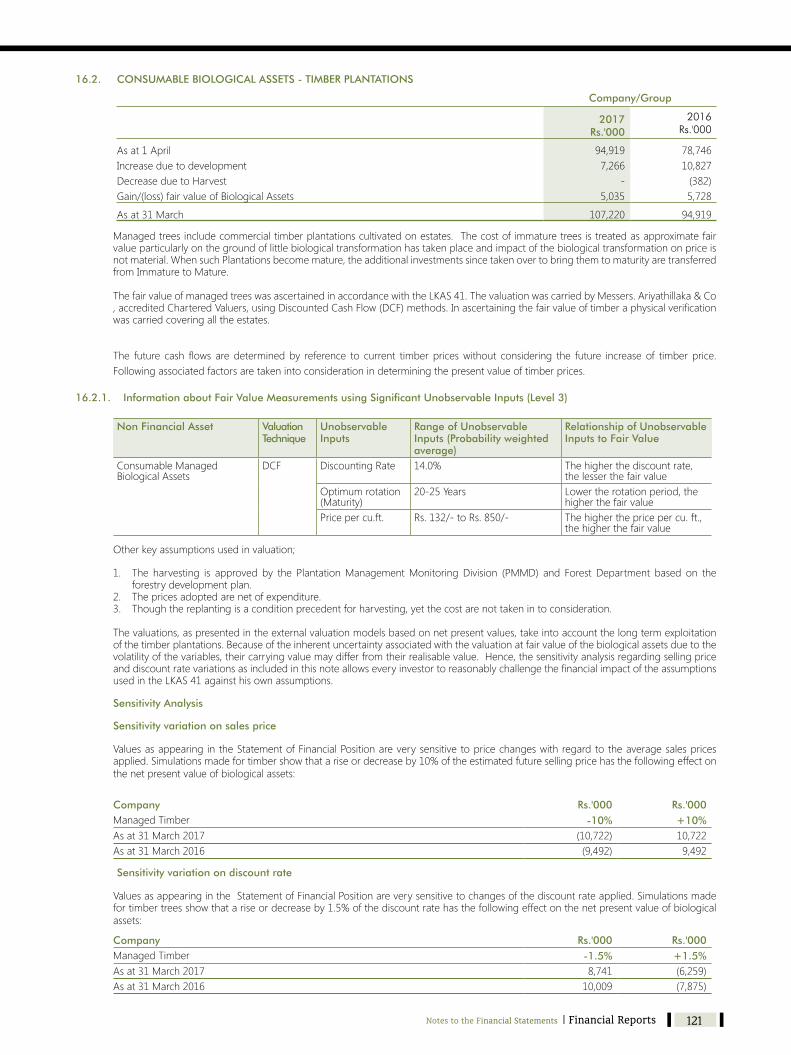
Kegalle Plantations PLC A n n u a l R e p o r t 2 0 1 6 - 1 7
121
16.2. CONSUMABLE BIOLOGICAL ASSETS - TIMBER PLANTATIONS
Company/Group
2017Rs.'000
2016Rs.'000
Asat1AprilIncreaseduetodevelopmentDecreaseduetoHarvestGain/(loss)fairvalueofBiologicalAssets
94,9197,266
-5,035
78,74610,827(382)5,728
Asat31March 107,220 94,919
Managedtreesincludecommercialtimberplantationscultivatedonestates.Thecostofimmaturetreesistreatedasapproximatefairvalueparticularlyonthegroundoflittlebiologicaltransformationhastakenplaceandimpactofthebiologicaltransformationonpriceisnotmaterial.WhensuchPlantationsbecomemature,theadditionalinvestmentssincetakenovertobringthemtomaturityaretransferredfromImmaturetoMature. ThefairvalueofmanagedtreeswasascertainedinaccordancewiththeLKAS41.ThevaluationwascarriedbyMessers.Ariyathillaka&Co,accreditedCharteredValuers,usingDiscountedCashFlow(DCF)methods.Inascertainingthefairvalueoftimberaphysicalverificationwascarriedcoveringalltheestates. The future cash flows aredeterminedby reference to current timberpriceswithout considering the future increaseof timberprice.Followingassociatedfactorsaretakenintoconsiderationindeterminingthepresentvalueoftimberprices.
16.2.1. Information about Fair Value Measurements using Significant Unobservable Inputs (Level 3)
Non Financial Asset Valuation Technique
Unobservable Inputs
Range of Unobservable Inputs (Probability weighted average)
Relationship of Unobservable Inputs to Fair Value
ConsumableManagedBiologicalAssets
DCF DiscountingRate 14.0% Thehigherthediscountrate,thelesserthefairvalue
Optimumrotation(Maturity)
20-25Years Lower the rotation period, the higherthefairvalue
Price per cu.ft. Rs.132/-toRs.850/- Thehigherthepricepercu.ft.,thehigherthefairvalue
Otherkeyassumptionsusedinvaluation;
1. The harvesting is approved by the PlantationManagementMonitoringDivision (PMMD) and Forest Department based on theforestrydevelopmentplan.
2. Thepricesadoptedarenetofexpenditure. 3. Thoughthereplantingisaconditionprecedentforharvesting,yetthecostarenottakenintoconsideration.
Thevaluations,aspresentedintheexternalvaluationmodelsbasedonnetpresentvalues,takeintoaccountthelongtermexploitationofthetimberplantations.Becauseoftheinherentuncertaintyassociatedwiththevaluationatfairvalueofthebiologicalassetsduetothevolatilityofthevariables,theircarryingvaluemaydifferfromtheirrealisablevalue.Hence,thesensitivityanalysisregardingsellingpriceanddiscountratevariationsasincludedinthisnoteallowseveryinvestortoreasonablychallengethefinancialimpactoftheassumptionsusedintheLKAS41againsthisownassumptions.
Sensitivity Analysis
Sensitivity variation on sales price
Valuesasappearing intheStatementofFinancialPositionareverysensitivetopricechangeswithregardtotheaveragesalespricesapplied.Simulationsmadefortimbershowthatariseordecreaseby10%oftheestimatedfuturesellingpricehasthefollowingeffectonthenetpresentvalueofbiologicalassets:
Company Rs.'000 Rs.'000ManagedTimber -10% +10%Asat31March2017 (10,722) 10,722Asat31March2016 (9,492) 9,492
Sensitivity variation on discount rate
ValuesasappearingintheStatementofFinancialPositionareverysensitivetochangesofthediscountrateapplied.Simulationsmadefortimbertreesshowthatariseordecreaseby1.5%ofthediscountratehasthefollowingeffectonthenetpresentvalueofbiologicalassets: Company Rs.'000 Rs.'000ManagedTimber -1.5% +1.5%Asat31March2017 8,741 (6,259)Asat31March2016 10,009 (7,875)
Notes to the Financial Statements | Financial Reports

Kegalle Plantations PLC A n n u a l R e p o r t 2 0 1 6 - 1 7
122
16.3. PRODUCE ON BEARER BIOLOGICAL ASSETS
Company Group
2017Rs.'000
2016Rs.'000
2017Rs.'000
2016Rs.'000
Asat1stApril-aspreviouslyreported 3,312 - 3,312 -
ImpactoftheAmendmentSofLKAS16&LKAS41 - 3,423 - 3,423
Changeinfairvaluelesscosttosell 879 (111) 879 (111)
Attheendoftheyear 4,191 3,311 4,191 3,312
16.4. GAIN/(LOSS) ON FAIR VALUE OF BIOLOGICAL ASSETS
Company Group
2017Rs.'000
2016Rs.'000
2017Rs.'000
2016Rs.'000
Consumable Biological Assets Gain/(loss) arising fromchangeinfairvaluelesscosttosell(Note16.2)
5,035 5,728 5,035 5,728
Produce on Bearer Biological Assets Gain/(loss) arisingfromchangeinfairvaluelesscosttosell(Note16.3)
879 (111) 879 (111)
TotalchangeinfairvalueofBiologcalAssets 5,914 5,617 5,914 5,617
17. FINANCIAL ASSETS/LONG TERM INVESTMENTS
Company Group
2017Rs.'000
2016Rs.'000
2017Rs.'000
2016Rs.'000
Quoted Investment
RichardPierisandCompanyPLC 17.1 1,000,000 1,000,000 1,000,000 1,000,000
Unquoted Investment
RichardPierisFinanceLtd 17.2 200,880 144,300 200,880 144,300
Total Financial Assets 1,200,880 1,144,300 1,200,880 1,144,300
17.1. QUOTED INVESTMENT
HELD-TO-MATURITY FINANCIAL ASSETS
Quoted Debt Securities Held by the Company Company Group
Quoted Debentures - Richard Pieris and Company PLC 2017 2016 2017 2016
YearofMaturity 2019 2019 2019 2019
NoofDebentures Nos’000 10,000 10,000 10,000 10,000
FaceValueperDebenture Rs. 100 100 100 100
CarryingValue Rs.‘000 1,000,000 1,000,000 1,000,000 1,000,000
FairValue Rs.’000 1,000,000 1,000,000 1,000,000 1,000,000
InMay2014, theCompany invested in10.0Mn, Rs.100/-eachfiveyearFixedRatedListedDebentures(11.25%p.a.)PayableSemiAnnuallyIssuedbytheUltimateParentCompany(RichardPieris&CompanyPLC)amountingtoRs.1.0Bn. subsequentprofitorlossonfairvaluerecognisedinOtherComprehensiveincome.
Financial Reports | Notes to the Financial Statements Notes to the Financial Statements | Financial Reports
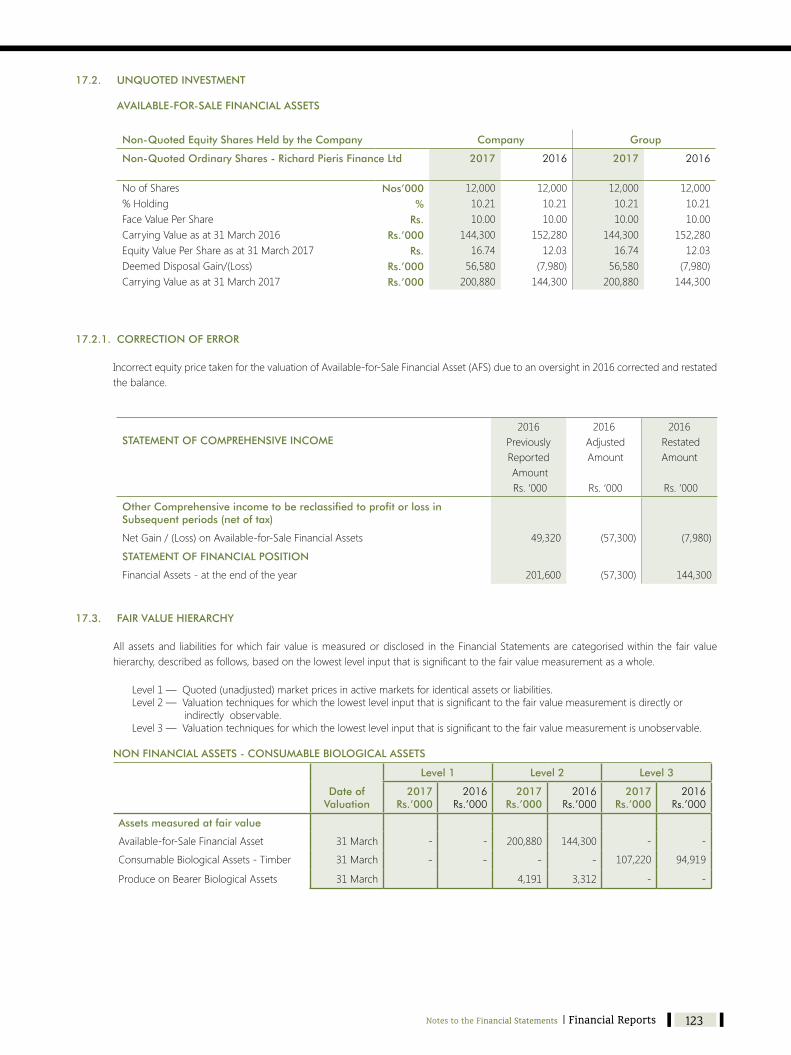
Kegalle Plantations PLC A n n u a l R e p o r t 2 0 1 6 - 1 7
123
17.2. UNQUOTED INVESTMENT AVAILABLE-FOR-SALE FINANCIAL ASSETS
Non-Quoted Equity Shares Held by the Company Company Group
Non-Quoted Ordinary Shares - Richard Pieris Finance Ltd 2017 2016 2017 2016
No of Shares Nos’000 12,000 12,000 12,000 12,000%Holding % 10.21 10.21 10.21 10.21FaceValuePerShare Rs. 10.00 10.00 10.00 10.00CarryingValueasat31March2016 Rs.’000 144,300 152,280 144,300 152,280EquityValuePerShareasat31March2017 Rs. 16.74 12.03 16.74 12.03DeemedDisposalGain/(Loss) Rs.’000 56,580 (7,980) 56,580 (7,980)CarryingValueasat31March2017 Rs.’000 200,880 144,300 200,880 144,300
17.2.1. CORRECTION OF ERROR
IncorrectequitypricetakenforthevaluationofAvailable-for-SaleFinancialAsset(AFS)duetoanoversightin2016correctedandrestatedthebalance.
STATEMENT OF COMPREHENSIVE INCOME2016
PreviouslyReportedAmountRs.‘000
2016AdjustedAmount
Rs.‘000
2016RestatedAmount
Rs.‘000
Other Comprehensive income to be reclassified to profit or loss in Subsequent periods (net of tax)
NetGain/(Loss)onAvailable-for-SaleFinancialAssets 49,320 (57,300) (7,980)
STATEMENT OF FINANCIAL POSITION
FinancialAssets-attheendoftheyear 201,600 (57,300) 144,300
17.3. FAIR VALUE HIERARCHY
Allassetsand liabilities forwhich fairvalue ismeasuredordisclosed in theFinancialStatementsarecategorisedwithin the fairvaluehierarchy,describedasfollows,basedonthelowestlevelinputthatissignificanttothefairvaluemeasurementasawhole.
Level1—Quoted(unadjusted)marketpricesinactivemarketsforidenticalassetsorliabilities. Level2—Valuationtechniquesforwhichthelowestlevelinputthatissignificanttothefairvaluemeasurementisdirectlyorindirectlyobservable. Level3—Valuationtechniquesforwhichthelowestlevelinputthatissignificanttothefairvaluemeasurementisunobservable.
NON FINANCIAL ASSETS - CONSUMABLE BIOLOGICAL ASSETS
Level 1 Level 2 Level 3
Date of Valuation
2017Rs.’000
2016Rs.’000
2017Rs.’000
2016Rs.’000
2017Rs.’000
2016Rs.’000
Assets measured at fair value
Available-for-SaleFinancialAsset 31March - - 200,880 144,300 - -
ConsumableBiologicalAssets-Timber 31March - - - - 107,220 94,919
ProduceonBearerBiologicalAssets 31March 4,191 3,312 - -
Notes to the Financial Statements | Financial Reports

Kegalle Plantations PLC A n n u a l R e p o r t 2 0 1 6 - 1 7
124
18. LONG TERM INVESTMENTS 18.1. Investments in Subsidiaries Company Unquoted Investments Hamefa Kegalle (Pvt) Ltd
InitialInvestmentinHamefaKegalle(Pvt)LtdstatedatcostofRs.14Mn.SinceitwasprovidedfordiminishinginvalueofRs.14Mnupto2008,thecarryingamountofinvestmentshowsnobalanceattheendoftheyear.
18.2. Investments in Associates
Quoted Investment - Arpico Insurance PLC Company Group
2017 2016 2017 2016
Holding % 40.29 40.29 40.29 40.29
No of Shares Nos ‘000 26,685 26,685 26,685, 26,685
Value Rs.’000 266,850 266,850 307,935 264,087
Unquoted Investment - Richard Pieris Natural Foams Ltd Company Group
2017 2016 2017 2016
Holding % 35.11 35.11 35.11 35.11
No of Shares Nos ‘000 22,500 22,500 22,500 22,500
Value Rs.’000 225,000 225,000 525,681 454,198
Company Investments in Associates, Total Rs.’000 491,850 491,850 833,616 718,285
18.3. Other Long Term Investments
2017 2016 2017 2016
No of Shares Nos Nos Nos Nos
MaskeliyaTeaGardenCeylonLtdExoticHorticulture(Pvt)Ltd
11
11
11
11
TotalInvestment 2 2 2 2
Value Rs.'000 Rs.'000 Rs.'000 Rs.'000
MaskeliyaTeaGardenCeylonLtdExoticHorticulture(Pvt)Ltd
--
--
--
--
Long Term Investments - Others - - - -
Long Term Investments - Total 491,850 491,850 833,616 718,285
Financial Reports | Notes to the Financial Statements Notes to the Financial Statements | Financial Reports

Kegalle Plantations PLC A n n u a l R e p o r t 2 0 1 6 - 1 7
125
18.4 Summarised Financial Information of Associates
Richard Pieris Natural Foams Ltd 2017Rs.'000
2016Rs.'000
Revenue 2,614,626 1,905,089
Profit/(Loss)BeforeTaxGroup'sShareofProfit/(Loss)BeforeTaxGroup'sShareofOtherComprehensiveIncomeProfit/(Loss)AfterTax
526,159184,734(292)
464,610
366,301128,608
27322,135
OtherComprehentiveIncomeTotalComprehentiveIncomeDividendsReceived
(831)463,77982,215
78322,21345,765
CurrentAssetsNonCurrentAssetsTotalAssetsCurrentLiabilitiesNonCurrentLiabilitiesTotalLiabilities
1,069,768502,172
1,571,940525,40340,825566,228
966,393391,136
1,357,529543,65411,767555,421
TheGroupcaninfluenceupto35.11%ofthevotingrightsoftheRichardPierisNaturalFoamsLtdwitheffectivedatefrom31March2010.
Arpico Insurance PLC 2017Rs.'000
2016Rs.'000
Revenue 803,015 516,816
Profit/(Loss)BeforeTaxGroup'sShareofProfit/(Loss)BeforeTaxGroup'sShareofOtherComprehensiveIncomeDeemedDisposalGainProfit/(Loss)AfterTax
109,26344,022(174)
-109,263
30,32812,219
925,81830,328
OtherComprehentiveIncomeTotalComprehentiveIncomeDividendsReceived
(432)108,831
-
22730,555
-
CurrentAssetsNonCurrentAssetsTotalAssetsCurrentLiabilitiesNonCurrentLiabilitiesTotalLiabilities
463,6201,221,4171,685,03798,744819,431918,175
793,783456,014
1,249,79787,039504,725591,765
TheGroupcaninfluenceupto40.29%ofthevotingrightsoftheArpicoInsurancePLCwitheffectivedatefrom01April2015.
Notes to the Financial Statements | Financial Reports

Kegalle Plantations PLC A n n u a l R e p o r t 2 0 1 6 - 1 7
126
19. INVENTORIES Company Group
2017Rs.'000
2016Rs.'000
2017Rs.’000
2016Rs.'000
InputMaterialsGrowingCrop-NurseriesProduceStockSparesandConsumables
45,98622,480197,6492,006
27,9779,018
196,8252,134
52,81422,480197,6492,006
34,8049,018
196,8252,134
268,121 235,954 274,949 242,781
(-)Provisionforslowmovingstocks - - (7,500) (7,500)
268,121 235,954 267,449 235,281
20. TRADE AND OTHER RECEIVABLES Company Group
2017Rs.'000
2016Rs.'000
2017Rs.'000
2016Rs.'000
ProduceDebtors Advances&PrepaymentsOtherDebtors
RelatedCompanies(20.1)Others
134,06285,12810,68958,067
50,18236,3518,30139,684
134,06185,12810,68966,362
50,18236,3518,30147,979
287,946 134,518 296,240 142,813
20.1. TRADE RECEIVABLES FROM RELATED COMPANIES Company Group
Relationship 2017Rs.'000
2016Rs.'000
2017Rs.'000
2016Rs.'000
RichardPierisNaturalFoamsLtdArpicoNaturalLatexFoam(Pvt)LtdRichardPierisExportsPLCRichardPierisRubberCompoundsLtdRichardPierisDistributorsLtdArpitalianCompactSoles(Pvt)LtdArpitech(Pvt)Ltd
AssociateCompanyRelatedCompanyRelatedCompanyRelatedCompanyRelatedCompanyRelatedCompanyRelatedCompany
110,82032,05518,466538
1,511873
1,853
40,53732,0559,645
----
110,82032,05518,466538
1,511873
1,853
40,53732,0559,645
----
166,116 82,237 166,116 82,237
(-)Provisionfordoubtfulreceivables (32,055) (32,055) (32,055) (32,055)
134,062 50,182 134,061 50,182
21. AMOUNTS DUE FROM RELATED COMPANIES Company Group
Relationship 2017Rs.'000
2016Rs.'000
2017Rs.'000
2016Rs.'000
MaskeliyaPlantationsPLCHamefaKegalle(Pvt)LimitedRPCPlantationManagementServices(Pvt)LtdRPCManagementServices(Pvt)Ltd
RelatedCompanySubsidiaryCompanyParentCompanyRelatedCompany
1,78290,847
-533
-91,9702,328466
1,782--
533
--
2,328466
93,162 94,765 2,315 2,794
(-)Provisionfordoubtfulreceivables (54,891) (54,891) - -
38,271 39,873 2,315 2,794
22. SHORT TERM INVESTMENTS Company Group
2017Rs.'000
2016Rs.'000
2017Rs.'000
2016Rs.'000
InvestmentinTreasuryBills,REPO&Others 1,420,892 1,692,867 1,420,892 1,692,867
23. STATED CAPITAL
Issued and Fully Paid Ordinary Shares Company Group
2017 2016 2017 2016
NumberofOrdinarySharesincludingonegoldenshareheldbytheTreasurywhichhasspecialrights Nos’000 25,000 25,000 25,000 25,000
Value ofOrdinary Shares including one golden shareheldbytheTreasurywhichhasspecialrights Rs.'000 250,000 250,000 250,000 250,000
TheholdersofOrdinarySharesareentitledtoreceivedividendsasdeclaredfromtimetotimeandareentitledtoonevotepershareatmeetingsoftheCompany.SpecialrightsoftheGoldensharearegivenintheAnnualReporttotheBoardofDirectorsontheaffairsoftheCompany
Financial Reports | Notes to the Financial Statements Notes to the Financial Statements | Financial Reports

Kegalle Plantations PLC A n n u a l R e p o r t 2 0 1 6 - 1 7
127
24.1. LONG TERM LOANS (Secured) (Cont…)
2017 Repayable
within1 year
Rs.'000
2017 Repayable after one year less than five
yearsRs.'000
2017 Repayable
after five year
Rs.'000
2017
Sub Total
Rs.'000
2017Total as at
31.03.2017
Rs.'000
2016Total as at
31.03.2016
Rs.'000
Rate of Interest Terms of Repayment
NDB/DFCC
Disbursement1
3,651 - - -
3,651 13,083 10.99%
1MonthInstallment@Rs.
507,091and71Installments
@Rs.786,000commencing
from30.09.2011Disbursement2 2,446 - - - 2,446 7,338 11.30% 1MonthInstallment@Rs.
407,645and71Installments
@Rs.407,668commencing
from31.10.2011ADB/NDB 23,064 - - - 23,064 57,665 AWPLR+0.5% 1MonthInstallment@Rs.
2,880,209and59Installments
@Rs.2,883,395commencing
from31.12.2012NDB 73,857 73,859 - 73,859 147,716 221,573 AWPLR+0.25% 1MonthInstallment@Rs.
6,550,000and83Installments
@Rs.6,150,000commencing
from31.05.2012IOB/IB/SBI 79,800 140,650 - 140,650 220,450 300,250 AWPLR+0.9% 1MonthInstallment@Rs.
7,650,000and59Installments
@Rs.6,650,000commencing
from31.01.2015IOB-Dollar 202,074 560,608 - 560,608 762,682 915,818 6Months
LIBOR+5.5%
1MonthInstallment@
Rs.17,256,610and71
[email protected],487,090
commencingfrom
31.10.2014Commercial-Doller 151,989 228,288 - 228,288 380,277 511,718 1Month
LIBOR+5.0%
1MonthInstallment@
Rs.11,265,571and59
[email protected],001,431
commencingfrom
31.10.2014Sri Lanka Tea Board 5,111 17,889 - 17,889 23,000 - MonthlyReviewed 36MonthlyInstallments@Rs.
638,888commencingfrom
31.08.2016 541,993 1,021,294 - 1,021,294 1,563,286 2,027,445
24. LOANS AND BORROWINGS
Company/Group 2017 2016
Repayable within1 year
Rs.'000
Repayable after one year
less than five yearsRs.'000
Repayable after five year
Rs.'000
Sub Total
Rs.'000
Total as at 31.03.2017
Rs.'000
Total as at31.03.2016
Rs.'000
LongTermLoans24.1ShortTermLoansBankOverDraft
541,993-
1,013,209
1,021,294--
---
1,021,294--
1,563,286-
1,013,209
2,027,444148,000552,069
1,555,202 1,021,294 - 1,021,294 2,576,495 2,727,513
23.1. General Reserve
GeneralReserverepresentsamountsset-asidefromtimetotimebytheDirectorsoftheCompanyforpurposeofgeneralapplication.ThesehavebeenappropriatedbytheBoardincompliancewiththeArticles,whichprovidesforsuchamountsbeingset-asideforfutureandutilizedafterappropriateBoardApprovals.
Notes to the Financial Statements | Financial Reports

Kegalle Plantations PLC A n n u a l R e p o r t 2 0 1 6 - 1 7
128
25. RETIRING BENEFIT OBLIGATIONS
Company Group
2017 2016 2017 2016
Rs.'000 Rs.'000 Rs.'000 Rs.'000
Provision for retiring gratuity
AtthebeginningoftheyearInterestCostCurrentServiceCostGratuityPaymentsfortheyearActuarial(Gain)/LossarisingfromchangesinfinancialassumptionsActuarial(Gain)/Lossarisingfromexperienceadjustments
429,47849,39026,291(80,978)(16,976)(26,405)
486,07549,82329,800(49,768)(36,503)(49,948)
429,57449,39026,291(80,978)(16,976)(26,405)
486,16949,82329,800(49,768)(36,503)(49,948)
Attheendoftheyear 380,800 429,478 380,895 429,573 The actuarial valuations had been carried out,Messrs. Actuarial &Management Consultants (Pvt) Ltd, for retiring gratuity for all theemployeesof theCompanyasat31March2017,whichamounts toRs. 380,800,362/-. If theCompanyhadprovided forgratuity forworkersonthebasisof14dayswagesandforstaffandexecutiveahalfmonthsalaryforeachcompletedyearofserviceasat31March2017,inlinewiththeGratuityActNo.12of1983theliabilitywouldhavebeenRs.529,786,330/-.Hence,thereisacontingentliabilityofRs.148,985,967/-whichwouldcrystaliseonlyiftheCompanyceasestobeagoingconcern,ortheresignationorterminationofemployeeswhicheverisearliest. LKAS19requirestheuseofactuarialtechniquestomakeareliableestimateoftheamountofretirementbenefitthatemployeeshaveearnedinreturnfortheirserviceinthecurrentandpriorperiodsusingtheProjectedUnitCreditMethodanddiscountthatbenefitinordertodeterminethepresentvalueoftheretirementbenefitobligationandthecurrentservicecost.Thisrequiresanentitytodeterminehowmuchbenefitisattributabletothecurrentandpriorperiodsandtomakeestimatesaboutdemographicvariablesandfinancialvariablesthatwillinfluencethecostofthebenefit. ThePresentValueofRetirementBenefitObligationiscarriedonannualbasis. Thefollowingpaymentsareexpectedfromthedefinedbenefitplanobligationinfutureyears.
Company
As at 31 March 2017
Rs.'000
Withinthenext12monthsBetween2and5yearsBeyond5years
89,753101,509189,539
TotalRBO 380,801 TheweigtedaveragedurationoftheDefindBenefitplanobligationattheendofthereportingperiodis3.62yearsand7.47Yearsforstaffandworkersrespectively. ThekeyassumptionsusedbyMessers.Actuarial&ManagementConsultants(Pvt)LtdwhendeterminingtheretirementbenefitobligationsaregiveninAccountingPolicyNote3.14.
Sensitivity Analysis - Salary/ Wage Escalation Rate
ValuesappearingintheFinancialStatementsareverysensitivetothechangesinfinancialandnon-financialassumptionsused.Asensitivitywascarriedoutasfollows:
Company Workers Staff
+1% -1% +1% -1%
A one percentage point change in the discount rate.
Rs.'000 Rs.'000 Rs.'000 Rs.'000
Asat31March2017Asat31March2016
(20,187)(24,553)
22,99128,135
(1,884)(2,814)
2,0833,170
+1% -1% +1% -1%
A one percentage point change in the salary / wage increment rate.
Rs.’000 Rs.’000 Rs.’000 Rs.’000
Asat31March2017Asat31March2016
10,48814,241
(9,970)(13,476)
8993,343
(862)(2,995)
Financial Reports | Notes to the Financial Statements

Kegalle Plantations PLC A n n u a l R e p o r t 2 0 1 6 - 1 7
129
26. DEFERRED INCOME Company Group
2017Rs.'000
2016Rs.'000
2017Rs.'000
2016Rs.'000
Deferred Grants and Subsidies
Balanceatthebeginningoftheyear 203,037 207,126 204,262 212,704
Add:Grants/Subsidyreceivedduringtheyear 6,399 11,546 6,399 11,546
Less:Amortisationfortheyear (13,257) (15,636) (14,483) (19,988)
Balanceattheendoftheyear 196,178 203,037 196,178 204,262
TheCompanyhasreceivedfundingfromthePlantationHumanDevelopmentTrustandAsianDevelopmentBankforthedevelopmentofworkerfacilitiessuchasre-roofingoflinerooms,latrines,watersupplyandsanitationetc.TheamountsspentareincludedundertherelevantclassificationofProperty,Plant&EquipmentandthegrantcomponentisreflectedunderDeferredGrantsandSubsidies.
27. DEFERRED TAX ASSETS AND LIABILITIES Company Group
2017Rs.'000
2016Rs.'000
2017Rs.'000
2016Rs.'000
Temporary Differences,
AtthebeginningoftheyearAmountoriginating/(Reversal)duringtheyear
1,007,1388,525
1,104,784(97,646)
1,007,1388,525
1,104,784(97,646)
Attheendoftheyear 1,015,663 1,007,138 1,015,663 1,007,138
Temporary Differences of,
Property,Plant&Equipment(includingBiologicalAssets)RetirementBenefitObligationsCarriedforwardTaxLosses
2,341,987(380,800)(945,524)
2,213,446(429,478)(758,912)
2,341,987(380,800)(945,524)
2,213,446(429,478)(758,912)
Attheendoftheyear 1,015,663 1,025,056 1,015,663 1,025,056
Tax Effect,
AtthebeginningoftheyearTransferfrom/(to)IncomeStatement
53,368(6,506)
79,555(26,186)
53,368(6,506)
79,555(26,186)
Attheendoftheyear 46,862 53,368 46,862 53,369
Deferred Tax Liabilities
Property,Plant&Equipment(includingBiologicalAssets) 255,890 243,620 255,890 243,620
255,890 243,620 255,890 243,620
Deferred Tax Assets
RetirementBenefitObligationsCarriedforwardTaxLosses
(60,014)(149,014)
(67,686)(122,566)
(60,014)(149,014)
(67,686)(122,566)
(209,028) (190,251) (209,028) (190,251)
DeferredTax(Asset)/Liability 46,862 53,369 46,862 53,369
27.1. Reconciliation of deferred tax charge / (reversal) Company Group
2017Rs.'000
2016Rs.’000
2017Rs.'000
2016Rs.’000
Atthebeginningoftheyear 53,369 79,555 53,369 79,555
Taxcharge/(reversal)duringtheperiodrecognisedStatementofprofitorloss. (13,345) (39,811) (13,345) (39,811)
Taxcharge/(reversal)duringtheperiodrecognisedinotherComprehensiveIncome. 6,837 13,625 6,837 13,625
Attheendoftheyear 46,861 53,369 46,861 53,369
Notes to the Financial Statements | Financial Reports

Kegalle Plantations PLC A n n u a l R e p o r t 2 0 1 6 - 1 7
130
Theleaseoftheestateshavebeenamended,witheffectfrom11June1996toanamountsubstantiallyhigherthanthepreviousleaserentalofRs.500/-perestateperannum.ThefirstrentalpayableundertherevisedbasisisRs.15,744,000from11June1997.ThisamountistobeinflatedannuallybytheGrossDomesticProduct(GDP)deflator,andisintheformofContingentrental. ThecontingentrentalduringthecurrentyearchargedtotheIncomeStatementamountedtoRs.41,198,830/-whichinbasedonGDPdeflatorof2.1%(2016-40,027,631/-5.1%) TheStatementofRecommendedPractice(SoRP)forRight-to-useofLandonLeasewasapprovedbytheCounciloftheInstituteofCharteredAccountantsofSriLankaon19December2012.Subsequently,theamendmentstotheSoRPalongwiththemodificationtothetitleasStatementof Alternative Treatment (SoAT) were approved by the Council on 21 August 2013. The Company has not reassessed the Right-to-use ofLandbecause this is not amandatory requirement.However, if the liability is reassessedaccording to the alternative treatment (SoAT)ontheassumption that the lease rent is increasedconstantlyby GDPdeflatorof4%anddiscountedata rateof13% , liabilitywouldbeasfollows. Rs.’000
GrossLiability = 3,016,050 FinanceCharges = (2,011,827) NetLiability = 1,004,223
TheabovereassessedliabilityisnotreflectedintheseFinancialStatements.
28. LIABILITY TO MAKE LEASE PAYMENT Company Group
2017Rs.'000
2016Rs.'000
2017Rs.'000
2016Rs.'000
Gross Liability
AtthebeginningoftheyearRepaymentduringtheyearAttheendoftheyearFinancecostallocatedtofutureperiods
459,974(15,744)444,230
(180,741)
475,718(15,744)459,974
(191,480)
459,974(15,744)444,230
(180,741)
475,718(15,744)459,974
(191,480)
NetLiability 263,489 268,493 263,489 268,493
Payable within one year
GrossliabilityFinancecostallocatedtofutureperiods
15,744(10,539)
15,744(10,740)
15,744(10,539)
15,744(10,740)
Netliabilitytransferredtocurrentliabilities 5,205 5,004 5,205 5,004
Payable within two to five years
GrossliabilityFinancecostallocatedtofutureperiods
62,976(39,989)
62,976(40,874)
62,976(39,989)
62,976(40,874)
Netliability 22,987 22,102 22,987 22,102
Payable after five years
GrossliabilityFinancecostallocatedtofutureperiods
365,510(130,212)
381,254(139,867)
365,510(130,212)
381,254(139,867)
Netliability 235,298 241,387 235,298 241,387
Netliabilitypayableafteroneyear 258,284 263,489 258,284 263,489
29. TRADE AND OTHER PAYABLES Company Group
2017Rs.'000
2016Rs.'000
2017Rs.'000
2016Rs.’000
TradeCreditorsOtherCreditors
222,41628,695
177,89024,796
226,29732,836
182,93827,591
251,111 202,685 259,133 210,529
30. DIVIDEND PAYABLE Company Group
2017Rs.'000
2016Rs.’000
2017Rs.'000
2016Rs.'000
DividendPayable 26,576 21,354 26,576 21,354
26,576 21,354 26,576 21,354
Financial Reports | Notes to the Financial Statements Notes to the Financial Statements | Financial Reports

Kegalle Plantations PLC A n n u a l R e p o r t 2 0 1 6 - 1 7
131
32. ASSETS PLEDGED AS SECURITIES Thefollowingassetshavebeenpledgedassecuritiesforliabilities.
Name of BankLoan
FacilityRs/USD (Mn)
SecurityNature
ofLiability
Carring Amount Pledged
2017Rs.’000
2016Rs.’000
BankofCeylon 35.0Mn PrimarymortgageoverleaseholdrightsofGampahaEstate. Overdraft 114,257 114,784
HattonNationalBankPLC 50.0Mn PrimarymortgageoverleaseholdrightsofLuckylandEstate. Overdraft 185,295 185,841
AsianDevelopmentBank/National
DevelopmentBankPLC
1,051.7Mn Primaryandsecondarymortgageoverleaseholdrightsof
Atale,Pallegama,Parambe,Weniwella,andYataderiyaEstates.
FurthermortgageoverPallegama,Parambe,Weniwella,and
YataderiyaEstates.
TermLoan 1,029,466 987,814
IndianOverseaseBank(IOB)
StateBankofIndia(SBI)/IndianBank(IB)
400.0Mn PrimarymortgageoverleaseholdrightsofMadeniyaand
HiggodaEstates.
TermLoan 209,590 201,171
IndianOverseasBank(IOB) USD8.0Mn PrimarymortgageoverleaseholdrightsofAmbadeniya,
HathbawaandUdapolaEstates.
TermLoan 458,527 450,672
CommercialBankofCeylonPLC USD5.0Mn PrimarymortgageoverleaseholdrightsofEtana,Doteloya,
andKirkleesEstates.
TermLoan 339,589 332,304
NationsTrustBankPLC 150.0Mn PrimarymortgageoverProduceStocks(Rubber,Teaand
Coconut).
TermLoan/
Overdraft
- 201,522
Notes: 1.CorporateGuaranteebytheCompanyforRs.25MngiventoMaskeliyaTeaGardenCeylonLtd. 2.CorporateGuaranteetoHSBCbytheCompanyforUSD450,000onbehalfofRichardPeirisNaturalFormsLtd.
33. CAPITAL COMMITMENTS
FollowingsarethecapitalcommitmentsasattheStatementofFinancialPositiondate;
Company Group
2017 2016 2017 2016
Rs.'000 Rs.'000 Rs.'000 Rs.'000
ApprovedbytheBoard&ContractedforApprovedbytheBoard¬Contractedfor
-515,105
-295,753
-515,105
-295,753
515,105 295,753 515,105 295,753
34. COMMITMENTS AND CONTINGENCIES
Contingentliabilitythatmayresult,dependingonthetimingofthetaxabilityofcertainfairvalueadjustmentsamounttoapproximatelyRs.591,448/-.
35. EVENTS AFTER REPORTING PERIOD
NocircumstenceshavearisensincetheStatementofFinancialPositiondate,whichwouldrequireadjustmentordisclosuerintheFinancialStatements.
31. AMOUNTS DUE TO RELATED COMPANIES Company Group
Relationship 2017Rs.'000
2016Rs.'000
2017Rs.'000
2016Rs.'000
MaskeliyaPlantationsPLCNamunukulaPlantationsPLCRPCLogistics(Pvt)LtdRichardPieris&CompanyPLCRichardPierisPlantations(Pvt)LtdRPCPlantationManagementServices(Pvt)LtdRichardPierisDistributorsLtdMaskeliyaTeaGardenCeylonLtd
RelatedCompanyRelatedCompanyRelatedCompanyUltimateParentCompanyRelatedCompanyParentCompanyRelatedCompanyRelatedCompany
-18,385
56347-
22,19213559
1,1217,07514
7,832--1658
-18,385
565,466
-22,19213559
1,1217,07514
12,951--1658
41,174 16,116 46,293 21,235
Notes to the Financial Statements | Financial Reports
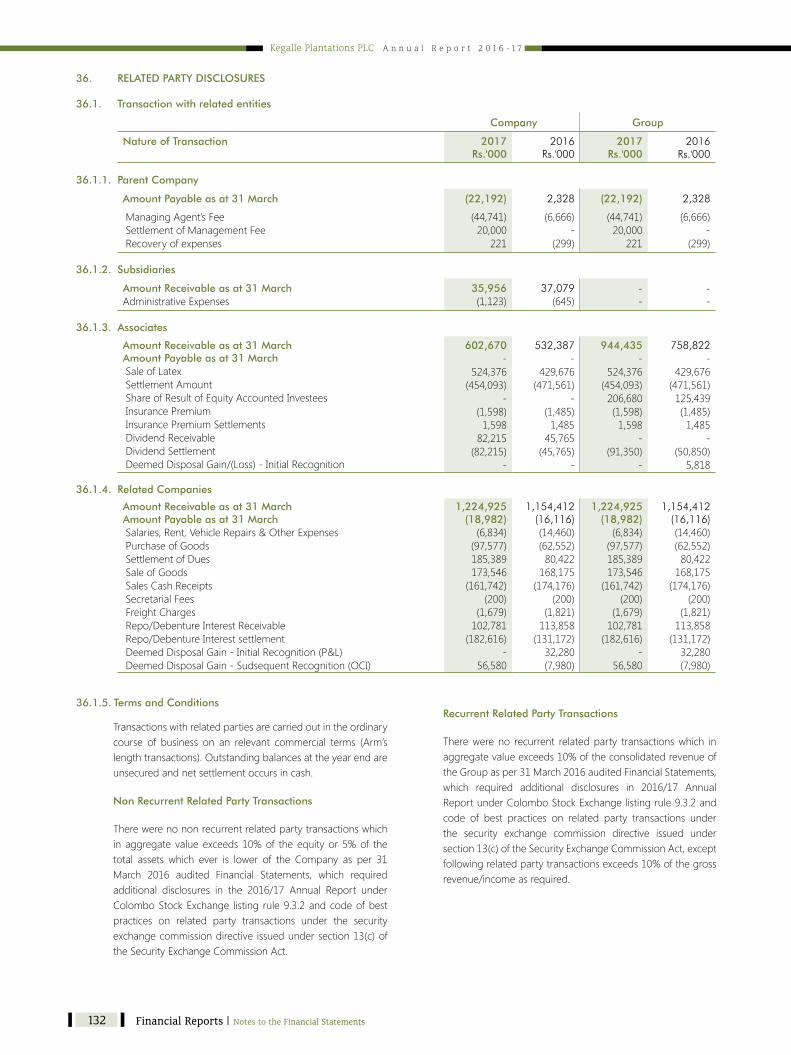
Kegalle Plantations PLC A n n u a l R e p o r t 2 0 1 6 - 1 7
132
36. RELATED PARTY DISCLOSURES 36.1. Transaction with related entities
Company Group
Nature of Transaction 2017 Rs.'000
2016 Rs.'000
2017 Rs.'000
2016Rs.'000
36.1.1. Parent Company
Amount Payable as at 31 March (22,192) 2,328 (22,192) 2,328
ManagingAgent’sFeeSettlementofManagementFeeRecoveryofexpenses
(44,741)20,000221
(6,666)-
(299)
(44,741)20,000221
(6,666)-
(299)
36.1.2. Subsidiaries
Amount Receivable as at 31 MarchAdministrativeExpenses
35,956 (1,123)
37,079 (645)
- -
- -
36.1.3. Associates
Amount Receivable as at 31 MarchAmount Payable as at 31 MarchSaleofLatexSettlementAmountShareofResultofEquityAccountedInvesteesInsurancePremiumInsurancePremiumSettlementsDividendReceivableDividendSettlementDeemedDisposalGain/(Loss)-InitialRecognition
602,670 -
524,376(454,093)
-(1,598)1,59882,215(82,215)
-
532,387 -
429,676(471,561)
-(1,485)1,48545,765(45,765)
-
944,435 -
524,376(454,093)206,680(1,598)1,598
-(91,350)
-
758,822 -
429,676(471,561)125,439(1,485)1,485
-(50,850)5,818
36.1.4. Related Companies
Amount Receivable as at 31 MarchAmount Payable as at 31 MarchSalaries,Rent,VehicleRepairs&OtherExpensesPurchaseofGoodsSettlementofDuesSaleofGoodsSalesCashReceiptsSecretarialFeesFreightChargesRepo/DebentureInterestReceivableRepo/DebentureInterestsettlementDeemedDisposalGain-InitialRecognition(P&L)DeemedDisposalGain-SudsequentRecognition(OCI)
1,224,925 (18,982)(6,834)(97,577)185,389173,546(161,742)
(200)(1,679)102,781(182,616)
-56,580
1,154,412 (16,116)(14,460)(62,552)80,422168,175(174,176)
(200)(1,821)113,858(131,172)32,280(7,980)
1,224,925 (18,982)(6,834)(97,577)185,389173,546(161,742)
(200)(1,679)102,781(182,616)
-56,580
1,154,412 (16,116)(14,460)(62,552)80,422168,175(174,176)
(200)(1,821)113,858(131,172)32,280(7,980)
36.1.5. Terms and Conditions
Transactionswithrelatedpartiesarecarriedoutintheordinarycourse of business on an relevant commercial terms (Arm’slengthtransactions).Outstandingbalancesattheyearendareunsecured and net settlement occurs in cash. Non Recurrent Related Party Transactions Therewerenononrecurrentrelatedpartytransactionswhichinaggregate valueexceeds10%of theequityor5%of thetotal assets which ever is lower of the Company as per 31March 2016 audited Financial Statements, which requiredadditional disclosures in the 2016/17 Annual Report underColomboStockExchange listing rule9.3.2andcodeofbestpractices on related party transactions under the security exchangecommissiondirective issuedundersection13(c)oftheSecurityExchangeCommissionAct.
Recurrent Related Party Transactions Therewere no recurrent relatedparty transactionswhich inaggregatevalueexceeds10%oftheconsolidatedrevenueoftheGroupasper31March2016auditedFinancialStatements,which required additional disclosures in 2016/17 AnnualReportunderColomboStockExchangelistingrule9.3.2andcode of best practices on related party transactions underthe security exchange commission directive issued undersection13(c)oftheSecurityExchangeCommissionAct,exceptfollowingrelatedpartytransactionsexceeds10%ofthegrossrevenue/incomeasrequired.
Financial Reports | Notes to the Financial Statements Notes to the Financial Statements | Financial Reports

Kegalle Plantations PLC A n n u a l R e p o r t 2 0 1 6 - 1 7
133
36.4. Related Party Transactions
There are no related party transactions other than thosedisclosedinNotes11,17.1,17.2,18,20.1,21,31,32&36totheFinancialStatements.
36.5. Details of material issues pertaining to employees and Industrial relations of the Company.
Therewerenomaterial issuespertaining to employees andindustrial relationspertainingto theCompanythatoccurredduringtheyearunderreview.
37. IMPACT OF AMENDMENTS TO LKAS 16 AND LKAS 41
TheprioryearfigureshavebeenrestatedduetothefollowingadjustmentandthetotaleffecttotheFinancialStatementsissummarizedbelow.
Amendment toLKAS16andLKAS41,onbearerplantsareeffective forannual reportingperiodsbeginningonorafter1 January 2016. Accordingly harvestable biological assetsgrowingonthebearerplantsaremeasuredattheirfairvaluelesscosttoharvestandaccountedretrospectively.
STATEMENT OF PROFIT OR LOSS
2016PreviouslyReportedAmountRs.‘000
2016AdjustedAmount
Rs.‘000.
2016RestatedAmount
Rs.‘000.
ChangeinFairValueofBiologicalAssets 5,728 (111) 5,617
STATEMENT OF FINANCIAL POSITION
Produce on Bearer Biological AssetsAsatthebeginningoftheyearAsattheendoftheyear
--
3,4233,312
3,4233,312
Accumulated Profit / (Loss)
Asatthebeginningoftheyear Asattheendoftheyear
2,934,6361,957,492
3,4233,312
2,938,0591,960,803
Company Group
Disclosures2017
Rs.'000 2016
Rs.'000 2017
Rs.'000 2016
Rs.'000
a. Nameoftherelatedparty;RichardPierisNaturalFoamsLtd
b. Relationship,AssociateCompany
c. Natureoftransaction;SaleofCentrifugedLatex
d. Aggregate value of related party transactions entered into during thefinancialyear 524,376 429,676 524,376 429,676
ConsolidatedrevenueasperlatestauditedFinancialStatements 1,933,063 2,023,911 1,933,063 2,023,911
e. Aggregate value of related party transactions as a% of net revenue/income 27.1% 21.2% 27.1% 21.2%
f. Termsandconditionsoftherelatedpartytransactions;Transactionswithrelatedpartiesarecarriedoutintheordinarycourseofbusinessonanarm’slengthbasis.
36.1.6. Management Fees
AspertheagreememtismadeandenteredintoatColomboasof10September2013,theManagingAgentshallbepaidfor each fiscal year fifteenpercent (15%)of the earningsofthe Company before interest received/paid, corporate tax,depreciationandamortizationof landandmanagment fees (EBIDTA)applicableinthatfiscalyear.
36.2. Transactions with key management personnel of the Company There were no transactions with the key managementpersonneloftheCompanyanditsparentfortheyearended31 March 2017. Further there were no key managementcompensationpaidduringtheyearotherthanthosedisclosedinNote8.
36.3. Other related party disclosures Legal fees amounting to Rs. 1,083,257/- was paid by theCompany last year 2015/16, to an entity in which a keymanagementpersonnelwasa partner.
Notes to the Financial Statements | Financial Reports

Kegalle Plantations PLC A n n u a l R e p o r t 2 0 1 6 - 1 7
134
38. FINANCIAL RISK MANAGEMENT OBJECTIVES AND POLICIES
TheGroup’sprincipal financial liabilities,other thanderivatives, comprise loansandborrowings, tradeandotherpayables. ThemainpurposeofthesefinancialliabilitiesistofinancetheGroup’soperationsandtoprovideguaranteestosupportitsoperations.TheGrouphasloanandotherreceivables,tradeandotherreceivables,andcashandshort-termdepositsthatarisedirectlyfromitsoperations.TheGroupalsoholdsavailable-for-saleinvestmentsandheldtomaturityinvestment. Accordingly, the Group has exposure to namely Credit Risk, Liquidity Risk, Currency Risk andMarket Risks from its use of financialinstruments. ThisnotepresentsinformationabouttheGroup’sexposuretoeachoftheaboverisks,theGroup’sobjectives,policiesandprocessesformeasuringandmanagingrisk.
38.1. FINANCIAL RISK MANAGEMENT FRAMEWORK
TheBoardofDirectors has theoverall responsibility for the establishment andoversight of theGroup’s financial riskmanagementframeworkwhichincludesdevelopingandmonitoringtheGroup’sfinancialriskmanagementpolicies.
38.2. CREDIT RISK
CreditRiskistheriskoffinanciallosstotheGroup’sifacustomerorcounterpartytoafinancialinstrumentfailstomeetitscontractualobligations,andariseprincipallyfromtheGroup’sreceivablefromcustomers.
38.2.1. TRADE AND OTHER RECEIVABLES
TheGroup’sexposuretocreditriskisinfluencedmainlybytheindividualcharacteristicsofeachcustomer.However,managementalsoconsiders the demographics of the Group’s customer base, including the default risk of the industry and the country in which thecustomersoperate,asthesefactorsmayhaveaninfluenceoncreditrisk. TheGroupreviewsexternalratingsandbankreferencesofthecustomerwhenavailable.Purchaselimitsareestablishedforeachcustomer,which are reviewedquarterly. Inmonitoring credit risk, customers are categorised according to their credit characteristics, includingwhether theyarean individualor legalentity,whether theyareawholesaleor retailcustomer,geographical location, industry,agingprofile,maturityandexistenceofpreviousfinancialdifficulties.TheGroupestablishesanallowance for impairment that represents itsestimateofincurredlossesinrespectoftradeandotherreceivables. ThemaximumexposuretocreditriskfortradeandotherreceivablesatthereportingdateisRs.296Mn(2015/16–Rs.142Mn). KegallePlantationsPLChasaminimalcreditriskofitstradereceivablesastherepaymentisguaranteedwithinsevendaysbytheTeaandRubberAuctionSystems.
38.2.2. INVESTMENTS
CreditrisksfrominvestedbalancewiththefinancialinstitutionsaremanagedbytheBoardofDirectors.Investmentsofsurplusfundsaremadeonlywithapprovedcounterpartiesandwithincreditlimitsassignedtothem.Thelimitsaresettominimizetheconcentrationofrisksandthereforemitigatefinanciallossthroughpotentialcounterparty’sfailure. TheGroupheldshortterminvestmentsofRs.1,421Mnasat31March2017(2015/16–Rs.1,693Mn)whichrepresentsthemaximumcreditexposureontheseassets.
Financial Reports | Notes to the Financial Statements Notes to the Financial Statements | Financial Reports

Kegalle Plantations PLC A n n u a l R e p o r t 2 0 1 6 - 1 7
135
38.2.3. CASH AND CASH EQUIVALENTS TheGroupheldcashatbankandinhandofRs.17Mnasat31March2017(2015/16–Rs.23Mn)whichrepresentsitsmaximumcreditexposureontheseassets.
38.3. LIQUIDITY RISK LiquidityriskistheriskthattheGroupwillencounterdifficultyinmeetingtheobligationsassociatedwithitsfinancialliabilitiesthataresettledbydeliveringcashoranotherfinancialasset.TheGroup’sapproachtomanagingliquidityistoensure,asfaraspossible,thatitwillalwayshavesufficientliquiditytomeetitsliabilitieswhendue,underbothnormalandstressedconditions,withoutincurringunacceptablelossesorriskingdamagetotheGroup’sreputation. TheGroupdoesnotconcentrateonasinglefinancialinstitution,therebyminimizingtheexposuretoliquidityriskthroughdiversificationoffundingsources.TheGroupaimstofundinvestmentactivitiesoftheindividualandGrouplevelbyfundingthelong-terminvestmentwithlongtermfinancialsourcesandshortterminvestmentwithshorttermfinancing.WherenecessarytheGroupconsultstheTreasuryDepartmentandStrategicBusinessDevelopmentUnitinParentCompanyforscrutinizingthefundingdecisions. TheTablebelowsummarizesthematurityprofileoftheGroupfinancialliabilitiesbasedoncontractualundiscountedpayments.
As at 31 March 2017 On Demand
Rs.'000
Less than 3 Months
Rs.'000
3 to 12 Months Rs.'000
2 to 5 years
Rs.'000
>5 years
Rs.'000
Total
Rs.'000
Group
Interestbearingloans&borrowing 1,023,164 139,492 442,439 1,502,936 - 3,108,031
Trade&otherpayables 259,133 - - - - 259,133
1,282,297 139,492 442,439 1,502,936 - 3,367,164
Company
Interestbearingloans&borrowing 1,023,164 139,492 442,439 1,502,936 - 3,108,031
Trade&otherpayables 251,111 - - - - 251,111
1,274,275 139,492 442,439 1,502,936 - 3,359,142
As at 31 March 2016 On Demand
Rs.'000
Less than 3 Months
Rs.’000
3 to 12 Months Rs.'000
2 to 5 years
Rs.'000
>5 years
Rs.'000
Total
Rs.'000
Group
Interestbearingloans&borrowing 705,430 135,872 425,926 2,046,151 - 3,313,379
Trade&otherpayables 210,529 - - - - 210,529
915,960 135,872 425,926 2,046,151 - 3,523,908
Company
Interestbearingloans&borrowing 705,430 135,872 425,926 2,046,151 - 3,313,379
Trade&otherpayables 202,685 - - - - 202,685
908,115 135,872 425,926 2,046,151 - 3,516,064
38.4. MARKET RISK
Marketriskistheriskthatthefairvalueorfuturecashflowsofafinancialinstrumentwillfluctuatebecauseofchangesinmarketprices.Marketpricescomprisefourtypesofrisk:interestraterisk&otherpricerisksuchasequitypricerisk.Financialinstrumentaffectedbymarketriskincludeloans&borrowings,deposits&derivativefinancialinstruments.
38.4.1. INTEREST RATE RISK
Interestrateriskistheriskthatthefairvalueorfuturecashflowsofafinancialinstrumentwillfluctuatebecauseofchangesinmarketinterest rates. The Group’s exposure to the risk of changes inmarket interest rates relates primarily to the Group’s long-term debtobligationswithfloatinginterestrates.TheGroupmanagesitsinterestrateriskbyhavingabalancedportfoliooffixedandvariablerateloansandborrowings.TheGrouphasnotengagedinanyinterestrateswapagreements. TheGroupheldlongtermborrowingswithfloatinginterestratesofRs.1,557Mn(2015/16–Rs.2,007Mn)whichrepresentsitsmaximumcreditexposureontheseliabilities.
Notes to the Financial Statements | Financial Reports
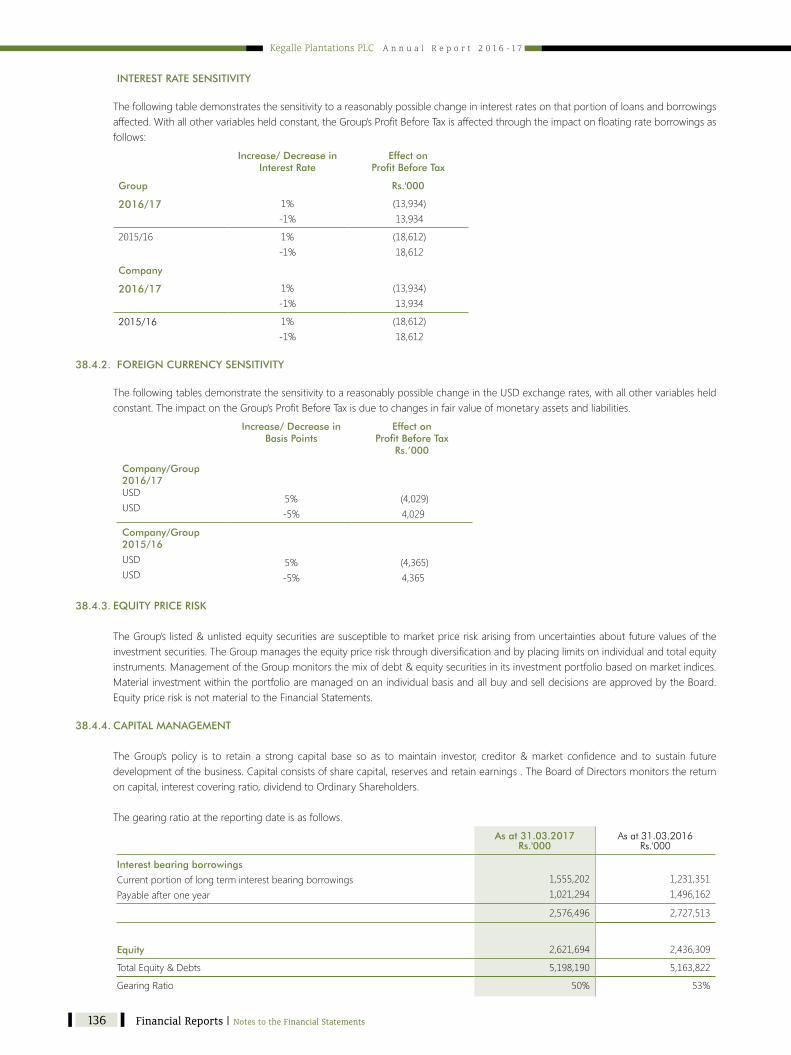
Kegalle Plantations PLC A n n u a l R e p o r t 2 0 1 6 - 1 7
136
INTEREST RATE SENSITIVITY
Thefollowingtabledemonstratesthesensitivitytoareasonablypossiblechangeininterestratesonthatportionofloansandborrowingsaffected.Withallothervariablesheldconstant,theGroup’sProfitBeforeTaxisaffectedthroughtheimpactonfloatingrateborrowingsasfollows:
Increase/ Decrease in Interest Rate
Effect onProfit Before Tax
Group Rs.'000
2016/17 1%-1%
(13,934)13,934
2015/16 1%-1%
(18,612)18,612
Company
2016/17 1%-1%
(13,934)13,934
2015/16 1%-1%
(18,612)18,612
38.4.2. FOREIGN CURRENCY SENSITIVITY
ThefollowingtablesdemonstratethesensitivitytoareasonablypossiblechangeintheUSDexchangerates,withallothervariablesheldconstant.TheimpactontheGroup’sProfitBeforeTaxisduetochangesinfairvalueofmonetaryassetsandliabilities.
Increase/ Decrease in Basis Points
Effect onProfit Before Tax
Rs.’000
Company/Group 2016/17USDUSD
5%-5%
(4,029)4,029
Company/Group2015/16
USDUSD
5%-5%
(4,365)4,365
38.4.3. EQUITY PRICE RISK
TheGroup’slisted&unlistedequitysecuritiesaresusceptibletomarketpriceriskarisingfromuncertaintiesaboutfuturevaluesoftheinvestmentsecurities.TheGroupmanagestheequitypriceriskthroughdiversificationandbyplacinglimitsonindividualandtotalequityinstruments.ManagementoftheGroupmonitorsthemixofdebt&equitysecuritiesinitsinvestmentportfoliobasedonmarketindices.MaterialinvestmentwithintheportfolioaremanagedonanindividualbasisandallbuyandselldecisionsareapprovedbytheBoard.EquitypriceriskisnotmaterialtotheFinancialStatements.
38.4.4. CAPITAL MANAGEMENT
TheGroup’s policy is to retain a strong capital base so as tomaintain investor, creditor&market confidence and to sustain futuredevelopmentofthebusiness.Capitalconsistsofsharecapital,reservesandretainearnings.TheBoardofDirectorsmonitorsthereturnoncapital,interestcoveringratio,dividendtoOrdinaryShareholders.
Thegearingratioatthereportingdateisasfollows.
As at 31.03.2017Rs.'000
As at 31.03.2016Rs.'000
Interest bearing borrowings
CurrentportionoflongterminterestbearingborrowingsPayableafteroneyear
1,555,2021,021,294
1,231,3511,496,162
2,576,496 2,727,513
Equity 2,621,694 2,436,309
TotalEquity&Debts 5,198,190 5,163,822
GearingRatio 50% 53%
Financial Reports | Notes to the Financial Statements
Supp
lem
enta
ry R
epor
ts

Kegalle Plantations PLC A n n u a l R e p o r t 2 0 1 6 - 1 7
137
Supp
lem
enta
ry R
epor
ts
Ten Year Summary ................................ 138 Historical Note ......................... 139Shareholder & Investor Information .......... 142Glossary of Financial Terminology ............ 145Notice of Meeting .................................... 147Form of Proxy ........................................... 149
Demand for Palm Oil
The edible oil requirement of Sri Lanka is day bydayincreasingandtheCoconutindustryisfailingtocater therequirement.The importationofPalmOilasanedibleoilhasincreasedtoover180,000mtperyearandtheoutflowofforeignexchangeincreasingtoUSD120mnapproximately,withtheimprovepercapitaincomeofSriLankatheconsumptionofOiltoohaveincreasedrapidly,thereforeitisexpectedtoincreasetheimportationofPalmOil.
With cultivation of approximately 1,000 HectaresKPLisalsotryingtohelpthecountrytoreducetheoutflowofforeignexchange.Sincethiscropproducethe highest Oil production per hectare. With theforegoing we are in the correct direction with thediversification of a reasonable extent to a nationalcause.
Tra
nsf
orm
ing
fro
m t
he T
rad
itio
n...
Contents

Kegalle Plantations PLC A n n u a l R e p o r t 2 0 1 6 - 1 7
138
Year Ended 31 March 2017 2016 2015 2014 2013 2012 2011 2010 2009 2008
Operating Results
Turnover
OperatingProfitbeforeMgtFee
ProfitbeforeInterestandTax
ProfitAfterTax
Dividends
Rs'000
Rs'000
Rs'000
Rs'000
Rs'000
2,287,161
302,804
457,275
217,263
125,000
1,933,063
85,344
262,085
101,330
1,125,000
2,023,911
62,710
274,227
127,034
50,000
2,414,220
409,416
564,605
345,993
337,500
2,587,558
670,346
710,927
473,186
-
2,940,027
930,179
990,709
769,842
200,000
2,991,762
1,150,845
1,031,593
883,127
75,000
2,216,497
492,193
410,000
376,030
75,000
1,927,762
423,185
351,436
177,411
25,000
2,163,030
589,392
481,984
427,597
125,000
CapitalExpenditure Rs'000 175,925 220,648 305,851 294,468 253,721 249,656 200,244 183,036 165,940 119,209
Financial Position
FixedAssets
Investments
CurrentAssets
CurrentLiabilities
Shareholders'Funds
ShareCapital
Reserves
Rs'000
Rs'000
Rs'000
Rs'000
Rs'000
Rs'000
Rs'000
2,622,327
1,692,730
2,089,323
1,879,268
2,621,694
250,000
2,371,697
2,553,641
1,693,150
2,165,252
1,476,510
2,436,309
250,000
2,186,309
2,437,195
1,611,850
3,078,052
771,499
3,412,393
250,000
3,162,393
2,232,039
611,850
4,102,606
560,053
3,342,520
250,000
3,092,520
2,024,766
597,000
3,028,955
373,638
3,336,956
250,000
3,086,956
1,872,057
450,000
2,421,056
347,441
2,841,915
250,000
2,591,915
1,707,820
225,000
1,847,793
366,372
2,272,074
250,000
2,022,074
1,814,679
225,000
1,325,104
317,718
1,698,311
250,000
1,448,311
1,564,998
80,298
946,549
196,801
1,347,281
250,000
1,097,281
1,466,538
75,000
863,732
214,234
1,219,870
250,000
969,870
Key Financial Indicators
CurrentRatio
QuickAssetRatio
DebtEquityRatio
InterestCover
Equity/AssetRatio
EarningsperShare
MarketPriceofaShare
PriceEarningRatio
DividendCover
DividendPayOutRatio
Times
Times
Times
Times
Times
Rs.
Rs.
Times
Times
%
1.11
0.97
0.50
1.77
0.41
8.69
52.00
5.98
1.74
57.54
1.47
1.31
0.53
1.32
0.38
4.05
50.70
12.51
0.09
1,110.28
3.99
3.64
0.41
1.55
0.48
5.08
85.80
16.89
2.54
39.36
7.33
6.76
0.41
3.15
0.48
13.84
105.00
7.59
1.03
97.55
8.11
7.46
0.25
5.02
0.59
18.93
112.00
5.92
-
-
6.97
6.39
0.20
9.21
0.60
30.79
103.00
3.34
3.85
25.98
5.04
4.39
0.14
9.01
0.60
35.33
207.50
5.87
11.78
8.49
4.17
3.39
0.19
6.22
0.54
15.04
47.00
3.12
5.01
19.95
4.81
4.07
0.21
5.90
0.54
7.10
19.00
2.68
7.10
14.08
4.03
3.09
0.19
10.53
0.52
17.10
60.00
3.51
3.42
29.24
Annual Production
Rubber
Tea
Coconuts
kg'000
kg'000
nuts'000
3,742
2,165
1,471
3,353
2,375
1,559
3,534
2,094
1,549
4,016
2,243
1,596
4,076
2,162
1,713
4,155
2,630
1,731
4,082
2,773
1,413
4,578
2,479
1,572
5,102
2,492
1,610
5,436
2,797
1,472
TEN YEAR SUMMARY
- 10 20 30 40 50 60 70 80 90 100
Funding
Assets
Assets & FundingIn percentage
Inflow OutflowCurrent Liabilities Land Deferred Income Other Fixed AssetsLong Term Liabilities InvestmentsShareholders' Funds Current Assets
-
500
1,000
1,500
2,000
2,500
3,000
3,500
4,000
2008
2009
2010
2011
2012
2013
2014
2015
2016
2017
Shareholders' FundsIn Million Rupees
Supplementary Reports | Ten Year Summary Historical Note | Supplementary Reports

Kegalle Plantations PLC A n n u a l R e p o r t 2 0 1 6 - 1 7
139
PARAMBE ESTATE – Undugoda, Kegalle
ParambeEstateinitiallyconsistedof998Acres(620Ha),plantedintheyear1905.TheestatewasmanagedbyMessrs.LewisBrown&Co.LtdandtheSuperintendentMr.Fairweather.
GolindaEstateconsistedof1,380Acres(857Ha)plantedin the year 1912 and had been managed by Messrs.WhittallBousteadandCo.Ltd.
Parambeestatewasunderprivateownershipsuntilupto1959inwhichyeartheestatewastakenoverbytheStatePlantationsCorporationandGolindaEstatemanagedbyWhittallBousteadLtd.Untilupto1976,wasvestedwiththeGovernment.
Subsequently both estates were managed by JanathaEstatesDevelopmentBoarduntilupto1992inwhichyeartheestateswerevestedwithRPCsandaccordinglytheabovetwoestateswereallocatedtoKegallePlantationsPLC. In the year 1993 the above two estates wereamalgamatedforadministrativereasons.
The estates are located geographically in the KegalleDistrict, inUndugodaVillage.Thedistanttotheestatefrom Kegalle Town is around 13 km situated in theKegalle/BulathkohupitiyaRoad.
Parambe estate has a Superintendent, an AssistantSuperintendentsand21estatestaffswithaworkforceofnearly388,outofwhich367workersforrubberand21workersfortea.
Land Extent of Parambe Estate - Hectares
Division Extent - haMabopitiya 141.63Ilwana 81.75Parambe 59.26Bossella 51.18Hunugala 28.91Wewatenna 256.05Moragahakande 115.83Malawita 60.80Total Land Extent 795.41
Crop Wise Extent - Hectares
Cultivation Extent - haRubber 513.66Tea 30.02MinorCrops 40.00Other Lands, buildings/jungle/roads & bridges/line gardens/rocks.Etc
211.73
Total Land Extent 795.41
PAST SUPERINTENDENTS:
The estate was entrusted with Senior Superintendentsformanagementwhosenamesarelistedbelow:
Name of Superintendent PeriodMr.Fairweather,D. 1905-1909Mr.Thistle,J.R. 1912-1917Mr.Smale,Jackson 1912-1914Mr.Shuffrey,S.J. 1914-1914Mr.Russel,A.F. 1920-1921Mr.Thomson,F.G. 1920-1929Mr.Walker,A.W. 1920-1921Mr.Lee,A. 1923-1923Mr.Lee,J.H.R. 1924-1925Mr.Ross,W.l. 1926-1929Mr.JohnKent Unknown-1955Mr.RichardLavesonLevett 1955-1967Mr.R.Wijayaratnam 1967-1971Mr.DayaThissaKarunanayaka 1971-1976Mr.LilanGaminideSilva 1976-1978Mr.SriyanP.JosephWijesekara 1978-1979Mr.D.AnilalErangeAlgama 1979-1983Mr.A.A.CyrilPerera 1983-1989Mr.SunilPoholiyadde 1989-1996Mr.GLHDAmaratunge 1996-2000Mr.UdaraS.Premathilake 2000-2002Mr.N.D.W.Kalyanaratne 2002-2004Mr.D.D.Wekunagoda 2004-2008Mr.S.A.A.PJayathilake 2008-2015Mr.N.D.Madawala 2015uptonow
HISTORICAL NOTE
Historical Note | Supplementary Reports
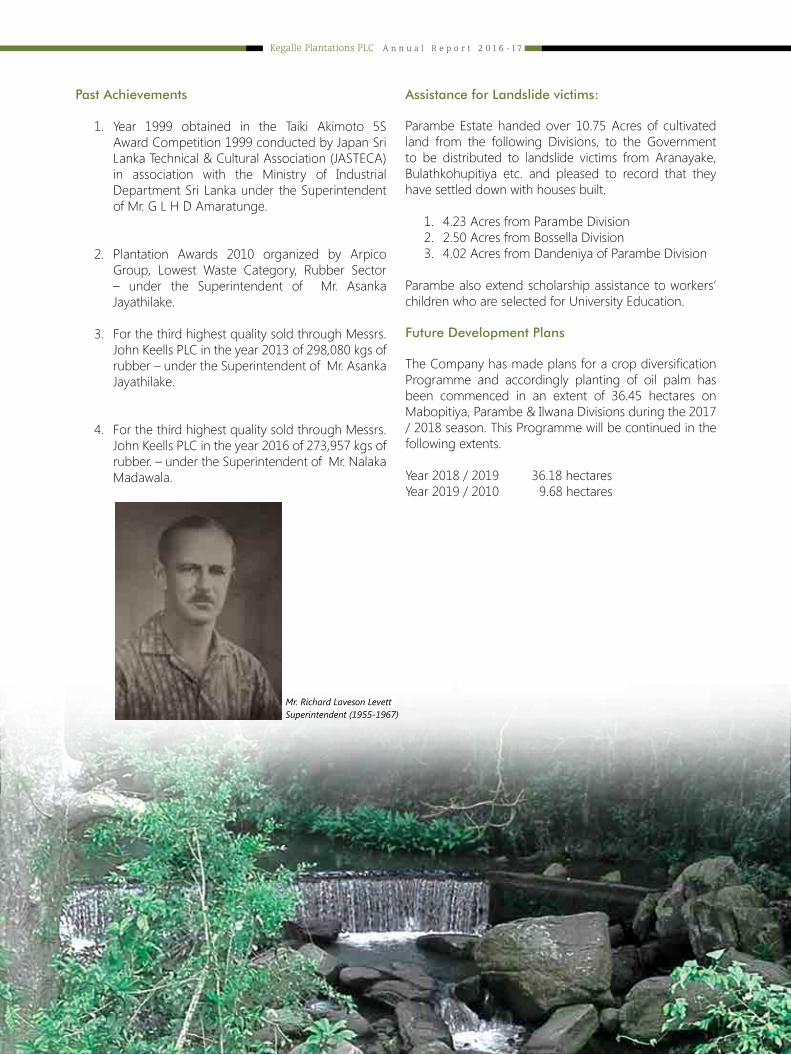
Kegalle Plantations PLC A n n u a l R e p o r t 2 0 1 6 - 1 7
140
Assistance for Landslide victims:
ParambeEstatehandedover10.75Acresof cultivatedland from the following Divisions, to the Governmentto be distributed to landslide victims from Aranayake,Bulathkohupitiya etc. and pleased to record that theyhavesettleddownwithhousesbuilt.
1. 4.23AcresfromParambeDivision2. 2.50AcresfromBossellaDivision3. 4.02AcresfromDandeniyaofParambeDivision
Parambealsoextendscholarshipassistancetoworkers’childrenwhoareselectedforUniversityEducation.
Future Development Plans
TheCompanyhasmadeplansforacropdiversificationProgramme and accordingly planting of oil palm hasbeen commenced in an extent of 36.45 hectares onMabopitiya,Parambe&IlwanaDivisionsduringthe2017/2018season.ThisProgrammewillbecontinuedinthefollowingextents.
Year2018/201936.18hectaresYear2019/20109.68hectares
Past Achievements
1. Year 1999 obtained in the Taiki Akimoto 5SAwardCompetition1999conductedbyJapanSriLankaTechnical&CulturalAssociation(JASTECA)in association with the Ministry of IndustrialDepartmentSriLankaundertheSuperintendentofMr.GLHDAmaratunge.
2. Plantation Awards 2010 organized by ArpicoGroup, Lowest Waste Category, Rubber Sector– under the Superintendent of Mr. AsankaJayathilake.
3. ForthethirdhighestqualitysoldthroughMessrs.JohnKeellsPLCintheyear2013of298,080kgsofrubber–undertheSuperintendentofMr.AsankaJayathilake.
4. ForthethirdhighestqualitysoldthroughMessrs.JohnKeellsPLCintheyear2016of273,957kgsofrubber.–undertheSuperintendentofMr.NalakaMadawala.
Mr. Richard Laveson LevettSuperintendent (1955-1967)

Kegalle Plantations PLC A n n u a l R e p o r t 2 0 1 6 - 1 7
141
Supirintendent’s Bunglow
Parambe Factory
Estate Office
Bridge between Village and Factory Constructed in 1897

Kegalle Plantations PLC A n n u a l R e p o r t 2 0 1 6 - 1 7
142
1. Stock Exchange Listing
TheissuedOrdinarySharesofKegallePlantationsPLC,arelistedwithColomboStockExchange(CSE)ofSriLanka(Quoted1996.01.08).
2. Distribution of Shareholders
No of Shares Held 2017No of Share Holders
2017No of Shares
2017% Holdings
2016% Holdings
1- 1,0001,001- 10,00010,001-100,000100,001-1,000,0001,000,001-&above
8,6363063961
1,857,4871,051,2401,099,2201,221,57719,770,477
7.43%4.20%4.40%4.89%79.08%
7.52%4.21%4.09%5.10%79.08%
Total 8,988 25,000,001 100.00% 100.00%
ResidentInvestorsNonResidentInvestors
8,96622
24,351,508648,493
97.41%2.59%
97.41%2.59%
Total 8,988 25,000,001 100.00% 100.00%
IndividualInvestorsInstitutionalInvestors
8,89098
3,489,62921,510,372
13.96%86.04%
14.06%85.94%
Total 8,988 25,000,001 100.00% 100.00%
RelatedCompanyCompanyDirectorsHoldingGeneralPublicincludingEmployees
31
8,984
19,783,8773,307
5,212,817
79.14%0.01%20.85%
79.14%0.01%20.85%
Total 8,988 25,000,001 100.00% 100.00%
Public Holding: The percentage of shares held by the public is 20.85% of the issued Share Capital of the Company as at 31 March 2017 (31 March 2016 – 20.85%).
3. The Golden Shareholder
TheGoldenShareofRs.10/-iscurrentlyheldbytheSecretarytotheTreasuryandshouldbeownedeitherdirectlybytheGovernmentofSriLankaorbya100%GovernmentownedPublicCompany.Inadditiontotherightsofthenormalordinaryshareholder,theGoldenShareholderhasthefollowingrights;
1) TheconcurrenceoftheGoldenShareholderwillberequiredfortheCompanytosubleaseanyoftheestatelandleased/tobeleasedtotheCompanybytheJanathaEstateDevelopmentBoard/SriLankaStatePlantations.
2) TheconcurrenceoftheGoldenShareholderwillberequiredtoamendanyclauseinthearticleofassociationoftheCompanywhichgrantsspecialrightstotheGoldenShareholder.
3) TheGoldenShareholderorhisnomineewillhavetherighttoexaminethebooksandaccountsoftheCompanyatanytimewithtwoweeksofwrittennotice.
4) TheCompanywillberequiredtobesubmittedadetailedquarterlyaccountsreporttotheGoldenShareholderinaspecifiedformatwithin60daysoftheendofeachquarter.AdditionalinformationrelatingtotheCompanyina
SHAREHOLDER & INVESTOR INFORMATION
Supplementary Reports | Shareholder & Investor Information Shareholder & Investor Information | Supplementary Reports
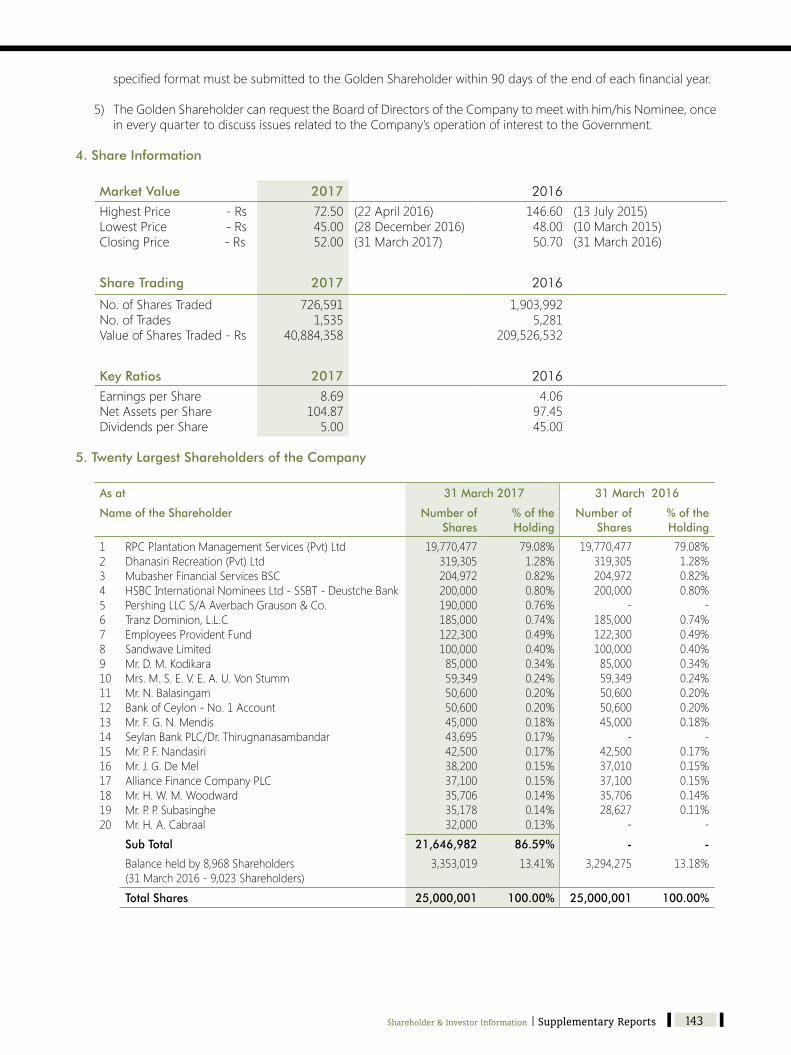
Kegalle Plantations PLC A n n u a l R e p o r t 2 0 1 6 - 1 7
143
specifiedformatmustbesubmittedtotheGoldenShareholderwithin90daysoftheendofeachfinancialyear.
5) TheGoldenShareholdercanrequesttheBoardofDirectorsoftheCompanytomeetwithhim/hisNominee,onceineveryquartertodiscussissuesrelatedtotheCompany’soperationofinteresttotheGovernment.
4. Share Information
Market Value 2017 2016
HighestPrice -RsLowestPrice -RsClosingPrice -Rs
72.5045.0052.00
(22April2016)(28December2016)(31March2017)
146.6048.0050.70
(13July2015)(10March2015)(31March2016)
Share Trading 2017 2016
No.ofSharesTradedNo.ofTradesValueofSharesTraded-Rs
726,5911,535
40,884,358
1,903,9925,281
209,526,532
Key Ratios 2017 2016
EarningsperShareNetAssetsperShareDividendsperShare
8.69104.875.00
4.0697.4545.00
5. Twenty Largest Shareholders of the Company
As at 31 March 2017 31 March 2016
Name of the Shareholder Number of Shares
% of the Holding
Number of Shares
% of the Holding
1234567891011121314151617181920
RPCPlantationManagementServices(Pvt)LtdDhanasiriRecreation(Pvt)LtdMubasherFinancialServicesBSCHSBCInternationalNomineesLtd-SSBT-DeustcheBankPershingLLCS/AAverbachGrauson&Co.TranzDominion,L.L.CEmployeesProvidentFundSandwaveLimitedMr.D.M.KodikaraMrs.M.S.E.V.E.A.U.VonStummMr.N.BalasingamBankofCeylon-No.1AccountMr.F.G.N.MendisSeylanBankPLC/Dr.ThirugnanasambandarMr.P.F.NandasiriMr.J.G.DeMelAllianceFinanceCompanyPLCMr.H.W.M.WoodwardMr.P.P.SubasingheMr.H.A.Cabraal
19,770,477319,305204,972200,000190,000185,000122,300100,00085,00059,34950,60050,60045,00043,69542,50038,20037,10035,70635,17832,000
79.08%1.28%0.82%0.80%0.76%0.74%0.49%0.40%0.34%0.24%0.20%0.20%0.18%0.17%0.17%0.15%0.15%0.14%0.14%0.13%
19,770,477319,305204,972200,000
-185,000122,300100,00085,00059,34950,60050,60045,000
-42,50037,01037,10035,70628,627
-
79.08%1.28%0.82%0.80%
-0.74%0.49%0.40%0.34%0.24%0.20%0.20%0.18%
-0.17%0.15%0.15%0.14%0.11%
-
Sub Total 21,646,982 86.59% - -
Balanceheldby8,968Shareholders(31March2016-9,023Shareholders)
3,353,019 13.41% 3,294,275 13.18%
Total Shares 25,000,001 100.00% 25,000,001 100.00%
Shareholder & Investor Information | Supplementary Reports
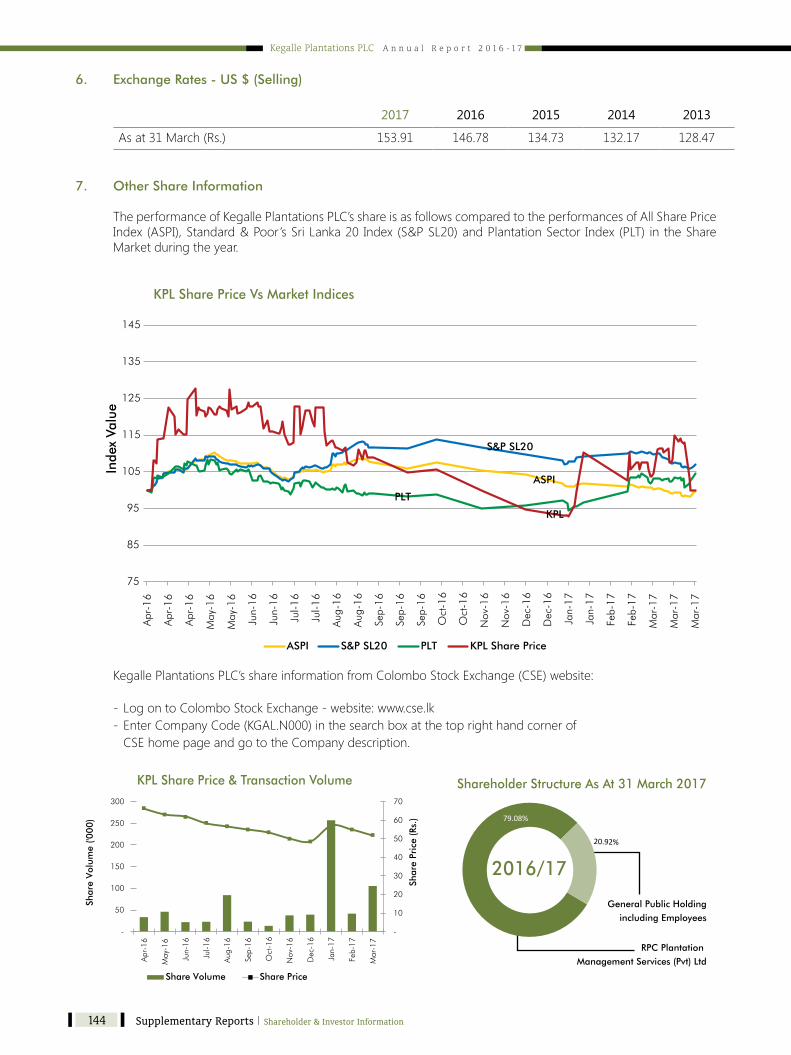
Kegalle Plantations PLC A n n u a l R e p o r t 2 0 1 6 - 1 7
144
6. Exchange Rates - US $ (Selling)
2017 2016 2015 2014 2013
Asat31March(Rs.) 153.91 146.78 134.73 132.17 128.47 7. Other Share Information
TheperformanceofKegallePlantationsPLC’sshareisasfollowscomparedtotheperformancesofAllSharePriceIndex(ASPI),Standard&Poor’sSriLanka20Index(S&PSL20)andPlantationSector Index(PLT) intheShareMarketduringtheyear.
KegallePlantationsPLC’sshareinformationfromColomboStockExchange(CSE)website:
-LogontoColomboStockExchange-website:www.cse.lk -EnterCompanyCode(KGAL.N000)inthesearchboxatthetoprighthandcornerof
CSEhomepageandgototheCompanydescription.
Shareholder Structure As At 31 March 2017
RPC Plantation Management Services (Pvt) Ltd
General Public Holdingincluding Employees
Share Volume Share Price
-
10
20
30
40
50
60
70
-
50
100
150
200
250
300
Apr
-16
May
-16
Jun-
16
Jul-1
6
Aug
-16
Sep-
16
Oct
-16
Nov
-16
Dec
-16
Jan-
17
Feb-
17
Mar
-17
Shar
e Pr
ice
(Rs.
)
Shar
e V
olum
e ('0
00
)
KPL Share Price & Transaction Volume
79.08%
2016/17
20.92%
75
85
95
105
115
125
135
145
Apr
-16
Apr
-16
Apr
-16
May
-16
May
-16
Jun-
16
Jun-
16
Jul-1
6
Jul-1
6
Aug
-16
Aug
-16
Sep-
16
Sep-
16
Sep-
16
Oct
-16
Oct
-16
Nov
-16
Nov
-16
Dec
-16
Dec
-16
Jan-
17
Jan-
17
Feb-
17
Feb-
17
Mar
-17
Mar
-17
Mar
-17
Inde
x Va
lue
KPL Share Price Vs Market Indices
ASPI
ASPI
S&P SL20
S&P SL20
PLT
PLT
KPL Share Price
KPL
Supplementary Reports | Shareholder & Investor Information Glossary of Financial Terminology | Supplementary Reports
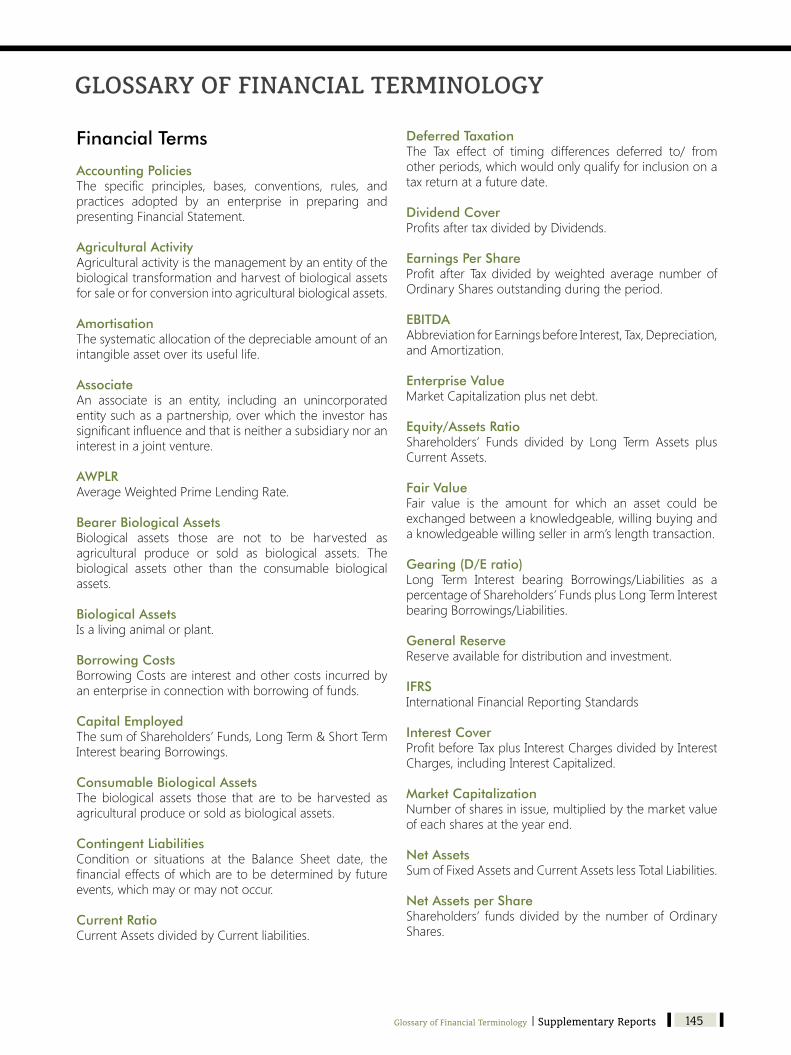
Kegalle Plantations PLC A n n u a l R e p o r t 2 0 1 6 - 1 7
145
Financial Terms
Accounting PoliciesThe specific principles, bases, conventions, rules, andpractices adopted by an enterprise in preparing andpresentingFinancialStatement.
Agricultural ActivityAgriculturalactivityisthemanagementbyanentityofthebiologicaltransformationandharvestofbiologicalassetsforsaleorforconversionintoagriculturalbiologicalassets.
AmortisationThesystematicallocationofthedepreciableamountofanintangibleassetoveritsusefullife.
AssociateAn associate is an entity, including an unincorporatedentitysuchasapartnership,overwhichtheinvestorhassignificantinfluenceandthatisneitherasubsidiarynoraninterestinajointventure.
AWPLRAverageWeightedPrimeLendingRate.
Bearer Biological AssetsBiological assets those are not to be harvested asagricultural produce or sold as biological assets. Thebiological assets other than the consumable biologicalassets.
Biological AssetsIsalivinganimalorplant.
Borrowing CostsBorrowingCostsareinterestandothercostsincurredbyanenterpriseinconnectionwithborrowingoffunds.
Capital EmployedThesumofShareholders’Funds,LongTerm&ShortTermInterestbearingBorrowings.
Consumable Biological AssetsThe biological assets those that are to be harvested asagriculturalproduceorsoldasbiologicalassets.
Contingent LiabilitiesCondition or situations at the Balance Sheet date, thefinancialeffectsofwhicharetobedeterminedbyfutureevents,whichmayormaynotoccur.
Current RatioCurrentAssetsdividedbyCurrentliabilities.
Deferred TaxationThe Tax effect of timing differences deferred to/ fromother periods, which would only qualify for inclusion on a taxreturnatafuturedate.
Dividend CoverProfitsaftertaxdividedbyDividends.
Earnings Per ShareProfit after Taxdividedbyweighted averagenumberofOrdinarySharesoutstandingduringtheperiod.
EBITDAAbbreviationforEarningsbeforeInterest,Tax,Depreciation,andAmortization.
Enterprise ValueMarketCapitalizationplusnetdebt.
Equity/Assets RatioShareholders’ Funds divided by Long Term Assets plusCurrentAssets.
Fair ValueFair value is the amount for which an asset could beexchangedbetweenaknowledgeable,willingbuyingandaknowledgeablewillingsellerinarm’slengthtransaction.
Gearing (D/E ratio)Long Term Interest bearing Borrowings/Liabilities as apercentageofShareholders’FundsplusLongTermInterestbearingBorrowings/Liabilities.
General ReserveReserveavailablefordistributionandinvestment.
IFRSInternationalFinancialReportingStandards
Interest CoverProfitbeforeTaxplusInterestChargesdividedbyInterestCharges,includingInterestCapitalized.
Market CapitalizationNumberofsharesinissue,multipliedbythemarketvalueof each shares at the year end.
Net AssetsSumofFixedAssetsandCurrentAssetslessTotalLiabilities.
Net Assets per ShareShareholders’ fundsdividedby thenumberofOrdinaryShares.
Glossary of Financial Terminology | Supplementary Reports
GLOSSARY OF FINANCIAL TERMINOLOGY
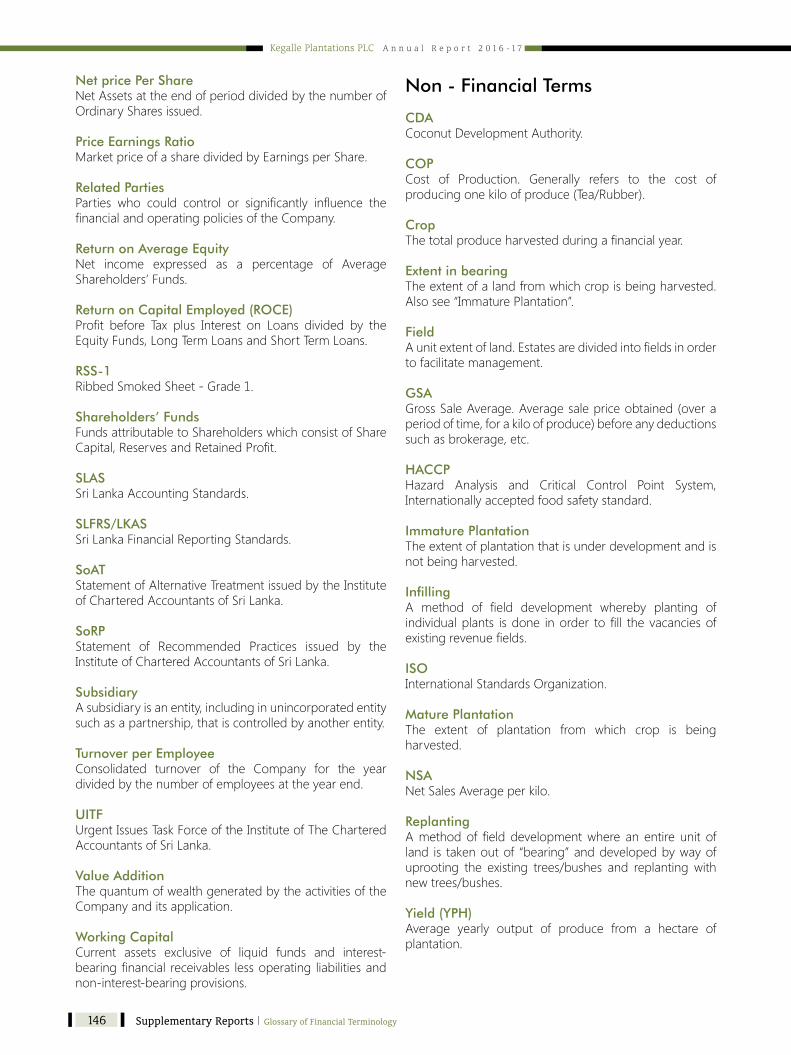
Kegalle Plantations PLC A n n u a l R e p o r t 2 0 1 6 - 1 7
146
Net price Per ShareNetAssetsattheendofperioddividedbythenumberofOrdinarySharesissued.
Price Earnings RatioMarketpriceofasharedividedbyEarningsperShare.
Related PartiesParties who could control or significantly influence thefinancialandoperatingpoliciesoftheCompany.
Return on Average EquityNet income expressed as a percentage of AverageShareholders’Funds.
Return on Capital Employed (ROCE)Profit before Tax plus Interest on Loans divided by theEquityFunds,LongTermLoansandShortTermLoans.
RSS-1RibbedSmokedSheet-Grade1.
Shareholders’ FundsFundsattributabletoShareholderswhichconsistofShareCapital,ReservesandRetainedProfit.
SLASSriLankaAccountingStandards.
SLFRS/LKASSriLankaFinancialReportingStandards.
SoATStatementofAlternativeTreatmentissuedbytheInstituteofCharteredAccountantsofSriLanka.
SoRPStatement of Recommended Practices issued by theInstituteofCharteredAccountantsofSriLanka.
SubsidiaryAsubsidiaryisanentity,includinginunincorporatedentitysuchasapartnership,thatiscontrolledbyanotherentity.
Turnover per EmployeeConsolidated turnover of the Company for the yeardividedbythenumberofemployeesattheyearend.
UITFUrgentIssuesTaskForceoftheInstituteofTheCharteredAccountantsofSriLanka.
Value AdditionThequantumofwealthgeneratedbytheactivitiesoftheCompanyanditsapplication.
Working CapitalCurrent assets exclusive of liquid funds and interest-bearingfinancial receivables lessoperating liabilitiesandnon-interest-bearingprovisions.
Non - Financial Terms
CDACoconutDevelopmentAuthority.
COPCost of Production. Generally refers to the cost ofproducingonekiloofproduce(Tea/Rubber).
CropThetotalproduceharvestedduringafinancialyear.
Extent in bearingTheextentofalandfromwhichcropisbeingharvested.Alsosee“ImmaturePlantation”.
FieldAunitextentofland.Estatesaredividedintofieldsinordertofacilitatemanagement.
GSAGrossSaleAverage.Averagesalepriceobtained(overaperiodoftime,forakiloofproduce)beforeanydeductionssuchasbrokerage,etc.
HACCPHazard Analysis and Critical Control Point System,Internationallyacceptedfoodsafetystandard.
Immature PlantationTheextentofplantationthatisunderdevelopmentandisnotbeingharvested.
InfillingA method of field development whereby planting ofindividualplants isdone inorder tofill thevacanciesofexistingrevenuefields.
ISOInternationalStandardsOrganization.
Mature PlantationThe extent of plantation from which crop is beingharvested.
NSANetSalesAverageperkilo.
ReplantingAmethodof field developmentwhere an entire unit ofland is takenoutof “bearing”anddevelopedbywayofuprooting the existing trees/bushes and replanting withnewtrees/bushes.
Yield (YPH)Average yearly output of produce from a hectare ofplantation.
Supplementary Reports | Glossary of Financial Terminology Notice of Meeting | Supplementary Reports

Kegalle Plantations PLC A n n u a l R e p o r t 2 0 1 6 - 1 7
147
NOTICE OF MEETINGNOTICE ISHEREBYGIVENthattheTwentyFourth(24th)AnnualGeneralMeetingofKegallePlantationsPLCwillbeheldattheRegisteredOffice,No.310,HighLevelRoad,Nawinna,MaharagamaonFriday,30June2017at10.00a.m.andthebusinesstobebroughtbeforethemeetingwillbeasfollows;
1. ToconsidertheReportoftheDirectorsandtheStatementofAccountsfortheyearended31March2017withtheReportoftheAuditorsthereon.
2. ToapprovetheappointmentofDr.SenaYaddehigeasaDirector
PursuanttoSection211oftheCompaniesActNo.07of2007,aNoticeofthefollowingOrdinaryResolutionhasbeenreceivedbytheCompany,fromRPCPlantationManagementServices(Private)Limited,310,HighLevelRoad,Nawinna,Maharagama,ashareholderoftheCompany.
“ThatDr.SenaYaddehigeofLeNeuf,Chemin,St.Saviours,Guernsey,UnitedKingdomwhois71yearsofagebeandisherebyappointedaDirectoroftheCompanyintermsofsection211oftheCompaniesActNo.07of2007,anditisfurtherspeciallydeclaredthattheagelimitof70yearsreferredtoinSection210oftheCompaniesActno.07of2007shallnotapplytothesaidDr.SenaYaddehige”
3. ToapprovetheappointmentofDr.GerryJayawardenaasaDirector
PursuanttoSection211oftheCompaniesActNo.07of2007,aNoticeofthefollowingOrdinaryResolutionhasbeenreceivedbytheCompany,fromRPCPlantationManagementServices(Private)Limited,310,HighLevelRoad,Nawinna,Maharagama,ashareholderoftheCompany.
“ThatDr.GerryJayawardenaofNo.134,Batagama(North)Ja-Ela,whois74yearsofagebeandisherebyappointedaDirectoroftheCompanyintermsofsection211oftheCompaniesActNo.07of2007,anditisfurtherspeciallydeclaredthattheagelimitof70yearsreferredtoinSection210oftheCompaniesActNo.07of2007shallnotapplytothesaidDr.GerryJayawardena”
4. Tore-electMr.SunilPoholiyaddewhoretiresbyrotationintermsofArticle92attheAnnualGeneralMeeting,aDirector.
5. Tore-appointMessrs.Ernst&Young,CharteredAccountantsasAuditorsoftheCompanyandtoauthorizetheDirectorsto determine their remuneration.
6. ToauthorizetheDirectorstodeterminecontributionstocharities.
7. Toconsideranyotherbusinessofwhichduenoticehasbeengiven.
ByOrderoftheBoard
(Sgd.)RichardPierisGroupServices(Private)LimitedSecretaries
No.310,HighLevelRoad,Nawinna,Maharagama.
31May2017
Notes:
a) Amemberentitledtoattendandvoteatthemeetingisentitledtoappointaproxytoattendandvoteinsteadofhim/her.
b) AproxyneednotbeamemberoftheCompany.TheformofproxywillbefoundinsertedintheAnnualReport.
c) ThecompletedformofproxyshouldbedepositedatNo.310,HighLevelRoad,Nawinna,Maharagama.notlessthan48hoursbeforethetimeappointedfortheholdingofthemeeting.
Notice of Meeting | Supplementary Reports

Kegalle Plantations PLC A n n u a l R e p o r t 2 0 1 6 - 1 7
148
NOTES
Supplementary Reports | Notes Form of Proxy | Supplementary Reports
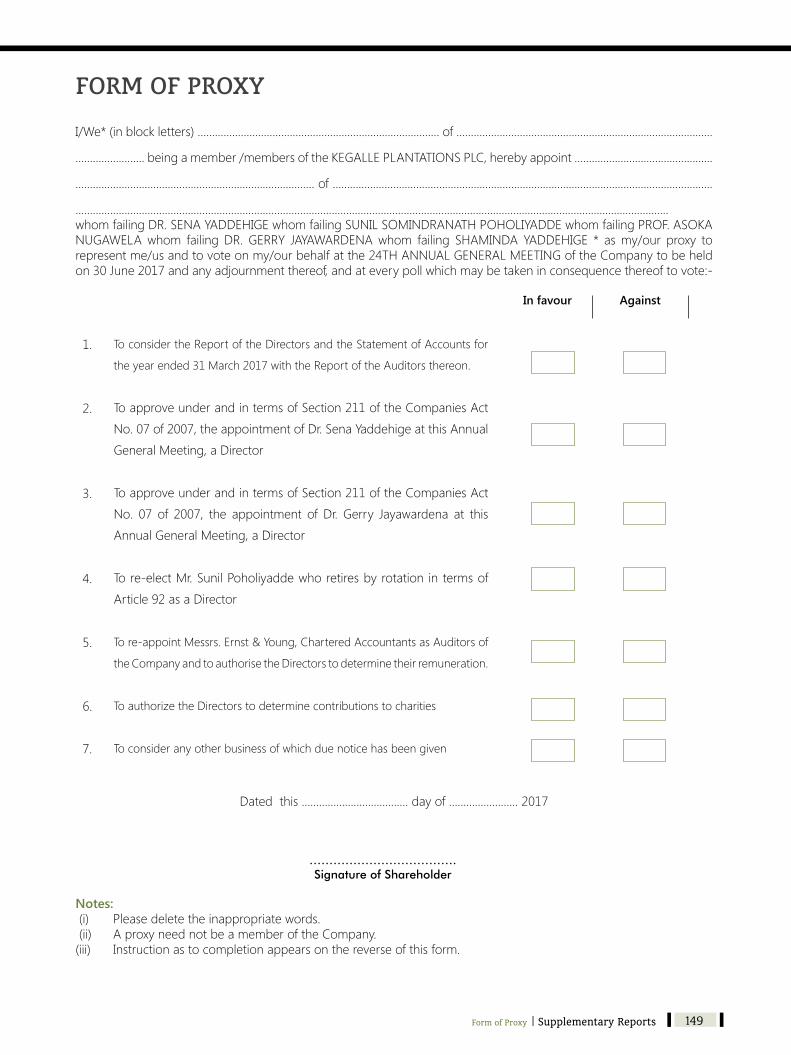
Kegalle Plantations PLC A n n u a l R e p o r t 2 0 1 6 - 1 7
149
I/We*(inblockletters).……………..………………………………….……………..………of….…………………………….……………………………………………
……………………beingamember/membersoftheKEGALLEPLANTATIONSPLC,herebyappoint…………………………………………
….…….………………………………………………………………of………………………………………………….………………………………………………………………..
..........................................................................................................................................................................................................….whomfailingDR.SENAYADDEHIGEwhomfailingSUNILSOMINDRANATHPOHOLIYADDEwhomfailingPROF.ASOKANUGAWELAwhom failingDR. GERRY JAYAWARDENAwhom failing SHAMINDA YADDEHIGE * asmy/our proxy torepresentme/usandtovoteonmy/ourbehalfatthe24THANNUALGENERALMEETINGoftheCompanytobeheldon30June2017andanyadjournmentthereof,andateverypollwhichmaybetakeninconsequencethereoftovote:-
In favour Against
1.
2.
3.
4.
5.
6.
7.
ToconsidertheReportoftheDirectorsandtheStatementofAccountsfor
theyearended31March2017withtheReportoftheAuditorsthereon.
ToapproveunderandintermsofSection211oftheCompaniesActNo.07of2007,theappointmentofDr.SenaYaddehigeatthisAnnualGeneralMeeting,aDirector
ToapproveunderandintermsofSection211oftheCompaniesActNo. 07 of 2007, the appointment of Dr. Gerry Jayawardena at thisAnnualGeneralMeeting,aDirector
Tore-electMr.SunilPoholiyaddewhoretiresbyrotation intermsofArticle92asaDirector
Tore-appointMessrs.Ernst&Young,CharteredAccountantsasAuditorsof
theCompanyandtoauthorisetheDirectorstodeterminetheirremuneration.
ToauthorizetheDirectorstodeterminecontributionstocharities
Toconsideranyotherbusinessofwhichduenoticehasbeengiven
Datedthis……………………………….dayof……………………2017
……………………………….Signature of Shareholder
Notes: (i) Pleasedeletetheinappropriatewords.(ii) AproxyneednotbeamemberoftheCompany.(iii) Instructionastocompletionappearsonthereverseofthisform.
FORM OF PROXY
Form of Proxy | Supplementary Reports
Kegalle Plantations PLC A n n u a l R e p o r t 2 0 1 6 - 1 7
150
INSTRUCTIONS AS TO COMPLETION OF PROXY FORM
● Tobevalid,thisFormofProxymustbedepositedatNo.310,HighLevelRoad,Nawinna,Maharagama.,notlaterthan10.00a.m.onWednesday,28June2017.
● InperfectingtheFormofProxy,pleaseensurethatalldetailsarelegible.
● InthecaseofaCompany/Corporation,theproxymustbeunderitsCommonSeal,whichshouldbeaffixedandattestedinthemannerprescribedbyitsArticlesofAssociation.
● Pleaseindicatewithan‘X’inthespaceprovidedhowyourproxyistovoteoneachresolution.Ifnoindicationisgiventheproxyathis/herdiscretionwillvoteashe/shethinksfit.
● ThisFormofProxyshallinthecaseofanindividualbesignedbytheappointororhis/herAttorney.WheretheFormofProxyissignedunderaPowerofAttorney,whichhasnotbeenregisteredwiththeCompany,theoriginalPowerofAttorneytogetherwithaphotocopyofsameoracopycertifiedbyaNotaryPublicmustbelodgedwiththeCompany,alongwiththeFormofProxy.
Supplementary Reports | Instructions as to completion of Proxy Form

Kegalle Plantations PLC A n n u a l R e p o r t 2 0 1 6 - 1 7
CORPORATE INFORMATION
NameoftheCompany : KEGALLEPLANTATIONSPLC
LegalForm : AQuotedPublicCompanywithlimitedliability,IncorporatedinSriLankaundertheCompaniesActNo.07of2007.
DateofIncorporation : 22June1992
CompanyRegistrationNo : NewregistrationNo.PQ135[OldNo.N(PBS/CGB)140]
Head/RegisteredOffice : No.310,HighLevelRoad,Nawinna,Maharagama,SriLanka.
PrincipalBusinessActivities : Cultivation,ManufactureandSaleofRubber,Tea,Coconut,Cardamom&otheragriculturalProduce.
UltimateParentEnterprise : RichardPieris&CompanyPLCNo.310,HighLevelRoad,Nawinna,Maharagama,SriLanka.
BoardofDirectors : Dr.SenaYaddehigeMr.SSPoholiyaddeProf.RCWMRANugawelaDr.SSBDGJayawardenaMr.ShamindaYaddehige
StockExchangeListing : TheOrdinarySharesoftheCompanyarelistedwiththeColomboStockExchangeofSriLanka.
Management : Mr.SSPoholiyaddeMr.SriyanEriyagamaMr.SudheeraEpitakumburaMr.ISDoranegamaMr.TIKodithuwakkuMr.RMSSHerath
Secretaries : RichardPierisGroupServices(Pvt)LimitedNo.310,HighLevelRoad,Nawinna,Maharagama,SriLankaTelephone:+(94)114310500
Auditors : Messrs.Ernst&Young,CharteredAccountants,201,DeSaramPlace,Colombo10.
Bankers : NationalDevelopmentBankPLCBankofCeylon-CorporateBranch&RegionalBranchesHattonNationalBankPLCPeoplesBankSeylanBankPLCCommercialBankofCeylonPLCIndianOverseasBank/IndianBank/StateBankofIndiaNationsTrustBankPLC
ContactDetails : TelephoneFacsimileWebsiteE-mail
-Chairman-Director-Director-Director-Director
-ManagingDirector-Plantations-ActingChiefExecutiveOfficer(Appointedw.e.f.01January2017)-FinancialController-GeneralManager-Accountant-Manager-InformationSystems
:+(94)114310500:+(94)114310799:www.arpico.com:[email protected]

ANNUAL REPORT 2016 / 2017
KEGALLE PLANTATIONS PLC
Kegalle Plantations PLC
Kegalle Plantations PLC
No. 310, High Level Road, Nawinna, Maharagama, Sri Lanka.Tel : +94 11 4310500Fax : +94 11 4310799Website : www.arpico.comEmail : [email protected]
An
nual Report 2016 / 2017