kenya food and nutrition policy - world bank
TRANSCRIPT
Report No. 8351-KE
KenyaFood and Nutrition PolicyA World Bank Sector Report
March 15, 1991
Agriculture Operations DivisionEastern Africa Department
FOR OFFICIAL USE ONLY
fot0 c . , e--i ..d. .
* e | 5 ._ _ _ . h irof e .. : . , . ; O ' t X
- S .0 ; 0 ,l
4 4 . & p o a e - ' 9 ft
' ediso oedf withe W V.ord Bank ao n,
This document basa r#tittd litrIbuton ai ai b~ wn 14' be ;sdIcpe
'-n -h pe.;ormaice of teir fMld 4dq;ie. 1$ a*ets m r tthe.w,be disclosed without Worlid Bank autho@iation.. -..
Pub
lic D
iscl
osur
e A
utho
rized
Pub
lic D
iscl
osur
e A
utho
rized
Pub
lic D
iscl
osur
e A
utho
rized
Pub
lic D
iscl
osur
e A
utho
rized
Pub
lic D
iscl
osur
e A
utho
rized
Pub
lic D
iscl
osur
e A
utho
rized
Pub
lic D
iscl
osur
e A
utho
rized
Pub
lic D
iscl
osur
e A
utho
rized
CURRENCY AND EXCHANGE RATES a/
Currency Unit X Kenya Shilling (KSh)and Pound (KX)
KSh 20 - KE 1.0KSh 1.00 - USS 0.0415 (as of December 31, 1990)USS 1.00 X KSh 24.084 (as of December 31, 1990)US$ 1.00 0.703 SDR (as of December 31, 1990)
a/ Since August 1985, the Kenya Shilling has been pegged to a Easket ofthe currencies of its main trading partners. The rate vis-a-vis the USDollar fluctuates. A rate of USS 1 - Ksh 18.5 has been used in this Reportfor figures related to 1988 constant prices.
FISCAL YEAR
July 1 - June 30
ABBREVIATIONS AND ACRONYMS
AFC Agricultural Finance CorporationAMREF African Medical and Research FoundationASAL Arid and Semi Arid LandsASAO Agriculture Sector Adjustment OperationCBS Central Bureau of StatisticsCHANIS Child Health and Nutrition Information SystemCRS Catholic Relief ServicesFAO Food and Agricultural Organization of the United NationsFNPU Food and Nutrition Planning UnitFOMCOS Food Monitoring and Control SystemGOK Government of KenyaIFPRI International Food Policy Research InstituteKCC Kenya Cooperative CreameriesKREMU Kenya Rangeland Ecological Monitoring UnitKRCS Kenya Red Cross SocietyMADIA Managing Agricultural Development In AfricaMCK Maternal and Child HealthMOA Ministry of AgricultureMOCD Ministry of Cooperative DevelopmentMOF Ninistry of FinanceMOLD Ministry of Livestock DevelopmentMPND Ministry of Planning and National DevelopmentNCPB National Cereals and Produce BoardNGOs Non-Governmental OrganizationsNSFCK National School Feeding Council of KenyaOP Office of the PresidentOXFAM Oxford Famine ReliefPEM Protein Energy MalnutritionUNICEF United Nations Children's FundUSAID United States Agency for International DevelopmentWFP World Food Programme of the United NationsWHO World Health organization of the United Nations
This report was prepared by Graeme Donovan (AF2AG), based on work of NeilCherry, Nadine Horenstein, Albert Keidel, Betty Mlingi, and Bengt Nekby(Consultants). It reflects comments made by the Government during 1990.
FOR OMCIAL ONLY
KENYA: FOOD AND NUTRITIONPOLICY
TABLE OF CONTENTS
Page No.
SUMMARY AND RECOMMENDATIONS i - xii
CHAPTER I: FGJD PRODUCTION AND SUPPLY 1
Trends In Food Production 1Food Exports and Imports 2Food Availability 6Regional & Seasonal Problems In Food Availability 10National Food Policy 19The Drought of 1984 21Responses to the Drought 24Lessons from the Drought Experience 26
Forward Planning 26Foreign Exchange, and Commercial Imports 27Role of NGOa 28Job Creation Programs 29Infrastructure 30Seed Supplies 31Grain Stocks 31Price Differentials 33
CHAPTER II: FOOD. NUTRITION AND INCOMES 34
Nutritional Status 34Discussion of the Nutritional Situation 40
Lack of Knowledge 40Disease 41
Income and Expenditure 44Prices and Prico Fluctuations 53Women, Food and Nutrition 57Arid and Semi-Arid Areas 58Discussion - Food Poverty 59Poverty Profiles 62The Government's Emerging Policy 63
CHAPTER III: POLICIES, PROGRAMS AND STUDIES 64
Economic Growth 67Population Growth 68Evolution of Policy 69
Public Provision for the Poor 69Agricultural Exports and Food Self-Sufficiency 70Grain Marketing & Targetted Subsidies 73Arid and Semi-Arid Lands 76
Towards An Action Plan 76Infrastructure and Public Works 77Food Aid 79Enhancing Women's Opportunities 83
This document has a restricted distribution and may be used by recipients only in the performanceIof their official duties. Its contents may not otherwise be disclosed without World Bank authorization.
Health Services and Nutrition Interventions 85Early Warning Systems 86Towards Reliable Statistics 87Institutional Changes 87
Bibliography 88
Tables in Text
1.01 Production Of Major Foods, 1977/78-1987/88 31.02 Trade In M-ajor Food Products, 1977-1988 41.03 Food Balance Sheet, 1987/88 71.04 Food Balances Compared - 1977-81 and 1987/88 81.05 Share Of Maize Production & Consumption By Province 141.06 NCPB Purchases & Salee Of Maize By District, 1981/82 151.07 Food Relief Allocations, 1973-83 161.08 Food Production 1988/89 Compared With Projected Needs 201.09 Long Rains, 1984 221.10 Coffee & Tea - Value Of Exports, 1982-1985 231.11 Retail Maize Prices, 1984 251.12 Movements of Cereals From Mombasa Up-Country, 1984/85 302.01 Distribution Of Stunted Children By Province, 1990 362.02 Distribution Of Stunted Children By District, 1982 372.03 Child Nutrition, Mortality, and Mothers, Education 382.04 Children's Undernutrition By Age Groups, 1982 422.05 Structure Of Rural Household Economy, 1981-82 452.06 Rural Household Budgets, 1981-82 472.07 Rural Household Expenditures, 1981-82 482.08 Food Poverty By Province, 1981-82 502.09 Rural Household Net Income By Sources, 1981-82 512.10 Rural & Urban Income Distribution, 1981-82 522.11 Average Retail Consumer Prices In Nairobi, 1980-1989 543.01 Major Agricultural Exports and Imports, 1977-88 72
Figures in Text
1 Maize Production & Trade, 1976/77-1988/89 52 Districts Of Kenya 113 Rainfall Patterns 124 Relation Between Cultivation Areas & Semi-Arid & Arid
Zones, 1982 135 Maize Price Variations In Towns Of Thika & Kandara 55
SUMMARY AND RECOMMENDATIONS
1. Kenya has achieved creditable growth during the 1980e, both inagriculture and in the general economy; without this good performance, themagnitudes of poverty and food insecurity would be much greater than they aretoday. This growth was the more creditable inasmuch as it took place in thecontext of international economic events which were often adverse, and thedisciplines of structural adjustment in which Kenya has been engaged.Furthermore, the country came through a very serious drought with considerablesuccess. Few other countries did as well under similar circumstances. Thegrowth which has been achieved in spite of these and other difficulties haspositioned Kenya more favorably for the challenging next stages in itseconomic development.
2. Creditable though it was, the growth of the 1980. has not beenfast enough to get ahead of the very rapid increase in population. In realterms, there was no measurable upward trend in either GNP per capita or modernsector wage earnings over the 1980-1989 period. As a result, the proportionof households with low levels of living has not been reduced during thisperiod of otherwise valuable growth. This continuing poverty, especially inrural areas, is one of the root causes of the very significant level ofchronic food poverty in the country. The continuing problems are ahown bys
= an estimate that more than 1.25 million children under five years of ageare stunted, as a result of undernourishment over an extended period,especially during the first two years of life;
= an estimate that more than 20% of rural households, containing more than3 million persons, do not have enough income to secure for themselves aminimum nutritional diet;
- failure to achieve planned increases in domestic food availability percapita, combined with food exports, reflecting among other thingslimited purchasing power on the part of lower income households.
3. In the absence of sustained growth in the incomes of those in thepooreat groups of households, these problems are capable only of partialsolution. The main sources of such income growth will be faster developmentof agriculture itself, reaching the smallest farmers, and productiveemployment opportunities outside agriculture, especially in rural areas, whichwill gradually reduce the proportion of the labor force engaged inagriculture. Within the context of such economic and agricultural growth,however, there is a need for specific interventions to address food povertymore directly. Experience from other countries shows that considerableadvances can be made without waiting for incomes to rise. This reportanalyzes factors which contribute to food poverty, and attempts to answerquestions regarding the groups of persons most likely to experience it, wherethey are located, and what sorts of interventions may be needed to addresstheir problems.
- ii -
THE FOOD AND NUTRMON PROBLEM
4. The three Child Nutrition Surveys of 1977, 1978/79 and 1982 showedthat the proportion of children under five years of age who were stunted wasincreasJng, as were the absolute numbers of those affected. Whether thpincrease in this proportion has continued will be shown by analysis of afurther survey carried out in 1987, whose results should be released soon.There is little reason to expect that the levels of stunting have declinedbetween 1982 and 1987. The stunting is evidence of chronic undernutrition,resulting from a combination of poverty, disease, and lack of knowledge.
5. Half of the stunted children were in seven Districts: Kilifi,Kisii, Kakamega, Machakos, South Nyanza, Nakuru and Siaya. Although the ratesof stunting were highest in Coast Province, the largest numbers were inNyanza, where the mortality rate for children in the first five years of lifewas greater than one in five. An estimated one third of childhood deaths inKenya have undernutrition as a contributing factor. Noting that Provincialmortality rates were consistent with ranking of Provinces by nutritionalstatus, the Government's report noted: "Most children die of multiplecauses...the combined process of poor diets and multiple recurrent infectionswhich cumulatively retard growth, lead to wasting and progressively wear downthe resistance of the child. The child is on the road to death..."Furthermore, "the young child faces much higher risks in rural than in urbanareas and...these risks have not declined over time."
6. The correlation of nutritional status, mortality and mothers'education is striking. Lack of knowledge as a factor contributing toundernutrition shows up especially in poor feeding practices during pregnancyand weaning. The practice of restricting food intake during the thirdtrimester of pregnancy in order to limit the size of the newborn appears to berelatively widespread, although it seems to result in a lower prevalence oflow birth weight than would be expected. The main period where undernutritionoccurs in childhood is clearly between the ages of 6 and 24 months, and isassociated closely with poor weaning practices. Prolonged breast feeding isoften accompanied by a late start to supplemental feeding, and inadequate orcontaminated supplementary foods.
7. The most important diseases having an effect on the nutritionalstatus of children are diarrhoeal illnesses, intestinal parasites, measles andmalaria. At least one third of Kenya's children suffer from anaemia. This isalso a special problem for pregnant arid lactating women. The nutritionalstatus of older children and adults, also, is impacted adversely by malaria,and by schistosomiasis. The intensity of infection for the latter peaks inthe age group 12-13 years, and it is estimated that adults may suffer 10-20days of disability a year as a result of malaria.
8. Using household income and expenditure data for 1981-82, and amethodology which had been applied to an earlier household survey, it isestimated that more than 20% of rural households, representing more than 3million persons, do not have enough income to afford a minimally adequate dietto meet their nutritional needs. This food poverty seems to have grown worsesince the 1970s. Certainly the absolute numbers of those affected has grown,and possibly the proportion of households as well. It is concentratedregionally, with about two thirds in ten Districts. With the exception of

- iii -
Machakos and Murang'a, all of these are 4.n the west of the country. In fact,Nyanza and Western Provinces contain about 60% of those estimated to besuffering from food poverty. Average rural households in the three westernProvinces (Nyanza, Western and Rift Valley) have expenditure levels below thenational average, while those in the three eastern Provinces (Central,Eastern, Coast) are above the national average. The list of Districts can bee,tended to 18 (of the total of 41 in Kenya; see Chapter II for details),which contain 69% of the population, 85% of the stunting problem in childrenunder five, and 83% of the rural food poverty problem arising from lowincomes.
9. The evidence for urban areas is more limited, but what isavailable suggests that while average income levels are significantly greaterin urban than in rural areas, the poverty lines must also be drawn at higherlevels, because the prices for food are higher in the cities. It isreasonable to conclude that the Droportion of urban households in food povertyis lower than that in the countryside, and estimates from the 1970s supportthis conclusion.
10. The rural income distribution in Kenya is quite markedly skewed,with the lowest seven income groups accounting for two thirds of householdsbut only 29% of total income. Households in the lowest income groups (almost45% of which are headed by women), have a high proportion of their income fromoff-farm sources, and a low proportion of the households sells crops, hireslabor or uses fertilizer. The pressure of a rapidly rising population hasreduced substantially the level of good land available per capita, but doesnot seem to have decreased the average farm size much, suggesting thatlandlessness, or near-landlessness, and the search for remunerative activitiesoff the farm, have increased markedly.
11. Analysis of rural household expenditure patterns shows that fo"the average household around one half of the value of food consumed is derivedfrom production on the farm. This high proportion, which seems to have beenunchanged since surveys carried out in the 1970s, suggests that manyhouseholds cannot count on the market as a source of adequate, timely foodsupplies, or on prices being stable and at reasonable levels. The lowrecourse to the market may also reflect lack of purchasing power. Whateverthe reason, it is a constraint on agricultural modernization, which dependsupon exploiting the possibilities offered by well-functioning markets.
12. The impact on poor consumers of food price fluctuations andincreases is considerable, and inadequately allowed for in the policy changesof recent years. From 1980 to 1989, average wage earnings in Kenya increasedby about 134% (private sector (including agriculture] 129%, public sector138%). During the same period, the average retail maize price in Nairobi hasrisen by 240%; with other thinigs held equal, this increase alone would havereduced by 18% the real income of a poor family with 7-8% of its total incomespent on purchased maize. In addition, the prices of other foods haveincreased steeply, and poor households also suffer disproportionately fromseasonal price fluctuations because of the higher fraction of their incomesspent on food. These fluctuations have been higher during drought periods,and appear to be aggravated by "micro-isolation" arising from poor transportinfrastructure, as well as by past polLcies to restrict private sectormovement of cereals within the country.
- iv -
13. While the National Cereals and Produce Board has aimed atstabilizing grain prices, data on actual market prices suggest their abilityto do so has been limited. The strict limitation on maize movements betweenDistricts appears to have exacerbated price differences and fluctuatione,while introducing other serious distortions. The partial freeing up of thesemovement restrictions which has taken place needs to go much further todiminish regional and seasonal price variations. There is also an urgent needfor the effects of these price fluctuations on poor households to be studiedwith a view to designing interventions to alleviate the worst of them.
14. Women have primary responsibility for the health and wellbeing ofchildren, and have a critical role as providers and preparers of food fortheir familiea. The majority of women live in rural areas, where they facetremendous, and increasing demands upon their time. Solutions to the foodproblems in rural Kenya must include attempts to reduce the time women spendon routine household service activities such as fetching water and firewood,food processing and preparation.
15. A description of poverty today in Kenya differs little from thatof a decade ago. Following is a summary of the problem of food insecurity,and the characteristics of those suffering from it:
- it is largely a rural problem, and must be tackled with rural remedies;
- children between weaning and 2 years of age, and pregnant and lactatingmothers are especially at risk;
- women's time, and the many clatms upon it, is a critical factor;
- many households have enough food in "normal" times, but are foodinsecure because they are easily tipped over into undernutrition by anyshocks;
- the commonest such shocks include illness, food price increases, anddrought; the poorest households have the most slender margins;
- seasonal food insecurity is marked, brought on by a combination of foodshortages, and peaks of stress related to labor needs;
- parasites, intestinal problems, and infectious diseases are majorfactors additional to 1)w income as factors in undernutrition;
- isolation, lack of adequate infrastructure and low levels of servicesare significant factors causing and exacerbating low income;
- drought has a longer term adverse effect for households dependent onlivestock, because of the long time it takes livestock numbers torecover;
- the arid and semi arid areas are under great pressure from migration,and are potential poverty traps for the future;
- while more study is needed about certain aspects, enough is known toaccelerate the process of dealing with the problem.
- v
TOWARDS AN ACTION PROGRAM
Economic Growth
16. In dealing with the problems of undernutrition and food insecurityidentified iai this report, there is no substitute for substantial andsustained increases in income growth for those who are affected. Suchincreases will come about only with growth in agricultural productivity,especially for smallholders, and remunerative employment opportunities, bothin agriculture and in off-farm pursuits, especially in rural areas. Asdiscussed in Chapter III, this requires agricultural research advances,especially in maize, dairying and other livestock products, increasing uptakeof fertilizers, completing improvements to the marketing system (mainlyspeeding up payments to farmers, and reducing controls on movement ofcereals), diversifying towards valuable export enterprises, findingtechnologies which address the labor constraints faced by farmers (especiallywomen farmers), improving the infrastructure of transportation, electric powerand telecommunications, and identifying and dealing with any factorsconstraining investments in rural areas. For agriculture, the adjustmentprogram which Government embarked upon three years ago should be continued.To assist with more intensive planning to take advantage of the growthlinkages between agriculture and other economic activities in the ruralsector, a thorough analysis is called for of the Rural and Urban HouseholdBudget Surveys of 1981-1983, whose data would provide a valuable guide to thelikely shape of development, and what kinds of activities need to be fostered.
Direct Actions To Help The Poor
17. There are many actions which can be taken to help the poor, whichcan be started immediately, and do not need to wait for economic growth. Thisreport recommends actions in the following areast health and nutritioninterventions, public works to build infrastructure, emphasizing exports inagriculture, enhancing opportunities for women, targetted subsidies in foodmarkets, better use of food aid, establishing a drought preparedness plan ofaction, population planning, improving statistics, and institutional change.In addition, the report recommends caution in strategy for the arid and semi-arid lands.
Health services and Nutrition Interventions
18. Though food poverty is a major root cause of undernutrition,measures to raise incomes are necessary but not sufficient to address theserious situation documented here. Major investments in health services arerequired, especially in those areas having a direct bearing on nutritionaloutcomes. The most important of these for children are a massive effort toaddress diarrhoeal illnesses and internal parasites, extending theimmunization program to achieve full coverage instead of the present 66%, andbetter prevention and treatment of malaria. Among other things, thepossibilities should be explored of greatly increasing the availability, f..sale through small shops, of chloroquine, anti-parasite medicines, andcontraceptives. Along with other public services, those in the health sectorhave suffered acutely from an increasing proportion of the total budgets beingtaken up with personnel costs, and a significant decline is the quality of

- vi -
services offered, which need to be reversed. The balance between curative andpreventative health expenditures, needs to be moved in favor of the latter.
19. It is recommended that the monitoring of growth faltering inchildren should be extendeA. School feeding programs should be re-assessed inthe context of a more comprehensive analysis of age-related risk ofundernutrition. The possibilities should be examined for an expanded programof nutritional education through the mass media. Further studies arerecommended to design low cost interventions which would encourageimprovements in household nutrition with increases in income. It would alsobe worthwhile to study production of fortified foods (especially Vitamin A andiron), and sale of such foods (possibly with a subsidy) in regions selecteafor a concentration of undernutrition problems. The effectiveness oflegislation mandating salt iodization needs to be monitored.
20. Government has made a start on implementing cost recovery ineducation, health and other public services. Careful monitoring of this isvery important, because of its potentially significant impact on lower incomegroups. The Government is now beginning initiatives to increase efficiency atKenyatta National Hospital, and is considering studies leading to an improvedpublic investment program, and to reforms of health financing, publicexpenditure management, and pharmaceutical supply. The details of theseproposals have yet to be worked out. There is no lack of need for increasedinvestments in this field. The data available are adequate to identify themain health problems which have to be tackled, and the regions where theproblems are most acute. What remains is the details, especially offinancing. Working these out should be given high priority.
21. The Government's Household Food Security Paper (qo. cit. p. 20)acknowledges that "disease and food insecurity are...closely linked andreinforcing", and that "measures to improve the health of the populationmust... form a major component of food security policy". The Government paperoutlines health and nutrition programs already under way whose annual cost isabout KE40 million, or 1.1% of the public budget, and recommends changes inthese, chief among which are:
(a) a more targetted school feeding program which would move towards cookedmeals and away from milk, attempt to reach children at earlier ages, andbe extended to MCH and birth control clinics;
(b) an expanded program of immunisation;
(c) combination of the efforts of field nutrition workers in theMinistry of Health with Ministry of Agriculture Home Economicsfield staff to develop comprehensive nutritional education throughwomen's groups;
(d) re-orientation of Ministry of Health budgets from curative towardspreventative measures, while at the same time increasing theirrural focus;
i2) improvement of data collection.

- vii -
22. The measures advocated by the Government paper, together withthose outlined above would, if adopted, make a substantial contribution to thekind of public provisioning which this report believes necessary if Kenya isto deal effectively with its problems of undernourishment and food insecurity.They would also assist with progress towards raising Kenya's life expectancyat birth from 59 years (estimated for 1988) towards the 70 ar.d over levelenjoyed by, among others, China and Sri Lanka. It is recommended that theFood Security Action Plan being formulated by the Government under the SecondAgricultural Sector Adjustment Operation include a full development of thesehealth and nutrition measures.
Infrastructure and Public Works
23. This report recommends e comprehenaive rural public works program,which would establish infrastructure vital for both agricultural and off-farmrural growth, while providing remunerative employment for significant numbersof lower income persons in rural areas. Such a program should emphasizeroads, electricity, telecommunications and water supply in high potentialareas of the country (where the majority of food-poor households live), andconstruction of water harvesting and conservation structures, small watertanks and tree planting in lower potential areas. The bulk of the programshould be implemented in "normal" years, with a "shelf" of projects developedfor use in drought years, when employment needs would be greater.Considerable thought must be given to financing, and the potential increasedcontribution of food aid should be explored thoroughly.
24. Only 21% of Kenya's rural population is estimated to have accessto safe water. Projects to provide more conveniently located, safe waxCersuv2lv would have a large payoff in reducing diseases, and improving health.In the case of roads, the rural public works program should draw lessons fromthe considerable experience in Kenya to date with rural road building, under aseries if projects, especially since the mid 19709. These lessons have to dowith balance between new construction and maintenance, the need to upgrade allroads in any network simultaneously to avoid creating new bottlenecks, thesuccessfulness of labor based construction methods, the need to decentralizetechnical and financial management to the District level, and the care neededin design and timing to provide employment opportunities which will impactupon poor households. Road maintenance has fallen so seriously behind newconstruction In Kenya, that some past road investments are in danger of beinglost. Investment allocations need to be spread more evenly through thecountry. More attention iE needed to develipna.t of transport services. Amanageable new phase of the rural roads prog-am, currently employing more than20,000 persons, could begin immediately, and readily double this employment.
Agricultural Exports and Food Self-Sufficiency
25. National food policies, as established in Sessional Paper No. 4 of1981, and consolidated in Sessional Paper No 1 of 1986, have been largelyoriented towards food production and distribution. It has been an explicitgoal of Government that the country should be self-sufficient in the main foodstaples, and in broad terms, especially in years of good weather, this goalhas been largely attained. In general, however, food self-sufficiency isincreasingly difficult to attain in Kenya, and adopting self-sufficiency as anoverriding goal in a modernizing economy is a potential source of serious
- viii -
economic inefficiency, low productivity, and therefore low personal income.Moreover, domeatic food self-sufficiency and household food security are notclosely related. This report supports the Government's Household FoodSecurity paper in its advocacy of rapidly increasing production of exportcommodities in agriculture. Such an export-oriented strategy would increasethe Government's confidence that in times of domestic food shortfalls, alongwith deploying its own stocks to provide a buffer, it could rely on recourseto the international market to cover remaining shortfalls. Such an explicitstrategy would also ensure that the element of "good luck" which allowed Kenyato rely on its foreign exchange reserves and earnings to ride out successfullythe serious drought of 1984, would not become "bad luck" during any recurrenceof such conditions in the future.
26. Such an export-oriented strategy would lead to fosteringdiversification of foreign exchange earnings, including horticultural andlivestock exports in agriculture, and turning around the situation in thetourism sector, Kenya's leading earner of foreign exchange, which is indesperate need of investment. Developing such a strategy would includestudying the input needs of various export enterpris(. and the degree to whichthese could be met from domestic sources, assessing the zeliability of foreignexchange earnings from various sources, and seeking to ernsure that they couldbe counted upon in a time when domestic production of foodstuffs had fallen.Since maize may continue to be available for export in some very goodproduction years, its trade needs to be managed particularly carefully, to getthe most out of it.
Enhancing Women's Opportunities
27. Critical actions recommended for enhancing the important rolesplayed by women as farmers, and primary family food and childcare providersinclude:
(a) increasing women's access to agricultural and nutrition informationprovided by the Ministry of Agriculture's extension service, byincreasing the proportion of women contact farmers with greaterrepresentation of low-income women, and improving home economicsextension activities;
(b) addressing women's need for ways to save time, through labor-reducinginnovations in food preparation and processing, and providing betterwater supply;
(c) increasing women's access to credit through joint titling and expandingthe use of group lending in the formal credit sector;
(d) securing women's control over income, and expanding their income earningopportunities through technologies to increase the productivity of theirlabor, joint contracts for commercial crops, and increased training,extension and credit.
GraLi Marketing and Targetted Subsidies
28. It is vital that the program of liberalizing grain markets, whichGovernment has started, should be successfully completed, in order that
- ix -
efficiency gains may be reaped from competitive marketing, allowing incentivesfor grain producers to be improved, while, it is hoped, also moderatingconsumer prices, improving price stability, and reducing regional pricedifferences. There has not been a comprehensive study yet, however, of thelikely losers and gainers from the liberalization process. This should becarried out as soon as possible. The Government's Household Food Securitypaper also advocates such a study, and the Government has undertaken to carryit out under the Second Agricultural Sector Adjustment Operation. It is alsorecommeaided that targetted interventions, such as food subsidies, rationing orother means of direct income maintenance, should be considered to helpespecially needy groups identified in this report, and any additional groupsdisadvantaged during the transition to a new grain market structure. Thestarting point for such studies would be the existing household survey data,which should be used to analyze the effects of the price increases which havealready taken place over the past five years. Because of their implicationsfor the exchequer, great care would be required to design efficientinterventions, monitor them continuously, and modify them when necessary.
Food Aid
29. This report assumes that food aid will remain a part of the aidpackages available to Kenya, and recommends a deliberate acceleration ofprograms which use food as a development tool, in support of higher incomesand improved nutrition. In particular, a review is needed of the contributionwhich food aid could make to financing the rural public works programrecommended above. The greatest nutritional impact would come from ensuringthat the income support from emp: )yment reaches members of vulnerablehouseholds most likely to use it to increase the nourishment of theirfamilies. Any food for work program should used domestically produced foodfor which food aid is exchanged. Such food should also be used to supportnutritional education, clinical care, and school feeding programs. Carefullydesigned, such programs may provide a valuable distributive mechanism formoving domestic food from surplus to deficit areas.
Drought Preparednes. and Early Warning Systems
30. The unusually severe drought of 1984 caught the country without adetailed plan of action for such events. The Government coped well on anemergency footing, and averted a potential catastrophe through a series ofactions which included commercial imports, food aid, food relief distributionand food for work activities on a modest scale. The following main lessonscan be learned from the experience:
(a) forward planning and an early warning system which includes moreaccurate and accepted weather forecasts can buy several months ofvaluable time for implementing a plan of action which has been alreadyprepared;
(b) healthy foreign exchange reserves, in which coffee and tea exportsplayed a crucisi role, were an important factor in the Government'sability to handle the situation, and should be part of deliberateplanning for the future;

- x
(c) non-Governmental organizations (NO0s) are important agencies foradministering the distribution of relief supplies; during the 1984drought they developed an innovative "grain for livestock" scheme whichwas helpful in pastoral areas; but coordination between them andGovernment needs improvement;
(d) job creation programs would be more effective if a "shelf" of viableproposals were prepared in advance of the need for them, andarrangements for implementation and supervision established;
(e) there is a need to make arrangements for securing seed supplies duringdroughte, possibly through a national stock whose costs would be borneby Government; this matter should be studied further to decide the best
approach to be adopted;
(f) the policy on national stocks of maize and beans needs to be re-examined; the concept of flexible reserves recommended by the earliergrain marketing study has yet to be taken up for serious analysis; it islikely that the present level of reserves is more costly than it needbe, and alternative arrangements should be developed and adopted in thecontext of NCPB reorganization;
(g) restrictions on private sector movement of maize within thecountry severely exacerbated regional differences in consumerprices, adding substantially to the adverse impact on vulnerablegroups in regions with food shortfalls.
31. Forward planning arrangements need not be too elaborate, butshould be designed to be relatively modest in cost, while also servingpurposes other than just drought preparedness where possible. The steps thatneed to be taken include: establishing a detailed policy for drought response(including procedures for assessing severity, population at risk, food importneeds, transport capacity, public employment programs, NGO coordination, andrelease of food from stores), improving the usefulness and acceptability ofweather forecasts (through more rainfall stations, better computingfacilities, more accurate prediction models, and a campaign to improve usesmade of the Meteorological Department's services), increasing the efficacy ofcrop estimating techniques (aerial surveys and other methods), completing thecomputerized food monitoring and control system in NCPB, and setting up asuccessor to the Food Sector Monitoring Project formerly carried out by theCentral Bureau of Statistics. The new National Food and Nutrition Secretariatproposed by the Government's Household Food Security paper would be anappropriate institution to do this.
Population Planning
32. The failure of otherwise creditable growth to raise real incomesof the country's population points to a need for undertaking family planniagprograms with renewed vigor, in an effort to reduce the population growth ratewhich is, among other things, making it extremely difficult to achieve realgains in income levels for so many people. Recent evidence on increaseduptake of family planning measures is encouraging, but does not give groundsfor complacency in the effort. Results of the new Census should shed light onwhether there have been significant -hanges in fertility rates in the decade

- xi -
since 1979, and provide a guide to new directions needed in family planning inthe immediate future.
Arid and Semi-Arid Lands
33. The Government's strategy paper on arid and semi-arid landsforesees a doubling in agricultural production in these areas, and adiminishing reliance on famine relief. This may be an over-optimisticprojection. It seems likely that per capita income growth will be very slowin these areas, almost certainly slower than the national average. The risksfor agriculture associated with climatic conditions mean that there willcontinue to be shortfalls in local production, whose implications will becomemore serious as the population at risk increases. Under such circumstances,the Government will need to guard against the ASAL regions becoming povertytraps, requiring continuous and increasing food relief. Efforts to developthese regions (including research on rainfed crops) should therefore proceedside by side with efforts to slow down the migration from other parts ofKenya, by fostering more attractive opportunities in those other areas.
Better Statistics
34. One of the most important needs in Kenya, for food security aswell as for wider planning of economic development, is better information,especially about the agricultural sector, market prices in rural areas, theavailability and uptake of staple foods, nutritional status, household incomesand expenditures, and the basic building blocks of the national accounts.There is already in place a relatively good capacity for designing andcarrying out surveys. What needs most strengthening is the processing, in atimely and insightful fashion, of data gathered in sample surveys, so that asmuch knowledge as possible is gained out of the information available. Aproject in this area is likely to be relatively modest in cost, but would havewide and valuable repercussions.
Institutional Change
35. This report has not been able to carry out detailed analysis ofthe institutions involved in food and nutrition work in Kenya, but theGovernment's Household Food Security paper has examined the situation, andconcludes that there is "no effective formal means within the presentgovernment structure for taking account of household food security andnutrition within the policy formulation and planning process"..."given thepriority which the Government gives to food security, there is a clear need atthe national level for a more institutionally formalised and effective foodsecurity system. It is considered that the only means of meeting this need isthrough the creation of a separate organisation able to span the range ofmajor sectors involved... The agency needs to be fully operational in allyears, not only at times of drought" (pp. 78-79). The paper thereforestrongly recommends establishing a National Food and Nutrition Secretariat,whose main functions would be analysis of secondary data to improve diagnosisof food security problems, and formulation of policies to address the problemsso revealed. This report concurs in the Government's recommendation, andsuggests that such a body should also be charged with keeping under its wingthe Government's drought contingency plan. Although there is no need for acontinuously operating body for drought prevention, a Secretariat of the kind

- xi -
since 1979, and provide a guide to new directions needed in family planning inthe immediate future.
Arid and Semi-Arid Lands
33. The Government's strategy paper on arid and semi-arid landsforesees a doubling in agricultural production in these areas, and adiminishing reliance on famine relief. This may be an over-optimisticprojection. It seems likely that per capita income growth will be very slowin these areas, almost certainly slower than the national average. The risksfor agriculture associated with climatic conditions mean that there willcontinue to be shortfalls in local production, whose implications will becomemore serious an the population at risk increases. Under such circumstances,the Government will need to guard against the ASAL regions becoming povertytraps, requiring continuous and increasing food relief. Efforts to developthese regions (including research on rainfed crops) should therefore proceedside by side with efforts to slow down the migration from other parts ofKenya, by fostering more attractive opportunities in those other areas.
Better Statistics
3!4. One of the most important needs in Kenya, for food security aswell as for wider planning of economic development, is better information,especially about the agricultural sector, market prices in rural areas, theavailability and uptake of staple foods, nutritional status, household incomesand expenditures, and the basic building blocks of the national accounts.There is already in place a relatively good capacity for designing andcarrying out surveys. What needs most strengthening is the processing, in atimely and insightful fashion, of data gathered in sample surveys, so that asmuch knowledge as possible iS gained out of the information available. Aproject in this area is likely to be relatively modest in cost, but would havewide and valuable repercussions.
Institutional Change
35. This report has not been able to carry out detailed analysis ofthe institutions involved in food and nutrition work in Kenya, but theGovernment's Household Food Security paper has examined the situation, andconcludes that there is "no effective formal means within the presentgovernment structure for taking account of household food security andnutrition within the policy formulation and planning process"..."given thepriority which the Government gives to food security, there is a clear need atthe national level for a more institutionally formalised and effective foodsecurity system. It is considered that the only means of meeting this need isthrough the creation of a separate organisation able to span the range ofmajor sectors involved... The agency needs to be fully operational in allyears, not only at times of drought" (pp. 78-79). The paper thereforestrongly recommends establishing a National Food and Nutrition Secretariat,whose main functions would be analysis of secondary data to improve diagnosisof food security problems, and formulation of policies to address the problemsso revealed. This report concurs in the Government's recommendation, andsuggests that such a body should also be charged with keeping under its wingthe Government's drought contingency plan. Although there is no need for acontlnuously operating body for drought prevention, a Secretariat of the kind

L. FOOD PRODUCTION AND SUPPLY
1.01 This chapter analyzes the food supply situation in Kenya. It notestrends in production, imports and exports of the major foods over the pastdecade, the availability of food in relation to population, and the trend inper capita supplies of calories and protein. The fluctuations caused byweather re given special attention, as are the food distribution system, andrelief operations and other measures undertaken to deal with productionshortfalls associated with drought, particularly that of 1983/84. Somerecommendations are made about improving early warning capacity in variousagencies. National food policies are discussed.
Trends In Food Production
1.02 Kenya's population is about 50% larger than it was ten years ago(16.1 million in 1979, estimated 24.4 million in 1990), and all trends in foodavailability must be assessed against the backdrop of the challenge this rapidgrowth presents to farmer and policy maker alike. It is not simply a matterof increasing food production, but also of dealing with larger swings inproduction associated with periodic annual and seasonal shortfalls, some ofwhich may be serious in certain localities even at times when the overallsupply at the national level appears adequate.
1.03 Estimates of domestic production of major foods over the pastdecade are outlined in Table 1.01. Important points to note are:
- production of maize, the single most important food (supplying 40-45% oftotal calories and 35-40% of protein), is subject to considerablefluctuations (Fig. 1); production in the 1984/85 crop year, for example,was 39% lower than the average of the previous three years; with betterweather in 1985/86 it recovered to a level 4% above that average,leaping 70% in one year;
- over the long term (1963-1987) maize production is estimated to havegrown at about 3.8% pa, close to the rate of growth of population; fiveyear averages are 1975/76 to 1979/80 1.78 million tons pa, 1980/81 to1984/85 2.05 million tons pa, and 1985/86 to 1989/90 2.64 million tonspa; with good research and extension, more inputs, and the rightincentives to farmers, it has the potential to continue growing almostas fast in the medium-term future, but it seems likely to fall somewhatbehind population growth;
- although domestic wheat production has certainly grown more slowly thanpopulation, rising imports have allowed wheat to assume a larger role inthe average diet; as will be seen later, its proportional share in bothcalorie and protein supply have risen;
- production of sorghum and millet appears to have diminished in the pastten years, displaced in many areas by maize and other crops; in certainlocalities susceptible to droughts this has tended to de-stabilize thestaple food supply, leading to much greater variability in productionand consumption availability;

- 2 -
- while meat production has levelled off, or even declined, milkproduction has grown well, and milk has assumed a more important role inproviding the country's protein, in terms of both quantity and quality;
- smallholder farmers produce three quarters of the country's totalagricultural output, and over one half of the marketed output, theircontribution including 70% of the maize, most of the milk and meat, andnearly all the rice and pulses; smallholders are also responsible for64% of coffee production, 50% of tea, and virtually all the pyrethrumand cotton;
amallholder agricultural production is heavily dependent upon women; anestimated 96% of rural women work on the family farm, where they providethree quarters of the labor, and manage 40% of the farms; althoughwomen focused traditionally on food crops, and men on crops for sale, asa result of migration of men out of rural areas, women are extendingtheir responsibilities to a wider variety of farm tasks.
Food Exports and Imports
1.04 Kenya does not have a large trade in food. The main elements inthis trade have been, on the export side, fluctuating shipments of maize inyears of "surplus", significant shipments of beans and other pulses, steady(or slightly declining) trade in canned pineapple, and exports of freshhorti,ultural produce which have expanded rapidly in recent years; imports ofwheat, rice, vegetable oils and sugar have all increased substantially. Table1.02 gives details of these exports and imports for the past decade.
1.05 During the 1970a (1970-1979), Kenya exported about 693,000 mt ofmaize, and imported 45,000 mt, a net outflow of 648,000 mt. Although exportsexpanded a third from 1980 to 1988 (est. 923,000 mt), there was also atremendous upsurge in imports (1,021,000 mt). The net result was a net inflowof maize of almost 100,000 mt from 1980 to 1988. This change in the net flowsreflects both the growth in population, and the droughts of 1980 and 1984.From 1989 to 1990, Kenya has once again been a net exporter. This illustratesthe problems of stock management, which include deciding when the costs ofstorage are greater than the benefits of export sales, even when such salesmay be followed closely by renewed purchases, as they were in 1984. Thecalculus is further complicated by the fact that Kenya produces white maize,while most imports are the less preferred (though usually cheaper) yellowmaize.
1.06 The domestic availability of food per capita in Kenya appears tohave at least levelled off, if not declined over the past decade, as discussedbelow. Maize has been exported, even though a significant proportion of thepopulation is undernourished, suggesting that they lack the purchasing powerto exert effective demand in the domestic market. This observation appliesalso to pulses, a more valuable and expensive food, whose exports of 233,000mt from 1980 to 1987 represented almost 10% of production.

TABLE 1.01
KENYA - PRODUCTION OF MAJOR FOODS, 1977/78-1987/88
('000 metric tons)
Food Item 77/78 78/79 79/80 80/81 81/82 82/83 83/84 84/85 85/86 86/87 87/88
Maize' 2,079 1,737 1,602 1,773 2,502 2,340 2,187 1,422 2,430 2,898 2,450
Sorghum/Milletb 350 351 296 350 330 197 65 119 180 195 180
Wheat' 166 158 155 189 226 244 251 144 201 254 207
Rice (paddy)"bC 43 42 37 40 40 43 23 21 23 24 22
cassavab 610 620 630 635 640 645 250 612 450 500 540
Sweet Potatoesb 258 330 340 330 345 350 265 280 330 350 380
Potatoes' 341 361 360 266 466 677 566 289 655 677 266
Beans' na na 153 117 198 288 270 81 180 324 171
Pulsesb(inc. Beans) 284 274 234 230 240 225 200 188 432 518 460
Vegetableeb 394 409 421 427 431 440 418 426 439 454 467
Sugar' 180 236 297 401 367 308 325 372 346 366 411
Plantainb 205 215 225 235 240 245 250 255 260 265 268
Bananab 120 1.30 140 145 150 155 137 168 167 231 210
Total Fruitsb 514 532 566 589 606 622 630 670 680 754 735
milk' 850 901 940 1,001 1,140 1,380 1,455 1,263 1,400 1,500 1,600
Total Meatb 274 261 285 288 274 303 304 303 238 261 281
Fish na na 50 48 57 81 98 91 106 122 124
Sources: a Official data from Economic Surveys, Statistical Abstracts, Ministries of Agriculture &
Livestock Development, supplemented in one or two cases by USDA data
b Production Yearbooks of the UN Food and Agricultural Organization (FAO)
c Paddy from 1977/78 to 1982/83, milled rice thereafter.

TAJBLE 1.02
KENYA - TRADE IN MAJOR FOOD PRODUCTS, 1977-1988
Food Item 1977 1978 1979 1980 1981 1982 1983 1984 1985 1986 1987 1988
Exports ('000 mt)
Maize 8 23 120 - 1 1 123 47 18 228 248 167
Pulses 22 15 10 10 7 38 92 15 2 21 48 37
Pineapple (canned) 45 42 41 38 41 40 48 50 44 45 43 41
Fresh Hort. Prod.a 19 21 21 22 23 25 29 29 32 35 36 40
Exports (million KSh)
Maize 13 14 107 - 1 7 243 119 25 293 389 433*
Pulses 55 43 30 30 39 126 277 49 13 135 268 2400
Pineapple (canned) 210 192 186 177 240 290 418 519 488 484 515 501*
Fresh Hort. Prod. 129 160 195 277 252 273 351 354 375 400 641 650
% Value All Exports 4.2 5.5 6.7 5.0 5.2 6.4 10.2 6.9 5.7 6.8 12.0 9.90
Imports ('000 mt)
Maize - - - 324 77 89 - 405 125 1 - -
Wheat 33 91 21 48 49 139 82 150 144 115 2 0 0 b 2 0 5 b
Rice - - - 1 5 12 45 - - 62 41 10
Vegetable Oils/Fats 46 52 47 72 102 99 74 63 84 102 126 na
Sugar 36 46 13 2 2 2 2 2 39 126 49 17
Imports (million KSh)
Maize - - - 502 116 233 - 1,081 271 4 - -
Wheat 39 118 49 100 89 278 197 416 381 241 350 200*
Rice - - 1 5 25 55 201 1 2 246 107 54*
Vegetable Oils/Fats 217 231 253 339 379 453 875 625 845 789 747 na
Sugar 80 91 28 9 11 10 11 7 114 512 200 na
% Value All Imports 3.2 3.3 2.7 5.0 3.3 5.7 7.1 9.7 6.7 6.7 4.9 na
Sources: Unless otherwise noted, all data are from the Statistical Abstract, Central Bureau of Statistics
a Horticultural Crops Development Authority; b USDA, crop years; * Provisional; - Negligible
mu urn.

Figure I KENYA -
MAIZE PRODUCTION & TRADE,
1976/77 - 1988/89 0.3
0.2
L_ ~Not Trade L 0.
0.1.
Exportt
M
2.9-
0.0
2.8-
|-0.1
2.7
2.--
2.68-.
2.5-
-0.4
t ~ ~~~~
~~~~~~~~~~~~
S
X2.3-2.2 -
-(Production
21. -X
1
1.6- .
S -
\ J
1.8 It ~ ~ I
1.6-
1.5-
1.4- -77/78
78/79 79/80
80/81 81/82
82/83 83/84
84/85 85/86
86/87 87/88
QKAN41M

- 6 -
1.07 Two other points may be noted about the food trade balances:
(a) Imports of wheat have increased more than threefold for the 1980.compared with the 1970u (est. 1.37 million mt compared with about 0.4million mt); while this reflects in part the fact that domestic wheatproduction has not been keeping pace with population growth,nevertheless the total availability of wheat appears to have grownfaster than population (est. 77% between the decades, compared with 50%for population);
(b) Fresh horticultu. produce has emerged as a valuable source of foreignexchange from the food sector. While the quantities shipped have almostdoubled in the decade, export earnings from this source have grownfourfold, reflecting the much higher unit values now being obtained.
1.08 As will be discussed further below, one of the basic questionswhich arises in planning for food availability in Kenya is the extent to whichscarce agricultural land should be used for food production for domesticconsumption, or used to produce commodities for export, the foreign exchangefrom whose sales will help sustain imports of food. This question is notconfined to non-food commodities, but applies equally to foods themselves,which may, under certain circumstances, be more valuable to the country asexports than if consumed domestically.
Food Availability
1.09 There is some evidence that over the past decade in Kenya the foodavailability per capita has at least not increased, and may have declined. Ina series of food balance sheets prepared during the 1970s, the UN Food andAgricultural Organization estimated '-vels of food availability in Kenya whichwould have provided an average of 2201 Calories per capita per day, and 63.8gm Protein per capita per day (both averages for 1968-1977 inclusive). Wehave estimated a new food balance sheet for 1987/88, the latest year for whichthere are reasonably complete data for food availability (Table 1.03). Theestimates as far as possible use the same assumptions as were used in the FAOfood balance sheet for 1979-1981, with which it is compared in Table 1.04.
1.10 As can be seen from Tables 1.03 and 1.04, for the 1979-1981 periodthe FAO estimatad food availabilities of 2,013 Calories and 54.6 gms Proteinper person per day. In the new balance sheet for 1987/88, estimated using thesame methods and coefficients as FAO, the comparable totals are 1,801 Caloriesand 51.8 gms Protein per person per day. These represent a reduction in foodenergy availability of about 18% compared with the average for 1968-1977, andjust over 10% compared with the average for 1979-1981. Furthermore, the FAO"critical limit" for energy supply is 1,517 Calories per day, to which FAOadds a 10% food security allowance to set a threshold of 1,669 Calories perday. The level estimated for the latest year is only 8% above that threshold.It is also well below the per capita target for 1988, of 2,557 Calories perday, set by the Gcvernment in the 1984-1988 Development Plan (GOK HouseholdFood Security paper, 22. cit. p. 4j.

TABLE 1.03
KENYA - FOOD BALANCE SHEET, 1987/88
(Quantities in '000 mt)
Per Capita per Day
Food Item Prodn. Imoort Export Stocks Nonfood' Waste Food Food (gm) Calories Protein (gm)
Maize 2,450 - 100 -126 123 212 2,141 259.9 734 19.3
Sorg/Nillet 180 - - - 10 25 145 17.6 54 1.5
Wheat 207 200 - -44 33 9 409 49.7 136 4.1
ice (milled) 22 41 - +5 1 1 56 6.8 24 0.4
Cassava 540 - - - - 16 524 63.6 70 0.6
Sweet Pot. 380 - - - 18 57 305 37.0 37 0.6
Potato 266 - - - 66 33 167 20.3 15 0.3
Pulses 460 - 48 - 37 42 333 40.4 137 8.9
Veges (fresh) 446 - 36 - - 41 369 44.8 10 0.6
(proc.) 21 2 - - - - 12 1.5 1 -
Sugar/Honey 427 49 - +13 48 - 415 50.4 194 -
Plantain 268 - - - - 40 228 27.7 25 0.3
Banana 146 - - - - 22 124 15.1 9 0.3
Other Fruitb 321 - 181 - - 33 102 12.3 7 -
Nuts/Oilseeds 105 - 3 - 13 8 81 9.9 20 0.5
Oils/Fats 17 118 - - 33 - 102 12.3 96 -
Milk 1,600 40 1 - 77 88 1,474 178.9 114 5.7
Meat (w. offal)340 - ^ - - - 340 41.3 71 6.2
Fish 124 1 - - 2 6 117 14.2 10 1.5
Eggs 35 - - - 4 7 24 2.9 4 0.3
Beverages,
294 35.7 19 0.2
other
16 0.4
_______ ______ ______ _______ ______ ____ _
Totals 1.8Q1 51.8
Source: Mission estimates. a Mainly seeds and animal feeds; b Exports are mainly canned pineapple (44,000
mt). expressed in fresh equivalent; c Mainly alcoholic; Population assumed 22,566,000 at December 31, 1987

TABLE 1.03
KENYA - FOOD BALANCE SHEET, 1987/88
(Quantities in '000 mt)
Per Capita Per Day
Food Item Prodn. Import Export Stocks Nonfood' Waste Food Food (gm) Calories Protein (gm)
Maize 2,450 - 100 -126 123 212 2,141 259.9 734 19.3
Sorg/Millet 180 - - - 10 25 145 17.6 54 1.5
Wheat 207 200 - -44 33 9 409 49.7 136 4.1
Rice (milled) 22 41 - +5 1 1 56 6.8 24 0.4
Cassava 540 - - - - 16 524 63.6 70 0.6
Sweet Pot. 380 - - - 18 57 305 37.0 37 0.6
Potato 266 - - - 66 33 167 20.3 15 0.3
slses 460 - 48 - 37 42 333 40.4 137 8.9
Vages (fresh) 446 - 36 - - 41 369 44.8 10 0.6
(proc.) 21 2 - - - - 12 1.5 1 -
ugar/Honey 427 49 - +13 48 - 415 50.4 194 - <
lantain 268 - - - - 40 228 27.7 25 0.3
Banana 146 - - - - 22 124 15.1 9 0.3
Other Fruitb 321 - 181 - - 33 102 12.3 7 -
Nuts/Oilseeds 105 - 3 - 13 8 81 9.9 20 0.5
Oils/Pats 17 118 - - 33 - 102 12.3 96 -
Milk 1,600 40 1 - 77 88 1,474 178.9 114 5.7
Meat (w. offal)340 - - - - - 340 41.3 71 6.2
Fish 124 1 - - 2 6 117 14.2 10 1.5
Eggs 35 - - - 4 7 24 2.9 4 0.3
Beverages* 294 35.7 19 0.2
Other 16 0.4
Totals 1.801 51.8
Source: Mission estimates. a Mainly seeds and animal feeds; b Exports are mainly canned pineapple (44,000
mt); expressed in fresh equivalent; c Mainly alcoholic; Population assumed 22,566,000 at December 31, 1987
- 9 -
1.11 It must be noted that such estimates of food availability arebased on a number of assumptions, and that the underlying data on foodproduction, waste, and disposition are rather unreliable. A FAO food balancesheet estimated for 1975-1977, for example, with hindsight can be seen to haveused too high an estimate of maize production, sufficient in itself to accountfor at least some of the apparent decline in food availability since thatperiod. Therefore the estimates in Tables 1.03 and 1.04 must be treated withcaution. What do they reveal, on the surface? The data in Table 1.04 suggesta decline in availability, and some shifts in composition. The naostsignificant of these are increases in the proportion of energy coming frompulses, sugar, milk, and fish (collectively rising from 20.3% to 25.3% ofCalories). This apparent shift of food availability in favor of pulses andlivestock products yields protein of better quality than that from the cereals(while the proportion of protein from cereals fell from 52% to 49%, thatcoming from pulses and livestock products rose from 39% almost to 44%). Thedifferences between urban and rural consumption patterns concealed by thenational averages should also be noted. Most of the wheat, for example, isconsumed in urban areas. As a result, the proportion of calories derived fromwheat would be higher for the urban population, while that from maize(consumed as meal rather than whole grain as is common in rural areas) wouldbe lower. At the national level, the overall lower caloric availability, withslightly better average composition, may reflect better nutritional conditionsfor higher income groups, combined with significantly worse conditions forlower income households.
1.12 There are also dangers in estimating food balances for a singleyear only. The year selected here (1987/88) was one in which there were dipsin production of maize and potatoes, following very good harvests in 1986/87.Production of most other commodities appeared to be at "normal" levels. If weadjust the food balance sheet for this by assuming production of these twocrops at the higher levels of the two surrounding years, the result would beto raise the per capita availability to 1,947 Calories and 55.5 gms Protein.Argumerts against making this adjustment are that maize was exported duringthe year (implying that available stocks could have been drawn down furtherhad there been effective iemand), and that the production estimates for theyear following 1987/88 are still preliminary and may be adjusted downwards.
1.13 Whatever obvious adjustments are made, therefore, it would bedifficult to conclude that the availability of food in Kenya in the 1980. hasrisen from its already modest level of a decade earlier, and it may havefallen somewhat, although the evidence is not conclusive. As noted, there arereasons to believe it may have fallen for low income groups. The most obviousreasons are the very great pressure on domestic food supplies from thesignificantly greater population in the later period, combined with limitedpurchasing power constraining effective demand for food from at least a partof the population. It is interesting also to note that the proportion ofCalories contributed by food imports rose from about 4% in the 1975/77 periodthrough 6.6% in the 1979/81 period to almost 11% in the latest year. Thispoints to domestic production falling behind the growing population, but doesnot, in itself, say anything about total availability per capita. TheGovernment's Household Food Security paper (on. cit. p. 27) estimates thattotal domestic food availability in the year 2000 will have to be double thatof 1986, and supports the need for imports even in normal years.
- 10 -
Regional and Seasonal Problems in Food Availability
1.14 There is a long history of periodic shortfalls in food supply inKenya. From 1920 to 1960, major shortfalls occurred in some or all regiins ofthe country in 1928, 1933-34, 1937, 1939, 1942-44, 1947, 1951, 1952-55, and1957/58. Since 1960, Kenya has needed significant imports of maize in 11years (out of 28) to supplement shortfalls in domestic production. Theseimpotts were procured principally in 1961/62, 1965/66, 1970/71, 1980/82, and1984/85. In most cases, the imports began some time after it became clearthat there would be a shortfall, and continued into the following year. Thisis because the main maize harvest begins only six months or so after the longrains of March-May have begun, and the harvest continues over a period of upto five months, as maize becomes available from various agro-ecological zonesof the country. The long rains harvest thus overlaps the much smaller shortrains harvest. Within the cropping year, starchy foods tend to be in shortest rasupply in the period prior to their harvest, while vegetables are leastavailable just before the beginning of the rains.
1.15 The timing, intensity, duration and total magnitude of the rainsare the key weather factors in the maize harvest, with the long rains playingthe most important role. When they are deficient, the need for supplementarysupplies follows with a lag, which does allow some leeway in taking steps toremedy the situation. If the long rains were to fail substantially for twoyears in a row, the situation would be much more serious than failure for asingle year, because there would not be any lag in the second year betweenknowing about the shortfall and having to deal with it.
1.16 The two most crucial factors in dealing with a shortfall at thenational level are the stocks on hand (including on farms) when it becomesevident, and the availability of foreign exchange reserves with which to payfor any commercial imports needed. It is not surprising, therefore, that theGovernment has followed relatively conservative policies regarding maizestocks. There does not seem to have been official recognition of the foreignexchange element, although ar will be seen later, through good luck amongother things, a healthy foreign exchange situation played a key role indiminishing the seriousness of the 1984 drought. Within the country, the mostimportant factors are where the stocks are in relation to need, and the meansfor moving food about. This includes the capacity of the port of entry, andof road and rail transport, an(, the state of the roads. Obviously knowledge,about every element in the food supply and demand situations, is vital.
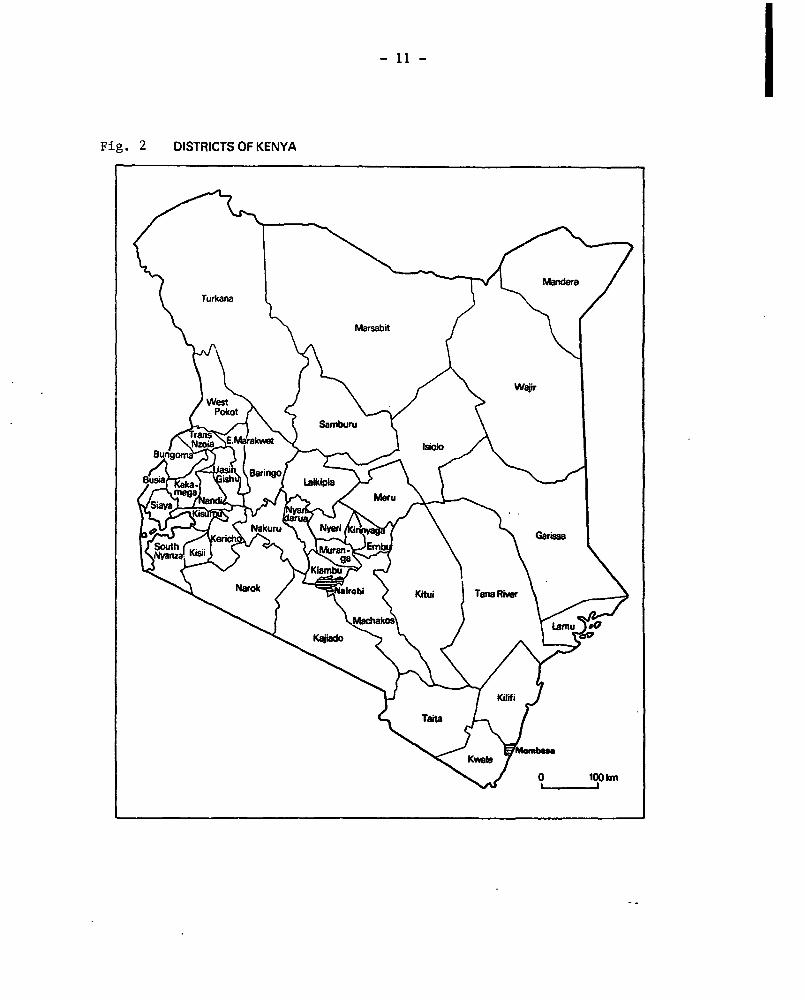
1.17 Figures 2, 3, and 4 outline, respectively, the administrativeDistricts of the country, the normal rainfall in the short and long rains, andthe boundaries between normal, semi-arid and arid zones, largely as determinedby the rainfall patterns. These dramatize the relatively small proportion ofKenya's land area in which productive agriculture is possible because of therainfall constraint, and also demonstrate how the boundary of cultivation hasbeen moving out into the areas less suitable for cultivation, as a result ofintense population pressure.
- 11 -
Fig. 2 DISTRICTS OF KENYA
Turkania ) /
< ~~~~~XX ~~~~Marsabit
WI'PPokot 2 { \>>> ~~~~Samburu a/
B 3< 1 C~~~~~~~~~~~~Lsw
Narok g zbirobi t Kittii TaneaRiwe
Ka/ K iiado
<Kvwabe
J 0 °, 0 km

Fig. 3 ZINYA - RAIRTALL PATTE:.t:S
Normal Rainfall in the Short Rains Normal Rainfall in the Long Rains
700
600
50
E ,.~~40

- 13 -
Fig. 4 RELATION BETWEEN THE CULTIVATION AREAS AND THE SEMI-ARID AND ARID ZONES,1982
SUDAN
/*t * j[nunwl ~ > \ ETHIOPIA
Loda
:wz ' odwar ,Marsait¢-
UGANDA lb ,46'0'. :'/ - W~~~~~~~~~~Vajir
\,..,::.. I I'..' I I ., : ::: :: .: II .* SOMALIA:::...:: ::.. . S
:'.'. ...'''''1 9........ "-- a......... .... 5io ,
~~~~~~~~~~~~~~..... .. .. - ,........]tn K. e um u ...........: ..: .. : . . ...........
........... .u.u..= ~~~~~. :. . -.. ......... .................................. :::, .... ... .w
A Nii.i............... . , . .' .:~~~............... ...... ... .. .. .. .~~~. . . . . . . . . ..............x.
~~ ,j....... .. ... .. ... ..
TANZANIA \ l
cultivation areas I
, high and medium potential land
boundary semi-arid land
boundary arid land..-- boundary very-arid land o 100° kn
Source: H. Epp & A. Killmayer. Determination of the CultivationBoundary in Kenya. Kenya Rangeland Ecological MonitoringUnit (KREMU) Technical Report No. 90, Nairobi, 1982.

- 14 -
1.18 Within the zone of cultivation, as one would expect, there areareas where more maize is produced than consumed, and others which are indeficit, either continuously or from time to time. This is illustrated inbroad terms, by Provinces, in Table 1.05. We have used data for 1981/82 hereand in following discussion because a rather full analysis of the graindistribution system was done in 1983 using these data. As is clear from thetable, most of the maize surplus arises in Rift Valley Province, which in1981/82 produced 54%, and consumed 27% of the country's maize. The fact thatthe share of consumption there was significantly higher than the Province'sshare of population reflects differences in tastes and traditional diets inthe various parts of the country, and probably to some degree the distributionof purchasing power and effective demand (the average rural household incomein 1981/82, in Rift Valley Province, was about 42% and 77% higher than inWestern and Nyanza Provinces, respectively). In 1981/82, two thirds of totalmaize purchases made by the National Cereals and Produce Board (NCPB) werefrom Rift Valley Province, and a further 17% from Western Province.
TABLE 1.05
KENYA - SHARE OF MAIZE PRODUCTION & CONSUMPTION BY PROVINCE - 1981/82
Share of Maize Share of Maize Share ofProvince ProductionaM%) Consumption(%r Population(%)
Rift 54 27 21Western 15 14 12Nyanza 12 19 18Central 9 14 15Eastern 8 16 18Coast 2 4 6North Eastern - neg 2Nairobi, Mombasa - 6 8
Totals 100 100 100
Sources: a Republic of Kenya, Ministry of Finance. Grain Marketing Study byBooker Agriculture International Ltd. with Githongo & Assoc. October, 1983.
b Republic of Kenya. Population Projections for Kenya, 1980-2000.Central Bureau of Statistics, March, 1983.
1.19 A more precise view of movements of maize can be obtained from anexamination of data regarding purchases and sales from NCPB depots, since withtight restrictions on the movement of maize, NCPB is the main mover. Data for1981/82 are outlined in Table 1.06. In broad terms, in 1981/82, the NCPB tookabout 450,000 mt of maize out of the rural economies of Rift Valley (64%),Western (24%) and Nyanza (12%) Provinces, transferring it into storage asstocks (38%), and to the three major urb:.. areas of Nairobi, Mombasa, andKisumu (62%). The remainder of its purchases, about 200,000 mt, were balancedby sales within the same Province. It is estimated that around one third ofthe maize produced that year entered the market, and that NCPB procured almost80% of the amounts marketed. Of the quantities moving to the three major
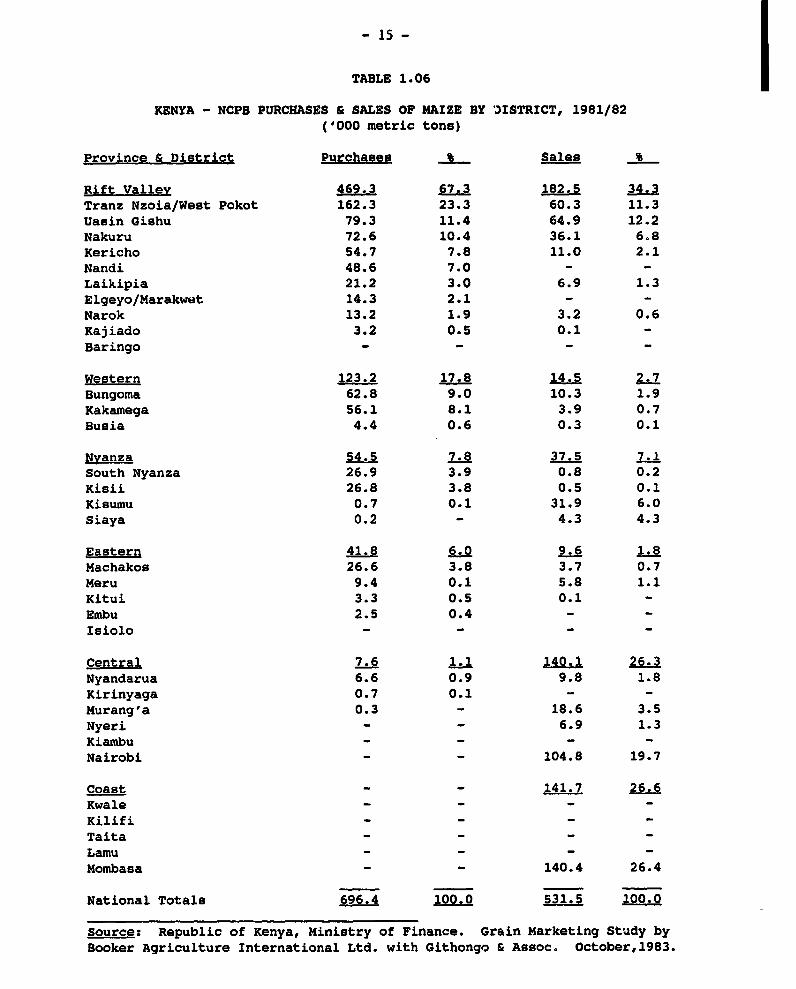
TABLE 1.06
KENYA - NCPB PURCHASES & SALES OF MAIZE BY 'DISTRICT, 1981/82
('000 metric tons)
Province & District Purchaseg L Sales
Rift Valley 469.3 67.3 182.5 34.3Tranz Nzoia/West Pokot 162.3 23.3 60.3 11.3Uasin Gishu 79.3 11.4 64.9 12.2Nakuru 72.6 10.4 36.1 6.8Kericho 54.7 7.8 11.0 2.1Nandi 48.6 7.0 - -Laikipia 21.2 3.0 6.9 1.3Elgeyo/Marakwet 14.3 2.1 - -Narok 13.2 1.9 3.2 0.6Kajiado 3.2 0.5 0.1 -Baringo - -
Western 123.2 17.8 14.5 2.7Bungoma 62.8 9.0 10.3 1.9Kakamega 56.1 8.1 3.9 0.7Busia 4.4 0.6 0.3 0.1
Nyanza 54.5 7.8 37.5 7.1South Nyanza 26.9 3.9 0.8 0.2Kisii 26.8 3.8 0.5 0.1Kisumu 0.7 0.1 31.9 6.0Siaya 0.2 - 4.3 4.3
Eastern 41.8 6.0 9.6 1.8Machakos 26.6 3.8 3.7 0.7Meru 9.4 0.1 5.8 1.1Kitui 3.3 0.5 0.1 -Embu 2.5 0.4 -Isiolo - _ _ _
Central 7.6 1.1 140.1 26.3Nyandarua 6.6 0.9 9.8 1.8Kirinyaga 0.7 0.1 - -Murang'a 0.3 - 18.6 3.5
Nyeri - - 6.9 1.3
Kiambu - - - -Nairobi - - 104.8 19.7
Coast - - 141.7 26.6
Kwale - - - -Kilifi - _ _ _Taita - - - -Lamu _ _ _ _Mombasa - - 140.4 26.4
National Totals 696.4 100.0 531.5 100.0
Source: Republic of Kenya, Ministry of Finance. Grain Marketing Study byBooker Agriculture International Ltd. with Githongo & Assoc. October,1983.
- 16 -
urban areas, after milling a little less than one half was consumed there, theremainder being transferred on for sale in Coast, Eastern and CentralProvinces. Insofar as maize is concerned, it is a fair generalization thatthe west feeds the east.
1.20 In years of very unfavorable weather, even the regions normally insurplus may enter a maize deficit situation. Using data from NCPB depots overa seven year period, one study showed that some 80% of the depots in WesternKenya experienced deficits at least once in a seven year period (but rarelymore than twice), but that for depots in Eastern Kenya a deficit situation wasthe norm, and surplus years rare.L' While Kenya's cropping patterns are suchthat there are almost no times in the year when maize is not being harvestedsomewhere, the harvest peaks are concentrated as follows: NyanzaAugust/Septem er, Western October, Rift December/January, Eastern and CentralMarch/April. Both Central and Coast Provinces have harvest spread more evenlythan the other Provinces. The stocks of maize held by farmers tend to followthe degree of concentration of the maize harvest, being generally highest inRift Valley Province and lowest in Central Province. As would be expected,stocks tend to be highest in the periods after harvests, and dwindle awayduring succeeding months.
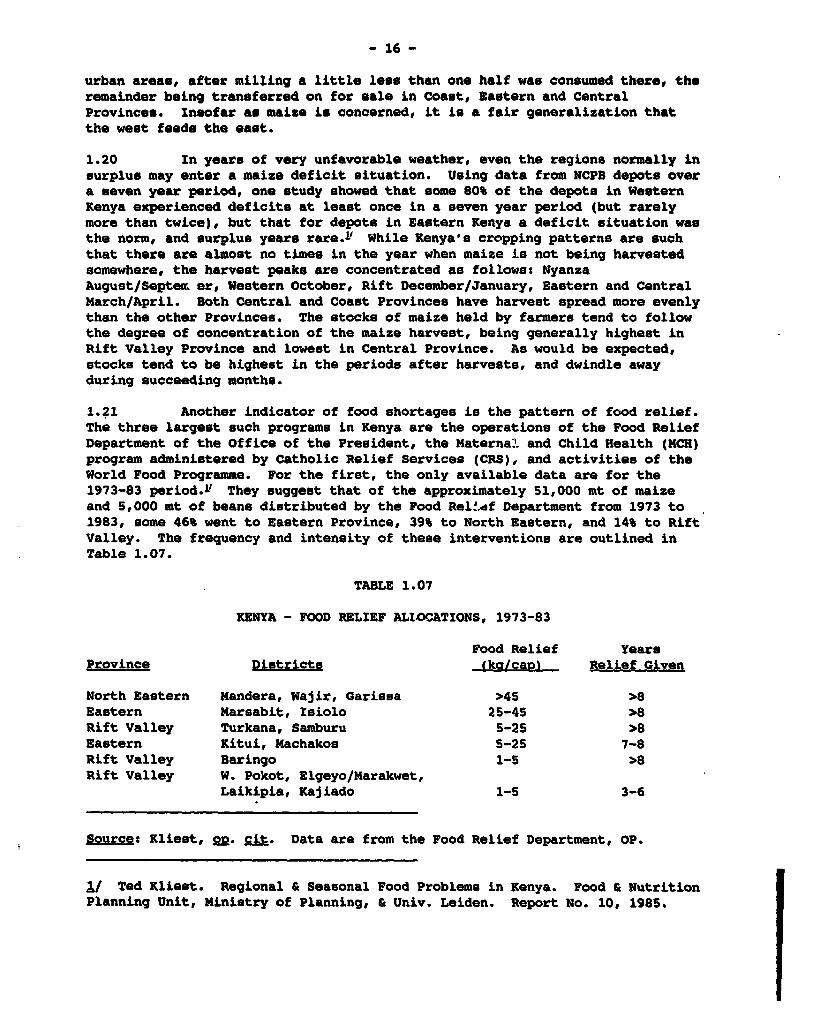
1.21 Another indicator of food shortages is the pattern of food relief.The three largest such programs in Kenya are the operations of the Food ReliefDepartment of the Office of the President, the Maternal and Child Health (NCR)program administered by Catholic Relief Services (CRS), and activities of theWorld Food Programme. For the first, the only available data are for the1973-83 period.y They suggest that of the approximately 51,000 mt of maizeand 5,000 mt of beans distributed by the Food Rel.df Department from 1973 to1983, some 46% went to Eastern Province, 39% to North Eastern, and 14% to RiftValley. The frequency and intensity of these interventions are outlined inTable 1.07.
TABLE 1.07
KENYA - FOOD RELIEF ALLOCATIONS, 1973-83
Food Relief YearsProvince Districts (kalcaol Relief Given
North Eastern Mandera, Wajir, Garissa >45 >8Eastern Nareabit, Isiolo 25-45 >8Rift Valley Turkana, Samburu 5-25 >8Eastern Kitui, Machakoe 5-25 7-8Rift Valley Baringo 1-5 >8Rift Valley W. Pokot, Elgeyo/Marakwet,
Laikipia, Kajiado 1-5 3-6
Source: Kliest, O2. cit. Data are from the Food Relief Department, OP.
1/ Ted Kliest. Regional & Seasonal Food Problems in Kenya. Food & NutritionPlanning Unit, Ministry of Planning, & Univ. Leiden. Report No. 10, 1985.
- 17 -
1.22 The MCH programs of Catholic Relief Services had around 116,000recipients in 1982/83. Of these, 36% were in Eastern Province (mostly inMachakos, Kitui and Meru Districts), 26% in Rift Valley Province (especiallyTurkana, with lesser numbers in Kajiado, Samburu and Laikipia Districts), and21% in Central Province. Almost one half of recipients were in the fourDistricts of Turkana, Machakos, Kitui and Meru. The MCH program had beenreduced to around 65,000 recipients by 1988, when CRS also was reachingapproximately 6,000 beneficiaries with some 70 food for work projects, againlocated mainly in Machakos, Kitui, drier areas of Meru and Embu, and on theCoast.
1.23 In the mid 1980s, there were some 10,000 beneficiaries of WorldFood Programme (WFP) food for work schemes in the Turkana area. Morerecently, WFP has administered a sizeable school feeding project, withassistance totalling about US$20 million over three years, reaching some500,000 children (of the approximately 5 million in the country). The morethan 1,000 schools participating in this project are located in EasternProvince (Marsabit, Isiolo, Kitui, and parts of Machakos, Meru and EmbuDistricts), North Eastern (Mandera, Wajir and Garissa), Rift Valley Province(Turkana, West Pokot, Baringo, Samburu, Narok, Kajiado, Laikipia), and CoastProvince (Lamu and Tana).
1.24 The pattern of relief food distribution points to the arid andsemi arid areas of Kenya, where there are chronic food shortages from localproduction. These areas will probably contain a population of close to 5million by 1990, of which just under one half will be in the semi arid areasof four Districts in Eastern Province (Machakos, Kitui, Meru and Embu). Afurther 20% will be in two Districts of Coast Province (Kilifi and Kwale), andin three Districts of Rift Valley Province (Turkana, Kajiado and Baringo).
1.25 The population of the arid and semi arid land (ASAL) areas isgrowing more rapidly than the national average, according to Governmentestimates-, with migration added to natural increase. As a result of thispopulation pressure there is increasing cultivation of lands which werehitherto reserved for extensive livestock production, with consequent dangersfor soil degradation. In Machakos, during the decade preceding the 1979census, while the population of the whole District grew by 45%, that of the"agricultural heartland" grew by 33%, and those of Yatta and Kibwezi Divisions(both in the dry livestock-millet zone) by 80% and 160% respectively (Kliest,22 cit). A similar pattern can be demonstrated for Kitui, where there hasbeen a steady movement of the cultivation margin eastwards into the drierzone.
1.26 The need for food imports into these areas is likely to growsubstantially. More seriously, in spite of efforts to raise agriculturalproductivity in the ASAL areas, they will remain areas of relatively lowproductivity. This implies that the population increasingly taking upresidence there is likely to experience very slow growth in their incomes, andmay find it increasingly difficult to secure their basic food needs as their
I/ Ministry of Planning & National Development. A Second-Generation Strategyand Policy for Reclamation and Development in the Arid and Semi-Arid Lands,Kenya, 1989-1993. Nairobi, May, 1988.
- 18 -
numbers grow. Although Government is rightly seeking to address thedevelopment of these areas, it is likely that unless migration to them isslowed (by better economic conditions elsewhere), the result wilL be deepeningfood poverty problems, and a growing need for costly food relief. ,
1.27 One of the striking features of the smallholder sector is thequantity and diversity of off-farm activities, earnings from which are animportant factor in alleviating poverty and coping with food shortfalls. Anelement common to many approaches to heading off stress is diversification,either of enterprises on a farm, or of economic activities in the family, inorder to safeguard against simultaneous failure of all sources of survival.Within households, coping mechanisms may differ by gender. Women's ability tomanage farm respcnsibilities, and their limited access to other forms ofemployment, enables men to work off the farm. Seasonal stress may be feltmost acutely by households headed by unmarried women, since they have fewereconomic options, and any remittances they receive are likely to be from otherfamily members who are themselves farming, and have families of their own.When all else fails in a time of acute stress, most households will migratecompletely to seek work elsewhere, or relief.
1.28 For livestock herders, the following elements may be included incoping with drought:!' movement of livestock, splitting the herd into severalgroups to exploit diverse grazing areas, intrafamily assistance in the form ofreciprocal grazing or livestock loans, sale of some livestock and/or as muchuse as possible of any which die, alternative food supplies from wild game orcropping activities; if most of these fail, livestock will be sold completely(unfortunately, commonly at much reduced prices, in the event that droughtconditions are widespread).
1.29 For agriculturalists, the following elements have been observed:yuse of food reserves, food purchase (with cash from selling livestock[especially goats), employment of family members, marginal craft activities,loans, or selling possessions or even tools), consumption of cheaper food,rationing and fasting, eating seeds, food sharing, sales of firewood/charcoaland beer, relief programs and/or migration if most other things fail.
1.30 It is often rising prices for food, and the appearance of some ofthe above coping activities which are the earliest signs of developing foodshortages. Authorities interested in establishing better early warningsystems will usually do better observing these signs than measuringnutritional stress, which may follow later.
1/ David J. Campbell. Response to Drought Among Farmers & Herders inSouthern Kajiado District, Kenya. Human Ecology Vol. 12, No. 1, 1984: 35-64
2/ 'a) Anne Fleuret. Indigenous Taita Responses to Drought. (mimeo. c.1985)
(b) The Collaborative Research Support Program on Food Intake and HumanFunction: Kenya Project. A Study in Embu District. School of Public Health,Univ. California, and College of Health Sciences, Univ. Nairobi. Nov. 1987
(c) Dick Foeken & Jan Hoorweg. Seasonality in the Coastal Lowlands ofKenya. Food & Nutrition Planning Unit, Ministry of Planning and NationalDevelopment, and African Studies Centre, Univ, Leiden. Report No. 28, 1988

- 19 -
1.31 In the 1980s, there have been two aignificant drought experienceswhich have had effects at the national level. The first of these, whichresulted in the shortfalls in production experienced in 1979 and 1980, ledGovernment to formulate new food policies. We now turn to a discussion of Kthese, before returning to the subject of production fluctuations through anexamination of the drought of 1984, and how it was handled.
National Food Policy
1.32 In the aftermath of needing to import more than 320,000 mt ofmaize in 1980, Government prepared a specific policy statement which waspublished as Sessional Paper No. 4 of 1981 on National Food Policy. Thispaper acknowledged that rapidly expanding population and a shortage ofunexploited high potential arable land were "beginning to expose a potentiallydangerous imbalance in the relationship between the national supply of anddemand for food". Among other things, it recognized t" need for a nationalfood policy, and proposed to go about establishing it on the basis of thefollowing objectives:
- "broad self-sufficiency in the main foodstuffs";
_ "a calculated degree of security of food supply for each area of thecountry";
- distribution of foodstuffs such that "every member of the population hasa nutiltionally adequate diet".
1.33 The great majority of the policies and programs laid out inSessional Paper No. 4 related to increasing the production of food withinKenya. The paper acknowledged that "a significant proportion of thepopulation...is malnourished as a consequence of inequalities in thedistribution of purchasing power, seasonal food shortages and lack ofnutritional education." Apart from increasing food supply and improving itsdistribution, however, the programs addressing nutritional status wereconfined to proposals for evaluating the School Milk Prograx-me, expanding theGovernment's relief efforts, raising the number of nutrition teachers,designing food fortification initiatives, monitoring quality of processedfoods, improving the Home Economics Service, and monitoring nutritional statusthrough detailed surveys. No explicit programs were proposed for raisingpurchasing power of low income groups. Implicitly this was to be taken careof through unspecified "policies aimed at reducing inequalities in thedistribution of income" (para. 3.26).
1.34 For increasing production and improving marketing there wereproposals aplenty. Some of these have been initiated in succeeding years,such as attempts to improve the process of setting producer prices, increasethe supply of fertilizers, improve extension, intensify research on foodproduction, build up the national grain reserve to 4 million bags of maizeplus other staple foods, and increase the catch of fish. Others have beenslower to be realized, such as expanding agricultural credit (in real terms,this has grown at a slower rate than agriculture itself), removing therestrictions on inter-District and inter-regional movements of maize, andemploying the National Cereals and Produce Board (NCPB) as a buyer and seller
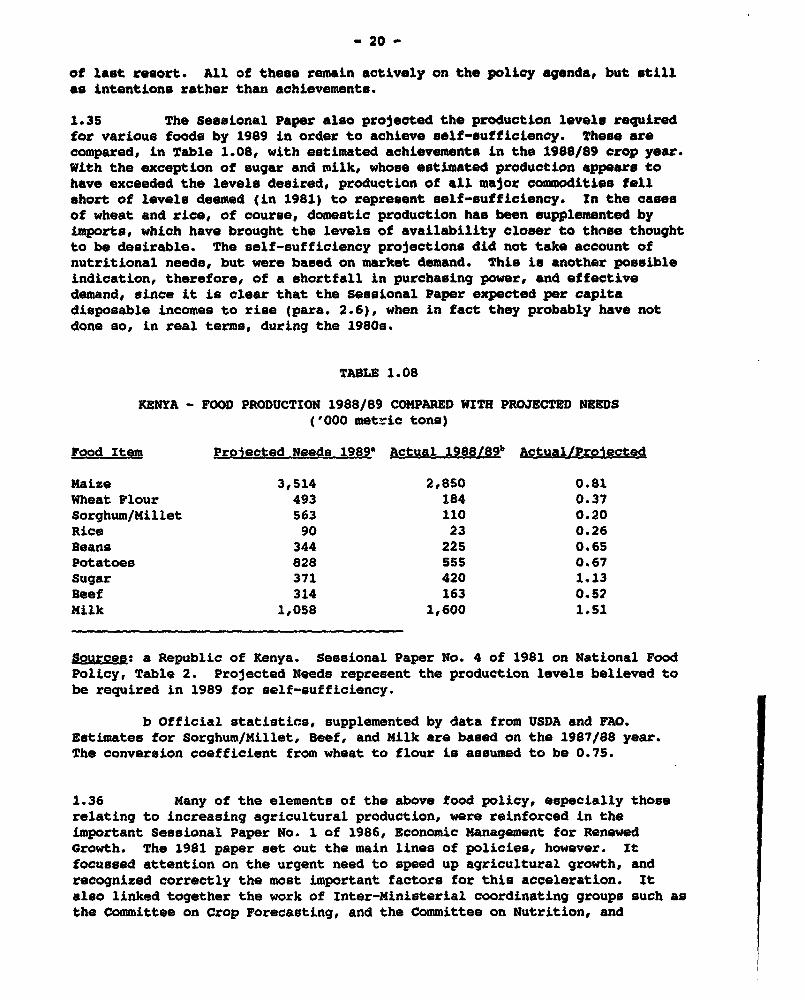
- 20 -
of last resort. All of these remain actively on the policy agenda, but stillas intentions rather than achievements.
1.35 The Sessional Paper also projected the production levels requiredfor various foods by 1989 in order to achieve self-sufficiency. These arecompared, in Table 1.08, with estimated achievements in the 1988/89 crop year.With the exception of sugar and milk, whose estimated production appears tohave exceeded the levels desired, production of all major commodities fellshort of levels deemed (in 1981) to represent self-sufficiency. In the causeof wheat and rice, of course, domestlc productLon has been supplemented byLmports, which have brought the levels of availabilLty closer to thnse thoughtto be desirable. The self-suffLcLency projectLons did not take account ofnutritional needs, but were based on market demand. This Ls another possibleindLcatLon, therefore, of a shortfall ln purchasing power, and effectivedemand, since it is clear that the Sessional Paper expected per capitadisposable incomes to rise (para. 2.6), when in fact they probably have notdone so, in real terms, durLng the 1980e.
TABLE 1.08
KENYA - FOOD PRODUCTION 1988/89 COMPARED WITH PROJECTED NEEDS('000 metric tons)
Food Item Proiected Needs 19896 Actual 1 98 8/89 b Actual/Proiected
Maize 3,514 2,850 0.81Wheat Flour 493 184 0.37Sorghum/Millet 563 110 0.20Rice 90 23 0.26Beans 344 225 0.65Potatoes 828 555 0.67Sugar 371 420 1.13Beef 314 163 0.52Milk 1,058 1,600 1.51
Sources: a Republic of Kenya. Sessional Paper No. 4 of 1981 on National FoodPolicy, Table 2. Projected Needs represent the productlon levels believed tobe required in 1989 for self-sufficiency.
b Official statistics, supplemented by data from USDA and FAO.Estimates for Sorghum/Millet, Beef, and Milk are based on the 1987/88 year.The conversion coefficient from wheat to flour is assumed to be 0.75.
1.36 Many of the elements of the above food policy, especLally thoserelating to increasing agricultural production, were reinforced in theimportant Sessional Paper No. 1 of 1986, Economic Management for RenewedGrowth. The 1981 paper set out the main lines of policies, however. Itfocussed attention on the urgent need to speed up agricultural growth, andrecognized correctly the most important factors for this acceleration. Italso linked together the work of Inter-Ministerial coordinatlng groups such asthe Committee on Crop Forecasting, and the Committee on Nutrition, and

- 21 -
clarified the roles of various Mlnistries. It was not to be long before the6sstructures were tested by the drought of 1984. Overall, while the SessionalPaper set a general policy framework, it lacked many specific recommendationsabout how to achieve the objectives it spelled out, and implementation of evenits general policies was slow and spotty. In the opinion of one observer, thepaper may have achieved both more specificity and faster, more completeimplementation, had its preparation been through a process of extensiveconsultation and discussion with field-level people, instead of from the topdown.l1
The Drought of 1984
1.37 The account and discussion in this and the following sectionsdraws heavily upon Borton (1988), Downing et al (1987) and Cohen & Lewis(1987).y We will outline the scope and effects of the drought, discuss thereponses by Government, the donors and the NGOs, and draw out lessons to belearned for the future.
1.38 The drought of 1984 was preceded by a year in which rainfall hadbeen normal in most parts of the country, but lower than average in northernand eastern areas, where the long rains either failed competely (Kitui) orwere spotty (Marsabit, Meru), and the short rains failed more widely. KituiDistrict received only 25% of its average rainfall. Thus many pastoralists inparticular were already in trouble going into 1984, and livestock deaths hadalready begun in affected areas.
1.39 In 1984 there was failure of the long rains throughout thecountry, with the exception of areas in the extreme west around Lake Victoria,and on a narrow coastal strip bordering the Indian Ocean. Data given belowfor the scope of the rainfall failure may understate the situation, because insome areas such rain as there was fell within very concentrated time periods(four days in one location), and therefore was much less useful than theamounts would suggest. The extent of the shortfalls is summarized in Table1.09, along with forecasts of them made by the Meteorological Department.
1/ John M. Cohen. Missed Opportunities? Participatory Planning and Kenya'sNational Food Policy Paper. African Studies Association, 26th. AnnualConference, Boston, December 1983.
2/ John Borton. The 1984/5 Drought Relief Programme in Kenya: A ProvisionalReview. Relief & Development Institute Discussion Paper No. 2. London,revised March, 1988.
Jeanne Downing, Leonard Berry, Lesley Downing, Thomas E. Downing andRichard Ford. Drought & Famine in Africa, 1981-1986: The US Response. ClarkUniv. & Institute for Development Anthropology. Mimeo, 1987.
John M. Cohen & David B. Lewis. Role of Government in Combatting FoodShortages: Lessons from Kenya 1984-85. Ch. 12 in Michael H. Glantz (ed).Drought and Hunger in Africa: Denying Famine A Future. Cambridge UniversityPress, 1987. 269-296.
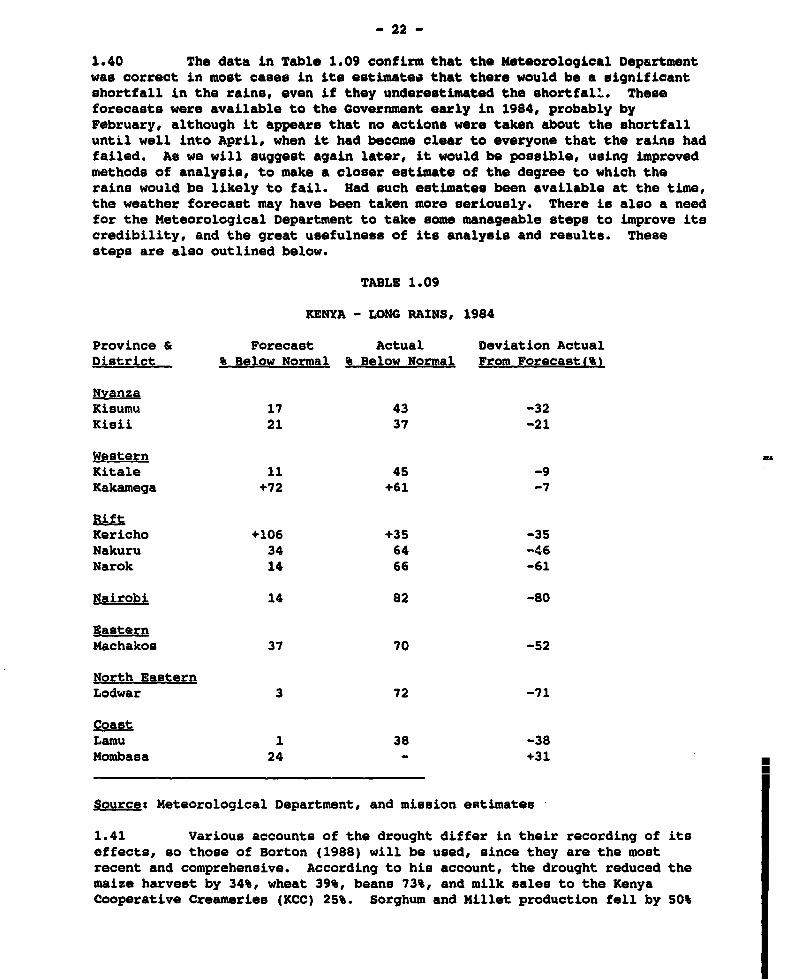
- 22 -
1.40 The data in Table 1.09 confirm that the Meteorological Departmentwas correct in most cases in ito estimates that there would be a oignificantshortfall in the rains, even if they underestimated the shortfal-l. Theseforecasts were available to the Government early in 1984, probably byFebruary, although it appears that no actions were taken about the shortfalluntil well into April, when it had become clear to everyone that the rains hadfailed. As we will suggest again later, it would be possible, using improvedmethods of analysis, to make a closer estimate of the degree to which therains would be likely to fail. Had such estimates been available at the time,the weather forecast may have been taken more seriously. There is also a needfor the Meteorological Department to take some manageable steps to improve itscredibility, and the great usefulness of its analysis and results. Thesesteps are also outlined below.
TABLE 1.09
KENYA - LONG RAINS, 1984
Province & Forecast Actual Deviation ActualDistrict % Below Normal % Below Normal From Forecast(%)
NvanzaKisumu 17 43 -32Kisii 21 37 -21
WesternKitale 11 45 -9Kakamega +72 +61 -7
RiftKericho +106 +35 -35Nakuru 34 64 -46Narok 14 66 -61
Nairobi 14 82 -80
EasternMachakos 37 70 -52
North EasternLodwar 3 72 -71
CoastLamu 1 38 -38Mombasa 24 - +31
Source: Meteorological Department, and mission estimates
1.41 Various accounts of the drought differ in their recording of itseffects, so those of Borton (1988) will be used, since they are the mostrecent and comprehensive. According to his account, the drought reduced themaize harvest by 34%, wheat 39%, beans 73%, and milk sales to the KenyaCooperative Creameries (KCC) 2s%. Sorghum and Millet production fell by 50%

- 23 -
(Downing at al). Compared with averages for the 1978/79-1983/84 period, maizeproduction fell 11% in Western Province, 19% in Nyanza, 41% in Rift Valley(which accounted for 44% of the total shortfall), 74% in Eastern, and 86% inCentral.
1.42 Various surveys reported livestock deaths up to 80% of herds insix Districts of North Eastern Province (up to July, 1984), 50% in Baringo(Jan.-Sept. 1984), and 77% of cattle plus 32% of smaller livestock in Samburu(April 1983 to Nov. 1984). The livestock offtake in Samburu was 76% of cattle(almost all deaths) and over 50% sheep and goats, while that in southernMachakos was 61% for all livestock (75% deaths). Losses in all of Kenya'srangelands were estimated equivalent to US$255 million. Slaughterings at theKenya Meat Co. had risen from 7,000 to 23,000 per month by August 1984, withaverage carcase weights for cattle down from 130 kg to 80 kg. Prices forlivestock are reported to have declined precipitously, but there are noreliable price series to confirm this.
1.43 While tea production was reduced slightly (3%), and coffee alittle more (18%), fortuitous circumstances raised export earnings from thesetwo crops to record highs in 1984, and again in 1985. For coffee, Kenyareduced its high stocks to sell record amounts at prices which increased 22%in 1983, a further 18% in 1984, and yet another 5% in 1985. When Indiawithdrew temporarily from the tea market in 1984, prices rose 68% and thevalue of Kenya's export earnings from this source increased by 54%. Whenprices fell back (by 27%) in 1985, Kenya increased its exports by 38% so thatexport earnings rose again. These overall effects are summarized in Table1.10.
TABLE 1.10
KENYA - COFFEE & TEA - VALUE OF EXPORTS, 1982-1985(Index, 1982 = 100)
1982 1983 1984 1985
Coffee 100 111 141 160Tea 100 159 244 247Coffee + Tea 100 128 177 190
Value (KE million) 222 284 392 422
Source: Data from Economic Surveys & Statistical Abstracts; mission estimates
1.44 Assisted by these developments in its two major exportcommodities, Kenya entered the drought with very substantial foreign exchangereserves, and these reserves increased throughout the period, in spite ofrecord food imports, costing somewhere between US$65 million and US$100million, and imports in general which increased by 26% in 1984. We willdiscuss further below the importance of this foreign exchange situation forKenya's ability to deal with the drought.
1.45 In 1984 the country's GDP grew by only 0.8% compared with anaverage of 4.3% pa for the three previous years. Without the increased export

- 24 -
value of coffee and tea, GDP growth may have been negative. There have beenno detailed estimates of other losses from the drought, such as the effectsupon agro-industries of the much reduced crop and livestock output forprocessing, the effects upon industrial production of reduced incomes and thusdemand for its products, and the longer term effects of retarded growth inLnvestment.
1.46 What limited information there is on health effects confirms therise in undernutrition, both of adults and children. Dramatic increases werereported in the numbers of malnourished children being vrought to clinics runby CRS (130 scattered in various Districts). A more detailed study in EmbuDistrict (Collaborative Research Support Program 2R. oit.) reported declinesof 23% in the food intake of households from April to September, 1984. The Iprevalence of severe Protein Energy Malnutrition (PEM) (weight for age <60% of P
median and/or weight for height <75% of median) in children rose from 2% to6%. Between March and December, 1984, lead males in households lost anaverage of 4 kg in weight, and lead females 3 kg. Between August andDecember. 14-24% of school age children and toddlers lost weight, and 65-75%merely held their weight, not gaining any. In the worst three months,October-December, pregnant women in their third trimester nade only two thirdsof the weight gains they would have in other periods, and the incidence of lowbirth weights increased. The report concludes that the normal copingstrategies of food sharing, drought resistant crops, and off-farm employmentall failed to one degree or another in 1984.
1.47 In spite of the Government's very important decision to respondwith food supp'.ies largely through the market, prices for staples rosedramatically in the latter months of 1984, more in the regions furthest fromthe main supply centers. Restrictions on private sector inter-regionalmovement of maize appear to have intensified the price disparities amongregions. The proportionate increase in maize prices between January andNovember 1984, for example, varied from 14% in Mumias (Bungoma District) to260% in Mwingi (Kitui District in Eastern Province). Increases of over 100%during the year were common in Districts in the east (more details are inTable 1.11). While one element of these price increases is the differentialcost of transporting maize to various regions of the country, nevertheless themore severe effects upon poorer households located in the regions experiencingthe greatest increases can readily be appreciated.
Responses to the Drought
1.48 Two major events triggered decisions by Government to take action.These were the failure of the long rains (a fact obvious to all by the end ofApril, 1984), and the surge in NCPB sales of cereals beyond the expectedmonthly rate of 90,000 tons. It is important to note that the MeteorologicalDepartment had forecast a significant shortfall in the long rains at least twomonths before they began. If that forecast had estimated a much largershortfall than it did, and thus had been closer to what transpired in reality,perhaps more attention would have been paid to it. Perhaps the weatherforecasts do not draw the attention they deserve because of a perception ofinaccuracy, whether deserved or not (this question of perception is addressedfurther below, where we make recommendations about improvements to the weatherforecasting system).

- 25 -
1.49 In any event, the Government response began in earnest in May andJune. On June 13, the President established a National Famine Relief Fund forprivate donations (some KSh 40 million fUS$2 m] was donated to this fund by1987). On June 19, Government made a formal request for donor assistance,estimating the food import needs for the next 12 months at 1 million mt ofmaize and 426,000 mt of wheat, with a further 424,000 mt maize and 84,000 mtwheat forecast for July-December, 1985 (imports of cereals totalled 858,000 mtin the event). On July 8, the first tender was announced for commercialsupplies of maize.
TABLE 1.11
KENYA - RETAIL MAIZE PRICES, 1984
January, 1984 November, 1984 IncreaseMarket (KSh/krz (KSh/kq) _
Kalundu 2.50 9.31 272Mwingi 2.50 9.00 260Kiambu 2.14 5.30 148Machakoe Town 2.40 5.76 140Iciara 2.53 5.94 135Limuru 2.02 4.19 107Runyenjes 2.57 4.70 83Thika 2.86 4.91 72Kandava 2.84 0.76 68Embu Town 2.92 4.89 67
Eldoret 2.00 2.92 46Kitale 1.51 2.11 40Bondo 2.50 3.33 33Ahero 2.51 3.19 27Sondu 2.31 2.73 18Mumias 2.35 2.69 14
Source: Republic of Kenya, Central Bureau of Statistics. Market InformationBulletin, Jan.-June and July-Dec., 1984.
1.50 Government acted in accordance with three prioritiess
(a) sufficient food through the normal market system;
(b) job creation in selected areas where the market system was not enough;
(c) free food distribution only as a last resort, in highly selected areas,through village level Famine Relief Committees, with selection ofpersons in need being made by the Chiefs.
As events unfolded, this approach largely achieved the effects desired, whichwere to work through institutional structures already in place, prevent panicand political unrest, do the job without undue dependence on externalassistance, and avoid fostering dependence on handouts. An ad hoc centraladministrative structure was set up quickly, and worked effectively. The

- 26 -
preparation of lists ty the Chiefs was also effective, and apparentlyequitable. Job creation programs fell short of expectations, and proved to bebeyond the administrative capacity already in place. Rather more free foodwas distributed as a result (close to 130,000 mt).
1.51 A brief account such as this must omit many of the multitudinousdetails which were important in dealing with the drought. Government facedmany difficult decisions and problems, among which were estimating the scopeof the likely food shortfall, the location and numbers of persons who wouldneed assistance, what types of assistance would be needed and when, foodrations, the capacities of the port, railways and road transport systems todeliver imported food to where it was needed at the least possible cost, thequantities, nature and sources of imported food, and when to stop importing (adecision whose ideal timing preceded full knowledge of whether the 1985 longrains would be good or bad).
1.52 Government also faced a host of logistical problems, many of whichwere resolved through reliance on the network of NGOs which assisted, and somethrough the strategy adopted. Working through the market, for example, meantthat the purchasing power of the population determined its access to most ofthe available food, while importing yellow maize (instead of the morepreferred white maize) was both cheaper at the time, and spurred somevoluntary self limiting in both total uptake and switching to alternativefoods as soon as they became available. Changing from free food distributionto food for work as the drought's effects diminished in early 1985 alsoinduced many to go off the handouts more quickly than they might haveotherwise.
Lessons from the Drought Experience
1.53 Forward Planning. The time from planting to harvest of the mainfood crops gives a certain amount of time for making arrangements to meetshortfalls, but it is barely enough for ensuring the timely arrival ofsupplementary supplies. An early warning system would buy more time forpreparation. A central proposition of the Cohen/Lewis paper (1987) is thatthe Government "prevented a potentially catastrophic famine frombeginning...without the kinds of permanent structures experts typically callfor". The point is well taken, but there are certain things which could bedone at little cost which would have bought the Government more time in 1984,and would stand it in good stead for a future food shortage.
1.54 Foremost among these is improving the capability and credibilityof the Meteorological Department's weather forecasts. (A more detailedassessment of the Meteorological Department is contained in a backgroundreport!/). This would involve widening the network of rainfall stations,especially in the ASAL areas and especially through systematic maintenance ofa larger number of voluntary collectors; improving computing facilities toenable better research on available data, increased specificity of forecasts,and a speedier response ae new data become available; using better prediction
;J Neil J. Cherry. Assessment of the Kenya Meteorological Department, ItsLong Range Forecasting and Timely Supply of Information to Farmers. (Mimeo)January, 1989.

- 27 -
models to &nalyze rainfall data (the more accurate predictions achieved fromspectral analysis than from low pass filter methods is demonstrated in thebackground paper); a deliberate campaign to increase confidence in the weatherforecasts, and disseminate the results through the mass media in a more timelyand widespread manner to the entire farming community. These steps couldachieve a much more accurate warning of the nature of the long rains at leasttwo months before their arrival. The value of this can be seen from the factthat NCPB exported 118,500 mt of maize during 1983, and a further 64,000 mt inthe first six months of 1984, equivalent to 22% of the commercial importswhich followed in the succeeding six months. Perhaps these exports would havebeen halted earlier (as they were during a similar scare about the long rainsprospects in 1987), had more attention been paid to a more reliable weatherforecast. In addition, with another three months of warning, the Governmentmay have been able to reduce commercial cereal orders even further by ensuringthe timely arrival of donated food aid, instead of seeing it trailing behindcommercial supplies by three months, as discussed below. These costs of nothaving a reliable early warning system are significant, and are likely tooutweigh additional costs of establishing and maintaining the system itself.
1.55 Equally important is establishing a detailed policv concerningdrought response, and a coherent set of procedures for identifying theseverity of the drought, estimating the population at risk, assessing foodimports needed, making decisions about free versus marketed distribution, foodversus cash in public employment programs, coordination with NGOs, determiningstandard rations, assessing transport capacity and handling food aid,potential for relaxing market restrictions, and guidelines for releasing foodfrom stores. Closer monitoring of selected indicators such as rising pricesand sales of livestock would locate areas of developing difficulty.
1.56 Certain initiatives were taken following the 1984 drought, such aspreparation under the auspices of the National Environment Secretariat of aseries of papers designed to learn lessons from the drought (status unclear,but intended to be completed in 1988); establishing a Food Sector MonitoringProject in the Central Bureau of Statistics to prepare and disseminate data oncrop forecasts, grain stocks, and market price movements (a promising firstFood Sector Bulletin was published in September, 1986, but no further issueshave become available, and it is not clear whether the effort was continued);improving nutrition monitoring through the Ministry of Health to include moreprecise indicators and more rapid reponse (the Child Health and NutritionInformation System (CHANISJ has made a good start with UNICEF assistance, andis in the process of being expanded); aerial surveys of maize by theDepartment of Resource Surveys and Remote Sensing in the Ministry of Planninghave scope for improving maize area estimates and the speed at which yieldforecasts may be prepared; the computerized Food Monitoring and Control System(FOMCOS) in NCPB has potential for making fast, accurate estimates of thelocality and size of grain stocks, but its efficacy depends on having timelyand accurate input of large quantities of data, and considerable stafftraining is now needed to get the most out of the system; the biggest lack isstill the timely availability of accurate basic agricultural data, especiallyestimates of planted areas, yield forecasts, and information on market prices.
1.57 Foreign Exchange, and Commercial Imports. As mentioned already,the healthy state of Kenya's foreign exchange allowed the Government to takethe decision to order commercial imports of cereals. The importance of this
- 28 -
is illustrated by the fact that while food aid was solicited earlier thancommercial orders were made, the first commercial shipments arrived in thenick of time, within three months of order, and a full three months before thearrival of the first significant food aid. Only 7% of the maize arriving
between the beginning of October and end January was food aid. As Bortonobserved: "It is clear that Kenya came very close to exhausting the stocks ofits primary staple in September. Had the Government delayed its decision to
purchase maize abroad, or instead chosen to await the arrival of donorshipments the country would most certainly have run out of food. This closecall vindicates the Government's decision to act decisively on its own behalf,
once it recognized that it had a severe crisis on its hands" (p. 23).
1.58 At the end of the second quarter of 1984, Kenya's foreign exchangeholdings, at US$422 million, were at their highest level for more than threeyears, and were 27% greater than they had been one year earlier. one year
later they had declined by only 8% in spite of a massive increase in imports.The crucial role played by coffee and tea exports has already been mentioned.
There was clearly an element of good luck in this, but it also vindicated the
Government's emphasis on, and encouragement of these exports, even if the
motivation for this was general expansion of foreign exchange earnings rather
than specific management of a drought situation.
1.59 The imports of yellow maize did involve certain costs, because
with the restoration of Kenya's own production of white maize Government was
left with considerable stocks of yellow maize which it was forced to re-export
at a loss (about 126,000 mt were re-exported, beginning in May, 1986, buyingprice US160/mt, selling price US$65/mt, for an estimated loss of US$12
million). With hindsight, Government could have stopped imports arriving more
quickly than it did, but this would have been a bold decision at the time it
had to be taken, prior to certainty about success of the long rains of 1985.
1.60 Role of MOOs. From October, 1984 to November, 1985 the relief
efforts coordinated by the Office of the President (OP) distributed about
114,000 mt of food, and the NGOs some 25-30,000 mt, as well as transportingsome 15,000 mt of the OP food relief. This food reached over 1.5 million
recipients in 25 of the country's 41 Districts, of whom approximately 75% werein Eastern Province (64% in Machakos District alone). The main features of
the NGO assistance were their ability to be flexible and innovative. Becausethe World Food Programme was able to make available maize from its own swap
exchange operations with the Government, and CARE was able to provide fundsfor transport, the NGOs were able to get off to an early start in October,1984, some two months before the Government food distribution entered itsdecisive phase.
1.61 Of course some NGOs had been providing significant food reliefalready under a number of ongoing programs, amongst which were the new effortsbegun in May, 1984 by the Kenya Red Cross Society (KRCS), the African Medicaland Research Foundation (ANREF), and OXFAM in North Eastern Province. Notableamong innovative approaches to relief was the "Grain-for-Livestock ExchangeScheme" devised by these NGOs to assist the pastoralists in the area. Thisscheme buffered the effects of rapidly falling prices of livestock underforced sale conditions, and provided valuable protein in a situation ofgeneral food shortage.
- 29 -
1.62 There were problems, however, with coordination between theGovernment and NGOs. Without the ability of WFP to provide grain from its ownarrangements with Government, it is unlikely that the NGOs would have beenable to begin relief distributions as early as they did, because of delays indeciding whether they would have access to Government food stocks. When theWFP supplies ran out there was still confusion and delay over this decision.Later there were difficulties in some regions about avoiding overlap betweenNGO activities and those of the much larger official relief scheme. Theadministrative structure set up by Government, with the Kenya National Councilof Social Services (KNCSS) charged with coordinating NGO activity, provedclumsy, and would have slowed down the NGO response time had it not beenlargely bypassed as events unfolded. The importance of good relationships andtrust tetwsen Government and the NGOs, at both central and local levels, wasclearly demo,nstrated, and efforts to build and maintain such trust are vitalfor enhancing preparedness for future relief operations, and for Government tobe able to make better use of NGO capability.
1.63 Job Creation Programs. The Government had planned to distributeas much as possible of the food aid provided by donors in the form of food forwork programs rather than as free food handouts. These food for workactivities were planned to create temporary employment in dam construction,soil conservation projects and roadworks, implemented by the Rural WorksProgramme of the Ministry of Finance and Development Planning, with fundsdisbursed to Districts for labor intensive infrastructure projects. It wasestimated that such projects could create up to 250,000 job opportunities.itIn the event, the administrative capacity to implement large scale publicworks programs at such short notice proved to be lacking. The projects takenup in the initial rounds of food relief distribution implied a level of jobcreation of only 25,000. Early in 1985, when the food crisis was beginning toease, local officials organized locally designed food for work projects whichapparently put a significant number of the able-bodied recipients to work.This also had the effect of inducing some reductions in the recipient rolls,as already mentioned above. From a peak of 1,575,000 in October, 1984, thesenumbers were reduced to 1,288,500 by January, 1985; 835,800 by April; 530,900by August, and 319,400 by October.
1.64 It is a clear lesson from the drought experience that effectivejob creation programs need to be prepared and ready for action as soon as theneed for them arises in an emergency. This preparation includes carefulshaping of priorities, in order that such programs should be productive, andnot merely makework initiatives. Technical and supervisory personnel need tobe trained and ready. It is a recommendation of this report that rural publicworks programs should be expanded during "normal" times in Kenya as a means ofaddressing persistent food poverty problems, and establishing and maintainingproductive infrastructure. if this recommendation is adopted, there would bein place ongoing institutional arrangements which could be expanded duringemergencies. It would also be necessary, however, to have prepared a "shelf"of productive projects, with priorities carefully thought through, which wouldbe ready to be taken up at short notice.
j/ Office of the President (1984). Guidelines on Food Supply andDistribution. Circular sent to District officials 21 August, 1984.

- 30 -
1.65 Infrastructure. During the frenzied preparation discussions whichfollowed acceptance of the need for Government action about the drought, therewas considerable concern about whether the port facilities at Mombasa and
transport facilities up country would be able to accomodate arrivals ofcereals which were estimated to be 1 million mt over a nine month period,averaging 3,300 mt per day. In the event, all proved adequate, although thetransportation capacity of the railways was initially overestimated, and road
transportation had to take up the slack. Table 1.12 summarizes theachievements. In the peak month, November, the transportation infrastructurehandled an average of over 4,300 tons per day throughout the month. Theweighted average distance transported for all grain was 550 km.
TABLE 1.12
KENYA - MOVEMENTS OF CEREALS FROM MOMBASA UP-COUNTRY, 1984/85('000 metric tons)
Maize Wheat All CerealsMonth Rail Road Total Rail Road Total Grand Total
1984September 15 2 17 - - - 17October 26 33 59 70 - 70 129November 15 83 98 32 - 32 130December - 31 31 31 - 31 62
1985January 6 45 51 27 - 27 78February - 51 51 9 - 9 60March - 6 6 10 18 28 34
Totals 63 250 313 179 18 197. 510
Source: National Cereals & Produce Board. Distribution of Imported grains in
Kenya: 1984/85. A Discussion Paper.(mimeo) l9pp.
1.66 Unfortunately there is not available any analysis of the outcomewith respect to another concern current in the planning, which was that theresources needed to handle the large food imports might squeeze out othervital commodity imports, including agricultural and industrial inputs(especially fertilizer), or that it might disrupt the flow of importantexports. Nor is it clear what additional costs were incurred by the necessityto rely more heavily than first expected on ro#i transport rather than rail(one document contains a suggestion that road transport may have cost KSh 1.36per ton per km, compared with the rail at KShO.5 per ton per km).
1.67 Nor is there any analysis of logistical problems beyond the mainstorage depots, which were the destination of the grain movements recorded inTable 1.12. How efficient were the roads, and the vehicles available, attaking the food from the depots out to the localities where it was needed?This is one of the important areas where not enough of an attempt seems tohave been made to learn lessons from the drought experience. The answer isimportant not only in preparation for a possible recurrence of the food
- 31 -
shortfall conditions of 1984/85, but in establishing priorities for upgradingroads, which could form a major component of public works programs designed toalleviate undernutrition problems in rural areas, and accelerate the eventualmovement of people out of agriculture.
1.68 seed supplies. The rehabilitation phase after a drought lastswell beyond the return of more normal agricultural conditions, and one of thecritical needs during rehabilitation is availability of seeds, whose stockshave usually been depleted during the drought, both by their being consumed asfood, and from the fact that weather conditions while the drought lasts arenot conducive to their production. There seems to have been a seriousshortage of both maize and bean seeds for the plantings of the 1984 shortrains and 1985 long rains. The NGOs assisted with this, and UNICEF supplied210 tons of seed for Machakos and Kitui in September, 1984, but the NGOsgenerally were unable to procure adequate seed supplies for any significantdistribution for the long rains planting. The Government, through the KenyaSeed Company (KSC), used irrigated land in the Bura Scheme to produce some 720mt of maize seed of the Katumani variety in time for the long rains, and theNational Famine Relief Fund established by the President distributed about 760mt of maize seeds to 20 Districts during 1984 and 1985.
1.69 Following the drought, however, there has been very littleprogress in addressing the seed problem in preparation for a possible returnof adverse conditions. Requests by the KSC for investment resources toestablish irrigation facilities on their main seed farm near Kitale have notbeen granted, and the economic justification for such facilities in any caseis not clear. Establishing a national stock of seeds for use in emergenciestherefore remains on the list of things which the Government has yet to bringinto being. Because of the risks involved, and the likely low profitabilityof such a stock, it is not something which the commercial seed productionsystem is willing to handle without a subsidy. It would probably be lesscostly for it to be subsidized, however, than for a stock to be produced andhandled by the public sector. In any event, the problem should be addressed.
1.70 Grain Stocks. One of the apparently fortuitous elements for Kenyain coping with the events of 1984 was that at the beginning of planning tomeet the drought emergency, stocks of maize were at levels higher even thancalled for by the national food policy. This was the case in spite of maizeexports, which continued in the opening months of 1984, as mentioned above.The Sessional Paper on National Food Policy had set a target of a minimum 4million bags (360,000 mt) for maize stocks, and about 6 million bags (540,000)were actually in stock at the beginning of May, 1984, when it became obviousthat a significant harvest shortfall from the long rains crop would ensue.These stocks bought the country time to request food aid and commercialimports. In the event, about the time the first commercial shipment arrivednear end September, NCPB stocks had dropped below the 100,000 mt, which FAOregarded as the minimum safe level of working stocks for Kenya. In theabsence of supplementation, these stocks may have lasted barely a month.
1.71 Perhaps influencad by this experience, as well as the ostensiblereason of increased population since the last revision, the Cabinet in late1987 increased the minimum stocks to 6 million bags of maize, and 500,000 bagsof beans ;up from the then current 300,000 bags), at the same timerecommending analysis of a proposal in the NCPB Reorganization Study for
- 32 -
adoption of a flexible reserve policy (the study estimated that, based onexperience over the past seven years, and linking reserve stock needs toexternal trading possibilities, the minimum reserve of maize would not need torise above 4.4 million bags in any month, and could be drawn down as low as2.2 million bags in November, in anticipation of the period when peakpurchases by NCPB are possible). This analysis has not yet been done.
1.72 Were the high reserves in 1984 fortuitous or not? On the face ofit this may seem a strange question, but the reason for raising it is torecognize the complex decision making of which the size of reserves at any onetime is only a part. Grain stocks are expensive to maintain, with costs ofstorage (under conditions allowing only moderate losses) added to theopportunity costs of the capital tied up, earning nothing. The decisionsinvolved for Kenya are particularly complex because domestic production ofmaize skates along the edge of self-sufficiency, with export possibilities insome years, followed (perhaps abruptly as was the case in 1984) by a need toimport. Switching from exports to imports can be expensive, since handlingand transportation costs alone between the main producing areas and the port(or for imports, between the port and the main storage depots), may amount toover US$110 per metric ton. Under these conditions, stocks are called upon toplay several diffet.at roles in assisting to meet diverse objectives ofGovernment, among which are:
(a) having on hand the working stocks to even out supplies for a market inwhich some consumers (farmers) may dispose of harvest early in theseason and buy back at a later time, while others buy evenly throughoutthe year;
(b) maintaining stable producer and cons ,mer prices throughout the season,in order to achieve incentive price and some measure of incomestability for producers (the estimates underlying this must include anassessment of substitution between maize and other crops by farmersbased on relative profitabilities), and consumption stability forconsumers;
(c) minimizing imports and maintaining self sufficiency in the country'smost important food staple;
(d) keeping as low as possible the fiscal costs of the whole exercise, andminimizing the need for subsidies.
1.73 These objectives are competing, rather than complementary, asdemonstrated in a recent study! of the costs of trade-offs among them. Theunderlying production instability which cannot be avoided because it is atleast partly weather induced, must translate into variability in eitherconsumption, trade, or stocks. The study shows that success in reducingimports while keeping prices within a chosen band between minimum and maximum,would increase costs significantly, and that these costs would be higher,
1/ Thomas C. Pinckney. Storage, T!ade, and Price Policy Under ProductionInstability: Maize in Kenya. International Food Policy Research InstituteResearch Report No. 71, December, 1988.
- 33 -
the narrower the desired price band (the lower the price fluctuationspermitted). The study analyzes cost differences between optimal strategies,which are often quite complicated, and the simpler price band/buffer stockpolicies adopted more frequently in practice, showing the latter to besignificantly more costly. Although acknowledging that there are many otherpossible scenarios than those evaluated in the study, it also points out thattwo important generalizations can be mades
(a) to be efficient, some price flexibility must be allowed, and thereforesome consumption variability expected in the systemi costs escalate withattempts to maintain perfect price stability; and
(b) policy can be made more efficient by trying to correlate official pricechanges with changes occurring in world prices, domestic production, andlevels of stocks.
1.74 Government commissioned a grain pricing study in 1989, with theintention of assessing various ways of setting price bands compatible withNCPB's becoming a buyer and seller of last resort, and moving towards reducingits monopoly position in the maize market. The study includes wheat, rice andben.ns as well. There is no indication when the flexible reserve conceptrecommended in the grain marketing study which preceded the reorganization ofNCPB will be examined.
1.75 It is a recommendation of this report that an analysis of theeffects of new pricing regimes on low income households should be completed aspart of the process of implementing the new price regimes. The outcome ofsuch analysis should be to allow realization of the efficiency gains inherentin any new pricing arrangements, while protecting vulnerable groups in thepopulation by making special arrangements for them, such as targettedinterventions which would at least maintain, and if possible improve theirability to secure the food they need, regardless of what happens to prices ina more liberal grain marketing system (this is discussed further in Chapter1II). The Government is planning to carry out such an impact study during1991, under the Second Agricultural Sector Adjustment Operation.
1.76 Price Differentials. As noted above (para. 1.47), theGovernment's restrictions on private sector inter-regional movement of maizeseverely exacerbated the differences in prices throughout the country duringthe drought, with adverse consequences for vulnerable groups in regions whereprices were highest. rhis prompted one commentatorl' to question whether theGovernment's strategy made the best use of available opportunities. While thestrategy attempted to use food imports to hold food prices down, rather thanextend income support on a wide scale, imported food had to be delivereddirectly to worst affected areas at least in part because internal trade wasso hobbled by movement restrictions. Price differentials remained very widein spite of these direct interventLons. Dreze and Sen conclude, "it appearsthat, in some respects, government intervention during the drought was undoingwith one hand the harm it had done with the other." (p.146)
J/ Jean Dreze and Amartya Sen. Hunger and Public Action. Oxford UniversityPress, 1989.

- 34 -
H. FOOD, NUTRITION AND INCOMES
2.01 In this chapter, we examine the demand side of the food equationin Kenya. First, a review of the nutritional status of the population,especially of children, is used to assess the adequacy of food intake, andindicate groups at risk and their geographical location. Second, analysis ofincome and expenditure patterns and their distribution demonstrates the mostimportant underlying cause of inadequate food intake, namely poverty. Third,analysis of food prices shows how price fluctuations affect producers andconsumers in rural areas, particularly the poorer ones. Finally, the specialneeds of women, and households in arid and semi-arid areas are examined.
Nutritional Status
2.02 The main sources of knowledge about the nutritional status of thepopulation in Kenya are thret Child Nutrition Surveys carried out in 1977,1978/79 and 1982. Results from a fourth survey in 1987 have not yet beenreleased. The surveys used anthropometric indicators, which is the mostdirect method of assessing the nutritional status of children. This methodinvolves comparing children in a sample drawn from the Kenyan population withstandards for a reference population which has experienced adequate nutrition.Although these standards were drawn up for the U.S. population, they areregarded as valid for Kenya. A review of studies on the growth of wellnourished children in Kenya and other East African countries concludes: "thedata strongly support the view that ethnic differences are very much lessimportant than other factors as causes of growth failure in children."'Furthermore, a study of children from middle-income families in Nairobi showedthat their growth during the first year of life was virtuallyindistinguishable from that of children in the North American referencepopulation.y
2.03 The anthropometric measures express each child's condition as apercentage of the median measure for the standard or reference population. Acutoff point is set above which a child's growth is regarded as normal, andbelow which there is cause for concern about a child's growth in relation tothe standard. The three common measures used are:
(a) weight for height - this assesses acute undernutrition, with acutoff point set at < 90% of the median ln the standard population; achild falling below this in weight for height is regarded as sufferingfrom nutritional wastinq;
/ L.S. Stephenson, M.C. Latham & A. Jansen. A Comparison of GrowthStandards: Similarities Between NCHS, Harvard, Denver and Privileged AfricanChildren and Differences With Kenyan Rural Children. Cornell InternationalNutrition Monograph Series, No. 12. Cornell University, 1983
2/ S.A. Lakhani & A.A.J. Jansen. Infant Feeding Practices Among MiddleIncome Urban Africans and Indians in Kenya. E.Africa Med.Jour. 1987, 122-130.
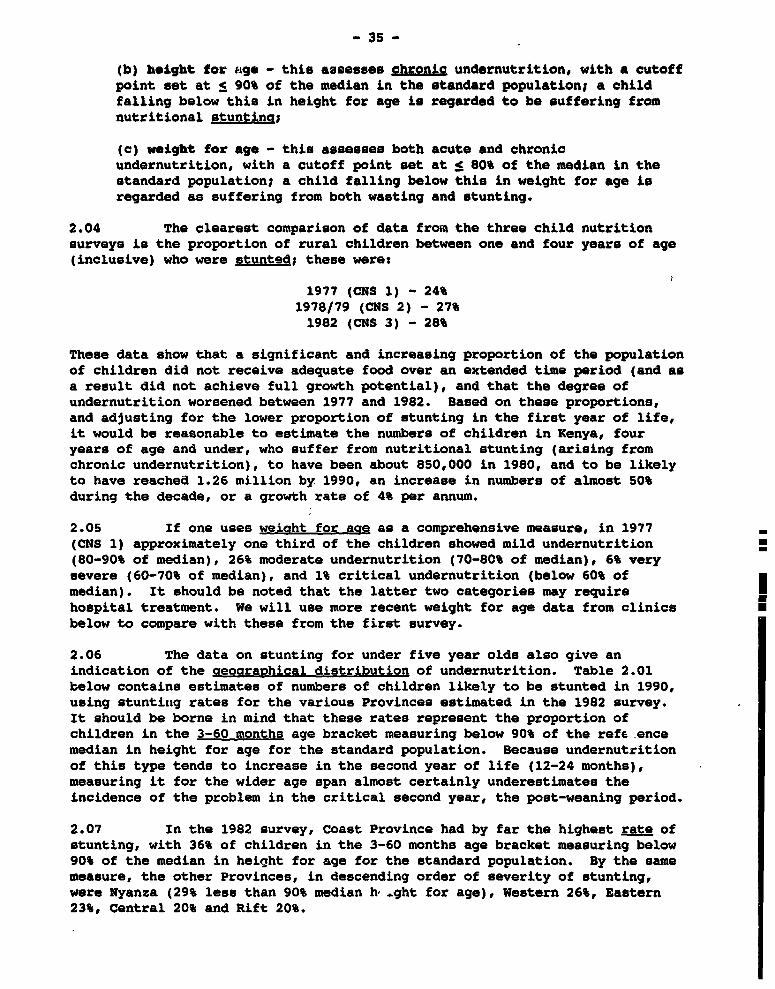
- 35 -
(b) height for age - this assesses chronic undernutrition, with a cutoffpoint set at c 90% of the median in the standard population; a childfalling below this in height for age is regarded to be suffering fromnutritional stuntina;
(c) weight for age - this assesses both acute and chronicundernutrition, with a cutoff point set at $ 80% of the median in thestandard population} a child falling below this in weight for age isregarded as suffering from both wasting and stunting.
2.04 The clearest comparison of data from the three child nutritionsurveys is the proportion of rural children between one and four years of age(inclusive) who were stunted; these were:
1977 (CNS 1) - 24%1978/79 (CNS 2) - 27%1982 (CNS 3) - 28%
These data show that a significant and increasing proportion of the populationof children did not receive adequate food over an extended time period (and asa result did not achieve full growth potential), and that the degree ofundernutrition worsened between 1977 and 1982. Based on these proportions,and adjusting for the lower proportion of stunting in the first year of life,it would be reasonable to estimate the numbers of children in Kenya, fouryears of age and under, who suffer from nutritional stunting (arising fromchronic undernutrition), to have been about 850,000 in 1980, and to be likelyto have reached 1.26 million by 1990, an increase in numbere of almost 50%during the decade, or a growth rate of 4% per annum.
2.05 If one uses weiaht for aae as a comprehensive measure, in 1977 _(CNS 1) approximately one third of the children showed mild undernutrition(80-90% of median), 26% moderate undernutrition (70-8C% of median), 6% verysevere (60-70% of median), and 1% critical undernutrition (below 60% ofmedian). It should be noted that the latter two categories may require Ihospital treatment. We will use more recent weight for age data from clinics N
below to compare with these from the first survey.
2.06 The data on stunting for under five year olds also give anindication of the aeoaraphical distribution of undernutrition. Table 2.01below contains estimates of numbers of children likely to be stunted in 1990,using stunting rates for the various Provinces estimated in the 1982 survey.It should be borne in mind that these rates represent the proportion ofchildren in the 3-60 months age bracket measuring below 90% of the refe .encemedian in height for age for the standard population. Because undernutritionof this type tends to increase in the second year of life (12-24 months),measuring it for the wider age span almost certainly underestimates theincidence of the problem in the critical second year, the post-weaning period.
2.07 In the 1982 survey, Coast Province had by far the highest rate ofstunting, with 36% of children in the 3-60 months age bracket measuring below90% of the median in height for age for the standard population. By the samemeasure, the other Provinces, in descending order of severity of stunting,were Nyanza (29% less than 90% median h-.ght for age), Western 26%, Eastern23%, Central 20% and Rift 20%.

- 36 -
TABLE 2.01
KENYA - DISTRIBUTION OF STUNTED CHILDREN BY PROVINCE, 1990
Province Est. Child Population Est. % Stunting Est. No. Children0-4 years. 1990 _ Stunted
Nyanza 914,000 29 265,000Rift Valley 1,182,000 20 236,000Eastern 932,000 23 214,000Western 640,000 26 166,000Coast 430,000 36 155,000Central 790,000 20 158,000Nairobi 257,000 17 44,000North Eastern 120,000 20 24,000
TOTALS 5,265,000Y 24 1,262,000
_/ Republic of Kenya, Central Bureau of Statistics. Population Projectionsfor Kenya 1980-2000. March, 1983.
b/ This number is likely to top 8 million, or 21.5% of the population, by theyear 2000, according to the Government's Household Food Security paper.
2.08 Data for the 27 Districts included in the survey are outlined inTable 2.02. Half of the stunted children were in just seven Districts -Kilifi, Kisii, Kakamega, Machakos, South Nyanza, Nakuru and Siaya - most ofwhich also had rates of stunting above the national average.

- 37 -
TABLE 2.02
KENYA - DISTRIBUTION OF STUNTED CHILDREN BY DISTRICT, 1982
District Province Est. % Stunting Est. No. ChildrenStunted. 0-4 yeare
('000)Kilifi/Tana R./Lamu Coast 42 76
Kwale Cocst 39 23Siaya Nyanza 37 40Nakuru Rift Valley 35 41Kisii Nyanza 31 75Kitui Eastern 30 30Kakamega Western 27 67South Nyanza Nyanza 25 48Murang'a Central 25 40Bungoma Western 25 32Kirinyaga Central 25 17Machakos Eastern 23 53Embu Eastern 22 13Busia Western 21 15Narok/Kajiado Rift Valley 20 18Kisumu Nyanza 20 22Baringo/Laikipia Rift Valley 19 16Trans Nzoia Rift Valley 19 13Elgeyo Marakwet/West Pokot Rift Valley 19 13
Nyeri Cerntral 19 20Kericho Rift Valley 18 29Uasin Gishu Rift Valley 18 12Kiambu Central 18 26Meru Eastern 17 34Taita Taveta Coast 15 4Nyandarua Central 12 7Nandi Rift Valley 12 8
TOTALS 27 792
Source : Republic of Kenya, Central Bureau of Statistics. Situation Analysisof Children & Women in Kenya. August, 1984, Section 4, p. 59.
2.09 Table 2.03 below, compiled for the same report as for Table 2.02,brings together data on nutrition, child mortality, morbidity (sickness), andeducation of mothers by Provinces. As buggested already, the data fornutritional stunting underestimate the severity of the problem for childrenbetween one and five years of age, because they include children from 3-12months, which covers pre-weaning (when a high proportion of children haveadequate nutrition), and immediate post-weaning (when the undernutrition manychildren begin to experience has only started to have a stunting effect). Thecorrelation of nutritional status, mortality and mothers' education byProvinces, while not perfect, is nevertheless striking.
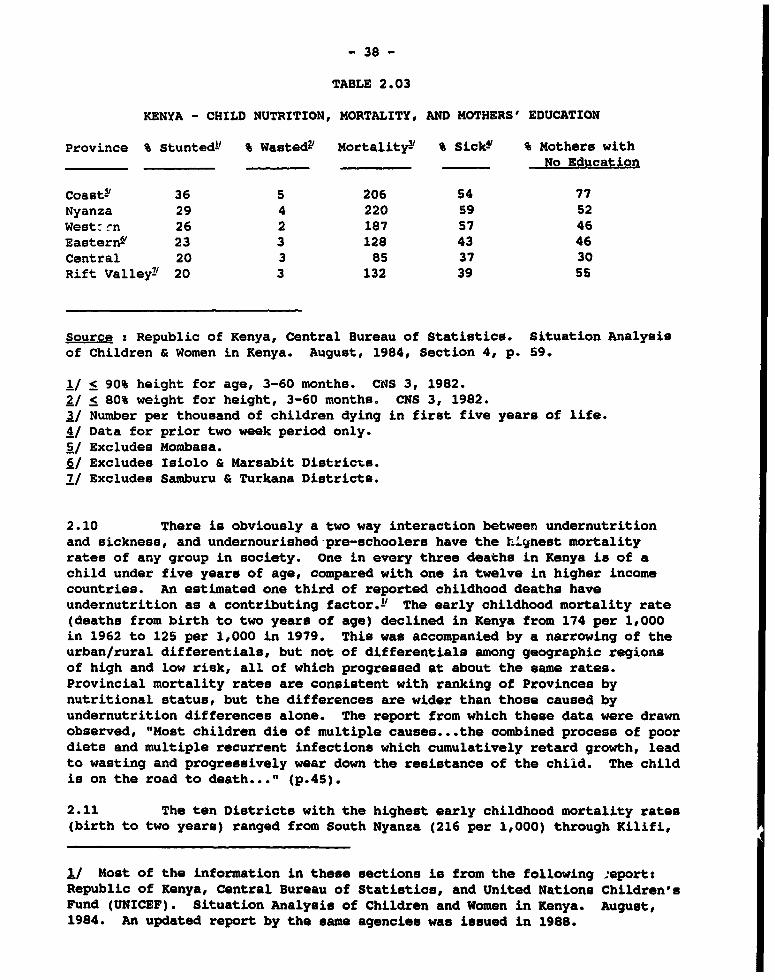
- 38 -
TABLE 2.03
KENYA - CHILD NUTRITION, MORTALITY, AND MOTHERS' EDUCATION
Province % Stunted! % WastedV Mortality!- % Sick % Mothers with_ No Education
Coast!' 36 5 206 54 77Nyanza 29 4 220 59 52West: en 26 2 187 57 46Eastern6' 23 3 128 43 46Central 20 3 85 37 30Rift Valley7' 20 3 132 39 55
Source : Republic of Kenya, Central Bureau of Statistics. Situation Analysisof Children & Women in Kenya. August, 1984, Section 4, p. 59.
1/ < 90% height for age, 3-60 months. CNS 3, 1982.2/ < 80% weight for height, 3-60 months. CNS 3, 1982.3/ Number per thousand of children dying in first five years of life.4/ Data for prior two week period only.5/ Excludes Mombasa.6/ Excludes Isiolo & Marsabit Districts.7/ Excludes Samburu & Turkana Districts.
2.10 There is obviously a two way interaction between undernutritionand sickness, and undernourished -pre-schoolers have the hlgnest mortalityrates of any group in society. One in every three deaths in Kenya i8 of achild under five years of age, compared with one in twelve in higher incomecountries. An estimated one third of reported childhood deaths haveundernutrition as a contributing factor.! The early childhood mortality rate(deaths from birth to two years of age) declined in Kenya from 174 per 1,000in 1962 to 125 per 1,000 in 1979. This was accompanied by a narrowing of theurban/rural differentials, but not of differentials among geographic regionsof high and low risk, all of which progressed at about the same rates.Provincial mortality rates are consistent with ranking of Provinces bynutritional status, but the differences are wider than those caused byundernutrition differences alone. The report from which these data were drawnobserved, "Most children die of multiple causes...the combined process of poordiets and multiple recurrent infections which cumulatively retard growth, leadto wasting and progressively wear down the resistance of the child. The childis on the road to death..." (p.45).
2.11 The ten Districts with the highest early childhood mortality rates(birth to two years) ranged from South Nyanza (216 per 1,000) through Kilifi,
1/ Most of the information in these sections is from the following :eport:Republic of Kenya, Central Bureau of Statistics, and United Nations Children'sFund (UNICEF). Situation Analysis of Children and Women in Kenya. August,1984. An updated report by the same agencies was issued in 1988.

- 39 -
Siaya, Lamu, Kisumu, susia, Xwale, West Pokot, Tana River, to Baringo (171 per1,000). In a ranking of Districts by nutritional stunting, five of these ten
Districts were ranked 1 (on a scale of 1 to 6, worst to best), one ranked 2,and four ranked 3. In Nairobi, mortality rates in the same early childhood
age group ranged from 41-51 per 1,000 in the most irosperous 10% of the city,to 109-152 per 1,000 in the poorest locations. The report from which thesedata were drawn concluded "the young child facee much higher risks in rural
than in urban areau and...these risks have not declined over time." (p. 19).
2.12 The data reported above from the three national Child NutritionSurveys are still the most representative available, but it would be useful to
have information for the period since 1982. We now examine more recent datadrawn from clinics operated by Catholic Relief Services (CRS). The biggestdisadvantage of these data is that we do not know how well they represent the
wider population. On one hand, the clinics from which the measurements weredrawn offered health aervices and some food supplements which may have led to
a degree of self-selection of those who have greater than average nutritionalproblems, but on the other hand the clinics were probably in the moreaccessible localities, and undernutrition in more isolated places would be
under-reported. The records also include disproportionate numbers of children
from some Districts of the arid and semi-arid areas such as Turkana, Nachakos
and Kitui. Nevertheless, the numbers of children for whom measurements weretaken were considerably greater than those in the national CNS samples, even
in the "mainstream" Districts. Furthermore, they allow disaggregation by
degrees of severity of undernutrition. The following observations are basedon data from 51,500 children in 1985, 30,000 in 1986, and 23,000 in 1987 (CNS
3 covered 5,323 rural children).
2.13 Using weiaht for aae. with a cutoff level of 80% of median of the
standard population, the CRS data show the proportion of children who were
undernourished falling from 51% in 1985 (following the 1984 drought whoseeffects continued well into 1985), through 42% in 1986, to 39% in 1987. These
were significantly greater than comparable weight for age data from the
earlier Child Nutrition Surveys, which ranged between 25% and 33%. Theproportions of children suffering from a more severe degree of undernutrition(< 70% of median weight for age) fell from 14.9% in 1985 to 9.7% in 1987, but
rose again to 11.1% in the first six months of 1988. A similar pattern showedfor yet more severe undernutrition (< 65% of median weight for age) which fell
from 6.2% of children in 1985 to 3.6% in 1987, before rising to 4.1% in thefirst six months of 1988.
2.14 The CRS data show a marked effect of seasonality, with the highestlevels of undernutrition consistently showing up in the months of February toApril, and the lowest in the last three months of the calendar year. Althoughthe agricultural cycles are somewhat different in different regions of thecountry, the worst period of undernutrition broadly coincides with theplanting season for maize, immediately before the "long rains" or during theearly part of the rains, when vegetables tend to be in short supply, andexcept for the small iarvests of "short rains" maize crops, maize supplies are
also beginning to run low.
2.15 The CRS data come from specific clinic locations which, whilescattered throughout the country, are too concentrated to provide a reliableguide to the aeoaraohical jattern of undernutrition. Leaving aside Nyanza and

- 40 -
Western Provinces (which are not included in the estimates available), in1986-88 the CRS data rank Nakuru and Eldoret (both in Rift Province), Garissa(Northeastern Province) and Mombasa as having the worst undernutrition,followed by Kitui (Eastern) and several Districts in Central Province.
2.16 In 1985, reflecting lingering effects of the 1984 drought, Kituiand Machakos (both semi arid Districts in Eastern P'-ovince which were severelyaffected by the drought) were sharply higher in the ranking of undernutrition,third and fifth respectively among CRS clinics. In that year, 54% of childrenin Machakos and 57% in Kitui were below the median weight for age of thestandard population, compared with 35% and 45%, respectively, for the twoDistricts in subsequent years. Data from 1979 to 1984 for cases of moresevere undernutrition in Eastern Province show that while the drought (1984)increased the number of cases in Meru District by 70%, it trebled the cases inMachakos.
Discussion of the Nutritional Situation
2.17 The major conclusions from the above are that chronicundernutrition is the lot of almost 30% of Kenya's children, and that theproblem is increasing both in terms of rates and absolute numbers of thoseaffected. There are three likely main causes of this undernutrition:
(a) underfeeding or using the wrong foods through lack of knowledge;
(b) disease; and
(c) poverty.
We discuss each of these in turn in the following sections. Following thatwill be a discussion of their interaction, and an attempt to constructprofiles for various parts of the country where different combinations ofcauses predominate, and therefore for which the prescriptions for policy andinvestment interventions may differ.
2.18 Lack of Knowledge. The two most important events during whichpoor feeding practices affect negatively the child's nutrition are Vreanancvand weanina. In Kenya both events are responsible to some extent for setbacksto children's growth. The degree to which the feeding practices associatedwith them result from lack of knowledge is difficult to determine, but it isclearly a contributing factor. A broad correlation between undernutrition andmothers' education is suggested in Table 2.03 above.
2.19 Two detailed studiesL' of the nutritional status of women duringpreanancv and its effect on the outcome of pregnancies were carried out inMachakos District in 1977/78 and Embu District in 1984-86. Both studies foundthat women's energy intake decreased steadily and substantially duringpregnancy. In the Machakos study, the average weight gain during the whole ofpregnancy was 5.8 kg, and in Embu also less than half of the recommendedweight gain of 12.5 kg. In Embu, only 8% of women gained more than 10 kg
1/ Reported in the Situation Analysis...1988 (OD. cit.), p. 117.

- 41 -
during pregnancy, and the majority of women lost weight during the last monthbefore parturition. The study concluded that "restrictions of intake duringthe third trimester to limit the size of a newborn at birth is not uncommon inKenya" .!'
2.20 In spite of the poor feeding and weight gain during pregnancy,however, the prevalence of low birth weight was only about 11%, although thereis some suggestion that the cutoff weight, set at 2.5 kg for Kenya, may be toolow to include all newborns at risk because of low weight. In the Embu study(CRSP, o. cit.) a further 14% of children had a birthweight between 2.5 and2.8 kg. What did seem clear from these studies was that taller women, who hadbeen better nourished during their own lives, tended to have heavier babies.There is therefore a strong possibility of a "vicious cycle" in whichundernourishment leads to stunting, which in turn leads to lower birthweightin the children from stunted mothers, and these children themselves becomestunted because they are not able to experience adequate catchup growth duringchildhood to overcome their initial handicap.
2.21 While there may be a degree of undernutrition in utero, partlyresulting from lack of knowledge, the main period of undernutrition forchildren is clearly between the ages of 6 and 24 months, and is associated atleast in part with weanina Dractices. It is common in Kenya, especially inrural areas, to prolong breastfeeding. In fact the average length of time forbreastfeeding was found in the second Child Nutrition Survey to be 14 monthsin rural areas and 10 months in urban areas. In CNS 3 (1982) the time was 18months in rural areas. This practice does not, in itself, cause nutritionalproblems, of course. But it is often associated with a late start tosupplemental feeding, and inadequate or contaminated supplementary foods.
2.22 According to CNS 3, almost one fifth of children had not beenstarted on supplements by the age of six months (45% in Kwale District, thehighest), about 60% received maize porridge as their sole supplement (over 90%in both Coast and Western Provinces), and 28% received no milk in weaning food(65% in Coast Province). Contaminated water supplies used to prepare weaningsupplements are a complicating factor introducing disease. The reasons forinadequate supplementation, either in quantity or quality, are likely to be acombination of lack of knowledge, use of breastfeeding as a birth controlmethod, and sheer poverty - insufficient means to purchase the right foods andamounts. The end result is a contribution to the significant decline innutritional status which takes place for many children between 6 months and 3years of age. This is illustrated by the data in Table 2.04 below for theproportion of children whose weight for age was less than 80% of the medianfor the standard reference population.
2.23 Disease. The Government concluded, in its 1988 Situation Analysisof Women and Children in Kenya, that "the overall pattern of childmorbidity... is dominated by communicable diseases and undernutrition and theinteraction of the two." The summaries of studies and other information on
I/ The Collaborative Research Support Program (CRSP) On Food Intake and HumanFanction: Kenya Project. School of Public Health, Univ. Calif., and Collegeof Health Sciences, Univ. wairobi. Final Report. 15 November, 1987. p. 370.
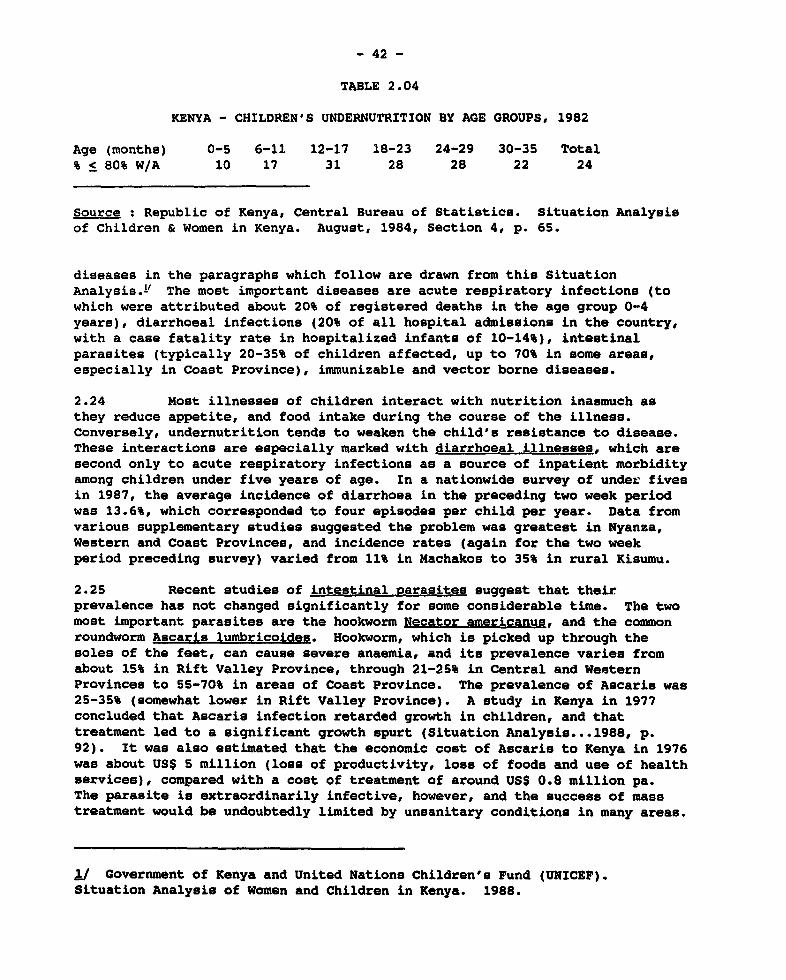
- 42 -
TABLE 2.04
KENYA - CHILDREN'S UNDERNUTRITION BY AGE GROUPS, 1982
Age (months) 0-5 6-11 12-17 18-23 24-29 30-35 Total% < 80% W/A 10 17 31 28 28 22 24
Source : Republic of Kenya, Central Bureau of Statistics. Situation Analysisof Children & Women in Kenya. August, 1984, Section 4, p. 65.
diseases in the paragraphs which follow are drawn from this SituationAnalysis.! The most important diseases are acute respiratory infections (towhich were attributed about 20% of registered deaths in the age group 0-4years), diarrhoeal infections (20% of all hospital admissions in the country,with a case fatality rate in hospitalized infants of 10-14%), intestinalparasites (typically 20-35% of children affected, up to 70% in some areas,especially in Coast Province), immunizable and vector borne diseases.
2.24 Most illnesses of children interact with nutrition inasmuch asthey reduce appetite, and food intake during the course of the illness.Conversely, undernutrition tends to weaken the child's resistance to disease.These interactions are especially marked with diarrhoeal illnesses, which aresecond only to acute respiratory infections as a source of inpatient morbidityamong children under five years of age. In a nationwide survey of under fivesin 1987, the average incidence of diarrhoea in the preceding two week periodwas 13.6%, which corresponded to four episodes per child per year. Data fromvarious supplementary studies suggested the problem was greatest in Nyanza,Western and Coast Provinces, and incidence rates (again for the two weekperiod preceding survey) varied from 11% in Machakos to 35% in rural Kisumu.
2.25 Recent studies of intestinal parasites suggest that theirprevalence has not changed significantly for some considerable time. The twomost important parasites are the hookworm Necator americanus, and the commonroundworm Ascaris lumbricoides. Hookworm, which is picked up through thesoles of the feet, can cause severe anaemia, and its prevalence varies fromabout 15% in Rift Valley Province, through 21-25% in Central and WesternProvinces to 55-70% in areas of Coast Province. The prevalence of Ascaris was25-35% (somewhat lower in Rift Valley Province). A study in Kenya in 1977concluded that Ascaris infection retarded growth in children, and thattreatment led to a significant growth spurt (Situation Analysis...1988, p.92). It was also estimated that the economic cost of Ascaris to Kenya in 1976was about USS 5 million (loss of productivity, loss of foods and use of healthservices), compared with a cost of treatment of around USS 0.8 million pa.The parasite is extraordinarily infective, however, and the success of masstreatment would be undoubtedly limited by unsanitary conditions in many areas.
1/ Government of Kenya and United Nations Children's Fund (UNICEF).Situation Analysis of Women and Children in Kenya. 1988.

- 43 -
2.2G Among .mmunizable diseases, measles is the biggest problem. Forthe age group 1-4 years, measles is the leading cause of death in Kenya, andit ranks third in the postneonatal period. Scattered studies show theproportion of deaths in 1-4 year olds associated with measles at 16% in NyeriDistrict (1982) and 26% in Siaya District (1981).I' A study in Nairobi (1986)showed that during measles the energy intake of patients fell by 75%.' Thenutritional consequences would obviously depend upon the length of the episodeand the nutritional status of the patient upon contracting the disease. Therelatively high death rates from this cause, however, point to the need toextend the immunization program to achieve more than the 66% coverageestimated in 1987.
2.27 Among vector borne diseases, malaria stands out. More than halfof all children are infected at least once before the end of the third monthof life. The disease is endemic in most Districts below 1,600 m in altitude,epidemic in areas over 1,600 m with high rainfall and in dry areas withexceptional rainfall, and causes little problem only at altitudes over 2,000
m. Although malaria shows up in a casual analysis of outpatient statistics asa more important cause of morbidity even than acute repiratory infections,this may represent over-reporting, since a lot of the outpatient facilitieslack the equipment or means to separate malaria from other causes of fever.Workers at the African Medical Research Foundation have found that only 28% ofcases diagnosed as malaria could be confirmed by parasitological examinationof thick blood films.y It remains, nevertheless, as a very important problemto be tackled, since unprotected children can expect an average of 2-3 attacksper annum, and it is estimated that adults may suffer from 10-20 days ofdisability per year as a result of the disease. The problems of organismsresistant to traditional methods of treatment are also well known. The othermajor vector borne disease is schistosomiasis (bilharzia). It was estimatedin 1976 that 42% of Kenya's population was exposed.<' The intensity ofinfection peaks in the age group 12-13 years.
2.28 As a result of some of the above diseases, especially internalparasites, and diets inadequate in certain nutrients, especially iron, it isestimated that at least one third of Kenya's children suffer from anaemia (65%of children in the age group 18-30 months in a 1987 study in Embu District).Anaemia is also a special problem for pregnant and lactating women. Therehave also been documented deficiencies in iodine in studies as late as 1983-84(Situation Analysis, g2. cit.), and it is not clear that iodization of salt,mandated in 1988 for all salt sold in Kenya, has yet become fully effective.
1/ G.W. Williams. Disease & Inequalities in Infant & Child Mortality inRural Kenya. IUSSP Seminar On Mortality & Society In Sub-Saharan Africa.Yaunde. 19-23 October, 1987.
2/ N.B. Duggan, J. Alwar & R.D.G. Milner. The Nutritional Cost of Measles InAfrica. Archives of Diseases in Childhood, 61:61-66.
3/ Situation Analysis...1988 (OD. c.), p. 98.
4/ World Health organization global survey, 1976. Cited in SituationAnalysis...1988, p. 99.
- 44 -
Income and Expenditure
2.29 This section reports on analysis of income and expenditurepatterns, in order to examine the extent of poverty, and discuss its possiblecontribution to the undernutrition problems documented above. The mainfindings of this section are the estimate that at least 20% of ruralhouseholds do not have enough income to afford a minimal nutritionallyadequate diet, and that the incidence of such "food poverty" has grown sincethe mid 1970s. The evidence suggests that food poverty is more marked inareas which are more isolated from the main international and domestic urbanmarkets.
2.30 The most recent comprehensive source of information on ruralhousehold incomes and expenditure patterns is the Rural Household BudgetSurvey conducted by the Central Bureau of Statistics in the 1981/8i period.Some of the findings of tnis survey were reported in the Government's EconomicSurvey of 1988 (Ch. 3). These published findings, usel in conjunction withot'her complementary statistical information from the same period, allow someestimates to be made of the pattern of expenditure, both in the averagehousehold and for various income groups.
2.31 An overview of the smallholder economy is provided in Table 2.05,which sketches characteristics of rural households. What immediately strikesthe observer is the extreme poverty of the bulk of rural households, shown byannual per capita incomes averaging Ksh 2,124 (US$185 equivalent at the time),with from 70% to 80% of the population below this level, small farms, and verylow ownership of farm tools and other assets even at the seventh decile of thedistribution. The lowest income groups, with almost 45% of households headedby women, had the smallest levels of crop sales, very little hired labor andfertilizer use, and limited, but significant, off-farm income. The importanceof off-farm income to the average household, throughout the distribution, isto be remarked. The proportion of land not cropped, among other thingssuggests possible labor constraints, a hypothesis supported by more detaileddata showing that as the holding size increases, the hours of labor spent onthe farm remain much the same, even as expenditure on agricultural inputsrises.
2.32 As would be expected, the share of income derived from consumptionof own produce fell steadily across income deciles, from more than 51% in thelowest to only 10% in the highest, although because of their much higherlevels of income, households in the highest deciles drew higher absoluteamounts from their own produce. The average farm holding size in the 1981-82survey (2.29 ha) was only a little smaller than that found in the 1974Integrated Rural Survey (2.33 ha), although some intensification was evident,in that the proportion of the average farm cropped had risen from 37% in 1974to 45% in 1981-82. Although the tremendous pressure of increasing populationdid not seem to have decreased the average farm size greatly, it should benoted that the availability of high potential land' per capita of populationhas declined markedly, and there is also evidence of growing landlessness.The proportion of landless households in rural areas was reported as 13.7% ir1976 (IRS 2), 19.9% in 1976 (IRS 3), and 21.6% in 1978 (IRS 4) (Kliest, 2g.c., p.35).

- 45 -
TABLE 2.05
KENYA - STRUCTURE OF RURAL HOUSEHOLD ECONOMY, 1981-82
Income Deciles All Households
Item 1st 3rd 7th 9th 10th
HH Income (KSh/mo.) 95 297 805 1,539 4,028 956
Persons/HH 3.5 5.5 5.9 7.1 7.5 5.4Children/HH 1.7 2.4 3.2 3.9 4.1 2.9
Hectares/HH 1.0 1.5 2.1 3.1 6.3 2.3Cropped ha/HH 0.4 0.7 0.9 1.3 2.0 1.3
Percentage of HH with:Crop Sales 18 36 43 52 55 40
Hired Labor 9 12 20 32 45 20Purchased Pertilizer 1 3 9 18 21 9
Percentage of HH owning:Ploughs 3 7 17 19 22 12Sprayers - 1 5 16 24 6
Wheelbarrows 1 3 6 11 23 7
Watertanks 4 4 9 17 28 10
Percentage of HH Heads:Female 43 36 29 21 15 30No Education 66 61 54 46 37 54
Educ. Past Primary 5 3 8 10 18 7
Sources of HH Income:Farm 67 56 55 58 57 56Self-Employment 3 6 7 8 15 11
Wages 12 18 18 16 11 15
Transfers _18 20 20 19 1i2 18100 100 100 100 100 100
Percentage of HH with:No Wage Income 80 58 54 53 59 58No Self-Employment 92 83 77 77 67 80
No Transfers 49 28 24 21 21 28
Source: Central Bureau of Statistics, Kenya Rural Household Budget Survey,
1981-82. Reported in: World Bank. "Kenya - Industrial Sector Survey". June
3, 1987, Vol II.
- 46 -
2.33 From the 1981-82 survey, smallholders in total were estimated tobe applying some 80,000 mt of fertilizers (about 50% of the national usage),but its use was heavily concentrated in Central Province, probably mainly oncoffee and tea. The proportion of farmers using fertilizer on maize iutherefore likely to have been considerably lower even than the overallpercentages suggest, particularly on lower income and smaller farms. Somemore recent data from a rural survey in 1987, reported in the Economic Surveyfor 1989 (pp. 35-36) suggest that the proportion of farmers using fertilizermay have increased to about 26%. The data still reveal a marked skew indistribution, however, with 50-60% of farmers reported using fertilizer in twoDistricts of Central Province, and in Uasin Giuhu, an important commercialmaize area, but with less than 10% using fertilizer in Kisumu, Siaya, Busia,Machakos, Kitui, and the Districts of Coast Province, only 14% in SouthNyanza, and around the (low) national average in Kakamega, Kisii, Kericho,Embu and Meru. In the same survey, an. astoniehingly low 2% of farmersreported using agricultural credit, although cross checking with banks andcooperative societies confirms that this ie an underestimate.
2.34 Estimates of income and expenditure for the average household areoutlined in Table 2.06, together with comparable information from theIntegrated Rural Survey (IRS 1) carried out during 1974/75. The data suggestthat the average rural family sper.t a relatively low 40% of net income onfood, but food consumotion was around 64% of total consumDtion, which is inline with data from other countries at comparable levels of income. It issignificant that for the average household around one half of expenditure onfood was cash purchases, and half came from "own produce", namely subsistenceproduction from the household's own farm. Thie is a high proportion, and thefact that it did not appear to change between 1974 and 1982 suggests that thefarm economy was not evolving at all towards an increasing market orientationduring that period.
2.35 Possibly a lot of households perceive that they cannot count onthe market as a source of adequate, timely food supplies, or that they cannotcount on prices being stable and at reasonable levels. The low recourse tothe market may also reflect lack of purchasing power. Whatever the reasons,they are constraints on agricultural modernization, divereification andgrowth, all of which depend on exploiting the poseibilities offered by well-functioning markets. For 1981-82, we do not know the breakdown of consumptionfrom "own produce", although there are data on that for the earlier 1974-75survey, and it would be fair to assume that the proportions did not varygreatly between the two sets of data.
2.36 The available statistical information for 1981-82 was for 13different income groups, ranging from less than KSh 100 per month to over KSh6,667 per month. The skew in the income distribution was quite striking.With such significant skewing overlaying an already low average income level,those in the poorest groups were exceedingly poor. The poorest three groupscontained 26% of the households, but received only 5.3% of the income.Expenditures followed the classical pattern of the Engel curve in economictheory i.e. the proportion of income spent on food declined as incomeincreased. Even the poorest households spend significant amounts on itemsother than food.

- 47 -
TABLE 2.06
KENYA - RURAL HOUSEHOLD BUDGETS, 1981-82
Budget Category KSh/mo. KSh/6 mo. Percentage Shares1981-82 1974-7S
Gross Income 956.2 5737YNet Income 829.0" 4974Tot. Expenditure 731.6 4389Y' 100.0Tot. Consumption Exp. 526.0" 3153 71.8 100.0Tot. Food Consumption 336.1W 2013Y 45.9 63.9 100.0 100.0Own Produce 167.6 1006k' 22.9 31.9 50.0 50.0Purchased Food 168.5 1007Y 22.9 31.9 50.0 50.01
Grains & Roots 56.8 341Y 7.8 10.8 16.9 19.2Fruits & Veges. 10.0 60Y 1.4 1.9 3.0 3.4Fats & Oils 14.9 90Y' 2.0 2.8 4.4 3.2Sugar & Sweets 23.6 142Y 3.2 4.5 7.0 6.6Dairy & Eggs 12.0 72V 1.6 2.3 3.6 1.8Neat & Fish 31.3 187Y 4.3 5.9 9.3 9.1Salt & Flavours 4.4 26V 0.6 0.8 1.3 1.3Beverages 15.0 90Y' 2.1 2.8 4.4 5.4
Tot. Other Consumption 189.9 1139 26.0 36.1 100.0Household Goods 64.7W 388 8.8 12.3 34.1Clothing & Footwear 48.9W 294 6.7 9.3 25.8Transport/Communication 17.9W 107 2.4 3.4 9.4School Fees 8.2 49Y 1.1 1.6 4.3Harambee School Gifts 2.9 17Y 0.4 0.6 1.5Recreation/Other Educ. 18.9W 114 2.6 3.6 10.0Health 5.8W 35 0.8 1.1 3.0Tobacco 5.3f 32 0.7 1.0 2.8Miscellaneous 17.3W 104 2.4 3.3 9.1
Sources: a/ Government of Kenya, Central Bureau of Statistics. EconomicSurvey, 1988. Chapter 3.
b/ Complementary statistical information.c/ Government of Kenya, Central Bureau of Statistics. Integrated
Rural Survey, 1974-75.
Note: the category "Own Produce", making up 50% of food consumption in 1974-75, was the sum of Grains & Roots 28%, Other Crops 5.5%, Dairy Products 11.5%,and Meat 5%. When these percentages are added to those for food purchases, acomplete breakdown of food consumption is obtained. Thus, for example, 47.2%of the average household's food consumption was for Grains & Roots.
2.37 For the poorest households, in the lowest three income aroups,food accounted for 66% of total expenditure, compared with 46% as the nationalaverage, 12% in the highest income group, and 32% in the three income groupsnext below the highest. Furthermore, for the poorest groups, the proportionof food from own produce was significantly lower than the average, 40%compared with 50% (for the lowest income group of all, only 27% of food wasobtained from own produce, suggesting that this group of households was

- 48 -
particularly land poor, or landleus). The lowest saven income grougoaccounted for two thirds of households, but only 29% of total income. Forthese groups food accounted for 62% of total expenditure (national average
46%), and 44% of the food was from own production (national average 50%).women have nrimary responsibility for food purchases, and their ability to
secure the household's supplies depends on their ability to earn and controlincome. The income from a main commercial crop is often controlled by men,even in cases where women have contributed a significant proportion of thelabor, which may be a reason for increases in household income not beingassociated with improved nutrition, as discussed later. Women tend to gainmost of their income from selling surplus agricultural produce from theirsmall individual plots, supplemented by petty trade, labor on other farms orestates, and remittances from husbands and other family members.
2.38 Household expenditure patterns by Province are outlined in Table
2.07. One striking conclusion from this table is that the average ruralhousehold in Nyanza Province spent only 60% of the average in CentralProvince. The three western provinces were below the national average, andthe three eastern ones above. Expenditure patterns for the Provinces followed
the patterns already noted above: the lower the expenditure, the higher theproportion of it was on food, and the greater the reliance on the market,rather than on own produce, for that food (almost 62% of the food for theaverage household in Nyanza was purchased in the market, compared with 43% inEastern, and 50% as the national average).
TABLE 2.07
KENYA - RURAL HOUSEHOLD EXPENDITURES, 1981-82
Cateaorv Kenya Av. Coast Eastern Central Rift Nvanza Western
Tot. Exp. (KSh/mo.) 732 732 881 900 706 544 558Percentage 100.0 100.0 100.0 100.0 100.0 100.0 100.0
Tot. Food Consump. 45.9 48.7 43.0 45.5 44.2 50.0 49.5Own Produce 22.9 21.4 24.6 22.4 24.0 19.1 24.2Purchased Food 23.0 27.3 18.4 23.1 20.2 30.9 25.3
Grains/Roots 7.8 13.5 7.1 8.8 5.8 7.4 5.6
Fruits/Veges 1.4 1.4 1.1 1.3 1.2 2.2 1.5Fate/Oils 2.0 1.7 1.7 2.5 1.8 2.7 1.8Sugar/Sweets 3.2 2.8 2.6 3.1 3.4 4.1 3.6Dairy/Eggs 1.6 1.3 1.2 1.9 1.9 1.4 1.7Meat/Fish 4.3 4.4 2.3 2.9 3.1 10.4 7.8Salt/Flavors 0.6 0.6 0.6 0.5 0.5 0.7 0.8Beverages 2.1 1.6 1.8 2.0 2.4 1.9 2.5
Tot. Non-Food Exp. 54.1 51.3 57.0 54.5 55.8 50.0 50.5
Source: Government of Kenya, Central Bureau of Statistics. Economic Survey,1988. Chapter 3; and complementary statistics.
2.39 Considering purchased food alone (since we do not have goodinformation of the content of "own produce"), there were also some strikingdifferences in consumption patterns, with the average household in Coast

- 49 -
Province spending double the national average - and almost one half of itspurchased food expenditures - on grains and roots, while households in the twopoorest Provinces, Nyanza and Western, spent a considerably higher proportionthan other Provinces on meat and fish. In Nyanza alone, reflecting itsproximity to Lake Victoria, some 3.9% of household expenditure was on fish,compared with the national average of 0.8%. In all Provinces, maize dominatedthe purchased Grains and Roots category, reaching a peak of 70% of thiscategory in Coast Province (national average 55%). These variations in foodspending must be taken into account in judgements about the adequacy of dietsin various areas.
2.40 The next step in the analysis is to establish a food povertv line,compare it to the available data, and estimate how many households and peoplefell below that line in the 1981-82 period. For this purpose we have adoptedtwo food poverty benchmarks worked out by Greer and Thorbeckel. These are:
(a) "Minimum Maize/Bean Diet" - the cost, in rural areas, of 2250calories per day derived from a diet of maize and beans;
(b) "Calorie Cost Poverty Line" - the cost, in rural areas, of 2250calories per day derived from food purchases typical for poorfamilies in rural Kenya in the late 1970s.
2.41 To use the Greer-Thorbecke food poverty benchmarks with the incomeand expenditure data for 1981-82 required several adjustments. The originalbenchmarks, in 1975 constant prices, were updated to 1982 constant prices,they were converted from adult equivalents to per capita terms using their ownequivalency coefficients, and finally household benchmarks were establishedusing data on the average size of the poorest 40% of rural households in theearly 1980. (4.2 persons). The result is the following estimates of theincome required to meet minimum household nutrition needs in 1982:
Maize/Bean Diet - KSh 2,806 per annumCalorie Line - KSh 3,167 per annum
Based on these food poverty lines, an estimated 18-22% of Kenya's ruralhouseholds, representing 1.8 million to 2.2 million persons, had so littleincome that they could not afford a minimum nutritional diet in 1981-82. Thiswould translate into more than 3 million persons in 1990.
2.42 Similar estimates have been made for the various Provinces andDistricts for which data were available. These are reported for Provinces inTable 2.08. In this table it should be noted again that the average householdincome level in the poorest Province (Nyanza) was only half that in therichest (Central). The three Provinces to the West contained more than threequarters of the estimated number of food poor persons in the country, andNyanza and Western Provinces contained just over 60% of the food poor. Theproblem is therefore very much a regional one, concentrated disproportionatelyin the provinces which produce most of the country's food.
1/ Joel Greer and Erik Thorbecke. "Patterns of Food Consumption and Povertyin Kenya and Effects of Food Prices", Cornell University, 1984 (mimeo); and "AMethodology for Measuring Food Poverty Applied to Kenya", Cornell University,September, 1984 (mimeo).

- so -
TABLE 2.08
KENYA - FOOD POVERTY BY PROVINCE, 1981-82
Catecorv Kenya Av. Coast Eastern Central ut Nyanza Weetern
Av. Household Inc. 956 905 1,039 1,103 1,020 575 716(KSh per month)
Food Poor H'holds (%)Bean/Maize Line 18.7 10.7 12.0 12.6 19.0 31.2 19.8Calorie Line 22.1 13.1 14.8 15.4 22.3 35.8 23.5
Food Poor Persons (000)Bean/Maize Line 1,703 74 189 160 420 600 258Calorie Line 2,011 89 233 196 493 692 307
Sources: Estimates based on food poverty benchmark approach adopted by Greerand Thorbecke, adjusted with data for 1981-82.
2.43 Analysis of District data allows us to focus even more clearly oncertain problem areas. Estimates of rural household net incomes in 1981-82are reported by District in Table 2.09. The poorest ten Districts (those withhousehold net incomes below the national average) were, in ascending order:Siaya, South Nyanza, Kisumu, Busia, Kakamega, Nakuru, West Pokot/ElgeyoMarakwet, Kilifi, Baringo/Laikipia, and Kitui. While income from off-farmsources was important in all Districts (national average 52%), it wasespecially important in Kiambu (proximity to Nairobi), Kisii, Kisumu, andKwale (proximity to Mombasa, and the Coast tourist industry). By contrast,income from farming was highest as a proportion of total income (60-70%) inthe more prosperous farming Districts of Rift Valley Province, Kajiado/Narok,Nandi, Uasin Gishu, Kericho and Trans Nzoia.
2.44 Applying the food poverty income lines to the Districts shows thatsome 64% of the food poverty was in ten Districts, namely South Nyanza, Kisii,Siaya, Kakamega, Kisumu, Busia, Nakuru, West Pokot, Machakos and Murang'a, indescending order of estimated numbers of food poor. These ten Districts alsocontained about 52% of the stunting in children under five years of age (Table2.02). When we discuss further the anatomy of food poverty and undernutritionwe will note again that some of the Districts which contain large numbers ofstunted children are not included among the worst food poverty Districts asmeasured by income. We will therefore examine factors other than income -
especially disease - which may contribute to the observed undernutrition.
2.45 At this point it may be noted that adding a further eightDistricts to the ten listed above would account for 70% of the remainingstunted children. These Districts are Kilifi, Meru, Bungoma, Kitui, Kericho,Kiambu, Kwale and Nyeri. To recapitulate: interventions addressingundernutrition, and food poverty arising from low incomes, in these eight andthe aforementioned ten Districts, a total of eighteen Districts, would addressan estimated 85% of the stunting problem in rural children under five, and 83%of the rural food poverty problem from low incomes. These 18 Districtscontain about 69% of Kenya's population.
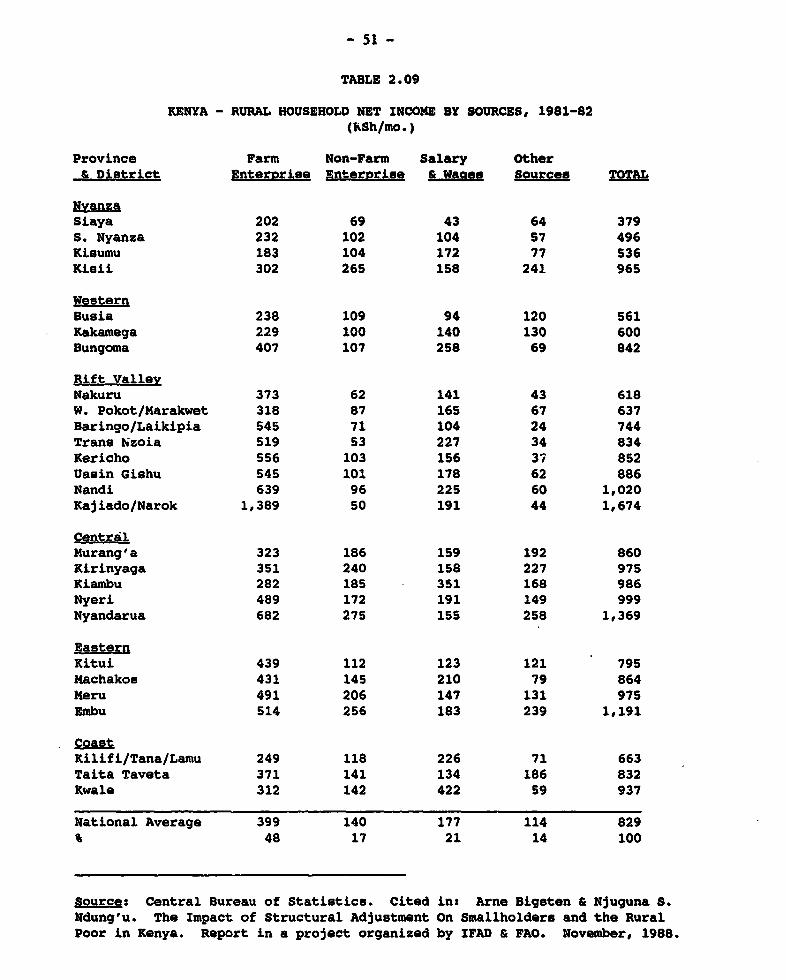
- 51 -
TABLE 2.09
KENYA - RURAL HOUSEHOLD NET INCONE BY SOURCES, 1981-82(hSh/mo.)
Province Farm Non-Farm Salary Other& District Enterprise Enterorise a Waoee Sources TOTAL
NyanzaSiaya 202 69 43 64 379S. Nyanza 232 102 104 57 496Kisumu 183 104 172 77 536Kisii 302 265 158 241 965
WesternBusia 238 109 94 120 561Kakamega 229 100 140 130 600Bungoma 407 107 258 69 842
Rift ValleyNakuru 373 62 141 43 618W. Pokot/Narakwet 318 87 165 67 637Baringo/Laikipia 545 71 104 24 744Trans Nzoia 519 53 227 34 834Kericho 556 103 156 37 852Uasin Gishu 545 101 178 62 886Nandi 639 96 225 60 1,020Kajiado/Narok 1,389 50 191 44 1,674
CentralMurang'a 323 186 159 192 860Kirinyaga 351 240 158 227 975Kiambu 282 185 351 168 986Nyeri 489 172 191 149 999Nyandarua 682 275 155 258 1,369
EasternKitui 439 112 123 121 795Hachakos 431 145 210 79 864Meru 491 206 147 131 975Embu 514 256 183 239 1,191
CoastKilifi/Tana/Lamu 249 118 226 71 663Taita Taveta 371 141 134 186 832Xwale 312 142 422 59 937
National Average 399 140 177 114 829% 48 17 21 14 100
Source: Central Bureau of Statistics. Cited in: Arne Bigsten & Njuguna S.Ndung'u. The Impact of Structural Adjustment on Smallholders and the RuralPoor in Kenya. Report in a project organized by IFAD & FAO. November, 1988.
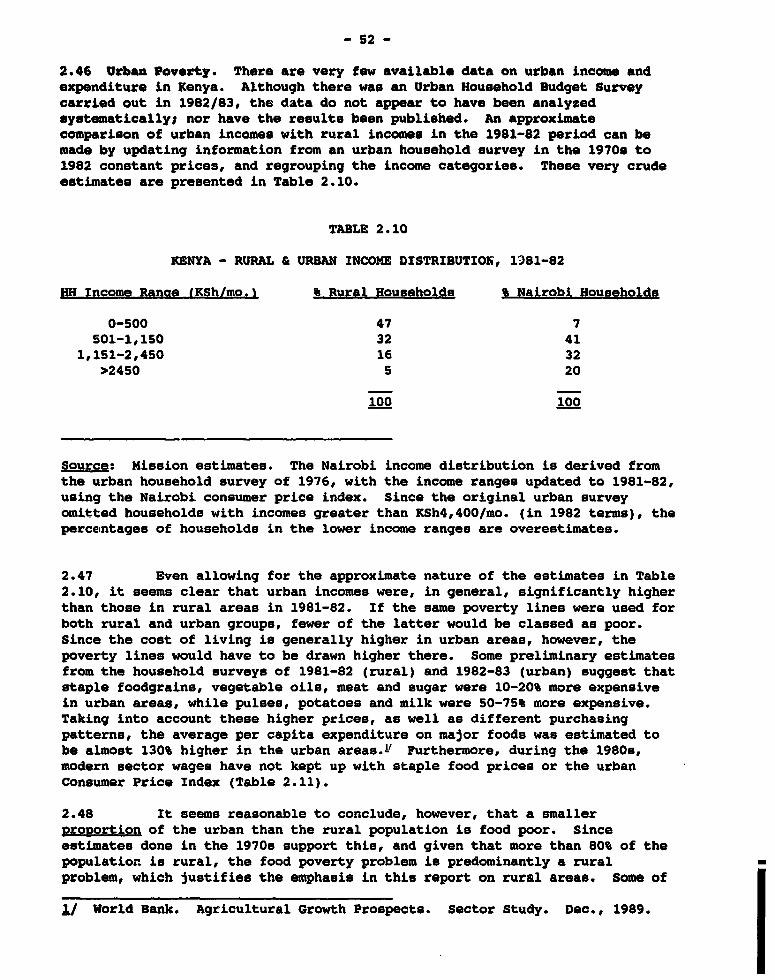
- 52 -
2.46 Urban Poverty. There are very few available data on urban income andexpenditure in Kenya. Although there was an Urban Household Budget Surveycarried out in 1982/83, the data do not appear to have been analyzedsystematically; nor have the results been published. An approximatecomparison of urban incomes with rural incomes in the 1981-82 period can bemade by updating information from an urban household survey in the 1970s to1982 constant prices, and regrouping the income categories. These very crudeestimates are presented in Table 2.10.
TABLE 2.10
KENYA - RURAL & URBAN INCOME DISTRIBUTION, 19)81-82
HH Income Rance (KShLmo.I % Rural Households % Nairobi Households
0-500 47 7501-1,150 32 41
1,151-2,450 16 32>2450 5 20
100 100
Source: Mission estimates. The Nairobi income distribution is derived fromthe urban household survey of 1976, with the income ranges updated to 1981-82,using the Nairobi consumer price index. Since the original urban surveyomitted households with incomes greater than RSh4,400/mo. (in 1982 terms), thepercentages of households in the lower income ranges are overestimates.
2.47 Even allowing for the approximate nature of the estimates in Table2.10, it seems clear that urban incomes were, in general, significantly higherthan those in rural areas in 1981-82. If the same poverty lines were used forboth rural and urban groups, fewer of the latter would be classed as poor.Since the cost of living is generally higher in urban areas, however, thepoverty lines would have to be drawn higher there. Some preliminary estimatesfrom the household surveys of 1981-82 (rural) and 1982-83 (urban) suggest thatstaple foodgrains, vegetable oils, meat and sugar were 10-20% more expensivein urban areas, while pulses, potatoes and milk were 50-75% more expensive.Taking into account these higher prices, as well as different purchasingpatterns, the average per capita expenditure on major foods was estimated tobe almost 130% higher in the urban areas.y' Furthermore, during the 1980s,modern sector wages have not kept up with staple food prices or the urbanConsumer Price Index (Table 2.11).
2.48 It seems reasonable to conclude, however, that a smallergrooortion of the urban than the rural population is food poor. Sinceestimates done in the 1970s support this, and given that more than 80% of thepopulation is rural, the food poverty problem is predominantly a rural -
problem, which justifies the emphasis in this report on rural areas. Some of
J/ World Bank. Agricultural Growth Prospects. Sector Study. Dec., 1989.

- 53 -
the poverty alleviation measures recommended later will also apply to urbanpoverty.
Prices and Price Fluctuations
2.49 Fluctuations in both producer and consumer prices for foods areimportant sources of instability in the nutritional intake of poor families.Households on the smaller farms are usually net buyers of basic foods,producing some on their farms on a subsistence basis, and buying the balancefrom the markets. rncreases in producer prices tend to raise the incomes offamilies who are net sellers, an4 lower those of the net buyers, although thesum of the effects may not be immediately evident for households who both buyand sell, often at different times of the year, introducing seasonal pricefluctuations.
2.50 Retail prices for basic foods and beverages in Nairobi haveincreased substantially during the 1980s, as outlined in Table 2.11. Innominal terms, the price of maize meal increased by almost 240% between 1980and 1989, an average increase of almost 15% per year, and substantially aheadof the overall Consumer Price Index. For a poor family with 7-8% of totalincome spent on purchased maize, and with other things equal, this price risealone represents a fall in the purchasing power of household income of morethan 18% over the period. Comparable calculations for a family in the higherincome brackets suggest a decline in purchasing power of 5% or less. In -
addition, the retail price of wheat flour increased 176%, white bread 164%, -
sugar 87%, milk 162%, tea 158%, and coffee 138%. The latter is still -
subsidized, but Government plans to remove the subsidy within the next fewyears. Even the poorest families spend some of their income on items otherthan food. It may be noted from Table 2.11 that the retail price of cottonalso increased by more than 87% during the 19809. For staple commodities suchas some of the foods included in the table, the price increases described falldisproportionately heavily on the poor, and are an obvious potential source oftheir increasing inability to secure their basic food needs.
2.51 For households which sell the commodities in question, of course,there have also been increases in the prices of their marketed output,sometimes more rapid, sometimes less than the price increases for consumers.Between 1984 and 1989, for example, while the retail price of maize almostexactly doubled, the producer price rose by only 42%. For wheat, comparableincreases were 69% retail and 82% producer; for sugar 22% retail and 27%producer; for tea 35% retail (the subsidy was removed only recently) and 64%producer.
2.52 Poorer households also suffer disproportionately from seasonalprice fluctuations, by virtue of the higher proportion of their incomes spenton staple foods. Lower income farmers frequently are forced to sell cerealsimmediately after harvest, when prices are at their lowest, in order to meetcash expenses such as school fees, or to repay debt (for the averagesmallholder family, school expenses may have been as much as 5% of allconsumption expenditure in 1981-82; see Table 2.06). Later they may purchasefrom the market at considerably higher prices. Similar forced sales andsubsequent re-purchase also hit hard at pastoralists, when there is a fall inavailable feed for their livestock. In periods when supplies of food areabnormally short, retail prices for cereals tend to rise by much greater

- 54 -
percentages in the deficit areas, striking particularly hard at poor familiesin those areas.
TABLE 2.11
KENYA - AVERAGE RETAIL CONSUMER PRICES IN NAIROBI, 1980-1989(KSh/kg except Milk & Cotton)
Commodity 1980 1981 1982 1983 1984 1985 1986 1987 1988 1989
Maize (sifted) 1.65 1.65 1.90 2.30 2.80 4.10 4.65 4.80 5.35 5.60Index 100 100 115 139 170 248 281 291 324 339
Wheat (flour) 3.15 3.45 4.20 4.50 5.15 5.90 6.50 7.00 7.45 8.70Index 100 110 133 143 163 187 206 222 237 276
(white bread) 3.60 4.15 4.60 5.15 5.80 6.60 7.30 8.20 9.20 9.50Index 100 115 128 143 161 183 203 228 256 264
Rice' (Sindano) 3.05 4.60 5.60 6.35 6.55 7.20 7.70 7.90 10.53 10.65Index 100 151 184 208 215 236 252 259 345 349(Basmati) 4.70 5.50 6.50 6.75 7.55 8.50 9.35 9.85 14.60 14.90
Index 100 117 138 144 161 181 199 210 311 317
Sugar 4.50 4.85 5.75 6.30 6.90 7.20 7.40 8.15 8.40 8.40Index 100 108 128 140 153 160 164 181 187 187
Milk (litre)b 2.75 3.25 3.90 4.25 4.90 5.50 5.95 6.00 6.90 7.20Ilidex 100 118 142 155 178 200 216 218 251 262
Tea (domestic) 14.90 16.90 24.30 27.95 28.50 28.50 30.50 33.50 35.00 38.50Index 100 113 163 188 191 191 205 225 235 258
Coffee (Kenna) 242.3 244.8 316.0 335.9 395.1 395.4 399.4 422.0 576.0 576.0Index 100 101 130 139 163 163 165 174 238 238
Cotton (metre) 24.00 24.00 29.15 39.50 39.60 40.50 45.00 45.00 45.00 45.00Index 100 100 121 165 165 169 188 188 188 188
Price Indexc 100 119 136 149 165 182 189 200 220 241Price Indexd 100 125 148 163 180 201 213 234 246 292Price Index' 100 119 140 154 166 180 187 206 231 256
Wage Indext 100 117 125 133 145 159 172 184 210 234Wage Index& 100 113 120 129 144 157 170 188 218 229Wage Indexh 100 120 128 136 146 160 173 179 202 238
Sources: Central Bureau of Statistics, Statistical Abstract, Economic SurveyNotes: a Rice prices are from Ministry of Agriculture Price Review Reports.
b Fresh, from Kenya Cooperative Creameries, in packets.c,d,e Nairobi Consumer Price Index, respectively for Lower, Middle,
and Upper Income Groups; December each year, except March 1989;Base changed to 1980.
f,g,h Average monthly earnings, modern sector, respectively for allemployees, private sector, and public sector.
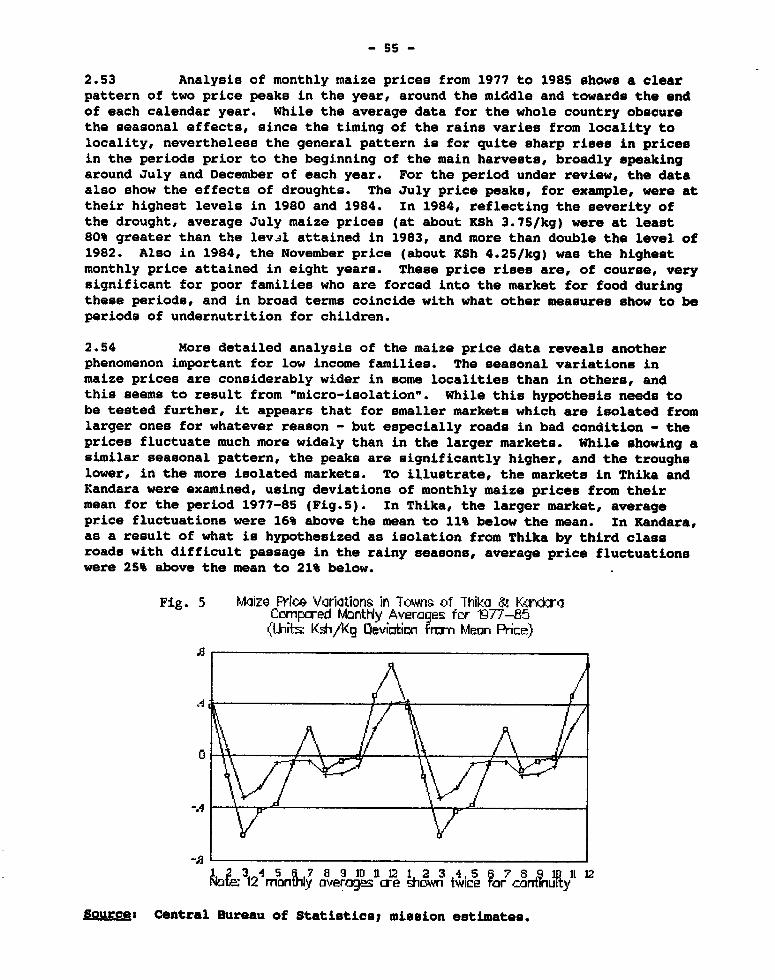
- 55 -
2.53 Analysis of monthly maize prices from 1977 to 1985 shows a clearpattern of two price peaks in the year, around the middle and towards the endof each calendar year. While the average data for the whole country obscurethe seasonal effects, since the timing of the rains varies from locality tolocality, nevertheless the general pattern is for quite sharp rises in pricesin the periods prior to the beginning of the main harvests, broadly speakingaround July and December of each year. For the period under review, the dataalso show the effects of droughts. The July price peaks, for example, were attheir highest levels in 1980 and 1984. In 1984, reflecting the severity ofthe drought, average July maize prices (at about KSh 3.75/kg) were at least80% greater than the levil attained in 1983, and more than double the level of1982. Also in 1984, the November price (about KSh 4.25/kg) was the highestmonthly price attained in eight years. These price rises are, of course, verysignificant for poor families who are forced into the market for food duringthese periods, and in broad terms coincide with what other measures show to beperiods of undernutrition for children.
2.54 More detailed analysis of the maize price data reveals anotherphenomenon important for low income families. The seasonal variations inmaize prices are considerably wider in some localities than in others, andthis seems to result from "micro-isolation". While this hypothesis needs tobe tested further, it appears that for smaller markets which are isolated fromlarger ones for whatever reason - but especially roads in bad condition - theprices fluctuate much more widely than in the larger markets. While showing asimilar seasonal pattern, the peaks are significantly higher, and the troughslower, in the more isolated markets. To illustrate, the markets in Thika andKandara were examined, using deviations of monthly maize prices from theirmean for the period 1977-85 (Fig.5). In Thika, the larger market, averageprice fluctuations were 16% above the mean to 11% below the mean. In Kandara,as a result of what is hypothesized as isolation from Thika by third classroads with difficult passage in the rainy seasons, average price fluctuationswere 25% above the mean to 21% below.
Fig. 5 Maize FPrIo Variations in Towns of Thika a K.rz;raCompared MbntHy Averages fer P77-85
(Unibi: KEh/' g Deviotian fnr , Mean Pria.-)
-.4
-AA
_A
X5 9 1D E 2 1 2 3 4 5 7 St9 It 112UJoa I12 manuIly overages are n twc or ortinui ty
S2urces Central Bureau of Statistics; mission estimates.

- 56 -
2.55 These observations may be significant when considering proposalsfor increasing the role of private traders in maize marketing, in situationswhere the public sector marketing agency, for price stabilization reasons, hasset margins inadequate to cover its costs, and the more realistic margins ofprivate traders may need to be higher. Closing public food outlets in smalltowns characterized by micro-isolation may result in higher food prices there,to the disadvantage of poorer consumers unable to reach the larger towns toprocure supplies of foodstuffs. This may, in turn, have a significant effecton undernutrition, and should be part of the calculation of side effects ofthe maize marketing reform program.
2.56 While the reform program is very important for improving marketefficiency, and for getting efficiency gains reflected in lower consumerprices for food, some special interventions may be necessary to protect anylower income households disadvantaged by the reforms. As mentioned already inChapter 1, further study is needed as a matter of priority, to identifyvulnerable groups and determine the most cost-effective ways of safeguardingtheir welfare.
2.57 As discussed in several places above, the NCPB has aimed to have aprice stabilization role in the market for food grains, especially maize, butobservations of quite sudden price changes in local markets suggest that theability of the NCPB to balance flows among surplus and deficit regions hasbeen limited.1' Indeed, it is probable that the strict curtailment of privatefood transport across District boundaries has aggravated price differentialsand fluctuations. The price controls operated by Treasury, with Eldoret asthe base zone, have allowed for differences between zones to reflect transportcosts, and marketing margins allowed to NCPB and licensed traders. Data fromthe Integrated Rural Survey of 1974 show that about 38% of maize was marketed,of which NCPB took up to onie half. In 1981-82, comparable figures were 33%marketed, of which NCPB took almost 80%, or 26% of all maize produced. SinceNCPB makes a significant proportion of its sales to mills, whose distributionof meal and flour is not so rigidly controlled, and because of its uptake ofonly from one quarter to 40% of the national crop, there are limits on itsability to even out supplies and prices.
2.58 As a result, a significant proportion of the rural population workin unofficial markets when they buy and sell maize. Analysis of local marketprices shows inter-regional price differentials much higher than can beexplained by transport costs, and seasonal price differentials higher than canbe explained by storage costs. Restrictions on inter-District trade appear tohave suppressed prices in producing areas and inflated them in consumingareas, and have probably increased transport costs, while providing windfallprofits to those with moving licenses, and opportunities for black marketingwith its consequent higher costs. Lifting movement controls is likely todiminish regional and seasonal price variations. Such a reduction in controls
I/ Many of the points in the discussion of the next two paragraphs are fromHenk A. Meilink. Food Consumption and Food Prices in Kenya: A Review. Food &Nutrition Planning Unit, Ministry of Planning, and University of Leiden.Report No. 21, 1987.
- 57 -
was endorsed in Government's Sessional Paper No. 1 of 1981, but only recentlyhas a start been made on implementing it, with the 1988 raising of the limiton inter-District movement without a license from two bags (90 kg) to 10 bags(900 kg), which was raised further to 4 tons in December, 1990. It is plannedthat these controls will be abolished completely by 1992.
Women, Food and Nutrition
2.59 The majority of Kenya's women live in rural areas. As heads of anincreasing number of rural households, especially farming households, womenface tremendous, and increasing demands on their time, for farm labor,marketing activities, household maintenance, fetching water and firewood, foodprocessing and preparation. Documentation of these statements, and detailsfrom empirical studies, are contained in a background paper.! Women'sattempts to re-allocate their labor in the face of competing demands on theirtime can have serious implications for the nutrititional status of the entirerural household.
2.60 In spite of their substantial contribution to labor on, andmanagement of smallholdings, fewer than 5% of women appear to own land. Whilecooperatives handle an estimated 40% of the country's marketed commodities,women's membership in cooperatives remains very low. Reasons given for thisinclude women's lack of title to land (which is often required formembership), their lack of regular income to pay monthly contributions, andtheir low educational attainment which limits their understanding ofcooperative regulations and by-laws.
2.61 Wcmen have primary responsibility for the health and wellbeing ofchildren. This includes providing a clean and safe environment, fetchingwater, and procuring health services. Women also play a critical role asproviders and preparers of food. They choose from among foods available inthe market or produced on the farm, and allocate food to individual familymembers. These roles make them aware of the qualities and uses of differentfoods, and to them falls the task of distinguishing between varieties forcharacteristics such as taste, storage life, digestibility and cooking time.This has important implications for agricultural research and extension.
2.62 Time studies from other parts of Africa show that women spend onaverage between two and three hours a day preparing food for themselves andtheir families.V During peak agricultural seasons, the re-allocation of laborto agricultural tasks implies that less time-consuming and less nutritiousmeals may be prepared, and less attention paid to supervising distribution offood within the family, with consequent negative effects upon nutrition,during a period when the family's energy reserves are particularly taxed, andfood availability is in any case at its lowest seasonal level. Labor savinginnovations in food processing and preparation would be of considerable helpin improving this situation.
I/ Nadine R. Horenstein. Women & Food Security in Kenya. World Bank Policy,Planning, & Research Working Paper Series, WPS 232, June 1989.
a_ J. McGuire and B. Popkin. Increasing Women's Resources for Nutrition inDeveloping Countries. Paper for the U.N. Coordinating Committee'sSubcommittee on Nutrition Symposium on Women and Nutrition. 1988.
- 58 -
Arid and Semi-Arid Areas
2.63 In the arid and semi-arid (ASAL) regions, in general livestockfeature much more prominently in farming systems than in the higher potentialareas of Kenya. Pastoral communities try to build up their herds in goodyears, and spread the risks by placing animals with relatives in differentparts of the District, and by raising different species. Studies of goups inthe Turkana area show that generally the consumption of milk decreases, andthat of meat and grain increases in the drier periods. Food aid cereals werevery important for some groups in most of the 1980s, but for other groups didnot feature prominently in their diets. One year of drought does not seem tocreate an Insuperable problem for such groups, but a second year of drought,before herds and stocks have been rebuilt, endangers their subsistence.
2.64 Under Turkana conditions, reliance on cultivation, in combinationwith more sedentary settlement patterns and limited movement of livestock, hasincreased their susceptibility to drought. Stagnating livestock numbers andrapid population growth in the arid northern areas have threateneC pastoralsubsistence, and led to chronic insecurity in procuring adequate food. Theseareas received substantial food relief in more than eight years of the 1973-1983 period, and the need for sustained food relief in the north of Kenyaappears to be growing.
2.65 For sedentary mixed farming, strategies for spreading risk includeintercropping with different crops varying in drought tolerance and time ofmaturity, the mix of livestock and crop production itself, and the almostuniversal one or more family members in non-farm occupations. Familiesattempt to expand this off-farm employment during drought. A study inMachakos District recorded that about 50% of income in the sample familiescame from such employment. Given the importance of such employment, it is notnecessarily true that the families with little land are the poorest and mostvulnerable.
2.66 A markedly skewed distribution of livestock herd sizes has beendocumented for Kajiado District, and is reported to be common in otherpastoral areas. The more vulnerable households with smaller herds willbenefit less from efforts to intensify production, improve marketing andanimal health, and develop water supplies. Attempts to redistribute incomethrough introduction of quotas or grazing fees in the context of adjudicationof group ranches have in general not succeeded. Other attempts atredistribution, such as a progressive cattle tax, would be very difficult toadminister. One of the most important needs is finding ways to rehabilitatepastoralists who lose their herds to drought. More study is needed ofadministration and funding aspects of providing new herds to destitutefamilies through combined gift and loan arrangements.
2.67 Promotion of a more commercial pastoralism is an essential part ofany development strategy for those areas where this is the main source ofincome. By marketing non-breeding males and restricting the breeding herd toa level sustainable under normal average rainfall, the pastoralist would limitthe volume of distress sales at low prices during droughts and accumulatesavings for such emergencies. It would still be impossible to stabilizeprices during a very widespread drought, since the level of deaths andslaughterings under such conditions overwhelms facilities, which cannot be
- 59 -
economically viable if designed to handle such drastic peaks of activity. Ifa drought is more region specific in its incidence, there may be scope fordelaying marketing by holding and even fattening animals elsewhere. Anexperimental program along these lines under the Turkana RehabilitationProgram needs further study and experience before a replicable model can beconfidently achieved.
2.68 For crop production there is scope in the more favorably endowedareas for intensification of production through improved methods of waterharvesting, improved crop varietiee and higher value crops. There is alsolimited scope for area expansion through converting pastoral areas tocropping, but careful attention to methods of soil protection need toaccompany such expansion. Irrigation settlement is likely to provide limitedscope for assisting landless families, whose prospects will continue to belargely determined by employment opportunities in the non-farm sector. Thereis a need, however for further study of reasons why such irrigation schemes ashave been attempted have been by and large failures, since there does not seemto be any inherent or obvious reason why this should be so.
2.69 There is a need to elaborate a considered program of employmentgeneration on public works which develop soil conservation and waterharvesting structures, reseeding and afforestation, rehabilitation of degradedareas, water supply and road construction. Such employment would be unlikelyto be attractive except on a transitory basis, for persons unable to findother employment opportunities, but it does constitute a strateg'y in whichfood aid could be used more constructively, and with less likelihood ofcreating dependency, than simple handouts. More emphasis should be placed onan employment generation objective in administering the Rural DevelopmentFund, and a more explicit policy to the same effect should be an importantpart of the emerging strategy for the ASAL areas.
Discussion - Food Poverty
2.70 Several precautions are in order regarding interpretation of thenutrition and income/expenditure observations documented above:
(a) growth of children and their nutrient uptake are certainly related, butthe relationship is a complex one, the complementary effects ofinfectious diseases, in particular, being relatively unquantified: it istherefore not possible to state that poor growth is necessarily due tolack of nutrients; indeed, "the effects of disease can beindistinguishable in terms of its effects on growth from those of arestriction in the amount of food supplied to the individual child."I'
(b) there is not a one-to-one correspondence between poor growth and lowincome; rather "differences of body sizes of children...provide indirect
1/ Phillip Payne. Appropriate Indicators for Project Design & Evaluation.Ch.4 in "Food Aid and the Wellbeing of Children in the Developing World", aUNICEF/WFP Workshop, Nov. 25/26, 1985.

- 60 -
information about the combined effect. of different factors: foodsecurity, communicable disease levels, housing standards, education, thetime and work burdens of women, etc." (Payne, 22. cit.)
(c) poor growth of children, whether or not arising from undernutrition, isnot a reliable guide to the nutritional status of the household;physical measurement of adults, unfortunately rarely included inanthropometric studieE (including in Kenya), would be needed in order toallow definitive statements about the entire household;
(d) there is still far from total agreement among writers about developmentconcerning the significance of stunting in childhood; because a certainamount of "catch-up" growth is possible up to a certain age, and becauseof biological adaptation, some argue for a concept of "small buthealthy" adults, chronically malnourished people who are "abnormallyshort but otherwise perfectly normal."y' Proponents of this point ofview have argued that acute, severe undernutrition is more important toaddress than chronic, moderate malnutrition of the kind that leads tostunting. This debate is discussed in more detail in the nextparagraph.
2.71 The debate about the significance of stunting seems to be at leastin part about the mechanisms by which undernutrition affects physiological andpsychological function, the effects of different degrees of undernutrition,where to draw lines at critical levels of severity as indicated byanthropometric measurements, and what can be done at various ages to reverseor alleviate the effects of stunting (in children under 3-5 years, quite alot; in adults, very little). The arguments aaainet the "small but healthy"position, as summed up by a nutritionist,1 are as follows:
- moderate, chronic undernutrition is a more reliable predictor ofmortality than is acute, severe malnutrition;
- the body's immune function is compromised progresesively as nutritionalstatus worsens;
- chronic undernutrition seems to have more profound effects on a child'smental development than does an isolated case of severe acutemalnutrition;
- short stature with low (but not abnormal) weight-for-height isassociated with reduced strength, endurance and work productivity;
1J David Seckler. Small But Healthy: Some Basic Problems in the Concept ofMalnutrition. Ford Foundation Discussion Paper, 1979. Also: Malnutrition: AnIntellectual Odyssey. Western J. Ag. Econ. Dec. 1980: 219-227.
V Judith S. McGuire & James E. Austin. Beyond Survival: Children's Growthfor National Development. UNICEF, 1987.

- 61 -
- short women who do not gain much weight during pregnancy are at greaterrisk of having low birth weight babies than taller women with inadequateweight gain; such babies are at greater risk for infant mortality andillness.
2.72 About the value of interventions to prevent or address stunting inchildhood, there is less disagreement. McGuire (op. cit.) argues the case forchild growth promotion on grounds of enhancing their future physical workcapacity and mental development, reducing the work loss of adults who care forsick children, higher returns from education (as a result of higherintelligence, better behavior, higher school enrolment and attendance, andincreasing grade completion without repetition), reducing demands on healthcare resources (both by the child itself and by the adult who subsequentlycontracts fewer illnesses), as well as cn humanitarian and political grounds.
2.73 In interpreting the data reported earlier for Kenya, we must becareful to note the importance of disease, as well as low income andundernutrition, in accounting for the observed levels of stunting in children.The extraordinarily high level of disease is a possible explanation of theobservation that the highest levels of stunting, in Coast Province, areassociated with middle levels of income, rather than the lowest observed inthe country (the distribution of income may also be less equal on the Coast).There is also evidence from other studies, that when household incomesincrease, they are not necessarily associated with an improvement in thenutritional status of the household.!' Although it is not yet clear why thisshould be, it points to the need for finding other interventions, e.g.nutrition education, which could be introduced alongside measures to increaseincomes, in order to induce a closer association between gains in income andnutrition.
2.74 It should be noted, therefore, that the estimates above of numbersof children suffering from undernutrition, and those of numbers of householdswith insufficient income and purchasing power to secure their minimum foodneeds, are not necessarily different ways of accounting for the samehouseholds. There is likely to be a considerable overlap between the twomeasurements, but to the degree there is not one-to-one correspondence, theproblems described may be even greater in magnitude than estimated here.Furthermore, to the extent that there is, as some have claimed,1 any genetictendency for above average height in African populations, the observations onstunting outlined earlier would be an understatement of the seriousness of theproblem.
1/ Eileen T. Ker-..ady & Bruce Cogill. Income and Nutritional Erfects of theCommercialization of Agriculture in Southwestern Kenya. International FoodPolicy Research Institute. Research Report No. 63, November 1987.
2/ Reynaldo Martorell. Genetics, Environment and Growth: Issues in theAssessment of Nutritional Status. in A. Velasquez & H. Bourges (eds).Genetic Factors In Nutrition. Academic Press, New York. 1984.

- 62 -
Poverty Profiles
2.75 The discussion above has documented a serious problem of foodpoverty in Kenya. In this final section, the various strands of the problemare brought together. Almost a decade ago, a studyl' noted that the poorest50% of smallholders had experienced no significant improvement in their livingstandards since the late 1960a; that Western, Nyanza and Eastern Provincescontained 75-80% of all poor Kenyan households; that there was a 15 yeardifference in life expectancies between Central and Nyanza Provinces; that theparticularly disadvantaged groups were women, the landless, and pastoralists;that the alternatives to farming did not seem to offer the landless and poor asecure escape from their condition; and that the poor had a chronic inabilityto generate enough cash surplus over subsistence to acquire the mostrudimentary benefits of economic progress. The fourth development plan,published in 1979, estimated that some 3.29 mlllio.. persons in the smallholderpopulation (32% of that population), 0.25 million underemployed urbandwellers, and 0.67 million pastoralists suffered from protein energymalnutrition.
2.76 A further observation of critical importance by the above authorsand their colleaguesY was that an urban bias in the country's development hadled to a large outflow of financial and human resources from the ruraleconomy. A significant part of this flow had been voluntary, reflectingreasonable private sector judgements about where to obtain the best returnsfor resources. But these were private rather than social rates of return,made possible by Government's concentrating most of its services andinfrastructural investments in the urban economy, and protecting the modernsector in numerous ways. Reversing this bias is a key factor in stimulatingrural growth, and dealing with rural poverty.
2.77 At the present time, the rural areas are still providing asubstantial proportion of their savings to the central government and themajor urban economy. The rural branches of the four largest commercial banksare the agents for channelling these resources out of the rural areas wherethey originate. Commercial bank deposits from all Provinces, excludingNairobi, totalled KShl4.3 billion (about US$850 million equivalent) at the endof 1987. While loans and advances in these Provinces totalled KSh7.3 billion,the other one half of the deposits supported loans, advances, and holdings inNairobi by the same banking institutions, a large proportion of which had beenused to purchase Treasury bills, thus financing Government's deficits andbeing lost to the private sector, even that in the capital city.
2.78 The Government of Kenya has had considerable success in sustainingagricultural and economic growth, without which the poverty situation wouldhave become much worse than it is. As a result of a very rapidly increasingpopulation, however, the proportion of those in poverty has not been reduced
l/ William J. House & Tony Killick. Inequality and Poverty in the RuralEconomy, and the Influence of Some Aspects of Policy. in Tony Killick (ed)Papers on the Kenyan Economy. Heinemann Educational Books. 1981
2/ Especially Jennifer Sharpley. Resource Transfers Between the Agriculturaland Nonagricultural Sectors: 1964-i977.
- 63 -
by the growth which has occurred. Similar statements to those about the poorin para. 2.75 above could be made today, except that the period of noimprovement in their lot has lengthened by a further decade, and their numbersare almost certainly greater. Following is a summary of the problem of foodinsecurity and the characteristics of those suffering from it:
- it is largely a rural problem, and must be tackled with rural remedies;
- children between weaning and 2 years of age, and pregnant and lactatingmothers are especially at risk;
- women's time, and the many claims upon it, is an important factor;
- many households have enough food in "normal" times, but are foodinsecure because they are easily tipped over into undernutrition by anyshocks;
- the commonest such shocks include illness, food price increases, anddrought; the poorest households have the most slender margins;
- seasonal food insecurity is marked, brought on by a combination of foodshortages, and peaks of stress related to labor needs;
- parasites, intestinal problems, and infectious diseases are majorfactors additional to low income as factors in undernutrition;
- isolation, lack of adequate infrastructure and low levels of servicesare significant factors causing and exacerbating low income;
- drought has a longer term adverse effect for households dependent onlivestock, because of the long time it takes livestock numbers torecover;
- the arid and semi arid areas are under great pressure from migration,and are potential poverty traps for the future;
- while more study is needed about certain aspects, enough is known toaccelerate the process of dealing with the problem.
The Goverment's Emerging Policy
2.79 In the context of implementing the first Agricultural SectorAdjustment Operation, the Government of Kenya prepared a new paper onHousehold Food Security and Nutrition Policy. This paper, drafted during1988, discussed within Government subsequently, and released formally inNovember, 1990, as its title suggests, assumes that sufficient food will beavailable in Kenya, from domestic production or from imports, and focusesinstead on "distributional aspects of food security." 1/ The report is driven
1/ Republic of Kenya, Ministry of Agriculture and Ministry of LivestockDevelopment. Household Food Security and Nutrition Policy. Draft Report,1988, released November, 1990. p.2.

- 64 -
by the concern expressed in the 1984-1988 Development Plan that "approximatelyone third of the national population Ls exposed to the risk of deficientnutrition", and its own conclusion that "in the absence of specific meaauresaimed at improving food security at the household level, the proportion atrisk is likely to increase as the national population grows." (p.1). Itassesses the evidence relating to undernutrition, summarizes the main groupsat risk, examines a number of Government interventions aimed at dealing withundernutrition and food insecurity, and makes recommendations for futureactions.
2.80 Because this new Government paper uses similar evidence to thatalready examined in the present Chapter, its conclusions regarding theincidence of undernutrition and food security problems are similar to thosereached here. In stressing the problems of children under five years of age,the paper estimates that by the year 2000, the numbers of such children willbe around 8 million, or just over 21% of the population, and that priorityshould be given to research on the nutritional problems of pre-schoolchildren. Furthermore, the paper suggests a relationship between nutritionalstunting in children and landholding per capita, noting that the problem isespecially severe for households with 0.1 to 0.25 hectares of land, and forlandless households. Only a small minority of the latter are in regular paidwork (p. 37).
2.81 For raising the incomes of low income households, the paperrecommends especially growth of non-farm employment in rural areas, notingthat "the role of the creation of productive employment as a means of meetingnational food security objectives cannot be over-emphasized" (p. 38). It alsoadvocates a rapid increase in agricultural exports, whose production wouldraise incomes of farmers, create more employment opportunities, and notdisplace a great deal of high potential land from food production. To ensurethat such a strategy would both raise export crop production and translateinto greater food intake in underconsuming households, the paper advocatesreliable, timely payments to cash crop producers, putting more of st-hpayments in the hands of women and increasing the productivity of their time,price stabilization, improving food marketing in cash crop areas, andincreasing food storage on farms. It also concludes that "disease and foodsecurity are... closely linked and reinforcing", and acknowledges that"measures to improve the health of the population...therefore form a majorcomponent of food security policy" (p. 20).
2.82 In the areas of pricing and marketing, the paper notes thatrelaxation of administrative controls on movement of maize within the countryshould reduce localized price instability, and advocates elimination ofadministrative restrictions on sales by the NCP8 as well. It also notes thatprice control formulae do not allow adequate margins for private sectordistribution away from main centers. For livestock producers in the pastoralareas, especially in the arid and semi-arid lands, whom the paper regards asparticularly vulnerable to climatic shocks which can severely erode theirproductive assets, the paper advocates reducing the total numbers of grazinganimals, developing hardier breeds and diversifying towards more camelherding, accelerating commercialization in the pastoral areas in order toencourage earlier sales of livestock, and introducing both price stabilizationand income support schemes for livestock producers.
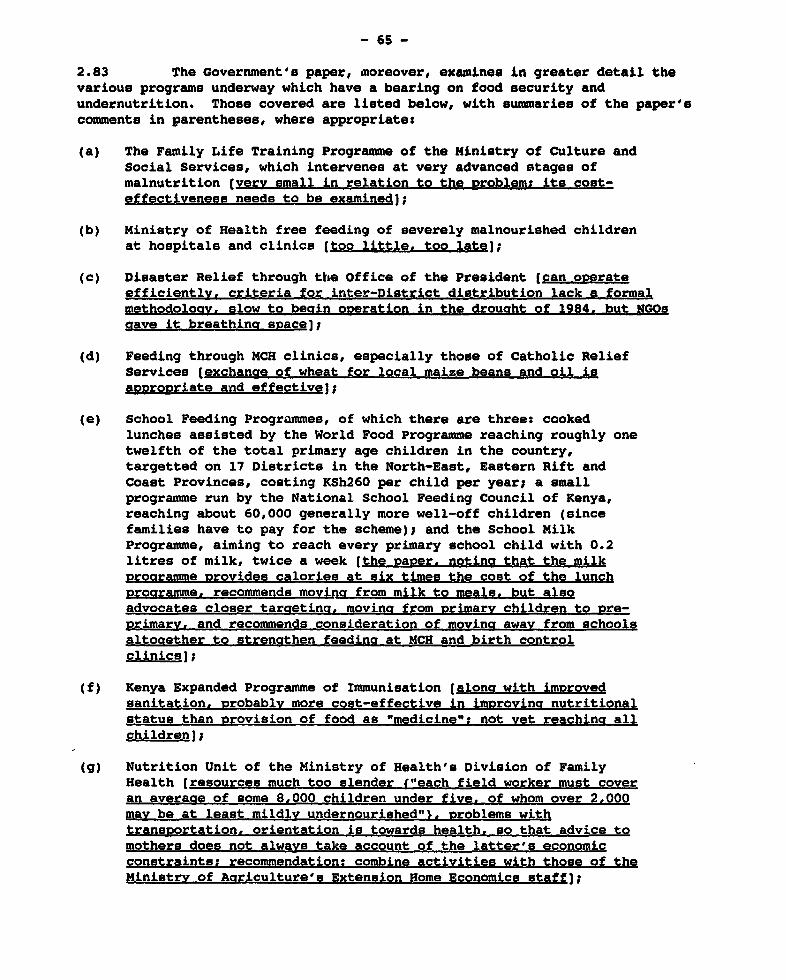
- 65 -
2.83 The Government's paper, moreover, examines in greater detail thevarious programs underway which have a bearing on food security andundernutrition. Those covered are listed below, with summaries of the paper'scomments in parenthesee, where appropriates
(a) The Family Life Training Programme of the Ministry of Culture andSocial Services, which intervenes at very advanced stages ofmalnutrition (very small in relation to the problems its cost-effectiveness needs to be examined];
(b) Ministry of Health free feeding of severely malnourished childrenat hospitals and clinics (too little, too late];
(c) Disaster Relief through the Office of the President (can ooerateefficiently, criteria for inter-District distribution lack a formalmethodoloav. slow to beain oDeration in the drouoht of 1984. but NGOsaave it breathina space];
(d) Feeding through MCH clinics, especially those of Catholic ReliefServices (exchange of wheat for local maize beans and oil isarprooriate and effective);
(e) School Feeding Programmes, of which there are three: cookedlunches aesisted by the World Food Programme reaching roughly onetwelfth of the total primary age children in the country,targetted on 17 Districts in the North-East, Eastern Rift andCoast Provinces, costing KSh260 per child per year; a smallprogramme run by the National School Feeding Council of Kenya,reaching about 60,000 generally more well-off children (sincefamilies have to pay for the scheme); and the School MilkProgramme, aiming to reach every primary school child with 0.2litres of milk, twice a week (the paper. notina that the milkProgramme provides calories at six times the cost of the lunchProaramme. recommends moving from milk to meals. but alsoadvocates closer targeting, moving from vrimarv children to 2re-orimary. and recommends consideration of movina away from schoolsaltoaether to strengthen feeding at MCH and birth controlclinics];
(f) Kenya Expanded Programme of Immunisation (along with imorovedsanitation. probablv more cost-effective in imoroving nutritionalstatus than provision of food as "medicine": not vet reaching allchildrenl;
(g) Nutrition Unit of the Ministry of Health's Division of FamilyHealth [resources much too slender f"each field worker must coveran averaae of some 8.000 children under five. of whom over 2.000may be at least mildly undernourished"i. problems withtransoortation. orientation is towards health. so that advice tomothers does not always take account of the latter's economicconstraints: recommendation: combine activities with those of theMinistry of Agriculture's Extension Home Economics staff];

- 66 -
(h) Home Economics Branch of Minietry of Agriculture's ExtensionService [nutrition messaaea not conveved effectively intearatedwith T & V extension. and would be better focussed on women'sgrouvnh.
2.84 In all, the public resources devoted to direct food securityinterventions amounted to about KE40 million, 1.1% of total publicexpenditures budgeted at just over KE3,500 million for 1989/90. Of the K£40million, the school feeding programs accounted for around K£36 million (almost90%), and all but a small proportion of this in turn was for the School MilkProgramme. The paper estimates that the latter provides, at hi.,% cost, only2% of the calorie needs and 5% of the protein needs of the children it serves(22. cit., p. 64).

- 67 -
m. POLICIES, PROGRAMS AND STUDES
3.01 The main findings of this report are that there is a verysignificant level of chronic food poverty in the country, as shown bys
- an estimate that more than 1.25 million children under five years of ageare stunted, as a result of undernourishment over an extended period,especially during the first two years of life;
- an estimate that more than 20% of rural households, containing more than3 million persons, do not have enough income to secure for themselves aminimum nutritional diet;
- failure to achieve planned increases in domestic food availability percapita, combined with rising food exports, reflecting (among otherthings) limited purchasing power on the part of lower income households.
3.02 This chapter sketches an action groaram for dealing with the foodand nutrition problems identified in the report. It first outlines thecontext of economic, rural and agricultural growth within which specificinterventions might take place. The action program comprises four areas ofGovernment policy where changes are recommended specifically to address foodpoverty concerns, together with other policies and programs which arerecommended for adoption or further study.
Economic Growth
3.03 The underlying problem in dealing with poverty in Kenya is not theabsence of economic growth. In fact if it had not been for a creditablegrowth performance, poverty and food security problems would be much greaterthan they are today. The problem is that growth has not been fast enough toget ahead of the very rapid increase in population, and that it has changedscarcely at all the extremely low levels of living experienced by asignificant proportion of households in rural areas. This continuing poverty,especially in rural areas, is one of the the root causes of the undernutritionand food insecurity documented in Chapters I and II. The main sources of suchincome growth for the poorest households will be faster development ofagriculture itself, reaching the smallest farmers, and productive employmentopportunities both in commercial agriculture, and outside agriculture,especially in rural areas, which will gradually reduce the proportion of thelabor force engaged in agriculture. In the absence of sustained growth in theincomes of those in the poorest groups of households, however, there are stillactions which can be taken to improve the lot of the poor and reduceundernutrition. As demonstrated in a number of countries, such actions, whileassisted by growth in incomes, do not have to await such growth, but can bestarted immediately (see below, in the section on public provisioning).
3.04 It is beyond the scope of this report to deal in detail withprograms for achieving faster agricultural and rurel growth, of the kind whichprovides productive employment opportunities, and reduces poverty. Thecritical factors at present for fostering agricultural growth are: gettingresearch moving, increasing uptake of fertilizers, completing improvements inmarketing systems (mainly speeding up payments to farmers, and reducing

- 68 -
controls on the movement of cereals), and diversifying towards valuable exportenterprises. Major research advances are needed in maize, dairying, and otherlivestock production (the structure of agrlculture is shLfting in thedirection of more rapid growth of dairying, other livestock, and horticulturalcrops). Among other things, the improved technologLes which emerge need toaddress labor constraints faced by many smallholders, especially women farmerswho experience unusually large and competing demands on their time. The lowproportion of smallholders using fertilizers has been documented above. Someof the non-users may be obtaining nitrogen for their cereal crops frominterplanting or ro_ations with nitrogen fixing legumes, and trees such asSesbania son. For the others, the critical factors inhibiting use are mostlikely lack of fertilizer-responsive crop varieties which yield a high enoughreturn to labor, problems in the supply system for fertilizers, andconstrained access to finance.
3.05 The significance of off-farm income sources to smallholder farmfamilies is clear from the survey evidence outlined in the previous chapters.That evidence separated "transfers" from income gained from entrepreneurshipand wage employment off the farm, and showed that the latter two wereconsiderably more important than the tranW'sre (mainly remittances from thelarger urban areas). It is likely that a h,h proportion of the remunerationfrom entrepreneurship and wages is found in the rural areas themselves. It iLsalso clear from studies of strategies for coping with droughts, that a lot ofthe off-farm activities are rather low in productivity, and unreliable as longLerm sources of sustained family ineome, savings and economic growth. It wasalso noted (Bigsten, op. cit.) that while Government had made small scaleindustrial development a cornerstone of the strategy announced in SessionalPaper No. 1 of 1986, it had not yet been given enough emphasis in developmentpolicy.
3.06 If the investment environment is right, there are very largelinkage effects between agriculture and its surrounding rural economy. Theshape of these potential effects can be seen from an examination of thespending patterns of farm households, which show what kinds of goods andservices such households demand as their incomes increase. Planning forstimulatina economic growth in the rural areas should start from a thoroughstudy of these demand patterns. The data exist in the Rural Household BudgetSurvey of 1981-82, and the survey results need to be examined from thio pointof view. What is required is estimation of marginal propensities to expendand income elasticities of demand for various goods and services, includingsuch items as farm tools, processed foods, textiles, clothing, householdutensils, furniture, roofing iron, education, and health. The next step is toidentify any factors which are constraining investments in these economicactivities. Regardless of specific constraints, there is a very large needfor the basic infrastructure of transportation, electric power andcommunications, which are also essential for stimulating agricultural growth.
Population Growth
3.07 The continuing poverty of a significant proportion of thecountry's population documented in Chapters I and II points to a need forundertaking famlly planning programs with renewed vigor, in an effort toreduce the population growth rate which is, among other things, making itextremely difficult to achieve real gains in income levels for so many people.

- 69 -
Recent evidence on increased uptake of family planning measures isencouraging, but does not give grounds for complacency in the wffort. Resultsof the new Census should shed light on whether there have been significantchanges in fertility rates in the decade since 1979, and provide a guide tonew directions needed in family planning in the immediate future.
Evolution of Policy
Public Provision for the Poor
3.08 In their comprehensive study of hunger in various countries, Drbzeand Sen !., among other things present the following conclusions:
(a) that chronic undernourishment is related not only to deficiency of foodintake, but also very closely to prevalence of diseases and epidemics,and to affected groups being deprived of education, health care, basicmedical facilities, clean water supply and sanitation;
(b) that those countries which have succeeded in reducing chronicundernourishment (their success measured by lowered infantmortality rates and increased life expectancies), have uniformlyengaged in deliberate public actions to deal with the deficienciesand deprivations experienced by affected groups;
(c) that such public actions, while facilitated by economic growth, donot have to await such growth; substantial advances can beachieved even at quite low income levels. In fact, many of theinterventions needed, they point out, remain relatively low incost while a country is poor. In addition, the results of suchinterventions, if they improve the nourishment and wellbeing ofthe country's disadvantaged groups, have instrumental value forgrowth, by raising people's capabilities and productivity.
3.09 The Government's Household Food Security Paper (22. cit. p. 20)acknowledges that "disease and food insecurity are...closely linked andreinforcing", and that "measures to improve the health of the populationmust...form a major component of food security policy". Using the example ofa closer, cleaner water supply, the Government's paper outlines the multiplebenefits of such a development for food security in a rural, woman-headedhousehold, leading to more regular feeding of children, more time on the partof the mother for food production, less drain on the mother's energy fromwalking long distances to fetch water, and improved family hygiene. TheGovernment paper also outlines health and nutrition programs already under waywhose annual cost is about KR40 million, or 1.1% of the public budget, andrecommends changes in these, chief among which are:
(a) a more targetted school feeding program which would move towards cookedmeals and away from milk, attempt to reach children at earlier ages, andbe extended to MCH and birth control clinics;
I/ Jean Dreze and Amartya Sen. Hunger and Public Action. rxford UniversityPress, 1989.
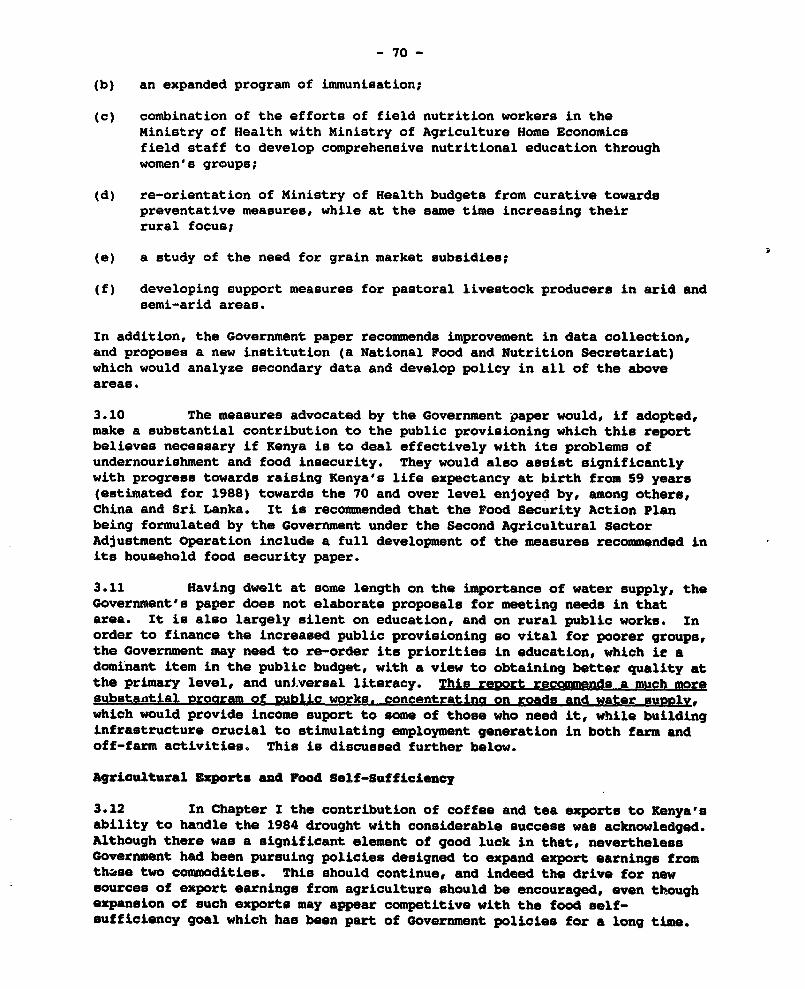
- 70 -
(b) an expanded program of immunisation;
(C) combination of the efforts of field nutrition workers in theMinistry of Health with Ministry of Agriculture Home Economicsfield staff to develop comprehensive nutritional education throughwomen's groups;
(d) re-orientation of Ministry of Health budgets from curative towardspreventative measures, while at the same time increasing theirrural focus;
(e) a study of the need for grain market subsidies;
(f) developing support measures for pastoral livestock producers in arid andsemi-arid areas.
In addition, the Government paper recommends improvement in data collection,and proposes a new institution (a National Food and Nutrition Secretariat)which would analyze secondary data and develop policy in all of the aboveareas.
3.10 The measures advocated by the Government paper would, if adopted,make a substantial contribution to the public provisioning which this reportbelieves necessary if Kenya is to deal effectively with its problems ofundernourishment and food insecurity. They would also assist significantlywith progress towards raising Kenya's life expectancy at birth from 59 years(estimated for 1988) towards the 70 and over level enjoyed by, among others,China and Sri Lanka. It is recommended that the Food Security Action Planbeing formulated by the Government under the Second Agricultural SectorAdjustment operation include a full development of the measures recommended inits household food security paper.
3.11 Having dwelt at some length on the importance of water supply, theGovernment's paper does not elaborate proposals for meeting needs in thatarea. It is also largely silent on education, and on rural public works. Inorder to finance the increased public provisioning so vital for poorer groups,the Government may need to re-order its priorities in education, which iE adominant item in the public budget, with a view to obtaining better quality atthe primary level, and universal literacy. This report recommends a much moresubstantial oroaram of public works. concentratinq on roads and water sunolv,which would provide income suport to some of those who need it, while buildinginfrastructure crucial to stimulating employment generation in both farm andoff-farm activities. This is discussed further below.
Agricultural Exports and Food Self-Sufficiency
3.12 In Chapter I the contribution of coffee and tea exports to Kenya'sability to handle the 1984 drought with considerable success was acknowledged.Although there was a significant element of good luck in that, neverthelessGovernment had been pursuing policies designed to expand export earnings fromthase two commodities. This should continue, and indeed the drive for newsources of export earnings from agriculture should be encouraged, even thoughexpansion of such exports may appear competitive with the food self-sufficiency goal which has been part of Government policies for a long time.

- 71 -
3.13 While it is undoubtedly true that the net foreign exchangeearnings of the averaae hectare of either coffee or tea would still financesubstantially more imported food than could be produced from the same hectare,for both tea and coffee, marainal returns are less than average returns. Thisis the case in particular for tea, where Kenya, as the third largest exporterin the international market, is a price maker, whose additional exports aresufficiently large to reduce the potential growth of the world market price.This means that although there is still scope for expanding coffee and teaexports, they cannot be expanded economically without limit, and alternativesmust be sought actively at this stage, so that they are ready when the limitson coffee and tea trade become more binding.
3.14 It is important to acknowledge more explicitly in agricultural andfood policy both the limitations to self-sufficiency in food grains (andindeed its un-necessariness as a policy goal), and what needs to be done toexpand both traditional and new export crops. In general, comrlete self-sufficiency should not be a policy goal for a modernizing economy, regardlessof whether the self-sufficiency refers to a household, a district, or thenation as a whole. This ie because, given the importance of specialization ineconomic modernization, food eelf-sufficiency, and other kinds of self-sufficiency, are potential sources of serious economic inefficiency, lowproductivity, and therefore low personal income. Self-sufficiency in foodstaples also has a political dimension, of course, and in spite of the factthat some cereals are imported every year, Government has been able to claim,reasonably, that the country is capable of self-sufficiency in "normal" years.
3.15 This claim is likely to become increasingly difficult tosubstantiate in the years ahead. The Government's paper on Household FoodSecurity advocates vigorous expansion of export enterprises in agriculture.This report suonorts that emohasis. Such an export-oriented strategy wouldincrease the Government's confidence that in times of domestic food shortfall,it could rely on international markets to meet such a shortfall. By makingfood security explicitly a part of the planning and projection of exportearnings, Government may reduce the possibility that the element of "goodluck" experienced in the recent past might instead become an element of "badluck" during some future recurrence of major weather-induced food shortfallsfrom domestic production. Moreover, Government should foster diversificationof the base for foreign exchange earnings. Within the agricultural sector,exports of horticultural products are showing much promise, as mentioned inChapter I, and the tourism sector, Kenya's most important earner of foreignexcnange, is in desperate need of investment. Agriculture's positive netcontribution to the country's balance of payments is demonstrated in Table3.01.

TABLE 3.01
KENYA - MAJOR AGRICULTURAL EXPORTS AND IMPORTS, 1977-1988
xtem 1977 1978 1979 1980 1981 1982 1983 1984 1985 1986 1987 1988
Exoorts (million KSh)
Coffee & Tea 5522 3757 3468 3323 3409 4443 5670 7862 8446 11226 7158 8596
Pineapple (canned) 210 192 186 177 240 290 418 519 488 484 515 501
Fresh Hort. Prod. 129 160 195 277 252 273 351 354 375 400 641 650
Maize 13 14 107 - 1 7 243 119 25 293 389 433
Pulses S5 43 30 30 39 126 277 49 13 135 268 240
Meat & Dairy 188 100 107 49 97 146 192 238 177 105 71 na
Hides & Skins 160 197 275 190 184 158 127 142 200 252 337 522
Pyrethrum 121 92 115 183 121 192 179 195 190 231 192 230
Sisal, Cotton, Wool 107 122 129 248 227 241 278 282 328 255 228 277
Wattle Prod./An.Feed 62 50 61 48 63 85 97 94 88 113 123 110
TOTAL 6567 4727 4673 4525 4633 5961 7832 9854 10330 13394 9922 11559
% Value All Exports 68 64 61 46 45 55 62 65 66 70 66 63
Imoorts (million KSh)
Maize - - - 502 116 233 - 1081 271 4 - -
Wheat 39 118 49 100 89 278 197 416 381 241 350 200
Rice - - 1 5 25 55 201 1 2 246 107 54
Vegetable Oils/Pats 217 231 253 339 379 453 875 625 845 789 747 na
Sugar 80 91 28 9 11 10 11 7 114 512 200 na
Subtotal Products 336 440 331 955 620 1029 1284 2130 1613 792 1404 na
Fertilizers 189 200 107 317 481 312 502 278 1040 1000 779 984
Agr. Chemicals 195 198 183 216 180 179 358 340 370 496 544 na
Agr. Mach./Tractors 332 370 151 202 230 220 120 220 276 392 534 590
Fuel 153 170 195 217 255 230 212 290 322 364 424 369
Livestock Drugs 65 66 64 92 101 116 107 177 194 207 na na
Subtotal Inputs 934 1004 70 1044 1247 1057 1299 10 222 2 na
TOTAL 1270 1444 1031 1999 1867 2086 2583 3435 3815 4251 4685 na
% Value All Imports 12 11 8 10 10 12 14 16 16 16 16 na
Agr. SOP (KSh m) 5297 3283 3642 2526 2766 3875 5249 6419 6515 9143 5237 na
Sources: Statistical Abstract, Central Bureau of Statistics, except for exports of Fresh Hort. Prod.
which are from the Horticultural Crops Development Authority; 1988 data are Provisional; - Negligible

- 73 -
3.16 Export earnings from agriculture have been more than capable, overthe past decade, of sustaining food imports to meet shortfalls in domesticproduction, as shown in Table 3.01. Over the past decade, agricultural exportearnings have more than doubled, while the net foreign exchange earnings fromagriculture (the agricultural balance of payments) have also increased, thoughnot as markedly. There have been significant increases both in imports ofagricultural products (mainly foodstuffs) and in agricultural inputs, notablyfertilizers and agricultural chemicals. The latter will continue to increase,in order to attain the growth required in agricultural productivity.
3.17 An export-oriented strategy to secure shortfalls in the country'sfood needs through the international market requires studying the net foreignexchange implications of expanding and intensifying production of various cropand livestock products. This would entail studies of the input requirementsof various agricultural enterprises, and the degree to which input needs couldbe met from domestic sources. A vital part of planning would be assessing thereliability of foreign exchange earnings from various agricultural sources,including relationships between fluctuations in export earnings and movementsin domestic production of foodstuffs, and their prices in internationalmarkets. To secure food supplies through international markets, it is helpfulif fluctuations in enterprises earning foreign exchange are counter-cyclicalto domestic food production. Inasmuch as maize continues to be available forexport from time to time, the management of that trade requires rather carefulcalculation to get the most out of it, while preserving economic levels ofgrain stocks against domestic shortfalls.
Grain Marketing and Targetted Subsidies
3.18 As mentioned already, Kenya has embarked on a process of grainmarket liberalization, in which it is the stated intention to change the roleof the parastatal National Cereals and Produce Board from that of monopolybuyer and seller of maize, wheat and beans, to buyer and seller of lastresort, while still maintaining an important role in price stabilization.Associated with this will be crucial changes which will lead to relaxation ofmovement controls on maize, faster payment of farmers for their marketedgrains, and expansion of the private sector's role in marketing, transport,processing and distribution. It is vital for this program to proceed, inorder to reap efficiency gains from more competitive marketing, which willallow incentives to grain producers to be improved, while, it is hoped, alsomoderating consumer prices, and contributing to price stabilit- across thecountry, as well as to reducing price differentials among regions.
3.19 These changes are likely, however, to alter the profile of thosewho lose and gain from the current market structure, and it is essential thatthese effects are understood as thoroughly as possible, instead of having thereforms proceed "in the dark". The changes are complicated by the fact thatamongst small farmers there are subsistence producers as well as both netsellers and net buyers of cereals; each group is impacted differently bychanging prices. The present tight movement controls and other regulationsfurther distort and complicate the present situation, for example leading toseasonal deficit areas on the fringes of areas with year round surplus, widerprice fluctuations than necessary, and forcing some poor urban consumers tobuy higher cost sifted maize flour, because of regulations which keep suppliesof unsifted (Oposho") flour out of the market.
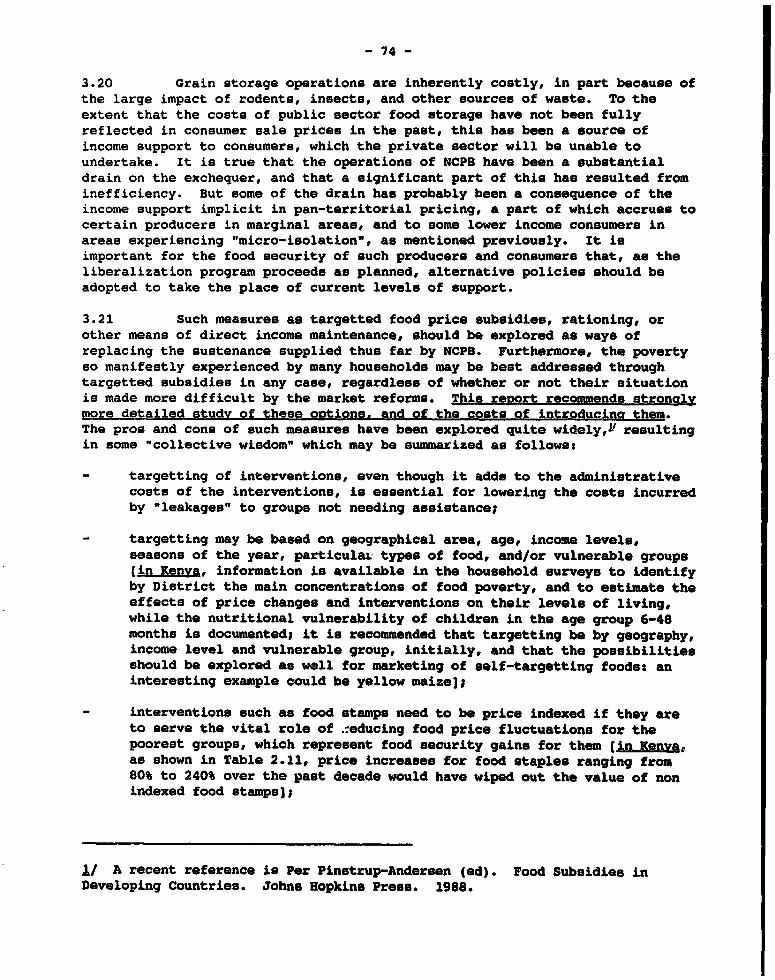
- 74 -
3.20 Grain storage operations are inherently costly, in part because ofthe large impact of rodents, insects, and other sources of waste. To theextent that the costs of public sector food storage have not been fullyreflected in consumer sale prices in the past, this has been a source ofincome support to consumers, which the private sector will be unable toundertake. It is true that the operations of NCPB have been a substantialdrain on the exchequer, and that a significant part of this has resulted frominefficiency. But some of the drain has probably been a consequence of theincome support implicit in pan-territorial pricing, a part of which accrues tocertain producers in marginal areas, and to some lower income consumers inareas experiencing "micro-isolation", as mentioned previously. It isimportant for the food security of such producers and consumers that, as theliberalization program proceeds as planned, alternative policies should beadopted to take the place of current levels of support.
3.21 Such measures as targetted food price subsidies, rationing, orother means of direct income maintenance, should be explored as ways ofreplacing the sustenance supplied thus far by NCPB. Furthermore, the povertyso manifestly experienced by many households may be best addressed throughtargetted subsidies in any case, regardless of whether or not their situationis made more difficult by the market reforms. This report recommends stronglymore detailed study of these oltiong. and of the cgots of introducino them.The pros and cons of such measures have been explored quite widely,Y' resultingin some "collective wisdom" which may be summarized as follows:
- targetting of interventions, even though it adds to the administrativecosts of the interventions, is essential for lowering the costs incurredby "leakages" to groups not needing assistance;
- targetting may be based on geographical area, age, income levels,seasons of the year, particulaL types of food, and/or vulnerable groups(in Kenya, information is available in the household surveys to identifyby District the main concentrations of food poverty, and to estimate theeffects of price changes and interventions on their levels of living,while the nutritional vulnerability of children in the age group 6-48months is documented; it is recommended that targetting be by geography,income level and vulnerable group, initially, and that the possibilitiesshould be explored as well for marketing of self-targetting foods: aninteresting example could be yellow maize];
- interventions such as food stamps need to be price indexed if they areto serve the vital role of reducing food price fluctuations for thepoorest groups, which represent food security gains for them (in Kenya,as shown in Table 2.11, price increases for food staples ranging from80% to 240% over the past decade would have wiped out the value of nonindexed food stampsl;
/ A recent reference is Per Pinstrup-Andereen (ed). Food Subsidies inDeveloping Countries. Johns Hopkins Press. 1988.
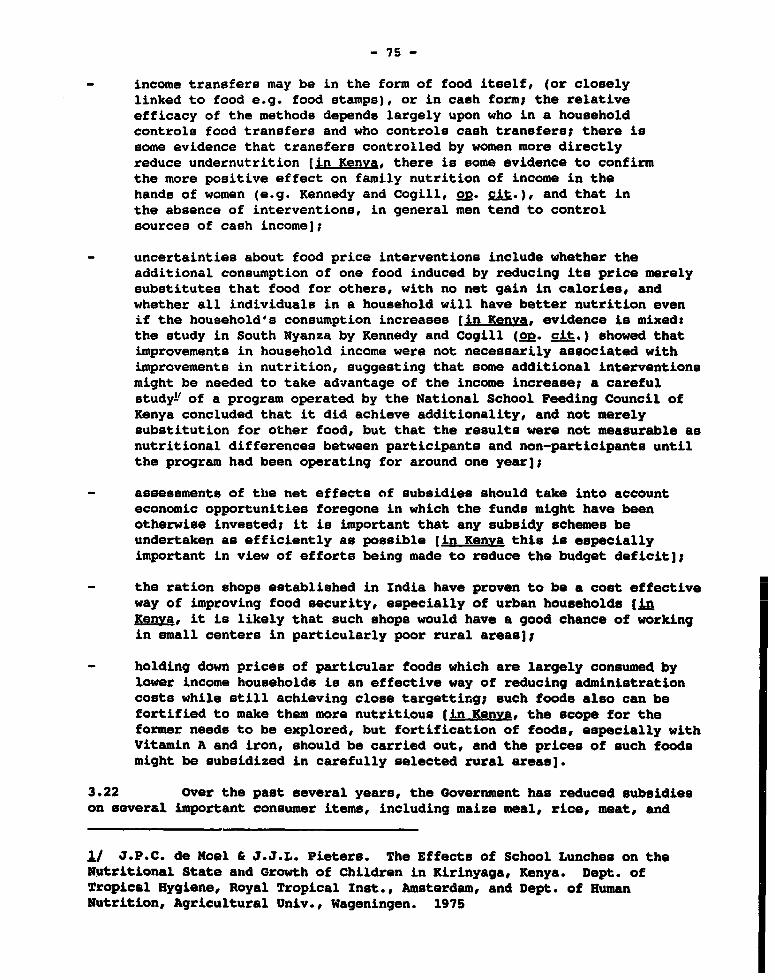
- 75 -
income transfers may be in the form of food itself, (or closelylinked to food e.g. food stamps), or in cash form; the relativeefficacy of the methods depends largely upon who in a householdcontrols food transfers and who controls cash transfers; there issome evidence that transfers controlled by women more directlyreduce undernutrition [in Kenya, there is some evidence to confirmthe more positive effect on family nutrition of income in thehands of women (e.g. Kennedy and Cogill, 22. cit.), and that inthe absence of interventions, in general men tend to controlsources of cash income);
uncertainties about food price interventions include whether theadditional consumption of one food induced by reducing its price merelysubstitutes that food for others, with no net gain in calories, andwhether all individuals in a household will have better nutrition evenif the household's consumption increases [in Lenya, evidence is mixed:the study in South Nyanza by Kennedy and Cogill (go. cit.) showed thatimprovements in household income were not necessarily associated withimprovements in nutrition, suggesting that some additional interventionsmight be needed to take advantage of the income increase; a carefulstudy!' of a program operated by the National School Feeding Council ofKenya concluded that it did achieve additionality, and not merelysubstitution for other food, but that the results were not measurable asnutritional differences between participants and non-participants untilthe program had been operating for around one year];
assessments of the net effects of subsidies should take into accounteconomic opportunities foregone in which the funds might have beenotherwise invested; it is important that any subsidy schemes beundertaken as efficiently as possible [in Kenya this is especiallyimportant in view of efforts being made to reduce the budget deficit);
the ration shops established in India have proven to be a cost effectiveway of improving food security, especially of urban households (LinKenya, it is likely that such shops would have a good chance of workingin small centers in particularly poor rural Areas);
- holding down prices of particular foods which are largely consumed bylower income households is an effective way of reducing administrationcosts while still achieving close targettir.g; such foods also can befortified to make them more nutritious (in Keny, the scope for theformer needs to be explored, but fortification of foods, especially withVitamin A and iron, should be carried out, and the prices of such foodsmight be subsidized in carefully selected rural areas).
3.22 Over the past several years, the Government has reduced subsidieson several important consumer items, including maize meal, rice, meat, and
J.I J.P.C. de Noel & J.J.L. Pieters. The Effects of School Lunches on theNutritional State and Growth of Children in Kirinyaga, Kenya. Dept. ofTropical Hygiene, Royal Tropical Inst., Amsterdam, and Dept. of HumanNutrition, Agricultural Univ., Wageningen. 1975
- 76 -
tea, with reductions for coffee under active consideratioia. These had beengeneral subsidies, available to the whole population regardless of level ofeconomic need. To replace these general subsidies with targetted ones, greatcare would be needed to address only particularly needy groups, to designinterventions which would not be frozen in place for long periods of time, butwould be special supplements within a more general program of povertyreduction. The starting point should be to use existing survey data toanalyze the effects upon household consumption of the price rises which havetaken place in the past five years, and to identify the groups and individualswho have been placed most at risk by these changes in the economy.
Arid and Semi-Arid Lands
3.23 The Government's strategy paper on Arid and Semi Arid landsacknowledges tnat they are for the most part characterized by inherently morerisky conditions for agricultural production than are found in the moreintensively cultivated areas. The strategy paper foresees a doubling inproduction in these areas, and envisages that "as increased productivity andproduction from these areas evolve, reliance on famine relief will diminish".This may be an over-optimistic projection. While the paper acknowledges thatthe population growth rate of some of these areas has exceeded the nationalaverage, it does not attempt to match up possible agricultural growth rateswith this increasing population to justify the contention that these areas cansupport even more people at levels of living satisfactorily higher than thoseexperienced today.
3.24 It seems more likely that per capita income growth will be veryslow in these areas, almost certainly slower than the national average. Therisks for agriculture associated with climatic conditions mean that there willcontinue to be shortfalls in local production, whose implications will becomemore serious as the population at risk increases. Under such circumstances,the Government will need to guard against the ASAL regions becoming povertytraps, requiring continuous and increasing food relief. Efforts to developthese regions should therefore proceed side by side with efforts to slow downthe migration from other parts of Kenya, by fostering more attractiveopportunities in those other areas.
Towards An Action Plan for Taciding Nutrition and Food Security Problems
3.25 As suggested already, agricultural development which focuses onsmallholders, and economic growth in rural areas, will be vital if the foodsecurity problems identified in this report are to be dealt with in acomprehensive and sustained way. The policy framework and investment programsneeded to achieve these are beyond the scope of this report, but are sketchedabove. These, together with increased public provisioning for poorer groups,an international markat approach to backstopping national food supplies,targetted subsidies, and realistic expectations for ASAL regions, would formthe core of an Action Plan for dealing with problems of food insecurity andundernutrition. This report also recommends preparation of plans for ruralpublic works (which could be financed in part through food aid), women'sprograms, health and nutrition interventions, and drought contingency/earlywarning systems. These are discussed further below.

- 77 -
Infrastructure and Public Works
3.26 Development of infrastructure is a key element of the strateavrecommended by this report. There are two main components of such aninfrastructure program. First, there should be a stepped up emphasis onroads, electricity, telecommunications, and water supply, with added attentionto the provision of health facilities, all in the high potential areas of thecountry which are the main centers both of population and agriculturalproduction, which were also identified earlier as accounting for the bulk ofthe undernutrition in Kenya. The aim of this would be to put in place aframework for encouraging growth, in a decentralized fashion, of theagricultural processing industries and marketing facilities, the manufactureof consumer durables and non-durables, and provision of the services neededfor a dynamic agriculture, while providing employment in the public worksprogram to build the infrastructure. Second, in the lower potential arid andsemi-arid areas, smaller public works programs should construct terraces,other water harvesting and conservation structures, small water tanks, andcarry out tree planting in selected areas important for soil conservation andfor creating opportunities for income generation.
3.27 Most of this infrastructure requires planning and financing by thepublic sector, but the public works programs which would provide them shouldaim to provide remunerative employment for those unable to earn enough atpresent to secure their food requirements. They should be financed by acombination of cash wages and food-for-work activities. The planning andadministration demands for a public works program on the scale envisaged herewould be considerable. Selection of locations, types of infrastructure,construction methods, sequences and timing, labor mobilization andsupervision, and methods of financing, would all require great care inanalysis and design.
3.28 The program should aim to meet high standards for productivity ofthe resulting infrastructure, as well as careful synchronization ofconstruction with seasonal labor demands in the regions of investment. Someproportion of the program should be designed for maximum impact in the eventof major food shortfalls in the country, when the numbers of persons seekingemployment would be significantly increased, and should be "kept on the shelf"in anticipation of such an eventuality. The bulk of the program shouldproceed in "normal" years, since the need for the infrastructure is great, andwith attention to constraints in the labor market, there would be likely to bea substantial pool of persons who could benefit from the employment generated.Experience gained in other countries with such programs could be drawn uponfor all stages of design through implementation.
3.29 The need for improved water suonlv in Kenya is clear, and it haslinks to many parts of the food security equation, among them women's time aidproductivity, family hygiene, and the spread of contagious diseases. While61% of Kenya's urban population is estimated to have access to safe water, theestimate for the rural population is only 21%. It is vital that this shouldbe improved. Various kinds of new water supply are needed ranging fromindividual boreholes to community storage ponds. The latter lend themselvesmore readily to the labor based construction methods which would make up apublic works program to create significant productive employment. A carefully
- 78 -
planned works program to increase rapidly the access of the rural populationto safe water would pay handsome dividends in improved health.
3.30 It in clear that roads play a dominant role in infrastructureneeds, and that ln opite of significant past efforts in Kenya, much remaino tobe done. The major investment programs in rural roads have been as followstV
(a) about 7,500 km of construction and maintenance carried out under varioushighwayo and rural development projects financed by the World Bank,mainly in the 1960s and 1970., continuing at a reduced level in the1980.;
(b) the Rural Access Road Program (RARP), implemented over the decade 1975-1985, in 26 Districts, with financing from 10 donors (including theWorld Bank) under separate agreements, which built some 55% of itsoriginal target of 14,000 km, using labor based construction methodswhich attained around 80% of their original employment targets;
(c) the Graveling, Bridging, and Culverting (GBC) project, implementedcontemporaneously with RARP, initially in three Districts, whoseachievements have not yet been reported in detail; and
(d) the Minor Roads Program (MRP), a follow on to RARP, in the same 26Districts, with 6 donors, and targets of rehabilitating andmaintaining 8,000 km of secondary and minor roads, also using.labor based methods, which is still under implementation; thisProgram. which has emDloved more than 20.000 laboreres. couldreadily double its emvlovment in a new expanded phase ofinvestments.
3.31 Among the main lessons of the Rural Access Road Program are:
- the importance of having a program of investment adequately balancedbetween construction and maintenance;
- the need to ensure that all types of roads in the network aresimultaneously upgraded to their respective design standards, in orderthat new bottlenecks do not cmerge as old ones are removed;
- that labor based methods are feasible and cost effective (Kenya hasaccumulated valuable experience in this regard, and the instituteestablished in Kisii for training in labor based methods has drawntrainees from across the country as well as from other countries inAfrica); and
- that technical and financial management of a labor based program shouldbe decentralized at the District level.
1/ Juan Gaviria. Kenya's Rural Road Programs: Lessons from Project Planningand Implementation at the District Level. World Bank, NADIA Study. draftAugust, 1989.

- 79 -
3.32 Design of the next phase in developing Kenya's rural roads need.to take into account several important issues in the transportation sector.First, maintenance has fallen seriously behind construction, to the extentthat if the situation persists, Kenya risks losing much of its Class C and Droad infrastructure, which is vital for carrying farm produce to market. Thedeterioration of surface, drainage and camber in these roads is already addingsubstantially to rural transportation costs. Current average budgetallocations per kilometre for maintenance are estimated to be as little as 20%of amounts considered necessary to keep the roads up to capacity and avoidlosing capital already invested (Gaviria, Me. cit.). The budget formaintenance needs to be increased over FY1989 levels by at least KE3 millionper year. In a rural public works program, some of this could be financed byfood aid. Second, there is a marked concentration of allocations for existingrural roads, in the three administrative centers of Nairobi, Nakuru, andKisumu, and the investments need to be soread around more evenly.
3.33 Third, the develooment of transoort services is as important asthe provision of roads. While Kenya's total fleet of vehicles has beengrowing rapidly, with new registrations increasing at 5% per year, facilitatedby broad deregulation of the transportation industry, the movement ofagricultural products from farms to the secondary and primary roads needs moreattention. While minor roads make up about 47% of the network, only 4% of thekilometres travelled each day by motorized vehicles is on minor roads (64% ison trunk roads, 23% on primary, and 9% on secondary roads). The apparentshortages of intermediate transport, and ineffective market consolidationfunctions, are worth further investigation, because they raise transportationcosts and cause significant bottlenecks in marketing, even when the roadnetwork in the higher classes is approaching adequacy. Fourth, further workis needed on the sources of financing for future road programs, including thecontribution of food aid through either food-for-work or cash wagearrangements, and the potential for resource mobilization through road taxesin the regions of higher agricultural potential.
Food Aid
3.34 The two major food aid donors into Kenya are the U.S.A. and theEEC. While U.S. wheat is used by the World Food Programme (WFP), and thereare commercial imports of 50-60,000 mt p.a. of wheat from the U.S.A., USAIDalso runs its Title I and Title II food aid programs, which have brought inabout 75,000 tons and 6-7,000 tons of wheat per year, respectively, in recentyears. Title I assistance has been provided since the early 1980s. Wheat isimported on concessional terms, with an initial downpayment of 5% (plus 10%currency use payment), a 10 year grace period, repayment over the succeeding30 years, and interest rates of 2% p.a. for the first 10 years, 3% p.a.thereafter.
3.35 The U.S. is moving towards more concessional food sales, whichincreasingly have policy conditions attached. These currently includeprivatization of wheat imports, restructuring of the National Cereals andProduce Board (NCPB), continued food grain situation and outlook reporting byGovernment, and food aid coordination meetings twice a year. USAID is in theprocess of changing the Title I program to Title III, with even softer terms(debt forgiveness), but stronger conditionality, focusing on cerealsmarketing. The Title II program wheat is being managed entirely by Catholic
80 -
Relief Services currently. There is no conditionality, and aid wheat isexchanged for local maize on a "fair market" basis.
3.36 EEC food aid is even more strongly linked with NCPB restructuring,a process which is also supported by the EEC through substantial monetarypayments. Under an agreement negotiated in 1988, the EEC brings in 11-15,000tons of wheat per year, which are delivered c.i.f. to Kenya, to be sold togenerate counterpart financing of the restructuring program. If food aid fromother sources (notably the U.S.A) is stepped up, the EEC may give fundsequivalent in value to the wheat, and arrange to procure maize at nearcommercial terms for triangular deals with Mozambique, Sudan, Somalia, andother foodgrain deficit countries. The agreement is due to be re-negotiatedin 1991.
3.37 The World Food Programme, along with other food donors, haschanged the mix of the foodstuffs it brings into Kenya. It now imports some10-15,000 tons of wheat (which remains in deficit in the country), andexchanges this for maize and beans procured by the NCPB, in fixed ratios of 1wheat to 1.1 maize or 0.33 beans. The NCP8 releases the maize and beans atthe locations and in the quantities desired by WFP for the projects itsupervises, especially for food for work. The ration provided to workers inthese projects includes vegetable oil (also imported by WFP) in addition tomaize and beans.
3.38 WFP has a sizeable school feeding project, with assistancetotalling about US$20 million over three years, reaching some 500,000 children(of the approximately 5 million in the country). While there is evidence thatsuch programs lead to increased school enrolment and attendance, WFP admitsthat it is harder to be sure that the nutrition of the children is actuallyimproved, given the possibilities of substituting the school lunches for foodwhich the children might otherwise consume. A careful earlier study of aprogram operated by the National School Feeding Council of Kenya concludedthat it did achieve additionality, and not merely substitution for other food(Moel and Pieters, go. cit.). Before expansion of school feeding programs canbe recommended, however, there is a need for more comprehensive analysis ofage-related risk of undernutrition, in order to ensure that children arereceiving supplementary food at an age when it can do them the most good. TheGovernment's Household Food Security paper recommends lowering the age fcrchildren's feeding programs.
3.39 Food for work projects are regarded by WTP as especially valuablefor reaching pockets of disadvantaged poor people experiencing seasonal fooddeficits, often in the arid and semi arid regions, who would otherwise beunable to purchase food without selling their meagre numbers of livestock.Although men take part in the projects in numbers almost as great as women,the projects are regarded as especially successful at reaching poor women, whoare more likely to ensure that the foods supplied are consumed within theirown families. WFP has been a major participant in food for work projects inthe Turkana area, and agreed (in May, 1989) to extend its activities there fora further five years in a project estimated to cost almost US$10 million (WFP67%, Government 33%). It has also agreed a US$7 million project in arid andsemi arid areas in Baringo, Kitui and Mutomo. These two projects will useabout 42,000 tons of imported wheat and 1,100 tons of vegetable oil over thefive year implementation period.
- 81 -
3.40 Among the several successful examples of food for work programs inKenya are the Turkana program which has been financed by various donors, theactivities supervised by Catholic Rellef Services (CR8) more widely across 10Districts in the country, and Government programs which have been morerecently organized as relief efforts in some of the poorer and less fertileregionu.l' Under the Turkana program, in 1984/85, some 8,000 participantsconstructed 350,000 micro catchments (10 square metre water harvestingstructures) in Kakuma Division. Two thlrds of these have received acaciaseedlings. One problem with the Turkana program is Lts rather heavy overheadstructure and costs.
3.41 The CR8 program, which reached 19,000 beneflciaries at its peak,and had a steady 7,000 by 1986, is characterized by decentralization ofproject ideas and management, insistence upon clearly formulated statements ofpurpose and limited duration of projects (average three months, limit 9months), meeting seasonal food deficits, strengthening local leadership andmanagement skills, and incentives for self-help. It has supported roads,bridges, schools, waste disposal, agroforestry and food storage, but hasemphasized water collection and storage in low income areas with fewinirastructure resources. Experience with this approach led to theobservation that "the more autonomy local manageme.nt was given, the morereponsibility it was willing to take on". (Stone, 22. cit.)
3.42 The Government's food for work program is younger than the others,and is still taking root at the District level. It has supported projects in16 Districts of North Eastern, Eastern, Coast and Rift Valley Provinces. Theadvantage of this program is that the administrative structure is alreadylargely in place, with close working relationships possible between theDistrict Commissioners and the line Ministries. The program needs a clearstatement of strategy, improved accounting and evaluation pro:cedures, standardforms for recording food receipt and distribution, criteria and schedules forproject evaluations, and more continuity in coordination, perhaps through theDistrict Development Officers. The program has worked well in Kitui District,through a famine relief committee chaired by the District Commissioner.
3.43 From experience to date in Kenya, the main characteristics ofsuccessful food for work programs are as followss
- tight administration, management and technical supervision;
- local design, site selection, autonomy, and strengthened leadership andorganizational skills;
- income generating assets constructed by the program;
- advance planning of food storage, equipment and agreements to be madefor the project's implementation;
XI The discussion which follows draws on Steven W. Stone. A ComparativeAnalysis of Food For Work In Kenya. August, 1986.

- 82 -
specified completion dates and food rations;
good coordination among donors, implementing groups and Government.
3.44 Food Aid - Discussion. There has been considerable assessment of themerits and demorits of food aid, and of its inherent lack of a strongjustification, in view of the costs of transporting bulky commodities insteadof money, and the observation that food aid of the oroaram kind has not beendemonstrated as improvialg nutritional status in the recipient countries. Thisreport assumes that food will remain a part of the aid packages available, andthat therefore it should be used as carefully and productively as possible.To the extent that it replaces commercial imports, it should be viewed ashaving about the same impact on nutritional status in the country as theequivalent amount of financial aid.
3.45 Food aid may have a direct effect on reducing undernutrition andfood poverty, where food itself (which need not be the actual food imported asaid, but better still, domestically produced food for which it is exchanged)is used as a component of the payments to laborers in the type of public worksinvestments discussed above, for carefully supervised distribution throughMaternal and Child Health clinics in conjunction with nutrition education andclinical care, or in school feeding programs. When such investments and otherprojects are well designed, putting the right kinds of food in the hands ofpersons (especially women) most likely to use it for the maximum nutritionalbenefit of the family, there is little evidence of the dependency and marketdepressing negative side effects sometimes attributed to food aid. It is notclear, however, whether or not it has a greater impact on reducingundernutrition in needy households than the equivalent amounts of cash. In acareful examination of food for work in Kenya, one study argues that it can bea valuable distributive mechanism for moving domestic food from surplus todeficit areas.1' Whether this contention holds only for areas with specialconstraints on marketed distribution, however, remains to be demonstrated. Theinconclusive evidence that food for work is better, in general, than cash forwork in reducing undernutrition, suggests that monetization of food aid shouldbe sought as far as possible.
3.46 Food aid has been used effectively in Kenya, and should be adoptedmore explicitly as an element of the overall strategy for addressingundernutrition and food poverty. Programs under the auspices of USAID, WFPand the EEC have been a feature of development assistance in Kenya for aconsiderable period. Their times of peak activity and probably greatestimpact have coincided with the more substantial shortfalls in food productionin the country. A great deal of valuable experience has been gained about howto administer such programs in the process. While the more substantial callupon food aid should remain with the shortfall years, there should be adeliberate acceleration of programs to use food as a development tool, insupport of higher incomes and improved nutrition.
J./ Brady J. Deaton. Food For Work In Kenya: Implications for CapitalFormation, Income Distribution and Nutrition. Paper to the Board of LutheranWorld Relief, Madison, Wisconsin. June, 1986
- 83 -
3.47 In times of major shortfall, distribution of food through theinstitutions coordinated by the Office of the President, and on a smallerscale through NGOs has proved effective and should be continued. Az discussedin Chapter I, lessons learned from the drought experience of 1984 should bestudied systematically and incorporated into formal guidelines for use in theevent of recurrence of similar food shortfalls. In more normal times, thefood aid should be used as a component of the payments to laborers in thepublic works investments discussed above, and for increased distributionthrough Maternal and Child Health clinics in conjunction with nutritioneducation and clinical care.
Enhancing Women's Opportunities
3.48 Critical actions recommended for enhancing the important rolesplayed by women as farmers, and primary family food and childcare providers,have been discussed in more detail in Chapter II. They include:
- steps to increase women's access to agricultural and nutritioninformation provided by the Ministry of Agriculture's extension service,among which are improving home economics extension activities;
- addressing women's need for ways to save time, through labor reducinginnovations in food preparation and processing, and providing betterwa-ar supply;
- increasing women's access to credit through joint titling and expandingthe use of group lending in the formal credit sector;
- securi.ag women's control over income, and expanding their income earningopportunities through technologies to increase the productivity of theirlabor, joint contracts for commercial crops, and increased training,extension and credit.
3.49 Access to Agricultural and Nutrition Infornation. There have beendeliberate efforts in the past few years to increase the reponsiveness ofKenya's agricultural extension system to the needs of women farmers. Theseshould be expanded. Some problems remain in the choice of contact farmers(those selected by extension staff to be the main contacts with the more than3,500 frontline extension agents and to serve as models to so-called "followerfarmers"), since women still comprise less than 10% of their numbers. Thisreport recommends that these numbers be increased, with selection based onfarming capacity and responsibility, and that greater representation of lower-income women farmers should be sought. It is encouraging to note that it isestimated that more than two thirds of the farmers actually met by agents arewomen (including those in women's groups). Meetings of agents with women'sgroups should also be increased, because this increases the reach of theextension service at lower unit cost. In addition, there is a need foragricultural research to focus more on developing technical packagesspecifically addressing the resource constraints and activities of womenfarmers, which are centered on labor, and finding ways to save labor on someactivities to free it for more productive purposes.
3.50 Another issue relates to home economics extension, which focuseson nutrition and food use, home management, and population education. Since

- 84 -
its integration into the general extension system, it has been evident thatthe subject matter was not being covered adequately, and a decision was takento separate home economics again from general extensLon. It is not clear thatthis is the best solution, since there li a danger of its leading to themarginalization of the home economics sork. This report recommends that thequestion be re-examined, with the aim of seeking other ways of improving thisimportant extension work, including cabining activities of the the Ministryof Agriculture Home Economics extension staff and Ministry of Health nutritionworkers in forwarding nutrition education through women'e groups asrecommended by the Government's Household Food Security paper.
3.51 Access To Technology. One of the most important areas for makingsubstantial improvements in securing household food needs is dealing with thetime constraints of women. Posho mills (for grinding maize and other cereals)within a reasonable distance have proven to be important in releasing women'stime for more productive actitivities, and where run by women have providedadditional income. Improved water supply, which roduced the distances womenhad to travel to obtain it, would be probably the ei 1gle investment withgreatest potential for alleviating labor constraints, and with hygienic supplyas the goal, would have the added benefit of reducing the incidence of thediarrhoea and internal parasites whlch are leading contributors to childhooddisease and slow growth.
3.52 Access To Credit. Most of the credit rural women use is from informalsources, which do not require collateral and for which the transactionsinvolved are easier, but these carry high interest rates and are often limitedboth in amounts and in the types of activities which can be financed. Jointtitle to land between husbands and wives could improve women's access to theformal credit sources which require land as collateral. Efforts should beexpanded in the formal credit arena to move away from collateral based on landtitles, and towards group lending, as well as simplifying credit transactionsand increasing the distribution to women of information about these and aboutcredit facilities in general.
3.53 Control Over Income. Because they have the primary role in foodprocurement and preparation, and because studies show that their inrome tendsto be spent on food to a greater degree than does the income accruing to men(Horenstein, g2. cit.), securing women's access to income is important forsecuring the household food supply. As women increasingly manage farms inKenya, their decision-making power about farming enterprises and activities isgrowing, but in many instances they are still precluded from control overincome arising from commercial crops. There is evidence from other countriesin Africa that this dampens women's incentives to work on such crops. It isimportant that women's income earning possibilities be expanded, both invariety and in levels of remuneration. Some ways of doing this includedevelopment of technologies which will enhance the productivity of the farmenterprises they now control, labor saving innovations and investments toreduce the demands on their time from non-income-earning activities (such asfetching water and firewood, food processing, storage and preparation, andhousehold chores), listing contracts for commercial crops jointly in the namesof men and women, and increasing access to training, extension and credit.

- 85 -
Health Services and Nutrition Interventions
3.54 The difficulty of sorting out adequately the joint effects ofundernutrition and illness am causes of stunting in children have beendiscussed in Chapter II. While food poverty is a major root cause ofundernutrition, measures to raiue incomes are necessary but not sufficient toaddress the serious situation documented here. Major investments in healthservices are required, especially in those areas having a direct bearing onnutritional outcomes. The most important of these for children are a massiveeffort to address diarrhoeal illnesses and internal parasites, extending theimmunization program to achieve full coverage instead of the present 66%, andbetter prevention and treatment of malaria. Among other things, thepossibilities should be explored of greatly increasing the availability, forsale through small shops, of chloroquine, anti-parasite medicines, andcontraceptives.
3.55 Along with other public se-vices, those in the health sector havesuffered acutely from an increasing proportion of the total budgets beingtaken up with personnel costs. This has brought with it a significant declinein the quality of services offered, and acute shortages 4f vital drugs,especially in rural areas, without which health care has become relativelymeaningless for many of tha big problems.
3.56 A program of assistance with nutrition and health care hascommenced under UNICEF auspices, planned to be implemented from 1989 to 1993.UNICEF has approved US$14 million from its general funds for this program, andis using additional funds from other donors. Of the total project funds, itis envisaged that some two thirds would be for activities in the Districts ofBaringo, Kitui, Kwale, South Nyanza, Kisumu, and Embu, which would includeimmunization of children, early childhood education, water supply, literacy,and strengthening local capacities for planning, data collection andmonitoring. A further 18% of the total funds would be forhealth/nutrition/population activities including strengthening community basedhealth care and provision of essential drugs, training health worker trainers,improving maternal health care, control of diarrhoeal disease, growthmonitoring of young children (expanding the CHANIS activities which started 2-3 years ago in several Districts), controlling iodine, vitamin A and irondeficiencies, and building up the health information system.
3. ,7 Government has made a start on implementing oost recovery ineducation, health and other public services. Careful monitoring of this isvery important, because of its potentially significant impact on lower incomegroups. The Government is about to begin a health rehabilitation projectwhich would focus on increasing efficiency at Kenyatta National Hospital, butwould also be a vehicle for studies leading to an improved public investmentprogram, the monitoring of user charges in health and other sectors, and toreforms of health financing, public expenditure managment, and pharmaceuticalsupply. The details of these proposals have yet to be worked out. There isobviously no lack of need for increased investments in this field. The dataavailable are adequate to identify the main health problems which have to betackled, and the regions where the problems are most acute. What remaine isthe details, especially details of financing. Working these out should begiven high priority.

- 86 -
3.58 With respect to direct nutrition interventions, the posslbilitiesfor school feeding have already been discussed above, along with theimportance of expanding the monitoring of growth faltering in children, andtreating the observed growth faltering with administration of food an mediolne(or possibly a "prescription" in the form of food stamps?). The UNICEFprogram intends at leart to extend the monitoring, although the subsequenttreatment is less clear. There are three other actions which would be worthfurther study. The first is a followup to the study reported earlier(Kennedy, 22. cit.), which showed that increased income from sugar cropping inSouth Nyanza did not appear to result in improved nutrition witllin thehouseholds concerned. The reasons for this result need to be studied,preferably through monitoring carefully selected interventions (especiallynutrition education) which would complement the improvements in economicstatus and aim to get the most out of those for nutritional advance. Dramaticresults have been obtained from nutrition training in projects in Zimbabwe andTanzania. A second activity worth study would be the production of fortifiedfoods, especially those containing Vitamin A and iron, and the sale of suchfoods (possibly with a subsidy) in regions selected for a concentration ofundernutrition problems. The effectiveness of the legislation mandating saltiodization also needs to be monitored. Finally, the possibilities for anexpanded program of nutritional education through the mass media should beassessed. In Indonesia, a successful activity of this nature was implemented,with a design based on careful market research.1'
Early Warning Systes
3.59 The assessment in Chapter I of responses to drought in Kenyashowed the value of improving forward planning in this area. In thatdiscussion it was noted that forward planning arrangements should not be tooelaborate, but should be designed to be relatively modest in cost, while alsoserving purposes other than just drought preparedness where possible. Therecommendations include improving the usefulness and acceptability of theweather forecasts (through more rainfall stations, improved computingfacilities, more accurate prediction models, and a campaign to extend the usesmade of the Meteorological Department), establishing a detailed policy fordrotl t response, which would include a set of procedures for assessingse\' *rity, population at risk, food import needs, and transport capacity, withguidelines for (among other things) public employment programs, NGOcoordination, and release of food from stores.
3.60 In addition, the aerial surveys of maize, and other cropestimating techniques, should be improved, the computerized food monitoringand control system in NCPB should be completed in all its regional detail, andmonitoring arrangements established more widely for such indicators as risingfood prices and sales of livestock. The Food Sector Monitoring Project, whichwas started several years ago in the Central Bureau of Statistics, was avaluable effort, which is worth reviving, and a successor to the Food SectorBulletin introduced by that project is badly needed. In the end, what earlywarning is about is buying valuable time for manoeuvre with good information.
I/ A. Berg. Malnutrition: What Can Be Done? Johns Hopkins University Press,1987.

- 87 -
Towards Reliable Statistics
3.61 Reliable information about the agricultural sector, theavailability and uptake of staple foodse prices in rural markets, nutritionalstatus, household incomes and expenditures, and the basic building blocks ofthe national accounts, are very difficult to obtain in Kenya. The CentralBureau of Statistics has accumulated a solid body of experience in planningand carrying out large sample surveys for various purposes, and hasdemonstrated its abilities in these activities. The analysis and use of thedata thus collected is weak, however. The clearest example is the Househ.oldSurveys of 1981-1983, whose results have never been released in anywhere neartheir complete form, and only partially analyzed, although they appear to be amine of useful information. Discussion with able planning officers in theDistricts (who are responsible for preparing the District Plans which feedinto the National Plan under Kenya's policy of decentralizing development),shows that the reliable data on which their plaas need to be based to becredible are very sparse indeed. There is a very urgent need for improvingsuch data collection and analysis, which should be addressed immediately. Itwould have important benefits throughout the agricultural sector, and inplanning at all levels. The Government's Household Food Security paper alsomakes a strong case (pp. 72-77) for strengthening primary data collection, inorder to base food security interventions more firmly in reality and make themmore effective.
institutional Changes
3.62 This report has not been able to carry out detailed analysis ofthe institutions involved in food and nutrition work in Kenya, but theGovernment's Household Food Security paper has examined the situation, andconcludes that there is "no effective formal means within the presentgovernment structure for taking account of household food security andnutrition within the policy formulation and planning process"..."given thepriority whiclh the Government gives to food security, there is a clear need atthe national level for a more institutionally formalised and effective foodsecurity system. It is considered that the only means of meeting this need isthrough the creation of a separate organisation able to span the range ofmajor sectors involved... The agency needs to be fully operational in allyears, not only at times of drought" (pp. 78-79). The paper thereforestrongly recommends establishing a National Food and Nutrition Secretariat,whose main functions would be analysis of secondary data to improve diagnosisof food security problems, and formulation of policies to address the problemsso revealed. This report concurs in the Government's recommendation, andsuggests that such a body should also be charged with keeping under its wingthe Government's drought contingency plan. Although there is no need for acontinuously operating body for drought prevention, a Secretariat of the kindrecommended by the Government's paper would be in a good position to keepunder surveillance any developing food shortfalls, and also to keep up to dateas required the drought policy itself, once it has been formulatedcomprehensively, as the Government has undertaken to do within 1991.

- 88 -
BIBLIOGRAPHY
Berg, A. Malnutrition: What Can Be Done? Johns Hopkins University Press,1987.
Bigsten, Arne & Njuguna S. Ndung'u. The Impact of Structural Adjustment OnSmallholders and the Rural Poor in Kenya. Report in a project organized byIFAD & FAO. November, 1988.
Borton, John. The 1984/5 Drought Relief Programme in Kenya: A ProvisionalReview. Relief & Development Institute Discussion Paper No. 2. London,revised March, 1988.
Campbell, David J. Response to Drought Among Farmers & Herders in SouthernKajiado District, Kenya. Human Ecology Vol. 12, No. 1, 1984: 35-64
Cherry, Neil J. Assessment of the Kenya Meteorological Department, ItsLong Range Forecasting and Timely Supply of Information to Farmers.(Mimeo) January, 1989.
Cohen, John M. Missed Opportunities? Participatory Planning and Kenya'sNational Food Policy Paper. African Studies Association, 26th. AnnualConference, Boston, December :983.
Cohen, John M. & David B. Leu.. ks. Role of Government in Combatting FoodShortages: Lessons from Kenya 1984-85. Ch. 12 in Michael H. Glantz (ed).Drought and Hunger in Africa: Denying Famine A Future. CambridgeUniversity Press, 1987. 269-296.
CRSP. The Collaborative Research Support Program on Food Intake and HumanFunction: Kenya Project. A Study in Embu District. School of PublicHealth, Univ. California, and College of Health Sciences, Univ. Nairobi.Nov. 1987.
de Moel, J.P.C. & J.J.L. Pieters. The Effects of School Lunches on theNutritional State and Growth of Children in Kirinyaga, Kenya. Dept. ofTropical Hygiene, Royal Tropical Inst., Amsterdam, and Dept. of HumanNutrition, Agricultural Univ., Wageningen. 1975.
Deaton, Brady J.. Food For Work In Kenya: Implications for CapitalFormation, Income Distribution and Nutrition. Paper to the Board ofLutheran World Relief, Madison, Wisconsin. June, 1986. -
Downing, Jeanne, Leonard Berry, Lesley Downing, Thomas E. Downing andRichard Ford. Drought & Famine in Africa, 1981-1986: The US Response.Clark Univ. & Institute for Development Anthropology. Mimeo, 1987.
Dreze, Jean and Amartya Sen. Hunger and Public Action. Oxford UniversityPress, 1989.
Duggan, M.B., J. Alwar & R.D.G. Milner. The Nutritional Cost of Measles InAfrica. Archives of Diseases in Childhood, 61:61-66.

- 89 -
Fleuret, Anne. Indigenous Taita Responses to Drought. (mimeo. c.1985).
Foeken, Dick & Jan Hoorweg. Seasonality in the Coastal Lowlands of Kenya.Food & Nutrition Planning Unit, Ministry of Planning and NationalDevelopment, and African Studies Centre, Univ, Leiden. Report No. 28,
1988.
Gaviria, Juan. Kenya's Rural Road Programs: Lessons from Project Planningand Implementation at the District Level. World Bank, MADIA Study. draft
August, 1989.
Government of Kenya, Central Bureau of Statistics, Statistical Abstract,Economic Survey, various years.
Government of Kenya, Central Bureau of Statistics. 2Economic Survey, 1988.
Chapter 3.
Government of Kenya, Central Bureau of Statistics. .ntegrated Rural
Survey, 1974-75.
Government of Kenya and United Nations Children's Fund (UNICEF). SituationAnalysis of Women and Children in Kenya. 1988.
Greer, Joel, and Erik Thorbecke. "Patterns of Food Consumption and Poverty
in Kenya and Effects of Food Prices", Cornell University, 1984 (mimeo); and"A Methodology for Measuring Food Poverty Applied to Kenya", CornellUniversity, September, 1984 (mimeo).
Horenstein, Nadine R. Women & Food Security in Kenya. World Bank Policy,Planning, & Research Working Paper Series, WPS 232, June 1989.
House, William J. & Tony Killick. Inequality and Poverty in the RuralEconomy, and the Influence of Some Aspects of Policy. in Tony Killick(ed) Papers on the Kenyan Economy. Heinemann Educational Books. 1981.
Kennedy, Eileen T. & Bruce Cogill. Income and Nutritional Effects of the
Commercialization of Agriculture in Southwestern Kenya. International FoodPolicy Research Institute. Research Report No. 63, November 1987.
Kliest, Ted. Regional & Seasonal Food Problems in Kenya. Food & NutritionPlanning Unit, Ministry of Planning, & Univ. Leiden. Report No. 10, 1985.
Lakhani, S.A. & A.A.J. Jansen. Infant Feeding Practices Among MiddleIncome Urban Africans and Indians in Kenya. E.Africa Med.Jour. 1987, 122-130.
Martorell, Reynaldo. Genetics, Environment and Growth: Issues in theAssessment of Nutritional Status. in A. Velasquez Q H. Bourges (eds).Genetic Factors In Nutrition. Academic Press, New York. 1984.
McGuire, J., and B. Popkin. Increasing Women's Resources for Nutrition in
Developing Countries. Paper for the U.N. Coordinating Committee'sSubcommittee on Nutrition Symposium on Women and Nutrition. 1988.
- 90 -
McGuire, Judith S. & James E. Austin. Beyond Survival: Children's Growth
for National Development. UNICEF, 1987.
Meilink, Henk A. Food Consumption and Food Prices in Kenya: A Review.
Food & Nutrition Planning Unit, Ministry of Planning, and University of
Leiden. Report No. 21, 1987.
National Cereals & Produce Board. Distribution of Imported grains in
Kenya: 1984/85. A Discussion Paper.(mimeo) l9pp.
Payne, Phillip. Appropriate Indicators for Project Design & Evaluation.Ch.4 in "Food Aid and the Wellbeing of Children in the Developing World", a
UNICEF/WFP Workshop, Nov. 25/26, 1985.
Pinckney, Thomas C. Storage, Trade, and Price Policy Under Production
Instability: Maize in Kenya. International Food Policy Reaearch Institute
Research Report No. 71, December, 1988.
Pinstrup-Andersen, Per (ed). Food Subsidies in Developing Countries.
Johns Hopkins Press. 1988.
Republic of Kenya. National Food Policy. Sessional Paper No. 4 of 1981.
Republic of Kenya. Population Projections for Kenya, 1980-2000. Central
Bureau of Statistics, March, 1983.
Republic of Kenya, Ministry of Finance. Grain Marketing Study by BookerAgriculture International L.td. with Githongo & Assoc. October, 1983.
Republic of Kenya, Central Bureau of Statistics. Market InformationBulletin, Jan.-June and July-Dec., 1984.
Republic of Kenya, Office of the President (1984). Guidelines on FoodSupply and Distribution. Circular sent to District officials 21 August,
1984.
Republic of Kenya, Central Bureau of Statistics, and United Nations
Children's Fund (UNICEF). SLtuation Analysis of Children and Women in
Kenya. August, 1984.
Republic of Kenya. Economic Managment for Renewed Growth. Sessional Paper
No. 1 of 1986.
Republic of Kenya, Ministry of Planning & National Development. A Second-
Generation Strategy and Policy for Reclamation and DeveLopment in the Arid
and Semi-Arid Lands, Kenya, 1989-1993. Nairobi, May, 1988.
Republic of Kenya, Ministry of Agriculture and Ministry of Livestock
Development. Household Food Security and Nutrition Policy. Draft Report,
1988, released November, 1990.
Seckler, David. Small But Healthy: Some Basic Problems in the Concept of
Malnutrition. Ford Foundation Discussion Paper, 1979. Also: Malnutrition:
An Intellectual Odyssey. Western J. Ag. Econ. Dec. 1980: 219-227.

- 91 -
Stephenson, L.S., M.C. Latham & A. Jansen. A Comparison of GrowthStandards: Similarities Between NCHS, Harvard, Denver and PrivilegedAfrican Children and Differences With Kenyan Rural Children. CornellInternational Nutrition Monograph Series, No. 12. Cornell University,1983.
Stone, Stephen W. A Comparative Analysis of Food For Work In Kenya.August, 1986.
Williams, G.W. Disease & Inequalities in Infant & Child Mortality in RuralKenya. IUSSP Seminar On Mortality & Society In Sub-Saharan Africa.Yaunde. 19-23 October, 1987.
World Bank. Kenya - Industrial Sector Survey. June 3, 1987.
World Bank. Kenya - Agricultural Growth Prospects. Sector Study. Dec.,1989.
World Health Organization global survey, 1976.

( I ~~~~~~~~LAZE
?STEETMNI P I
/evsn Lhu ' N. .
ABI~~~~TURKANA EIiye~~~~~~ MARSMADERA
bit~~~~i
E A IFE R NAIUGANDA . 'WAI
/ VA~~~~~~~~~~L L E YWai
o. (~~~~~~~~,SIAYA I~~~~~~~SMAI
I IME~~~~~~~~J y MURA~~~ 0 R'J
MMhr -.GO..SR.4 URI
lot~~~~~~~~~~~~~~~~~~~/Elointorct
t(lie~~~~~~~~~~~~~~~~~~~~~~~~~~~~~~~~~~~*4NtEllarol
MA~~~~~~~~~~~~~~~~~~~~~~~~~~~~~~~~~~~®NtlO CiaISIULO ~ ~ ~ ~ ~ ~ Povnia oplI
r*EST~~~~~~~~~~~~~~~~~~~~~~~~~~~OBS CVe n on
~eaa.a# .* El MEES 4 0 AL MMAd rElltodYIn n.a ,n.o... MILES ~~~~~~~~~~~~~~~~y-----, 120 60 'I-' , Dioni ~~~~~~~~~~~~~E AT E R
lln.lvau .n l lela.lm ea..,.el.a. 0 4 5 5 E EerOtOIOtldT
ela.5 Ya.l a Ta lflla .5 sIllal i'awlelllltwa. EO'Ialfl fl.alalwl----PIO EKCe A sdooie
Cl - up. asIaas., lSa. a ay *lla,.~el l .CII.a.. atellra.MERL;Plet- elol.Th lh,l...o aaslalllw
Multi ~~~~.0TOs .Soon 40 istic byukiie