key characteristics of the insurance market
TRANSCRIPT

1 Introduction ................................................................................................. 2
1.1 General ..................................................................................................... 2 1.2 Balance sheet ............................................................................................ 2 1.3 Solvency II ratios ....................................................................................... 3
2 Investments, deposits, cash and cash equivalents ....................................... 4
2.1 Scope ....................................................................................................... 4 2.2 Asset exposure .......................................................................................... 5 2.3 Equity exposure ......................................................................................... 7
3 Index-linked and unit-linked investments .................................................. 10
3.1 Scope ..................................................................................................... 10 3.2 Asset exposure ........................................................................................ 10 3.3 Equity exposure ....................................................................................... 11
4 Insurance products .................................................................................... 13
4.1 Overview ................................................................................................ 13 4.2 Life insurance products ............................................................................. 14 4.3 Non-Life insurance products ...................................................................... 15 4.4 Average duration ..................................................................................... 16
5 Accounting & Tax framework ..................................................................... 17
5.1 Accounting framework .............................................................................. 17 5.2 Tax framework ........................................................................................ 17
6 Historical data ............................................................................................ 19
6.1 Index-linked and unit-linked investments in comparison to total assets .......... 19 6.2 Solvency II – excluding index-linked and unit-linked investments .................. 20 6.3 Solvency I – excluding index-linked and unit-linked assets ............................ 21 6.4 European Central Bank – including index-linked and unit-linked assets ........... 22 6.5 Trends in Equity Investments .................................................................... 25
ITALY Key characteristics of the insurance market
European Commission - Study on the drivers of investments in equity by insurers and pension funds
ITALY – Key characteristics of the insurance market April 2019 I 2
1 Introduction
1.1 General
At the end of 2017 (2017 Q4), 97 insurance companies1 in Italy submitted their Solvency
II related reporting package to the Italian National Supervisory Authority (NSA). These
companies accounted for 8,160% of Total assets of insurance undertakings operating within
the European Union (EU).
Table 1 depicts the number of Solvency II reporting submissions in Italy by insurance
activities and the importance of the country within the EU, based on Total assets.
Table 1 - Insurance reporting submissions
Insurance reporting submissions #
Life undertakings 30
Non-Life undertakings 48
Reinsurance undertakings 0
Composite undertakings 19
Total 97
Total assets IT / Total assets EU % 8,160%
Ranking IT based on Total assets EU 4
Source: EIOPA Solvency II statistics and Deloitte-CEPS analysis
1.2 Balance sheet
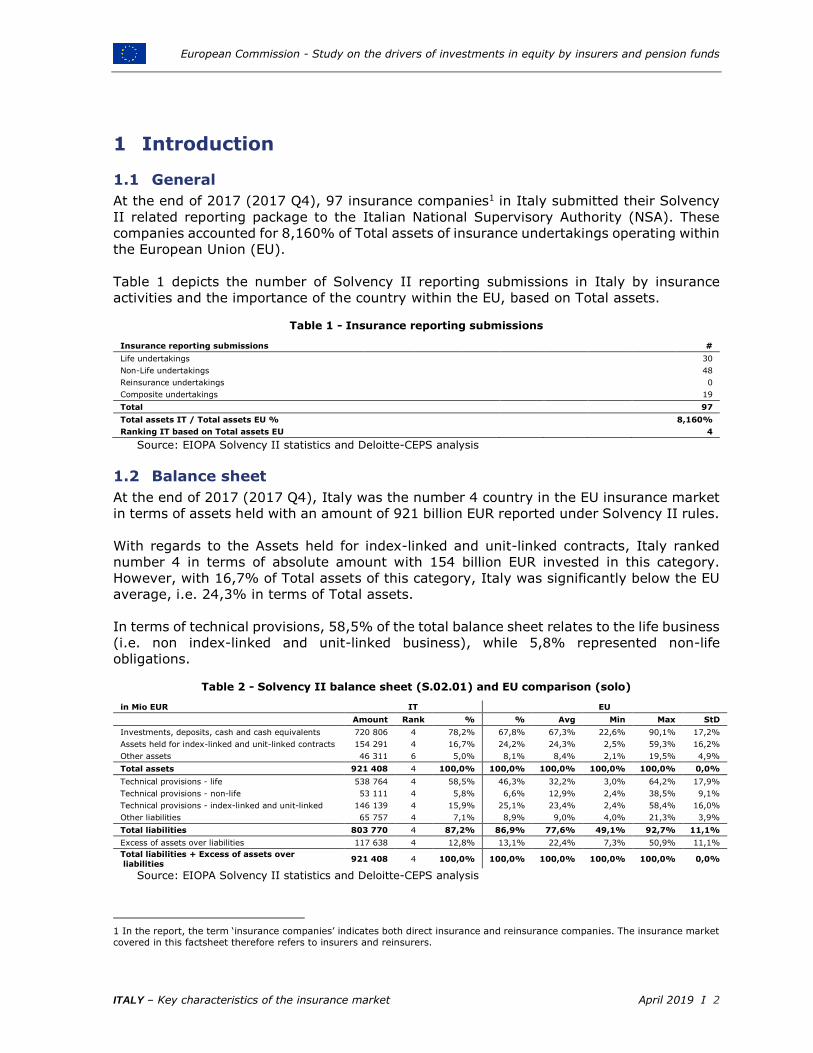
At the end of 2017 (2017 Q4), Italy was the number 4 country in the EU insurance market
in terms of assets held with an amount of 921 billion EUR reported under Solvency II rules.
With regards to the Assets held for index-linked and unit-linked contracts, Italy ranked
number 4 in terms of absolute amount with 154 billion EUR invested in this category.
However, with 16,7% of Total assets of this category, Italy was significantly below the EU
average, i.e. 24,3% in terms of Total assets.
In terms of technical provisions, 58,5% of the total balance sheet relates to the life business
(i.e. non index-linked and unit-linked business), while 5,8% represented non-life
obligations.
Table 2 - Solvency II balance sheet (S.02.01) and EU comparison (solo)
in Mio EUR IT EU
Amount Rank % % Avg Min Max StD
Investments, deposits, cash and cash equivalents 720 806 4 78,2% 67,8% 67,3% 22,6% 90,1% 17,2%
Assets held for index-linked and unit-linked contracts 154 291 4 16,7% 24,2% 24,3% 2,5% 59,3% 16,2%
Other assets 46 311 6 5,0% 8,1% 8,4% 2,1% 19,5% 4,9%
Total assets 921 408 4 100,0% 100,0% 100,0% 100,0% 100,0% 0,0%
Technical provisions - life 538 764 4 58,5% 46,3% 32,2% 3,0% 64,2% 17,9%
Technical provisions - non-life 53 111 4 5,8% 6,6% 12,9% 2,4% 38,5% 9,1%
Technical provisions - index-linked and unit-linked 146 139 4 15,9% 25,1% 23,4% 2,4% 58,4% 16,0%
Other liabilities 65 757 4 7,1% 8,9% 9,0% 4,0% 21,3% 3,9%
Total liabilities 803 770 4 87,2% 86,9% 77,6% 49,1% 92,7% 11,1%
Excess of assets over liabilities 117 638 4 12,8% 13,1% 22,4% 7,3% 50,9% 11,1%
Total liabilities + Excess of assets over
liabilities 921 408 4 100,0% 100,0% 100,0% 100,0% 100,0% 0,0%
Source: EIOPA Solvency II statistics and Deloitte-CEPS analysis
1 In the report, the term ‘insurance companies’ indicates both direct insurance and reinsurance companies. The insurance market
covered in this factsheet therefore refers to insurers and reinsurers.
European Commission - Study on the drivers of investments in equity by insurers and pension funds
ITALY – Key characteristics of the insurance market April 2019 I 3
The balance sheet item Investments, deposits, cash and cash equivalents will be further
detailed in section 2, while section 3 will focus on Assets held for index-linked and unit-
linked contracts.
1.3 Solvency II ratios
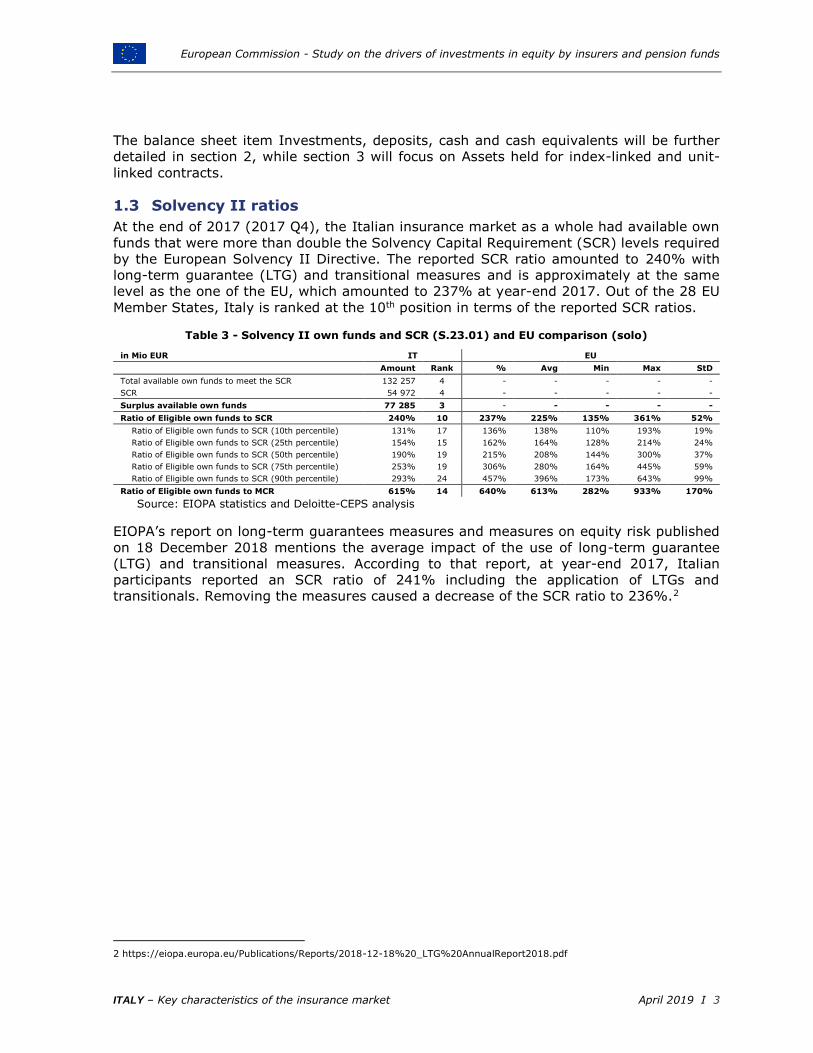
At the end of 2017 (2017 Q4), the Italian insurance market as a whole had available own
funds that were more than double the Solvency Capital Requirement (SCR) levels required
by the European Solvency II Directive. The reported SCR ratio amounted to 240% with
long-term guarantee (LTG) and transitional measures and is approximately at the same
level as the one of the EU, which amounted to 237% at year-end 2017. Out of the 28 EU
Member States, Italy is ranked at the 10th position in terms of the reported SCR ratios.
Table 3 - Solvency II own funds and SCR (S.23.01) and EU comparison (solo)
in Mio EUR IT EU
Amount Rank % Avg Min Max StD
Total available own funds to meet the SCR 132 257 4 - - - - -
SCR 54 972 4 - - - - -
Surplus available own funds 77 285 3 - - - - -
Ratio of Eligible own funds to SCR 240% 10 237% 225% 135% 361% 52%
Ratio of Eligible own funds to SCR (10th percentile) 131% 17 136% 138% 110% 193% 19%
Ratio of Eligible own funds to SCR (25th percentile) 154% 15 162% 164% 128% 214% 24%
Ratio of Eligible own funds to SCR (50th percentile) 190% 19 215% 208% 144% 300% 37%
Ratio of Eligible own funds to SCR (75th percentile) 253% 19 306% 280% 164% 445% 59%
Ratio of Eligible own funds to SCR (90th percentile) 293% 24 457% 396% 173% 643% 99%
Ratio of Eligible own funds to MCR 615% 14 640% 613% 282% 933% 170%
Source: EIOPA statistics and Deloitte-CEPS analysis
EIOPA’s report on long-term guarantees measures and measures on equity risk published
on 18 December 2018 mentions the average impact of the use of long-term guarantee
(LTG) and transitional measures. According to that report, at year-end 2017, Italian
participants reported an SCR ratio of 241% including the application of LTGs and
transitionals. Removing the measures caused a decrease of the SCR ratio to 236%.2
2 https://eiopa.europa.eu/Publications/Reports/2018-12-18%20_LTG%20AnnualReport2018.pdf
European Commission - Study on the drivers of investments in equity by insurers and pension funds
ITALY – Key characteristics of the insurance market April 2019 I 4
2 Investments, deposits, cash and cash equivalents
2.1 Scope
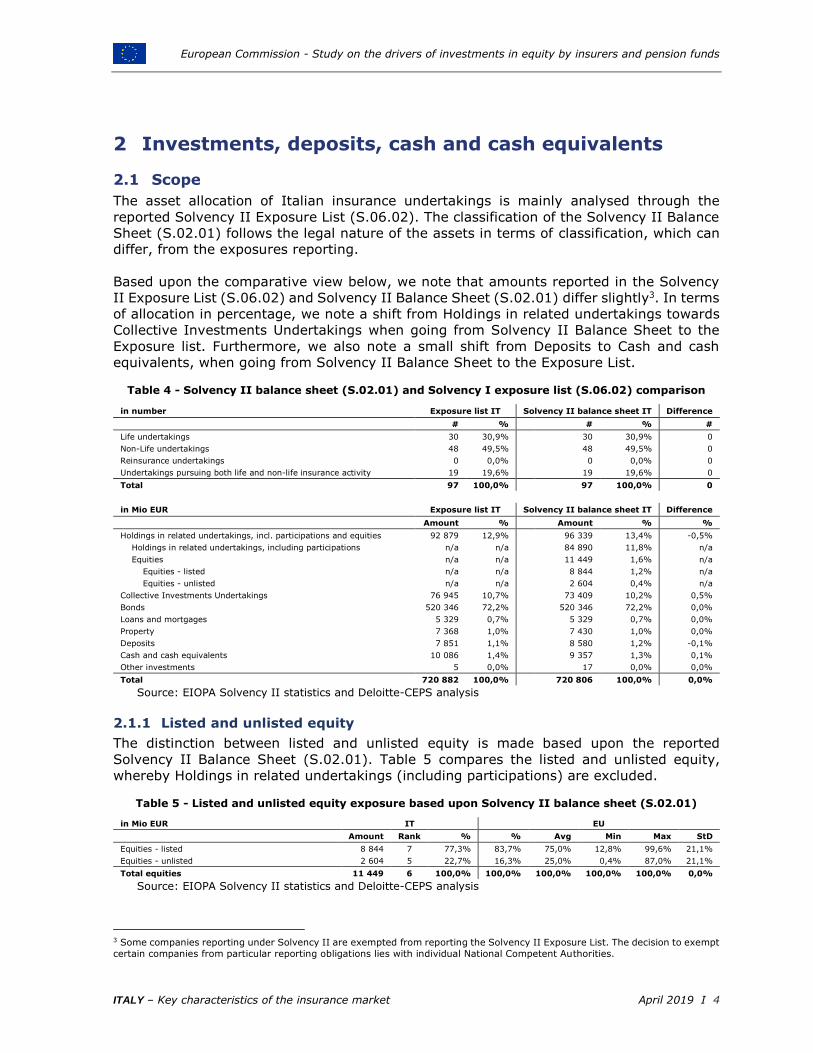
The asset allocation of Italian insurance undertakings is mainly analysed through the
reported Solvency II Exposure List (S.06.02). The classification of the Solvency II Balance
Sheet (S.02.01) follows the legal nature of the assets in terms of classification, which can
differ, from the exposures reporting.
Based upon the comparative view below, we note that amounts reported in the Solvency
II Exposure List (S.06.02) and Solvency II Balance Sheet (S.02.01) differ slightly3. In terms
of allocation in percentage, we note a shift from Holdings in related undertakings towards
Collective Investments Undertakings when going from Solvency II Balance Sheet to the
Exposure list. Furthermore, we also note a small shift from Deposits to Cash and cash
equivalents, when going from Solvency II Balance Sheet to the Exposure List.
Table 4 - Solvency II balance sheet (S.02.01) and Solvency I exposure list (S.06.02) comparison
in number Exposure list IT Solvency II balance sheet IT Difference
# % # % #
Life undertakings 30 30,9% 30 30,9% 0
Non-Life undertakings 48 49,5% 48 49,5% 0
Reinsurance undertakings 0 0,0% 0 0,0% 0
Undertakings pursuing both life and non-life insurance activity 19 19,6% 19 19,6% 0
Total 97 100,0% 97 100,0% 0
in Mio EUR Exposure list IT Solvency II balance sheet IT Difference
Amount % Amount % %
Holdings in related undertakings, incl. participations and equities 92 879 12,9% 96 339 13,4% -0,5%
Holdings in related undertakings, including participations n/a n/a 84 890 11,8% n/a
Equities n/a n/a 11 449 1,6% n/a
Equities - listed n/a n/a 8 844 1,2% n/a
Equities - unlisted n/a n/a 2 604 0,4% n/a
Collective Investments Undertakings 76 945 10,7% 73 409 10,2% 0,5%
Bonds 520 346 72,2% 520 346 72,2% 0,0%
Loans and mortgages 5 329 0,7% 5 329 0,7% 0,0%
Property 7 368 1,0% 7 430 1,0% 0,0%
Deposits 7 851 1,1% 8 580 1,2% -0,1%
Cash and cash equivalents 10 086 1,4% 9 357 1,3% 0,1%
Other investments 5 0,0% 17 0,0% 0,0%
Total 720 882 100,0% 720 806 100,0% 0,0%
Source: EIOPA Solvency II statistics and Deloitte-CEPS analysis
2.1.1 Listed and unlisted equity
The distinction between listed and unlisted equity is made based upon the reported
Solvency II Balance Sheet (S.02.01). Table 5 compares the listed and unlisted equity,
whereby Holdings in related undertakings (including participations) are excluded.
Table 5 - Listed and unlisted equity exposure based upon Solvency II balance sheet (S.02.01)
in Mio EUR IT EU
Amount Rank % % Avg Min Max StD
Equities - listed 8 844 7 77,3% 83,7% 75,0% 12,8% 99,6% 21,1%
Equities - unlisted 2 604 5 22,7% 16,3% 25,0% 0,4% 87,0% 21,1%
Total equities 11 449 6 100,0% 100,0% 100,0% 100,0% 100,0% 0,0%
Source: EIOPA Solvency II statistics and Deloitte-CEPS analysis
3 Some companies reporting under Solvency II are exempted from reporting the Solvency II Exposure List. The decision to exempt
certain companies from particular reporting obligations lies with individual National Competent Authorities.

European Commission - Study on the drivers of investments in equity by insurers and pension funds
ITALY – Key characteristics of the insurance market April 2019 I 5
Based upon the quarterly reporting as of Q4 2017, Italian insurers invested 77,3% of their
directly-held equity positions in listed equity in comparison to an average of 75,0% in the
EU. With an amount of 8 884 million EUR, Italy ranked number 7 in the EU.
With an invested amount of 2 604 million EUR, unlisted equity constituted a significant
portion of the equity investment category of the directly-held equity investments, i.e.
22,7%. This placed Italy as the number 5 in the EU.
2.2 Asset exposure
From an asset exposure perspective, the insurance market in Italy was mainly invested in
Government bonds and Corporate bonds (in total 69,8% of Total Investments, deposits,
cash and cash equivalents), Collective Investment Undertakings (10,7%), and Equity
(12,9%).
Within the bond categories, the insurance market was not equally exposed to government
securities (50,3%) and corporate debt (19,5%), categories for which Italy ranked number
2 and number 4 respectively, in the EU. Comparing the different assets classes, we note
that the government bonds asset class shows the highest standard deviation of 18,9%.
The category of Collective Investment Undertakings was the fourth most important for the
Italian Insurance market in terms of asset exposures. Within this category, the industry
was mainly exposed to Debt funds, Asset allocation funds, and Real estate funds for which
Italy ranked respectively number 5, number 4, and number 4 in the EU.
Equity was the third category to which the Italian insurers had the most exposure. Equity
of real estate related corporation constitutes 0,5% within the 12,9% of the total equity
exposure.
Table 6 - Asset exposures based upon Solvency II exposure list (S.06.02)
in Mio EUR IT EU
Amount Rank % % Avg Min Max StD
Equity 92 879 4 12,9% 12,0% 9,5% 1,1% 28,1% 6,5%
Common equity 86 964 4 12,1% 10,4% 7,8% 1,0% 22,5% 6,0%
Equity of real estate related corporation 3 762 7 0,5% 1,0% 1,1% 0,0% 4,0% 1,2%
Other equity 2 153 7 0,3% 0,6% 0,6% 0,0% 2,0% 0,7%
Collective Investment Undertakings 76 945 5 10,7% 19,2% 12,8% 1,5% 41,6% 9,3%
Equity funds 6 443 6 0,9% 3,2% 2,7% 0,4% 10,9% 2,4%
Private equity funds 1 908 7 0,3% 0,5% 0,5% 0,0% 6,9% 1,3%
Debt funds 29 463 5 4,1% 7,8% 5,6% 0,8% 18,0% 4,9%
Money market funds 4 775 4 0,7% 2,3% 1,1% 0,0% 6,3% 1,6%
Asset allocation funds 13 007 4 1,8% 1,1% 0,8% 0,0% 3,9% 1,0%
Real estate funds 10 033 4 1,4% 1,6% 0,8% 0,0% 3,3% 0,9%
Alternative funds 2 789 6 0,4% 0,4% 0,3% 0,0% 3,1% 0,6%
Infrastructure funds 1 222 4 0,2% 0,2% 0,1% 0,0% 0,9% 0,2%
Other 7 305 4 1,0% 2,0% 0,9% 0,0% 7,2% 1,7%
Government bonds 362 282 2 50,3% 28,7% 39,7% 10,0% 77,0% 18,9%
Corporate bonds 140 445 4 19,5% 26,9% 21,6% 1,8% 47,3% 11,2%
Structured notes 15 204 3 2,1% 1,3% 0,5% 0,0% 2,5% 0,6%
Collateralised securities 2 415 5 0,3% 0,6% 0,6% 0,0% 9,3% 1,8%
Mortgages and loans 5 329 8 0,7% 4,8% 3,8% 0,3% 26,3% 5,2%
Property 7 368 7 1,0% 2,0% 3,5% 0,8% 11,6% 2,6%
Deposits 7 851 6 1,1% 2,8% 3,6% 0,2% 16,6% 3,6%
Cash and cash equivalents 10 086 6 1,4% 1,4% 4,3% 0,5% 16,6% 3,5%
Other investments 5 10 0,0% 0,1% 0,1% 0,0% 0,9% 0,3%
Not reported 74 7 0,0% 0,0% 0,0% 0,0% 0,3% 0,1%
Total Investments, deposits, cash and
cash equivalents 720 882 4 100,0% 100,0% 100,0% 100,0% 100,0% 0,0%
Source: EIOPA Solvency II statistics and Deloitte-CEPS analysis

European Commission - Study on the drivers of investments in equity by insurers and pension funds
ITALY – Key characteristics of the insurance market April 2019 I 6
2.2.1 Asset exposures between Life, Non-Life and Composite insurance
undertakings, and reinsurers
Table 7, based upon the Asset Exposure reporting (S.06.02) of Q4 2017, gives further
insight into the investment behaviour of Life, Non-Life and Composite insurance companies,
and reinsurers in Italy.
Table 7 - Asset exposure based upon Solvency II exposure list (S.06.02) for Life, Non-Life and
Composite insurance undertakings, and reinsurers
in % IT EU
Life Non-life
Composite
and reinsurance
Life Non-life
Composite
and reinsurance
Equity 2,3% 7,1% 16,5% 6,6% 18,3% 16,5%
Common equity 2,0% 4,2% 15,6% 5,0% 16,2% 14,9%
Equity of real estate related corporation 0,1% 0,1% 0,7% 1,0% 0,8% 1,2%
Other equity 0,2% 2,8% 0,3% 0,6% 1,3% 0,4%
Collective Investment Undertakings 9,8% 12,0% 10,9% 22,4% 22,3% 13,8%
Equity funds 1,6% 1,2% 0,7% 3,7% 2,9% 2,7%
Private equity funds 0,2% 0,2% 0,3% 0,5% 0,5% 0,5%
Debt funds 4,1% 4,8% 4,1% 9,7% 9,7% 4,7%
Money market funds 0,7% 0,7% 0,6% 2,8% 1,4% 2,0%
Asset allocation funds 0,9% 0,3% 2,1% 1,3% 1,2% 0,9%
Real estate funds 1,5% 2,7% 1,3% 1,6% 1,8% 1,4%
Alternative funds 0,5% 1,7% 0,3% 0,3% 0,3% 0,5%
Infrastructure funds 0,1% 0,1% 0,2% 0,2% 0,2% 0,3%
Other 0,3% 0,3% 1,3% 2,3% 4,3% 0,8%
Government bonds 59,5% 46,2% 47,4% 28,1% 19,1% 33,4%
Corporate bonds 23,2% 22,2% 18,2% 29,2% 29,3% 22,9%
Structured notes 2,5% 2,0% 2,0% 1,4% 0,6% 1,5%
Collateralised securities 0,5% 0,5% 0,3% 0,8% 0,6% 0,5%
Mortgages and loans 0,1% 0,3% 1,0% 7,4% 3,2% 2,3%
Property 0,2% 4,1% 1,2% 2,0% 2,5% 1,7%
Deposits 0,3% 0,3% 1,5% 0,8% 1,6% 5,8%
Cash and cash equivalents 1,7% 5,2% 1,1% 1,0% 2,5% 1,4%
Other investments 0,0% 0,0% 0,0% 0,2% 0,0% 0,1%
Not reported 0,0% 0,1% 0,0% 0,0% 0,0% 0,0%
Total Investments, deposits, cash and cash equivalents 100,0% 100,0% 100,0% 100,0% 100,0% 100,0%
Source: EIOPA Solvency II statistics and Deloitte-CEPS analysis
At EU level Non-Life insurers invested a significantly higher portion of their Investments in
Equity (18,3% equity investments) in comparison to pure Life insurers (6,6% equity
investments). In Italy, we observe that the Composite insurers and reinsurers invested in
equity, as a percentage of their assets, more than their Life and Non-Life insurer
counterparts.
On the other hand, at EU level, pure Life insurers and also Composite insurers allocated a
larger share of their investments to government bonds as compared to Non-Life insurers.
An interesting observation was the contrast in behaviour between Italian insurers and their
counterpart at EU level with regard to the Collective Investment Undertakings: for every
undertaking type, the share of investments through funds were lower than the EU levels.

European Commission - Study on the drivers of investments in equity by insurers and pension funds
ITALY – Key characteristics of the insurance market April 2019 I 7
2.3 Equity exposure
Based upon the information included in the Solvency II Exposure List (S.06.02) and Balance
Sheet (S.02.01), equity exposures can be calculated and presented in different ways:
Equity exposure as the sum of Equity (Common equity, Equity of real estate related
corporation and Other equity), Equity and Private equity funds, and Equity risk
included in structured notes;
Equity of real estate related corporation could be seen as a property exposure.
Therefore equity exposures are presented including and excluding Equity of real
estate related corporation;
The equity amounts of the Solvency II Exposure List does not provide further details
whether the equity exposures relate to listed or unlisted equity positions. In
addition, the Solvency II Exposure List does not mention whether the equity relates
to Holdings in related undertakings, including participations;
Therefore, the listed and unlisted share amounts reported in the Solvency II Balance
Sheet are considered and integrated as an equity exposure indicator. A rescaling is
performed in case a difference is noted between the two Solvency II information
sets (Exposure List versus Balance Sheet). The adjusted equity exposure stemming
from this analysis excludes the Equity exposure coming from Holdings in related
undertakings, including participations. These holdings can potentially be important
within insurance groups.
Table 8 - Equity exposure based upon Solvency II balance sheet (S.02.01) and Solvency II exposure list (S.06.02)
in Mio EUR IT EU
Amount Rank % % Avg Min Max StD
Equity 92 879 4 12,9% 12,0% 9,5% 1,1% 28,1% 6,5%
Common equity 86 964 4 12,1% 10,4% 7,8% 1,0% 22,5% 6,0%
Equity of real estate related corporation 3 762 7 0,5% 1,0% 1,1% 0,0% 4,0% 1,2%
Other equity 2 153 7 0,3% 0,6% 0,6% 0,0% 2,0% 0,7%
Collective Investment Undertakings - Equity funds 8 351 5 1,2% 3,8% 3,2% 0,4% 14,7% 3,5%
Equity funds 6 443 6 0,9% 3,2% 2,7% 0,4% 10,9% 2,4%
Private equity funds 1 908 7 0,3% 0,5% 0,5% 0,0% 6,9% 1,3%
Structured notes - Equity risk 85 8 0,0% 0,2% 0,1% 0,0% 0,6% 0,1%
Total Equity exposure 101 315 4 14,1% 16,0% 12,7% 2,5% 37,4% 8,4%
Equity without Equity of real estate related
corporation 89 117 4 12,4% 11,0% 8,4% 1,1% 24,1% 6,1%
Equity exposure without Equity of real estate related
corporation 97 553 4 13,5% 15,0% 11,7% 2,4% 33,3% 7,9%
Equities market value balance sheet (rescaled to CIC scope)
11 454 6 1,6% 3,6% 3,2% 0,1% 20,6% 4,0%
Equities - listed (rescaled to CIC scope) 8 848 7 1,2% 3,0% 2,6% 0,0% 15,4% 3,2%
Equities - unlisted (rescaled to CIC scope) 2 606 5 0,4% 0,6% 0,6% 0,0% 5,2% 1,0%
Equity exposure based upon (Un)Listed equities
(rescaled) 19 890 6 2,8% 7,6% 6,5% 1,2% 29,8% 6,7%
Source: EIOPA Solvency II statistics and Deloitte-CEPS analysis
The observed standard deviations at EU level are relatively high given the asset allocation
in percentage between the different asset classes at EU level.
In Italy, we note that equity exposures coming from Collective Investment Undertakings
amount to 1,2% and are lower than the listed and unlisted equity exposures which in total
amount to 1,6%. Hereby the listed and unlisted equities in Italy are not similar to the asset
allocation at EU level.

European Commission - Study on the drivers of investments in equity by insurers and pension funds
ITALY – Key characteristics of the insurance market April 2019 I 8
2.3.1 Direct and indirect equity exposure
Table 9 - Direct and indirect equity exposure based upon Solvency II exposure list (S.06.02)
in Mio EUR IT EU
Amount Rank % % Avg Min Max StD
Direct equity 92 879 4 91,7% 75,2% 73,4% 39,2% 94,5% 15,9%
Common equity 86 964 4 85,8% 64,8% 59,4% 28,6% 93,3% 19,0%
Equity of real estate related corporation 3 762 7 3,7% 6,4% 8,4% 0,0% 39,1% 9,6%
Other equity 2 153 7 2,1% 3,9% 5,7% 0,0% 35,3% 8,8%
Indirect equity 8 436 6 8,3% 24,8% 26,6% 5,5% 60,8% 15,9%
Collective Investment Undertakings - Equity funds 8 351 6 8,2% 23,6% 25,9% 4,6% 60,6% 15,7%
Equity funds 6 443 6 6,4% 20,2% 22,8% 4,6% 52,9% 13,4%
Private equity funds 1 908 7 1,9% 3,3% 3,1% 0,0% 28,4% 5,7%
Structured notes - Equity risk 85 8 0,1% 1,3% 0,7% 0,0% 4,0% 1,0%
Total Equity exposure 101 315 4 100,0% 100,0% 100,0% 100,0% 100,0% 0,0%
Source: EIOPA Solvency II statistics and Deloitte-CEPS analysis
In 2017 Q4, the insurance market in Italy was invested twice as much in Direct equity
(91,7% of Total equity) than in Indirect equity (8,3% of Total equity).
In terms of direct equity exposure, Italy ranked number 4 and number 7 in the EU, with
regards respectively to the exposure amount to Common equity and Equity of real estate
related corporation.
Within the Indirect equity category, Equity funds constituted the bulk of investments with
6,4% of Total equity, more than 3 times the amount invested in Private equity funds.
2.3.2 Equity by location
Table 10 - Equity exposure by location based upon Solvency II exposure list (S.06.02)
in Mio EUR IT
EU home EU other outside EU (1) Total
Equity 43 317 45 208 4 354 92 879
Common equity 38 859 43 752 4 352 86 964
Equity of real estate related corporation 3 196 566 0 3 762
Other 1 262 890 2 2 153
Collective Investment Undertakings - Equity funds 1 841 6 222 287 8 351
Equity funds 857 5 341 245 6 443
Private equity funds 984 881 42 1 908
Structured notes - Equity risk 0 66 19 85
Total Equity exposure 45 158 51 496 4 660 101 315
in % IT
EU home EU other outside EU (1) Total
Equity 46,6% 48,7% 4,7% 100,0%
Common equity 44,7% 50,3% 5,0% 100,0%
Equity of real estate related corporation 85,0% 15,0% 0,0% 100,0%
Other 58,6% 41,3% 0,1% 100,0%
Collective Investment Undertakings - Equity funds 22,0% 74,5% 3,4% 100,0%
Equity funds 13,3% 82,9% 3,8% 100,0%
Private equity funds 51,6% 46,2% 2,2% 100,0%
Structured notes - Equity risk 0,0% 77,7% 22,3% 100,0%
Total Equity exposure 44,6% 50,8% 4,6% 100,0%
(1) The following countries are included in the class 'outside EU': IS, LI, NO, AU, CA, JP, US, CH and countries grouped under the caption 'Rest of World'. In addition some investments are not assigned to an individual country and are also included in this class.
Source: EIOPA Solvency II statistics and Deloitte-CEPS analysis

European Commission - Study on the drivers of investments in equity by insurers and pension funds
ITALY – Key characteristics of the insurance market April 2019 I 9
Based upon the Q4 2017 reporting with regards to the location of equity investments,
insurers established in Italy favoured domestic investments to a large extent, dedicating to
these 46,6% of their direct equity investments, and 22,0% of their indirect investments.
Table 10 also showed that besides the home market, Italy insurers invested significantly
more in equity of other EU Member States than that of non-EU Member States. The
Netherlands, Germany and France were the preferred destinations.
Table 11 - Direct equity exposure by location based upon Solvency II exposure list (S.06.02)
in Mio EUR IT
Amount %
Home country 43 317 46,6%
IT 43 317 46,6%
Top 5 countries (outside home country) 42 370 45,6%
NL 15 589 16,8%
DE 13 431 14,5%
FR 8 362 9,0%
ES 2 820 3,0%
IE 2 168 2,3%
Home + Top 5 countries (outside home country) 85 687 92,3%
Total Direct equity exposure (with real estate corporation) 92 879 100,0%
in Mio EUR IT
Amount %
Home country 40 121 45,0%
IT 40 121 45,0%
Top 5 countries (outside home country) 41 891 47,0%
NL 15 398 17,3%
DE 13 349 15,0%
FR 8 224 9,2%
ES 2 752 3,1%
IE 2 168 2,4%
Home + Top 5 countries (outside home country) 82 012 92,0%
Total Direct equity exposure (without real estate corporation) 89 117 100,0%
Source: EIOPA Solvency II statistics and Deloitte-CEPS analysis

European Commission - Study on the drivers of investments in equity by insurers and pension funds
ITALY – Key characteristics of the insurance market April 2019 I 10
3 Index-linked and unit-linked investments
3.1 Scope
Based upon the comparative view below, we note a minor difference with respect to the
Assets held for index-linked and unit-linked contracts reported in the Solvency II Exposure
List (S.06.02) and Solvency II Balance Sheet (S.02.01).
Table 12 - Solvency II balance sheet (S.02.01) and Solvency II exposure list (S.06.02) comparison
in number Exposure list IT Solvency II balance sheet IT Difference
# % # % #
Life undertakings 30 30,9% 30 30,9% 0
Non-Life undertakings 48 49,5% 48 49,5% 0
Reinsurance undertakings 0 0,0% 0 0,0% 0
Undertakings pursuing both life and non-life insurance activity 19 19,6% 19 19,6% 0
Total 97 100,0% 97 100,0% 0
in Mio EUR Exposure list IT Solvency II balance sheet IT Difference
Amount % Amount % %
Assets held for index-linked and unit-linked contracts 154 180 100,0% 154 291 100,0% -0,1%
Source: EIOPA Solvency II statistics and Deloitte-CEPS analysis
3.2 Asset exposure
Table 13 depicts a more detailed view of the Assets held for index-linked and unit-linked
contracts, based upon the Solvency II exposure list (S.06.02).
Table 13 - Asset exposure based upon Solvency II exposure list (S.06.02)
in Mio EUR IT EU
Amount Rank % % Avg Min Max StD
Equity 3 899 7 2,5% 19,3% 4,5% 0,0% 30,1% 7,1%
Common equity 3 769 7 2,4% 18,0% 3,9% 0,0% 28,8% 6,3%
Equity of real estate related corporation 85 7 0,1% 0,8% 0,3% 0,0% 1,5% 0,5%
Other equity 44 7 0,0% 0,4% 0,3% 0,0% 4,1% 0,9%
Collective Investment Undertakings 130 055 4 84,4% 63,2% 73,1% 30,1% 97,5% 16,3%
Equity funds 45 978 5 29,8% 26,5% 29,2% 11,2% 57,5% 10,5%
Private equity funds 10 10 0,0% 0,1% 0,2% 0,0% 2,9% 0,6%
Debt funds 40 880 2 26,5% 12,1% 19,0% 4,8% 47,5% 11,4%
Money market funds 3 235 4 2,1% 2,2% 1,7% 0,0% 7,5% 1,8%
Asset allocation funds 13 879 8 9,0% 14,8% 13,1% 0,4% 30,5% 7,7%
Real estate funds 15 15 0,0% 1,4% 0,6% 0,0% 6,2% 1,2%
Alternative funds 1 864 7 1,2% 1,6% 2,4% 0,0% 16,3% 3,8%
Infrastructure funds 7 4 0,0% 0,0% 0,1% 0,0% 2,4% 0,5%
Other 24 187 1 15,7% 4,6% 6,9% 0,0% 44,3% 10,0%
Government bonds 12 952 2 8,4% 6,4% 6,9% 0,0% 31,4% 8,4%
Corporate bonds 1 510 8 1,0% 3,9% 6,0% 0,0% 22,7% 6,9%
Structured notes 136 14 0,1% 1,6% 4,1% 0,0% 18,9% 4,9%
Collateralised securities 30 5 0,0% 0,1% 0,1% 0,0% 0,9% 0,2%
Mortgages and loans 0 - 0,0% 0,2% 0,2% -3,7% 2,5% 1,0%
Property 0 - 0,0% 1,3% 0,6% 0,0% 7,6% 1,5%
Deposits 3 104 5 2,0% 1,2% 2,0% -0,3% 14,5% 3,3%
Cash and cash equivalents 2 095 5 1,4% 1,2% 2,2% 0,0% 8,5% 2,5%
Other investments 399 3 0,3% 0,4% 0,3% 0,0% 8,1% 1,5%
Not reported 0 - 0,0% 1,2% 0,1% 0,0% 2,3% 0,4%
Total Investments, deposits, cash and cash
equivalents 154 180 4 100,0% 100,0% 100,0% 100,0% 100,0% 0,0%
Source: EIOPA Solvency II statistics and Deloitte-CEPS analysis
The Collective Investment Undertakings (84,4%) and the Government bonds (8,4%)
represent the most important asset classes of the index-linked and unit-linked investments.
Overall, we note a significantly different asset exposure allocation in comparison to the

European Commission - Study on the drivers of investments in equity by insurers and pension funds
ITALY – Key characteristics of the insurance market April 2019 I 11
asset exposure for non index-linked and unit-linked investments. Hereby we refer to section
2 for further details.
Relatively to the EU average, we observe a large difference between the portion of index-
linked and unit-linked related assets that were invested in Corporate bonds, 1,0% in Italy
compared to 6,0% in the EU.
3.3 Equity exposure
The Solvency II balance sheet (S.02.01) does not include a further split in different asset
classes for the Assets held for index-linked and unit-linked contracts. Hence the rescaling
exercise as presented in section 2 cannot be performed here.
Table 14 - Equity exposure based upon Solvency II exposure list (S.06.02)
in Mio EUR IT EU
Amount Rank % % Avg Min Max StD
Equity 3 899 7 2,5% 19,3% 4,5% 0,0% 30,1% 7,1%
Common equity 3 769 7 2,4% 18,0% 3,9% 0,0% 28,8% 6,3%
Equity of real estate related corporation 85 7 0,1% 0,8% 0,3% 0,0% 1,5% 0,5%
Other equity 44 7 0,0% 0,4% 0,3% 0,0% 4,1% 0,9%
Collective Investment Undertakings - Equity funds 45 988 5 29,8% 26,5% 29,3% 11,2% 57,5% 10,4%
Equity funds 45 978 5 29,8% 26,5% 29,2% 11,2% 57,5% 10,5%
Private equity funds 10 10 0,0% 0,1% 0,2% 0,0% 2,9% 0,6%
Structured notes - Equity risk 0 - 0,0% 1,2% 2,7% 0,0% 15,0% 3,5%
Total Equity exposure 49 887 7 32,4% 47,1% 36,5% 11,7% 58,6% 10,9%
Equity without Equity of real estate related corporation
3 814 4 2,5% 16,0% 4,2% 0,0% 29,2% 6,8%
Equity exposure without Equity of real estate
related corporation 49 802 7 32,3% 40,0% 36,2% 11,7% 58,6% 10,8%
Source: EIOPA Solvency II statistics and Deloitte-CEPS analysis
In Italy, we note that total equity exposures related to index-linked and unit-linked
contracts (32,4%) are significantly higher in comparison to non index-linked and unit-linked
contracts (14,1%). Equity funds are the main contributors to the total equity exposures.
3.3.1 Direct and indirect equity exposure
Table 15 - Direct and indirect equity exposure based upon Solvency II exposure list (S.06.02)
in Mio EUR IT EU
Amount Rank % % Avg Min Max StD
Direct equity 3 899 7 7,8% 38,3% 11,1% 0,0% 54,2% 15,2%
Common equity 3 769 7 7,6% 35,4% 9,6% 0,0% 51,8% 13,2%
Equity of real estate related corporation 85 7 0,2% 1,7% 0,7% 0,0% 4,0% 1,1%
Other equity 44 7 0,1% 1,3% 0,8% 0,0% 9,7% 2,2%
Indirect equity 45 988 6 92,2% 61,7% 88,9% 45,8% 100,0% 15,2%
Collective Investment Undertakings - Equity funds
45 988 5 92,2% 59,1% 81,5% 45,7% 100,0% 15,5%
Equity funds 45 978 5 92,2% 58,6% 81,0% 44,9% 100,0% 16,0%
Private equity funds 10 10 0,0% 0,5% 0,5% 0,0% 6,9% 1,4%
Structured notes - Equity risk 0 0,0% 2,6% 7,4% 0,0% 35,8% 9,6%
Total Equity exposure 49 887 7 100,0% 100,0% 100,0% 100,0% 100,0% 0,0%
Source: EIOPA Solvency II statistics and Deloitte-CEPS analysis
In 2017 Q4, Italian Insurers invested almost all of their Assets held for index and unit-
linked contracts in Indirect equity (92,7% of Total equity). Direct equity constituting 92,2%
of Total equity.
In terms of direct equity exposure, Italy ranked number 7 in the EU, with regards to the
exposure amount to Common equity and Equity of real estate related corporation.

European Commission - Study on the drivers of investments in equity by insurers and pension funds
ITALY – Key characteristics of the insurance market April 2019 I 12
Within the Indirect equity category, Equity funds constituted the bulk of investments,
amounting to 92,2% of Total equity whereas allocation to Private equity funds were
negligible.

European Commission - Study on the drivers of investments in equity by insurers and pension funds
ITALY – Key characteristics of the insurance market April 2019 I 13
4 Insurance products
4.1 Overview
This section covers the most important insurance products offered in Italy and the volume
of the market. Data reported in this section obtained from the Italian Association of
Insurance Companies (ANIA).4
Premiums from direct domestic business totalled 134 billion EUR in 2016, of which 76,2%
(or 102 billion EUR) from life polices and 23,8% from non-life policies. The overall drop of
8.7% was the first registered after three years of steady growth in which premiums had
increased from 105 billion EUR in 2012 to 147 billion EUR in 2015. The 2016 drop was
mainly caused by the life sector in which premiums contacted by 11% (after a 4% increase
a year later). On the other hand, non-life premiums are on a recovery path, after four years
of steady decrease.
Graph 1 - Gross written premiums (in Mio EUR)
Note: Numbers are based on written gross premiums.
Source: ANIA
4 Available at http://www.ania.it/it/index.html.
69%72%
67% 66%
72%
77% 78%76%
31%
28%
33%34%
28%
23%22%
24%
0
20 000
40 000
60 000
80 000
100 000
120 000
140 000
160 000
2009 2010 2011 2012 2013 2014 2015 2016
Life Non-life
European Commission - Study on the drivers of investments in equity by insurers and pension funds
ITALY – Key characteristics of the insurance market April 2019 I 14
4.2 Life insurance products
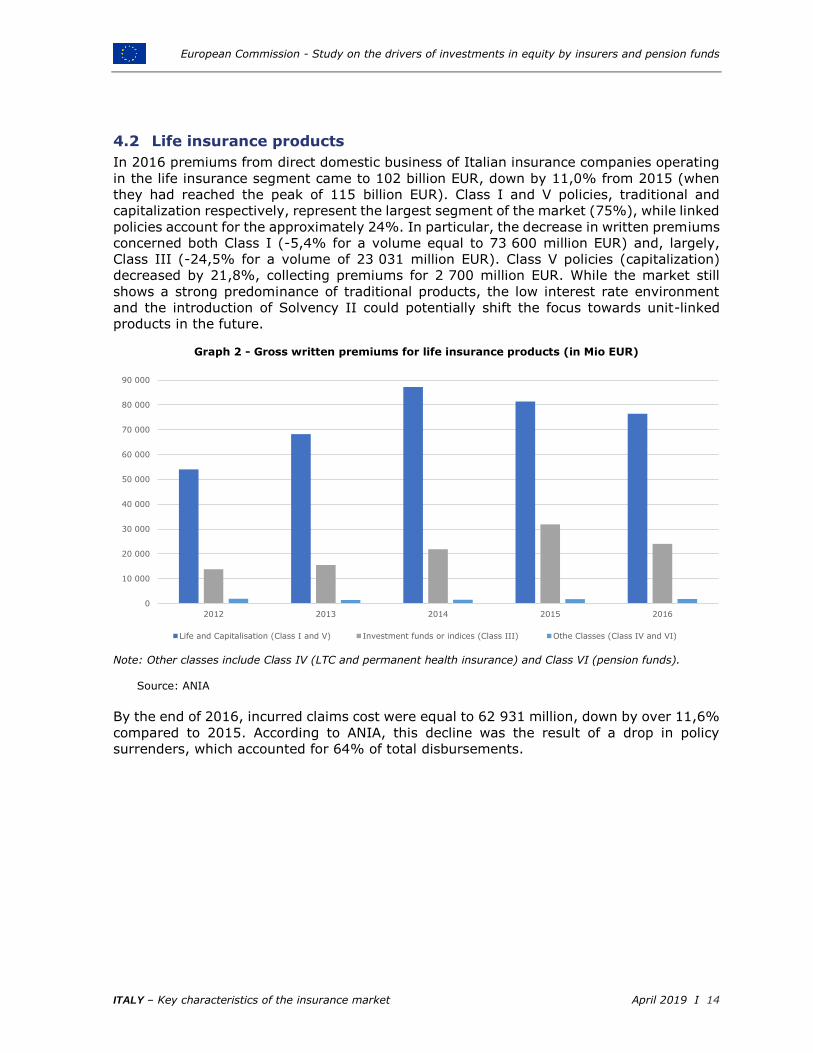
In 2016 premiums from direct domestic business of Italian insurance companies operating
in the life insurance segment came to 102 billion EUR, down by 11,0% from 2015 (when
they had reached the peak of 115 billion EUR). Class I and V policies, traditional and
capitalization respectively, represent the largest segment of the market (75%), while linked
policies account for the approximately 24%. In particular, the decrease in written premiums
concerned both Class I (-5,4% for a volume equal to 73 600 million EUR) and, largely,
Class III (-24,5% for a volume of 23 031 million EUR). Class V policies (capitalization)
decreased by 21,8%, collecting premiums for 2 700 million EUR. While the market still
shows a strong predominance of traditional products, the low interest rate environment
and the introduction of Solvency II could potentially shift the focus towards unit-linked
products in the future.
Graph 2 - Gross written premiums for life insurance products (in Mio EUR)
Note: Other classes include Class IV (LTC and permanent health insurance) and Class VI (pension funds).
Source: ANIA
By the end of 2016, incurred claims cost were equal to 62 931 million, down by over 11,6%
compared to 2015. According to ANIA, this decline was the result of a drop in policy
surrenders, which accounted for 64% of total disbursements.
0
10 000
20 000
30 000
40 000
50 000
60 000
70 000
80 000
90 000
2012 2013 2014 2015 2016
Life and Capitalisation (Class I and V) Investment funds or indices (Class III) Othe Classes (Class IV and VI)

European Commission - Study on the drivers of investments in equity by insurers and pension funds
ITALY – Key characteristics of the insurance market April 2019 I 15
4.3 Non-Life insurance products
In 2016, non-life insurance premiums declined by 1,1% to 31 395 million EUR, compared
to 2015. The non-life share of the industry’s total premiums (non-life plus life) rose to
23,8% from 21,8% in 2015 as a consequence of the contraction in life premiums. Incurred
claims cost, representing cost for settlements, was equal to 20 000 million EUR, as in 2015.
4.3.1 Motor insurance
The motor insurance segment accounted for 50,6% of overall non-life income, at the end
of 2016. Despite that, motor premiums dropped by 5,6% to 13 525 million EUR Moreover,
the number of insured vehicles decreased by 0,2%, contrary to the growth in the last two
years (+0,5% and +1,0% in 2015 and 2014 respectively).
4.3.2 Accident and health insurance
Premiums from direct domestic business related to accident and health totalled 5 357
million EUR and represented 16,7% of the non-life insurance premiums. From this, 56,1%
was due to accident, which was moderately increased by 1% compared to 2015. The
remaining, 42,8% or 2 349 million EUR, was due to sickness which rose by 9,6% within a
year.
4.3.3 Property insurance
The property insurance segment includes fire and natural forces, as well as other damage
to property. The combined written premiums represented 16% or 5 136 million EUR of the
total non-life premiums, at the end of 2016.
4.3.4 General liability insurance
General liability segment represented 9,1% or 2 899 million EUR of the non-life insurance
products market, an increase by 4,95% compared to 2015.
4.3.5 Other insurance
Written premium income for other non-life insurance products reached 2 399 million EUR
and represented approximately 7,7% of the non-life premiums. This insurance class
includes transport, other than motor (such as railway rolling stock classes, aircraft, ships
and goods in transit), credit and suretyship, as well as other non-life classes (i.e. financial
loss, legal expenses and assistance). In particular, assistance had the highest growth rate
in 2016 (56,3%), followed by financial loss (12,3%) and legal expenses (10,1%).

European Commission - Study on the drivers of investments in equity by insurers and pension funds
ITALY – Key characteristics of the insurance market April 2019 I 16
Graph 3 - Allocation of gross written premiums for non-life insurance products (in %)
Note: Property includes fire and other property damage. Other includes transport (railway rolling stock classes, aircraft, ships and goods in transit), credit and suretyship, as well as other non-life classes (financial loss, legal expenses and assistance).
Source: ANIA
4.4 Average duration
In 2016, EIOPA published their Insurance Stress Test Report 5, which resulted in the
following conclusions for Italy:
The approximate effective duration for the TP life for all lines of business reported
by the EIOPA 2016 stress test participants is 4,46;
The Macaulay duration for the TP life for all lines of business reported by the EIOPA
2016 stress test participants is 9,49.
In comparison, the approximate effective duration and Macaulay duration for the TP life for
all lines of business for the EU/EEA are 8,23 and 13,97, respectively.
5 EIOPA, 2016, 2016 EIOPA Insurance Stress Test Report. https://eiopa.europa.eu/publications/surveys/eiopa-bos-16-
302%20insurance%20stress%20test%202016%20report.pdf
Motor
50%
Accident and health
17%
Property
16%
General liability
9%
Other
8%

European Commission - Study on the drivers of investments in equity by insurers and pension funds
ITALY – Key characteristics of the insurance market April 2019 I 17
5 Accounting & Tax framework
5.1 Accounting framework
The EU has introduced rules, as laid down in Directive 2013/34/EU, to promote the
convergence of accounting standards at global level and to ensure consistent and
comparable financial reporting across the EU. Regulation 1606/2002/EC requires all listed
companies to prepare their consolidated financial statements in accordance with a single
set of international standards, the so-called IFRS.6
1. Applicable GAAP at consolidated level: IFRS required for all listed companies7 and
non-listed companies.
2. Applicable GAAP at statutory level: IFRS required for listed insurance companies
with no subsidiaries7. IFRS is not permitted for non-listed companies.
3. Prudential regulatory framework: Solvency II for the calculation of the Solvency
Capital Requirement.
5.2 Tax framework
5.2.1 Capital gains on shares
Gains on qualifying shares are 95% exempt subject to the following conditions (both
resident companies and permanent establishments of non-resident companies):
1. A holding period requirement: full ownership for an uninterrupted period of 12-13
months;
2. An accounting requirement: the participation is classified as a financial fixed asset
in the first financial statement closed after the participation was acquired;
3. A tax haven requirement: the entity is not situated in a “black list”-country for Italian
CFC-purposes;
4. An activity requirement: the entity carries out a business activity.
If one or more of the above conditions is not complied with, this will result in taxation
whereby capital gains are fully taxable at the standard corporate income tax rate: 24%
5.2.2 Capital losses on shares
Capital losses on shares that qualify for the participation exemption are not deductible;
Capital losses realised on the disposal of shares and securities that are not eligible for the
participation exemption cannot be deducted up to 95% of the dividends received on these
shares and securities in the 36-month period preceding the disposal. The limitation only
applies if (i) the shares and similar securities have been acquired (and held) by the seller
in the 36 months before the sale and (ii) the issuer meets both the subject to tax and the
active business tests.
5.2.3 Taxation of dividends
A 95% exemption applies on dividends received by resident companies and permanent
establishments of non-resident parent companies if the following condition is met:
6 https://ec.europa.eu/info/business-economy-euro/company-reporting-and-auditing/company-reporting/financial-reporting_en
7 https://www.ifrs.org/-/media/feature/around-the-world/jurisdiction-profiles/italy-ifrs-profile.pdf

European Commission - Study on the drivers of investments in equity by insurers and pension funds
ITALY – Key characteristics of the insurance market April 2019 I 18
- A CFC-requirement: the foreign subsidiary is not situated in a “black list”-country
for Italian CFC-purposes.
If the above condition is not met, the dividend is only 50% exempt.
Dividends paid to a non-resident corporation are generally subject to a 26% final
withholding tax (with a potential refund of the foreign tax paid on the dividend by the
recipient, up to 11/26ths of the Italian WHT), unless the rate is reduced under a tax treaty
or the dividends qualify for an exemption under the EU parent-subsidiary directive. A
domestic final withholding tax of 1,20% applies to dividends distributed to shareholders
resident in an EU/EEA country.
A tax credit is allowed against Italian net tax for final foreign taxes paid on foreign-source
earnings in the year in which the taxes were paid. The amount of the foreign tax credit may
not exceed the amount of Italian tax due.

European Commission - Study on the drivers of investments in equity by insurers and pension funds
ITALY – Key characteristics of the insurance market April 2019 I 19
6 Historical data The following section contains historical overviews of Solvency I, Solvency II and ECB data
in order to provide insights on possible short and long-term trends.
6.1 Index-linked and unit-linked investments in comparison to total
assets
Based upon the Solvency I and Solvency II (S.02.01) historical information, the evolution
of the index-linked and unit-linked investments in comparison to total assets of Italy is
compared to the EU. The break in Graph 4 shows the transition from the Solvency I to the
Solvency II regulatory framework. Under Solvency II assets are presented based upon their
market value.
Graph 4 - Evolution index-linked and unit-linked investments based upon Solvency I and Solvency II
Note: The data from the EIOPA Solvency I and Solvency II statistics is complemented with the data received from
the Italian NSA.
Source: EIOPA Solvency II and Solvency I statistics and Deloitte-CEPS analysis
As shown in Graph 4, the share of index-linked and unit-linked investments in comparison
to total assets depict a decreasing trend until 2013, from where they picked up and started
to increase. Note that the graph for the EU shows a relatively stable behaviour over the
observation period, with a slightly increasing trend as from 2011. Furthermore, it is clear
that in Italy, starting from mid-2008 investments in index-linked and unit-linked contracts
are lower compared to the EU.
0,0%
2,5%
5,0%
7,5%
10,0%
12,5%
15,0%
17,5%
20,0%
22,5%
25,0%
27,5%
30,0%
32,5%
35,0%
37,5%
40,0%
42,5%
45,0%
47,5%
50,0%
0
10 000
20 000
30 000
40 000
50 000
60 000
70 000
80 000
90 000
100 000
110 000
120 000
130 000
140 000
150 000
160 000
170 000
180 000
190 000
200 000
1998 1999 2000 2001 2002 2003 2004 2005 2006 2007 2008 2009 2010 2011 2012 2013 2014 2015 SII 2016 2017
Index-l
inked a
nd u
nit
-lin
ked investm
ents
(%
of to
tal assets
)
Index-l
inked a
nd u
nit
-lin
ked investm
ents
(in
mio
EU
R)
Assets held for index-linked and unit-linked contracts (in mio EUR)
Assets held for index-linked and unit-linked contracts (in % of total assets) for IT
Assets held for index-linked and unit-linked contracts (in % of total assets) for EU

European Commission - Study on the drivers of investments in equity by insurers and pension funds
ITALY – Key characteristics of the insurance market April 2019 I 20
6.2 Solvency II – excluding index-linked and unit-linked investments
Based upon the Solvency II (S.02.01) quarterly data from 2016 Q3 until 2018 Q1, the
evolution of the different asset categories is depicted in Graph 5. Furthermore, the evolution
of the SCR ratio is shown over the seven quarters.
Graph 5 - Evolution Solvency II balance sheet (S.02.01) items (Total Investments, deposits, cash
and cash equivalents) and SCR ratio
Source: EIOPA Solvency II statistics and Deloitte-CEPS analysis
The composition of the Italian insurers’ balance sheet has remained relatively stable over
the quarters since the introduction of Solvency II on 1 January 20168. This seems to be
confirmed by the fact that the most dominant assets classes such as Bonds, Collective
Investments Undertakings and Holding in related undertakings, including participations do
not suggest a clear trend whether it be downwards or upwards.
Bonds have constituted the major part of the Italian insurers’ balance sheet since the
introduction of Solvency II.
For Italy, the SCR ratio shows an increasing trend as from 2017 Q1. Overall, this trend has
not resulted into significant changes in the asset allocation of the overall Italian insurance
market.
8 Day one reporting, 2016 Q1 and Q2 are not publicly available
120%
140%
160%
180%
200%
220%
240%
260%
280%
300%
320%
340%
360%
380%
400%
420%
440%
460%
480%
500%
0%
5%
10%
15%
20%
25%
30%
35%
40%
45%
50%
55%
60%
65%
70%
75%
80%
85%
90%
95%
100%
2016 Q3 2016 Q4 2017 Q1 2017 Q2 2017 Q3 2017 Q4 2018 Q1
Other investments
Cash and cash equivalents
Deposits
Property
Loans and mortgages
Bonds
Collective Investments Undertakings
Holdings in related undertakings,including participations
Equities - unlisted
Equities - listed
Ratio of Eligible own funds to SCR

European Commission - Study on the drivers of investments in equity by insurers and pension funds
ITALY – Key characteristics of the insurance market April 2019 I 21
6.3 Solvency I – excluding index-linked and unit-linked assets
Based upon the Solvency I yearly data from 2005 until 2015, the evolution of the different
investment asset categories is depicted in Graph 6. Furthermore, the evolution of the
solvency ratio is shown over the history.
Graph 6 - Evolution Solvency I balance sheet items (Total Investments, deposits, cash and cash
equivalents)
Source: EIOPA Solvency I statistics and Deloitte-CEPS analysis
Graph 6, which relates to Solvency I figures suggests the following observations. The
dominance of Bonds that we observed under the rules of Solvency II has been a
characteristic of the Italian insurers’ balance sheet for more than a decade. Furthermore,
the solvency margin shows a slight decreasing trend since 2005.
100%
125%
150%
175%
200%
225%
250%
275%
300%
325%
350%
375%
400%
425%
450%
475%
500%
525%
550%
575%
600%
0%
5%
10%
15%
20%
25%
30%
35%
40%
45%
50%
55%
60%
65%
70%
75%
80%
85%
90%
95%
100%
2005 2006 2007 2008 2009 2010 2011 2012 2013 2014 2015
Other
Land and buildings
Deposits
Loans and mortgages
Debt securities and other fixed income
securities
Debt securities issued by and loans toaffiliated undertakings and undertakings
Investments in affiliated enterprises andparticipating interests
Shares in affiliated undertakings andparticipating interests
Shares and other variable-yield securities
and units in unit trusts
Available solvency margin /required solvency margin

European Commission - Study on the drivers of investments in equity by insurers and pension funds
ITALY – Key characteristics of the insurance market April 2019 I 22
6.4 European Central Bank – including index-linked and unit-linked assets
Graph 7 - Evolution ECB balance sheet items (asset categories)
Source: ECB Statistical Data Warehouse and Deloitte-CEPS analysis
Graph 7 relates to figures of investments by Italian Insurers since 1999 Q1 as reported by
the ECB. It can be observed that Debt securities dominate the Italian balance sheets for
the entire observation period. Moreover, a decrease in the importance of Listed Shares is
observable. Additionally, there is a steady increase in Non-Money-Market Funds starting
from 2009 Q4. The Italian NSA notes that the increase in the Non Money-Market funds
reflects companies exploiting opportunities to get better return compared with trend of
Italian government bonds and government bonds in general.
On the next page, the Equity asset classes are presented in a more detailed view.
Furthermore, the evolution of the listed shares (normalised to a start value of 100) of Italy
is plotted against the aggregated EU data.
We remark that these graphs include index-linked and unit-linked assets, which cannot be
individualised from the figures published by the ECB. Nevertheless, according to the Italian
NSA, the unit-linked and index-linked investments do not have great impact on the
observed trends in the direct equity investments since the weight of Collective Investment
Undertakings is fundamental for both with profit products, and unit-linked and index-linked
products.
0%
5%
10%
15%
20%
25%
30%
35%
40%
45%
50%
55%
60%
65%
70%
75%
80%
85%
90%
95%
100%
1998 Q
1
1999 Q
1
2000 Q
1
2001 Q
1
2002 Q
1
2003 Q
1
2004 Q
1
2005 Q
1
2006 Q
1
2007 Q
1
2008 Q
1
2009 Q
1
2010 Q
1
2011 Q
1
2012 Q
1
2013 Q
1
2014 Q
1
2015 Q
1
2016 Q
1
2017 Q
1
2018 Q
1
Other Accounts Receivable Payable
Insurance, Pension and StandardizedGuarantee Schemes
Financial Derivatives and Employee Stock
Options
Currency and Deposits
Money-Market Funds
Loans
Debt Securities
Non Money-Market Funds
Other Equity
Unlisted Shares
Listed Shares

European Commission - Study on the drivers of investments in equity by insurers and pension funds
ITALY – Key characteristics of the insurance market April 2019 I 23
Graph 8 - Evolution ECB balance sheet items (equity categories)
Source: ECB Statistical Data Warehouse and Deloitte-CEPS analysis
Graph 9 - Evolution ECB balance sheet items (Unlisted Shares and Other Equity)
Source: ECB Statistical Data Warehouse and Deloitte-CEPS analysis
0,0%
2,0%
4,0%
6,0%
8,0%
10,0%
12,0%
14,0%
16,0%
18,0%
20,0%
22,0%
24,0%
26,0%
28,0%
30,0%
32,0%
34,0%
36,0%
38,0%
40,0%1998 Q
1
1999 Q
1
2000 Q
1
2001 Q
1
2002 Q
1
2003 Q
1
2004 Q
1
2005 Q
1
2006 Q
1
2007 Q
1
2008 Q
1
2009 Q
1
2010 Q
1
2011 Q
1
2012 Q
1
2013 Q
1
2014 Q
1
2015 Q
1
2016 Q
1
2017 Q
1
2018 Q
1
Other Equity
Unlisted Shares
Listed Shares
0,0%
2,0%
4,0%
6,0%
8,0%
10,0%
12,0%
14,0%
16,0%
18,0%
20,0%
22,0%
24,0%
26,0%
28,0%
30,0%
32,0%
34,0%
36,0%
38,0%
40,0%
1998 Q
1
1999 Q
1
2000 Q
1
2001 Q
1
2002 Q
1
2003 Q
1
2004 Q
1
2005 Q
1
2006 Q
1
2007 Q
1
2008 Q
1
2009 Q
1
2010 Q
1
2011 Q
1
2012 Q
1
2013 Q
1
2014 Q
1
2015 Q
1
2016 Q
1
2017 Q
1
2018 Q
1
Other Equity
Unlisted Shares
European Commission - Study on the drivers of investments in equity by insurers and pension funds
ITALY – Key characteristics of the insurance market April 2019 I 24
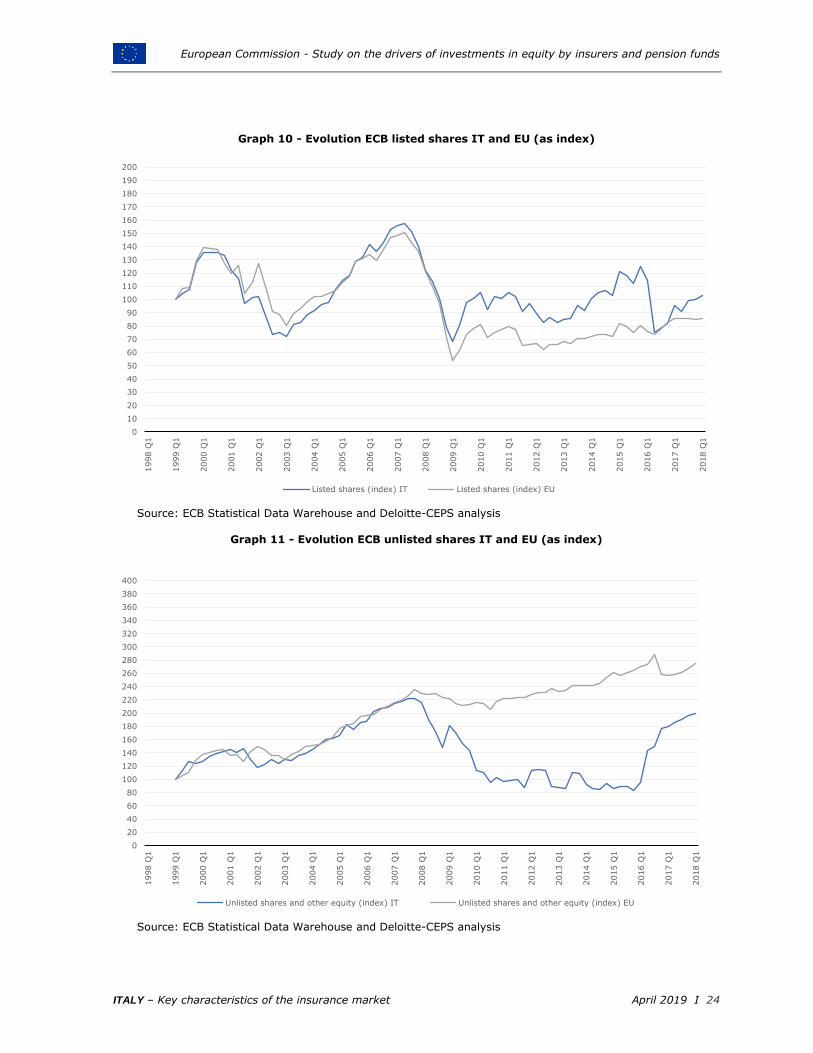
Graph 10 - Evolution ECB listed shares IT and EU (as index)
Source: ECB Statistical Data Warehouse and Deloitte-CEPS analysis
Graph 11 - Evolution ECB unlisted shares IT and EU (as index)
Source: ECB Statistical Data Warehouse and Deloitte-CEPS analysis
0
10
20
30
40
50
60
70
80
90
100
110
120
130
140
150
160
170
180
190
200
1998 Q
1
1999 Q
1
2000 Q
1
2001 Q
1
2002 Q
1
2003 Q
1
2004 Q
1
2005 Q
1
2006 Q
1
2007 Q
1
2008 Q
1
2009 Q
1
2010 Q
1
2011 Q
1
2012 Q
1
2013 Q
1
2014 Q
1
2015 Q
1
2016 Q
1
2017 Q
1
2018 Q
1
Listed shares (index) IT Listed shares (index) EU
0
20
40
60
80
100
120
140
160
180
200
220
240
260
280
300
320
340
360
380
400
1998 Q
1
1999 Q
1
2000 Q
1
2001 Q
1
2002 Q
1
2003 Q
1
2004 Q
1
2005 Q
1
2006 Q
1
2007 Q
1
2008 Q
1
2009 Q
1
2010 Q
1
2011 Q
1
2012 Q
1
2013 Q
1
2014 Q
1
2015 Q
1
2016 Q
1
2017 Q
1
2018 Q
1
Unlisted shares and other equity (index) IT Unlisted shares and other equity (index) EU

European Commission - Study on the drivers of investments in equity by insurers and pension funds
ITALY – Key characteristics of the insurance market April 2019 I 25
6.5 Trends in Equity Investments
This section provides a trend analysis of the equity investments of the Italian insurers using
the balance sheet data of the insurance sector from the ECB Statistical Data Warehouse.
Given the availability of the equity split in the ECB database, the analysis focuses on
investments in listed shares and investments in unlisted shares and other equity.
6.5.1 Listed Shares
In the analysis below, the listed shares of insurance corporations are plotted against the
total assets in the industry both in amounts and in indexed values. The aim of this
comparative analysis is to understand the evolution of listed shares in the overall insurance
market. Similarity of the growth patterns in the listed shares and total assets can be
considered as an indication of the extent that the equity investments are driven by a good
(or bad) economic environment in the industry at a certain point in time. A presentation of
the variables only in amounts might dilute the magnitude of the growths for countries with
large assets because in such a representation, the listed shares will be overstated.
Therefore, we also plot each series as indexed to the initial point in their available history.
In the next step, we focus on the relationship with the listed shares and stock market
indices. The ECB QSA balance sheet items are valued at market prices at the end of each
quarter. Therefore, it is plausible to assume that the changes in the stock prices are
reflected on the amounts held in listed shares. In order to remove this “price effect” from
the observed amounts of listed shares and approximate the “real” amounts held in shares,
we consider adjusting the observed amounts in listed shares. Even though we observe high
correlations with listed shares and several stock indices, since the exact destinations of the
portfolio invested in listed shares at each period is not observable, we build a
“Weighted Equity Index” similar to the EIOPA Equity Dampener.
Amounts invested in listed shares and the total amount of assets of the insurance sector
are plotted in Graph 12 while the indexed values of the series are presented in Graph 13.
On these graphs, we observe that there are downward trends in the amounts invested in
listed shares starting from 2001 until 2004 and during the Global Financial Crisis; however,
the investments bounce back to the initial levels and deviate around the initial level until
the end of the observation period. On the other hand, we observe that the overall growth
in the listed shares is around one fourth of the growth in the total assets.

European Commission - Study on the drivers of investments in equity by insurers and pension funds
ITALY – Key characteristics of the insurance market April 2019 I 26
Graph 12 – Evolution of Listed Shares and Total Assets, in Mio EUR
Source: ECB Statistical Data Warehouse and Deloitte-CEPS analysis
Graph 13 – Evolution of Listed Shares and Total Assets, Indexed Values
Source: ECB Statistical Data Warehouse and Deloitte-CEPS analysis
Graph 14 presents the indexed values of the amounts invested in listed shares against its
Weighted Equity Index adjusted counterpart. In this graph, we observe that there is a long-
term downward trend in the listed shares investments of Italian insurers over the
observation period (i.e. 1999 Q1 – 2018 Q1), although not at a similar level of the
downward trend as the German insurers. In the case of Italy, the indexed value of adjusted
amounts is 65,8% at the end of the observation period. Before and during the Global
Financial Crisis, we observe that the adjusted listed shares have smaller deviations than
0
100 000
200 000
300 000
400 000
500 000
600 000
700 000
800 000
900 000
1 000 000
0
10 000
20 000
30 000
40 000
50 000
60 000
1998 Q
1
1999 Q
1
2000 Q
1
2001 Q
1
2002 Q
1
2003 Q
1
2004 Q
1
2005 Q
1
2006 Q
1
2007 Q
1
2008 Q
1
2009 Q
1
2010 Q
1
2011 Q
1
2012 Q
1
2013 Q
1
2014 Q
1
2015 Q
1
2016 Q
1
2017 Q
1
2018 Q
1
Tota
l Assets
, M
io E
UR
Lis
ted S
hare
s,
Mio
EU
R
Listed Shares Total Assets
0
50
100
150
200
250
300
350
400
450
1998 Q
1
1999 Q
1
2000 Q
1
2001 Q
1
2002 Q
1
2003 Q
1
2004 Q
1
2005 Q
1
2006 Q
1
2007 Q
1
2008 Q
1
2009 Q
1
2010 Q
1
2011 Q
1
2012 Q
1
2013 Q
1
2014 Q
1
2015 Q
1
2016 Q
1
2017 Q
1
2018 Q
1
Listed Shares - Indexed Total Assets - Indexed

European Commission - Study on the drivers of investments in equity by insurers and pension funds
ITALY – Key characteristics of the insurance market April 2019 I 27
the unadjusted series which implies that the valuations in the stock markets have a high
impact on the unadjusted amount during these periods. After 2011, there are three quarters
in which the adjusted amounts decrease more than 10%. In 2012 Q1, the adjusted
amounts decrease by 16,1%, they decrease by 10,9% in 2013 Q4, and finally, the amounts
decrease by 32,7% in 2016 Q2. The decrease in 2016 Q2 is preceded by a decrease of
3,1% and is followed by drops of 1,1% and 2,4% in 2016 Q3 and Q4 respectively. The
lowest value of the indexed adjusted amounts is 56% in 2016 Q4, then the indexed
amounts recover to 65,8% in 2018 Q1.
Graph 14 – Evolution of Listed Shares – Indexed (Weighted Equity Index Adjusted)
Source: ECB Statistical Data Warehouse and Deloitte-CEPS analysis
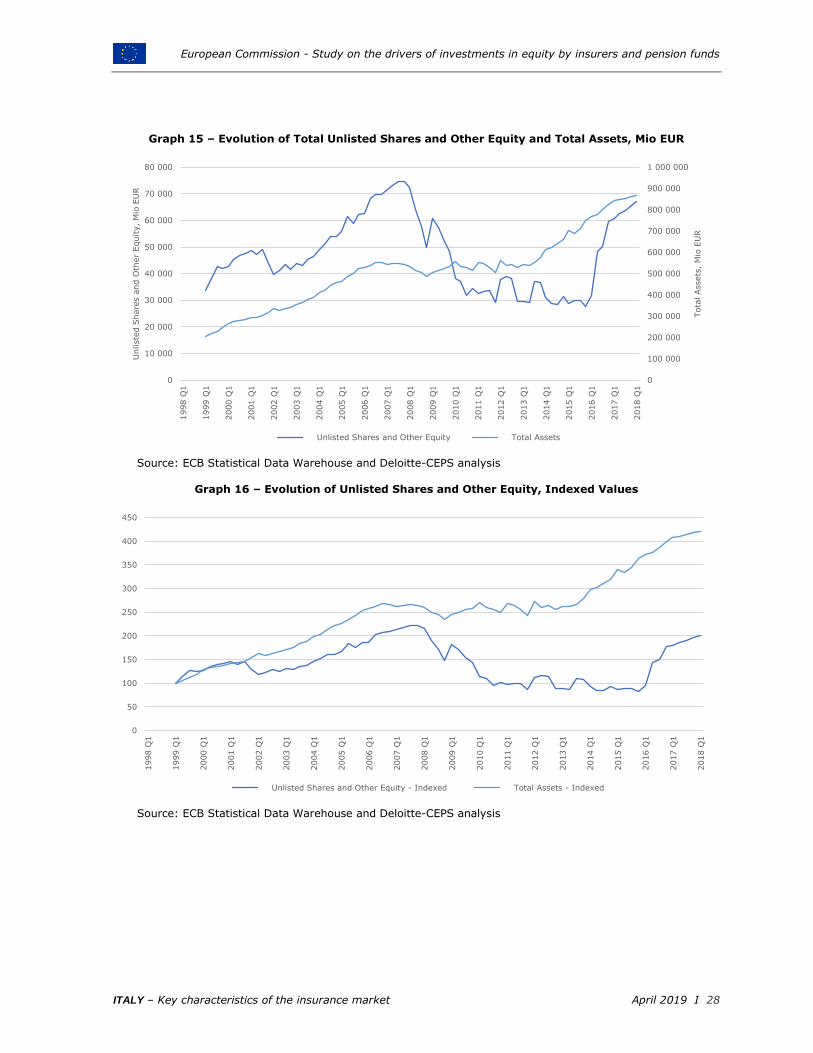
6.5.2 Unlisted Shares
Graph 15 depicts the amounts invested in unlisted shares and other equity plotted against
the total assets in the insurance markets of while Graph 16 presents the indexed values of
the series for an easier comparison of the movements in these two series.
Both of the series increase steadily over the initial period 1998 – 2008, with the total assets
increasing at a faster rate. The unlisted shares then decrease steadily over the period 2008
– 2011, stay relatively constant over the period 2011 – 2016 and slowly increase over the
period 2016 – 2018 albeit with a sharp start. In contrast, the total assets stay relatively
stable over the period 2008 – 2013 and then start to rise steadily over the period 2013 –
2018. As such, by the end of the period the indexed value of the total assets is significantly
higher than the unlisted shares (420 vs 200).
0
20
40
60
80
100
120
140
160
180
1998 Q
1
1999 Q
1
2000 Q
1
2001 Q
1
2002 Q
1
2003 Q
1
2004 Q
1
2005 Q
1
2006 Q
1
2007 Q
1
2008 Q
1
2009 Q
1
2010 Q
1
2011 Q
1
2012 Q
1
2013 Q
1
2014 Q
1
2015 Q
1
2016 Q
1
2017 Q
1
2018 Q
1
Listed Shares - Indexed Listed Shares (Weighted Equity Index Adjusted) - Indexed
European Commission - Study on the drivers of investments in equity by insurers and pension funds
ITALY – Key characteristics of the insurance market April 2019 I 28
Graph 15 – Evolution of Total Unlisted Shares and Other Equity and Total Assets, Mio EUR
Source: ECB Statistical Data Warehouse and Deloitte-CEPS analysis
Graph 16 – Evolution of Unlisted Shares and Other Equity, Indexed Values
Source: ECB Statistical Data Warehouse and Deloitte-CEPS analysis
0
100 000
200 000
300 000
400 000
500 000
600 000
700 000
800 000
900 000
1 000 000
0
10 000
20 000
30 000
40 000
50 000
60 000
70 000
80 000
1998 Q
1
1999 Q
1
2000 Q
1
2001 Q
1
2002 Q
1
2003 Q
1
2004 Q
1
2005 Q
1
2006 Q
1
2007 Q
1
2008 Q
1
2009 Q
1
2010 Q
1
2011 Q
1
2012 Q
1
2013 Q
1
2014 Q
1
2015 Q
1
2016 Q
1
2017 Q
1
2018 Q
1
Tota
l Assets
, M
io E
UR
Unliste
d S
hare
s a
nd O
ther
Equity, M
io E
UR
Unlisted Shares and Other Equity Total Assets
0
50
100
150
200
250
300
350
400
450
1998 Q
1
1999 Q
1
2000 Q
1
2001 Q
1
2002 Q
1
2003 Q
1
2004 Q
1
2005 Q
1
2006 Q
1
2007 Q
1
2008 Q
1
2009 Q
1
2010 Q
1
2011 Q
1
2012 Q
1
2013 Q
1
2014 Q
1
2015 Q
1
2016 Q
1
2017 Q
1
2018 Q
1
Unlisted Shares and Other Equity - Indexed Total Assets - Indexed