key messages of chapter 4 4 - fao
TRANSCRIPT
Key messages of chapter 44 � Enteric fermentation and feed production are
the main emission sources for ruminants.
� Beef produced by dairy cattle has generally
lower emission intensity than beef produced by
specialised beef cattle. This is explained by the
fact that emissions from reproductive animals
are allocated to milk and meat in the case of
the dairy herd, and to meat only in the case of
the beef herd.
� Beef and milk production have higher emission
intensities in systems characterized by low pro-
ductivity. This is due to low feed digestibility,
less efficient herd management practices and
low reproduction performance. This relation-
ship between emission intensity and productiv-
ity is not clearly observed for monogastric spe-
cies, as highly productive systems rely on high
emission intensity feed.
� In Latin America and the Caribbean, one-third
of the emissions from beef production are re-
lated to pasture expansion into forested areas.
� In pork and poultry supply chains, emissions
mainly derive from feed production explained
by the use of high emission intensity feed. For
pork and chicken egg production, manure stor-
age and processing are also an important source
of emissions.
� Emissions related to energy consumption ac-
count for as much as 40 percent of emissions in
pork and poultry supply chains.
� In pork production, lowest emission intensities
are in backyard systems which rely on feed with
low emissions, and among industrial systems
which are most efficient at converting feed into
animal products.
� Chicken meat and eggs have low emission inten-
sities compared with other livestock products.
� For livestock production systems, N2O, CH4 and
CO2 emissions are losses of N, energy and or-
ganic matter that undermine the efficiency and
productivity of production units.
23
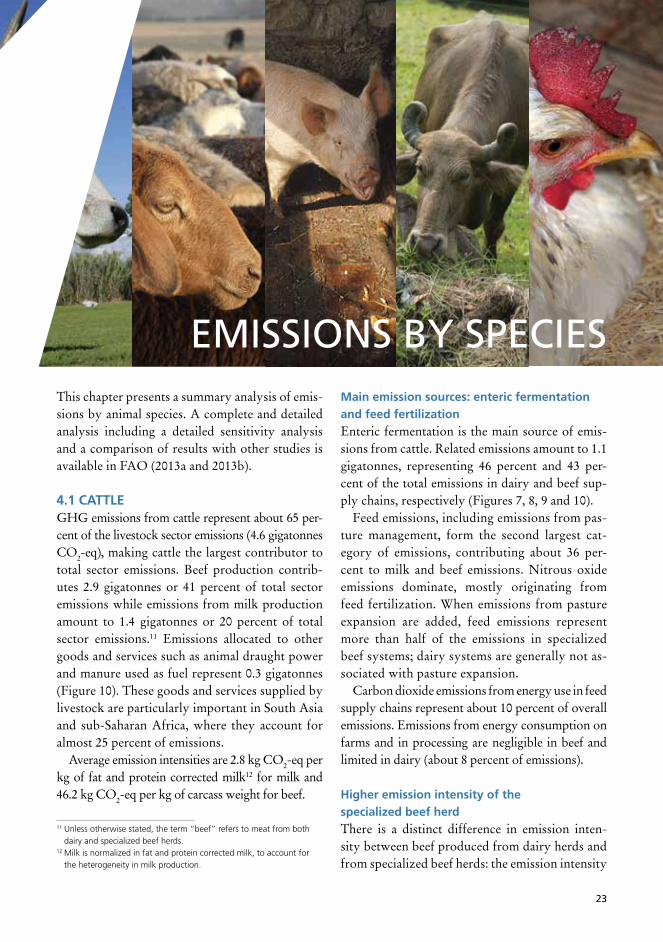
EMISSIONS BY SPECIESmain emission sources: enteric fermentation and feed fertilizationEnteric fermentation is the main source of emis-sions from cattle. Related emissions amount to 1.1 gigatonnes, representing 46 percent and 43 per-cent of the total emissions in dairy and beef sup-ply chains, respectively (Figures 7, 8, 9 and 10).
Feed emissions, including emissions from pas-ture management, form the second largest cat-egory of emissions, contributing about 36 per-cent to milk and beef emissions. Nitrous oxide emissions dominate, mostly originating from feed fertilization. When emissions from pasture expansion are added, feed emissions represent more than half of the emissions in specialized beef systems; dairy systems are generally not as-sociated with pasture expansion.
Carbon dioxide emissions from energy use in feed supply chains represent about 10 percent of overall emissions. Emissions from energy consumption on farms and in processing are negligible in beef and limited in dairy (about 8 percent of emissions).
higher emission intensity of the specialized beef herdThere is a distinct difference in emission inten-sity between beef produced from dairy herds and from specialized beef herds: the emission intensity 4This chapter presents a summary analysis of emis-
sions by animal species. A complete and detailed analysis including a detailed sensitivity analysis and a comparison of results with other studies is available in FAO (2013a and 2013b).
4.1 cattle GHG emissions from cattle represent about 65 per-cent of the livestock sector emissions (4.6 gigatonnes CO2-eq), making cattle the largest contributor to total sector emissions. Beef production contrib-utes 2.9 gigatonnes or 41 percent of total sector emissions while emissions from milk production amount to 1.4 gigatonnes or 20 percent of total sector emissions.11 Emissions allocated to other goods and services such as animal draught power and manure used as fuel represent 0.3 gigatonnes (Figure 10). These goods and services supplied by livestock are particularly important in South Asia and sub-Saharan Africa, where they account for almost 25 percent of emissions.
Average emission intensities are 2.8 kg CO2-eq per kg of fat and protein corrected milk12 for milk and 46.2 kg CO2-eq per kg of carcass weight for beef.
11 Unless otherwise stated, the term “beef” refers to meat from both dairy and specialized beef herds.
12 Milk is normalized in fat and protein corrected milk, to account for the heterogeneity in milk production.

Tackling climate change through livestock – A global assessment of emissions and mitigation opportunities
24
FIgurE 7. Global emissions from cattle milk and beef supply chains, by category of emissions
Source: GLEAM.
46.5%
LUC: pasture expansion, CO2
Enteric, CH4
Manure management, N2O
Manure management, CH4
Pos�arm, CO2
Direct & indirect energy, CO2
3.8%
2.2%
0.7%
17.0%
6.1%
5.4%
10.9%
Feed, CO2
Fer�lizer & crop residues, N2O
Applied & deposited manure, N2O
7.4%
14.8%
10%
18.1%
7.4 %
0.7%
3.6%0.5%
0.9%
1.4%
42.6%
LUC: soybean, CO2
Milk Meat
TABLE 5. Global production, emissions and emission intensity for cattle milk and beef
herd system production(Million tonnes)
emissions(Million tonnes CO2-eq )
emission intensity(kg CO2-eq/kg product)
milk1 meat2 milk meat milk1 meat2
Dairy
grazing 77.6 4.8 227.2 104.3 2.93 21.93
Mixed 430.9 22.0 1 104.3 381.9 2.63 17.43
total dairy 508.6 26.8 1 331.1 486.2 2.63 18.23
Specialized beef
grazing 8.6 875.4 102.23
Mixed 26.0 1 462.8 56.23
total beef 34.6 2 338.4 67.6 3
Post-harvest emissions4 87.6 12.4
totals 508.6 61.4 1 419.1 2 836.8 2.85 46.25
1 Product: FPCM.2 Product: carcass weight (CW).3 Does not include post-harvest emissions.4 Computed at commodity and country level.5 Includes post-harvest emissions.

4. Emissions by species
25
of beef from specialized beef herds is almost four-fold that produced from dairy herds (68 vs. 18 kg CO2-eq per kg of carcass weight) (Table 5).
This difference is primarily due to the fact that dairy herds produce both milk and meat while, on the other hand, specialized beef herds mostly pro-duce beef. As a consequence, emissions from dairy herds are attributed to milk and meat while emissions from beef herds are allocated to meat (in both cases, a limited fraction is allocated to other goods and servic-es, such as draught power, and manure used as fuel).
A closer look at emission structure shows that emissions from reproductive animals (the “breed-ing overhead”) exclusively explain the difference: when only fattening animals are considered, spe-cialized beef and surplus dairy calves have similar
emission intensity per kg of carcass weight. In ad-dition, the breeding cohorts represent 69 percent of the herd in specialized beef herds, compared with 52 percent in dairy systems.
Because of differences in feed quality and herd management, grazing systems generally have higher emission intensities than mixed systems.13 Average emission intensities are particularly high for specialized beef raised in grazing systems in Latin America and the Caribbean, due to the land-use change emissions related to pasture expansion. The difference in emission intensities between grazing and mixed systems is less pronounced for beef from dairy herds and negligible for milk.
13 Mixed and grazing systems are defined on the basis of animal diet and mix of products in farm output (Chapter 2).
FIgurE 8. Regional variation in beef production and GHG emission intensities
Source: GLEAM.
0
10
20
30
40
50
60
70
0
10
20
30
40
50
60
70
80
LAC
E &
SE
Asia
E. E
urop
e
N. A
mer
ica
Oce
ania
Russ
ian
Fed.
Sout
h As
ia
SSA
NENA
W. E
urop
e
Mill
ion
tonn
es C
W
kg C
O2-e
q.kg
CW
-1
Wor
ld
Beef produc�on
Pos�arm, CO2
LUC: pasture expansion, CO2
Enteric, CH4
Manure management, N2O
Manure management, CH4
Direct & indirect energy, CO2
LUC: soybean, CO2
Feed, CO2
Fer�lizer & crop residues, N2O
Applied & deposited manure, N2O

Tackling climate change through livestock – A global assessment of emissions and mitigation opportunities
26
FIgurE 9. Regional variation in cattle milk production and GHG emission intensities
Source: GLEAM.
Enteric, CH4
Manure management, N2O
Manure management, CH4
0
100
200
300
400
500
600
0
1
2
3
4
5
6
7
8
9
10
Mill
ion
tonn
es F
PCM
kg C
O2-e
q.kg
FPC
M-1
LAC
E &
SE
Asia
E. E
urop
e
N. A
mer
ica
Oce
ania
Russ
ian
Fed.
Sout
h As
ia
SSA
NENA
W. E
urop
e
Wor
ldDirect & indirect energy, CO2
LUC: soybean, CO2
Feed, CO2
Fer�lizer & crop residues, N2O Pos�arm, CO2
Milk produc�on
Applied & deposited manure, N2O
higher emission intensities in low productivity systemsBeef productionEmission intensities for beef are highest in South Asia, sub-Saharan Africa, Latin America and the Caribbean, and East and Southeast Asia (Figure 8). Higher emissions are largely caused by low feed digestibility (leading to higher enteric and manure emissions), poorer animal husbandry and lower slaughter weights (slow growth rates leading to more emissions per kg of meat pro-duced) and higher age at slaughter (longer life leading to more emissions).
In Latin America and the Caribbean, one-third of the emissions (24 kg CO2-eq/kg carcass weight) from beef production is estimated to come from
pasture expansion into forested areas. This estimate is to be taken with caution, given the numerous methodological and data uncertainties affecting land-use change emissions estimates (Chapter 2) (FAO, 2013a and 2013b).
In Europe, about 80 percent of the beef is pro-duced from dairy animals (surplus calves and culled cows), resulting in lower emission intensi-ties, as explained above.
milk production Generally, the emission intensity of milk pro-duction is lowest in industrialized regions of the world (below 1.7 kg CO2-eq/kg milk, compared with regional averages going as high as 9 kg CO2-eq/kg milk). Better animal feeding and nutrition

4. Emissions by species
27
reduce CH4 and manure emissions (lower release of N and volatile solids). Higher milk yields imply a shift of the cow’s metabolism in favour of milk and reproduction as opposed to body mainte-nance, contributing to lower emission intensities.
In low productivity regions, enteric fermenta-tion is the main emission source. In industrialized regions, feed production and processing, and ma-nure together are as important a source of emis-sions as enteric fermentation.
Manure management emissions are relatively high in North America where, on average, 27 per-cent of manure from the dairy sector is managed in liquid systems that produce greater quantities of CH4 emissions.
4.2 BuffaloTotal GHG emissions from buffalo production (meat, milk and other products and services) rep-resent 9 percent of the sector’s emissions. They amount to 618 million tonnes CO2-eq, of which 390 million tonnes come from milk production, 180 million tonnes from meat production and 48 million tonnes CO2-eq from other goods and services, such as manure used as fuel and draught power (Table 6).
main emission sources: enteric fermentation and feed fertilizationOver 60 percent of emissions from buffalo meat and milk production come from enteric fermenta-
tion, compared with 45 percent for cattle. The dif-ference is due to the generally lower digestibility of feed rations (Figure 11).
The fertilization of feed crops is the second largest emission source, representing 17 percent for milk production and 21 percent for meat pro-duction.
Emissions originating from land-use change are close to nil, given the absence of buffalo in areas where pasture is expanding as well as the limited presence of soybean products in the ration.
geographically-concentrated productionBuffalo production is geographically concentrat-ed in South Asia, Near East and North Africa and East and Southeast Asia, with South Asia alone producing as much as 90 percent and 70 percent of the global buffalo milk and meat, respectively. East and Southeast Asia produce 20 percent of buffalo meat; the other regions making limited contributions to meat and milk outputs (Figure 12 and 13).
milk productionAbout 80 percent of buffalo milk is produced in mixed systems located in semi-arid climates. Av-erage milk emission intensity ranges from 3.2 in South Asia to 4.8 kg CO2-eq/kg FPCM in East and Southeast Asia. Milk produced in South Asia has the lowest emission intensity, explained by higher yields.
TABLE 6. Global production, emissions and emission intensity for buffalo milk and meat
system production(Million tonnes)
emissions(Million tonnes CO2-eq )
emission intensity(kg CO2-eq/kg product)
milk1 meat2 milk meat milk1 meat2
grazing 2.7 0.1 9.0 4.7 3.43 36.83
Mixed 112.6 3.2 357.9 175.2 3.23 54.83
Post-harvest emissions4 23.0 0.3
totals 115.2 3.4 389.9 180.2 3.45 53.45
1 Product: FPCM.2 Product: CW.3 Does not include postfarm emissions.4 Computed at commodity and country level.5 Includes postfarm emissions.

Tackling climate change through livestock – A global assessment of emissions and mitigation opportunities
28
DRAFT AND MANURE USED AS FUEL0.3 Gigatonnes
MILK1.4 Gigatonnes
BEEF FROMDAIRY HERD
0.5 Gigatonnes
BEEF FROMSPECIALIZED
HERD2.4 Gigatonnes
NON�FEEDPRODUCTS
SLAUGHTER BY�PRODUCTS
MANURE AVAILABLE FOR APPLICATION ON NON�FEED CROPS
4.6 Gigatonnes
POSTFARM TRANSPORT AND PROCESSING0.1 Gigatonnes
LIVESTOCK PRODUCTION2.5 Gigatonnes
FEED PRODUCTION2.0 Gigatonnes
PRO
DU
CTIO
N A
CTIV
ITIE
SPR
OD
UCT
S
A B
FIgurE 10. Global flows of emissions in cattle supply chains
Different types of feed crops are identified: second grade crops (food crops that do not match quality standards for human consumption and that are fed to livestock), feed crops with no co-products (crops cultivated as feed, e.g. maize, barley), crop residues (residues from food of feed crops, e.g. maize, stover, straw), and by-products from food crops (by-products from food production and processing, e.g. soybean cakes, bran). The arrow “non-feed products” reminds us that the emissions from the production of feed are shared with other sectors. For example, householdfood wastes used to feed pigs in backyard systems are estimated to have
an emission intensity of zero because emissions are entirely attributed to household food. In the same way, emissions related to crop residues (e.g. maize stover) are low because most of the emissions are attributed to the main product (maize grain).No emissions could be allocated to slaughterhouse by-products (e.g. offal, skins, blood). Case studies show that by-products can add about 5 to 10 percent to the total revenue at slaughterhouse gate; for example, for beef and pork in OECD countries (FAO, 2013a and 2013b).
gHg EMISSIONS FrOM gLOBAL LIVESTOCK SuPPLY CHAINS, BY PrODuCTION ACTIVITIES AND PrODuCTS

4. Emissions by species
29
GRASS AND LEAVES1.4 Gigatonnes
FEED CROPS WITHNO CO-PRODUCTS
0.2 Gigatonnes
CROP RESIDUES0.3 Gigatonnes
BY-PRODUCTS FROM FOOD CROPS0.1 Gigatonnes
LUC0.4 Gigatonnes
LUC0.03 Gigatonnes
Other1.0 Gigatonnes
Other0.1 Gigatonnes
A feed production
MANURE STORAGEAND PROCESSING
0.3 Gigatonnes
ENERGY CONSUMPTION*
0.1 Gigatonnes
ENTERIC FERMENTATION2.1 Gigatonnes
B livestock production
*Embedded energy related to the manufacture of on-farm buildings and equipment is included in this category.
Source: GLEAM.

Tackling climate change through livestock – A global assessment of emissions and mitigation opportunities
30
FIgurE 11. Global emissions from buffalo milk and meat supply chains, by category of emissions
7.0%
13.8%
0.2%
62.6%
1.2%
9.2%
5.7% 0.3%
59.5%
10.3%
7.3%
10.1%0.9%
5.9%
4.9%1.1%
Enteric, CH4
Manure management, N2O
Manure management, CH4 Pos�arm, CO2
Direct & indirect energy, CO2
Feed, CO2
Fer�lizer & crop residues, N2O
Applied & deposited manure, N2O
Source: GLEAM.
FIgurE 12. Regional variation in buffalo milk production and GHG emission intensities*
0
20
40
60
80
100
120
140
0
1
2
3
4
5
6
kg C
O2-e
q.kg
FPC
M-1
Mill
ion
tonn
es F
PCM
E &
SE
Asia
NENA
Sout
h As
ia
Wor
ld
Enteric, CH4
Manure management, N2O
Manure management, CH4
Direct & indirect energy, CO2
LUC: soybean, CO2
Feed, CO2
Fer�lizer & crop residues, N2O Pos�arm, CO2
Milk produc�on
Applied & deposited manure, N2O
* Regions accounting for less than 2 percent of world production are omitted.
Source: GLEAM.
Milk Meat

4. Emissions by species
31
meat productionSeventy percent of all buffalo meat originates from both grazing and mixed systems in the arid zones, which also have the lowest emission intensities.
Emission intensity of buffalo meat production at regional level ranges from 21 kg CO2-eq/kg CW in NENA to 70.2 kg CO2-eq/kg CW in East and Southeast Asia. Emission intensity of buf-falo meat production is particularly high in East and Southeast Asia because productivity of the animals is low due to poor feed resources and low reproductive efficiency.
4.3 small ruminants (sheep and goats)Representing about 6.5 percent of the sector’s global emissions, emissions from small ruminants amount to 475 million tonnes CO2-eq , of which
299 million tonnes are allocated to meat produc-tion, 130 million tonnes to milk production and 46 million tonnes CO2-eq to other goods and ser-vices.
Goat milk has a lower milk emission intensity compared with sheep (Table 7), due to higher yields.14 Average emission intensity for small ru-minant meat is 23.8 kg CO2-eq/kg CW, with no large differences between sheep and goat meat.
main emission sources: enteric fermentation and feed fertilizationSimilar to buffalo, over 55 percent of emissions from small ruminant meat and milk produc-tion come from enteric fermentation (Figure 14). Slightly more than 35 percent of emissions are from feed production. Compared with buffalo
14 Fat and protein corrected milk.
FIgurE 13. Regional variation in buffalo meat production and GHG emission intensities*
LAC
E &
SE
Asia
Sout
h As
ia
NENA
Wor
ld
0
0.5
1.0
1.5
2.0
2.5
3.0
3.5
4.0
0
10
20
30
40
50
60
70
80
Mill
ion
tonn
es C
W
kg C
O2-e
q.kg
CW
-1
Enteric, CH4
Manure management, N2O
Manure management, CH4
Direct & indirect energy, CO2
LUC: soybean, CO2
Feed, CO2
Fer�lizer & crop residues, N2O Pos�arm, CO2
Meat produc�on
Applied & deposited manure, N2O
* Regions accounting for less than 2 percent of world production are omitted.
Source: GLEAM.

Tackling climate change through livestock – A global assessment of emissions and mitigation opportunities
32
Source: GLEAM.
FIgurE 14. Global emissions from small ruminant milk and meat supply chains, by category of emissions
17.6%
8.8%
54.9%
2.0%
11.1%
1.8%
2.0%
1.7%0.3%
15.6%
7.3%
57.2%
1.9%
12.3%
1.6%3.8%
Enteric, CH4
Manure management, N2O
Manure management, CH4 Pos�arm, CO2
Direct & indirect energy, CO2
Feed, CO2
Fer�lizer & crop residues, N2O
Applied & deposited manure, N2O
TABLE 7. Global production, emissions and emission intensity for small ruminants
species system production(Million tonnes)
emissions(Million tonnes CO2-eq )
emission intensity(kg CO2-eq/kg product)
milk1 meat2 milk meat milk1 meat2
Sheep grazing 3.1 2.8 29.9 67.3 9.83 23.83
Mixed 5.0 4.9 37.1 115.0 7.53 23.23
total sheep 8.0 7.8 67.1 182.4 8.43 23.43
Post-harvest emissions4 0.3 4.1
goats grazing 2.9 1.1 17.7 27.2 6.13 24.23
Mixed 9.0 3.7 44.3 84.5 4.93 23.13
total goats 11.9 4.8 62.0 111.7 5.23 23.3 3
Post-harvest emissions4 0.4 1.0
totals 20.0 12.6 129.8 299.2 6.55 23.85
1 Product: FPCM.2 Product: CW. 3 Does not include post-harvest emissions.4 Computed at commodity and country level.5 Includes post-harvest emissions.
Milk Meat
4. Emissions by species
33
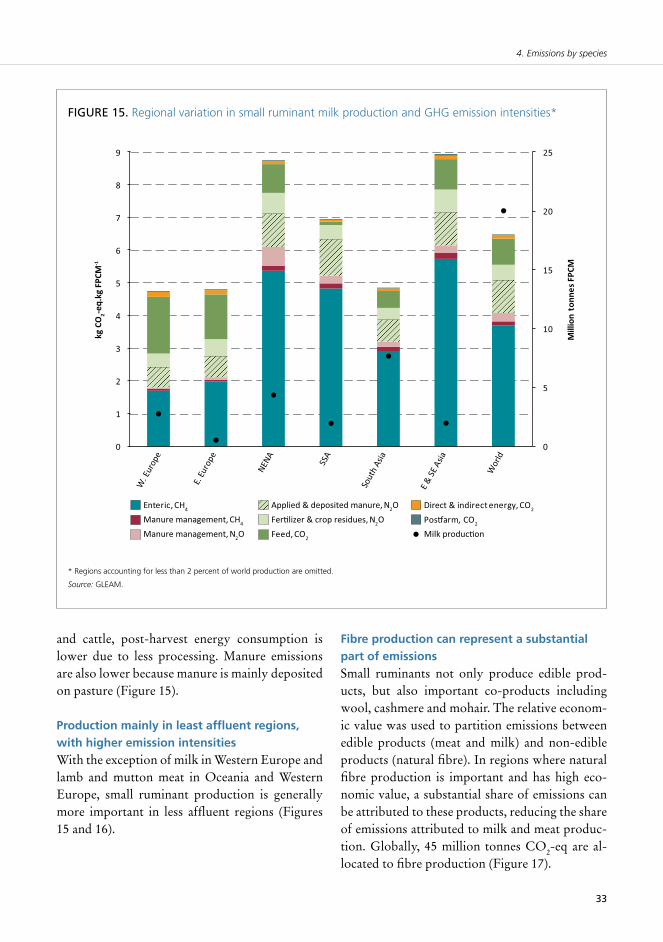
FIgurE 15. Regional variation in small ruminant milk production and GHG emission intensities*
0
5
10
15
20
25
0
1
2
3
4
5
6
7
8
9
kg C
O2-e
q.kg
FPC
M-1
Mill
ion
tonn
es F
PCM
E &
SE
Asia
E. E
urop
e
Sout
h As
ia
SSA
NENA
W. E
urop
e
Wor
ldEnteric, CH4
Manure management, N2O
Manure management, CH4
Direct & indirect energy, CO2
Feed, CO2
Fer�lizer & crop residues, N2O Pos�arm, CO2
Milk produc�on
Applied & deposited manure, N2O
* Regions accounting for less than 2 percent of world production are omitted.
Source: GLEAM.
and cattle, post-harvest energy consumption is lower due to less processing. Manure emissions are also lower because manure is mainly deposited on pasture (Figure 15).
production mainly in least affluent regions, with higher emission intensitiesWith the exception of milk in Western Europe and lamb and mutton meat in Oceania and Western Europe, small ruminant production is generally more important in less affluent regions (Figures 15 and 16).
fibre production can represent a substantial part of emissionsSmall ruminants not only produce edible prod-ucts, but also important co-products including wool, cashmere and mohair. The relative econom-ic value was used to partition emissions between edible products (meat and milk) and non-edible products (natural fibre). In regions where natural fibre production is important and has high eco-nomic value, a substantial share of emissions can be attributed to these products, reducing the share of emissions attributed to milk and meat produc-tion. Globally, 45 million tonnes CO2-eq are al-located to fibre production (Figure 17).

Tackling climate change through livestock – A global assessment of emissions and mitigation opportunities
34
FIgurE 16. Regional variation in small ruminant meat production and GHG emission intensities*
0
2
4
6
8
10
12
14
0
5
10
15
20
25
30
35
kg C
O2-e
q.kg
CW
-1
Mill
ion
tonn
es C
W
LAC
Oce
ania
E &
SE
Asia
Sout
h As
ia
SSA
NENA
W. E
urop
e
Wor
ld
Enteric, CH4
Manure management, N2O
Manure management, CH4
Direct & indirect energy, CO2
Feed, CO2
Fer�lizer & crop residues, N2O Pos�arm, CO2
Meat produc�on
Applied & deposited manure, N2O
* Regions accounting for less than 2 percent of world production are omitted.
Source: GLEAM.
FIgurE 17. Emissions per kg meat and milk protein from small ruminants, with and without allocation of emissions to non-edible outputs
Source: GLEAM.
kg C
O2e.
kg p
rote
in-1
N. A
mer
ica
Russ
ian
Fed.
NENA
Oce
ania
Sout
h As
ia
E &
SE
Asia
SSA
LAC
W. E
urop
e
E.Eu
rope
Meat: all emissions allocated to edible products
Meat: emissions allocated to both edible and non-edible outputs
Milk: all emissions allocated to edible products
Milk: emissions allocated to both edible and non-edible outputs
0
50
100
150
200
250
300
350

4. Emissions by species
35
4.4 pigGlobally, pork production is estimated to emit about 668 million tonnes CO2-eq, representing 9 percent of the livestock sector emissions.
main emission sources: feed production and manureFeed production contributes to 48 percent of emissions. An additional 12.7 percent relate to land-use change caused by soybean expansion for feed production (Figure 18). About 27 percent of emissions are related to the production of fertiliz-ers, the use of machinery and transport for feed production. About 17 percent of emissions are caused by fertilization (emitting N2O) with both synthetic fertilizers and manure.
Manure storage and processing are the second largest source of emissions, representing 27.4 per-cent of emissions. Most manure emissions are in the form of CH4 (19.2 percent, predominantly from anaerobic storage systems in warm climates); the rest is in the form of N2O (8.2 percent).
Postfarm emissions from processing and trans-port contribute moderately to total GHG output (5.7 percent).
On-farm energy consumption represents only 3.5 percent of emissions; however, when other en-ergy uses in postfarm activities and feed produc-tion are added, emissions from overall energy use amount to about one-third.
lowest emission intensity in backyard systemsOn a global scale, the difference in emission in-tensities between the various production systems
is not substantial. Intermediate15 systems have the highest average emission intensities, followed by industrial and backyard. Industrial systems do, however, account for the majority of both total production and emissions (Table 8).
Backyard systems have relatively high manure emissions, caused by larger amounts of volatile
15 Farming systems defined on the basis of the animal ration and level of market integration – see Chapter 2.
FIgurE 18. Global emissions from pig supply chains, by category of emissions
Pos�arm, CO2
Direct energy, CO2
Indirect energy, CO2
Manure management, N2O
Manure management, CH4
9.1%
7.9%
3.5%
27.1%
12.7%
3.1%
19.2%
8.2%
0.6%2.9%
5.7%
Enteric, CH4
LUC: soybean, CO2
Feed, CO2
Feed: rice, CH4
Fer�lizer & crop residues, N2O
Applied & deposited manure, N2O
Source: GLEAM.
TABLE 8. Global production, emissions and emission intensity for pigs
system production(Million tonnes CW)
emissions(Million tonnes CO2-eq)
emission intensity (kg CO2-eq/kg CW)
Backyard 22.9 127.5 5.6
Intermediate 20.5 133.9 6.5
Industrial 66.8 406.6 6.1
totals 110.2 667.9 6.1

Tackling climate change through livestock – A global assessment of emissions and mitigation opportunities
36
solids (VS) and N excretion per kg of meat pro-duced. This is caused by poor conversion16 of low quality feed. Higher manure emissions in back-yard systems are, however, offset by relatively low feed emissions, as the provision of low quality feed has low emissions.
Emission intensity in intermediate systems is generally higher than that in industrial systems. This is explained by a poorer feed conversion and a higher share of rice products in animal rations. A large share of intermediate production is located in rice-growing areas and uses rice by-products as feed material (East and Southeast Asia); the pro-duction of paddy rice emits CH4 and has higher emission intensities than the production of other
16 The feed conversion ratio is kg of feed used per kg of meat produced. Feed conversion ratio is an indicator of feed-use efficiency and is mostly determined by feed quality, animal genetics, animal health and animal husbandry practices.
cereal products. Higher emission intensities are also linked to the storage of manure in anaerobic storage systems, leading to higher CH4 emissions.
feed emission intensity: driver of regional differencesMainly due to cultural preferences, the global pig population is geographically concentrated. Ninety-five percent of production takes place in three regions: East Asia, Europe and the Ameri-cas (Figure 19). This geographical concentra-tion close to consumption areas has been main-tained over time by importing increasingly large amounts of feed.
Emission intensities in the top-five producing regions range between 4.6 and 7.1 kg CO2-eq per kg CW.
Regional differences are mostly explained by variation in feed material in the ration, animal
FIgurE 19. Regional variation in pork production and GHG emission intensities*
0
20
40
60
80
100
120
0
1
2
3
4
5
6
7
8
kg C
O2-e
q.kg
CW
-1
Mill
ion
tonn
es C
W
LAC
E &
SE
Asia
N. A
mer
ica
W. E
urop
e
Wor
ld
E. E
urop
e
Applied & deposited manure, N2O
Manure management, N2O
Fer�lizer & crop residues, N2O
Feed: rice, CH4
LUC: soybean, CO2
Enteric, CH4
Feed, CO2
Pos�arm, CO2
Pork produc�on
Manure management, CH4
Direct energy, CO2
Indirect energy, CO2
* Regions accounting for less than 1 percent of world production are omitted.
Source: GLEAM.

4. Emissions by species
37
productivity and climate. In East and Southeast Asia, emissions from manure are comparatively more important, mainly due to the types of ma-nure storage systems and climatic conditions. In Europe and Latin America and the Caribbean, high emission intensities are partly explained by feeding of soybean cake originating from areas where land-use change has occurred in the past 20 years.
4.5 chicKenGlobally, chicken supply chains emit GHG emis-sions of 606 million tonnes CO2-eq, representing 8 percent of the sector’s emissions.
main emission source: feed production (fertilization, use of machinery and transport) Feed production contributes about 57 percent of emissions from both chicken and egg supply chains, with an additional 21.1 percent related to the expansion of soybean cultivation in the case of meat and 12.7 percent in the case of eggs (Figure
20). Broiler rations are richer in protein and, on average, include a higher share of soybean sourced from areas where land-use conversion has taken place.
Manure emissions account for 20 percent of emissions in eggs but only 6 percent in broilers. This is due to different management systems; most of the manure from specialized meat production is managed in dry, aerobic conditions whereas that from hens is often managed in liquid systems with long-term pit storage.
Emissions from energy consumption, including direct energy, feed CO2 and postfarm CO2 are 35 to about 40 percent of total emissions.
lower emission intensity for industrial systemsThree types of chicken production systems exist: backyard layers and industrial layers, producing both meat and eggs, and industrial broilers, pro-ducing only meat.17
17 Farming systems defined on the basis of the animal ration and level of market integration (Chapter 2).
FIgurE 20. Global emissions from chicken meat and egg supply chains, by category of emissions
Meat Eggs
21.4%
12.7%
26.7%
8.6%
5.5%6.9%
22.6%
21.1%
7.6%
24.8%
9.1%
1.4%
4.0%
4.8%
1.6%
11.0%
9.0%
1.1%
Direct energy, CO2
Other*
Pos�arm, CO2
Manure management, N2O
Manure management, CH4
LUC: soybean, CO2
Feed, CO2
Fer�lizer & crop residues, N2O
Applied & deposited manure, N2O
* Includes “Feed: rice, CH4“ and “Indirect energy, CO2“.
Source: GLEAM.

Tackling climate change through livestock – A global assessment of emissions and mitigation opportunities
38
Making up over 90 percent of meat production, industrial broilers have the lowest emission inten-sity (Table 9). Likewise, the production of eggs from intensively-managed laying hens represents over 85 percent of output and has a lower emis-
sion intensity than the production of eggs from backyard systems. Backyard systems have higher emission intensities but they represent less than 10 percent of GHG emissions. Backyard production occurs in small units, with slow growing animals
TABLE 9. Global production, emissions and emission intensity for chickens
system production(Million tonnes)
emissions (Million tonnes CO2-eq)
emission intensity (kg CO2-eq/kg product)
eggs meat1 eggs meat eggs meat1
Backyard 8.3 2.7 35.0 17.5 4.2 6.6
Layers 49.7 4.1 182.1 28.2 3.7 6.9
Broilers 64.8 343.3 5.3
totals 58.0 71.6 217.0 389.0 3.7 5.41 Product: CW.
FIgurE 21. Regional variation in chicken meat production and GHG emission intensities*
0
10
20
30
40
50
60
70
80
0
1
2
3
4
5
6
7
kg C
O2-e
q.kg
CW
-1
Mill
ion
tonn
es C
W
LAC
E &
SE
Asia
N. A
mer
ica
Sout
h As
ia
NENA
W. E
urop
e
Wor
ld
E. E
urop
e
Manure management, N2O
Fer�lizer & crop residues, N2O
Feed: rice, CH4
LUC: soybean, CO2
Feed, CO2
Pos�arm, CO2
Meat produc�on
Manure management, CH4
Direct energy, CO2
Indirect energy, CO2
Applied & deposited manure, N2O
* Regions accounting for less than 2 percent of world production are omitted.
Source: GLEAM.

4. Emissions by species
39
and lower egg production per hen than industrial systems.
Several factors explain the higher emission in-tensities of backyard systems. First, hens in back-yard systems have poor feed conversion ratios because of the relatively low quality of feed and because birds spend energy scavenging for feed. Second, backyard systems have a higher propor-tion of unproductive animals (around 10 percent of the backyard flock, compared with 4 percent of the broiler flock and 1 percent of the layer flock). This is due to much higher death rates (largely through disease and predation) and lower fertility rates. In backyard systems, manure N2O emission
intensity is also higher due to poor feed conver-sion (higher rates of transformation of feed N into N2O emissions).
similar emission intensities in top three producing regionsLatin America and the Caribbean, North America and East and Southeast Asia dominate chicken meat production, and the latter region also domi-nates egg production (Figures 21 and 22). Average emission intensities are at similar levels in the top three production regions, reflecting the relative standardization of production systems and similar levels of technology. However, North American
FIgurE 22. Regional variation in chicken egg production and GHG emission intensities*
0
10
20
30
40
50
60
70
0
1
2
3
4
5
6
7
kg C
O2-e
q.kg
egg
-1
Mill
ion
tonn
es e
gg
LAC
E &
SE
Asia
N. A
mer
ica
Sout
h As
ia
NENA
W. E
urop
e
Wor
ld
E. E
urop
e
SSA
Russ
ian
Fed.
Manure management, N2O
Fer�lizer & crop residues, N2O
Feed: rice, CH4
LUC: soybean, CO2
Feed, CO2
Pos�arm, CO2
Egg produc�on
Manure management, CH4
Direct energy, CO2
Indirect energy, CO2
Applied & deposited manure, N2O
* Regions accounting for less than 2 percent of world production are omitted.
Source: GLEAM.

40
Tackling climate change through livestock — A global assessment of emissions and mitigation opportunities
systems generally have slightly lower emission in-tensities, as a result of good feed conversion and low emission intensity feed (about 1 kg CO2-eq per kg feed dry matter). Higher emission intensity feed, related to sourcing feed from areas of defor-estation, cause emission intensities to be higher in Western Europe and Latin America and the Car-ibbean. In East and Southeast Asia, poorer feed conversion ratios and more anaerobic storage of manure explain the higher emissions compared with North America.
4.6 cross-cutting oBservations
ghg emissions and natural resource use efficiency To the climatologist, CH4, N2O and CO2 are GHGs released into the atmosphere. However, for the livestock producer, these emissions are losses of energy, nutrients and soil organic mat-ter. Their emissions often reflect the non-efficient use of initial inputs and resources. These losses undermine the efficiency, and often the economic viability, of supply chains.
methaneEnteric CH4 emissions mean a loss of energy to the production system: part of the energy ingested as feed is lost in the form of CH4 instead of being assimilated by animals and used for production. Livestock producers make substantial efforts to produce feed or bring animals to pastures; feed is typically the main production cost item in mixed and intensive systems. Wasting part of the feed energy in the form of CH4 is, thus, not only a cli-mate change issue but also damages production. Furthermore, feed production mobilizes natural resources, such as water, land, fossil fuels and rock phosphorus; its wastage is also detrimental to oth-er dimensions of environmental sustainability.
Likewise, CH4 emissions from manure are an-other form of energy loss that can be recovered when manure is fed into a biogas digester.
The total enteric CH4 emissions of the sector are 2.7 gigatonnes CO2-eq per year, or 144 mil-
lion tonnes of oil equivalent per year - about the energy use of South Africa (World Bank, 2013). The total manure CH4 emissions are 300 million tonnes CO2-eq per year, or 16 million tonnes of oil equivalent per year - about the energy use of Ireland.
While manure CH4 emissions could be largely recovered, enteric CH4 losses can only be partially avoided given current knowledge. These figures nev-ertheless give an impression of the magnitude of the loss. This has not escaped producers and improving the energy efficiency of feed is now the main argu-ment for the use of dietary lipids, with reduction of enteric emissions being seen as a co-benefit.
nitrous oxideNitrous oxide emissions, either direct or indirect from NH3 losses, are both forms of N loss. Nitro-gen is a macronutrient of plants, key to improving yield. Supplying reactive N to plants (in the form of manure or synthetic fertilizers) and preserving N in soils through agronomic practices come at significant cost to producers. They also involve high levels of fossil fuel consumption.
Nitrous oxide emissions from manure stor-age and processing, and from the application of manure on crops and pasture, represent about 3 million tonnes of N. This is about 15 percent of the mineral N fertilizer use that can be ascribed to feed (crop and pasture) production for the live-stock sector (FAO, 2006).
Additional losses of N take place in the form of NH3 and NOx emissions into the atmosphere and leaching of soluble forms of N into ground water. While the latter is not quantified in this as-sessment, it is estimated that NH3 and NOx emis-sions represent significant N losses: NH3 and NOx emissions from the application of manure on crops and pasture, and from manure storage and processing are estimated to represent 26 million tonnes of N and 17 million tonnes of N, respec-tively. While not contributing to climate change, these emissions pose other environmental prob-lems such as the acidification and eutrophication of natural habitats.

4. Emissions by species
41
carbon dioxideCarbon dioxide emissions are related to fossil fuel consumption and land use activities.
On-site energy consumption is generally mar-ginal in production cost structure but can be high in some cases, for example in intensive milk pro-duction systems. Energy-use efficiency can be im-proved by the adoption of better management prac-tices (e.g. maintenance of equipment and operating time) and energy saving devices (e.g. heat pumps and thermal isolation), reducing both emissions and energy costs for farms and processing plants.
Soil organic matter, the primary form of carbon in soils, serves several functions. From an agricul-tural standpoint, it is important as a “revolving nutrient fund”, as well as an agent to improve soil structure, maintain tilth and minimize erosion. (FAO, 2005). When soil organic matter is lost, ei-ther through inadequate agricultural practices in feed production or pasture degradation, the pro-ductivity of land decreases over time.
important but poorly understood contribution of land use and land-use change Land-use change is estimated to contribute 9.2 percent to the sector’s overall GHG emissions (6 percent from pasture expansion, with the rest from feed crop expansion).
While relatively limited when averaged globally and over all species, land-use change emissions are significantly higher for some specific supply chains and regions. They amount to 15 percent for beef production (linked to pasture expansion) and 21 percent in chicken meat production (linked to soybean expansion). Because soybean is largely traded internationally, emissions from soybean expansion in Latin America and the Caribbean are actually attributed to production units around the world using soybean cakes imported from that region. This is different for pasture expansion, where induced emissions are entirely attributed to local production. As a result, land-use change emissions amount to 24 kg CO2-eq per kg CW of beef in Latin America and the Caribbean, 33 per-cent of total emissions.
The drivers of land-use changes, and the attribu-tion of the related emissions, as well as the methods available to compute land-use change emissions, are still highly debated.
As noted above, this report follows IPCC guidelines (IPCC, 2006) and three alternative approaches were tested in the context of a par-tial sensitivity analysis of the results. Land-use change emissions computed for Argentina ranged between 0.3 and 4.2 kg CO2-eq per kg soybean cake and between 3.0 and 7.7 kg CO2-eq per kg soybean cake produced in Brazil (the values re-sulting from the IPCC method and used in this as-sessment are 0.9 and 7.7 for Argentina and Brazil, respectively).
This analysis could not estimate changes in soil carbon stocks under constant land use manage-ment practices because of the lack of global data-bases and models. The effect of this simplification was, however, tested in the case of the European Union, where data are available (Soussana et al., 2010). Permanent grasslands in the European Un-ion represent a sink of 3.1 ± 18.8 million tonnes C per year (or 11.4 ± 69.0 million tonnes CO2-eq per year), equivalent to 3 percent (± 18 percent) of the yearly emissions of the ruminant sector in the European Union. Net sequestration/emission of C in permanent pasture under stable management practices may thus be significant but the uncer-tainty about calculation parameters is such that it cannot be said with certainty whether permanent pastures are a net sink or source of emissions. The relative importance of land use emissions may even be higher in other parts of the world where permanent pastures are much more common and C sequestration higher (e.g. Africa, Latin America and the Caribbean).
Better understanding of soil organic carbon dynamics in grasslands and the development of methods and models to monitor and predict changes in C stocks are, however, required for the inclusion of this emission category in global as-sessments (FAO, 2013b).

42
Tackling climate change through livestock — A global assessment of emissions and mitigation opportunities
correlation between productivity and emission intensities
ruminantsIn ruminant production, there is a strong relation-ship between productivity and emission intensi-ty – up to a relatively high level of productivity, emission intensity decreases as yield increases.
Gerber et al. (2011) demonstrate this relation-ship for milk, illustrating how differences in pro-ductivity explain the variation in emission inten-sity between countries. Figure 23 highlights the strong correlation between output per cow and emission intensity per unit of product produced.
High-yielding animals producing more milk per lactation generally exhibit lower emission intensities for three main reasons. First, because emissions are spread over more units of milk, thus diluting emissions relative to the maintenance requirements of the animals. Second, because productivity gains are often achieved through improved practices and technologies which also contribute to emissions reduction, such as high
quality feed and high performance animal genet-ics. And third, because productivity gains are gen-erally achieved through herd management, animal health and husbandry practices that increase the proportion of resources utilized for productive purposes rather than simply being used to main-tain the animals. This results in a reduced stand-ing biomass (both in lactating and in replacement herds) per unit of milk produced. The impact per unit of milk is therefore reduced at both the indi-vidual cow and dairy herd level.
A large potential to mitigate emissions thus exists in low-yield ruminant production systems. Improved productivity at the animal and herd level can lead to a reduction of emission intensi-ties while at the same time increasing milk output.
monogastric speciesThe relation between productivity gains and emissions shows a different pattern for monogas-tric species.
In pig production, the relation between inten-sification and emission intensity follows a slight
FIgurE 23. Relationship between productivity and emission intensity of milk (country averages)
0
2
4
6
8
10
12
0 1 000 2 000 3 000 4 000 5 000 6 000 7 000 8 000 9 000
kg C
O2-e
q.kg
FPC
M-1
kg FPCM.cow-1
Source: Gerber et al., 2011.

4. Emissions by species
43
inverse U-shape relation (Figure 24). At the low end of the productivity spectrum, in backyard systems, emission intensity is low. The feed ration is mostly made up of wastes and by-products with low emission intensity which compensate for the high manure emissions per unit of product due to poor nutrient balancing and low digestibility. In contrast, industrial systems characterized by high productivity have slightly higher emission inten-sity on a global average than backyard systems. They have optimized feed conversion ratios but are penalized by the relatively high emission in-tensity of the feed materials they rely on (driven up by energy consumption and land-use change). Highest emission intensity is found among inter-mediate systems, which combine relatively high feed emission intensity with moderate feed con-version ratios. The diversity of manure emission intensities, not related to farming systems but rather to local manure management practices and climate, further blurs the relation between pro-ductivity and emission intensity.
FIgurE 24. Global emission intensity from pig supply chains, by main production systems
Source: GLEAM.
Pos�arm, CO2
Direct energy, CO2
Indirect energy, CO2
Manure MMS, N2O
Manure MMS, CH4
Enteric, CH4
LUC: soybean, CO2
Feed, CO2
Feed: rice, CH4
Fer�lizer & crop residues, N2O
0
1
2
3
4
5
6
7
Backyard Intermediate Industrial
Applied & deposited manure, N2O
kg C
O2-e
q.kg
CW
-1
The possibility to increase backyard production is limited by the availability of the feed materials these systems rely on. There is, however, a strong mitigation potential in upgrading intermediate systems to improve herd efficiency. Furthermore, independent of the production system, manure storage, processing and application practices can be altered to mitigate emissions.
For chicken, the broiler and layer systems display lower levels of emission intensity than backyard systems for meat and eggs. Feed repre-sents about 75 percent of emissions in intensive systems, so the type and origin of feed materials explain most of the emission intensity variability within these systems.