key results - data.daff.gov.audata.daff.gov.au/.../austfishsurveys2013nthprawn_v1.0.… · web...
TRANSCRIPT

Australian fisheries economic indicators report 2013
Financial and economic performance of the Northern Prawn FisheryMaggie Skirtun, Mary Stephan and Kasia Mazur
Research by the Australian Bureau of Agriculturaland Resource Economics and Sciences
April 2014

Australian fisheries economic indicators report 2013: Northern Prawn Fishery
© Commonwealth of Australia 2014
Ownership of intellectual property rightsUnless otherwise noted, copyright (and any other intellectual property rights, if any) in this publication is owned by the Commonwealth of Australia (referred to as the Commonwealth).
Creative Commons licenceAll material in this publication is licensed under a Creative Commons Attribution 3.0 Australia Licence, save for content supplied by third parties, logos and the Commonwealth Coat of Arms.
Creative Commons Attribution 3.0 Australia Licence is a standard form licence agreement that allows you to copy, distribute, transmit and adapt this publication provided you attribute the work. A summary of the licence terms is available from creativecommons.org/licenses/by/3.0/au/deed.en. The full licence terms are available from creativecommons.org/licenses/by/3.0/au/legalcode.
This publication (and any material sourced from it) should be attributed as Skirtun, M, Stephan, M & Mazur, K 2014, Australian fisheries economic indicators report 2013: financial and economic performance of the Northern Prawn Fishery, ABARES, Canberra, April 2014. CC BY 3.0.
Cataloguing dataSkirtun, M, Stephan, M & Mazur, K 2014, Australian fisheries economic indicators report 2013: financial and economic performance of the Northern Prawn Fishery, ABARES, Canberra, April 2014.
ISBN 978-1-74323-184-5ABARES project 43351
InternetAustralian fisheries economic indicators report 2013: financial and economic performance of the Northern Prawn Fishery is available at daff.gov.au/abares/publications.
Department of Agriculture Australian Bureau of Agricultural and Resource Economics and SciencesPostal address GPO Box 1563 Canberra ACT 2601Switchboard +61 2 6272 2010|Facsimile +61 2 6272 2001Email [email protected] daff.gov.au/abaresInquiries regarding the licence and any use of this document should be sent to [email protected].
The Australian Government acting through the Department of Agriculture has exercised due care and skill in the preparation and compilation of the information and data in this publication. Notwithstanding, the Department of Agriculture, its employees and advisers disclaim all liability, including liability for negligence, for any loss, damage, injury, expense or cost incurred by any person as a result of accessing, using or relying upon any of the information or data in this publication to the maximum extent permitted by law.
AcknowledgementsThe ABARES fisheries survey program involves the cooperative effort of industry, fisheries management, agencies and ABARES staff.
Industry—ABARES surveys are voluntary, so the cooperation of NPF fishing operators and their accountants in providing data is essential for the success of the fisheries surveys. Without this assistance the surveys would not be possible.
Management agencies—the Australian Fisheries Management Authority (AFMA) provided logbook and address data, as well as fishery management costs and general information about the surveyed fisheries. Comments by AFMA on earlier drafts are also gratefully acknowledged.
ABARES staff—sample design and estimation was undertaken with assistance from Walter Shafron. Patricia Hobsbawn and Phil Sahlqvist provided data support. Rupert Summerson created the maps. Programming and computer systems support was provided by Justin Allen and Mark Neilsen. Robert Curtotti and Ilona Stobutzki provided comments on the report. The Fisheries Resources Research Fund and ABARES funded this report.
ii
Australian fisheries economic indicators report 2013: Northern Prawn Fishery
ContentsSummary................................................................................................................................................................. 1
Key results.................................................................................................................................................. 11 Introduction............................................................................................................................................... 3
2 Background................................................................................................................................................ 5
Description of the fishery.................................................................................................................... 5Key economic trends............................................................................................................................. 6Current management arrangements..............................................................................................8
3 Financial and economic performance.........................................................................................10
Financial performance.......................................................................................................................10Economic performance......................................................................................................................12
4 Productivity analysis...........................................................................................................................13
5 Other key indicators............................................................................................................................15
Profitability indexes............................................................................................................................ 15Entitlement values............................................................................................................................... 17Management costs................................................................................................................................17
6 Performance against management objectives.........................................................................22
Appendix A: Survey definitions................................................................................................................. 24
Financial performance.......................................................................................................................24Net economic returns.........................................................................................................................25Survey-based estimation of net economic returns................................................................26Net economic returns and economic performance...............................................................27
Appendix B: Survey methods......................................................................................................................28
Appendix C: Non-survey based estimation of net economic returns........................................31
Appendix D: Productivity methodology.................................................................................................33
Productivity measurement...............................................................................................................33Data............................................................................................................................................................. 33
References........................................................................................................................................................... 36
TablesTable 1 Key financial performance results, Northern Prawn Fishery.........................................1
Table 2 Key economic performance results, Northern Prawn Fishery.......................................2
Table 3 Northern Prawn Fishery fishing seasons................................................................................6
Table 4 Financial performance of boats operating in the Northern Prawn Fishery..........11
Table 5 Fishery cash profit and net economic returns, Northern Prawn Fishery...............12
Table 6 Regression model for tiger prawn price, Northern Prawn Fishery..........................19
Table 7 Regression model for banana prawn price, Northern Prawn Fishery.....................20
Table 8 Actual and fitted price estimates, banana and tiger prawns, 2012–13...................21
Table C1 Regression model for average cash receipts, Northern Prawn Fishery...............32
iii
Australian fisheries economic indicators report 2013: Northern Prawn Fishery
Table C2 Regression model for average operating costs, Northern Prawn Fishery..........32
FiguresFigure 1a Landed catch of key species, Northern Prawn Fishery.................................................7
Figure 1b Real gross value of production, Northern Prawn Fishery...........................................7
Figure 1c Real net economic return, Northern Prawn Fishery......................................................7
Figure 2 Exchange rate and average real unit price, Northern Prawn Fishery.......................8
Figure 3a Key management changes, Northern Prawn Fishery.....................................................9
Figure 3b Number of vessels operating, Northern Prawn Fishery...............................................9
Figure 4 Productivity indexes, Northern Prawn Fishery...............................................................13
Figure 5 Key indexes for vessels, Northern Prawn fishery tiger prawn season..................16
Figure 6 Key indexes for vessels, Northern Prawn fishery the banana prawn season.....16
Figure 7 Management cost per active boat and as share of GVP.................................................18
Figure 8 Pseudo out-of-sample forecast, tiger prawn prices........................................................20
Figure 9 Pseudo out-of-sample forecast, banana prawn prices..................................................21
MapsMap 1 Relative fishing intensity, Northern Prawn Fishery, 2012.................................................5
BoxesBox 1 Economic indicators in fisheries management.........................................................................4
Box 2 Prawn prices forecasts......................................................................................................................19
Box D1 Fisher index........................................................................................................................................ 34
iv
Australian fisheries economic indicators report 2013: Northern Prawn Fishery
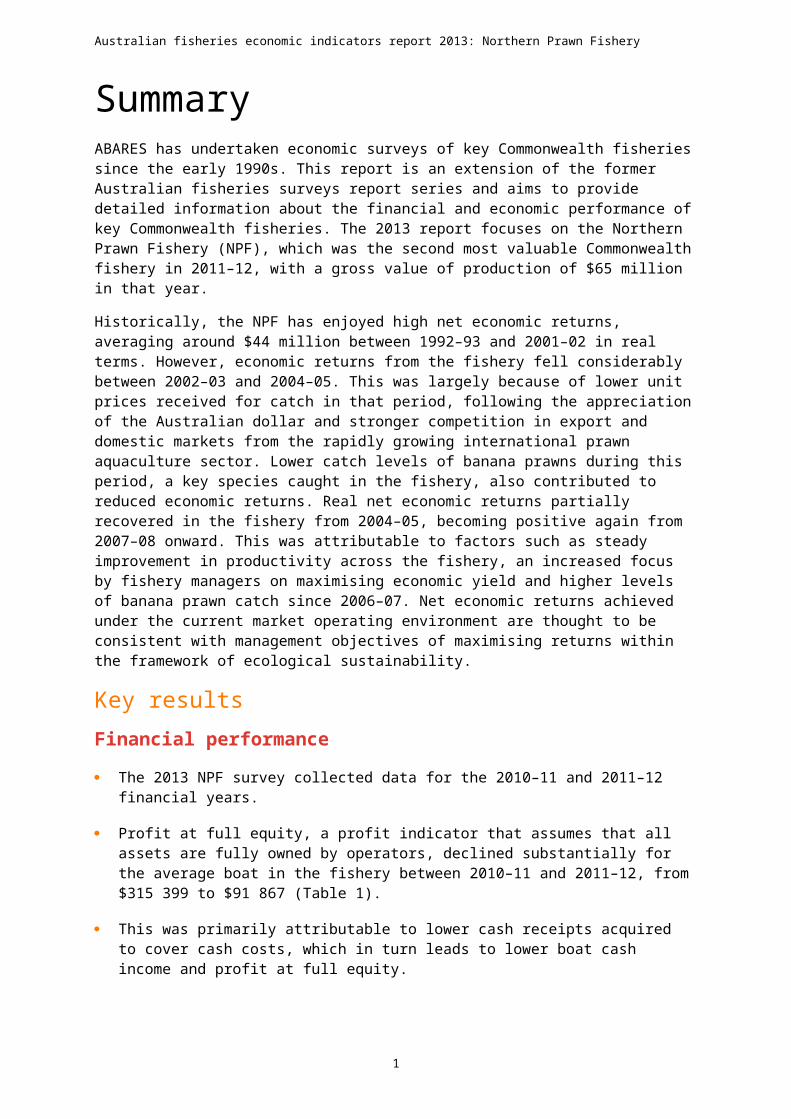
SummaryABARES has undertaken economic surveys of key Commonwealth fisheries since the early 1990s. This report is an extension of the former Australian fisheries surveys report series and aims to provide detailed information about the financial and economic performance of key Commonwealth fisheries. The 2013 report focuses on the Northern Prawn Fishery (NPF), which was the second most valuable Commonwealth fishery in 2011–12, with a gross value of production of $65 million in that year.
Historically, the NPF has enjoyed high net economic returns, averaging around $44 million between 1992–93 and 2001–02 in real terms. However, economic returns from the fishery fell considerably between 2002–03 and 2004–05. This was largely because of lower unit prices received for catch in that period, following the appreciation of the Australian dollar and stronger competition in export and domestic markets from the rapidly growing international prawn aquaculture sector. Lower catch levels of banana prawns during this period, a key species caught in the fishery, also contributed to reduced economic returns. Real net economic returns partially recovered in the fishery from 2004–05, becoming positive again from 2007–08 onward. This was attributable to factors such as steady improvement in productivity across the fishery, an increased focus by fishery managers on maximising economic yield and higher levels of banana prawn catch since 2006–07. Net economic returns achieved under the current market operating environment are thought to be consistent with management objectives of maximising returns within the framework of ecological sustainability.
Key results
Financial performance
The 2013 NPF survey collected data for the 2010–11 and 2011–12 financial years.
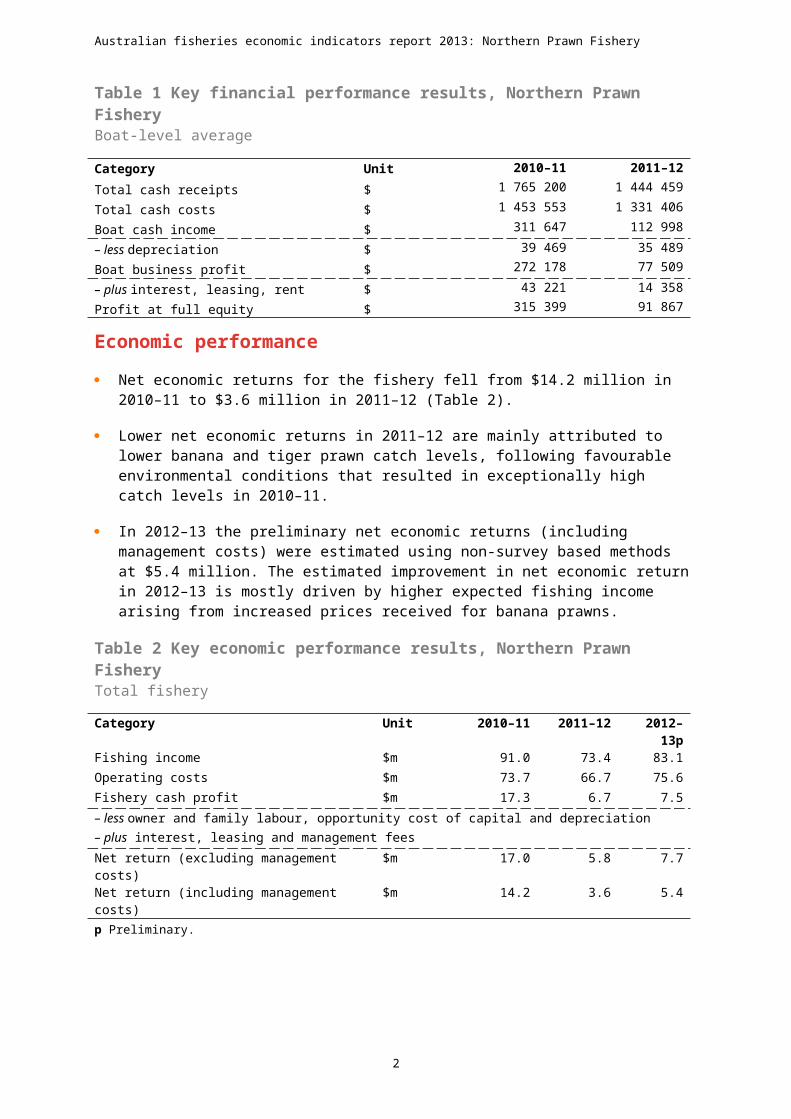
Profit at full equity, a profit indicator that assumes that all assets are fully owned by operators, declined substantially for the average boat in the fishery between 2010–11 and 2011–12, from $315 399 to $91 867 (Table 1).
This was primarily attributable to lower cash receipts acquired to cover cash costs, which in turn leads to lower boat cash income and profit at full equity.
Table 1 Key financial performance results, Northern Prawn FisheryBoat-level average
Category Unit 2010–11 2011–12
Total cash receipts $ 1 765 200 1 444 459
Total cash costs $ 1 453 553 1 331 406
Boat cash income $ 311 647 112 998
– less depreciation $ 39 469 35 489
Boat business profit $ 272 178 77 509
– plus interest, leasing, rent $ 43 221 14 358
Profit at full equity $ 315 399 91 867
1

Australian fisheries economic indicators report 2013: Northern Prawn Fishery
Economic performance
Net economic returns for the fishery fell from $14.2 million in 2010–11 to $3.6 million in 2011–12 (Table 2).
Lower net economic returns in 2011–12 are mainly attributed to lower banana and tiger prawn catch levels, following favourable environmental conditions that resulted in exceptionally high catch levels in 2010–11.
In 2012–13 the preliminary net economic returns (including management costs) were estimated using non-survey based methods at $5.4 million. The estimated improvement in net economic return in 2012–13 is mostly driven by higher expected fishing income arising from increased prices received for banana prawns.
Table 2 Key economic performance results, Northern Prawn FisheryTotal fishery
Category Unit 2010–11 2011–12 2012–13p
Fishing income $m 91.0 73.4 83.1
Operating costs $m 73.7 66.7 75.6
Fishery cash profit $m 17.3 6.7 7.5
– less owner and family labour, opportunity cost of capital and depreciation
– plus interest, leasing and management fees
Net return (excluding management costs) $m 17.0 5.8 7.7
Net return (including management costs) $m 14.2 3.6 5.4
p Preliminary.
Other indicators
Total factor productivity increased in the NPF from 2004–05 to 2010–11 as a result of falling input use, while output increased. The increase in productivity reflects a reduction in fleet size following the Securing Our Fishing Future buyback program, the likely exit of less efficient boats through autonomous adjustment and favourable environmental conditions.
In 2011–12 productivity declined as a result of a fall in the output index. This can be attributed to a 36 per cent decline in banana prawn catch, following an exceptionally good season in 2010–11. Tiger prawn catch also contributed to the decline in output, with production falling from 1627 tonnes in 2010–11 to 864 tonnes in 2011–12.
Similarly, the profit decomposition analysis found that productivity improvements contributed to higher profitability in both the tiger prawn and banana prawn season from 2005–06 to 2009–10; but steady increases in banana prawn landings over this period also contributed to higher profitability (analysis only up to 2009–10).
Like the productivity analysis, most of the improvements in productivity are likely to be largely the result of less efficient boats exiting the fishery, as well as the introduction of more economic specific objectives such as maximum economic yield targeting in 2004.
2
Australian fisheries economic indicators report 2013: Northern Prawn Fishery
1 IntroductionABARES has undertaken regular surveys of key Commonwealth fisheries since the early 1990s. The resulting data are used to assess the financial performance of operators in the fishery and the economic performance of the fishery as a whole. Both performance measures act as important indicators for fishery managers (Box 1). In 2013, to provide a more comprehensive assessment of fishery level performance, ABARES expanded the former Australian Fisheries Surveys report series to include other economic indicators that draw on data collected from the surveys. These indicators include productivity and profitability indexes, entitlement values and management costs. In this report, survey-based results are presented for 2010–11 and 201112, with the exception of profitability indexes (results presented to 2009–10); preliminary non-survey-based results are presented for 2012–13.
A distinction is made throughout the report between the two primary indicators: financial performance and economic performance. Financial performance estimates are calculated for the average boat in a fishery and include all cash receipts and cash costs that have been earned and incurred within the survey period. These estimates reflect the average boat’s profit and loss statement for all business activities, including cases where boats have operated in several fisheries. The key indicator of economic performance presented is net economic returns (NER), which is reported at the fishery level. The NER estimates differ from financial performance estimates because they relate only to the surveyed fishery; results exclude revenues and costs attributable to operating in other fisheries and include other economic costs such as depreciation, the opportunity cost of capital and the opportunity cost of labour. For definitions of these costs see Appendix A.
Each indicator provides different information. Boat level financial performance information provides a context for determining trends in the surveyed fishery; for example, positive financial profits at the boat level may reveal how operators continue to operate in a fishery that has experienced negative economic returns. These estimates are relevant to all industry operators, enabling them to compare their individual performance with that of the average boat.
Economic performance is relevant mainly to fishery managers and policymakers. The estimate of NER indicates the economic return to society associated with harvesting the fishery resource. For this reason, NER is the key economic performance indicator referred to in the Fisheries Management Act 1991. According to the Act, the Australian Fisheries Management Authority (AFMA) is required to maximise NER to the Australian community through managing Commonwealth fisheries (AFMA 2014a). Although estimates of NER do not reveal how a fishery has performed relative to maximum potential NER (maximum economic yield) in a given period, interpretation of NER trends and drivers, together with other economic indicators, can assist in assessing AFMA’s performance against this objective.
3
Australian fisheries economic indicators report 2013: Northern Prawn Fishery
Box 1 Economic indicators in fisheries management
In September 2007 the Australian Government released the Commonwealth Fisheries Harvest Strategy Policy to provide guidelines for sustainable and profitable management of Commonwealth fisheries. The policy aims to maintain key commercial stocks at ecologically sustainable levels and maximise economic returns to the Australian community by targeting maximum economic yield (MEY) (DAFF 2007). In order to assess the performance of Commonwealth fisheries against their MEY targets, fishery policymakers frequently rely on economic indicators that provide them with information about economic activities in the fishery. The economic indicators used to inform fishery management generally serve two main purposes: they inform management decisions against the economic objective and they monitor management performance against the economic objective.
Informing management decisions against the economic objective
This type of economic indicator is forward looking and can advise fishery managers on policy settings necessary to achieve MEY. Bio-economic models provide indicators that serve this purpose; models have been developed for the NPF (Kompas & Che 2004) and the SESSF (Kompas & Che 2008). Management strategy evaluation based approaches that include an economic component can also serve this purpose.
Monitoring management performance against the economic objective
This type of economic indicator is retrospective and assesses previous economic performance. It can provide insight into the impact of previous management decisions on economic performance. Most indicators examined in this report fall under this category. This includes the survey-based estimation of NER, productivity indexes, entitlement values, management costs and profitability indexes.
Total factor productivity analysis is an economic tool used to assess how well fishers use inputs to produce outputs and how their ability to convert inputs to outputs over time has changed with changes in the fishery’s operating environment. Productivity indexes can inform fishery managers about the effect of management arrangements on average productivity levels in the fishery.
Similarly, index profit decomposition analysis looks at the key drivers of average profitability in a fishery, such as productivity, fish stock, output price and prices of inputs. The correlation between the profitability index and indexes of the key drivers can provide an indication to fishery managers of the effect that different factors have on profitability. The trends in indexes can also reveal information about the impact changes in management have on key drivers and, in turn, profitability.
In contrast, entitlement values (or quota values), signal the current value of resources in the fishery. When compared over time, entitlement values can serve as a general indicator for how well the resources in a fishery have been sustained or managed. If entitlement values are increasing over time, this suggests that resources are being managed effectively because operating in the fishery is deemed to have become more profitable. Measures of management costs, as a proportion of gross value of fishery production (GVP) and per active boat, also provide information about the cost-effectiveness of fishery management—another key objective referred to in the Fisheries Management Act 1991.
4

Australian fisheries economic indicators report 2013: Northern Prawn Fishery
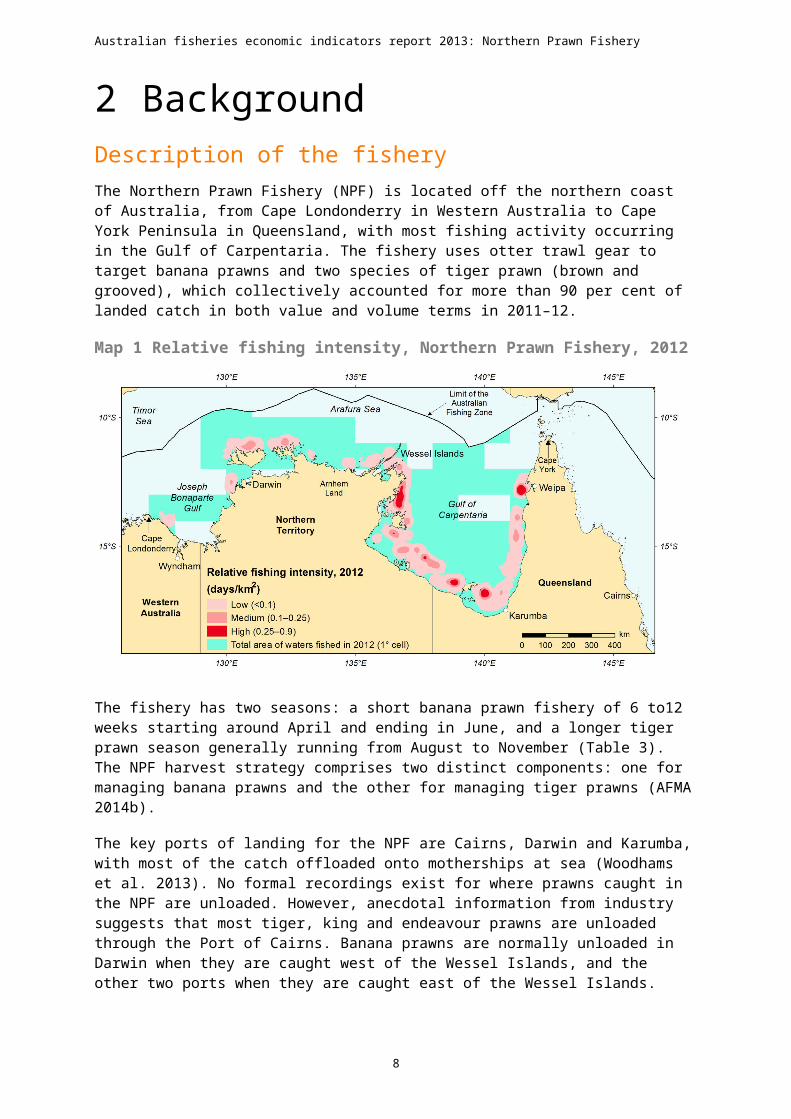
2 BackgroundDescription of the fisheryThe Northern Prawn Fishery (NPF) is located off the northern coast of Australia, from Cape Londonderry in Western Australia to Cape York Peninsula in Queensland, with most fishing activity occurring in the Gulf of Carpentaria. The fishery uses otter trawl gear to target banana prawns and two species of tiger prawn (brown and grooved), which collectively accounted for more than 90 per cent of landed catch in both value and volume terms in 2011–12.
Map 1 Relative fishing intensity, Northern Prawn Fishery, 2012
The fishery has two seasons: a short banana prawn fishery of 6 to12 weeks starting around April and ending in June, and a longer tiger prawn season generally running from August to November (Table 3). The NPF harvest strategy comprises two distinct components: one for managing banana prawns and the other for managing tiger prawns (AFMA 2014b).
The key ports of landing for the NPF are Cairns, Darwin and Karumba, with most of the catch offloaded onto motherships at sea (Woodhams et al. 2013). No formal recordings exist for where prawns caught in the NPF are unloaded. However, anecdotal information from industry suggests that most tiger, king and endeavour prawns are unloaded through the Port of Cairns. Banana prawns are normally unloaded in Darwin when they are caught west of the Wessel Islands, and the other two ports when they are caught east of the Wessel Islands.
The median age of skippers was 39 years in 2010–11 and in 2011–12. In the same period, skippers had on average 21 years of experience operating in the NPF. In 2010–11 skippers had an average total fishing experience of 24 years compared with 26 years in 2011–12. The highest level of educational attainment for most respondents was completion of year 12 high school. The maximum qualification obtained was completion of a trade/technical apprenticeship (66 per cent in 2010–11 and 67 per cent in 2011–12).
5
Australian fisheries economic indicators report 2013: Northern Prawn Fishery
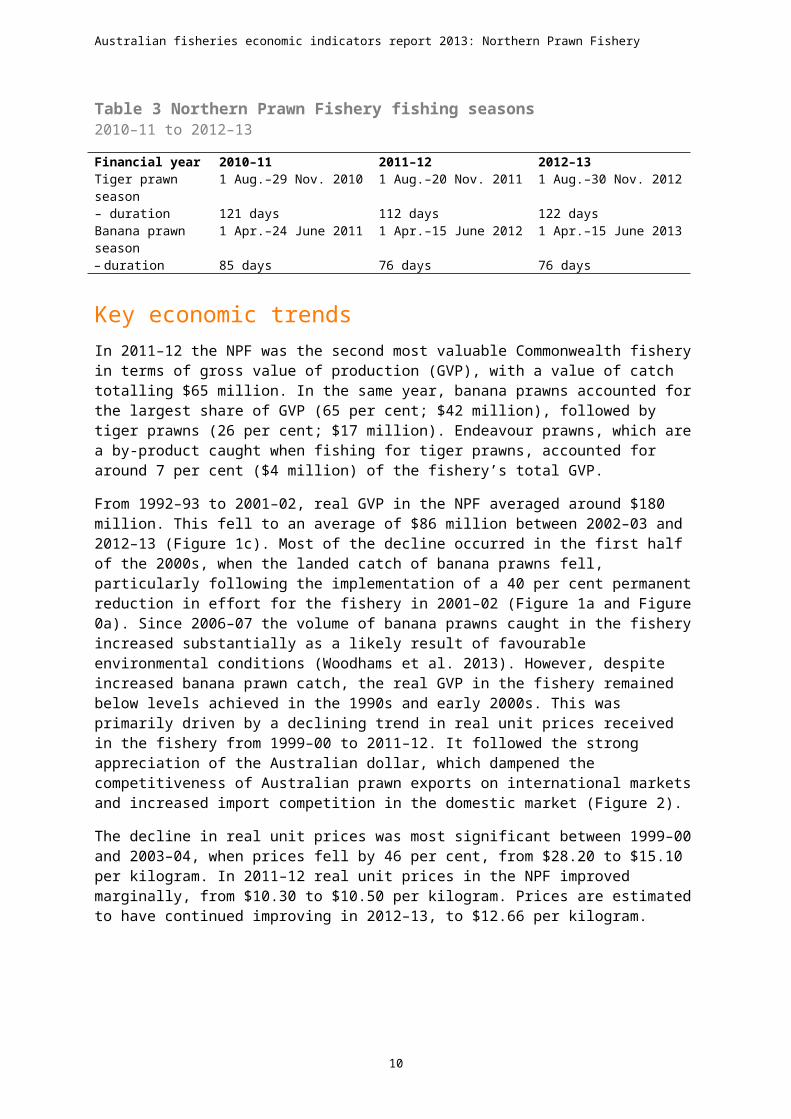
Table 3 Northern Prawn Fishery fishing seasons2010–11 to 2012–13
Financial year 2010–11 2011–12 2012–13Tiger prawn season 1 Aug.–29 Nov. 2010 1 Aug.–20 Nov. 2011 1 Aug.–30 Nov. 2012– duration 121 days 112 days 122 daysBanana prawn season
1 Apr.–24 June 2011 1 Apr.–15 June 2012 1 Apr.–15 June 2013
– duration 85 days 76 days 76 days
Key economic trendsIn 2011–12 the NPF was the second most valuable Commonwealth fishery in terms of gross value of production (GVP), with a value of catch totalling $65 million. In the same year, banana prawns accounted for the largest share of GVP (65 per cent; $42 million), followed by tiger prawns (26 per cent; $17 million). Endeavour prawns, which are a by-product caught when fishing for tiger prawns, accounted for around 7 per cent ($4 million) of the fishery’s total GVP.
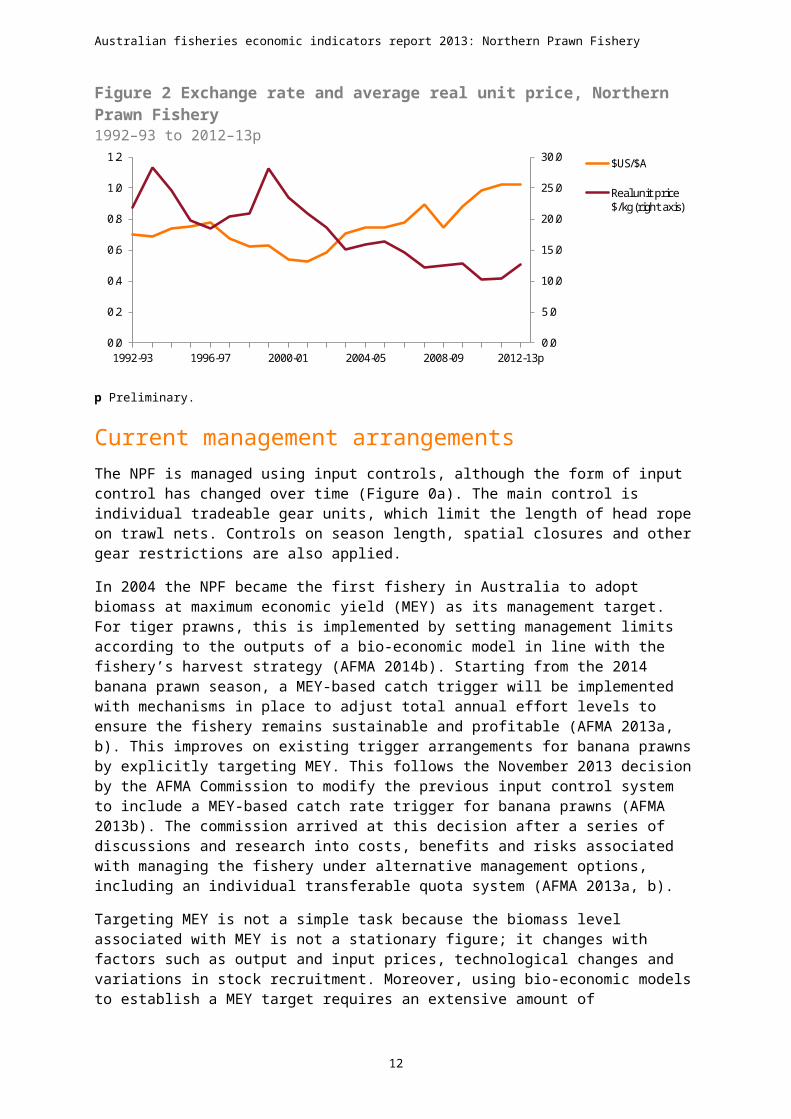
From 1992–93 to 2001–02, real GVP in the NPF averaged around $180 million. This fell to an average of $86 million between 2002–03 and 2012–13 (Figure 1c). Most of the decline occurred in the first half of the 2000s, when the landed catch of banana prawns fell, particularly following the implementation of a 40 per cent permanent reduction in effort for the fishery in 2001–02 (Figure 1a and Figure 0a). Since 2006–07 the volume of banana prawns caught in the fishery increased substantially as a likely result of favourable environmental conditions (Woodhams et al. 2013). However, despite increased banana prawn catch, the real GVP in the fishery remained below levels achieved in the 1990s and early 2000s. This was primarily driven by a declining trend in real unit prices received in the fishery from 1999–00 to 2011–12. It followed the strong appreciation of the Australian dollar, which dampened the competitiveness of Australian prawn exports on international markets and increased import competition in the domestic market (Figure 2).
The decline in real unit prices was most significant between 1999–00 and 2003–04, when prices fell by 46 per cent, from $28.20 to $15.10 per kilogram. In 2011–12 real unit prices in the NPF improved marginally, from $10.30 to $10.50 per kilogram. Prices are estimated to have continued improving in 2012–13, to $12.66 per kilogram.
6

Australian fisheries economic indicators report 2013: Northern Prawn Fishery
Timelines—Northern Prawn Fishery, 1992–93 to 2012–13
Figure 1a Landed catch of key species, Northern Prawn Fishery
0
2
4
6
8
10
12
1992–93 1996–97 2000–01 2004–05 2008–09 2012–13p
Land
ed ca
tch
(kilo
tonn
es)
Tiger prawns Banana prawnsEndeavour prawns King prawnsOther prawns Other species
Figure 1b Real gross value of production, Northern Prawn Fishery
0
50
100
150
200
250
1992–93 1996–97 2000–01 2004–05 2008–09 2012–13p
GVP
(201
2–13
A$
mill
ion)
Figure 1c Real net economic return, Northern Prawn Fishery
-20
0
20
40
60
80
100
1992–93 1996–97 2000–01 2004–05 2008–09 2012–13p
NER
(201
2–13
A$
mill
ion)
p Preliminary.Note: Time series of financial and economic performance (NER) tables are available in the accompanying data product on the ABARES website.
7
Australian fisheries economic indicators report 2013: Northern Prawn Fishery
Figure 2 Exchange rate and average real unit price, Northern Prawn Fishery1992–93 to 2012–13p
0.0
5.0
10.0
15.0
20.0
25.0
30.0
0.0
0.2
0.4
0.6
0.8
1.0
1.2
1992-93 1996-97 2000-01 2004-05 2008-09 2012-13p
$US/$A
Real unit price $/kg (right axis)
p Preliminary.
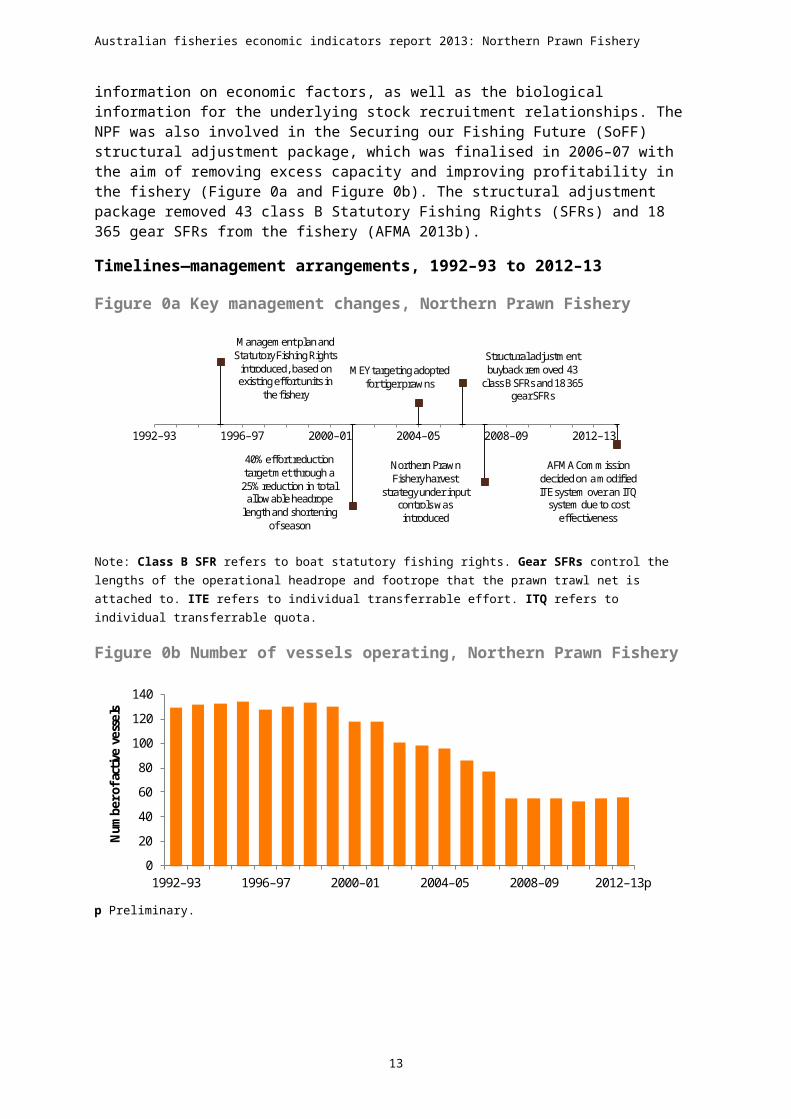
Current management arrangementsThe NPF is managed using input controls, although the form of input control has changed over time (Figure 0a). The main control is individual tradeable gear units, which limit the length of head rope on trawl nets. Controls on season length, spatial closures and other gear restrictions are also applied.
In 2004 the NPF became the first fishery in Australia to adopt biomass at maximum economic yield (MEY) as its management target. For tiger prawns, this is implemented by setting management limits according to the outputs of a bio-economic model in line with the fishery’s harvest strategy (AFMA 2014b). Starting from the 2014 banana prawn season, a MEY-based catch trigger will be implemented with mechanisms in place to adjust total annual effort levels to ensure the fishery remains sustainable and profitable (AFMA 2013a, b). This improves on existing trigger arrangements for banana prawns by explicitly targeting MEY. This follows the November 2013 decision by the AFMA Commission to modify the previous input control system to include a MEY-based catch rate trigger for banana prawns (AFMA 2013b). The commission arrived at this decision after a series of discussions and research into costs, benefits and risks associated with managing the fishery under alternative management options, including an individual transferable quota system (AFMA 2013a, b).
Targeting MEY is not a simple task because the biomass level associated with MEY is not a stationary figure; it changes with factors such as output and input prices, technological changes and variations in stock recruitment. Moreover, using bio-economic models to establish a MEY target requires an extensive amount of information on economic factors, as well as the biological information for the underlying stock recruitment relationships. The NPF was also involved in the Securing our Fishing Future (SoFF) structural adjustment package, which was finalised in 2006–07 with the aim of removing excess capacity and improving profitability in the fishery (Figure 0a and Figure 0b). The structural adjustment package removed 43 class B Statutory Fishing Rights (SFRs) and 18 365 gear SFRs from the fishery (AFMA 2013b).
8

Australian fisheries economic indicators report 2013: Northern Prawn Fishery
Timelines—management arrangements, 1992–93 to 2012–13
Figure 0a Key management changes, Northern Prawn Fishery
Management plan and Statutory Fishing Rights
introduced, based on existing effort units in
the fishery
40% effort reduction target met through a
25% reduction in total allowable headrope
length and shortening of season
MEY targeting adopted for tiger prawns
Structural adjustment buyback removed 43
class B SFRs and 18 365 gear SFRs
Northern Prawn Fishery harvest
strategy under input controls was introduced
AFMA Commission decided on a modified ITE system over an ITQ
system due to cost effectiveness
1992–93 1996–97 2000–01 2004–05 2008–09 2012–13
Note: Class B SFR refers to boat statutory fishing rights. Gear SFRs control the lengths of the operational headrope and footrope that the prawn trawl net is attached to. ITE refers to individual transferrable effort. ITQ refers to individual transferrable quota.
Figure 0b Number of vessels operating, Northern Prawn Fishery
0
20
40
60
80
100
120
140
1992–93 1996–97 2000–01 2004–05 2008–09 2012–13p
Num
ber o
f acti
ve v
esse
ls
p Preliminary.
9
Australian fisheries economic indicators report 2013: Northern Prawn Fishery
3 Financial and economic performance
Financial performanceThe survey population for a given year is defined as any boat that recorded more than one tonne of catch in the NPF. The population was 53 in 2010–11 and 55 in 2011–12. The survey sample was 31 in both years. This represents 58 per cent of population and 62 per cent of catch in 2010–11, and 56 per cent of population and 65 per cent of catch in 2011–12, respectively. For details of survey method see Appendix B.
Most operators surveyed indicated that they operated in other fisheries during the survey period, although the portion of time spent in other fisheries varied from operator to operator. Receipts and costs associated with operating in these fisheries have also been included in the average vessel financial performance results. That is, estimates reflect the average boat’s profit and loss statement for all business activities. The financial performance for the average boat operating in the NPF increased between 2009–10 and 2010–11. Average boat cash income increased by 7 per cent as a result of a larger increase in total cash receipts ($225 829 or 15 per cent) compared to the increase in total cash costs ($206 385 or 17 per cent). Most of the increase in total cash receipts came from an increase in fishing income, which is consistent with the 31 per cent increase in the landed catch of banana prawns. As expected with a larger harvest, the key cost items that increased include crew costs, fuel, repairs and maintenance, and other costs. As a result of higher boat cash income and interest, leasing and rent, profit at full equity increased by 10 per cent ($28 989) between 2009–10 and 2010–11.
The financial performance of the average boat declined between 2010–11 and 2011–12. Total revenue declined in percentage terms, considerably more than total cost (18.2 per cent compared with 8.4 per cent). This resulted in substantially lower average boat cash income of $112 998 in 2011–12, compared with $311 647 in 2010–11.
Total cash receipts declined by $320 741 to $1 444 459 in 2011–12, reflecting a 19 per cent decrease in seafood receipts, which was only marginally offset by an increase in non-fishing receipts. The fall in seafood receipts reflects large reductions in catch of tiger and banana prawns. Banana prawn catch declined by 36 per cent (2721 tonnes) between 2010–11 and 2011–12, while tiger prawn catch fell by 47 per cent (864 tonnes) (Skirtun et al. 2013). This is likely to have been influenced by poor environmental conditions in the 2012 banana prawn season; banana prawns are believed to be resilient to fishing pressure and recruitment appears to be more closely associated with seasonal rainfall than fishing mortality (Woodhams et al. 2013).
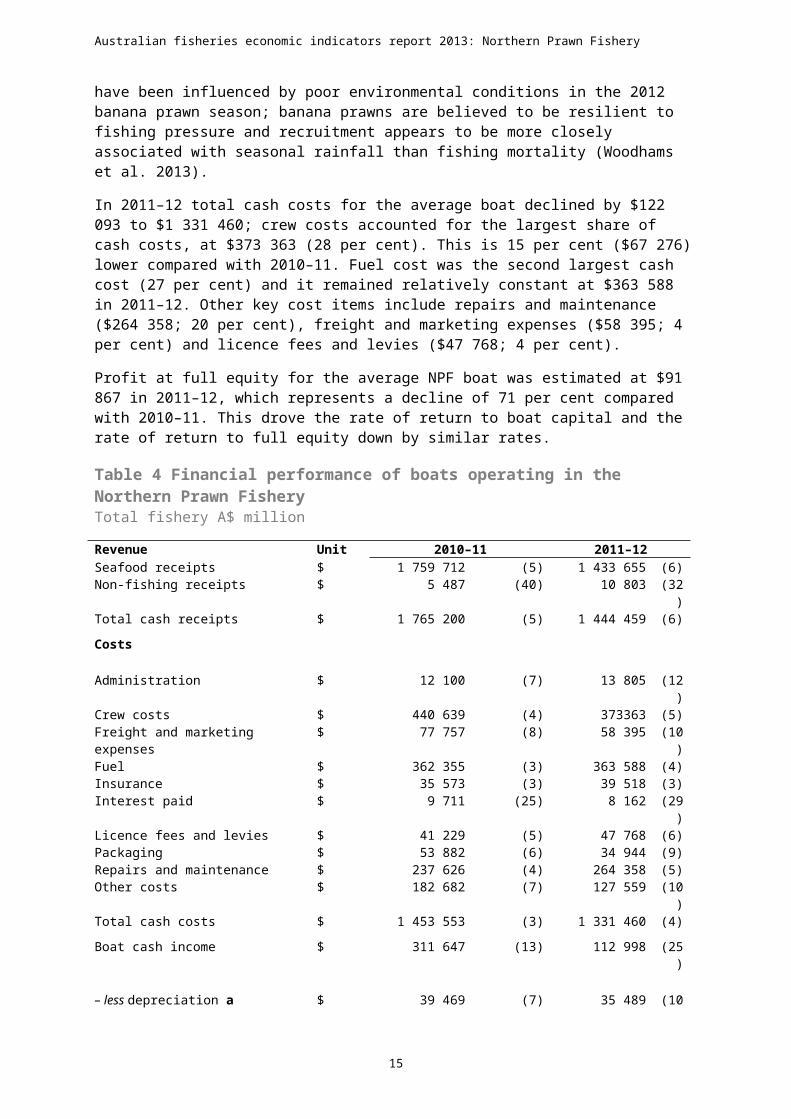
In 2011–12 total cash costs for the average boat declined by $122 093 to $1 331 460; crew costs accounted for the largest share of cash costs, at $373 363 (28 per cent). This is 15 per cent ($67 276) lower compared with 2010–11. Fuel cost was the second largest cash cost (27 per cent) and it remained relatively constant at $363 588 in 2011–12. Other key cost items include repairs and maintenance ($264 358; 20 per cent), freight and marketing expenses ($58 395; 4 per cent) and licence fees and levies ($47 768; 4 per cent).
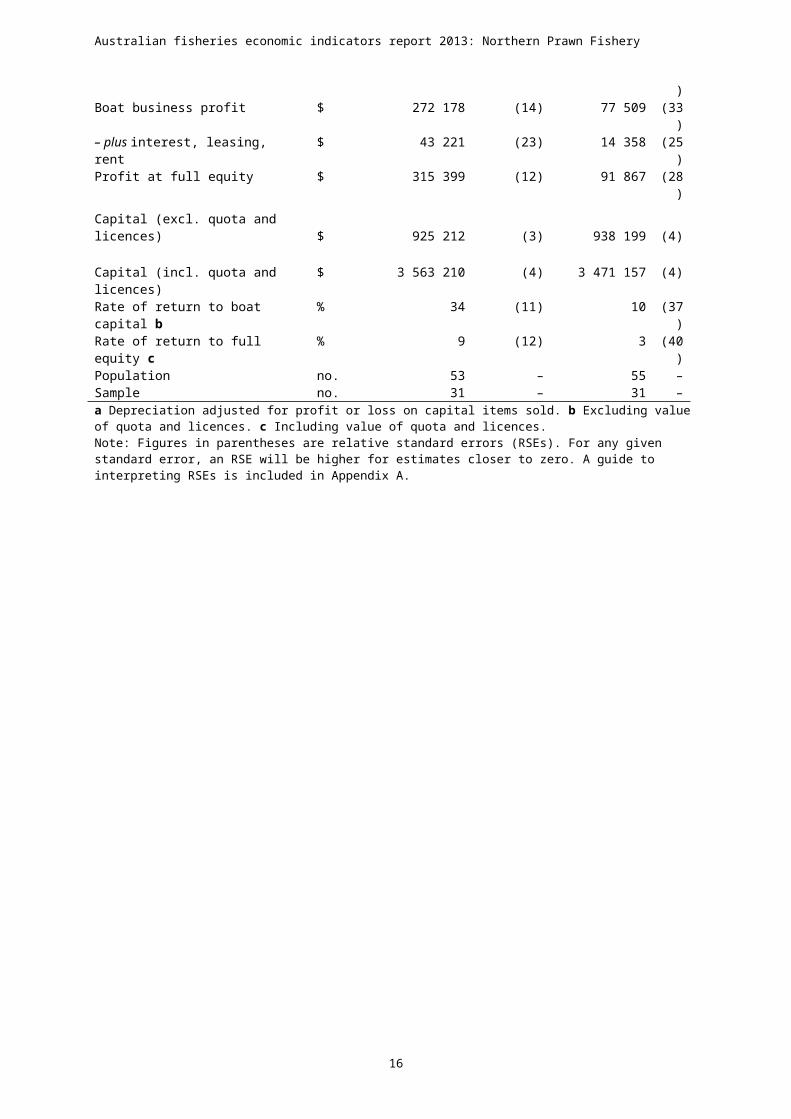
Profit at full equity for the average NPF boat was estimated at $91 867 in 2011–12, which represents a decline of 71 per cent compared with 2010–11. This drove the rate of return to boat capital and the rate of return to full equity down by similar rates.
10

Australian fisheries economic indicators report 2013: Northern Prawn Fishery
Table 4 Financial performance of boats operating in the Northern Prawn FisheryTotal fishery A$ million
Revenue Unit 2010–11 2011–12Seafood receipts $ 1 759 712 (5) 1 433 655 (6)Non-fishing receipts $ 5 487 (40) 10 803 (32
)Total cash receipts $ 1 765 200 (5) 1 444 459 (6)
Costs
Administration $ 12 100 (7) 13 805 (12)
Crew costs $ 440 639 (4) 373363 (5)Freight and marketing expenses $ 77 757 (8) 58 395 (10
)Fuel $ 362 355 (3) 363 588 (4)Insurance $ 35 573 (3) 39 518 (3)Interest paid $ 9 711 (25) 8 162 (29
)Licence fees and levies $ 41 229 (5) 47 768 (6)Packaging $ 53 882 (6) 34 944 (9)Repairs and maintenance $ 237 626 (4) 264 358 (5)Other costs $ 182 682 (7) 127 559 (10
)Total cash costs $ 1 453 553 (3) 1 331 460 (4)
Boat cash income $ 311 647 (13) 112 998 (25)
– less depreciation a $ 39 469 (7) 35 489 (10)
Boat business profit $ 272 178 (14) 77 509 (33)
– plus interest, leasing, rent $ 43 221 (23) 14 358 (25)
Profit at full equity $ 315 399 (12) 91 867 (28)
Capital (excl. quota and licences) $ 925 212 (3) 938 199 (4)
Capital (incl. quota and licences) $ 3 563 210 (4) 3 471 157 (4)Rate of return to boat capital b % 34 (11) 10 (37
)Rate of return to full equity c % 9 (12) 3 (40
)Population no. 53 – 55 –Sample no. 31 – 31 –a Depreciation adjusted for profit or loss on capital items sold. b Excluding value of quota and licences. c Including value of quota and licences.Note: Figures in parentheses are relative standard errors (RSEs). For any given standard error, an RSE will be higher for estimates closer to zero. A guide to interpreting RSEs is included in Appendix A.
11
Australian fisheries economic indicators report 2013: Northern Prawn Fishery
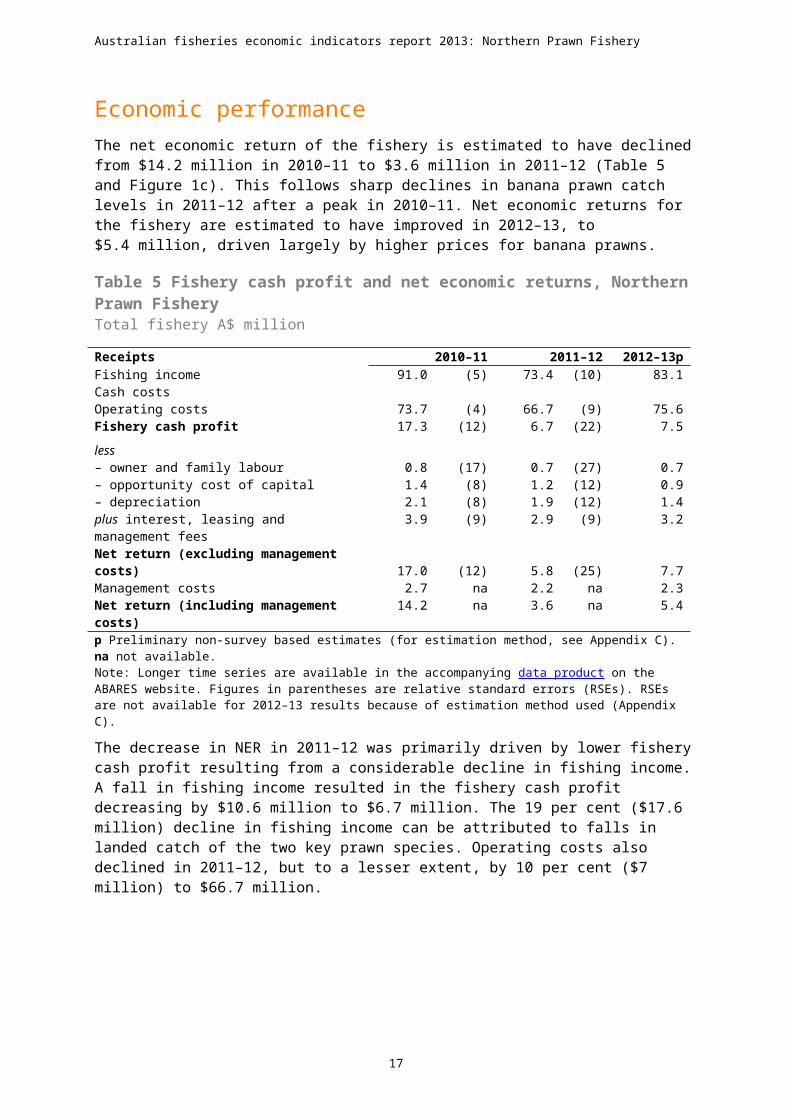
Economic performanceThe net economic return of the fishery is estimated to have declined from $14.2 million in 2010–11 to $3.6 million in 2011–12 (Table 5 and Figure 1c). This follows sharp declines in banana prawn catch levels in 2011–12 after a peak in 2010–11. Net economic returns for the fishery are estimated to have improved in 2012–13, to $5.4 million, driven largely by higher prices for banana prawns.
Table 5 Fishery cash profit and net economic returns, Northern Prawn FisheryTotal fishery A$ million
Receipts 2010–11 2011–12 2012–13pFishing income 91.0 (5) 73.4 (10) 83.1Cash costsOperating costs 73.7 (4) 66.7 (9) 75.6Fishery cash profit 17.3 (12) 6.7 (22) 7.5
less– owner and family labour 0.8 (17) 0.7 (27) 0.7– opportunity cost of capital 1.4 (8) 1.2 (12) 0.9– depreciation 2.1 (8) 1.9 (12) 1.4plus interest, leasing and management fees 3.9 (9) 2.9 (9) 3.2
Net return (excluding management costs) 17.0 (12) 5.8 (25) 7.7Management costs 2.7 na 2.2 na 2.3Net return (including management costs) 14.2 na 3.6 na 5.4p Preliminary non-survey based estimates (for estimation method, see Appendix C). na not available.Note: Longer time series are available in the accompanying data product on the ABARES website. Figures in parentheses are relative standard errors (RSEs). RSEs are not available for 2012–13 results because of estimation method used (Appendix C).
The decrease in NER in 2011–12 was primarily driven by lower fishery cash profit resulting from a considerable decline in fishing income. A fall in fishing income resulted in the fishery cash profit decreasing by $10.6 million to $6.7 million. The 19 per cent ($17.6 million) decline in fishing income can be attributed to falls in landed catch of the two key prawn species. Operating costs also declined in 2011–12, but to a lesser extent, by 10 per cent ($7 million) to $66.7 million.
12

Australian fisheries economic indicators report 2013: Northern Prawn Fishery
4 Productivity analysisTotal factor productivity (TFP) analysis of a fishery looks at the ability of fishers to convert inputs into outputs over time. Results from this analysis can assist in the evaluation of a fishery’s economic performance and provide understanding of the factors that drive changes in productivity. Changes in productivity generally reflect changes in a fishery’s operating environment, such as management settings that regulate technology choice of fishers, or changing market conditions. Market conditions include variations in input costs, import competition and changes in Australia’s terms of trade (appreciation or depreciation of the Australian dollar).
Changes in a fishery’s operating environment and market conditions can provide fishers with incentives to pursue vessel level productivity improvements. This may be required in order to keep the business financially viable; for example, to offset any negative effects on profitability from adverse market conditions such as increasing input costs or competition. Adverse market conditions can also help drive autonomous structural adjustment within the industry. In fisheries, this is often characterised by fishing rights moving to the most profitable fishers and the least efficient or least profitable vessels exiting the industry, resulting in a more productive residual fleet.
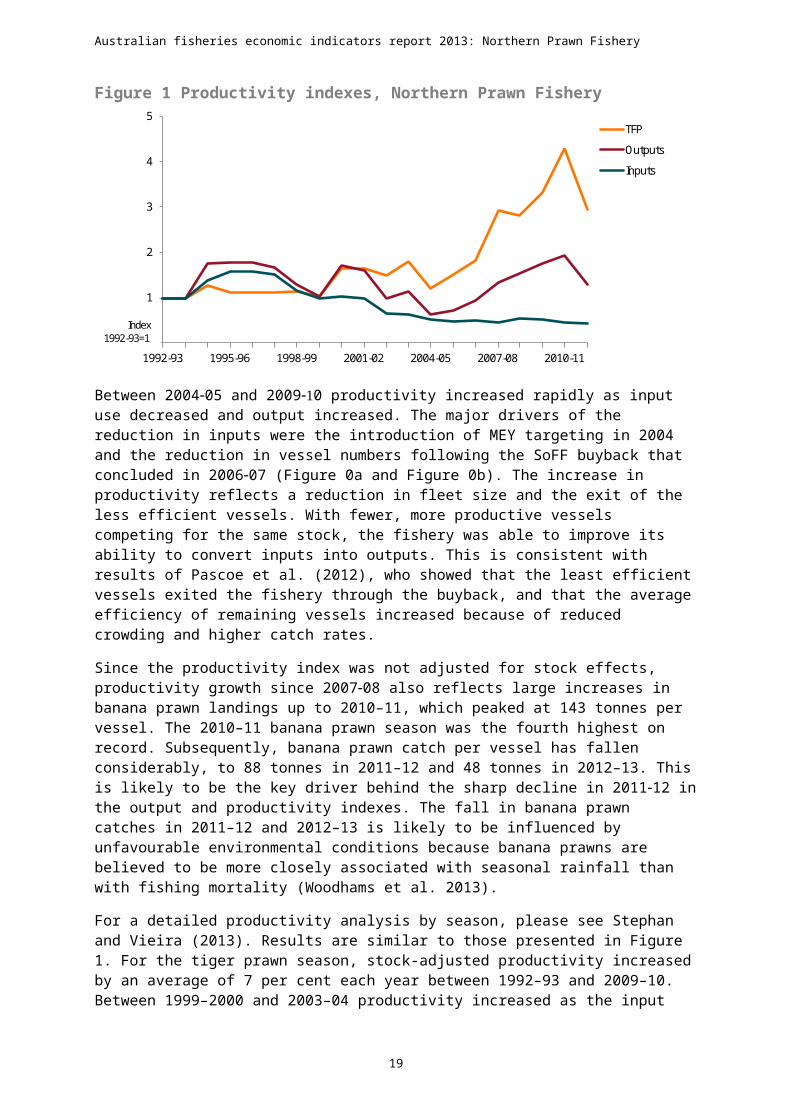
For the NPF, the analysis extended from 199293 to 201112. During this period, productivity increased by an average of 5.9 per cent each year (for index calculation method, see Appendix D). Between 199293 and 199900 the TFP index remained relatively close to one, as the input and output indexes moved similarly (Figure 1). From 199900 to 200405 the input index followed a decreasing trend, while the output index moved with fluctuations in landed catch of banana and endeavour prawns (Figure 1a). The drop in the input index in 200203 is primarily attributable to the 40 per cent reduction in effort in 200102, met through a 25 per cent reduction in total allowable headrope length and shortening of season (Figure 0a). As a result of movements in the output and input index, the productivity index varied around a declining trend over this period.
Figure 1 Productivity indexes, Northern Prawn Fishery
0
1
2
3
4
5
1992-93 1995-96 1998-99 2001-02 2004-05 2007-08 2010-11
TFP
Outputs
Inputs
Index 1992-93=1
Between 200405 and 20090 productivity increased rapidly as input use decreased and output increased. The major drivers of the reduction in inputs were the introduction of MEY targeting in 2004 and the reduction in vessel numbers following the SoFF buyback that concluded in
13
Australian fisheries economic indicators report 2013: Northern Prawn Fishery
200607 (Figure 0a and Figure 0b). The increase in productivity reflects a reduction in fleet size and the exit of the less efficient vessels. With fewer, more productive vessels competing for the same stock, the fishery was able to improve its ability to convert inputs into outputs. This is consistent with results of Pascoe et al. (2012), who showed that the least efficient vessels exited the fishery through the buyback, and that the average efficiency of remaining vessels increased because of reduced crowding and higher catch rates.
Since the productivity index was not adjusted for stock effects, productivity growth since 200708 also reflects large increases in banana prawn landings up to 2010–11, which peaked at 143 tonnes per vessel. The 2010–11 banana prawn season was the fourth highest on record. Subsequently, banana prawn catch per vessel has fallen considerably, to 88 tonnes in 2011–12 and 48 tonnes in 2012–13. This is likely to be the key driver behind the sharp decline in 201112 in the output and productivity indexes. The fall in banana prawn catches in 2011–12 and 2012–13 is likely to be influenced by unfavourable environmental conditions because banana prawns are believed to be more closely associated with seasonal rainfall than with fishing mortality (Woodhams et al. 2013).
For a detailed productivity analysis by season, please see Stephan and Vieira (2013). Results are similar to those presented in Figure 1. For the tiger prawn season, stock-adjusted productivity increased by an average of 7 per cent each year between 1992–93 and 2009–10. Between 1999–2000 and 2003–04 productivity increased as the input index decreased faster than the output index. For the banana prawn season, the annual average productivity growth of boats was 15 per cent between 1998 –99 and 2009–10. Most of the growth occurred between 2004–05 and 2009–10, primarily influenced by the increase in output.
14
Australian fisheries economic indicators report 2013: Northern Prawn Fishery
5 Other key indicatorsThis report also discusses other indicators that can provide information to management and policymakers; these indicators include profitability indexes, which give a breakdown of the factors driving profitability in a fishery, entitlement values and cost of managing the fishery. Commodity price, another form of indicator or tool that helps signal the value of the fishery resource, is used in the construction of other indicators such as profit and productivity indexes (Box 2).
Profitability indexes
A useful economic indicator that has been applied to the NPF in the past is provided by the profit decomposition analysis, covering 1998–99 to 2009–10 (Skirtun & Vieira 2012). The analysis quantified the main drivers of profit change over time and isolated the causes behind recent profitability increases in the fishery. Results from the analysis were split by fishing season. The key finding was that profitability increases between 2005–06 and 2009–10 were primarily driven by increases in productivity (Figure 2 and Figure 3). That is, an improved ability of fishers to produce greater output from their fixed capital input.
Index values are computed relative to the reference vessel, which is the average vessel in the most profitable year for each season. This was 2000–01 for the tiger and banana prawn seasons. When comparing index values against the reference vessel for output price (Po), fuel price (Pf ), labour price (Pl) and productivity (R) or stock-adjusted productivity (R s), the following interpretation should be used:
where an index has a value less than one, the positive contribution of that index to profit is less than that of the reference vessel
where an index has a value greater than one, the positive contribution of that index to profit is greater than that of the reference vessel.
For the tiger prawn season, stock-adjusted profit for the average vessel followed a decreasing trend from 2000–01 to 2004–05 (Figure 2). It then gradually recovered but remained well below levels in 2000–01. The main driver behind the decline in stock-adjusted profit was output prices; falling prices had a strong negative influence on profit from 2000–01 to 2009–10. However, substantial improvements in stock-adjusted productivity since 2005–06 have increased stock-adjusted profit. While fuel prices have had a negative influence on stock-adjusted profit since 2004–05, this is minor relative to the influence of output prices and productivity.
For the banana prawn season, profitability for the average vessel fell between 2000–01 and 2004–05 (Figure 3). Like the tiger prawn season, this decline in profitability was primarily driven by output prices. Since 2006–07 profitability in the banana prawn season has improved, with productivity being the key driver and the contribution to profit from output prices remaining low. As observed in the tiger prawn sector, fuel prices had a negative influence on profit but were of less importance relative to output prices and productivity.
15
Australian fisheries economic indicators report 2013: Northern Prawn Fishery
Figure 2 Key indexes for vessels, Northern Prawn fishery tiger prawn seasonAverage by financial year
0.00
0.50
1.00
1.50
2.00
2.50
Inde
x val
ue re
lativ
e to
refe
renc
e ve
ssel
θs
Po
Pl
Pf
Rs
Note: θ s is the stock adjusted profit index, Po is the price of output index, Pl is the price of labour index, Pf is the price of
fuel index, K is the capital index and R s is the stock adjusted productivity index.
The contribution of productivity to profitability has been important for the NPF, given falling output prices. A contributing factor to productivity improvements was the Securing our Fishing Future structural adjustment package implemented in 2006, which is likely to have removed the less productive vessels from the fishery (Skirtun & Vieira 2012). For the tiger prawn component of the fishery, management of stocks against a MEY target is also likely to have contributed to productivity improvements. As no stock information was available for banana prawns, productivity growth in this component of the fishery also reflects large increases in banana prawn landings up to 2010–11.
Figure 3 Key indexes for vessels, Northern Prawn fishery the banana prawn seasonAverage by financial year
0.00
0.50
1.00
1.50
2.00
2.50
Inde
x val
ue re
lativ
e to
refe
renc
e ve
ssel
θ
Po
Pl
Pf
R
16
Australian fisheries economic indicators report 2013: Northern Prawn Fishery
Note: θ is the profit index, Po is the price of output index, Pl is the price of labour index, Pf is the price of fuel index, K is
the capital index and R is the productivity index.
Entitlement valuesOperating in the NPF requires two types of statutory fishing rights (SFRs): class B SFR (or boat SFR) and gear SFR. A class B SFR is required for commercial use of a trawl boat in the fishery, while the gear SFR controls the lengths of the operational headrope and footrope of the prawn trawl net (ComLaw 2012). Entitlement values are estimated from valuations that fishers operating in the NPF place on the two types of SFR. These valuations cannot be measured directly because of confidentiality in trading prices. Therefore, values estimated by fishers are usually subjective and may differ from operator to operator. ABARES started collecting estimated entitlement values in the 2011–12 NPF survey.
Entitlement values reflect underlying beliefs about the state of the fishery’s prawn stocks and expected prices for that stock. In general, entitlement values reflect expected vessel profitability in the fishery. Over time, changes in entitlement values can provide an indication of economic performance in the fishery. In 2011–12 the average estimated sale price of individual tradeable gear units in the NPF was $3 758, while the median price for a class B SFR was $185 185. On average, each boat operating in the fishery in 2011–12 held 714 gear SFRs. In the current survey, these estimates offer little information, as they are a single figure for a single year; however, it is hoped that the continuation of collection of such information will offer insights into a fisher’s perspective on the underlying performance of their fishery.
Management costsThe cost of management per active boat has followed an increasing trend from 2001–02 to 2010–11 (Figure 4). This corresponds to a reduction in the number of active boats from 118 to 54 between 2001–02 and 2010–11 (Figure 0b). The jump in average management cost after 2005–06 reflects the 36 per cent reduction in boat numbers between 2005–06 and 2007–08, resulting from the structural adjustment package. Higher management costs per vessel are a likely outcome when vessels exit a fishery. This is because at least some of the management costs are fixed in nature; that is, unrelated to the number of vessels operating, and become spread across fewer vessels. In 2011–12 average management costs per vessel declined sharply, by 23 per cent, to around $40 000 per vessel. In 2012–13 management costs per vessel increased marginally, by 2 per cent to $40 600 per vessel.
Similarly, management costs as a percentage of GVP fluctuated considerably over the last decade, from 1 per cent in 2001–02 to 4 per cent in 2006–07, before dropping back down to around 3 per cent in 2012–13. This was the result of changes in management costs and GVP over the same period (Figure 1b). The increase in management costs from $1.9 million in 2005–06 to $2.7 million in 2006–07 was the primary driver of the recent peak in management cost as a percentage of GVP in 2006–07. The increase in management cost as a percentage of GVP in recent years compared with the 1990s and early 2000s is mainly attributable to the fall in fishery GVP since 2000–01 (see Figure 1c). This decline in GVP was caused by market conditions outside the control of management. From 2007–08 to 2012–13 management costs as a percentage of GVP declined slightly, to average around 3 per cent.
17
Australian fisheries economic indicators report 2013: Northern Prawn Fishery
Figure 4 Management cost per active boat and as share of GVP
0
1
2
3
4
5
0
10
20
30
40
50
60
1992–93 1996–97 2000–01 2004–05 2008–09 2012–13p
Man
agem
ent c
ost
as a
per
cent
age
of G
VP
Man
agem
ent c
ost
per a
ctive
boa
t Management cost per active boat
Management cost as a percentage of GVP
p Preliminary.
18
2012–13 $'000
Australian fisheries economic indicators report 2013: Northern Prawn Fishery
Box 2 Prawn prices forecastsPrices play an important role in calculating trends in fishery profitability, as indicated in the profit decomposition analysis. Price information is essential in a range of analyses and modelling, including profit estimation and MEY targeting/catch trigger models. This is because the objective of MEY or any profit maximisation models is to find the level of catch that maximises the difference between revenue and cost, or in marginal terms, equates prices received with marginal cost.
Therefore, price and cost information can play an important role in informing fishery management. Aside from maximising profitability, prices are also key inputs in fishery GVP estimations and individual commodity production value forecasts, both of which are important indicators in their own right.
ABARES calculates and validates prices used in the calculation of GVP for Commonwealth and state fisheries. ABARES also provides commodity production forecasts in its quarterly Agriculture commodities series, including five-year forecasts in the March quarter issue. Recently, ABARES has begun more forward-looking price estimation to help inform management decisions.
For every commodity, several factors drive price changes. These range from economy-wide factors (such as national income, the exchange rate and inflation) to commodity specific drivers (such as quantity of landed catch and price of domestic and import substitutes). The price estimation models developed by ABARES follow the ordinary least squares estimation method and take into consideration all relevant factors affecting commodity prices, including time-lagged variables.
For tiger prawn prices, the regression model that best fits the data (time series from 1994–95 to 2012–13) included only the price of frozen prawn imports and the quantity of tiger prawn catch because no other variable was statistically significant in improving the model fit. For banana prawns, the variables that were significant in influencing price included banana prawn catch, the one period lag of banana prawn catch, national income, tiger prawn price and the one period lag of frozen prawn import price. The results from these models are displayed in Table 6 and Table 7.
Table 6 Regression model for tiger prawn price, Northern Prawn FisheryVariable Estimate Std. error t-statistic Pr(>|t|) Significance
Intercept 6.696 3.354 1.996 0.06 *
Tiger catch –2.136 1.05 -2.034 0.06 *
Import price 1.52 0.332 4.576 0 ***
R2 0.56 – – – –Prob(F-stat) 0 – – – –
Note: Significance codes: ‘***’ 0.01, ‘**’ 0.05, ‘*’ 0.10.
The signs on the coefficient estimates appear to be economically intuitive. For instance, a higher supply of tiger prawn catch is expected to have a negative impact on its price. Similarly for banana prawns, the price model predicts that the quantity caught in the current and the preceding seasons (which can fluctuate considerably) will have a negative effect on its price, while the price of its domestic and import substitute is expected to have a positive influence.
This result is reasonable for commodities facing price competition (strategic complements); in other words, an increase in the price of tiger prawns or frozen prawn imports will allow suppliers of banana prawns to increase their price without losing competitiveness. In addition, higher national income is likely to lead to increased purchase of banana prawns, hence putting upward pressure on its price.
continued…
19
Australian fisheries economic indicators report 2013: Northern Prawn Fishery
Box 2 Prawn prices forecasts continued
Table 7 Regression model for banana prawn price, Northern Prawn FisheryVariable Estimate Std. error t-statistic Pr(>|t|) Significance
Intercept -3.606 2.355 -1.532 0.15
Banana catch -0.599 0.137 -4.384 0 ***
Banana catch (-1) -0.317 0.153 -2.078 0.06 *
GDP 5.156 1.262 4.084 0 ***
Import price (-1) 0.699 0.109 6.438 0 ***
Tiger price 0.188 0.048 3.946 0 ***
R2 0.86 – – – –F p-value 0 – – – –
Note: Significance codes: ‘***’ 0.001, ‘**’ 0.01, ‘*’ 0.05.
The coefficient of determination or R2 represents the explanatory power of the regression model. It indicates the percentage of variation in the estimated variable that can be explained by the independent factors (such as catch, price of substitutes and income). For the tiger prawn price model, this is 56 per cent, while explanatory power of the banana prawn price model is 86 per cent. This suggests that for banana prawn prices, the regression model can estimate price fairly well; however, for the tiger prawn price model, the estimation is expected to be less accurate. Several diagnostic tests for model fit were run on both regression models, including tests for autocorrelation, heteroskedasticity and the Ramsey RESET model fit test. All tests showed that both models are statistically sound, with no irregularities detected in the residuals.
Figure 5 Pseudo out-of-sample forecast, tiger prawn prices
10
15
20
25
30
35
Tige
r pra
wn
price
(nom
inal
$/k
g)
Forecast
Actual
Although model fit ensures the estimation model fits the given data in the best way, it does not provide any measure of forecast accuracy. To examine the forecasting ability of the two models, pseudo out-of-sample forecasts were carried out. The results are illustrated in Figure 5 and Figure 6. Data from 1994–95 to 2009–10 were used to estimate the coefficients of the variables listed in Table 6 and Table 7. These coefficients are not the same as those reported in Table 6 and Table 7 because of differences in the data range used for estimation. The coefficients from the in-sample estimations were applied to known values of the independent factors in 2010–11, 2011–12 and 2012–13 to get forecasted values for tiger and banana prawns. With out-of-sample forecasts, predicted values that are further out are generally associated with the larger error.
continued…
20
Australian fisheries economic indicators report 2013: Northern Prawn Fishery
Box 2 Prawn prices forecasts continued
Figure 6 Pseudo out-of-sample forecast, banana prawn prices
6
8
10
12
14
16
Bana
na p
raw
n pr
ice (n
omin
al $
/kg) Forecast
Actual
Both models using data up to 2009–10 perform reasonably well out-of-sample. As expected from the R2, the banana prawn price model appears to perform better than the tiger prawn price model, which seems to predict a dollar or two higher than the actual price. Applying the coefficients from the full model (data up to 2012–13) in Table 6 and Table 7, the actual and fitted price estimates for 2012–13 and the forecast for 2013–14 are shown in Table 8.
Table 8 Actual and fitted price estimates, banana and tiger prawns, 2012–13Commodity price ($/kg) 2012–13 actual 2012–13 fitted 2013–14 forecastBanana prawn price $12.66 $11.97 $11.32Tiger prawn price $19.44 $19.68 $19.93
Given that shrimp prices on the international market are steadily rising in 2013–14 as a result of a shock in supply, the forecasted values in the Table 8 are likely to be undervalued (IMF 2014). A number of other factors may also influence prawn prices, such as global supply. However, it is not always possible to get accurate and consistent data for estimation purposes. Moreover, ordinary least squares regression models are most suited to estimating averages rather than coping with shocks in the system.
21

Australian fisheries economic indicators report 2013: Northern Prawn Fishery
6 Performance against management objectives
The targeting of MEY across the key species caught in NPF is consistent with the economic objective of maximising economic returns. For the tiger prawn season, this involves using a bio-economic model to estimate annual fishing effort required to move stock biomass to that associated with MEY. Blue endeavour prawns and both species of tiger prawn and are estimated to be below stock biomass levels associated with MEY, although all are close to or above levels that are associated with maximum sustainable yield (AFMA 2013c). For banana prawns, where the drivers of stock recruitment are poorly understood, management will begin to more explicitly target MEY in the 2014 season using an in-season catch trigger that is aligned with achieving a MEY (AFMA 2013a, b).
The cost of constructing bio-economic models to estimate stock biomass associated with MEY is often high and the modelling process requires extensive amounts of data on biological and economic aspects of the fishery. In contrast, the range of economic indicators constructed by ABARES can provide a lower cost alternative for assessing the performance of Commonwealth fisheries. While some indicators complement each other, others are informative on their own. For the NPF, these indicators can help managers monitor the performance against management objectives by offering an additional set of information to the formal MEY targeting already underway for the fishery.
For the NPF as a whole, the real NER have remained positive in the years following 2006–07, peaking at $15 million in 2010–11. In 2011–12 NER fell by over $10 million to $3.6 million, largely because of lower landings of banana prawns. Economic returns are estimated to have increased in 2012–13, to $5.4 million. This increase was driven by higher projected fishing income arising from an increase in the average price received for banana prawns.
Aside from the NER, this report also illustrates a range of other indicators applied to the NPF, many of which show a consistent improvement in the economic performance of the fishery. Both the productivity analysis and the profit decomposition showed an increase in productivity and profitability since the introduction of MEY targeting in 2004–05. Productivity continued to improve more significantly after 2006–07; this is likely to be the result of the SoFF structural adjustment package, which aimed to remove excess capital in the fishery and promote autonomous adjustment. In 2011–12 productivity declined as a result of a fall in the output index, mainly because of a 36 per cent decline in banana prawn catch following an exceptionally good season in 2010–11.
The cost of managing the fishery, as a ratio per active vessel, fell sharply in 2011–12. While these costs remain higher on a per vessel basis than those in the 1990s and early 2000s, management costs are being shared among a smaller number of vessels: 55 vessels in 2011–12 compared with an average of 128 vessels between 1992–93 and 2001–02. The increase in management costs per active vessel in 2006–07 was primarily the result of a 36 per cent reduction in boat numbers that resulted from the structural adjustment package. Similarly, the increase in management costs as a share of GVP earned in the fishery in 2006–07 mainly reflects a fall in total catch (and in turn revenue) as a result of the reduction in vessel numbers in the fishery. Since then, management cost as a share of GVP has stabilised to average around 3 per cent. Given these factors, it is difficult to conclude whether management has become more or less cost-efficient over the last decade.
22
Australian fisheries economic indicators report 2013: Northern Prawn Fishery
To better assist fishery managers to meet their economic objective, ABARES is developing other indicators, including a time series of entitlement values, as well as price forecasts of tiger and banana prawns. These will help provide some indication of the changes in the value of fishery resources over time and contribute to economic and statistical models that aim to inform policy and management decisions.
23
Australian fisheries economic indicators report 2013: Northern Prawn Fishery
Appendix A: Survey definitionsThis appendix provides definitions of key financial performance variables, net economic returns (NER) and the ABARES method of calculating NER. Use of NER as an indicator of economic performance is briefly discussed.
Financial performanceThe definitions of key variables used in the analysis of boat-level financial performance are:
Total cash receipts represent returns from the sale of fish, from non-fishing activities, including charter operations, and from other sources (insurance claims and compensation, quota and/or endorsements leased out, government assistance and any other revenue) in the financial year.
For most operators, this information is readily available from their own records. However, different operators record their fishing income in different ways. In some cases, such as where fish are sold through a cooperative, some operators may only record payments received from the cooperative. These payments may be net of commissions and freight, as well as net of other purchases made through the cooperative.
In other cases, the cooperative or agency pays the crew directly for the catch; the owner’s financial records might include only the revenues received after the crew’s share has been deducted.
For these reasons, operators are asked to provide a breakdown of the total catch of their boat and an estimate of the total value of that catch. For consistency, marketing charges may need to be added back into fishing receipts for some boats, to give a gross value. Where this is necessary, these selling costs are also added into the cost estimates to offset the new revenue figure. Receipts also include amounts received in the survey year for fish sold in previous years.
Total cash costs include payments made for both permanent and casual hired labour and payments for materials and services (including payments on capital items subject to leasing, rent, interest, licence fees and repairs and maintenance). Capital and household expenditures are excluded.
Labour costs are often the highest cash cost in the fishing operation. Labour costs include wages and an estimated value for owner/partner, family and unpaid labour. Labour costs cover the cost of labour involved in boat-related aspects of the fishing business, such as crew or onshore administration costs, but do not cover the cost of onshore labour involved in processing fisheries products.
On many boats, the costs of labour are reflected in wages paid by boat owners and/or in the share of the catch they earn. However, in some cases, such as where owner–skippers are involved, or where family members work in the fishing operation, payments made can be low or even nil, which will not always reflect the market value of the labour provided. To allow for this possible underestimation, all owner/partner and family labour costs are based on estimates collected at the interview of what it would cost to employ someone else to do the work.
Boat cash income is the difference between total cash receipts and total cash costs.
Depreciation costs have been estimated using the diminishing value method based on the current replacement cost and age of each item. The rates applied are the standard rates allowed
24

NR = R – CC – OWNFL + ILR – OppK – DEP + recMC – totM
operating costs capital cost management costscash receipt
Australian fisheries economic indicators report 2013: Northern Prawn Fishery
by the Commissioner of Taxation. For items purchased or sold during the survey year, depreciation is assessed as if the transaction had taken place at the midpoint of the year. This method of calculating depreciation is also used in other ABARES industry surveys.
Boat business profit is boat cash income less depreciation.
Profit at full equity is boat profit, plus rent, interest and lease payments.
Capital is the value placed on the assets employed by the owning business of the surveyed boat. It includes the value of the boat, hull, engine and other onboard equipment (including gear). Estimates are also reported for the value of quotas and endorsements held by the surveyed boat. Estimates of the value of capital are based on the market value of capital and are usually obtained at interview. However, in some cases quota and endorsement values are obtained from industry sources.
Depreciated replacement value is the depreciated capital value based on the current age and replacement values of the boat and gear. The value of quota and endorsements held is not included in the estimate.
Rate of return to boat capital is calculated as if the proprietors owned all fishing assets. This enables financial performance of sample boats to be compared regardless of proprietors’ equity in the business. Rate of return to boat capital is calculated by expressing profit at full equity as a percentage of total capital (excluding quota and licence value).
Rate of return to full equity is calculated by expressing profit at full equity as a percentage of total capital (including quota and licence value).
Net economic returnsNet economic returns are the long-run profits from a fishery after all costs have been met, including fuel, crew costs, repairs, the opportunity cost of family and owner labour, fishery management costs, depreciation and the opportunity cost of capital.
More specifically, a fishery’s net economic return for a given period can be defined as:
Where:NR = net returnsR = total cash receipts attributable to the fishery, excluding leasing incomeCC = total cash costs attributable to the fishery, including recovered
management costsOWNFL= imputed cost of owner and family labourILR = interest and quota/permit leasing costsOppK = opportunity cost of capitalDEP = depreciationrecMC = recovered management coststotMC = total management costs.
25

Australian fisheries economic indicators report 2013: Northern Prawn Fishery
Note that recovered management costs are those management costs paid by industry through management fees and are included in total cash costs (CC). These costs are removed (as indicated by ‘+ recMC’) to prevent double counting, given that these costs are a component of total management costs. Similarly, interest and quota/permit leasing costs are removed (indicated by ‘+ ILR’) because these costs at the fishery level represent revenues that have been redistributed to external investors in the fishery.
Survey-based estimation of net economic returns
Fish sale receiptsFish sale receipts are usually taken from fishers’ financial accounts. Where a fisher operates in more than one fishery, they are asked to indicate what proportion of total fish sales is attributable to the fishery being surveyed. Any freight or marketing costs must also be deducted. This provides an estimate of net fishing receipts that incorporates only the ‘beach price’ that has been received for the catch; that is, the price received for fish at its first landing point.
Income received from leasing out quota and licences is not included as income in calculating net economic returns. This item represents a redistribution of profits among investors in the fishery. Also, the amount a fisher earns from leasing out quota and licences relates to the amount of profits the fishery is generating. Including leasing revenue would therefore result in double counting.
Operating costsOperating costs include day-to-day operational expenses incurred to harvest fish in the fishery. Cash costs (CC) are a component of operating costs that includes those cost items that are easily identified in fishers’ accounts, such as fuel, repairs and gear replacement.
Labour costs are often specified in fishers’ accounts as wages. However, in calculating net returns, an estimate of the opportunity cost of labour is needed. The opportunity cost of labour is the wage that could have been earned performing a similar role elsewhere. Where a market wage is paid, it is assumed to represent the opportunity cost of labour and is included in the cash costs component of operating costs. The opportunity cost of owner and family labour is not easily identifiable in fishers’ accounts. Often owners and their families are involved in operating a boat, either as skippers and crew or onshore as accountants and shore managers. While some will be paid market value for their labour, some will not be paid at all and others paid very high amounts, often as ‘director fees’ or ‘manager fees’. In these cases, ABARES survey officers ask survey respondents to estimate the market value of owner and family labour; that is, the amount that would need to be paid to employ a non-family member to fulfil the same position. This amount is entered as a component of operating costs (OWNFL).
Quota and licence leasing costs and interest expenses are included in cash costs. However, these costs must be removed from calculation of net returns for the same reason they are excluded from income (see ‘Fish sale receipts’ in the previous section).
Capital costsTo calculate capital costs, an estimate of the value of capital is needed. ABARES survey officers ask fishers to provide information for all capital items associated with the fishing business (including hull, engine, onboard equipment, vehicles and sheds). Information collected for each item includes the year the capital item was manufactured and an estimate of what it would cost to replace that item with a new equivalent item. By accounting for previous depreciation and
26
Australian fisheries economic indicators report 2013: Northern Prawn Fishery
inflation, these data are used to estimate the total value of capital invested in the fishery for the survey year.
As mentioned, capital costs include the opportunity cost of capital (OppK) and depreciation (DEP). The opportunity cost of capital is the return that could have been earned if capital was invested elsewhere, rather than in the fishery. This cost is not identifiable in fishers’ accounts. A real interest rate that represents the long-term average rate of return that could be earned on an investment elsewhere is applied to the value of capital in the fishery. For fisheries surveys, ABARES uses a rate of 7 per cent per year.
Depreciation expense is the cost of capital becoming less valuable over time as a result of wear and tear and obsolescence. Depreciation expense is not consistently identifiable in fishers’ accounts, so ABARES calculates annual depreciation of boats based on the capital inventory list collected during the surveys and predetermined depreciation rates for each capital item type.
Management costsManagement costs are incurred to ensure the fishery continues operating and are therefore costs associated with harvesting fish in the fishery. Management costs comprise two components: recovered management costs and non-recovered management costs. Recovered management costs (recMC) are those costs recovered from fishers and appear in the accounts of fishers as payments of management fees or levies. Non-recovered management costs are those management costs that are not charged to fishers, but instead are covered by the managing body or government. Calculation of net economic returns requires deduction of total management costs, which is the sum of these two components.
Total cash costs (CC) includes an estimate of recovered management costs based on management levy expenses contained in fishers’ accounts. As this estimate of recovered management costs is based only on a sample of the fishery, it may not be consistent with the actual value of management costs recovered from the entire fishery. AFMA is able to provide an estimate of total management costs for each fishery; that is, the sum of both recovered and non-recovered management costs. For these reasons, recovered management costs from fishers’ accounts are ignored (as indicated by +recMC in the net returns equation). Then, total management costs (totM) supplied by AFMA are used to estimate net economic returns.
Net economic returns and economic performanceFishery managers, policy and decision-makers require information on fisheries’ performance for achieving the objective of maximising net economic returns from use of fish stocks—an objective commonly referred to as MEY. If a fishery is operating at MEY, effort, catch and stocks are at levels where the difference between discounted revenues and costs, and therefore profits, are maximised. The term ‘discounted’ means that the difference in the value of a dollar earned today relative to a dollar in the future is accounted for. Although estimates of NER do not reveal how a fishery is performing relative to its maximum potential, positive trends in NER, together with other indicators, suggest that the MEY objective is closer to being met.
27

Australian fisheries economic indicators report 2013: Northern Prawn Fishery
Appendix B: Survey methodsCollecting economic survey dataABARES has undertaken economic surveys of selected Commonwealth fisheries since the early 1980s. These have been done on a regular basis for particular fisheries since 1992. The current fisheries survey program involves surveying major Commonwealth fisheries every few years; or more frequently where the fishery is undergoing major changes and monitoring is particularly important. The aim is to develop a consistent time series of economic information for each fishery. Such information, in conjunction with scientific assessments of each fishery, is vital for assessing fisheries’ economic performance.
Survey information is made publicly available so the performance of fisheries and the effect of management policies can be independently assessed.
Sample designABARES surveys are designed and samples selected on the basis of information provided by AFMA. This information includes data on the volume of catch, fishing effort and boat characteristics.
Because it is not possible to survey all boats in a fishery, a representative sample of boats is selected. Where possible, boats are classified into subgroups based either on the fishing method used (longline, purse seine and trawl) or on the size of operations (small, medium and large producers). A minimum number of representative boats from each subgroup are then targeted for the survey.
In practice, this sample is seldom fully realised. Non-response is relatively high across fishery surveys, reflecting the difficulty in contacting some operators and a reluctance of others to participate. This may bias the results; for example, if a significant difference exists between the profitability of respondents and non-respondents. Sample design and weighting systems have been developed that reduce the non-response effect, but care is still needed when interpreting survey information.
Between February and August, an ABARES officer visits the owner of each boat selected in the sample. The officer interviews the boat owner to obtain physical and financial details of the fishing business for the survey years. When necessary the skipper of the boat is also interviewed. Further information is subsequently obtained from accountants, selling agents and marketing organisations on the signed authority of survey respondents.
Information obtained from various sources is reconciled to produce the most accurate description possible of the financial characteristics of each sample boat in the survey.
Sample weightingAll population estimates presented in this report are calculated from the weighted survey data of sample boats. A weight is calculated for each boat in the sample based on how representative that boat is in the population. Sample weights are calculated such that the weights sum to the population of boats that the sample is representing, and the weighted sum of catch reported by the sample boats approximates as closely as possible the total catch for the fishery according to AFMA logbook data.
28
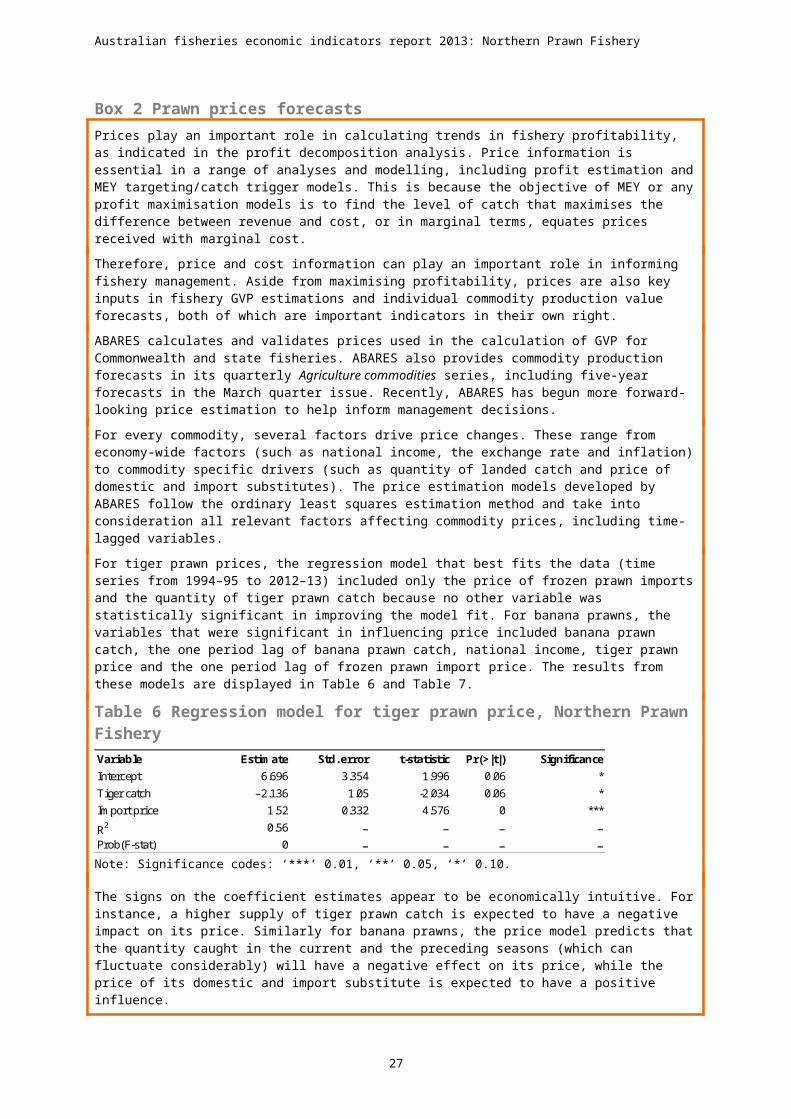
Australian fisheries economic indicators report 2013: Northern Prawn Fishery
That is,
∑ wi=P and ∑ wi xi=X
where:
wi is the weight for the ith boat
P is the number of boats in the population
xi is the catch for the ith boat
X is the total catch for the target population.
Technical details of the method of weighting used are given in Bardsley and Chambers (1984).
Reliability of estimatesA relatively small number of boats out of the total number in a particular fishery are surveyed. Estimates derived from these boats are likely to be different from those that would have been obtained if information had been collected from a census of all boats. How closely the survey results represent the population is influenced by the number of boats in the sample, the variability of boats in the population and, most importantly, the design of the survey and the estimation procedures used.
To give a guide to the reliability of the survey estimates, measures of sampling variation have been calculated. These measures, expressed as percentages of the survey estimates and termed relative standard errors, are given next to each estimate in parentheses. In general, the smaller the relative standard error, the more reliable the estimate.
Use of relative standard errorsRelative standard errors can be used to calculate ‘confidence intervals’ for the survey estimate. First, calculate the standard error by multiplying the relative standard error by the survey estimate and dividing by 100. For example, if average total cash receipts are estimated to be $100 000, with a relative standard error of 6 per cent, the standard error for this estimate is $6000.
There is roughly a two-in-three chance that the ‘census value’ (the value that would have been obtained if all boats in the target population had been surveyed) is within one standard error of the survey estimate. There is roughly a 19-in-20 chance that the census value is within two standard errors of the survey estimates. Thus, in this example, there is approximately a two-in-three chance that the census value is between $94 000 and $106 000, and approximately a 19-in-20 chance that the census value is between $88 000 and $112 000.
Comparing estimatesWhen comparing estimates across groups or years, it is important to recognise that the differences are also subject to sampling error. As a basic principle, a conservative estimate of the standard error of the difference can be constructed by adding the squares of the estimated standard errors of the component estimates and then taking the square root of the result.
For example, suppose the estimates of total cash receipts were $100 000 in one year and $125 000 in the previous year—a difference of $25 000—and the relative standard error is given as 6 per cent for each estimate. The standard error of the difference can be estimated as:
29

Australian fisheries economic indicators report 2013: Northern Prawn Fishery
√ (0.06∗$100000 )2+ (0.06∗$125000 )2=$9605
The relative standard error of the difference is:
($9605/ $25000 )∗100=38%
There may be changes in the population of a fishery from one year to the next. If these population changes are substantial, differences in estimates may be caused more by the changes in population than by changes in the variables themselves.
Non-sampling errorsThe values obtained in a survey may be affected by errors other than those directly related to the sampling procedure. For example, it may not be possible to obtain information from certain respondents, respondents may provide inaccurate information or respondents may differ from non-respondents for a particular variable being surveyed.
In conducting surveys, ABARES draws on a depth of experience. Survey staff are generally experienced and undergo rigorous pre-survey training, aimed at minimising non-sampling errors. However, when drawing inferences from estimates derived from sample surveys, users should remember that both sampling and non-sampling errors occur.
30
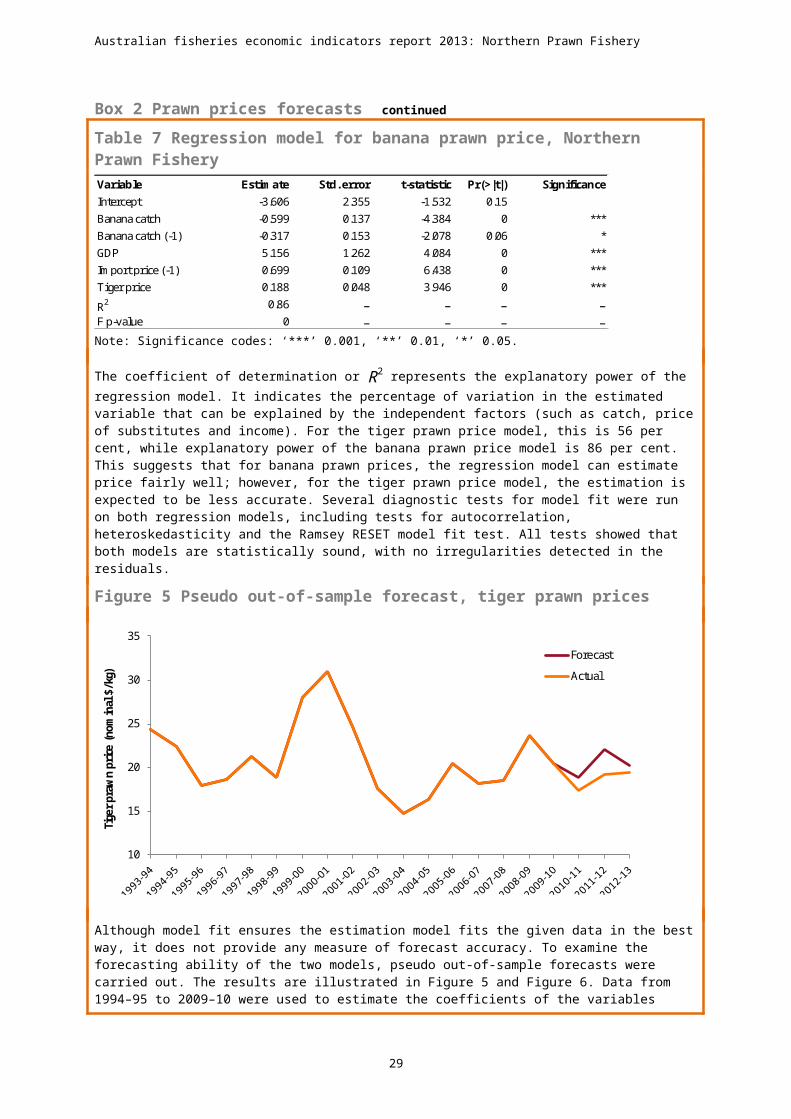
Australian fisheries economic indicators report 2013: Northern Prawn Fishery
Appendix C: Non-survey based estimation of net economic returnsABARES has developed a non–survey based method of estimating net economic returns for financial years where survey data are not yet available. It allows more timely estimation and reporting of net economic return estimates that can better inform industry and government decision-making. This method is intended to complement collection of data and publication of results normally undertaken through the fisheries surveys.
MethodThe method used to calculate non-survey based estimates of net economic returns for a non-survey year (a year for which no survey data are available) utilises regression estimates for key components of net economic return. Regression approaches use the most relevant variables for each fishery, given the unique fishing methods and other characteristics. In all cases, each component is estimated based on an assumed sample of the population and a set of corresponding assumed weights. This assumed sample represents those boats that are expected to be sampled for 2012–13 in the next survey.
Reliability of estimatesEstimates from the regression analysis are subject to uncertainties. First, relationships estimated between surveyed values of receipts and costs and other more readily available data relies on the historical sample of boats surveyed. Therefore, if boats are consistently not included in a sample, they may be under-represented in the estimates.
Uncertainty also surrounds the validity of historical relationships to hold in the most recent year. Operating conditions in the fishery may change, resulting in changes in receipts and costs not foreseeable using this method.
Estimates should be used as an indication of the likely direction and magnitude of changes in net economic return. For each receipt and cost category, the coefficient of determination (R2) gives an indication of the extent to which the explanatory variables can explain variation in the dependent variable. Lower coefficients of determination suggest a greater level of uncertainty surrounding the estimates.
Cash receiptsCash receipts is the primary component of net economic return calculations because all other costs are deducted from cash receipts. Cash receipts represents income from fishing operations in the surveyed fishery. Therefore, for non-survey years, GVP is a good indicator for cash receipts as it bears close relationship with fishing income. Preliminary estimates of GVP were made using average price data and catch data.
Variables included for each fishery are: preliminary GVP time trend.
31

Australian fisheries economic indicators report 2013: Northern Prawn Fishery
Table C0 Regression model for average cash receipts, Northern Prawn FisheryVariable Estimate Std. error t-statistic Pr(>|t|) SignificanceIntercept 2.91e+05 3.99e+4 7.286 0.00 ***GVP 8.44e-01 2.40e-02 35.139 0.00 ***Boat dummy –3.51e+05 1.09e+05 –3.217 0.00 ***R2 0.74 Prob(F-stat) 0.00
Note: Significance codes: ‘***’ 0.001, ‘**’ 0.01, ‘*’ 0.05.
Operating costsKey drivers of operating costs in any fishery are fuel and labour. Therefore, accurately calculating operating costs for a non-survey year requires selecting variables that influence these two components. For labour, share payment systems imply a close relationship between fishery GVP and labour costs. In contrast, fuel costs depend largely on the hours trawled and distance travelled in the NPF. Hence, preliminary estimates of operating cost were based on (see Table C1 for full regression):
GVP travel distance (based on logbook and unloading position data) hours trawled.
Table C1 Regression model for average operating costs, Northern Prawn FisheryVariable Estimate Std. error t-statistic Pr(>|t|) SignificanceIntercept 6.03e+05 4.51e+04 13.364 0.00 ***GVP 4.73e-01 2.32e-02 20.391 0.00 ***Distance 2.36e-01 4.94e-01 4.773 0.00 ***Hours Trawled –7.43e+00 3.09e+01 –0.241 0.81 –Boat dummy –1.92e+05 3.96+04 –4.857 0.00 ***2010 dummy 3.51e+05 8.50e+04 4.129 0.00 ***R2 0.60 Prob(F-stat) 0.00
Note: Significance codes: ‘***’ 0.01, ‘**’ 0.05, ‘*’ 0.10.
Interest, leasing and management feesInterest and leasing fees represent a redistribution of profits to investors in the fishery. As such, they are not costs at the fishery level. They are estimated based on historical ratios and values.
Management fees for the purpose of the estimation are taken from AFMA (recovered and non-recovered) and include all costs involved with managing the fishery, not just those recovered from industry. Management fees are also estimated based on historical ratios and values.
Opportunity cost of capital and depreciationCapital values, the opportunity cost of capital and depreciation expenses were estimated based on an implied capital rate of 7 per cent and assuming a depreciation rate equal to that in the most recent survey year and a capital upgrade rate (an assumed capital investment amount).
Management costsTotal management costs (recovered and non-recovered) for 2012–13 were based on AFMA’s budgeted estimates.
32

Australian fisheries economic indicators report 2013: Northern Prawn Fishery
Appendix D: Productivity methodologyProductivity measurementProductivity is defined as the quantity of output produced with a given quantity of inputs. For example, a partial measure of productivity for a fishing vessel would be kilos of a particular species of fish produced per hook used. A more complete measure of productivity is the total catch per unit of all inputs used. This latter approach is preferred as a measure of productivity, and is usually referred to as total factor productivity.
Various methods have been developed to quantitatively assess total factor productivity trends for industries, and individual enterprises within industries (see Coelli et al. 2005 for discussion). A popular approach to measuring productivity trends uses index number theory. In this report a Fisher quantity index is used to measure total factor productivity trends for key Commonwealth fisheries (see Box D0). Fishery-level input, output and total factor productivity indexes were estimated for each of the Commonwealth fisheries analysed and for each year where data were available. The Fisher quantity index is well suited to handling the range of inputs and outputs recorded in ABARES fisheries economic survey data. For example, ABARES fisheries economic survey data contain many zero entries, which are well handled by the Fisher quantity index approach.
As with other index number approaches that measure productivity, the Fisher quantity index enables measurement of productivity trends with multiple inputs and outputs. The prices paid for inputs and received for outputs are used as weights to derive aggregations of outputs and inputs, which are expressed in index form. Output and input indexes are estimated using both Laspeyres and Paasche index approaches. A geometric mean of these indexes is derived to determine the Fisher output and input indexes. Total factor productivity is measured as the ratio of the Fisher output and Fisher input indexes.
DataThe data used for this total factor productivity analysis are sourced from the ABARES Australian Fisheries Surveys dataset. The surveys dataset comprises physical and financial survey data for a sample of vessels operating in key Commonwealth fisheries. The inputs incorporated in the input indexes for each fishery are labour, fuel, repairs and capital. The output indexes for each fishery are described in the results section for each individual fishery. Population estimates are derived using sample vessel data from this database, and are calculated for each of the fisheries analysed in this report. A weight is calculated for each boat in the sample, to represent its importance in the total unobserved population. The weight is generally based on the vessel’s catch representation. Weighted vessel level information is used to derive fishery level input and output indexes.
Stock biomass data were only available for the tiger prawn season of the Northern Prawn fishery (calculated by CSIRO and sourced from Pascoe 2012).
33
Australian fisheries economic indicators report 2013: Northern Prawn Fishery
Box D0 Fisher index
Using price and quantity data for a set of outputs (and separately for inputs), the Laspeyres quantity index Q0 t
L can be defined as:
Q0 tL =
∑i=1
Np i0q it
∑i=1
Npi 0qi 0
=∑i=1
NW i0
qitq i0
where
W i 0=p i0q i0
∑i=1
Np i0q i0
is the share of ith item in the total value of outputs or inputs in the base period (denoted by 0). The Laspeyres index compares a total quantity in time period (t) to a base period.
The Paasche index (Q0 tP
) is defined as:
Q0 tP =
∑i=1
Np itq it
∑i=1
Npit qi0
={∑i=1
NW it( q i0qit )}
−1
where
W it=pit qit
∑i=1
Np itq it
is the share of ith item in the total value of outputs or inputs in the current period (denoted by t). Like the Laspeyres index, the Paasche index compares a total quantity in time (t) to a base period(0).
The Fisher index (Q0 tF
) is the geometric mean of Laspeyres and Paasche indexes, defined as:
Q0 tF =√Q0tL Q0 tP
The TFP index can be calculated as the ratio of the Fisher output (Q0 tFO¿and input¿¿) indexes:
TFP0 t=Q0 tFO
Q0 tFI
34
Australian fisheries economic indicators report 2013: Northern Prawn Fishery
Total factor productivity inputs and outputsTotal inputs consist of 13 items that can be split into four major groups:
Capital costs—account for all capital items associated with the fishing business. These include the boat, hull, engine, onboard equipment, vehicles and sheds. The estimate of capital is based on the depreciated replacement value. The quantity variable used for all capital is the average value of capital stock deflated by the respective price index for each.
Fuel costs—include the costs of all fuel, oil and grease. The quantity variable used for all fuel is the average of fuel use deflated by the fuel price paid.
Labour—includes the number of crew employed in boat-related aspects of the fishing business, such as crew or onshore administration costs, but does not cover the cost of onshore labour involved in processing fisheries products. It covers owner/partner, family and unpaid labour.
Repairs—Repairs costs include boat and motor vehicle repairs, gear costs and other repairs expenditure. The quantity variable is the value of all repairs deflated by the price of repairs.
Outputs, on the other hand, are the species caught by vessels in each fishery. For the NPF, this is mainly tiger and banana prawns. The price variable is the price received for the species caught. The quantity variable is the kilograms of each species caught by individual vessels.
35
Australian fisheries economic indicators report 2013: Northern Prawn Fishery
ReferencesAFMA 2014a, Objectives, functions and powers, Australian Fisheries Management Authority, Canberra, available at afma.gov.au/about-us/functions-and-powers.
—— 2014b, Northern Prawn Fishery harvest strategy under input controls, Australian Fisheries Management Authority, Canberra, available at afma.gov.au/managing-our-fisheries/harvest-strategies/harvest-strategy-for-the-northern-prawn-fishery-under-input-controls.
—— 2013a, Northern Prawn Fishery management arrangements for 2013, Australian Fisheries Management Authority, Canberra, afma.gov.au/managing-our-fisheries/fisheries-a-to-z-index/northern-prawn-fishery/northern-prawn-fishery-management-arrangements-for-2013.
—— 2013b, Prawn future assured, Australian Fisheries Management Authority, Canberra, afma.gov.au/2013/11/prawn-future-assured/, last updated 1 November 2013.
—— 2013c, Status of the Northern Prawn Fishery Tiger Prawn Fishery at the end of 2012 with estimated TAE and TAC for 2013, Australian Fisheries Management Authority, Canberra.
Bardsley, P & Chambers, RL 1984, ‘Multipurpose estimation from unbalanced sampled’, Applied Statistics, vol. 33, pp. 290–99.
Coelli, TJ, Rao, DSP, O’Donnell, CJ & Battese, GE 2005, An introduction to efficiency and productivity analysis, 2nd edn, Springer, Berlin.
ComLaw 2012, Northern Prawn Fishery Management Plan 1995, registered 21 March 2012, Australian Government, Canberra, available at comlaw.gov.au/Details/F2012C00160.
DAFF 2007, Commonwealth Fisheries Harvest Strategy: Policy and Guidelines, Department of Agriculture, Fisheries and Forestry, Canberra, available at daff.gov.au/__data/assets/pdf_file/0004/397264/hsp.pdf (pdf 527kb).
IMF 2014, Monthly commodity prices, International Monetary Fund, Washington, DC, available at imf.org/external/np/res/commod/index.aspx.
Kompas, T & Che, TN, 2008, Maximum economic yield in the Southern and Eastern Scalefish and Shark Fishery, ABARE Report to the Fisheries Resources Research Fund, Australian Bureau of Agricultural and Resource Economics, Canberra, February.
—— 2004, A bioeconomic model of the Australian Northern Prawn Fishery: management options under uncertainty, ABARE, Australian Bureau of Agricultural and Resource Economics, Canberra.
Pascoe, S, Coglan, L, Punt, AE & Dichmont, CM 2012, ‘Impacts of vessel capacity reduction programmes on efficiency in fisheries: the case of Australia’s multispecies Northern Prawn Fishery’, Journal of Agricultural Economics, vol. 63 (2), pp 425–43.
Skirtun, M & Vieira, S 2012, Understanding the drivers of profitability in Commonwealth fisheries, ABARES technical report 12.4, Australian Bureau of Agricultural and Resource Economics and Sciences, Canberra, November, available at data.daff.gov.au/data/warehouse/9aam/2012/udpcfd9aame002/UnderstandDriveProfitCommFisheries201211_Ver1.0.0.pdf (pdf 2.59mb).
36
Australian fisheries economic indicators report 2013: Northern Prawn Fishery
Skirtun, M, Sahlqvist, P & Vieira, S 2013, Australian fisheries statistics 2012, FRDC project 2010/208, Australian Bureau of Agricultural and Resource Economics and Sciences, Canberra, November, available at daff.gov.au/data/warehouse/9aam/afstad9aamd003/2012/AustFishStats_2012_v1.0.0.pdf (pdf 5.71mb).
Stephan, M & Vieira, S 2013, Productivity analysis of key Commonwealth fisheries, ABARES technical report 13.09, Australian Bureau of Agricultural and Resource Economics and Sciences, Canberra, December.
Woodhams, J, Vieira, S & Stobutzki, I (eds) 2013, Fishery status reports 2012, Australian Bureau of Agricultural and Resource Economics and Sciences, Canberra.
37