key sources of uncertainty in forest carbon inventories raisa mäkipää with mikko peltoniemi, suvi...
TRANSCRIPT

Key sources of uncertainty in forest carbon inventories
Raisa Mäkipää withMikko Peltoniemi, Suvi Monni, Taru Palosuo,
Aleksi Lehtonen & Ilkka Savolainen
EU Workshop on Uncertainties in Greenhouse Gas Inventories 5-6 September 2005 Helsinki, Finland

• GHG reporting under the UNFCCC and Kyoto Protocol (KP)
• IPCC guidance for GHG reporting– 1996 revised guidelines– 2003 GPG for LULUCF sector (other sectors
already in 2000)– 2006 under expert review (from Sept 12)
Introduction

KP ->Need to improve inventories
• Completeness: all pools to be included• Consistency: time-series 1990-present• Transparency: default values, reporting• Accuracy: uncertainty analysis help to
priroritise efforts to improve inventories; uncertainty to be reduced as far as practicable

Inventories
• Land-use change– methods (sampling based NFI, remote sensing, land-
use statistics)– categories (definitions vs. monitroing system)– challenges e.g. initial C stocks and time of transition
• Forest remaining forest, major C stock and sink of LULUCF sector

Biomass carbon inventories
• Default method: Growth – Drain
• Stock change method: Stock t+1 – Stock t

Uncertainty analysis
• Guidance by IPCC GPG Chapter 5.2 Identifying and quantifying uncertainties
1. Error propagation equations
2. Monte Carlo Analysis

Error propagation equationsUncertainty of a product of several quantities
2n
22
21total U...UUU
where:
Utotal : the percentage uncertainty in the product of the quantities (the 95% confidence interval divided by the total and expressed as a percentage). Note that this uncertainty is twice the relative standard error (in %), a commonly used statistical estimate of relative uncertainty.
Ui :the percentage uncertainties associated with each of the quantities.
(Equation 5.2.2, IPCC GPG 2004)

Uncertainty of biomass stock estimates
222V BEFdstock UUUU
can be one valuewhere:
Uv : uncertainty of the volume
Ud : uncertainty of the wood density
UBEF : uncertainty of BEF
vGU

Relative standard error (rstock) and percentage uncertainty of biomass stock of spruce for Svealand (%)
Age rvol rBEF rstock %Uncertainty (2*rstock)
11-20 11 21 24 4821-30 9 10 13 2631-40 7 7 10 2041-60 6 4 7 1461-80 6 3 7 1481-100 8 3 9 18101-120 9 3 9 18121-140 12 5 13 26141- 16 3 16 32
Measure used in NFIsUsed by
IPCC GPG

Uncertainty of a sum of several quatities
n21
2nn
222
211
E EEE
EUEUEUU
where:
UE : percentage uncertainty of the sum
Ui : percentage uncertainty associated with source/sink i
Ei : emission/removal estimate for source/sink I
(Equation 5.2.1, IPCC GPG 2004)

Uncertainty of stock change: how stock estimates apply on sink assessment
12
21
22 )()(
12
timetime
timeStocktimeStock
eStockChang StockStock
StockUStockUU timetime
Could give for uncertainty of the change in biomass stock (example with illustrative values)
11501200
)1150%25()1200%25( 22
eStockChangU

Soil GHG inventory
• Peatlands based on flux measurements – area * emission factor
• Upland forest soils – change in C stock

Methods to assess change in soil C stock
1. Repeated measurements2. Statistical models on soil C as a function of
stand and tree parameters3. Dynamic soil model integrated to NFI data on
forest resources
Differences in uncertainty assessment??

Uncertainty analysis
• IPCC GPG Ch 5.2 Identifying and quantifying uncertainties
1. Error propagation equations
2. Monte Carlo Analysis

• Aggregated or averaged input data on – growing stock, area (forest land, no peat), growth
indices, harvests, temperature, natural mortality
• Annual estimates of growing stock interpolated from the estimates at calculation period ends (GSstart, GSend) using growth indices and drain estimates
• Integrated with dynamic soil C model
An inventory based carbon model combining a dynamic soil component

Methods to estimate uncertainties and key factors:
Approach 2 - Monte Carlo
X =
1
P1
1
P2
1
Result
X = Any operator
Pi,j = Any parameter, input or variable in the system

Laskennan kulku
Model for litter of
understoryvegetation
Inventory: stand volume
BEFs
Errors of living biomasses by component
Errors of biomass turnover rates
Errors in the amounts of litter for three different litter types (input to the soil model)
Inventory: Area
Drain statistics
Error of drain biomass (harvest residues)
Errors of source data and models
The result distributions for the amount of soil carbon, changes in carbon, soil respiration
Errors related to the parameters in the soil model
stem, branches, roots, etc..
Underst. litter production
Extractives
CelluloseFine
woody
Coarse woody
Lignin-like
Humus 1
Humus 2
CO2
CO2
CO2
CO2
CO2

Carbon stocks in 1990 (Tg)
Vegetation C stock 1998 (Tg)
De
nsi
ty
540 560 580 600 620 640
0.00
00.
005
0.01
00.
015
0.02
00.
025
Min. 538.21st Q. 580.3Med. 590Mean 590.33rd Q. 600.1Max. 648.9SD. 14.8
Soil C stock 1990 (Tg)
De
nsi
ty
1000 2000 3000 4000 50000
e+00
4
e-04
8
e-04
Min. 309.81st Q. 786.2Med. 1044Mean 11743rd Q. 1422Max. 5282SD. 550.9
Forest C stock 1990 (Tg)
De
nsi
ty
1000 2000 3000 4000 5000 60000
e+00
4
e-04
8
e-04
Min. 876.21st Q. 1376Med. 1634Mean 17653rd Q. 2013Max. 5895SD. 552
Vegetation Soil Forest total
CV~ 2.5%
CV~ 47%
CV~ 32%
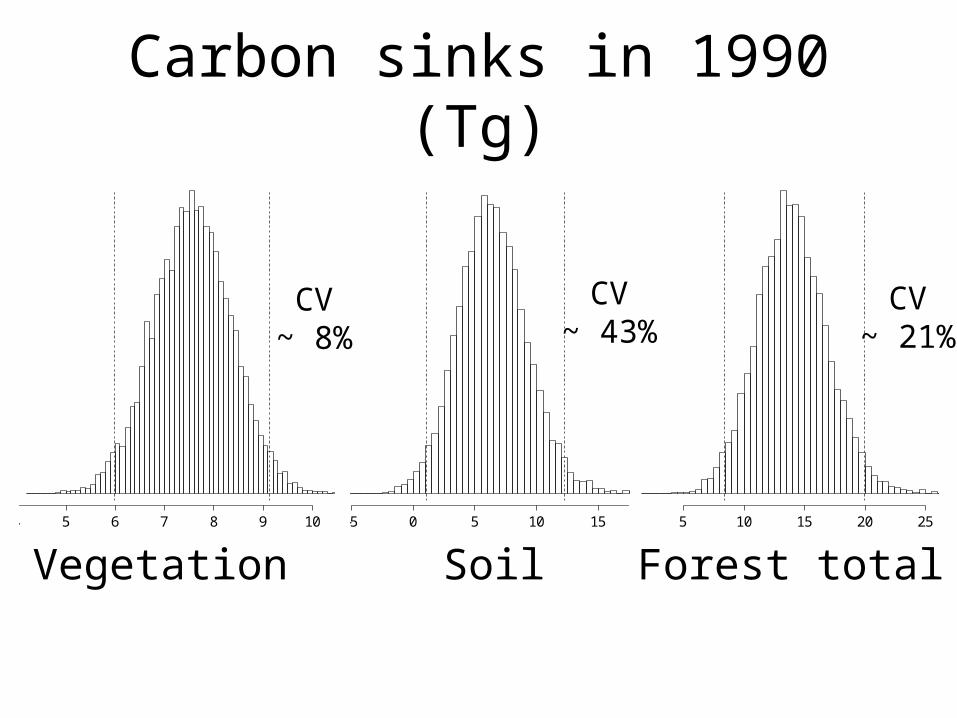
Carbon sinks in 1990 (Tg)
Soil C sink 1990-1989 (Tg)
De
nsi
ty
-5 0 5 10 15 20
0.00
0.05
0.10
0.15
Min. -5.81st Q. 4.5Med. 6.3Mean 6.43rd Q. 8.2Max. 20SD. 2.8
Forest C sink 1990-1989 (Tg)
De
nsi
ty
5 10 15 20 25
0.00
0.02
0.04
0.06
0.08
0.10
0.12
0.14
Min. 1.51st Q. 12Med. 13.9Mean 143rd Q. 15.9Max. 27.6SD. 2.9
Vegetation C sink 1990-1989 (Tg)
De
nsi
ty
4 5 6 7 8 9 10
0.0
0.1
0.2
0.3
0.4
0.5
Min. 4.21st Q. 7Med. 7.6Mean 7.63rd Q. 8.1Max. 10.7SD. 0.8
Vegetation Soil Forest total
CV~ 8%
CV~ 43%
CV~ 21%

1990 1992 1994 1996 1998 2000 2002
05
1015
Vegetation
Year
Ca
rbo
n s
ink
(Tg
)
1990 1992 1994 1996 1998 2000 2002
-50
510
Upland soils
Year
Ca
rbo
n s
ink
(Tg
)
2.5% C.l.25%50%75%97.5%
Uncertainty of C sink

Key factors of uncertainty: vegetation sink and stock
0
0.2
0.4
0.6
0.8
Ap
pro
x. co
ntr
. to
vari
an
ce
Veg C sink 1990-1989Veg. C stock 1990

0
0.2
0.4
0.6
0.8
1
Ap
pro
x. co
ntr
. to
vari
an
ce
Soil C sink 1990-1989Soil C stock 1990
The key factors of uncertainty: soil sink and stock
Combined effectin the 1st run

-40 -20 0 20 40 60 80
Tg CO2-eq
1990
2003
Fuel combustion
Fugitive emissions
Industrial processes
Agriculture
Waste
Forest biomass
Forest soil
Other LULUCF categories
CO2 emissions and removals, error bar is 95% CI

Summary
• Soil C sink can be estimated with a dynamic soil C model; input derived from biomass data provided by NFI
• Complete inventories incl. all pools needed• LULUCF contribute notably to overall uncertainty of the
GHG inventory• Error propagation equations are OK for uncertainty
analysis of carbon sink of biomass• Soil carbon model -> MonteCarlo analysis• Soil model parameters determine most of the uncertainty
of forest/soil stocks.• Variables that are related changes contribute to the
uncertainty of forest sinks

Discussion: Reliability of results (1/2)
• Sources of uncertainty not covered in the study:– model structure: possible wrong or missing
components or processes?– classification/applicability of submodels to this case – forest inventories report average GS for a period, not
for a single year– The use of average climatic conditions for the soil
model instead of detailed data

Discussion: Reliability of results (2/2)
• Subjectivity of uncertainty estimates– Expert judgment needed for parameters
missing uncertainty estimates– What is included in the reported uncertainty
estimates varies

Discussion
• Estimation of annual sinks introduces extra input variables into the system
• Information on variability or correlation of model parameters lacks although the information could be available for input data– For some model parameters (eg. turnover rates)
potential variability should be treated as uncertainty because there is no data
The method is more applicable for the estimation of long term sinks

• Thank you!
• www.efi.fi/projects/uncertainty