keysight technologies can eye-diagram mask...
TRANSCRIPT
Keysight TechnologiesCAN Eye-Diagram Mask Testing
Application Note

Introduction
Eye-diagram mask testing is used in a broad range of today’s serial bus applications. An eye-diagram is basically an infinite persisted overlay of all bits captured by an oscilloscope to show when bits are valid. This provides a composite picture of the overall quality of a system’s physical layer characteristics, which includes amplitude variations, timing uncertainties, and infrequent signal anomalies.
Eye-diagram testing can be performed on differential Controller Area Network (CAN) 2.0 signals using a Keysight Technologies, Inc. 1000, 2000, 3000T, 4000 or 6000 X-Series oscilloscope licensed with the CAN/LIN trigger and decode option, along with the mask test option. Various CAN mask files can be downloaded from Keysight’s website at no charge. Save the appropriate CAN eye-diagram mask files (based on baud rate, probing polarity, and network length) to your personal USB memory device. The following CAN mask files are available:
– CAN-diff (H-L) 125 kbps-400m.msk – CAN-diff (L-H) 125 kbps-400m.msk – CAN-diff (H-L) 250 kbps-200m.msk – CAN-diff (L-H) 250 kbps-200m.msk – CAN-diff (H-L) 500 kbps-80m.msk – CAN-diff (L-H) 500 kbps-80m.msk – CAN-diff (H-L) 500 kbps-10m.msk – CAN-diff (L-H) 500 kbps-10m.msk – CAN-diff (H-L) 800 kbps-40m.msk – CAN-diff (L-H) 800 kbps-40m.msk – CAN-diff (H-L) 1000 kbps-25m.msk – CAN-diff (L-H) 1000 kbps-25m.msk
Eye-diagram mask testing can also be performed on CAN FD signals using a 3000T or 4000 X-Series oscilloscope. CAN FD eye-diagrams are based on the first 10 bits of the FD phase from all CAN FD frames. However, this application note is focused on eye-diagram mask testing on “classic” CAN 2.0 signals - not CAN FD signals.

03 | Keysight | CAN Eye-Diagram Mask Testing - Application Note
CAN eye-diagram mask testing is based on capturing and overlaying all recessive and dominate bits on the differential bus. The differential bus must be probed using a differential active probe. Keysight recommends using the N2818A 200-MHz differential active probe shown in Figure 1. This probe includes Keysight AutoProbe interface that automatically sets the oscilloscope’s input impedance and attenuation factor and also provides power to the active probe.
Also available is the lower-priced N2791A 25-MHz bandwidth differential active probe (not shown). If using this probe, the attenuation setting on the probe should be set to 10:1 (not 100:1), and the output of the probe should be terminated into the oscilloscope’s default 1-MΩ input termination. This probe requires power using a USB power cable connected to the oscilloscope or a battery.
If you need to connect to DB9-SubD connectors in your system, Keysight also offers the CAN/FlexRay DB9 probe head (Part number 0960-2926). This differential probe head, which is shown in the inset photo of Figure 1, is compatible with both the N2818A and N2791A differential active probes, and allows you to connect easily to your CAN and/or FlexRay differential bus.
A differential active probe allows you to view signals on the differential CAN bus in either a dominant-bit-high or dominant-bit-low format. And CAN eye-diagram mask testing can be performed using either polarity of probing. To observe signals as dominant-bit-high, connect the “+” (red) input of the differential probe to CAN_H and the “-“ (black) input of the probe to CAN_L. Figure 2 shows a differential CAN waveform in the dominant-bit-high format.
To observe signals in the dominant-bit-low format, connect the “+” (red) input of the differential probe to CAN_L and the “-“ (black) input of the probe to CAN_H. Although connecting the differential probe to the bus in this manner may sound backwards and perhaps unintuitive, timing diagrams of CAN signals are typically shown in a dominant-bit-low format. In this format, bus idle level is always high (recessive). Also, during transmission of CAN frames, high-level signals (recessive bits) will always be interpreted as “1s”, while low-level signals (dominant bits) will always be interpreted as “0s”. Figure 3 shows a differential CAN waveform in the dominant–bit-low format.
Figure 1. N2818A 200-MHz Differential Active Probe and DB9-Probe Head.
Figure 2. Probing the differential CAN bus to show dominant-bit-high.
Figure 3. Probing the differential CAN bus to show dominant-bit-low.
Probing the Differential CAN Bus

04 | Keysight | CAN Eye-Diagram Mask Testing - Application Note
Step-by-Step Instructions to Perform a CAN Eye-diagram Mask Test
To perform a CAN eye-diagram mask test, first turn off all channels of the oscilloscope except for the input channel that is connected to the CAN differential bus. If you begin with a Default Setup, only channel-1 will be turned on. Alternatively, you can begin with the oscilloscope already set up and triggering on the differential CAN bus. To begin execution of a CAN eye-diagram mask test, do the following:
1. Insert your USB memory device (with the appropriate mask file) into the scope’s front panel USB port.
2. Press the [Save/Recall] front panel key; then press the Recall softkey.
3. Press the Recall: XXXX softkey; then select Mask as the type of file to recall.
4. Press the Location (or Press to go, or load from) softkey; then navigate to the appropriate mask file based on baud rate and probing polarity (L-H = dominant bit low, H-L = dominant bit high).
5. Press the Press to Recall softkey (or press the entry knob) to begin a CAN eye-diagram mask test.
6. When the mask file is recalled, the scope will automatically set itself up (timebase, vertical, and trigger settings) to display overlaid CAN bits across the center six divisions of the scope’s display. During this special sequencing test, timebase settings and timing cursors cannot be used. To exit a CAN eye-diagram mask test, either turn off mask testing or press Clear Mask in the scope’s Analyze-Mask menu. When the test is exited, the scope will restore most oscilloscope settings to the state they were in prior to beginning the test.
Interpreting the Eye
The CAN 2.0 eye-diagram test randomly captures and overlays every differential bit of every CAN frame based on a unique clock recovery algorithm that emulates worst-case CAN receiver hard-synchronization, re-synchronization, and sampling. Figure 4 shows a CAN eye-diagram mask test based on a system baud rate of 500 kbps with differential probing established to obverse the waveforms in a dominant-bit-low format. This test basically shows if dominate and recessive bits have settled to valid/specified levels prior to receiver sampling, which typically occurs near the 75% bit-time point. In other words, the CAN eye-diagram shows what the CAN receiver “sees” by synchronizing the scope’s acquisition and display timing to the CAN receiver’s timing. The result is a single measurement that provides insight into the overall signal integrity of the CAN physical layer network to show worst-case timing and worst-case vertical amplitude variations.
Overlaid and infinitely persisted bits of the eye-diagram are continually compared against a 6-point polygon-shaped pass/fail mask, which is based on CAN 2.0 physical layer specifications. Although there are many factors that determine the eye-diagram test rate, Keysight’s InfiniiVision X-Series oscilloscopes can test approximately 10,000 bits per second based on a CAN system operating at 500 kbps and with an approximate bus load equal to 33%.
Figure 4. CAN eye-diagram mask test on a 500 kbps differential bus viewed in a dominant-bit-low format.

05 | Keysight | CAN Eye-Diagram Mask Testing - Application Note
On the vertical axis, the eye-diagram display shows various peak-to-peak amplitudes. Variations in signal amplitudes on the differential CAN bus are primarily due to the following:
– System noise/interference/coupling – Different transmitters (nodes in the system) exhibiting unique
and different output characteristics – Attenuated amplitudes due to network lengths and
reflections – Increased dominate-bit amplitudes during the arbitration and
acknowledge timing phases when multiple nodes transmit dominant bits simultaneously (or nearly simultaneously)
Although variations in peak-to-peak amplitudes can also be observed when viewing the bits and frames sequentially (non eye-diagram display), such as what is shown in Figure 3, the eye-diagram shows these variations — along with details of pulse shapes that may reveal termination problems — in a single overlaid picture. This means that you don’t have to scroll through captured waveforms to analyze each bit one at a time to see if there are any amplitude problems.
On the horizontal axis, the eye-diagram display shows timing uncertainties primarily due to the following:
– Worst-case clock jitter – Worst-case clock tolerance between various nodes in the
system – Bit-time quantization (typically 1/8th to 1/25th of 1 bit-time) – Physical network delays
Worst-case timing errors such as these are extremely difficult to observe when viewed as a sequential waveform (non eye-diagram display) based on a common trigger point.
Unlike most other serial bus standards where timing uncertainties revealed in an eye-diagram test typically exhibit symmetrical edge transition placements around the zero-crossing-points (beginning and end of each bit-time), timing uncertainties in a multi-node CAN 2.0 network produce asymmetric edge transition placements in a CAN eye-diagram test as shown in Figure 4. This is primarily because physical network delay is the dominant contributor of timing uncertainties. And although some engineers may interpret this to be random timing jitter, it is actually a display of deterministic signal delays through the CAN physical network. And this display of timing shift is normal and to be expected — so long as the shifted edges are within specification for the physical length of the particular CAN network under test. This phenomenon of “shifted edges” to the right of the bit-time boundaries (always positive delay) occurs during the arbitration and acknowledgement phases of CAN frames when bits are transmitted from one node to the next, and then back again. The longer the CAN network—the longer the delays.
Interpreting the Eye (Continued)
06 | Keysight | CAN Eye-Diagram Mask Testing - Application Note
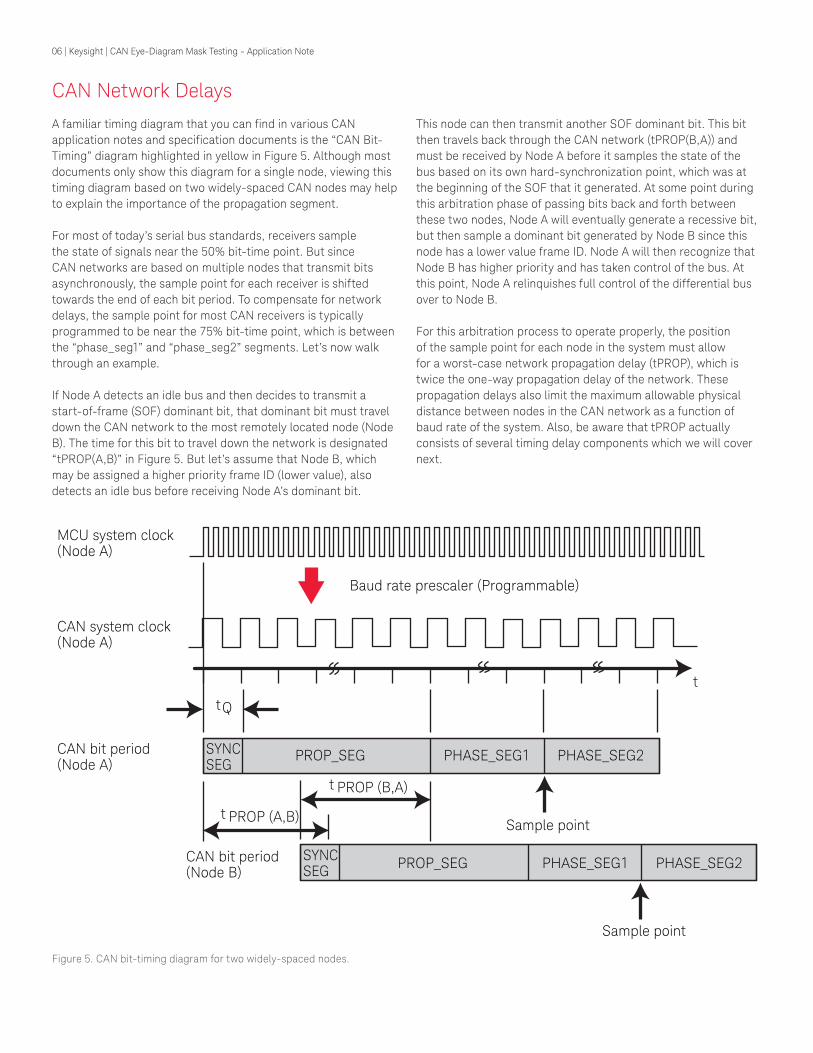
A familiar timing diagram that you can find in various CAN application notes and specification documents is the “CAN Bit-Timing” diagram highlighted in yellow in Figure 5. Although most documents only show this diagram for a single node, viewing this timing diagram based on two widely-spaced CAN nodes may help to explain the importance of the propagation segment.
For most of today’s serial bus standards, receivers sample the state of signals near the 50% bit-time point. But since CAN networks are based on multiple nodes that transmit bits asynchronously, the sample point for each receiver is shifted towards the end of each bit period. To compensate for network delays, the sample point for most CAN receivers is typically programmed to be near the 75% bit-time point, which is between the “phase_seg1” and “phase_seg2” segments. Let’s now walk through an example.
If Node A detects an idle bus and then decides to transmit a start-of-frame (SOF) dominant bit, that dominant bit must travel down the CAN network to the most remotely located node (Node B). The time for this bit to travel down the network is designated “tPROP(A,B)” in Figure 5. But let’s assume that Node B, which may be assigned a higher priority frame ID (lower value), also detects an idle bus before receiving Node A’s dominant bit.
CAN Network Delays
This node can then transmit another SOF dominant bit. This bit then travels back through the CAN network (tPROP(B,A)) and must be received by Node A before it samples the state of the bus based on its own hard-synchronization point, which was at the beginning of the SOF that it generated. At some point during this arbitration phase of passing bits back and forth between these two nodes, Node A will eventually generate a recessive bit, but then sample a dominant bit generated by Node B since this node has a lower value frame ID. Node A will then recognize that Node B has higher priority and has taken control of the bus. At this point, Node A relinquishes full control of the differential bus over to Node B.
For this arbitration process to operate properly, the position of the sample point for each node in the system must allow for a worst-case network propagation delay (tPROP), which is twice the one-way propagation delay of the network. These propagation delays also limit the maximum allowable physical distance between nodes in the CAN network as a function of baud rate of the system. Also, be aware that tPROP actually consists of several timing delay components which we will cover next.
Figure 5. CAN bit-timing diagram for two widely-spaced nodes.
MCU system clock (Node A)
CAN system clock (Node A)
CAN bit period (Node A)
Baud rate prescaler (Programmable)
SYNC SEG
PROP_SEG PHASE_SEG1 PHASE_SEG2
Sample point
t PROP (B,A)
PROP_SEG PHASE_SEG1 PHASE_SEG2
Sample point
CAN bit period (Node B)
SYNC SEG
tQ
PROP (A,B)t
t

07 | Keysight | CAN Eye-Diagram Mask Testing - Application Note
Figure 6. Typical multi-node CAN 2.0 network.
CAN Network Delays (Continued)
Figure 6 shows a typical CAN physical network with the scope’s differential active probe connected to the input/output of Node A’s transceiver. Let’s now consider all the individual components of network propagation delay (tPROP ). Again, let’s assume that Node A generates an SOF dominant bit. This bit must travel through Node A’s transceiver (tXCVR ), then down the physical network (tBUS ), then through Node N’s transceiver (tXCVR ), and then processed by Node N’s controller (tCONTROLLER ). But before processing and sampling this bit, assume that Node N generates its own SOF dominate bit. That bit then travels back through Node N’s transceiver (tXCVR ), then back through the physical network (tBUS ), then through Node A’s transceiver (tXCVR ), and finally processed and sampled by Node A (tCONTROLLER ). The total amount of network propagation delay (tPROP ) that must be budgeted for in this network is:
The physical bus delay component (tBUS ) is usually computed using a 5 ns/meter multiplying factor. Transceiver delay (tXCVR ) and controller response time (tCONTROLLER ) will depend upon the devices selected. Note that some CAN documents refer to a loop delay parameter (tLOOP ), which is a combination of some of the above noted delay components. A node’s loop delay consists of the time for a bit to travel through a transceiver’s receiver side, plus controller response time, plus the time for another bit to travel back through the transceiver’s transmitter side. In other words:
The total CAN network delay (tPROP ) can then be reduced to:
Node A Node B Node C Node N
Transceivers
Most distant nodes down and back
CAN_HRL
µControllers
RL CAN_LCAN_HCAN_L
Diff probe ±
08 | Keysight | CAN Eye-Diagram Mask Testing - Application Note
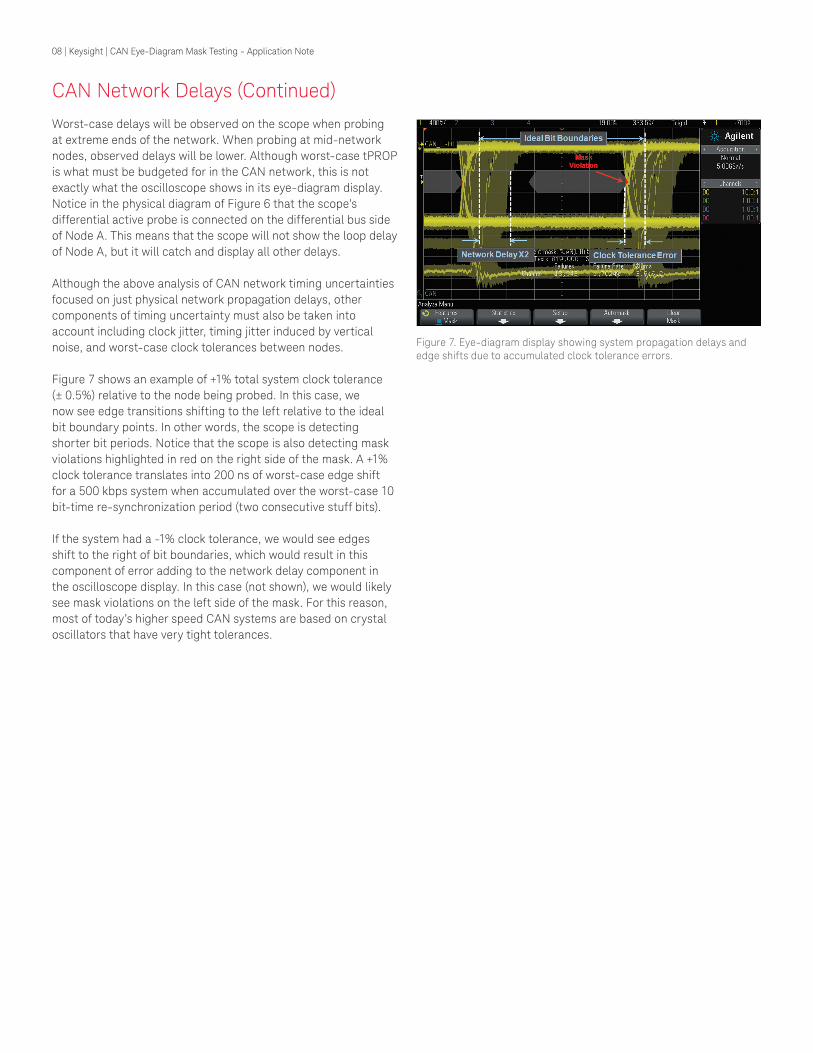
Worst-case delays will be observed on the scope when probing at extreme ends of the network. When probing at mid-network nodes, observed delays will be lower. Although worst-case tPROP is what must be budgeted for in the CAN network, this is not exactly what the oscilloscope shows in its eye-diagram display. Notice in the physical diagram of Figure 6 that the scope’s differential active probe is connected on the differential bus side of Node A. This means that the scope will not show the loop delay of Node A, but it will catch and display all other delays.
Although the above analysis of CAN network timing uncertainties focused on just physical network propagation delays, other components of timing uncertainty must also be taken into account including clock jitter, timing jitter induced by vertical noise, and worst-case clock tolerances between nodes.
Figure 7 shows an example of +1% total system clock tolerance (± 0.5%) relative to the node being probed. In this case, we now see edge transitions shifting to the left relative to the ideal bit boundary points. In other words, the scope is detecting shorter bit periods. Notice that the scope is also detecting mask violations highlighted in red on the right side of the mask. A +1% clock tolerance translates into 200 ns of worst-case edge shift for a 500 kbps system when accumulated over the worst-case 10 bit-time re-synchronization period (two consecutive stuff bits).
If the system had a -1% clock tolerance, we would see edges shift to the right of bit boundaries, which would result in this component of error adding to the network delay component in the oscilloscope display. In this case (not shown), we would likely see mask violations on the left side of the mask. For this reason, most of today’s higher speed CAN systems are based on crystal oscillators that have very tight tolerances.
Figure 7. Eye-diagram display showing system propagation delays and edge shifts due to accumulated clock tolerance errors.
CAN Network Delays (Continued)

09 | Keysight | CAN Eye-Diagram Mask Testing - Application Note
A mask on the scope’s display defines a failing region where signals are not supposed to enter. You can think of this region on the scope’s display as the “keep-out” zone. If captured waveforms enter this zone of this scope’s display, then the scope will display those portions of the waveform trace in red and will also the count the number of bits that fail the test.
The CAN pass/fail masks provided by Keysight are based on a 6-point polygon shape, which is typical for most serial bus standards. Figure 8 shows a mask for a 500 kbps system with an approximate network length (one-way) of 10 meters. The differential probing configuration for this particular mask was for dominant-bit-low. The top and bottom of the mask are based on specified worst-case receiver threshold levels of –0.5 to –0.9 V. If probing to view in a dominant-bit-high format, Keysight also provides appropriate masks with the lower and upper levels of the mask set at +0.5 to +0.9 V.
For a 10 meter system, the left side of the mask is positioned at 30% of a Unit Interval (UI). One UI is the same as the CAN system’s bit period (2 μs for 500 kbps). This 30% of UI timing point relative to the beginning of a received bit will test for worst-case system delays — along with other timing uncertainties — of 600 ns. The right side of the mask is positioned at 90% of UI.
Figure 8. Pass/Fail mask for a 10 meter network operating at 500 kbps.
Figure 9. Pass/Fail mask for an 80 meter network operating at 500 kbps.
Figure 9 shows an example of a 500 kbps mask for a CAN system that has an approximate network length of 80 meters. This is the approximate maximum allowable network length for a system operating at this baud rate. The left side of this particular mask is positioned at 60% of UI, which allows for up to 1.2 μs of system delays and other timing uncertainties.
You may be tempted to use the 80 meter mask on a 10 meter system since it provides additional test margin. But what if your 10 meter system produced edge transitions near 50% of UI, which would be at the center-screen graticule of Figure 9? Although this provides more-than-sufficient margin for CAN receivers to correctly sample bits at the typical 75% sample point, a 10 meter system should never generate delays as large as 1 μs. Using the 10 meter mask will alert you to possible component problems in your system. Perhaps one of your transceivers exhibits excessive delay.
The Pass/Fail Mask

10 | Keysight | CAN Eye-Diagram Mask Testing - Application Note
Summary
Although CAN serial bus protocol analyzers can provide higher application-level data transfer information on the CAN bus, they reveal little or nothing about the signal integrity of individual bits that may be inducing errors in the system. This is why engineers and technicians often use oscilloscopes with CAN trigger and decode capability to test the physical layer characteristics of the differential CAN network. And the single most important measurement that can be performed with an oscilloscope to evaluate the overall quality of the physical layer in one composite measurement is a CAN eye-diagram mask test. Creating a proper CAN eye-diagram measurement on a scope’s display requires much more than just triggering on rising and/or falling edges. It requires a special triggering and display clock recovery algorithm than emulates the hard-synchronization and worst-case re-synchronization of CAN receivers to capture and overlay up to the worst-case 10th bit-time after re-synchronization (two consecutive stuffed bits).
Not only can Keysight’s InfiniiVision X-Series oscilloscopes trigger, decode, and perform eye-diagram mask test measurements on differential CAN bus signals, but these oscilloscopes can also perform analysis on other serial bus standards often found in both automotive and industrial applications including FlexRay, SENT, LIN, I2C, SPI, and RS-232/UART.
Related Literature
Publication title Publication numberInfiniiVision 1000 X-Series Oscilloscopes - Data Sheet 5992-1965ENInfiniiVision 2000 X-Series Oscilloscopes - Data Sheet 5990-6618ENInfiniiVision 3000T X-Series Oscilloscopes - Data Sheet 5992-0140ENInfiniiVision 4000 X-Series Oscilloscopes - Data Sheet 5991-1103ENInfiniiVision 6000 X-Series Oscilloscopes - Data Sheet 5991-4087ENSerial Bus Options for InfiniiVision X-Series Oscilloscopes - Data Sheet 5990-6677ENMask/Waveform Limit Testing for InfiniiVision Series Oscilloscopes - Data Sheet 5990-3269ENN2790A 100 MHz, N2791A 25 MHz and N2891A 70 MHz High-voltage Differential Probes - Data Sheet 5990-3780ENDebugging LIN, CAN, CAN FD, SENT and FlexRay Serial Buses - Application Brief 5990-9275ENFlexRay Physical Layer Eye-diagram Mask Testing - Application Note 5990-4923ENEvaluating Oscilloscope Mask Testing for Six Sigma Quality Standards - Application Note 5990-3200ENUsing Oscilloscope Segmented Memory for Serial Bus Applications - Application Note 5990-5817ENOscilloscope Measurement Tools to Help Debug Automotive Serial Buses Faster - Application Note 5991-0512EN
To download these documents, insert the publication number in the URL: http://literature.cdn.keysight.com/litweb/pdf/XXXX-XXXXEN.
Product Web site
For the most up-to-date and complete application and product information, please visit our product Web site at: www.keysight.com/find/morescope.
System Requirements
In addition to the Keysight N2818A differential active probe (or equivalent) to probe the differential bus, performing CAN eye-diagram mask tests requires that your Keysight 2000, 3000T, 4000 or 6000 X-Series oscilloscopes be licensed with the DSOX2AUTO, DSOXT3AUTO, DSOX4AUTO or DSOX6AUTO serial trigger and decode option (CAN & LIN), as well as the DSOX2MASK, DSOX3MASK, DSOX4MASK or DSOX6MASK mask test option. In addition, your 2000 X-Series must have firmware version 2.30 or greater, and the 3000 X-Series must have firmware version 2.11 or greater.
11 | Keysight | CAN Eye-Diagram Mask Testing - Application Note
www.axiestandard.orgAdvancedTCA® Extensions for Instrumentation and Test (AXIe) is an open standard that extends the AdvancedTCA for general purpose and semiconductor test. The business that became Keysight was a founding member of the AXIe consortium. ATCA®, AdvancedTCA®, and the ATCA logo are registered US trademarks of the PCI Industrial Computer Manufacturers Group.
www.lxistandard.org
LAN eXtensions for Instruments puts the power of Ethernet and the Web inside your test systems. The business that became Keysight was a founding member of the LXI consortium.
www.pxisa.org
PCI eXtensions for Instrumentation (PXI) modular instrumentation delivers a rugged, PC-based high-performance measurement and automation system.
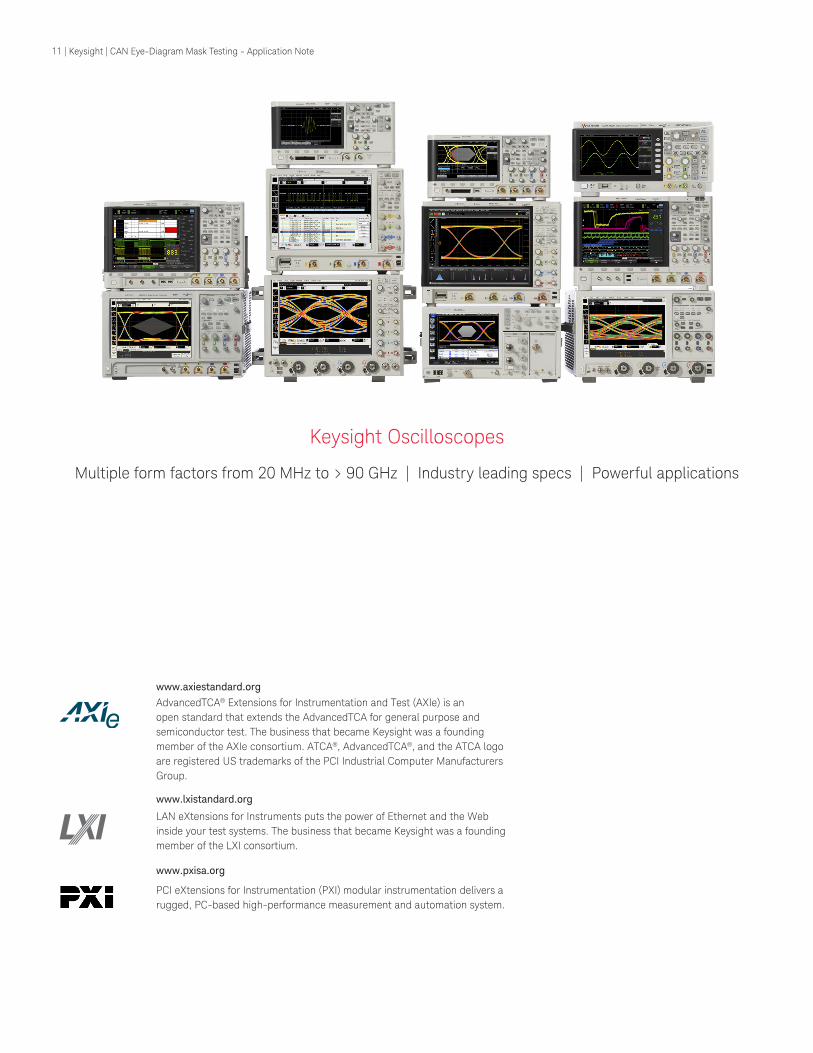
Keysight Oscilloscopes
Multiple form factors from 20 MHz to > 90 GHz | Industry leading specs | Powerful applications
12 | Keysight | CAN Eye-Diagram Mask Testing - Application Note
This information is subject to change without notice.© Keysight Technologies, 2017Published in USA, Decemeber 1, 20175991-0484ENwww.keysight.com
www.keysight.com/find/1000x-serieswww.keysight.com/find/2000x-serieswww.keysight.com/find/3000x-serieswww.keysight.com/find/4000x-serieswww.keysight.com/find/6000x-series
For more information on Keysight Technologies’ products, applications or services, please contact your local Keysight office. The complete list is available at:www.keysight.com/find/contactus
Americas Canada (877) 894 4414Brazil 55 11 3351 7010Mexico 001 800 254 2440United States (800) 829 4444
Asia PacificAustralia 1 800 629 485China 800 810 0189Hong Kong 800 938 693India 1 800 11 2626Japan 0120 (421) 345Korea 080 769 0800Malaysia 1 800 888 848Singapore 1 800 375 8100Taiwan 0800 047 866Other AP Countries (65) 6375 8100
Europe & Middle EastAustria 0800 001122Belgium 0800 58580Finland 0800 523252France 0805 980333Germany 0800 6270999Ireland 1800 832700Israel 1 809 343051Italy 800 599100Luxembourg +32 800 58580Netherlands 0800 0233200Russia 8800 5009286Spain 800 000154Sweden 0200 882255Switzerland 0800 805353
Opt. 1 (DE)Opt. 2 (FR)Opt. 3 (IT)
United Kingdom 0800 0260637
For other unlisted countries:www.keysight.com/find/contactus(BP-9-7-17)
DEKRA CertifiedISO9001 Quality Management System
www.keysight.com/go/qualityKeysight Technologies, Inc.DEKRA Certified ISO 9001:2015Quality Management System
Evolving Since 1939Our unique combination of hardware, software, services, and people can help you reach your next breakthrough. We are unlocking the future of technology. From Hewlett-Packard to Agilent to Keysight.
myKeysightwww.keysight.com/find/mykeysightA personalized view into the information most relevant to you.
www.keysight.com/find/emt_product_registrationRegister your products to get up-to-date product information and find warranty information.
Keysight Serviceswww.keysight.com/find/serviceKeysight Services can help from acquisition to renewal across your instrument’s lifecycle. Our comprehensive service offerings—one-stop calibration, repair, asset management, technology refresh, consulting, training and more—helps you improve product quality and lower costs.
Keysight Assurance Planswww.keysight.com/find/AssurancePlansUp to ten years of protection and no budgetary surprises to ensure your instruments are operating to specification, so you can rely on accurate measurements.
Keysight Channel Partnerswww.keysight.com/find/channelpartnersGet the best of both worlds: Keysight’s measurement expertise and product breadth, combined with channel partner convenience.