kgi - q2 production upate for f2015
TRANSCRIPT

A PROFITABLE FUTURE
Toronto Marketing November 12-13, 2014
A RICH HISTORY

Forward Looking Statements Cautionary Note Regarding Forward Looking Statements.
This presentation contains statements which constitute ”forward-looking statements”, including statements
regarding the plans, intentions, beliefs and current expectations of the Company with respect to the future
business activities and operating performance of the Company. The words “may”, “would”, “could”,
“should”, “will”, “intend”, “plan”, “anticipate”, “believe”, “estimate”, “expect” and similar expressions, as
they relate to the Company, are intended to identify such forward-looking statements. Forward-looking
statements used in this Presentation include, but may not be limited to, statements regarding the Company’s
production forecast including ounces produced and grade assumptions; the operating costs and all-in cash
cost for fiscal 2015; and exploration programs and their results. Investors are cautioned that forward-looking
statements are based on the opinions, assumptions and estimates of management considered reasonable at
the date the statements are made such as, without limitation, opinion, assumptions and estimates of
management regarding the Company’s business, its ability to increase its production capacity and decrease
its production cost. Such opinions, assumptions and estimates, are inherently subject to a variety of risks
and uncertainties and other known and unknown factors that could cause actual events or results to differ
materially from those projected in the forward-looking statements. These factors are discussed in length in
the Company's annual Management's Discussion and Analysis and Annual Information Form for the year
ended April 30, 2014. and the Company’s Management's Discussion and Analysis for the interim period
ended July 31, 2014 filed with the securities regulatory authorities in certain provinces of Canada and
available at www.sedar.com.
Should one or more of these risks or uncertainties materialize, or should assumptions underlying the forward-looking
statements prove incorrect, actual results may vary materially from those described herein as intended, planned,
anticipated, believed, estimated or expected. Although the Company has attempted to identify important risks, uncertainties
and factors which could cause actual results to differ materially, there may be others that cause results not to be as
anticipated, estimated or intended. The Company does not intend, and does not assume any obligation, to update these
forward-looking statements except as otherwise required by applicable law.
TSX/AIM:KGI www.klgold.com 2

Company Vision
George Ogilvie, P.Eng., CEO
“Build a sustainable mining company that is
recognized as a safe and responsible intermediate
gold producer.
“We will provide exceptional stakeholder value by
delivering operational and exploration excellence
through empowering our people to act as owners.”
www.klgold.com 3 TSX/AIM:KGI
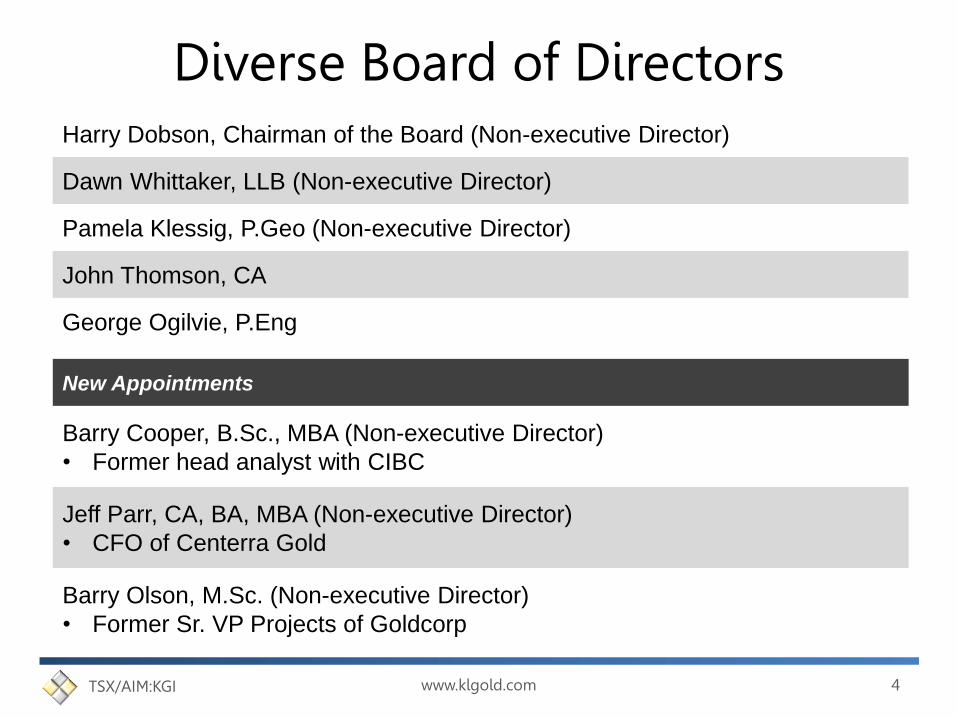
Diverse Board of Directors
New Appointments
Barry Cooper, B.Sc., MBA (Non-executive Director)
• Former head analyst with CIBC
Jeff Parr, CA, BA, MBA (Non-executive Director)
• CFO of Centerra Gold
Barry Olson, M.Sc. (Non-executive Director)
• Former Sr. VP Projects of Goldcorp
Harry Dobson, Chairman of the Board (Non-executive Director)
Dawn Whittaker, LLB (Non-executive Director)
Pamela Klessig, P.Geo (Non-executive Director)
John Thomson, CA
George Ogilvie, P.Eng
www.klgold.com 4 TSX/AIM:KGI

Synergistic Management Team GEORGE OGILVIE, P. Eng.
President & CEO, Director
• 25 years management, operating, and
technical expertise in the mining industry
with over 9 years of operating experience
in deep, narrow-vein gold mines (Anglo
Gold, South Africa)
• Former CEO of Rambler Metals and
Mining
JOHN THOMSON, CA
Executive VP and CFO,
Director
• More than 25 years experience in
various senior level finance positions
with companies such as PepsiCo
• Chartered Accountant who studied at
INSEAD
CHRIS STEWART, P. Eng.
VP Operations
• More than 20 years of operating
experience in Northern Ontario in various
senior-level positions. Prior to joining
KGI, was CEO of Liberty Mines Inc.
• Mining Engineering degree from Queen’s
University
Worked together
at Dynatec for
~3.5 years
Worked together at
Rambler for ~ 7 years
www.klgold.com 5 TSX/AIM:KGI

Investment Highlights
Located in Ontario, one of the safest and lowest risk mining jurisdictions globally
Attractive NI43-101 high grade reserve and resource profile with a long mine life
Growing annual production, declining cost base and improving unit costs
Company returning to profitability and free cash flow
Significant exploration potential with organic growth
Potential upside with a higher gold price and a weaker Canadian dollar
www.klgold.com 6 TSX/AIM:KGI

Financial Position
CASH C$41.4 million*
DEBT C$120 million convertible debentures
KGI.DB: 6% coupon/ $15.00 strike
C$54.5MM mature Jun/2017
KGI.DB.A: 7.5% coupon/ $13.70 strike
C$65.5MM mature Dec/2017
ROYALTY 2.5% NSR Franco Nevada Corporation
option to buyback 1% by October 31, 2016
CAPITAL STRUCTURE*
ISSUED SHARES 72,081,617
FULLY DILUTED 84,986,448
MARKET CAP ~270 Million
52 Week Performance*
HIGH C$6.19
LOW C$2.21
www.klgold.com 7 TSX/AIM:KGI
* Share Capital as of July 31, 2014. All other info as of October 31, 2014.

KGI Share Performance Vs Gold
www.klgold.com 8 TSX/AIM:KGI
(-40%)
(-20%)
30%
40%
50%
60%
70%
80%
90%
100%
110%
120%
Jan-13 Apr-13 Jul-13 Oct-13 Jan-14 Apr-14 Jul-14 Oct-14
Kirkland Lake (TSX:KGI) Gold Price (C$ / oz)
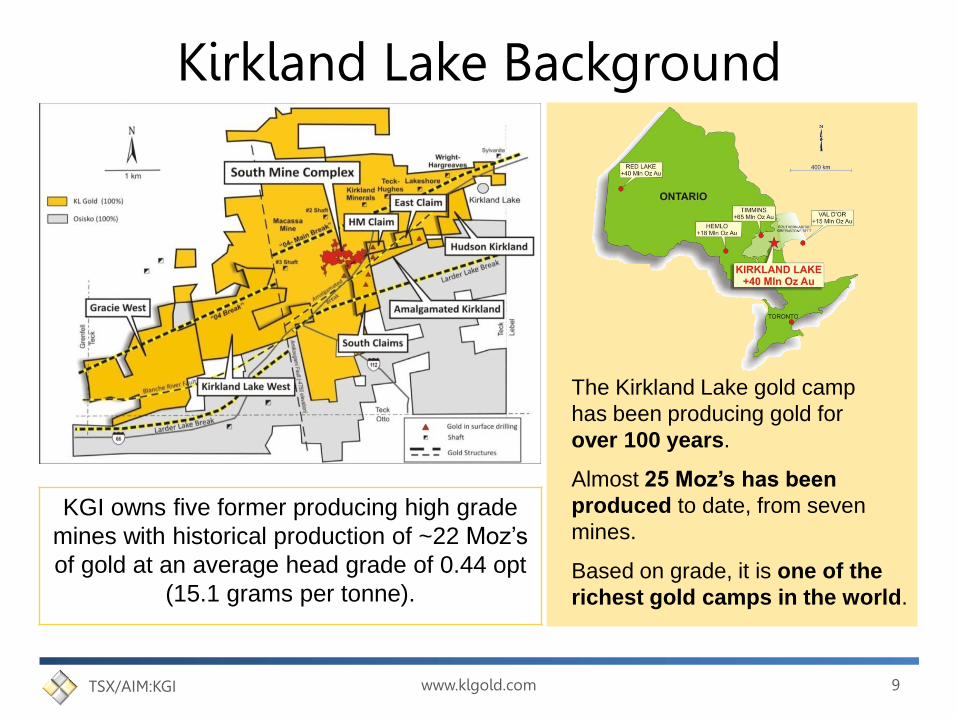
Kirkland Lake Background
KGI owns five former producing high grade
mines with historical production of ~22 Moz’s
of gold at an average head grade of 0.44 opt
(15.1 grams per tonne).
The Kirkland Lake gold camp
has been producing gold for
over 100 years.
Almost 25 Moz’s has been
produced to date, from seven
mines.
Based on grade, it is one of the
richest gold camps in the world.
www.klgold.com 9 TSX/AIM:KGI
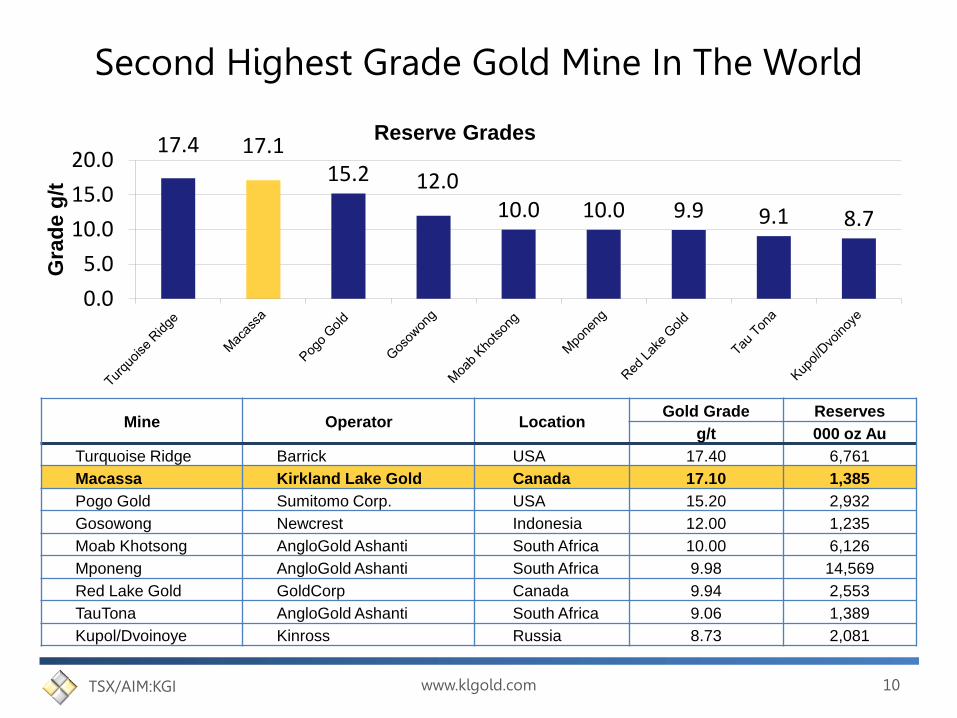
Second Highest Grade Gold Mine In The World
Mine Operator Location Gold Grade Reserves
g/t 000 oz Au
Turquoise Ridge Barrick USA 17.40 6,761
Macassa Kirkland Lake Gold Canada 17.10 1,385
Pogo Gold Sumitomo Corp. USA 15.20 2,932
Gosowong Newcrest Indonesia 12.00 1,235
Moab Khotsong AngloGold Ashanti South Africa 10.00 6,126
Mponeng AngloGold Ashanti South Africa 9.98 14,569
Red Lake Gold GoldCorp Canada 9.94 2,553
TauTona AngloGold Ashanti South Africa 9.06 1,389
Kupol/Dvoinoye Kinross Russia 8.73 2,081
17.4 17.1 15.2 12.0
10.0 10.0 9.9 9.1 8.7
0.0
5.0
10.0
15.0
20.0
Gra
de g
/t
Reserve Grades
www.klgold.com 10 TSX/AIM:KGI

New Mine Plan With Positive Results
Old Plan Focussed on QUANTITY and TONNEAGE New Plan Focusses on QUALITY and GRADE
SIGNIFICANT
INCREASE IN
GRADE
REDUCTION
IN COSTS
CASH
FLOW
POSITIVE
• Not Dependant on a High Gold Price
• Requires Less Manpower
• Fewer Stopes
• Strict Ore/Waste Management and Dilution Control
Additional benefits of new mine plan are SIMPLIFIED PLANNING
and ability to FINANCE AT COMPANY’s DISCRETION
www.klgold.com 11 TSX/AIM:KGI
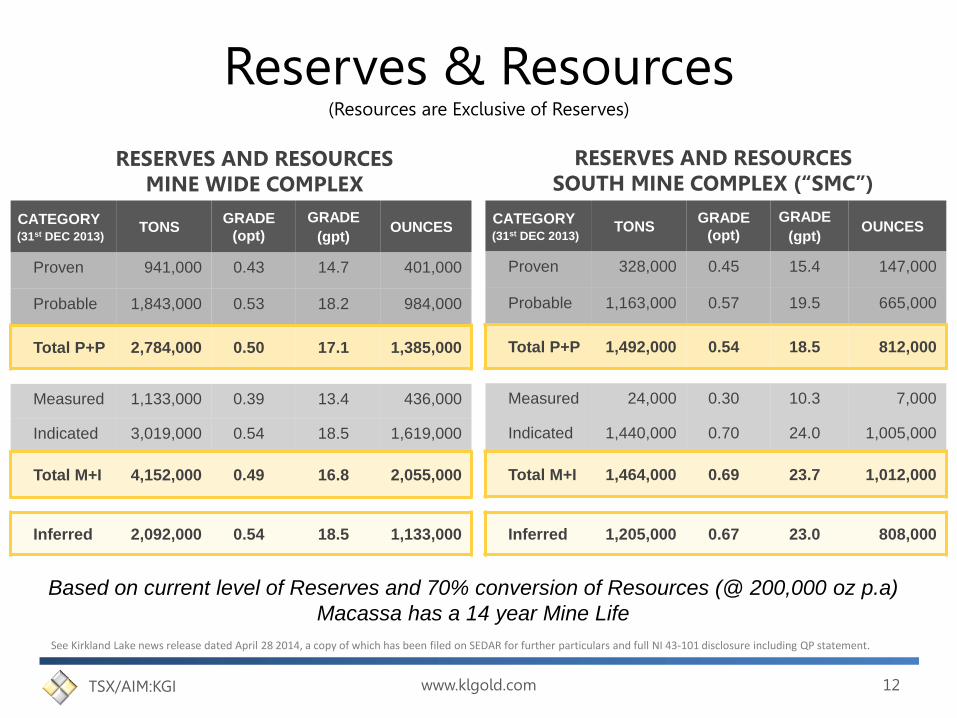
Reserves & Resources (Resources are Exclusive of Reserves)
RESERVES AND RESOURCES MINE WIDE COMPLEX
CATEGORY (31st DEC 2013)
TONS GRADE
(opt)
GRADE
(gpt) OUNCES
Proven 941,000 0.43 14.7 401,000
Probable 1,843,000 0.53 18.2 984,000
Total P+P 2,784,000 0.50 17.1 1,385,000
Measured 1,133,000 0.39 13.4 436,000
Indicated 3,019,000 0.54 18.5 1,619,000
Total M+I 4,152,000 0.49 16.8 2,055,000
Inferred 2,092,000 0.54 18.5 1,133,000
See Kirkland Lake news release dated April 28 2014, a copy of which has been filed on SEDAR for further particulars and full NI 43-101 disclosure including QP statement.
Based on current level of Reserves and 70% conversion of Resources (@ 200,000 oz p.a)
Macassa has a 14 year Mine Life
RESERVES AND RESOURCES SOUTH MINE COMPLEX (“SMC”)
CATEGORY (31st DEC 2013)
TONS GRADE
(opt)
GRADE
(gpt) OUNCES
Proven 328,000 0.45 15.4 147,000
Probable 1,163,000 0.57 19.5 665,000
Total P+P 1,492,000 0.54 18.5 812,000
Measured 24,000 0.30 10.3 7,000
Indicated 1,440,000 0.70 24.0 1,005,000
Total M+I 1,464,000 0.69 23.7 1,012,000
Inferred 1,205,000 0.67 23.0 808,000
www.klgold.com 12 TSX/AIM:KGI
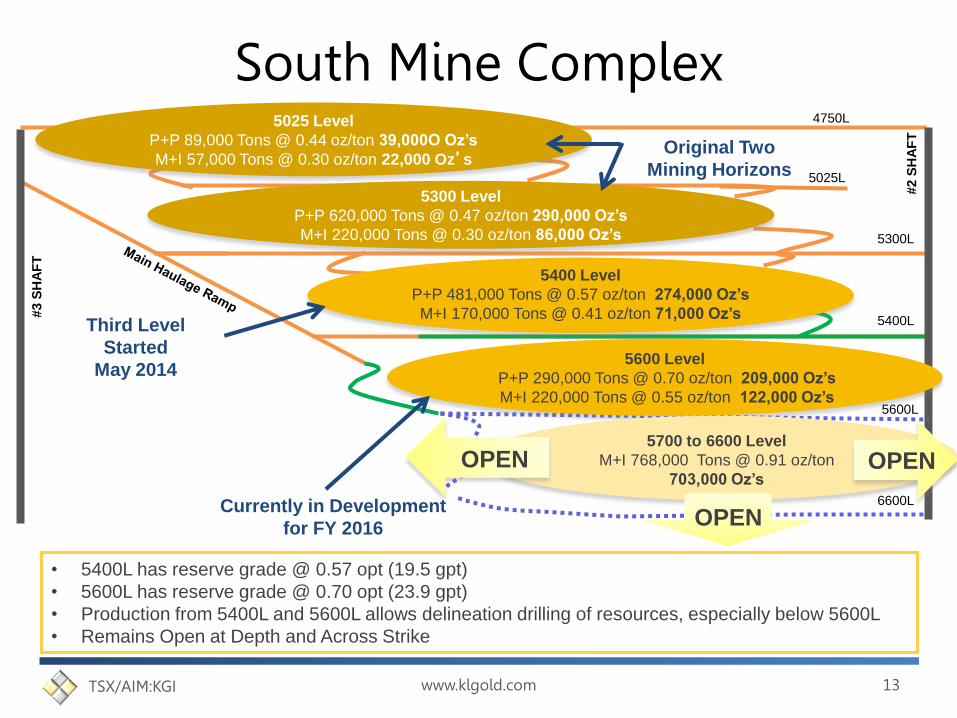
South Mine Complex
• 5400L has reserve grade @ 0.57 opt (19.5 gpt)
• 5600L has reserve grade @ 0.70 opt (23.9 gpt)
• Production from 5400L and 5600L allows delineation drilling of resources, especially below 5600L
• Remains Open at Depth and Across Strike
5025 Level
P+P 89,000 Tons @ 0.44 oz/ton 39,000O Oz’s
M+I 57,000 Tons @ 0.30 oz/ton 22,000 Oz’s
5300 Level
P+P 620,000 Tons @ 0.47 oz/ton 290,000 Oz’s
M+I 220,000 Tons @ 0.30 oz/ton 86,000 Oz’s
5400 Level
P+P 481,000 Tons @ 0.57 oz/ton 274,000 Oz’s
M+I 170,000 Tons @ 0.41 oz/ton 71,000 Oz’s
5600 Level
P+P 290,000 Tons @ 0.70 oz/ton 209,000 Oz’s
M+I 220,000 Tons @ 0.55 oz/ton 122,000 Oz’s
5700 to 6600 Level
M+I 768,000 Tons @ 0.91 oz/ton
703,000 Oz’s
Original Two
Mining Horizons
Third Level
Started
May 2014
Currently in Development
for FY 2016
OPEN OPEN
OPEN
#3 S
HA
FT
#2 S
HA
FT
www.klgold.com 13 TSX/AIM:KGI
5025L
5300L
5400L
6600L
5600L
4750L

Q2/H1 of F2015 Production Update
Q1 F2015
38,543
93,880
0.45
Q2 F2015
38,335
92,146
0.41
H1 F2015
76,878
186,026
0.43
Ounces Sold
Tons Milled
Head Grade (opt)
• Second stope (5612) brought into production on 5400 level
• 2 Electric Hydraulic Jumbo’s fully operational
• Main ramp towards the 5600 level progressing well and is on schedule
www.klgold.com 14 TSX/AIM:KGI

0.34 0.31 0.30
0.26 0.29
0.45
0.39
0.34 0.37
0.34
0.47
0.51
0.39
0.43 0.41
-
0.10
0.20
0.30
0.40
0.50
0
5,000
10,000
15,000
20,000
Aug Sep Oct Nov Dec Jan Feb Mar Apr May2014
Jun Jul Aug Sep Oct
Ou
nc
es
per
To
n
Go
ld O
un
ce
s
Oz Recovered Head Grade
Monthly Production Profile Average Grade 0.41 opt
• Cut-off Grades Raised from 0.18 opt to 0.22 opt.
• Stopped Mining “Incremental Tonnage”
• Implemented Strict Ore/ Waste Segregation UG
• Increasing UG Delineation Drilling in SMC
• Employing more UG Geologists
• Assay Lab is Manned 24/7
• Restructuring Organization
• Implementing Leadership Training
• Looking to Upgrade MIS
www.klgold.com 15 TSX/AIM:KGI
0.37
0.40
0.37
0.32
0.41
0.37 0.31 0.33
0.37 0.39
0.41
0
0.05
0.1
0.15
0.2
0.25
0.3
0.35
0.4
0.45
-
50,000
100,000
150,000
200,000
250,000
FY2007
08 09 10 11 12 13 14 15 16 17
Ou
nc
es
per
To
n
Go
ld O
un
ce
s
Oz Recovered Guidance Head Grade
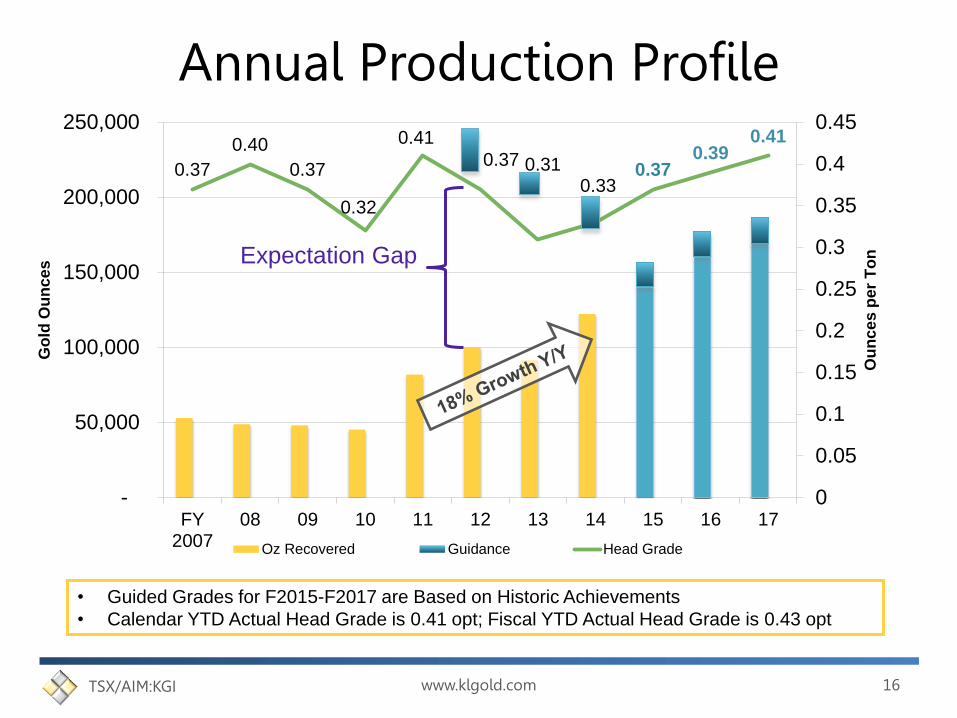
Annual Production Profile
Expectation Gap
• Guided Grades for F2015-F2017 are Based on Historic Achievements
• Calendar YTD Actual Head Grade is 0.41 opt; Fiscal YTD Actual Head Grade is 0.43 opt
www.klgold.com 16 TSX/AIM:KGI

F2014 & Q1 F2015 Financial Results
Financial FY2014 FY2013 Y/Y
Change Q1/14 Q4/14 Q1/15
Q1/15
vs.
Q1/14
Q1/15
vs.
Q4/14
Comments
Gold Sales
(ounces) 125,273 91,771 +37% 30,253 30,771 38,543 +27% +25%
Sold 10,903 ounces at C$1,419
up to September 30th
Average
Price ($)
(per ounce) 1,383 1,653 -16% 1,435 1,376 1,401 -2% +2%
Revenue
(000’s) 173,258 151,692 +14% 43,421 42,356 54,000 +24% +27%
H2/15 tons are expected to increase by
+10% to ~1,100 – 1,250 tpd, which will
positively impact the Cost Per Ton
Cash
Operating
Cost per
Ton
Produced
343 335 +2% 344 352 340 -1% -3% Objective is for Cost Per Ton of ≤ $300
in H2/2015
Cash
Operating
Cost per
Ounce
Produced
1,078 1,109 -3% 1,113 1,000 788 -29% -21% F2015 Objective is for Cash Cost Per
Ounce of ≤ $800
AICC per
Ounce
Produced 1,986 2,432 -18% 2,094 1,774 1,250 -40% -30% F2015 Objective is for AICC < $1,250
All amounts stated are in Canadian dollars
www.klgold.com 17 TSX/AIM:KGI

All-In Cash Cost (AICC) $
1,1
27
$1,3
07
$956
$1,1
56
$1,1
12
$1,0
52
$1,4
03
$1,1
87
$839
$1,0
73
$1,1
19
$836
$1,2
44
$720
$614
-
2,000
4,000
6,000
8,000
10,000
12,000
14,000
16,000
18,000
$-
$500
$1,000
$1,500
$2,000
$2,500
$3,000
MAY2013
JUN JUL AUG SEP OCT NOV DEC JAN FEB MAR APR MAY2014
JUN JUL
Ou
nces
C$ p
er
Ou
nce
Production Capital Development PP&E Corporate Exploration Royalties Oz Produced
Ounces Produced
All amounts stated are in Canadian dollars
• 16% Reduction in Labour Force and Cancelled Incentive Programs (e.g. home loan assistance and travel)
• Major Capital Projects (PP&E) Completed in January 2014
• Adjusted Shift Schedules
www.klgold.com 18 TSX/AIM:KGI

AICC Projection for F2015
-
2,000
4,000
6,000
8,000
10,000
12,000
14,000
16,000
18,000
$-
$500
$1,000
$1,500
$2,000
$2,500
FEB MAR APR MAY2014
JUN JUL AUG SEP OCT NOV DEC JAN FEB MAR APR
Ou
nces
C$ p
er
ou
nce
Production Capital Development PP&E Corporate Exploration Royalties Oz Produced
Ounces Produced
$1,350
ESTIMATED
All amounts stated are in Canadian dollars
• Projection Based on Assumptions of 1,150 tpd, 0.37 opt and 96% Mill Recovery
• KGI Beginning to Generate FCF
• Fairly High Degree of Variability Remains until more High Grade Stopes come online
www.klgold.com 19 TSX/AIM:KGI
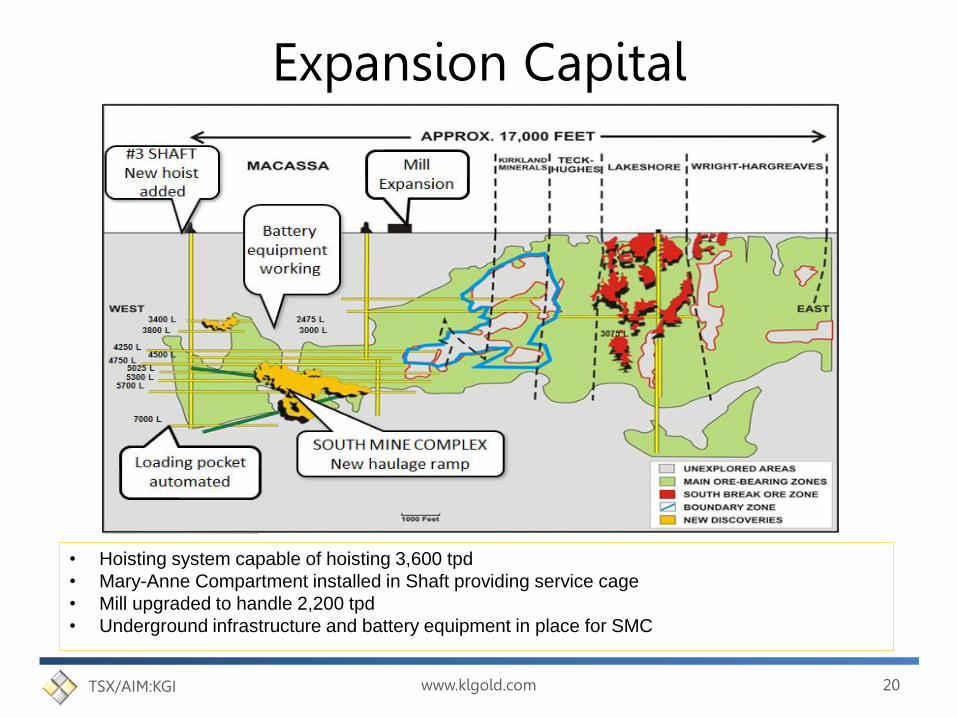
Expansion Capital
• Hoisting system capable of hoisting 3,600 tpd
• Mary-Anne Compartment installed in Shaft providing service cage
• Mill upgraded to handle 2,200 tpd
• Underground infrastructure and battery equipment in place for SMC
www.klgold.com 20 TSX/AIM:KGI

Capital Expenditures
• Project Capital was Completed in January 2014
• C$9M in Capital Development of 5400L and SMC Main Decline to
5600L Spent in FY15
0
10
20
30
40
50
60
70
80
90
100
2010 2011 2012 2013 2014 2015E 2016E 2017E
C$ M
illi
on
s
Mineral Properties PP&EESTIMATED
9.7
22.4 30.9 45.8 46.9 55.0 51.0 51.0 51.0
28.9
24.5 44.0
29.6 7.0 7.0 7.0
www.klgold.com 21 TSX/AIM:KGI

Exploration Potential SURFACE DRILLING • Near surface mineralization is within 2 Km’s of mill
• Mill has excess capacity of +/- 1,000 tpd
• Mineralization from 100’ to 1,000’ below surface
• Open across strike and at depth
• M&I 310,000 tons @0.34opt (11.7gpt) 104,000 oz.
• Infer. 131,000 tons @0.36opt (12.3gpt) 48,000 oz.
• 3 drills drilling to expand resource and infill drill
UG DRILLING • SMC continues to be expanded
• Multi-ounce intersections
• 3 drills turning underground
• Open in multiple directions
www.klgold.com 22 TSX/AIM:KGI

Outlook for F2015
Guidance Metric Q1/15 Actual Status
$800 – 850/ Oz Cash Operating Cost Per Ounce $788 Favourable
$1,250 - 1,350/ Oz AICC Per Ounce Produced $1,250 On Track
$58.0 million Sustaining CAPEX $12.0 million On Track
$200.0 million Revenue $54.0 million On Track
$50.0 - 60.0 million Cash Flow from Operations $17.0 million Favourable
$15.0 - 20.0 million Free Cash Flow Generation $5.0 million On Track
All amounts stated are in Canadian dollars
www.klgold.com 23 TSX/AIM:KGI

WWW.KLGOLD.COM
Suzette N Ramcharan, CPIR
Director of Investor Relations
+1-416-840-7884
Mobile: +1-647-284-5315
Tim Blythe / Halimah Hussain
(Blytheweigh)
Investor Relations / PR
+44-207-138-3204
TSX /AIM: KGI