kik k dk' - island county, washington · 2017-11-09 · kik k dk' ' i' p 1.1 p...
TRANSCRIPT

0
SECTION HI
ED
kik k Dk' ' I' P 1.1
P
Island County is comprised almost entirely of two islands, Whidbey and Camano. They are situated near the northeast shore of Puget Sound between Everett and Anacortes, Washington. The largest of the islands is Whidbey and it is bounded on the west by Admiralty Inlet and the Straight of Juan de Fuca. Camano Island is situated between Whidbey Island and the mainland. Whidbey Island has a land area of approximately 172 square miles. Camano Island has a land area of approximately 40 square miles.
The Islands are principally the result of deposits from glacial advance and reces-sion, although the northernmost part of Whidbey Island is bedrock. The surface relief of much of the County is very gradual, with elevations typically between 100 and 400 feet above sea level. A few small lakes exist. However, year-round streams are infrequent and there are no "rivers" in the County. Land cover is predominantly second growth forest, with a significant (approximately 20 percent) portion of total area used for agriculture. Soils at the surface are typi-cally shallow and may be underlain with cemented gravel or till.
The climate of the County is dominated by fairly uniform marine air influence from a prevailing westerly or southwesterly direction. Due to the proximity of the Olympic mountain range in the same direction, Island County experiences a rain shadow effect, with annual rainfall usually below 40 inches. Rainfall tends to be greater in the southern portions of Whidbey Island. The climate and soil
climate is also highly regarded for recreational uses, and occupancy increases of Island County have proven to be ideal for some kinds of agriculture. The
significantly in the summer season.
Transportation to the Islands is facilitated by bridges to Camano Island at Stanwood, and to North Whidbey Island at Deception Pass. Ferry transportation routes are Clinton-Mukilteo and Keystone (South of Coupeville)-Port Townsend.
2. POPULATION AND ECONOMY
In 1987, the population of Island County was estimated to be 52,069. By comparison, the population in 1930 was only 5,369, an average growth rate of 4 percent. A period of especially rapid growth was experienced in the County in the 1970s, with an annual growth rate over 5 percent. The historic population
fi

trend for Island County since 1900 is shown in Exhibit 111-1. Later in this Section a projection of future water supply based on population trends is presented.
More than half of Island County's population resides on North Whidbey Island, in and near the City of Oak Harbor and the Whidbey Naval Air Station (NAS). The significance of the Naval Air Station to Island County's demography is implied by the fact that, between the 1970 and 1980 census year, 31 percent of the population moving to the County was from out of state. No other county in the state had a higher percentage (state average = 16 percent). The NAS Draft Master Plan Update in 1987 reports that military and federal civil service retirement income in the County in 1984 was $38 million, as compared to the total of all earnings by non-governmental industry of $81 million. These figures also indicate the potential impact of significant changes at the NAS on planning for future water supply needs.
The population of central Whidbey Island is concentrated near the business centers of Coupeville (the County seat) and Greenbank. This area of Whidbey Island also supports significant agricultural land use. Rate of population growth has been roughly the same as North Whidbey.
South Whidbey Island is primarily residential, with more seasonal dwelling units, but business centers are located at the City of Langley and communities of Freeland and Clinton. Approximately 19 percent of Whidbey Island's perma-nent population resides in South Whidbey. However, according to Planning Department estimates, approximately two-thirds of Whidbey's seasonal popula-tion impact is felt there. A significant factor in the South Whidbey economy is proximity to the metropolitan area near Everett via the Mukilteo Ferry.
Camano Island makes up approximately 12 percent of the County's total perma-nent population, although its population approximately doubles with seasonal population. The character of Camano Island is more pastoral than that of Whidbey. Most commercial activity occurs off-island in the Town of Stanwood.
In all areas of Island County the near-shore lands are preferred for residential development. The natural beauty of surrounding Puget Sound, the Cascade and Olympic mountain ranges, and the lands of Island County itself have attracted a steady growth in platted lands and dwellings over the last 20 years.
3. WATER DEMAND FORECAST
Planning for future water supply needs requires projection of demand for both short- and long-term periods. The short-term (10-year) projections are generally necessary to define needed capital improvements. Such improvements require lead time for financing, design, and construction. Longer term forecasts are needed to estimate resource requirements. Resource decisions inherently have
III-2
I:
far-reaching implications. Any forecast of 50-year outlook is highly uncertain. However, in the absence of some quantification of future water supply require-ment, essential resource planning decisions may not be addressed in a timely manner. A need for periodic review and update of long-range forecasts is recognized.
Water demand is a complex and dynamic variable. Each individual household or water user is a locus of a particular demand characteristic. At any given point of use, demand varies from zero to some peak value, which may be equal to the maximum capacity of the supply system. The sum of all point of use demand characteristics gives an overall pattern of demand which must be met, at least partially, by the public water system.
Some uses are relatively fixed in terms of quantity and time. An example might be domestic toilet or shower use. This component is fairly predictable, based on occupancy, typical fixtures, and normal expected use pattern. Other uses may be variable. Irrigation use, for example, is highly dependent on season, crop and climate. Commercial and industrial demand may follow various patterns, based on the type of use. A plant nursery, for instance, probably requires more total water resource than a wood-working shop, although the latter may some day require a great deal of water in a short time for fire control.
Public water systems normally plan for water supply needs based on customer growth. It is crucial to the public water system that enough supply be developed to assure a high degree of service reliability. Therefore, water systems normally attempt to be somewhat conservative in planning expected needs.
To determine the future needs, a reasonable assessment must be made of the number and type of customers expected to be served. This projection must extend as far as practical to determine the quantity requirements for source development. The water system manager will attempt to anticipate the appro-priate need and match it to the local knowledge of resource availability. The need is usually predicted by selecting a nominal value representing average daily and peak use per customer for the expected customer mix. Essentially, this same approach is utilized by the Department of Ecology (Ecology) in allocating quan-tities for a water right permit.
In the Coordinated Water System Plan (CWSP), the forecast of water demand is at a larger scale than normally used for a water right or system evaluation. Since the quantities are significantly larger, it is desirable to use as precise as possible a forecast, to minimize implications for other uses of the water resource. The most sophisticated techniques of econometric modeling provide a greater level of precision, and also allow indexing of forecasted demand to other factors which can be measured in future years.
III-3
fM•
An econometric forecast, however, is not possible for Island County now due to a lack of the detailed data required, and the significant cost of such a forecast. Instead, a forecast was prepared using population projections by the Office of Financial Management of Washington (OFM), and Island County Planning Department (ICPD). The forecasted population was converted to water demand using an estimate of water need on a per capita basis. This approach is adequate for the purpose of the CWSP, but should be verified and revised based on a more complete data base, and possibly an econometric forecast, at a later date. In any event, the projections of the CWSP will need to be revised at the time of the 5-year update.
Island County is rural to transitional, with minimal industrial water use. In similar study areas in the Northwest, daily per capita demand of between 80-120 gallons is typical. Information collected from Class 1 water systems during preparation of the CWSP indicated an average water demand of about 90 gallons per capita per day. This factor is based upon the total volume of water delivered by water systems and the permanent population served. However, the total water delivered includes some service to commercial, institutional, and other non-population uses, as well as typical lawn irrigation use. These other uses are usually much less than domestic use except in highly urbanized areas. Individual homes served by a single well are expected to have essentially the same demand for water, except where significant irrigation use is also involved. Agricultural, mining, and other non-domestic uses are not included because they are not directly related to population. A factor of 100 gallons per capita per day was chosen to use, with projected population, to estimate long-range future water demand and resource requirement for Island County. This value is an estimate of average daily use. Peak use is estimated as 250 gallons per capita per day.
Exhibit BM and Table 111-1 show population projections, through the year 2000, published by OFM, in 1986 Population Trends for Washington State, and by ICPD. The long-range projection of seasonal population impact must consider that with overall growth occurring there will be some conversion of seasonal to permanent residences. Also, urbanizing areas will see much higher rates.
The OFM is responsible for projecting population in areas of the State for the purpose of revenue forecasting. Such forecasts tend to be conservative so as not to over-estimate revenues. The ICPD estimate is for planning of needed public services and land use management. Ordinarily these forecasts tend to be liberal so as to identify problems soon enough to provide solutions. Both forecasts extend through the year 2000. Inspection of Exhibit III-1 suggests that both are generally consistent with the long-term historical growth of population.

The typical population growth curve is shaped as an elongated "S", with a "steep" region of nearly linear growth followed by a period of declining growth rate (Water Supply and Pollution Control; Clark, LW., et.al.; 2nd ed., 1971; International Textbook Company; p. 96). This growth rate decline is attributed to the population approaching a maximum capacity. Island County's growth appears to be in a portion of the typical curve which is represented by approxi-mately linear behavior.
In Exhibit III-1 and Table both projections are extended to the year 2040 using a straight line extrapolation. The Environmental Impact Statement (EIS) for Island County's Comprehensive Plan estimates the County's peak population holding capacity (which would include seasonally occupied dwellings), based on the optimal land use pattern and permitted density, as 184,000. This is an approximate figure and does not account for many factors which are able to limit or expand growth, such as changes in regional economic conditions, environmen-tal and social costs added to development, revised County growth policies, etc.
A forecast of seasonal population was prepared using an adaptation of data and methodology by the ICPD. In the Comprehensive Plan EIS, and later in Population Trends in Island County, furnished by ICPD, an estimate of seasonal population is provided. This estimate is based on a special census of seasonal housing in 1977. Adjusting for the 1980 census populations, a seasonal increase of 11,200 persons is estimated. By comparison, the reported "unoccupied" dwellings in the 1980 census (January 31), if occupied by an average of 2.5 persons, .would estimate a seasonal population of 7,410. The census figure does not include transitory dwelling units such as hotel rooms, and unoccupied mobile home or trailer sites, and other transitory units. The 1987 Annual Membership Report of the Island County Economic Development Council identifies approxi-mately 420 hotel/motel rooms in Island County. Thus, the ICPD figures appear to be reasonable if all levels of seasonal population impacts are considered.
Peak resident population forecasted by the OFM extrapolation to year 2040, including seasonal, is 170,100. Using the ICPD extrapolation, an estimate of 201,340 is obtained. These figures are both near the Comprehensive Plan esti-mate of holding capacity.
It is not possible, given available information, to select the most probable long-term growth forecast from the above alternatives. However, recent OFM popu-lation estimates (1987 Population Trends for Washington State, F87-08) give Island County's 1987 population as 52,100, which is approximately in line with the OFM projections. Both projections are used for water demand evaluation. The ICPD forecast should be considered a high growth scenario, while the OFM forecast is a moderate growth scenario.
111

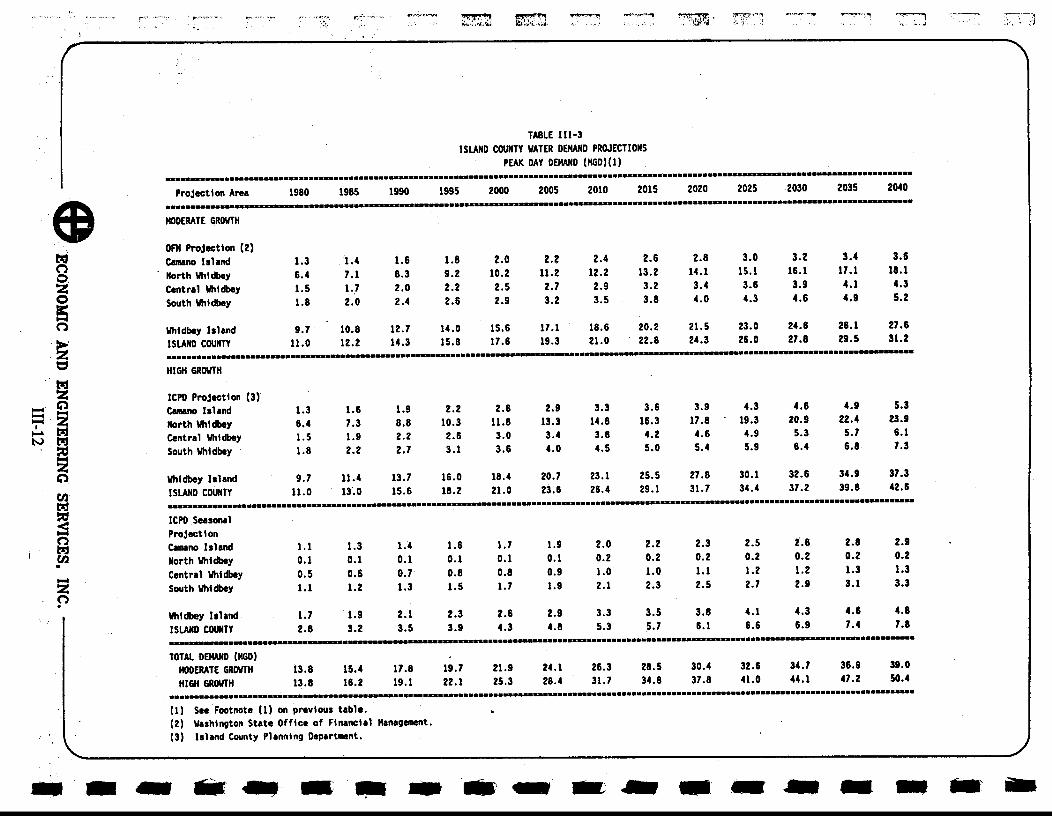
Table shows the average daily demand projection for Island County, and for the four sub-areas, estimated through the year 2040. Peak day projections, based on the same population data, and using a demand factor of 250 gallons per capita per day, are shown in Table 111-3. Additional data is also provided in Appendix C.
It is possible, and even likely, that the demand patterns for a given area will change with time. Two important factors are increased urbanization and the impact of conservation. Urbanization will tend to increase a per capita use rate and conservation will cause decrease. Both of those influences have practical limits to the quantitative impact that may be felt.
In Island County, conservation must be considered an immediate priority because of the limitation of resource and the cost of alternative supplies. However, since most of Island County's water supplies are not metered it would be difficult to monitor the effectiveness of a conservation program. In areas where aggressive conservation has been applied, demand reductions of up to 10 percent have been realized by retrofitting alone. The expected effect of conser-vation on water demand growth is to decrease the rate of growth of all new demand by an amount corresponding to the conservation effectiveness. If conservation is also applied to existing demand, the growth of total demand will be reduced further, and total demand could even experience a decline. However, this effect would be shorter term, lasting only until conservation effects had been maximized among current water users.
A summary of the projected long-term water supply requirements, therefore, for domestic use in Island County is as follows:
PROJECTED DOMESTIC WATER SUPPLY REQUIREMENT IN THE YEAR 2040 (1)(6)
Moderate Growth Demand (2)
High Growth Demand (3)
Average Peak Daily Daily
Average Peak "lay Daily
Camano 1.9 6.5 2.6 8.2
North Whidbey (4)(5) 7.2 18.3 9.6 24.1 Central Whidbey (4) 1.9 5.6 2.6 7.4 South Whidbey (4) 2.7 8.5 3.5 10.6
11.8 32.4 15.7 42.1 Total Whidbey
Total County 13.7 38.9 18.3 50.3
III-6

(1) Supply requirement given in MGD, includes current demand. One MGD is approximately equivalent to 700 gpm or 1,120 acre-feet per year.
(2) Based on population projection by OFM. (3) Population projection by ICPD. (4) Whidbey Island divided into three subareas according to census division. (5) Total supply requirement including that which is met by the Oak Harbor
pipeline. Pipeline capacity is approximately 10 MGD. Projected average daily flow for the existing pipeline in year 2010 is 5.3 MOD, based on Oak Harbor estimates.
(6) Projections do not include agriculture, mining, and other non-domestic water supply uses. Projections also do not include the possible impact of an effective conservation program.
Based on current estimated demand (1985), the additional water supply needed in the next 10, 25, and 50 years is as follows:
ESTIMATED ADDITIONAL WATER SUPPLY NEEDED (Average Daily Demand) (1)
Estimated Additional Supply Needed Above Current Current Year 2000 Year 2015 Year 2040 . Demand Mod, High Mod. High Mod. High
Camano 0.8 0.3 0.5 0.6 1.0 1.1 1.8
North Whidbey 2.9 1.2 1.8 2.4 3.6 4.3 6.7 Central Whidbey 0.8 0.3 0.5 0.7 1.1 1.1 1.8 South Whidbey 1.0 0,5 0.7 0.2 12 _25 Total Whidbey 4.7 2.0 3.0 4.0 6.1 7.1 11.0
Total County 5.5 2.3 3.5 4.6 7.1 8.2 12.8
(1) See Footnote (6) from previous table.
Using the water supply requirements forecasted for the High Growth case, a total demand reduction resulting from a 10 percent conservation effectiveness represents up to 1.8 MGD through the year 2040. This is approximately 14 percent of the high forecast of future supply requirement. In the short-term, however, the resource amount represented by the conservation option will be substantially less. Nevertheless, the intrinsic conservation potential in existing uses (approximately 0.6 MGD if 10 percent conservation is assumed) should be considered an important short-term option to increase water resource availabil-ity and defer the more costly and difficult supply alternatives.
III-7

TABLE III-1
ISLAND COUNTY POPULATION PROJECTIONS
Protection : 1980 : 1985 : 1990 : 1995 : 2000 : 2005 : 2010 : 2015 : 2020 : 2025 : 2030 : 2035 : 2040 : : : • . : : : : : •
MODERATE GROWTH : . • . : : : : : : : : : : • . •
OFH Projection (1) : : : . : : : : : : Conn* Island 5,080 : 5,674 : 6,569 : 7,349 : 8,129 : 8,909 : 9,689: 10,469 : 11,249 : 12,029 : 12,809: 13,589 : 14,369
North Whidbey : 25,535 : 28,522 : 33,021 : 36,941 : 40,860: 44,780 : 48,699 : 52,619 : 56,538 : 60,458: 64,377 : 68,297 : 72,216
Central Whidbey . : 6,144 : 6,863 : 7,945 : 8,888 : 9,831: 10,774 : 11,717 : 12,660 : 13,603 : 14,546 : 15,489 : 16,432: 17,375 South Whidbey 7,289 : 8,142 : 9,426 : 10.545 : 11.663 : 12,781 : 13,899: 15,017 : 16,135 : 17,253 : 18,371: 19,489: 20,607
Whidbey Island ! 38,968: 43,527 : 50,392 : 56,374: 62,354: 68,335 : 74,315 : 80,296 : 86,276: 92,257 : 98,237 : 104,218 : 110,198
ISLAND COUNTY : 44,048: 49,201: 56,961 : 63,723: 70,483: 77,244: 84,004: 90,765: 97,525 : 104,286 : 111,046 : 117,807 : 124,567
}RICH GROWTH : ; : : : : : : : : : . : •
ICPD Projection (2) . : : : : : . : : Canano Island
! 5,100 : 6,300 : 7,600 : 8,950 : 10,300 : 11,650 : 13,000 : 14,350 : 15,700: 17,050 : 18,400 : 19,750 : 21,100
North Whidbey .25,500 : 29,100 : 35,000 : 41,050 : 47,100 : 53,150 : 59,200 : 65,250 : 71,300 : 77,350 : 83,400 : 89,450: 95,500
Central Whidbey 6,100 : 7,400 : 8,900 : 10,450 : 12,000 : 13,550: 15,100: 16,650: 18,200 : 19,750 : 21,300 : 22,850 : 24,400
South Whidbey 7,300 : 8,800 : 10,600 : 12,450 : 14,300: 16,150 : 18,000 : 19,850: 21,700: 23,550 : 25,400 : 27,250 : 29,100
Whidbey Island : 38,900: 45,300: 54,500: 63,950: 73,400 : 82,850: 92,300 : 101,750 : 111,200 : 120,650 : 130,100 : 139,550 : 149,000
ISLAND COUNTY : 44,000: 51,600: 62,100: 72,900: 83,.700: 94,500 : 105,300 : 116,100 : 126,900 : 137,700 : 148,500 : 159,300 : 170,100 : •
ICPD Seasonal :- : • Protection (3) : : . : : : : : : : :
Camano Island 4,500 : 5,080 : 5,700 : 6,300 : 6,900 : 7,500 : 8,100 : 8,700 : 9,300 : 9,900 : 10,500 : 11,100 : 11,700
North Whidbey 300 : 340 : 380 : 440 : 500 : 560 : 620 : 680 : 740 : 800 : 860 : 920 : 980
Central Whidbey 2,200 : 2,480 : 2,780 : 3,040 : 3,300 : 3,560 : 3,820 : 4,080 : 4,340 : 4,600 : 4,860 : 5,120 : 5,380
South Whidbey 4,200 : 4,750 : 5,330 : 6,115 : 6,900 : 7,685 : 8,470 : 9,255: 10,040 : 10,825 : 11,610 : 12,395: 13,180
Whidbey Island 6,700 : 7,570 : 8,490: 9,595: 10,700: 11,805 : 12,910: 14,015: 15,120: 16,225 : 17,330: 18,435 : 19,540
ISLAND COUNTY : 11,200: 12,650: 14,190: 15,895: 17,600: 19,305: 21,010: 22,715: 24,420: 26,125: 27,830: 29,535: 31,240
TOTAL POPULATION • •
MODERATE GROWTH : 55,248 : 61.851 : 71,151: 79,618 : 88,083 96,549 : 105,014 : 113,480 : 121,945 : 130,411 : 138,876 : 147,342 : 155,807
HIGH GROWTH :55,200: : 64,250 : 76,290: 88,795 ; 101,300 : 113,805 : 126,310 : 138,815 : 151,320 : 163,825 : 176,330 : 188,835 : 201,340 . : : : : : : •
I
C:,
-z doC)
tTl [21 2J z
GO 01 VJ
00 G0
z
OIN
ION
OD
a

MO INS elle 'VW 111111k 11111 AIM "lin 310 Ma 71111,1 1110 'Mit INS al 'Mk 71111111 APS -Nat
TABLE III-1 continued
Ewing= (1) Washington State Office of Financial Management -
(2) Island County Planning Department - Resident Pop
(3) Using data collected by ICPD in the Environmental Beyond 2000, a constant increase is assumed.
Cri (-) O
O
z
z
.60
tri
LT!
to
Resident Population, 1984 Forecast.
ulation.
Impact Statement for the Island County Comprehensive Plan, which projects seasonal population from 1980-2000.

3IN
ION
03
3
'3N
1 IS
30
IAZ
I3S
1980 : 1985 : 1990 : 1995 : : : : :
: : : :
2000: 2005: 2010: 2015: 2020 : 2025 • . • .
: :
: •
: :
:
: :
:
77213 777
TABLE 111-2
ISLAND COUNTY PUBLIC WATER SUPPLY DEMAND PROJECTIONS AVERAGE DAILY DEMAND (MGDVII
: 2030: 2035: 2040 • . : • . :
• :
• . 0.5 • . 0.6 : 0.7 • . 0.7 • . 0.9 : 1.0 ! 1.0 : 1.1 : 1.2 : 1.3 : 1.4 : 1.4 2.6 • . 2.9 : 3.3 • .
3.7 : 0.8 • . 4.5 5.3 : 5.7 : 6.0 : 6.4 : 6.8 : 7.2
0.6 • . 0.7 : 0.8 • . 0.9 : 4.1
: 1.0 • . 1.1 : 4.9
: 1.2 . 1.3 : 1.4 : 1.5 : 1.5 : 1.6 : 1.7 0.7 • . 0.8 : 0.9 • . 1.1 : 1.2 • . 1.3: 1.4 : 1.5 : 1.6 : 1.7 : 1.8 : 1.9 : 2.1 3.9 • . 4.4 : 5.0 • . 5.7 : 6.3 • . 6.9 : 7.5 • . 8.1 : 8.7 : 9.2 : 9.7 : 10.3 : 11.0
• . : • . : • . : •
4.4 • . 5.0 : 5.7 • . 6.4 • . . • 9.1 : 9.8 : 10.4 : • 11.0 : 11.7 :12.4 • . . :
: 7.1 7.8 : 8.5 : : : : •
: • . : : : : : : :
: : •
ICPD PROJECTION (3): • . : . : • . : • . : • . : . :
Camano Island : 0.5 • . 0.6 : 0.8 • . 0.9 : 1.0 : 1.2 : 1.3 : 1.4 : 1.6 : 1.7 : 1.8 : 2.0 : 2.1 North Whidbey : 2.6 • . 2.9 : 3.5 4.1 : 4.7 : 5.3 5.9 . 6.5 : 7.1 : 7.7 : 8.3 : 8.9 : 9.6 Central Whidbey : 0.6 : 0.7 : 0.9 ! 1.0 : 1.2 : 1.4 : 1.5 • . 1.7 : 1.8 : 2.0 : 2.1 : 2.3 : 2.4 South Whidbey : 0.7 0.9 : 1.1 1.2 : 1.4 1.6 : 1.8 2.0 : 2.2 : 2.4 : 2.5 : 2.7 : 2.9 Whidbey Island : 3.9 • . 4.5 : 5.5 • . 6,3 : 7.3 : 8.3 : 9.2 : 10.2 : 11.1 : 12.1 : 12.9 : 13.9 : 14.9
ISLAND COUNTY : 4.4 : 5.1 : 6.3 : 7.2 : 8.3 : 9.5 : 10.5 : 11.6 : 12.7 : • 13.8 : 14.7 : • 15.9 : 17.0
ICPD SEASONAL
PROJECTION (3) : • . : • . : : : . : • Camano Island : 0.2 : 0.2 : 0.2 : 0.3 : 0.3 : 0.3 : 0.4 : 0.4 : 0.4 : • 0.4 : 0.5 : 0.5 : 0.5 North Whidbey : 0.0 : 0.0 : 0.0 : 0.0 : 0.0 : 0.0 : 0.0 : 0.0 : 0.0 : 0.0 : 0.0 0.0 : 0.0
Central Whidbey : 0.1 : 0.1 : 0.1 : 0.1 : 0.1 : 0.2 : 0.2 : 0.2 : 0.2 . 0.2 : 0.2 : 0.2 : 0.2 South Whidbey : 0.2 : 0:2 : 0.2 : 0.3 : 0.3 : 0.3 : 0.4 : 0.4 : 0.4 : 0.5 : 0.5 : 0.5 : 0.6 Whidbey Island : 0.3 : 0.3 : 0.3 : 0.4 : 0.4 : 0.5 : 0.6 : 0.6 : 0.7 : 0.7 : 0.8 : 0.8 : 0.8
ISLAND COUNTY : 0.5 : 0.5 : 0.6 : 0.7 : 0.8 : 0.8 : 1.0 : 1.0 : 1.0 • .
•
1.1 : 1.2 • 1.2 : 1.3
TOTAL DEMAND (MGD) :
: . . : . . : •
MODERATE GROWTH : 4.9 : • 5.5 : 6.3 : 7.1 : 7.8 : 8.6 : 9.4 : 10.1 : 10.8 : 11.6 : 12.3 : 13.1 : 13.8 HIGH GROWTH : 4.9 : 5.6 : 6.8 : 8.0 : 9.1 : 10.3 : 11.5 : 12.6 : 13.7 : 14.9 : 16.1 : 17.2 : 18.3
: : : : : : •
Projection : :
MODERATE ARWIR :
OFM PROJECTION (2) : Camano Island : North Whidbey : Central Whidbey : South Whidbey : Whidbey Island :
: ISLAND COUNTY :
: HIGH GROWTH :
nil Nag In 'Wit Olt 111111 INN mit au rim ism 1111111 SIM OR
TABLE 111-2 continued
Footnotes;
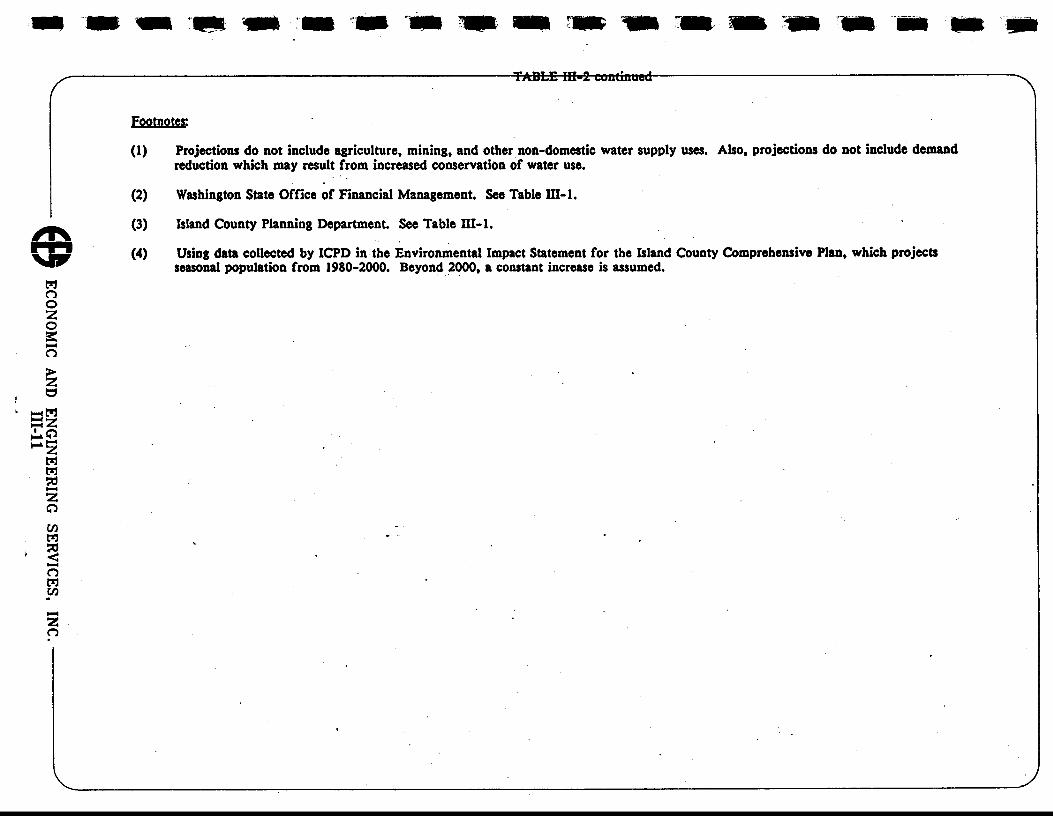
(1) Projections do not include agriculture, mining, and other non-domestic water supply uses. Also, projections do not include demand reduction which may result from increased conservation of water use.
(2) Washington State Office of Financial Management. See Table HI-1.
(3) Island County Planning Department. See Table
(4) Using data collected by ICPD in the Environmental Impact Statement for the Island County Comprehensive Plan, which projects seasonal population from 1980-2000. Beyond 2000, a constant increase is assumed.
#11%
tri c") O z 0
z
Z tzl
tTJ tTj
z 0
to tz,
rzi
aN
Y 3IN
01
03a
TABLE 111-3 ISLAND COUNTY WATER DEMAND PROJECTIONS
PEAK DAY DEMAND (MOM
Projection Area 1980 1985 1990 1995 2000 2005 2010 2015 2020 2025 2030 2035 2040 MM.
MODERATE GROWTH
OFM Projection (2) Camano Island 1.3 1.4 1.6 1.8 2.0 2.2 2.4 2.6 2.8 3.0 3.2 3.4 3.6
North Whidbey 6.4 7.1 8.3 9.2 10.2 11.2 12.2 13.2 14.1 15.1 16.1 17.1 18.1
Central Whidbey 1.5 1.7 2.0 2.2 2.5 2.7 2.9 3.2 3.4 3.6 3.9 4.1 4.3
South Whidbey 1.8 2.0 2.4 2.6 2.9 3.2 3.5 3.8 4.0 4.3 4.6 4.9 5.2
Whidbey Island 9.7 10.8 12.7 14.0 15.6 17.1 18.6 20.2 21.5 23.0 24.6 26.1 27.6
ISLAND COUNTY 11.0 12.2 14.3 15.8 17.6 19.3 21.0 22.8 24.3 26.0 27.8 29.5 31.2 IMO NOMINMIIM
HIGH GROWTH
ICPD Projection (3) Camano Island 1.3 1.6 1.9 2.2 2.6 2.9 3.3 3.6 3.9 4.3 4.6 4.9 5.3
North Whidbey 6.4 7.3 8.8 10.3 11.8 13.3 14.8 16.3 17.8 - 19.3 20.9 22.4 23.9
Central Whidbey 1.5 1.9 2.2 2.6 3.0 3.4 3.8 4.2 4.6 4.9 5.3 5.7 6.1
South Whidbey 1.8 2.2 2.7 3.1 3.6 4.0 4.5 5.0 5.4 5.9 6.4 6.8 7.3
Whidbey Island 9.7 11.4 13.7 16.0 18.4 20.7 23.1 25.5 27.8 30.1 32.6 34.9 37.3
ISLAND COUNTY 11.0 13.0 15.6 18.2 21.0 23.6 26.4 29.1 31.7 34.4 37.2 39.8 ...........
42.6
.11•MatfiliMamarnaimMatrnimmatalOMMOmMAIMM.INMSNImmirni
ICPD . Seasonal Projection Camano Island 1.1 1.3 1.4 1.6 1.7 1.9 2.0 2.2 2.3 2.5 2.6 2.8 2.9
North Whidbey 0.1 0.1 0.1 0.1 0.1 0.1 0.2 0.2 0.2 0.2 0.2 0.2 0.2
Central Whidbey 0.5 0.6 0.7 0.8 0.8 0.9 1.0 1.0 1.1 1.2 1.2 1.3 1.3
South Whidbey 1.1 1.2 1.3 1.5 1.7 1.9 2.1 2.3 2.5 2.7 2.9 3.1 3.3
Whidbey Island 1.7 1.9 2.1 2.3 2.6 2.9 3.3 3.5 3.8 4.1 4.3 4.6 4.8
ISLAND COUNTY 2.8 3.2 3.5 3.9 4.3 4.8 5.3 5.7 6.1 6.6 6.9 7.4 7.8
uw..us.w...s
TOTAL DEMAND (MGD) MODERATE GROWTH 13.8 15.4 17.8 19.7 21.9 24.1 26.3 28.5 30.4 32.6 34.7 36.9 39.0
HIGH GROWTH 13.8 16.2 19.1 22.1 25.3 28.4 31.7 34.8 37.8 41.0 44.1 47.2 50.4
(1) See Footnote (1) on previous table. (2) Washington State Office of Financial Management. (3) Island County Planning Department.
1
111111 111111 IR sit am air omr an is on me 1111111 OR Mt

PROJECTIONS HISTORICAL DATA
I.C.P.D. ESTIMATED HOLDING CAPACITY (SEE TEXT)
MODERATE GROWTH
EXTRAPOLATIONS IP■
MP INS MO III WI -MS -11111 111111 lilt alit WOO MIS WO ant 11111111
EXHIBIT III-1
ISLAND COUNTY POPULATION TRENDS
200 190-
180-170-160-150- 140- 130- 120 -
U,
0 - 100 -
g 90 -
80 -70
60 - 50 -40 -30 -20 -
10 -
0
1900 1920 1940 1960 1980 I I
2000 2020 I I
2040
YE AR e ECONOMIC AND ENGINEERING SERVICES, INC.
PO
PU
LATI
ON