kinematic and kinetic comparison between baseball pitching ... · kinematic and kinetic comparison...
TRANSCRIPT

DURNAL OF APPLIED BIOMECHANICS, 1996,12,207-224 0 19% by Human Kinetics Publishers, Inc.
Kinematic and Kinetic Comparison Between Baseball Pitching
and Football Passing
Glenn S. Fleisig, Rafael E Escamilla, lames R. Andrews, Tomo yuki Matsuo, Yvonne Sattenwhite,
and Steve W Barrentine
Kinematic and kinetic aspects of baseball pitching and football passing were com- pared. Twenty-six high school and collegiate pitchers and 26 high school and colle- giate quarterbacks were analyzed using three-dimensional high-speed motion analy- sis. Although maximum shoulder external rotation occurred earlier for quarterbacks, maximum angular velocity of pelvis rotation, upper torso rotation, elbow extension, and shoulder internal rotation occurred earlier and achieved greater magnitude for pitchers. Quarterbacks had shorter strides and stood more erect at ball release. During arm cocking, quarterbacks demonstrated greater elbow flexion and shoulder horizon- tal adduction. TO decelerate the arm, pitchers generated greater compressive force at the elbow and neater comvressive force and adduction torque at the shoulder. These results may help explain differences in performance and injury rates between the two sports.
Many talented athletes are both the quarterback on their school's football team and a pitcher on their baseball team. However, it is unknown whether participation in both activities is beneficial or detrimental to the athlete's performance and safety.
Theoretically, a football can be used as an overload weighted implement to strengthen the arm of a baseball pitcher, as it has been documented that overload training can increase the velocity of pitching regulation 0.14-kg (5-oz) baseballs. Brose and Hanson (1967) used college baseball players to study the effects that training with 0.28-kg (10- oz) overweight baseballs had on throwing velocity using regulation baseballs. They found a significant increase in throwing velocity subsequent to a 6-week overload training pro- gram. Litwhiler and Hamm (1973) included 5 college pitchers in a 12-week overload study using 0.20-kg (7-02) to 0.34-kg (12-oz) baseballs and found that velocity for regu- lation baseballs increased an average of 5 m/s (1 1 mph) due to the 12-week training ses- sions. DeRenne, Buxton, Hetzler, and Ho (1994) studied the effects on throwing velocity of regulation baseballs due to training with underweight (0.1 1 -kg) and overweight (0.17- kg) baseballs. In their study, a sample of 45 high school and 180 college baseball pitch- ers were randomly divided into three groups. Two groups used training programs that incorporated pitching underweight, overweight, and regulation baseballs, while the third
The authors are with the American Sports Medicine Institute, 1313 13th St. South, Birming- ham, AL 35205.

I
Fleisig, Escarnilla, Andrews, et a/. i group trained with regulation baseballs only (i.e., control group). After 10 weeks of train- ing, the two experimental groups had significantly increased their velocity of pitching regulation baseballs, while the control group had no significant change. These studies indicate that training with slightly overweight baseballs can significantly increase the ve- locity of pitching regulation weight baseballs. A football, however, weighs three times as much as a baseball (0.42 kg vs. 0.14 kg), and no published study has examined the effi- cacy of training baseball pitchers with footballs. Nevertheless, some college and profes- sional baseball coaches advise their pitchers to throw a football during the off-season (DeRenne & House, 1993).
Participation as both a pitcher and a quarterback may improve the athlete's perfor- mance on the football field as well. Because a baseball is lighter than a football, pitchers are believed to generate greater arm speed than quarterbacks. Thus, quarterbacks may be able to improve arm speed by training with baseball pitching. No study has examined the efficacy of underload weighted training for football quarterbacks.
In addition to enhancing performance, the throwing athlete is also interested in minimizing the risk of injury. By quantifying and comparing kinematic and kinetic as- pects of these two throwing activities, previously proposed injury mechanisms can be evaluated. While several studies have documented kinematic and kinetic parameters dur- ing baseball pitching (Atwater, 1979; Campbell eta]., 1994; Dillman, Fleisig, & Andrews, 1993; Elliott & Anderson, 1990; Elliott, Grove, Gibson, & Thurston, 1986; Feltner & Dapena, 1986; Fleisig, 1994; Fleisig, Dillman, Escarnilla, & Andrews, 1995; Gainor, Piotrowski, Puhl, Allen, & Hagen, 1980; Horn, 1984; Pappas, Zawacki, & Sullivan, 1985; Sakurai, Ikegami, Okamoto, & Yabe, 1990; Sakurai, Ikegami, Okamoto, Yabe, & Toyoshima, 1993; Vaughn, 1985b; Werner, Fleisig, Dillman, & Andrews, 1993), minimal information about the kinematic and kinetic aspects of football passing is available (Rash & Shapiro, 1995), and no study has compared the biomechanics of the two throws. The purpose of this study was to compare kinematic and kinetic parameters of baseball pitch- ing to football passing; results were evaluated relative to potential benefits and detriments of participation in both activities.
Methods
'Ihenty-six quarterbacks (13 collegiate, 13 high school) and 26 baseball pitchers (I3 col- legiate, 13 high school) were subjects for this study. All 52 athletes were healthy males who were active on their schools' teams at the time of testing. Mean height was 1.84 f 0.06 m for the quarterbacks and 1.84 f 0.07 m for the pitchers. The quarterbacks had a mean mass of 82.0 f 8.3 kg and the pitchers had a mean mass of 80.2 +_ 10.5 kg.
After completing informed consent and history forms, each subject was tested with a procedure previously described (Dillman et al., 1993; Fleisig, 1994; Fleisig et al., 1995). With this procedure reflective markers were attached bilaterally to the distal end of the midtoe, lateral malleolus, lateral femoral epicondyle, greater trochanter, lateral tip of the acromion, and lateral humeral epicondyle. A reflective band was wrapped around the wrist on the throwing arm, and a reflective marker was attached to the ulnar styloid of the nonthrowing arm. After stretching and warming up, the subject threw 10 balls in an indoor laboratory for data collection. Baseball pitchers threw from a portable pitching mound (Athletic Training Equipment Company, Santa CNZ, CA) toward a strike-zone ribbon located over a home plate at a distance of 18.4 m (60.5 ft) from the pitching rubber (Figure 1). Football quarterbacks threw dropback passes from flat ground toward a target net located approximately 18.4 m from their location at the time of ball release (Figure 2).

-0q3uKs dl@3!uoa3ala mod .uo!iom s,alalqe y x a @imnb 01 pasn EM (v3 %sox mms 'uo~e. iod.~o~ s!slCpq uopopq) nraislCs 8u!zp!8!p ~ ~ i m o i n e @uo!suam!p-aa~q v
-pmq s,aiarqe a q gal ~ @ q aqi E (XO 'u!ie@nA 'Kwd - 1 ~ 0 3 au!q3epq 8u!q3i~ s8nr) un8 n p w uods &?qu~ e q ! ~ pap103al EM h p o l a ~ 1@8
21 0 Fleisig, Escamilla, Andrews, et a/. M
nized 200-Hz charged coupled device (CCD) cameras transmitted pixel images of the reflective markers directly into a video processor without being recorded onto video. Three- dimensional marker locations were calculated with Motion Analysis Corporation Expertvision 3-D software utilizing the direct linear transformation (DLT) method (AbdeI- Aziz & Karara, 197 1 ; Shapiro, 1978; Walton, 198 1).
Camera coefficients were calibrated by recording the position of markers attached to four vertically suspended wires. Three reflective markers spaced at 61-cm intervals were attached to each wire. The wires were positioned so that the markers made a matrix approximately 1.5 m x 1.2 m x 1.2 m in size, suspended approximately 0.3 m above the ground, where the 1.5 m dimension was aligned with the direction of throwing. This ma- trix was designed to encompass as much of the testing area as possible while leaving each marker within the field of view of all four cameras. In general, the foot and ankle markers were the only markers that did not stay within the calibrated space, which was reasonable considering that the subjects had a mean height of 1.84 m and the pitchers had a mean stride length of 1.36 m. The root mean-square error in calculating the three-dimensional location of markers randomly placed within the calibrated space was 1.0 cm (Heisig et al., 1995).
Positional data were digitally filtered independently in the X, Y, and Z directions with a Butterworth low-pass filter (Winter, 1990). Qualitative evaluation of displacement, velocity, and acceleration data indicated that a (sample frequency)/(cut-off frequency) ratio of 12 was effective at rejecting noise and passing data. For a 200-Hz sample fre- quency, this was equivalent to a second-order, low-pass, cutoff frequency of 16.7 Hz (200 HzI16.7 Hz = 12). As suggested by Winter, Sidwall, and Hobson (1974). the data were passed through the filter a second time, in the reverse order, to eliminate phase distortion. In effect, this second passing created a fourth-order, zero-phase-shift, low-pass filter. By passing the data through the filter a second time, the cutoff frequency was reduced by 0.802; thus, the cutoff frequency for this double-pass filter was 13.4 Hz (16.7 Hz x 0.802).
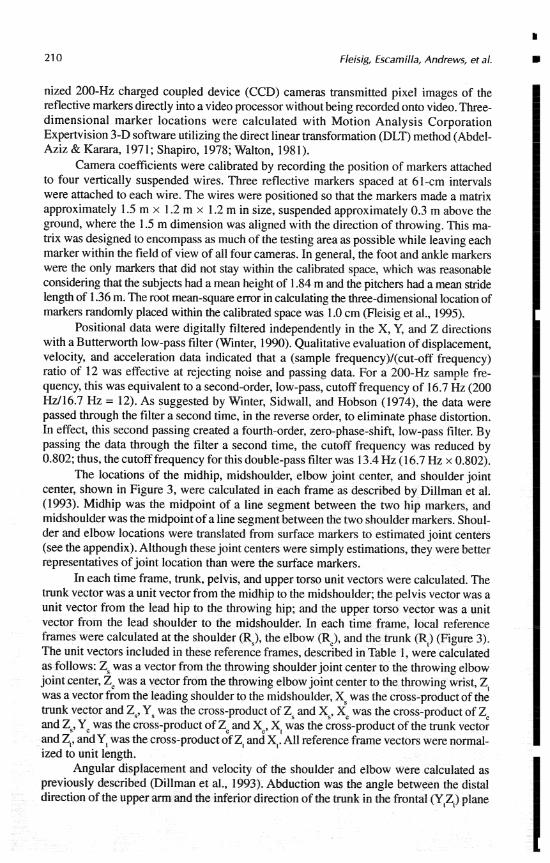
The locations of the midhip, midshoulder, elbow joint center, and shoulder joint center, shown in Figure 3, were calculated in each frame as described by Dillman et al. (1993). Midhip was the midpoint of a line segment between the two hip markers, and midshoulder was the midpoint of a line segment between the two shoulder markers. Shoul- der and elbow locations were translated from surface markers to estimated joint centers (see the appendix). Although these joint centers were simply estimations, they were better representatives of joint location than were the surface markers.
In each time frame, trunk, pelvis, and upper torso unit vectors were calculated. The trunk vector was a unit vector from the midhip to the midshoulder; the pelvis vector was a unit vector from the lead hip to the throwing hip; and the upper torso vector was a unit vector from the lead shoulder to the midshoulder. In each time frame, local reference frames were calculated at the shoulder (RJ, the elbow (Re), and the trunk (R,) (Figure 3). The unit vectors included in these reference frames, described in Table 1, were calculated as follows: Zs was a vector from the throwing shoulder joint center to the throwing elbow joint center, Zc was a vector from the throwing elbow joint center to the throwing wrist, Z, was a vector from the leading shoulder to the midshoulder, Xs was the cross-product of the trunk vector and Zs, Y was the cross-product of Zy and Xs, Xe was the cross-product of Zc and Zs, Yc was the cross-product of Zc and Xe, X, was the cross-product of the trunk vector and Z,, andY, was the cross-product of Z, and X,. All reference frame vectors were normal- ized to unit length.
Angular displacement and velocity of the shoulder and elbow were calculated as previously described (Dillman et al., 1993). Abduction was the angle between the distal direction of the upper arm and the inferior direction of the trunk in the frontal (Y,Z,) plane I

Baseball Pitching/Football Passing
2. ~eadin~-hi~' 3. Leading shoulder 4. Throwing shoulder 5 . Shoulder joint center 6. Throwing elbow 7. Elbow joint center 8. Throwing wrist
Figure 3 - Reflective markers ( 0 ) and calculated targets ( 0 and x). Translation vectors (S and E) and local reference frames for the shoulder (RJ and elbow (Re) also shown. Adapted from Dillman et al. (1993).
Table 1 Local Reference Frames
Unit vector Description
Shoulder reference frame (RJ
Elbow reference frame (R,)
Trunk reference frame (RI)
Anterior direction of shoulder Superior direction of shoulder Distal direction of upper arm
Medial direction of elbow Anterior direction of elbow Distal direction of forearm
Anterior direction of trunk Superior direction of trunk Lateral direction of trunk
(Figure 4a). Horizontal adduction was defined as the angle between the distal direction of the upper arm and the upper torso vector in the transverse (XIZ,) plane (Figure 4b). Since external rotation of the humerus about its long axis could not be directly measured, the rotation of the forearm about the upper arm's long axis was used, as previously described by Vaughn (1985a) and Feltner and Dapena (1986). Using this method, we calculated external rotation as the angle between the trunk's anterior direction and the forearm's distal direction, in a plane perpendicular to the upper arm (XsYS plane) (Figure 4c). Elbow flexion of the throwing arm was defined as the angle between the distal directions of the upper arm and forearm (Figure 4d).
Knee flexion of the lead leg was defined as the angle between the distal directions of the upper and lower leg (Figure 4e). Trunk tilt forward was the angle between the

Fleisig, Escamilla, Andrews, et al. b
TRUNK
FLEXION
. .
Figure 4 -Definition of kinematic variables: (a) shoulder abduction, (b) horizontal adduction, (c) external rotation, (d) elbow flexion, (e) lead knee flexion and trunk tilt, and (f) pelvis angular velocity and upper torso angular velocity. I superior direction of the trunk and the global X direction (i.e., toward the thrower's target) in the global XZ plane (Figure 4e). Trunk tilt forward was therefore 0" when the trunk was horizontal toward the target and 90" when the trunk was vertical. For each angular dis- placement measurement, the corresponding velocity was calculated using the 5-point cen- tral difference method (Miller & Nelson, 1973).
Angular velocities of the pelvis and upper torso (Figure 4 9 were calculated with a method published by Feltner and Dapena (1989). Angular velocity of the pelvis was the cross-product of the pelvis vector and its derivative. Angular velocity of the upper torso was the cross-product of the upper torso vector and its derivative.
Forces produced at the elbow and shoulder joints were calculated with a previ- ously described procedure (Feltner & Dapena, 1989; Fleisig, 1994). This procedure uti- lized Newton's second law of motion; specifically, the sum of all forces applied to each segment of the upper extremity was set equal to the mass of that segment multiplied by the linear acceleration of its center of mass. The positions of center of mass of the forearm and upper arm were determined using Clauser, McConville, and Young's (1969) cadaveric data. Due to limitations in camera resolution, markers could not be placed on the hand, and the mass of the hand was therefore assumed to be at the wrist marker. The five-point central difference method for second derivatives was used to determine the linear accelera- tion of each segment's center of mass (Miller & Nelson, 1973). The masses of a baseball and football were set equal to 0.14 kg and 0.43 kg, respectively. The mass of each upper extremity segment was assumed to be a percentage of the subject's total mass (Clauser et al., 1969).

Baseball Pitching/Football Passing 213
Following a procedure first described by Feltner and Dapena (1989) and later used by Fleisig (1994), the sum of all torques applied to each segment was set equal to the vector product of the segment's moment of inertia and angular acceleration. Moments of inertia of the hand and ball were assumed to be negligible. Moments of inertia of the forearm and upper arm were determined from Dempster's (1955) cadaveric study. Mo- ment of inertia values were then individualized using each subject's height and mass and a procedure developed by Dapena (1978). Angular velocity of the forearm or upper arm about the transverse axis was the cross-product of a unit vector aligned in the distal direction of the segment and the derivative of this vector (Feltner & Dapena, 1989). Feltner and Dapena (1989) neglected the angular velocity about the longitudinal axis for both the forearm and upper arm. Although the angular velocity about the longitudinal axis is small for fore- arm supinationJpronation (Feltner & Dapena, 1986; Sakurai et al., 1993), it is substantial for upper arm internal rotation (Dillman et al., 1993; Feltner & Dapena, 1986; Pappas et al., 1985). Hence, angular velocity about the longitudinal axis was assumed to be zero for the forearm but was equated to the derivative of externaVinterna1 rotation for the upper arm.
Kinetic values were reported as the force and torque applied by the upper arm to the forearm about the elbow and as the force and torque applied by the trunk to the upper arm at the shoulder (Fleisig et al., 1995). Kinetic values were separated into orthogonal com- ponents using the axes shown in Table 1 and Figure 3. Shoulder force was separated into three components (Figure 5a): anterior (+Xs) and posterior (-Xs), superior (+Ys) and inferior (-Ys), and distractive (+ZJ and compressive (-ZJ. Shoulder torque was separated into three components (Figure 5b): adduction (+XJ and abduction (-Xs), horizontal adduc- tion (+YJ and horizontal abduction (-YF), and external rotation (+ZJ and internal rotation (-ZJ. Elbow force was separated into three components (Figure 5c): medial (+Xe) and lateral (-Xe) force, anterior (+Y,) and posterior (-Ye) force, and distractive (+Ze) and compres- sive (-Z,) force. Elbow torque was separated into two components (Figure 5d): extension (+X,) and flexion (-X,) torque, and varus (+Ye) and valgus (-Ye) toque. Supination (+Ze) and pronation (-Ze) torque at the elbow could not be calculated with the model used; how- ever, Feltner and Dapena (1986) showed that these torques were fairly minimal.
To eliminate any effects of variation in body size, kinetic data were normalized as follows: Forces for each athlete were divided by his body weight and multiplied by the average subject body weight (795 N); torques for each athlete were divided by both his body weight and his height and multiplied by the average subject body weight and the average subject height (1.84 m). Temporal data were reported as percentages of the throw completed, where 0% corresponded to the instant when the front foot contacted the ground and 100% was the instant of ball release.
For each subject, data for the three fastest throws that struck the baseball strike zone or football target net were averaged. Differences between baseball pitching and football passing were statistically tested with Student's t test. The significance level for this analy- sis was set at p < .Ol.
To simplify interpretation of results, the throwing motion was divided into six phases previously defined for baseball pitching (Dillman et al., 1993; Werner et al., 1993): windup, stride, arm cocking, arm acceleration, arm deceleration, and follow-through (Figure 6). The windup phase began when the thrower initiated his first movement and ended when the lead leg was lifted and the two hands were separated. Next was the stride phase, which ended when the front foot contacted the ground. The arm cocking phase followed, ending when the throwing shoulder reached maximum external rotation. Subsequently the arm acceleration phase occurred, which ended at ball release. The time from ball release until the shoulder reached maximum internal rotation was defined as the arm deceleration phase.

Fleisig, Escamilla, Andrews, eta/.
COMPRESSIVE
ANTERIOR /
J COMPRESSIVE
\ MEDIAL
(cl
HORIZONTAL ADDUCTION
FLEXION /
VARUS
Figure 5 - Definition of kinetic variables: (a) shoulder forces, (b) shoulder torques, (c) elbow forces, and (d) elbow torques.
F w t Contact Max ER Ref- Max lR
Figure 6 - The six phases of throwing.

'(N g p ~ 'SA N 0 ~ 9 ) axoj an!ssardwo3 MoqIa pm '(N ~ £ 9 'sn N 099) a3103 a~~ssard -wo3 raplnoqs '(w . N 6[ .SA w . N ps) anb~oi s m ~ Moq[a ralear8 pamoqs Xpnls iua.un3 aqi 'aldwexa roj fondeqs pm q q Xq pauodar Xpno!nard asoqi myl ralear8 X[1e!)uelsqns aiam asp sanlen 3!1au?y '(S/,O~O'I T 066'2 = uo!iqor [ewaiu! : S / ~ ~ O Z + 082'1 = uo!suaxa moq~a) ol!deqs pw q s e ~ Xq pavodar elep aql 01 pa~dwo3 (S /~O~O'[ T 0~6 '9 = uo!ieior ~ewa~u! :S/,OIZ + 0 9 ~ ' ~ = uopuaixa ~ o q ~ a ) dpnls luasard ayl u! raqO!q Xlle!l~sqns aram w n %u!mo.~yl atp jo sa!lyo[an qn8ue wnwlxeyy .asealar 11eq IE uo!mnppe ~quozuoq 30 ,6 + Z[ pw uo!13npqe JO ,9 7 96 pauodar o.~!deqs pm qsex seaiaqm 'asealai IIeq jo lmlsu! ayl le uo!lanppe [quozuoq rap[noqs 30.6 + 9z pm aseqd uo!iwala33e w e aql %uunp uo!13npqe raplnoqs jo og T 801 peq sy3vqrawnb 'Xpnis luasard aqi UI - ( s p E + 81) ondeqs put! q s q Xq pauodar asoyl mtp raq%!q aram ( s p z + I 2) spaads 1pq 'Xpms luasard a q ~ u! paz~~yn slam saiatyle looq~s q81q q8noq1 uang '(~661) orldeqs pue qsex Xq palpnls aram syxqrawnb aSa[(o3 ZI searaqm 'pasn aram s y ~ e q r w n b a8allo3 pue looq3s qS!q 9z Xpws masa~d ayl UI .al!qMylJoM s! oi!dt!qs pm q s q Xq paluasard wep aql oi sqnsar Jno jo u o s ~ d m o 3 e 'paiuawn3op Ifam lou a n s~!mq3awo!q 8u!ssed Ileqiooj asne3aa '(~661) oqdeqs pw q-8 dq dluo pale%!lsanu! Xlsno!na~d uaaq aneq s3!ueq3awo!q 8ulssed ~[eqiooj 'sraq3nasar snorawnu dq pa!pnls uaaq aAeq s3!mq3awo!q 8u!q3i!d q8noyl1v
.run! ~ U ! M O J ~ ~ ~U!AOUI X~p!der a q ~ aie~ala3ap 01 raplnoqs aqi ie anbroi uo!l3nppe pm a3.103 an!ssa~duro3 ratear8 pm moqla atp le axoj a~!ssardur03 lait!ar% paieiaua8 sraqq!d -p alqeL U! paluasard s! 8ulssed [leqloq pm %u!q3l!d [[eqaseq uaawaq mep 3pau!y 30 uospduro3 v .lauoos run! Bu!~oryl aqi jo (uopqcl~ puralu! raplnoqs pue uo!suaixa moq -[a) IClpo~an q n 8 w wnw!mw panaFq3e sraq3iEd &rayma raplnoqs r!aqi paleior X~~ewaixa syxqrawnb q8noqqv 'p!p sy3eq.1amnb mqi (1~quo3 iooj 01 an!iela.t) r a p a os.101 raddn pw s ~ n ~ a d aql 30 Xq3o[an a[n8m urnm!mw paAalq3e sraq311d 'E a[qeL u! 8u~ssed IIeq -3003 pm 8u!q3i!d IFqaseq uaawaq pandwo:, s! s~uawarnseaur z~!lewau!y JO 8u!ur!~
waqqd loj uaas sem B!3o[an nqn8ue osroi raddn 1a1ea18 'aseqd uo!iera -[aDap uue ayl 8uuna 'aseatar [ ~ q JO IU~SU! aylw pm 8 ~ ~ 3 0 3 uur! 8uunp uo!xag moq -la pm uo!l3nppe [quozuoq raplnoqs ra1ea.G 8u!hqds!p 'siaq3i!d mtp arow ,,moqla aqi t p ! ~ pt!aI,, 01 papua syxqawnb 'uo~qppe UI -siaq3~!d wq1 sapys rauoqs peq pm-uo! -xap a a q pea1 pm p ~ m r o j il!~ yum uodn paseq-13ara arow poo~s syxq rwnb 'asealar lIeq JO zwsu! ayl i y -aseqd 8 ~ ~ 3 0 3 run! aql8uunp uo!lelor IeuIaixa raplnoqs urnw!mw ralear8 paieasuowap sraq3i!d <pquo3 iooj jo iugsu! atp ie sraq3ild mql uo!~qor pwaixa rap[noqs ralear8 peq syxqramnb q8noqllv .(&polan leln8m osroi raddn pw sy~lad "a'!) yuw put! (ICl!3ola~ qn8ue uo!1~0.1 [ewaiu! pue uo!suaixa moqa "a'!) uue ayl 30 spaads [euo!iqor raieai8 os1e mq Xlpo[an [[eq raiea.18 Xluo IOU panarq3e sraq3l!d ieyl aram sa3ua -rag!p im3y!u8!s Xl~e~!is!iels aqi 8uourv '(z a 1 q ~ ) paypmnb aram sa~.~arag!p 3!1em -au!y Ieianas 'uo!iow SU!MOJ~J NI!~!S e paXelds!p sy3eqrawnb pm sraq3ild q8noyllv
'(£66 1 "@ la JauaM fqS861 ' W ~ ~ E A f £661 "@ la 9 T S f066I "@ la V T S f S86I "@ $3
sedded f ~ 6 6 1 "p ia 8!s!a~ :9861 't?uadea ip ~auqad t9861 '-p ia uo!nz :~66[ "p ia m?ur~l!a) saseqd asayl 8uwp rn3m anbroi iu!of pm 'a3roj iu!oC %po1an m1n8m 'iuawax1ds!p re[nSue jo sapni!u8ew isa8lel atp ieql umoqs aneq salpnls sno~nard srz 'saseqd q8noq -mol~oj pm 'uo!wa[a3ap run! 'uo!wa1a3x run! '2ugm3 run! atp roj pazXleue aram ma '%u!Xe[d antguo3 01 uog!sod pa~mpq s!q paq3e,eat peq a i a l p atp uaqm papua pm uo!iqor pruaw! raplnoqs wnw!mw jo awtj a* P? m s q q m 'q8nonp-molloj sem aseqd pug a u

21 6 Fleisig, Escamilla, Andrews, eta/.
Table 2 Kinematic Comparison Between Baseball Pitching and Football Passing
Parameter
Pitching Passing (n = 26) (n = 26)
Mean SD Mean SD
Instant of foot contact Stride length from ankle to ankle (% height)** 74 5 6 1 Shoulder abduction (O) 93 12 96 Shoulder horizontal adduction (")** -17 12 7 Shoulder external rotation (")* 67 24 90 Elbow flexion (")** 98 18 77 Lead knee flexion (")** 51 11 39
Arm cocking phase Maximum pelvis angular velocity ("Is)** 660 80 500 Maximum shoulder horizontal adduction (")** 18 8 32 Maximum upper torso angular velocity ("Is)** 1,170 100 950 Maximum elbow flexion (")** 100 13 113
Instant of maximum shoulder external rotation Maximum shoulder external rotation (")* 173 10 164
Arm acceleration phase Maximum elbow extension velocity ("Is)** 2,340 300 1,760 Average shoulder abduction during acceleration (")** 93 9 108
Instant of ball release Ball velocity ( m / s ) * * Shoulder horizontal adduction (")** Elbow flexion (")** Trunk tilt forward (")* Trunk tilt sideways (")** Lead knee flexion (")**
Arm deceleration phase Maximum shoulder internal rotation velocity ("Is)** 7,550 1,360 4,950 Minimum elbow flexion (")** 18 5 24 Average upper torso angular velocity ("Is)** 470 160 310
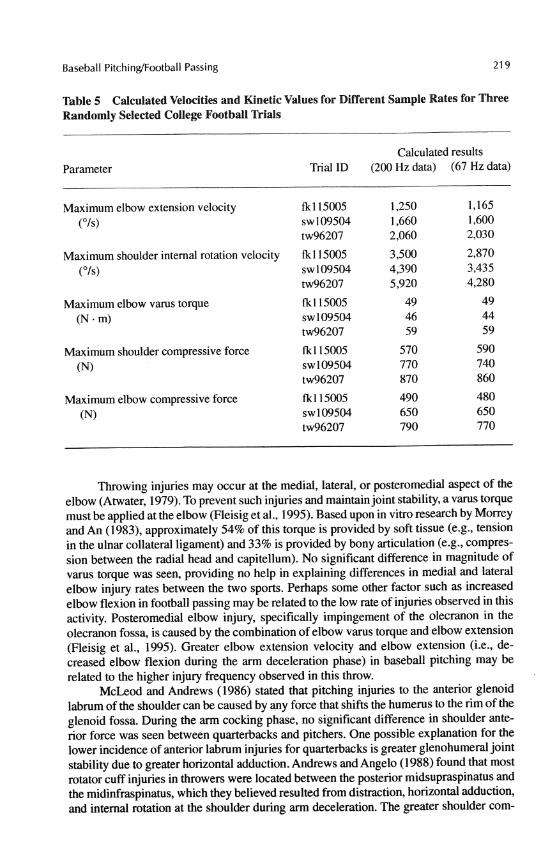
One possible explanation for the considerable discrepancies between the two stud- ies was the difference in data sampling rates; data were collected at 200 Hz in the current study and at 60 Hz in the study by Rash and Shapiro. Although 60-Hz cameras are suffi- cient for displacement measurements and leg and trunk motions, their adequacy for quan- tifying the high-speed motion of the throwing arm should be justified. To investigate this issue, we reevaluated three randomly selected football passing trials from the current study utilizing only every third sample of camera data (i.e., [200 Hz113 = 67 Hz). These lower frequency data were filtered with a 13.4-Hz, fourth-order, zero-phase-shift Butterworth low-pass filter and reevaluated with the analysis methods described above. Table 5 shows

Baseball Pitching/Football Passing 21 7
Table 3 Timing of Kinematic Measurements, Compared Between Baseball Pitching and Football Passing
Parameter
Pitching Passing (n = 26) (n = 26)
Mean SD Mean SD
Instant of foot contact 0 0 0 0
Arm cocking phase Maximum pelvis angular velocity** 35 19 56 12 Maximum shoulder horizontal adduction 49 17 55 21 Maximum upper torso angular velocity** 50 8 62 10 Maximum elbow flexion 53 14 53 11
Instant of maximum shoulder external rotation * 81 4 71 14
Arm acceleration phase Maximum elbow extension velocity** Maximum trunk-tilt angular velocity**
Instant of ball release 100 0 100 0
Arm deceleration phase Maximum shoulder internal rotation velocity** 1 03 2 1 06 2 Minimum elbow flexion (")** 103 2 107 3
Note. Each number in the table represents a percentage of throw completed, where 0% was defined as the instant of foot contact, and 100% was the instant of ball release. Length of time for 100% of a throw was significantly different @ < .001) between pitching (0.145 f 0.022 s) and passing (0.207 + 0.037 s).
that when the three throws were analyzed with 67-Hz data, shoulder internal rotation velocities were reduced approximately 25% (in comparison, Rash's values were 50% lower than those in the present study) while other movements were not noticeably affected. Hence, sampling rate may partially explain differences in kinematic and kinetic values. Other possible factors include skill level, ball velocity, and methodological errors (such as inaccuracy in calculating shoulder internal rotation position and velocity when the elbow is near full extension). Since the methods used in the present study were similar for base- ball pitching and football passing, a statistical comparison among the subjc :ts tested in this study is reasonable.
Because the football had more mass than the baseball, quarterbacks cc ~ l d not gen- erate as much shoulder internal rotation velocity as pitchers did. To compensate, quarter- backs rotated their shoulders sooner and achieved maximum external rotation earlier in the throw than the pitchers, thereby allowing more time for acceleration of internal rota- tion. Throwing the heavier football also seemed to correlate with two other mechanical adjustments: "leading with the elbow" and decreased contribution from the trunk and legs. Leading with the elbow-that is, using increased shoulder horizontal adduction and elbow flexion-was observed for quarterbacks. The decreased contribution from the trunk and legs was seen as a shorter stride, more upright trunk, and reduced pelvis and upper

21 8 Fleisig, Escamilla, Andrews, et a/.
Table 4 Kinetic Comparison Between Baseball Pitching and Football Passing
Parameter
Pitching Passing (n = 26) (n = 26)
Mean SD Mean SD
Arm cocking phase Maximum shoulder anterior force Maximum shoulder horizontal adduction torque Maximum shoulder internal rotational torque Maximum elbow medial force Maximum elbow varus torque
Arm acceleration phase Maximum elbow flexion torque
Arm deceleration phase Maximum shoulder compressive force* Maximum elbow compressive force** Maximum shoulder adduction torque*
Follow-through phase Maximum shoulder posterior force Maximum shoulder horizontal abduction torque
Note. Elbow kinetic data are presented as forces and torques applied by the arm onto the forearm. Shoulder kinetic data are presented as forces and torques applied by the trunk onto the arm. Forces were normalized by body weight and are expressed in newtons. Torques were normalized by body weight and height and are expressed in newton-meters.
torso angular velocity. At release, during arm deceleration, and during follow-through, pitchers had more trunk tilt and knee flexion than quarterbacks. Furthermore, pitchers had greater rotation of the upper torso after release, based upon greater upper torso angular velocity during the arm deceleration phase. A complete follow-through motion was criti- cal for pitchers to decelerate the rapidly moving arm. Even with acomplete follow-through, forces and torques generated at the elbow and shoulder to decelerate the arm were greater in pitchers than in quarterbacks. Although a full follow-through might be advantageous for quarterbacks as well, it is impractical as a quarterback mustquickly regain a balanced position after throwing the ball and prepare for possible impact from an opposing player.
Throwing injuries associated with baseball pitching are well documented (Andrews, 1985% 1985b, 1993; Andrews, Kupferman, & Dillman, 1991; Andrews, McCluskey, & McLeod, 1976; Branch, Partin, Chamberland, Emeterio, & Sabetelle, 1992; Chandler, 1992; DeHaven, 1973; Grana & Rashkin, 1980; Jobe & Kvime, 1989; Lipscomb, 1975; Pappas & Zawacki, 1991; Stacey, 1984; Sterling, Calvo, & Holden, 1991). The rate of throwing injuries is assumed to be less in football, as no studies have reported injuries resulting from football throwing. A comparison of pitching and passing data from the present study with respect to injury mechanisms may add insight about the apparent dis- parity in injury risk between the two types of throws.
Baseball PitchingRootball Passing 21 9
Table 5 Calculated Velocities and Kinetic Values for Different Sample Rates for Three Randomly Selected College Football Trials
Parameter Calculated results
Trial ID (200 Hz data) (67 Hz data)
Maximum elbow extension velocity & I 15005 1,250 1,165 (Ols) sw 109504 1,660 1,600
tw96207 2,060 2,030
Maximum shoulder internal rotation velocity fk115005 (OJs) sw109504
tw96207 Maximum elbow varus torque fk115005 (N - m) ~ ~ 1 0 9 5 0 4
tw96207 Maximum shoulder compressive force fk115005
(N) sw 109504 tw96207
Maximum elbow compressive force fkl15005 490 480 (N) sw 109504 650 650
tw96207 790 770
Throwing injuries may occur at the medial, lateral, or posteromedial aspect of the elbow (Atwater, 1979). To prevent such injuries and maintain joint stability, a varus torque must be applied at the elbow (Fleisig et al., 1995). Based upon in vitro research by Morrey and An (1983), approximately 54% of this torque is provided by soft tissue (e-g., tension in the ulnar collateral ligament) and 33% is provided by bony articulation (e.g., compres- sion between the radial head and capitellum). No significant difference in magnitude of varus torque was seen, providing no help in explaining differences in medial and lateral elbow injury rates between the two sports. Perhaps some other factor such as increased elbow flexion in football passing may be related to the low rate of injuries observed in this activity. Posteromedial elbow injury, specifically impingement of the olecranon in the olecranon fossa, is caused by the combination of elbow varus torque and elbow extension (Fleisig et al., 1995). Greater elbow extension velocity and elbow extension (i.e., de- creased elbow flexion during the arm deceleration phase) in baseball pitching may be related to the higher injury frequency observed in this throw.
McLeod and Andrews (1986) stated that pitching injuries to the anterior glenoid labrum of the shoulder can be caused by any force that shifts the humerus to the rim of the glenoid fossa. During the arm cocking phase, no significant difference in shoulder ante- rior force was seen between quarterbacks and pitchers. One possible explanation for the lower incidence of anterior labrum injuries for quarterbacks is greater glenohumeral joint stability due to greater horizontal adduction. Andrews and Angelo (1988) found that most rotator cuff injuries in throwers were located between the posterior midsupraspinatus and the midinfraspinatus, which they believed resulted from distraction, horizontal adduction, and internal rotation at the shoulder during arm deceleration. The greater shoulder com-

220 Fleisig, Escarnilla, Andrews, et a / .
pressive force to resist distraction and greater shoulder internal rotation velocity for base- ball pitching may be related to the greater risk of rotator cuff injury. Subacromial impingement is another pathology common in the throwing shoulder. As the shoulder is abducted and externally rotated, the rotator cuff, biceps tendon, or subacromial bursa may become impinged under the coracoacromial arch (Atwater, 1979; Chandler, 1992; Fleisig et al., 1995). Although shoulder abduction during the arm acceleration phase was signifi- cantly greater in football passing, the greater shoulder external rotation during arm cocking measured in baseball pitching may be related to the high risk of impingement for pitchers.
In addition to fitting the constraints of the game, trunk kinematic parameters of football quarterbacks may also be related to limiting the risk of arm injury. The kinetic chain principle asserts that in acoordinated human motion, energy or momentum is trans- ferred through sequential body segments, achieving maximum magnitude in the terminal segment (Kreighbaum & Barthels, 1990; Norkin & Levangie, 1983; Steindler, 1955). By limiting leg motion, pelvis rotation, and upper torso rotation, quarterbacks may be regu- lating the momentum or energy transferred to the throwing arm and limiting the force and torque produced at the shoulder and elbow joints.
These mechanical considerations are, of course, only some of the elements possi- bly related to injury. Other factors such as number of hard throws, rest between perfor- mances, warm-up routine, conditioning program, and anatomical variations must also be considered. For instance, a starting pitcher may throw 120 pitches in a game every fifth day, whereas a quarterback might throw 50 passes in a game every seventh day. The increased number of throws seen in baseball might lead to fatigue and instability in the pitcher's arm, exacerbating injury potential late in the game.
I Conclusions I
One objective of the current study was to determine whether higher forces are generated in football passing than in baseball pitching, as it has been proposed that football passing could be used to strengthen a baseball pitcher's arm. Football passing did not produce greater forces or torques. In fact, during the arm deceleration phase greater forces and torques in the shoulder and elbow were produced by pitchers; this may be related to the increased incidence of injury from repetitive throwing that occurs in pitching. Computer simulation of joint components may be helpful in estimating the distribution of loads among the hard and soft tissues of the joints. I
Another objective was to determine whether pitchers generate greater arm velocity than quarterbacks, as quarterbacks might use baseball pitching to develop arm speed. Higher arm speeds were indeed generated in pitching; however, baseball pitching might be detrimental for quarterbacks since they might learn inappropriate throwing mechanics. Furthermore, the greater incidence of overuse injury in pitching indicates that pitching may unnecessarily increase a quarterback's risk of arm injury.
In summary, the two throws are similar but not identical. Although the throws were qualitatively similar during the arm cocking, arm acceleration, and arm deceleration phases, quantifiable kinematic, kinetic, and timing differences were found. Although research is cer- tainly needed to clinically measure the training effects of throwing both baseballs and foot- balls, our recommendation is that a baseball pitcher or football quarterback should not use the other throw during the competitive season, as improper mechanics may develop. Training with the other throw during the off-season, however, may be beneficial. This could be true especially for the adolescent or prepubescent athlete, whose objective should be to develop general fimess and athletic skills without committing to the specialization of one sport.
Baseball PitchinglFootball Passing 221
With the dearth of information concerning the cross-training effects of baseball pitching and football passing, caution should be taken. Participation in both sports may have deleterious effects, as differences between pitching and passing may lead to im- proper throwing mechanics in either sport. Also, differences in shoulder and elbow kinetic parameters between the two throwing patterns may affect the potential for arm injury. It is imperative for any athlete who throws both footballs and baseballs to use a year-round conditioning program that recognizes the demands of both activities.
References
Abdel-Aziz, Y.I., & Karara, H.M. (197 1). Direct linear transformation from comparator coordinates into object space coordinates in close-range photogrammetry. In Proceedings of the Ameri- can Society of Photogrammetry Symposium on Close-Range Photogrammetry (pp. 1-18). Falls Church, VA: American Society of Photogrammetry.
Andrews, J.R. (1985a). Bony injuries about the elbow in the throwing athlete. Instructional Course Lectures, 34,323-33 1 .
Andrews, J.R. (1985b). Glenoid labrum tears related to the long head of the biceps. American Jour- nal of Sports Medicine, 13(5), 337-341.
Andrews, J.R. (1993). Common elbow problems in the athlete. Journal of Orthopaedic and Sports Physical Therapy, 17(6), 289-295.
Andrews, J.R., & Angelo, R.L. (1988). Shoulder arthroscopy for the throwing athlete. Techniques in Orthopaedics, 3(1), 75-8 1.
Andrews, J.R., Kupferman, S.P., & Dillman, C.J. (1991). Labral tears in throwing and racquet sports. Clinics in Sports Medicine, 10(4), 901 -91 1.
Andrews, J.R., McCluskey, G.M., & McLeod, W.D. (1976, summer). Musculo-tendinous injuries of the shoulder and elbow in athletes. Athletic Training, 11(2), 68-7 1,74.
Atwater, A.E. (1979). Biomechanics of overarm throwing movements and of throwing injuries. Ex- ercise and Sport Science Review, 7,43-85.
Branch, T., Partin, C., Chamberland, P., Emeterio, E., & Sabetelle, M. (1992). Spontaneous fractures of the humerus during pitching. American Journal of Sports Medicine, 20(4), 468-470.
Brose, D.E., & Hanson, D.L. (1967). Effects of overload training on velocity and accuracy of throw- ing. Research Quarterly, 38(4), 528-533.
Campbell, K.R., Hagood, S.S., Takagi,Y., McFarland, E.G., Volk, C.P., & Silberstein, C.E. (1994). Kinetic analysis of the elbow and shoulder in professional and Little league pitchers. Medi- cine and Science in Sports and Exercise, 26(5), S 175.
Chandler, J.B. (1992). Shoulder function and dysfunction in the baseball pitcher. Journal of the Medical Association of Georgia, 81(6), 289-291.
Clauser, C.E., McConville, J.T., &Young, J.W. (1969). Weight, volume, and center of mass of seg- ments of the human body (AMRL-TR-69-70). Dayton, OH: Wright-Patterson Air Force Base.
Dapena, J. (1978). Method to determine the angular momentum of a human body about three or- thogonal axes passing through its center of gravity. Journal of Biomechanics, 11(5), 25 1-256.
DeHaven, K.E. (1973). Throwing injuries of the elbow in athletes. Orthopaedic Clinics of North America, 4(3), 801-808.
Dempster, W.T. ( i 955). Space requirements of the seated operator (WADC-TR-55- 159). Day ton, OH: Wright-Patterson Air Force Base.
DeRenne, C., Buxton, B.P., Hetzler, R.K., & Ho, K.W. (1994). Effects of under- and overweighted implement training on pitching velocity. Journal of Strength and Conditioning Research, 8(4), 247-250.
DeRenne, C., & House, T. (1993). Power baseball. New York: West. Dillman, C.J., Fleisig, G.S., & Andrews, J.R. (1993). Biomechanics of pitching with emphasis upon
shoulder kinematics. Journal of Orthopaedic and Sports Physical Therapy, 18(2), 402-408. Elliott, B., & Anderson, G. (1990). Age related differences in high performance overarm throwing
patterns. Journal of Human Movement Studies, 18(1), 1-23. Elliott, B., Grove, J.R., Gibson, B., & Thurston, B. (1986). Three-dimensional cinematographic

222 Fleisig, Escamilla, Andrews, et a/.
analysis of the fastball and curveball pitches in baseball. International Journal of Sport Bio- mechanics, 2,20-28.
Feltner, M., & Dapena, J. (1986). Dynamics of the shoulder and elbow joints of the throwing arm during a baseball pitch. International Journal of Sport Biomechanics, 2(4), 235-259.
Feltner, M.E., & Dapena, J. (1989). Three-dimensional interactions in a two-segment kinetic chain: Part I. General model. International Journal of Sport Biomechanics, 5(4), 403-419.
Fleisig, G.S. (1994). The biomechanics of baseballpitching. Unpublished doctoral dissertation, Uni- versity of Alabama at Birmingham.
Fleisig, G.S., Dillman, C.J., Escamilla, R.F., &Andrews, J.R. (1995). Kinetics of baseball pitching with implications about injury mechanisms. American Journal of Sports Medicine, Z3(2), 233-239.
Gainor, B.J., Piotrowski, G., Puhl, J., Allen, W.C., & Hagen, R. (1980). The throw: Biomechanics and acute injury. American Journal of Sports Medicine, 8(2), 114-1 18.
Grana, W.A., & Rashkin, A. (1980). Pitcher's elbow in adolescents. American Journal of Sports Medicine, 8(5), 333-336.
Horn, T.S. ( 1984). An analytical solution to the determination of resultant forces and torques occur- ring at the shoulder joint during baseball pitching. Unpublished master's thesis, Auburn University, Auburn, AL.
Jobe, F., & Kvitne, R. (1989). Shoulder pain in the overhand or throwing athlete: The relationship of anterior instability and rotator cuff impingement. Orthopaedic Review, 18(9), 963-975.
Kreighbaum, E., & Barthels, K. (1990). Biomechanics: A qualitative approach for studying human movement. New York: Macmillan.
Lipscomb, A. (1975). Baseball pitching injuries in growing athletes. Journal of Sports Medicine, 3(1), 25-34.
Litwhiler, D., & Hamm, L. (1973). Overload: Effect on throwing velocity and accuracy. Athletic Journal, 53(5), 64-65,88.
McLeod, W.D., & Andrews, J.R. (1986). Mechanisms of shoulder injuries. Physical Therapy, 66(12), 1901-1904.
Miller, D.I., & Nelson, R.C. (1973). Biomechanics of spor td research approach. Philadelphia: Lee and Febiger.
Morrey, B.F., & An, K.N. (1983). Articular and ligamentous contributions to the stability of the elbow joint. American Journal of Sports Medicine, 11,3 15-3 19.
Norkin, C.C., & Levangie, P.K. (1983). Joint structure &function: A comprehensive analysis. Phila- delphia: Davis.
Pappas, A.M., & Zawacki, R.M. (1991). Baseball: Too much on a young pitcher's shoulders? The Physician and Sportsmedicine, 19(3), 107- 1 17.
Pappas, A.M., Zawacki, R.M., & Sullivan, T.J. (1985). Biomechanics of baseball pitching: A pre- liminary report. American Journal of Sports Medicine, 13(4), 216-222.
Rash, G.S., & Shapiro, R. (1995). A three-dimensional dynamic analysis of the quarterback's throw- ing motion in American football. Journal of Applied Biomechanics, 11(4), 443-459.
Sakurai, S., Ikegami, Y., Okamoto, A., & Yabe, K. (1990). A three-dimensional cinematographic analysis of the baseball pitch. In Proceedings from the 6th International Symposium on Bio- mechanics in Sports (p. 6 12). Boseman, MT.
Sakurai, S., Ikegami, Y., Okamoto, A., Yabe, K., & Toyoshima, S. (1993). A three-dimensional cin- ematographic analysis of upper limb movement during fastball and curveball baseball pitches. Journal of Applied Biomechanics, 9(1), 47-65.
Shapiro, R. (1978). Direct linear transformation method for three-dimensional cinematography. Re- search Quarterly, 49,197-205.
Stacey, E. (1984). Pitching injuries to the shoulder. Athletic Journal, 64(6), 44-47. Steindler, A. (1955). Kinesiology of the human body under normal and pathological conditions.
Springfield, IL: Charles C Thomas. Sterling, J.C., Calvo, R.D., & Holden, S.C. (1991). An unusual stress fracture in a multiple sport
athlete. Medicine and Science in Sports and Exercise, 23(3), 298-303. Vaughn, R.E. (1985a). An algorithm for determining arm action during overarm baseball pitches. In
D.A. W~nter (Eds.), Biomechanics IX-B (pp. 5 10-5 15). Champaign, IL: Human Kinetics.

Baseball Pitchinflootball Passing 223
Vaughn, R.E. (1985b). Three dimensional kinematics of the baseball pitch. In J. Terauds & J.N. Barham (Eds.), Biomechanics in Sports N(pp. 72-78) (proceedings of ISBS 1985). Del Mar, CA: Research Center for Sports.
Walton, J.S. (198 1) Close range cine photogrammetry: A generalized technique for quantifiting gross human motion. Unpublished doctoral dissertation, Penn State University, University Park, PA.
Werner, S.L., Fleisig, G.S., Dillman, CJ., & Andrews, J.R. (1993). Biomechanics of the elbow dur- ing baseball pitching. Journal of Orthopaedic and Sports Physical Therapy, 17(6), 274-278.
W~nter, D.A. (1990). Biomechanics and motor control of human movement. New York: Wiley. Winter, D.A., Sidwall, H.G.. & Hobson, D.A. (1974). Measurement and reduction of noise in kine-
matics of locomotion. Journal of Biomechanics, 7 , 157- 159.
Appendix: Calculation of Elbow and Shoulder Joint Centers
A method was developed for determining elbow and shoulder joint center locations based upon the locations of surface markers (Fleisig, 1994). Fit, the locations of the joint centers and surface markers were manually digitized for a s m d sample of subjects. Local reference frames for the trunk and elbow were then established using the surface markers. Next, the locations of the shoulder and elbow joint centers were expressed as functions of the local reference frames and the length of a subject's humerus and radius. The development of the general equations is presented below, followed by application of the equations for each athlete.
General Equations
Pitching mechanics of four subjects were recorded at 500 Hz onto videotape with two synchronized EktaPro 1000 cameras (Motion Analysis Systems Division, Eastman Kodak Company, San Diego, CA). Reflective markers (placed as described in the Methods sec- tion) and the elbow and shoulder joint centers of the throwing arm were manually digi- tized with a Peak 3D Motion Measurement System (Peak Performance Technologies, Englewood, CO). In each frame, midhip was the midpoint of a line segment between the two hip markers, and midshoulder was the midpoint of a line segment between the two shoulder markers. Trunk, shoulder, and elbow reference frames were calculated in each time frame in the following order:
Global reference frame
Up: Z, = vertical, as defined by hanging calibration poles Left Y, = Z, x [vector from pitching rubber to home plate] Forward: X, = Y, x Z,
Trunk reference frame:
Lateral: Z, = vector from leading shoulder marker to the midshoulder Anterior: XI = [vector from midhip to midshoulder] x Z, Superior: Y, = Z, x X,
Elbow reference frame:
Distal: Z, = vector from throwing elbow marker to throwing wrist Medial: X, = Z, x [vector from shoulder joint center to elbow marker] Anterior: Ye = Zc x Xe
Vector S was calculated in the global reference frame as a vector from the throwing shoulder marker to the throwing shoulder joint center. This vector was then expressed

224 Fleisig, Escamilla, Andrews, et al.
as components in the trunk reference frame and labeled as vector SRL. Vector E was calculated in the global reference frame as a vector from the throwing elbow marker to the throwing elbow joint center and then expressed in the elbow reference frame as vector ERc.
The direction (i.e., unit-length vector) and magnitude were calculated for vectors SRL and ERc in each data frame. The average magnitude and direction throughout the pitch were calculated for vectors SRL and ERe. The average magnitude of each of the two vectors was expressed as a fraction of humems and radius length, respectively. The directions for the vectors SR' and ERc were then averaged for all subjects. The average magnitudes as a fraction of humerus and radius length were calculated for SR' and ERe, respectively.
The average magnitude of SR' expressed in meters was equal to the radius of a reflective marker (0.019 m) added to the length of the pitcher's humerus (in meters) di- vided by 605. The average direction of this vector was (.413 e armflag, -.903, .121), where armflag was 1 for a right-handed thrower and -1 for a left-handed thrower. Hence,
SR1 = (.019 + humerus/605) . (.413 . armflag, -.903, .121).
The average magnitude of ERe expressed in meters was equal to the radius of a reflective marker (0.019 m) added to the length of the pitcher's radius (in meters) divided by 870. The average direction of this vector was (.SO0 - armflag, .521, .296). Hence,
E R G (.019 + radius/870) . (.800. armflag, .521, .296).
Equations for Each Individual Athlete
In each time frame of each throw, the locations of the shoulder and elbow on the throwing arm were translated from markers to joint centers. First, vectors SRL and ERe were calcu- lated as shown above. The local trunk reference frame (R,) was then calculated using the locations of the reflective markers. Then vector S was calculated as follows:
li 41 = I[ xtll ~ l l l ii - I1 Next, the shoulder joint center location was calculated:
(Shoulder joint center) = (Shoulder marker) + S.
To find the elbow joint center location, the local elbow reference frame (Re) was calculated using the locations of the reflective markers and the shoulder joint center. Vector E was then calculated as follows:
Finally, the elbow joint center location was calculated:
(Elbow joint center) = (Elbow marker) + E.