kinematic differences between three wheelchair …
TRANSCRIPT

KINEMATIC DIFFERENCES BETWEEN THREE
WHEELCHAIR RACERS (T54) IN SPRINT START
Katariina Järveläinen
Master’s Thesis in Biomechanics
Summer 2008
Department of Biology of Physical Activity
University of Jyväskylä
Supervisors: J. Avela and P.V. Komi

ABSTRACT
______________________________________________________________________
Järveläinen, Katariina
Kinematic Differences between Three Wheelchair Racers (T54) in Sprint Start
University of Jyväskylä
Department of Biology of Physical Activity
Master’s Thesis in Biomechanics. 54 pp.
Summer 2008
Keywords: Wheelchair racing; Kinematics; Sprint start; Propulsion
______________________________________________________________________
This study examined kinematic differences between wheelchair racers (T54) in sprint
start. Three male elite disabled athletes performed maximum trials four times, 80 % of
maximum and 60 % of maximum two times. Two-dimensional motion analysis was
used to study the fastest trial (100 % of Max) and the closest trial to the 80 % of Max
and 60 % of Max. The kinematic variables measured were: a) timing parameters; push
time, recovery time and cycle time, b) linear velocities; the velocity of the wheelchair,
the wrist and the elbow velocities in different cycles in the different trials c) angular
parameters; trunk and shoulder angle and trunk angular velocity, contact angle and
range of push angle and d) the point of contact and release.
In this case study it was found that the racer with more velocity had smaller time on the
propulsive phase and increased forward body movement in relation to the axle of wheel
at start. In addition, the racer with more velocity had larger velocity of the wrist in the
end of the recovery phase and had larger velocity of the elbow in the beginning of the
propulsive phase.
The sample sizes within a disability classification are quite small and limit
generalisations which could be made about the findings to the population under
consideration. Moreover, the differences in the testing modes and protocols make
comparisons among different studies difficult. However, results demonstrate that the
kinematic variables recorded prior to contact and on hand contact with the pushrim are
more important in developing more efficient racing wheelchair propulsion. The results
of this study indicate a need to educate coaches of wheelchair track athletes concerning
the most efficient start technique of racing wheelchair propulsion.

TIIVISTELMÄ
______________________________________________________________________
Järveläinen, Katariina
Kinematic Differences between Three Wheelchair Racers (T54) in Sprint Start
Jyväskylän yliopisto
Liikuntabiologian laitos
Biomekaniikan Pro gradu – tutkielma, 54 s.
Kesä 2008
Avainsanat: ratakelaus, kinematiikka, startti, kelaaminen
______________________________________________________________________
Tämän tutkimuksen tarkoituksena oli tutkia kinemaattisten muuttujien eroja
ratakelaajilla (T54) startissa. Kolme vammaishuippu-urheilijaa suoritti neljä kertaa
maksimaalisen startin, joiden lisäksi kaksi kertaa 80 % ja 60 % startin. Kolmesta
suorituksista (100 % Max, 80 % Max ja 60 % Max) tehtiin kaksi-dimensionaalinen
liikeanalyysi, jolla analysoitiin: a) työntö- ja palautusaika sekä koko sykliin käytetty
aika, b) pyörätuolin, ranteen ja kyynärpään nopeus syklin eri vaiheissa, c) vartalon ja
olkapään kulma, vartalon kulmanopeus sekä kontakti- ja työntökulma ja d) kontakti- ja
irrottamiskohta.
Tutkimuksessa havaittiin, että nopeuden kasvaessa työntöaika pieneni ja vartalon
kulmamuutokset pienenivät. Lisäksi nopean kelaajan ranteen lineaarinen nopeus oli
suurempi palautusvaiheen lopussa ja kyynärpään lineaarinen nopeus suurempi
työntövaiheen alussa kuin hitaammalla kelaajalla.
Tutkimuksen tuloksia ei voida yleistää pienen koehenkilömäärän takia. Erilaiset
määritelmät, tutkimusmenetelmät ja – asetelmat myös hankaloittivat tulosten vertailua
muihin tutkimuksiin. Tämän tutkimuksen perusteella voidaan kuitenkin osoittaa, että
ennen työntövaihetta ja sen aikana mitatut kinemaattiset muuttujat ovat tärkeitä
tehokkaalle kelaamiselle. Vammaisyleisurheiluvalmentajien tulisi täten ymmärtää ja
hyödyntää niitä tekijöitä, jotka saavat aikaan mahdollisimman optimaalisen
lähtötekniikan.

CONTENTS
1 INTRODUCTION ........................................................................................................ 4
2 SPINAL CORD, SPINAL CORD INJURY (SCI), NEUROMUSCULAR
DISEASES AND CLASSIFICATION ........................................................................... 5
2.1 Spinal nerves and the structure of spinal cord ......................................................... 5
2.2 International classification of spinal cord injuries ................................................... 8
2.3 Neuromuscular diseases ......................................................................................... 10
2.4 Physiology of wheelchair racing in athletes with spinal cord injury and diseases 11
2.5 Classification of athletics in class T54 ................................................................... 11
3 WHEELCHAIRS ....................................................................................................... 13
4 BIOMECHANICS OF WHEELCHAIR RACING ................................................. 16
4.1 Different phases in wheelchair propulsion ............................................................. 17
4.2 Kinematic variables in wheelchair propulsion ....................................................... 18
4.3 Muscles and movement patterns in wheelchair propulsion ................................... 20
5 THE PURPOSE OF THE STUDY ........................................................................... 24
6 METHODS .................................................................................................................. 25
6.1 Subjects .................................................................................................................. 25
6.2 Procedures .............................................................................................................. 25
6.3 Apparatus ............................................................................................................... 26
6.4 Analysis .................................................................................................................. 27
6.5 Statistics ................................................................................................................. 29
7 RESULTS .................................................................................................................... 30
7.1 Timing parameters ................................................................................................. 30
7.2 Linear velocities ..................................................................................................... 31
7.3 Angular variables and movement patterns ............................................................. 34
8 DISCUSSION .............................................................................................................. 39
8.1 Wheelchair racing propulsion at start .................................................................... 40
8.2 An efficient propulsion at start ............................................................................... 42
8.3 Kinematic differences between the wheelchair racers ........................................... 43
8.4 Recommendations for future studies ...................................................................... 44
REFERENCES .............................................................................................................. 47
APPENDIX .................................................................................................................... 52
Appendix 1: Information for the participant and agreement ........................................ 52
4
1 INTRODUCTION
Disabled athletes have got a growing publicity in media in Finland after the medals won
from Athens Paralympic Games 2004, especially from wheelchair racing. Since then
there has been a growing interest towards disabled athletes in general. But there are still
very few studies done in this field.
Wheelchair racing is one of the events in athletics. The events of wheelchair racing can
be compared to running events. Since the wheelchair-user combination is non-
stationary, wheelchair propulsion is complicated to measure. There are a lot of
movements in wheelchair propulsion appearing almost at the same time: upper limb
flexion/extension and abduction/adduction; joints of shoulder, elbow and wrist move at
the same time; muscles of every moving segment generate different parallels and in
amounts of forces that change all the time. (Wang et al. 1995.) There are some articles
dealing with the kinematic variables in wheelchair racing propulsion (Chow et al. 2001;
Higgs 1986; O´Connor et al. 1998; Ridgway et al. 1988; Wang et al. 1995), but there
are almost no published articles examining the sprint start of wheelchair racing. Very
few studies have measured racing wheelchair propulsion in natural environment and
different researchers have used different definitions for the same variables (O´Conner et
al. 1998; Moss et al. 2005).
The start is obviously crucial and very important to master if a racer wants to maximize
ones performance over the race distance. Wheelchair athletes are continually looking for
new and enhanced ways to train and/or analyze their propulsion technique. Racing times
are getting better and better so that small increments of change can lead to world
records. This is one the reasons why this study is made and why it is so important for
athletes and their coaches.
The purpose of the present study was to examine kinematic differences between
wheelchair racers (T54) in sprint start.

5
2 SPINAL CORD, SPINAL CORD INJURY (SCI),
NEUROMUSCULAR DISEASES AND CLASSIFICATION
There are about one hundred new cases of severe SCI in Finland every year. There is
about 3000-4000 in total of SCIs in Finland. Two thirds of them are wheelchair users.
(Dahlberg & Alaranta 1996.) Accidents are 70-85 % the cause of SCIs and the rest are
caused by neuromuscular diseases. The main general reasons for accidents are traffic
(41,8 %), falling (37,4 %) and work. (Alaranta & Ahoniemi 1998.) Accidents caused by
stumbling and slippering have doubled as well (Alaranta et al. 2000). Diving accidents
are rarer, although there are still about 2-6 diving accidents every summer (Alaranta &
Ahoniemi 1998). Relatively, cycling accidents are growing at this time with the
accidents caused by snowmobiles. Cycling accidents cover 4,1 % and sport covers 3,9
% of all accidents. (Alaranta et al. 2000.) Motocross and ice hockey are extremely risky
sporting events. Still, sport accidents are very rare in Finland comparing to other
countries. It seems to be tied to the geographical location. (Valtonen & Alaranta 2001.)
It is apparent that the amount of women and the middle-aged are increasing the case
numbers (Alaranta et al. 2000).
Tetraplegia is result of the damage of the cervical segments of the spinal cord (Alaranta
et al. 1998). Upper and lower limbs and pelvic organs have more or less functional
impairment. At that time sense of touch can also be lost. The levels of lesion of brachial
plexus or peripheral nerves outside the neural canal do not include tetraplegia.
(Maynard et al. 1997.) Paraplegia is a lesion of the thoracic, lumbar or sacral segments
of the spinal cord and it is almost as common as tetraplegia (Alaranta et al. 1998).
2.1 Spinal nerves and the structure of spinal cord
The spinal nerves are transmitted through the intervertebral foramina on either side of
the spinal column. There are thirty-one pairs of spinal nerves, which are arranged into
the region of the spine through which they pass: Cervical (8 pairs, C1-C8),
Dorsal/Thoracic (12 pairs, T1-T12), Lumbar (5 pairs, L1-L5), Sacral (5 pair, S1-S5) and
Coccygeal (1 pair, Co1) (Fig. 1). Each spinal nerve arises by two roots; an anterior
motor root and a posterior sensory root (Gray 1974) (Fig. 1).

6
FIGURE 1. Spinal Nerves. Missing Coccygeal nerve (The Spinal Cord Injury Resource Center
2008).
The spinal cord (medulla spinalis) is contained in the vertebral canal. It is the
connection center for the reflexes as well as the afferent (sensory) and efferent (motor)
pathways for the most of the body, with the exception of the cranial nerves, to the head
and neck. It does not nearly fill the canal but there is also areolar tissue, a plexus of
veins, nerves and liquid cerebro-spinal. Spinal cord goes all the way to the level of L1
(Gray 1974) (Fig. 2).

7
FIGURE 2. The specific details of spinal cord (Swan 2006).
The spinal cord may be damaged in many ways, which produces various symptom
patterns. These patterns enable a doctor to determine the location, or the level, of spinal
cord damage. The spinal cord can be cut, compressed or destroyed due to an accident or

8
infection or it could be damaged when its blood supply is cut off or affected by diseases
(such as spinal cord cysts, cervical spondylosis, or multiple sclerosis) that alter its nerve
function. (Bridwell 2006.)
2.2 International classification of spinal cord injuries
Traditional classification of SCI has the problem of inaccuracy because of not noticing
symmetrical motor and sensory functions. For example, if the neurological lesion is in
C5, the sensory functions on the right side of the body could be active in dermatome C8
(skin area which is innervated by sensor axons) and motor functions could be active at
the level of C7. At the same time, the left side and its sensory functions are active at the
level of C7 and motor functions at the level C6. Then neurological functional capacity is
much better than so called total C5-tetraplegia. In other words, there are four different
segments to be identified in determining the neurological lesion: Right-sensory, Left-
sensory, Right-motor and Left-motor. American Spinal Injury Association (ASIA) has
published standards for classification of spinal cord injuries (Fig. 3). In these standards,
these asymmetrical sensory and motor functions are noticed. (Alaranta et al. 1998.)
FIGURE 3. Standards for Neurological Classification of SCI Worksheet (Dermatomes Chart)
(American Spinal Injury Association (ASIA) 2006).

9
In these standards, motor and sensory level of the lesion of nerve tissue is investigated
from left and right side of the body, and whether the lesion is complete or not. The
lowest functional sensor segment is the level that has the sense of touch for pin prick
and light touch. The lack of the sense of touch, changes in the sense of touch,
weakening in the sense of touch and sensitising for the sense of touch are all things that
are investigated in these standards. Position sense and deep pressure/deep pain is also
examined from all limbs. (Alaranta et al. 1998.) All the key points in each of the 28
dermatomes are studied on the both sides of the body. Ten different myotomes (group
of nervefibers that are innervated by motoneurons) from left and right side of the body
are investigated for motor functions. (Maynard et al. 1997.) The lowest motor segment
is the level that muscles force is three on the scale of 0-5. In other words, muscles are
active and the range of motion is full against gravity. Although above motor segment
must be the highest muscle force, five on the scale of 0-5, and full range of motion. The
synenergy of muscles that affects the movement of joints is investigated in these
standards instead of single force produced by one muscle. With these standards, there
are classifications for SCI of incomplete (B, C, D) or of complete (A) tetraplegia or
paraplegia. (Alaranta et al. 1998.) (Fig. 4).
FIGURE 4. Muscle grading and ASIA impairment scale (American Spinal Injury Association
2006).

10
2.3 Neuromuscular diseases
There are more than 40 different kinds of neuromuscular diseases. Some of the major
diseases, which affect the neuromuscular system, are classified into four main groups:
motor neuron diseases, neuropathies, neuromuscular junction disorders and myopathies
including muscular dystrophies. (Ryöppy 1997.) This introduction concentrates only on
those diseases that subjects have and therefore are valid concerning this research paper.
Spina bifida, which literally means “cleft spine,” is characterized by the incomplete
development of the brain, spinal cord, and/or meninges (the protective covering around
the brain and spinal cord). The human nervous system develops from a small,
specialized plate of cells along the back of an embryo. Early in development, the edges
of this plate begin to curl up toward each other, creating the neural tube – a narrow
sheath that closes to form the brain and spinal cord of the embryo. As development
progresses, the top of the tube becomes the brain and the remainder becomes the spinal
cord. This process is usually complete by the 26th
day of pregnancy. But if problems
occur during this process, the result can be brain disorders called neural tube defects.
When the process is incomplete on the spinal cord it is called spina bifida. The exact
cause of that remains a mystery. Scientists suspect that genetic, nutritional (especially
insuffient intake of folic acid) and environmental factors play a role. There is no cure
for this disease. There are four different types of spina bifidas. The symptoms of spina
bifida vary from person to person depending on which type of spina bifida it is and
where the neurological lesion is. (National Institute of Neurological Disorders and
Stroke 2005.) In Finland the prevalence of spina bifida was 2,63 / 10 000 births in 2000
(Stakes 2000).
Arthrogryposis multiplex congenita translated from the Greek literally means "curved or
hooked joints." Hence, this term is used to describe multiple joint contractures present at
birth. There are many causes for congenital multiple joint contractures, and could be
due to abnormal nerve or muscle development in the womb. The latter is much rarer. In
difficult cases there are variations in every limb and in the mild cases only on the edge
of the upper or lower limbs. The cause of arthrogryposis is varied and not entirely
understood. Certainly, in many cases abnormal nerve, muscle and connective tissue
11
development plays a crucial role. Genetic factors do play a part in many cases. (Ryöppy
1997.)
2.4 Physiology of wheelchair racing in athletes with spinal cord injury and diseases
Physical condition and capacity vary with the level of neurological lesion, whether it is
incomplete or complete. On one end, there is complete tetraplegia where people are
physically disabled and possibly use a respirator. On the other end, there are people
with mild paraplegia. These people can even walk by themselves without any devices.
There might be other disordered organ systems beside the physical system (genitalia,
bladder and intestine problems, spastisity in muscles, autonomic nerves system) or there
could be complications (pain, posttraumatic syringomyelia, ossification, osteoporosis,
skin problems). (Alaranta et al. 2000.) Wheelchair users usually have a lot of problems
with their upper limbs (Dahlberg & Alaranta 1996).
Athletes with SCI or some other neuromuscular disease have unique changes in
metabolic, cardiorespiratory, neuromuscular and thermoregulatory systems, which
reduce their overall physiological capacity compared with able-bodied athletes or
athletes with other types of impairments (Bhambhani 2002). Although respiratory
muscle endurance can be increased in competitive athletes with paraplegia by isolated
respiratory muscle endurance training (Mueller et al. 2008). During the sprint racing
performance, such as the 100 and 200 meter sprints, the primary motor units that will be
recruited are the type IIb motor units because they have a fast contractile speed and high
glycolytic capacity. The energy for these events will be derived mainly from immediate
(adenosine triphosphate ATP and creatine phosphate CP) and short-term (via anaerobic
glycolysis) energy sources. (Bhambhani 2002.)
2.5 Classification of athletics in class T54
Discrepancies could arise due to dissimilarities in muscular and/or neural dysfunction.
In international competitions athletes with different disabilities are classified according
to their individual functional capacities so that they can compete on an equitable basis.
Trained classifiers conduct objective tests that involve an examination of the medical
records as well as direct observation of the athlete to evaluate the functional capacity

12
and identify the anatomic level of the lesion. The tests include the evaluation of the
trunk and limb movements as well as the strength of specific muscle groups.
(International Paralympic Committee 2006.)
In athletics there are events for ambulant and wheelchair athletes in track and field. This
study will focus only on wheelchair athletes who are competing in class T54. An athlete
who is classified in T54 competes in track event (T) and normally uses a wheelchair.
Athlete must meet the conditions for minimal impairment (references to muscle power,
joint range of movement, spinal deformity, amputation level and congenital limb
shortening, spasticity and tendon reflex changes and limb length differences) to be
eligible to compete in International Competitions held under the Rules and Regulations
of IPC (International Paralympic Committee) athletics. The functions of upper limbs are
normal or almost normal in the class T54. Also the range of trunk function extending is
partial or normal trunk function. In this group there may be significant function in lower
limbs. (International Paralympic Committee 2006.)

13
3 WHEELCHAIRS
The wheelchair is the most important thing for its user. To avoid disadvantages caused
by incorrect position, the wheelchair is always planned individually and customized for
the users purpose. In every sport, there is almost always a specifically designed
wheelchair. (Airaksinen & Kataja 1984.) The strength of the upper body, the athletes
physical capacity, the level of the neurological lesion and applicability of the wheelchair
has to be considered when designing wheelchairs. All above mentioned factors can also
affect performance in wheelchair racing. (Masse & Lamontagne 1992.)
Wheelchair racing started at 1948. At that time, the racing wheelchairs were everyday
wheelchairs. At first, there were no competition events over 200 meters. (Cooper
1990b.) As the time has passed, the wheelchairs have developed with increasing
demands and wheelchair racing performance has improved tremendously over the past
years (Table 1). Nowadays racing wheelchairs are very light (about 4,5-7,3 kg). Those
have three wheels (one wheel in the front and two normal wheels on the back) and
monocoque frame which is made of aluminium, titan, chromolly steel etc. (Fig. 5).
(Airaksinen & Kataja 1984; MacLeish et al. 1993.) These chairs have tubular tires,
precision hubs, large wheels and small pushrims to optimise an individuals racing
ability (Cooper 1990b). To enhance the wheeling, racing wheelchairs are built in a more
aerodynamic way than everyday wheelchairs (MacLeish et al. 1993).
TABLE 1. Evolution of time for 100 m in Paralympics Games and today’s world record (IPC
2008).
Year Paralympics Time (s) Class
1988 Seoul 15,63 A1-3A9L2
1992 Barcelona 14,67 TW4
1996 Atlanta 14,45 T53
2000 Sydney 14,46 T54
2004 Athens 14,3 T54
World record 13,59 sec (22th of May 2008, Ibach, Switzerland))

14
FIGURE 5. Aero-Racer (Bromakin 2004).
Wheeling feature, stability and applicability to specific sport are very important
things concerning the different kinds of wheelchairs used in sports. The frame of the
racing wheelchairs should support racers´ position in a way that wheeling could be
aerodynamic and ergonomic and the trunk could be supported all the time. Wheelchairs
should also be quick but at the same time a bit stiff so the transfer of energy to the
wheels is more enhanced. (MacLeish et al. 1993.) The relation between center of gravity
and adhesion place of the wheels affect the wheeling features as well. When the
wheelchair has more weight on the back, it is easier to handle, but on the other hand, it
falls back easier. In these wheelchairs, there are short backrests so that the wheeling
position is more forward. The disabilities of limbs and differences in racers weight have
to be considered when designing racing wheelchairs. (Airaksinen & Kataja 1984.) The
size of the frame is determined by the racers size and the stability one wants. The
lengthening is useful in racing wheelchairs. Also, the width grows with camber-angle
(the angle of wheel and vertical line). (MacLeish et al. 1993.) In general, the camber-
angle varies from 5 to 15 degrees. This would prevent the upper arm from abducting in
the frontal plane, thus reducing static effort of the shoulder muscles. The effective force
vector can also be directed as closely as possible to the shoulder joint. The angle gives
elbows a more natural and relaxed way to push the wheelchairs. (Sherill 1993.) The
camber-angle affects on the grabbing of the pushrim and therefore has an influence on
the duration of pushing and the angular changes in the pushing phase (Ruggies et al.
1994).
The seating position affects the effectiveness of pushing. Masse and Lamontagne
(1992) noticed in their studies that seating in middle-low and in behind-low is a little bit

15
more effective way to push than in front-low, in front-high, in middle-high or in behind-
high (Masse & Lamontagne 1992). The researchers have also studied the location of
legs. The closer the legs are to the body, the more stable the pushing will be. Their
studies also indicate that keeping the knees up will enhance the power of pushing. These
results prove what coaches have suggested for years: for athletes with different levels of
neurological lesions should have specially designed wheelchairs with different seating
positions. Every athlete has to find their own individual and optimistic position.
(Ridgway et al. 1988.)
The size of the wheels depends on the racers range of motion of upper limbs, power
and the racers experience (MacLeish et al. 1993). The pushrim made of very strong and
light material is fastened to the wheels. Very often it is covered with coating tape to
enhance the grabbing. There are a lot of different sizes of pushrims. (Airaksinen &
Kataja 1984.) The quantities of spokes have to be considered in racing wheelchairs
because of the aerodynamics. When the spokes are rolling they mix air and produce
turbulences. So reducing the number of spokes will reduce the amount of turbulence.
On the other hand, at the same time the power of wheels and stiffness is reduced. This
can be compensated with arranging the spokes radially to each other. (MacLeish et al.
1993.)
These are the factors that affect the efficiency of racing wheelchairs in general: weight
and balance; frame and wheel stiffness; rolling, bearing and air resistance and the frame
geometry (Cooper 1990b). In the other words, rolling resistance is one of the major
resisting forces. The factors that influence rolling resistance are:
• fixed, customized frame;
• fixed foot/leg support;
• custom-made and tapered front end;
• customized frame angle of 80˚or more;
• camber bar;
• fixed backrest;
• fixed clothes protectors;
• weight; as low as possible;
• rear axis: customized seat angle and height; and
• rear wheel camber angle of 6-12˚. (van der Woude et al. 2000).

16
4 BIOMECHANICS OF WHEELCHAIR RACING
Propulsion technique varies between events, between the level of the neurological
lesions and between wheelchairs. The movement of upper arms is one of the things that
have to be considered when talking about everyday propulsion and wheelchair racing.
Many of the top athletes keep their knees as high as they can when propulsioning so that
air resistance will be smaller. It will also give better position for the upper arms and due
to that the body is easier to keep under control. Other option to keep air resistance
smaller is to keep the trunk close to knees. (Sherill 1993.) The seat position, pushrim
size and variations in terrain could change the propulsion technique (Morrow et al.
2003). There are still few studies done on wheelchair propulsion, especially on racing
wheelchair propulsion. One reason for this is that there are a lot of open issues
concerning propulsion techniques. Here is a short view on what has been done so far.
There are two different propulsion techniques: semi-circular and circular technique.
Short-duration, semi-circular technique is used in wheelchair races on short distances.
Upper arms will be pasted by the pushrim and will be released from it in this technique.
It is used also in everyday wheelchair propulsion. Long-duration, circular technique is
used in longer distances. In that technique the upper arms will follow the pushrim all the
time and grip will never be released. It only will be loosen at the end of the propulsion.
(Sherill 1993.) With this technique, racers can keep their velocity as high as they can
and the velocity is also stable. This technique requires good physical condition and
smaller pushrims than normal propulsion technique. Both upper arms must do the
propulsion at the same time with the same amount of force to keep the propulsion in
balance. (Airaksinen & Kataja 1984.) There is also discussion about the differences
between the conventional (CVT, also called thumb-technique) and para-backhand
(PBT) propulsion techniques in literature. With the CVT, the hands are fully flexed in a
tight fist with the thumb in a slightly extended position. The contact of the pushrim
occurs between the first joint and the knuckle of the thumb. A flick of the wrist is
commonly observed at the bottom of the stroke. CVT- technique demands impaired
upper extremity function. Using a specialized glove designed for the PBT, the hand
makes initial contact with the pushrim with the back of the index and middle fingers
between the first and second joins rather than the thumb. This technique is popular

17
among racing wheelchair athletes with upper extremity injuries. (Chow et al. 2001.) In
general one might generalize the propulsion technique as a push and pull technique
which is used for standard wheelchairs (Sanderson & Sommer 1985), whereas the
racing propulsion technique is referred to as a punching of the pushrim technique
(Cooper 1992).
4.1 Different phases in wheelchair propulsion
Wheelchair propulsion can be divided into two phases: propulsive phase and the
recovery phase. During the propulsive phase, hands are in contact with the pushrim so
that the muscle force maintains or increases the velocity of the wheelchair. Propulsive
phase typically starts when hands grasp the pushrim near or behind top dead center,
TDC. This phase will end when hands are released from the pushrim. In the recovery
phase, hands are released from the pushrim and the grip is taken again and a new
propulsive phase begins. In theory this happens, but compared to circular technique, it is
not so obvious or visible every time. (Sanderson & Sommer 1985.)
Cooper (1995) has divided entire arm pattern during propulsion into five categories: (a)
The elbows are in the highest position where arms are pointing forward and downward
(Component 1), (b) starting the propulsive phase (Component 2), (c) hand on pushrim
(Component 3), (d) end of the propulsive phase, “flick” (Component 4) and (e) the
elbows are driving to top (Component 5) (O´Connor et al. 1998) (Fig. 6).
FIGURE 6: The five categories of wheelchair propulsion (O´Connor et al. 1998).

18
4.2 Kinematic variables in wheelchair propulsion
Many studies have examined kinematic features of wheelchair propulsion. The
biomechanical variables investigated in these studies are the movement of the
wheelchair propulsion and the movement of the segments of body, (handling in chapter
4.3.), cycle frequency, push and recovery time, the linear velocity of shoulder, elbow
and wrist and their angular kinematics and start and end angle of propulsion. (O´Connor
et al. 1998; Sanderson & Sommer 1985; Vanlandewijck et al. 1994; Wang et al. 1995.)
Cycle frequency is the amount of full cycles per time. The changes in speed will cause
changes in cycle frequency and in the interrelation of push time (time spent on the
propulsive phase) and recovery time (time spent on the recovery phase). At the same
speed, a higher body mass leads to higher cycle frequency because of the greater
workload. (Veeger et al. 1989.)
Push and recovery time are often measured in wheelchair studies. The time spent in one
whole cycle, cycle time, can be calculated with these times. In Lamontagne´s (1981)
studies the push time was consistent in different velocities and seating positions. Push
time was around 38 % of the whole cycle. In Cooper’s (1990a) studies push time was on
average 33 % of the whole cycle and recovery time was on average around 67 % of the
whole cycle in different distances. When the recovery time gets shorter it limits the
backward movement of body. It also has an influence on acceleration, because of the
negative impact of the impulse produced by hands to the pushrim. (Wang et al. 1995.)
So when the push time shortens also the breaking forces (the inertia of the athlete, the
rolling resistance of the wheel etc.) diminish. On the other hand, so much impulse
cannot be produced at that time. (Cooper 1990a; O´Connor et al. 1998.) It is very
relevant for wheelchair racing that push time is the same for every cycle and, at the
same time, push angle will not change when maintaining the speed (Wang et al. 1995).
O´Connor et al. (1998) studied the velocity of a wrist in contact with the pushrim and
the velocity of an elbow. The velocity of the wrist in the beginning of the propulsive
phase, which transfers the speed to the pushrim at the same time, is in a major role in
measuring the velocity of the wheelchair. The velocity of the elbow is in a major role in
preparing the thoracic muscle for effective propulsion. If the push time gets longer and

19
the velocity of the wrist diminishes, it might cause ineffective propulsion. (Cooper
1990a; O´Connor et al. 1998.) With the maximal linear velocity of the shoulder and
elbow in the start of propulsive phase, and the maximal linear velocity of hand (flick of
hand at the end of the propulsive phase / at the beginning of the recovery phase) will
ensure the maximal velocity of the wheelchair. The linear velocity of the hand has to be
equal or bigger than the velocity of the pushrim. Otherwise the hand will reduce the
velocity of the pushrim. (Wang et al. 1995). Also grasping the pushrim will have the
same negative effect on the velocity of the wheelchair (Cooper 1990a).
The angular changes have also been studied. Ridgway et al. (1988) have done a research
studying the kinematic features of 800 meter wheelchair racers. They studied the
angular changes between head, arm, elbow, trunk and legs while propulsion. Also
Lamontagne (1981) has done a study about these same parameters. The angular
kinematics of elbow varied in every velocity and seating position. They noticed that
when legs were higher, the angle between legs and lower body was 30 degrees, the
relative amplitude of elbow angle was lower than when the angle was 90 degrees. When
measuring the same propulsion phase, the angle of elbow was bigger in 90 degrees
seating position than in 30 degrees seating position (Fig. 7). In the same study, they
noticed that the stability of subjects upper body (only one subject has paraplegia) was
better in high velocity than in low velocity. This was because the movement of upper
body was shorter in high velocity than when the velocity was decreasing. (Lamontagne
1981.)
FIGURE 7. A comparison of the angular displacement of the elbow a) for the legs up position
and Bb) for the legs down position at three spinning speeds (Lamontagne 1981).

20
O´Connor et al. (1998) perceived that the angle of elbow increased with speeding. This
might be an explanation for athletes to move their body upward, in vertical direction, so
they have time to get the body downward when hands are preparing to be in contact
with pushrim. This helps racers to use their own mass of body and gravity to enhance
power and improve the technique of propulsion. When hands are in contact with the
pushrim, the smaller elbow angle helps racers to stabilize their arms. This is because of
elbows bend more and arms are now closer to the body. Then athlete can produce higher
impulse to the pushrim and the stability of shoulder increases. Smaller elbow angle
indicates that the point hands are contacting the pushrim is closer to the shoulder joint,
which decreases the moment arm around the shoulder joint. This smaller moment arm
reduces the load of the shoulder joint and therefore it is possible to reduce the general
problem with wheelchair athletes shoulders. (O`Connor et al. 1998.)
In general, the start angle, the end angle and relative differences of the push angle are
studied (Dallmeijer et al. 1998; Wang et al. 1995). Wang et al. (1995) noticed that
having effective propulsion enables the racer to retain the same push angle when
speeding and at the same time, racer have to do the propulsive phase quicker than the
recovery phase.
4.3 Muscles and movement patterns in wheelchair propulsion
Here is a short review for muscles and movement patterns used in wheelchair
propulsion. It helps to understand more about wheelchair propulsion even though
muscles at work were not measured in this study.
The force for propulsion depends on many things such as the features of the wheelchair,
seating position and its relation with the hub of the wheel, the size of the diameter of the
pushrim and camber angle (van der Helm & Veeger 1996). The muscles and joints of
the shoulder, elbow and wrist are active when producing the force and power to
propulsion (Ruggles et al. 1994). Rodgers et al. (1994) studied more specifically about
the muscles involved in propulsion. They perceived in EMG-studies that m. biceps
brachii is active in the beginning of the propulsive phase and at the very end of the
recovery phase (in exhaustion). This muscle works as a flexor of the arm in the
beginning of the propulsive phase and at the phase where one puts hands on the

21
pushrim. M. triceps brachii is active in the recovery phase when the push and pull
movement is seen between the action of m. biceps brachii and m. triceps brachii. Most
of the time of the propulsive phase m. deltoideus anterior is active in the flexion of the
shoulder and in the recovery phase. M. deltoideus posterior is active in the extension of
the propulsive phase and in the beginning of the recovery phase. M. flexor carpi ulnaris
and m. extensor carpi radialis are both active in most of the time in propulsive phase,
which provide a more rigid member for the transfer of forces. (Rodgers et al. 1994.)
Also m. infraspinatus and m. supraspinatus participate in propulsion (van der Helm &
Veeger 1996). On the other hand, when Chow et al. (2001) examined the differences in
electromyography (EMG) between two racing wheelchair propulsion techniques they
got partially different results (Fig. 8).
FIGURE 8. Raw and normalized EMG of different muscles for a conventional (CVT) subject.
The vertical lined indicate instants of hand contact and release, (solid lines) and maximum
elbow height (dashed lines). (Choe et al. 2001.)

22
Cerquiglini et al. (1981) defined that the muscles of elbow do one third of the whole
propulsion, the muscles of wrist one fifth and the muscles of shoulder do the rest. The
muscles of wrist do isometric work in the beginning of the propulsion and eccentric
work at the end of the propulsion. The muscles of elbow are first doing concentric work
that is followed by isometric phase and an eccentric phase. The most of the propulsion
phase is caused by m. deltoideus anterior and m. pectoralis major. The force is never
more than 20 % of maximal force according to their investigations. (Cerquiglini et al.
1981.)
In the beginning of the propulsion phase the elbow is actively flexed: after this the
shoulder abducts, the shoulder lifts (because of m. trapezius) and the shoulder blade
rotates (Cerquiglini et al. 1981). The rotating of shoulder blade depends on the size of
the pushrim, its orientation and the racers force. Also the size of the pushrim has an
influence on the movement of the body while propulsion. (Hughes et al. 1992.) Also
Veeger et al. (1991) have got the same results that the smaller pushrim is more
favourable in fast and low-intensity distances. This can be seen in the racing
wheelchairs. (Veeger et al. 1991.) Hughes et al. (1992) stated that the movement of the
joints depends on seating position while propulsion.
There are two phenomena in propulsion that affect its effectiveness and load. These two
are the stability of glenohumeral joint and the kinematics movement. Isometric and
eccentric contracting muscles, which are activated in stabilization, produce metabolic
energy. At this time they do not produce outside force. Muscles produce positive force
only when muscles are under concentric work. So stabilization enquires force, which
could be a part of the reason that propulsion is ineffective. The movement should be
tangential to pushrim. Then the joint of shoulder and elbow are straightened out and at
the same time flexing momentum must be present for the result to be ideal. (van der
Helm & Veeger 1996; Roelevald et al. 1994.) Goosey-Tolfrey et al. (2001) investigated
the nature of the pushrim forces during the propulsion of a racing wheelchair. They
noticed that the peak forces occur at an angle between 140˚ and 180˚ in the racing
chairs contrast to the peak approximately 30˚ in everyday chairs. Racers were
accommodating the forces with increasing speed, not changing the propulsion strategy.
(Goosey-Tolfrey et al. 2001.)

23
The forward movement of the body depends on effective propulsion. The further the
racer leans forward, the more power the racer produces to pushrim. Producing force
composes of three things: gravitation, the acceleration of the movement when body
leans backward and abdominal (which are functional) activity. (Sanderson & Sommer
1985; Veeger et al. 1989.) Ridgway et al. (1988) have got the same results. Wang et al.
(1995) noticed that the flexion of body is bigger in high velocities than in low
velocities. This was caused of bigger start angle and bigger angle of elbow in the
beginning of the propulsive phase. When the body moves forward and backward, a part
of the weight of it may shift through the joint of shoulder and elbow to hands. The
flexion of body may cause better acceleration of pushrim in the beginning of the
propulsion. The wide vertical movement of abduction and hyperextension of shoulder in
the recovery phase is one way to get to the maximal speed. (Wang et al. 1995.) There
were not found any studies that studied the muscles of body during the propulsion.
Production of force is affected by the position of head and its movement while
propulsion and before that. Just before propulsion the flexion of head can produce more
force, which transfers to body, then continues to hands and onwards to pushrim. The
extension of head happens in the end of the propulsive phase. With all these factors put
together, the racer is more streamlined and air resistance diminishes. (Ridgway et al.
1988.)

24
5 THE PURPOSE OF THE STUDY
The level of neurological lesion, the neuromuscular disease and the features of the
wheelchair play all an important role for determining the kinematics variables in
wheelchair propulsion. The performances of the wheelchair athletes have continually
enhanced during past years. One way to succeed in wheelchair racing is trying to
improve the start technique. Few studies have analyzed the kinematic variables in
wheelchair racing propulsion (Chow et al. 2001; Higgs 1986; O´Connor et al. 1998;
Ridgway et al. 1988; Wang et al. 1995) but there are only two published articles about
the kinematic variables in the sprint start of wheelchair racing (Moss et al. 2005;
Tupling et al. 1986). The purpose of this study was to examine kinematic differences
between wheelchair racers (T54) in sprint start.
The following problems can be drawn from the purpose:
1. Are there any differences in time variables during the first and the third push at start
between the athletes?
2. Are there any differences in angle variables during the propulsive and the recovery
phase at start between the athletes? How the angle variables affect on movement
patterns of body and on movement patterns of segments of their body at start?
3. Are there any differences in the velocity of wrist and elbow in different phases of
the cycle and in different pushes at start between the athletes?
4. What kind of different starting positions athletes have?

25
6 METHODS
6.1 Subjects
Three male elite disabled athletes, aged 21-25 (mean 23,3 years) participated in this
study. All of them were international level wheelchair racers, paralympic gold
medallists, and competing in the class T54. They were participating in the Paralympic
Wheelchair Training Camp in Kuortane Training Center and all racers had experience in
wheelchair racing (mean 6,7 years). Table 2 shows the personal data. They were fully
informed of the procedures and the risks involved in this study and they gave their
informed consent (Attachment 1). They were also allowed to withdraw from the
measurements at will.
TABLE 2. Personal data of the subjects.
Subjects A B C Mean
Age 21 24 25 23,3
Weight (kg) 59 63 48 56,7
Height (cm) 153 175 145 157,7
Years in 21 7 25 17,7
wheelchair
Diameter of 37,2 38 38 37,7
pushrim (cm)
Diameter of 28 28 28 28,0
wheel (inch)
Years of 5 7 8 6,7
racing
Disablity Spina Bifida Artrogryposis Multiplex Spina Bifida
Congevit
Racing position Seated Kneeling Kneeling
6.2 Procedures
Before starting the protocol each racer did warm-up independently. Athletes used their
own racing wheelchairs (mean diameter of the wheel 28 inch, mean diameter of the
pushrim 37,7 cm) and regular racing equipments (gloves, leg restraints). The athletes
were allowed to use their own racing wheelchairs in order to acquire their natural

26
technique of the racing wheelchair propulsion and to provide to most accurate data
representing their racing wheelchair start technique. All the racing wheelchairs were
high quality so it was hypothesized that there were no significant advantage to any
participant. The filmed distance was 10 m. Athletes did maximum performances (100 %
of Max) four times, 80 % of maximum (80 % of Max) and 60 % of maximum (60 % of
Max) two times. Totally there were eight performances of each athlete. From 3 to 5 min
rest periods were allowed between trials to minimise the effect of fatigue. Athletes were
advised to focus to each performance as a competition. Starting commands used in
athletics were employed to initiate each of the sprint trials. The lower speeds (80 % Max
and 60 % Max) were so artificial simulations of the wheelchair propulsion that they did
not give any valid data for optimising the maximal start, for that reasons those results
are not under the main observation.
6.3 Apparatus
The kinematic data were collected using video recording and then digitised using a
motion analysis system (Peak Motus 8.5, Peak performance Inc., Denver, Colorado,
USA). This two-dimensional motion analysis was made by using High Speed Digital
Imaging system with two high-speed-cameras (MotionScope 1000SC, Redlake MASD,
Inc., USA) next to each one. Figure 9 shows that Camera #1 was set 27 m in front of the
propulsion line and it filmed from start to 5 m. Camera #2 was placed with the same
standards than Camera #1 from 4 m to 10 m. The time was measured by using two
beam sensors (SUN X, Beam Sensor VF2-RM5, Japan) at the start and at the end. There
were two extra lights (IANIRO 800, Italy) enhancing reflections of the markers. The
test was made on the track and field surface (Novotan CC). Film rate was 250 frames
per second. The arm movements of these athletes during the propulsion phase were
hypothesized to be bilaterally symmetrical. Thus only there were two cameras
positioned 27 m from the subject so that the axis of the lens was orthogonal to the
subject’s sagittal plane. It was assumed that because of this symmetry of motion there
would be negligible or no rotation of the trunk about its longitudinal axis (Goosey &
Campbell 1998). The calibration frame was filmed prior the tests.

27
FIGURE 9. Exciperimental set up
Nine reflective markers were placed on the left side of the participants: top of the head,
in front of the ear, on the shoulder (ligament Acromio-clavicular), on the elbow
(epicondylus lateralis), on the wrist (processus styloideus ulnae), on the hand (third
metacarpal), and on the knee (the proximal point of Patella). Also, markers were placed
on the hubs of the rear and front wheel (Fig. 10).
Acceleration sensor was placed on the frame of back of the wheelchair (Muscle Tester
ME3000 Professional: Mega Electronics, Kuopio, Finland). The speed of the wheelchair
was measured with speed radar (LAVEG, jenoptik).
6.4 Analysis
The fastest trial (100 % of Max) and the closest trial to the 80% of Max and 60% of
Max were manually digitised using motion analysis software (Peak Motus 8.5 Peak
performance Inc., Denver, Colorado, USA). The raw co-ordinate data were transformed
and the data were smoothed with a Butterworth filter with cut-off frequency 20 Hz. The
timing parameters; cycle time (time spent on one cycle), push time (% of the cycle time,

28
s) and recovery time (% of the cycle time, s) were calculated. Push time was defined as
the time during which the hand was in contact with the pushrim. Recovery time was
defined as the time when the hand was not in contact with the pushrim.
The resultant velocities analyzed were: 1) the velocity of the wheelchair in the first and
third cycles in the 100 % of Max, 2) the wrist velocity in the max performance in the
end of the first, second and third cycle, 3) the elbow velocity in the Max performance in
the beginning of the propulsive phase on the second, third and fourth cycle, 4) the elbow
velocity during the propulsion and the recovery phase on the maximum trial and on the
third cycle. The resultant velocities were calculated according to:
∆υr = sqrt(∆υv2
+∆υh2),
where ∆υv = vertical velocity, ∆υh = horizontal velocity.
The following two angular variables were analyzed of the first and third cycles in the
100 % of Max, of third cycle in 80 % of Max and of 60 % of Max according to:
∆α = degrees(atan((y2-y1)/( x2-x1)).
FIGURE 10: Angular parameters that were analyzed were trunk angle (green angle) and
shoulder angle (blue angle). Also the nine reflective markers are shown in this figure.

29
The angles were defined as follows: shoulder angle (formed by a line from the elbow to
the shoulder with the vertical) and trunk angle. To estimate the motion of the trunk, the
trunk angle was measured by forming the front of the ear marker, the rear wheel hub
marker translated along the x-axis. This variation only approximated motion of the
trunk due to number of factors. The motion described was not a true trunk rotation
because the subjects actually flexed in the mid-trunk region. The seat cage provided
support and stabilization and determined body position with respect to the pushrims for
the athlete, but the seat cage also imposed to see where the hip was. So the rear wheel
hub marker was used in these measurements. Also the angular velocities of trunk were
measured. Contact angle (CA) and range of push angle (RPA) were analyzed using the
data from wrist and rear wheel hub marker and their relation to vertical line (TDC or
BDC) (Fig. 11).
FIGURE 11: Angular parameters (CA and RPA) used to indicate the locations of the hand
relative to the wheel center at the instants of initial hand contact (HC) and release (HR).
The point of contact (cm from TDC) and release (cm from BDC) during the propulsive
phase of the stroke cycle where also examined.
6.5 Statistics
In some cases, average and standard deviation were calculated for some of the relevant
variables. However, due to nature of this study no other statistics analyses were
performed.

30
7 RESULTS
7.1 Timing parameters
The absolute and relative data for the push time and recovery time during the first and
third cycles in maximal performances, and the duration of each cycle, are presented in
the Table 3. The mean push time for the first push at maximum start was 0,60 s and for
third push 0,23 s. Recovery time was 0,15 s and 0,21 s on average in the same
performances. When speed increased, the propulsion phase was performed faster while
the recovery phase increased on subject A and C and decreased on subject B. As
predicted, the cycle time decreased as the speed increased on all athletes. Subject A had
a much faster first cycle than the other subjects but the advantage was vanished when
the third cycle was performed.
TABLE 3. Starting position and timing parameters in the performances.
Subject Performance Push Time (s) Recovery Time (s) Cycle time (s)
A 100 / 1 0,4 0,136 0,536
% cycle time 75 25
100 / 3 0,228 0,252 0,48
% cycle time 47,50 52,5
B 100 / 1 0,66 0,184 0,844
% cycle time 78 22
100 / 3 0,188 0,152 0,34
% cycle time 55 45
C 100 / 1 0,752 0,212 0,964
% cycle time 78 22
100 / 3 0,26 0,224 0,484
% cycle time 54 46
100 / 1= Maximun trial / First push, 100 / 3= Maximum trial / Third push
The mean percentages of the propulsion phase and the recovery phase are presented in
Figure 12. The data indicated that in the beginning the differences between these phases
were enormous but it was almost even on the third cycle on the maximum trial (Fig.
12).

31
FIGURE 12: The average relative data of the propulsion and the recovery phase of the subjects
in the first and third cycles. 100 / 1 = Maximum trial / First push, 100 / 3 = Maximum trial /
Third push.
The time for 10 m was measured by using two beam sensors and for the 100 % Max the
times were 2,39 s, 2,36 s and 2,51 s for subject A, B and C respectively.
7.2 Linear velocities
Figure 13 allowed the comparison of the wheelchair velocities of each subject during
the first and third cycle in maximal start. During the first cycle the velocity of the
wheelchair was much faster on the subject who was seated but subjects having other
seating positions caught up with the subject A during the third cycle. Subject A had
very variable velocity of the wheelchair during the third cycle. The mean wheelchair
velocity during the first cycle was 2,63 m/s, 1,07 m/s and 1,14 m/s for subject A, B and
C respectively. For the third cycle the same values were 4,53 m/s, 4,43 m/s and 4,44
m/s.
0
10
20
30
40
50
60
70
80
90
Performance / cycle
Percent (%)
% Propulsion phase
% Recovery phase
100 / 1 100 / 3

32
a)
b)
FIGURE 13. The wheelchair velocity of the first (a) and third (b) cycle on the Max. The vertical
lines reflect the change from the propulsion phase to the recovery phase.
Wrist velocity in the Max performance in the end of the first, second and third cycles
are demonstrated on Figure 14. Subject A had the maximum wrist velocity, 2, 24 m/s, in
the end of the third recovery phase.

33
0
1
2
3
Subject
Velocity (m/s)
Subject A 2,14 1,6 2,24
Subject B 1,60 1,8 1,03
Subject C 0,56 1,12 1,12
1 2 3
FIGURE 14. Wrist velocity in the max performance in the end of the recovery phase of the first
(1), second (2) and third (3) pushes.
The values for elbow velocity in the Max performance in the beginning of the
propulsive phase on the second, third and fourth cycle showed that subject A had the
maximum elbow velocity, 2,26 m/s, in the beginning of the second propulsive phase
(Fig. 15).
0,0
0,5
1,0
1,5
2,0
2,5
Velocity (m/s)
Subject A 2,26 2,02 0,9
Subject B 1,50 1,95 1,75
Subject C 0,79 0,56 0,50
2 3 4
FIGURE 15. Elbow velocity in the Max performance in the beginning of the propulsive phase
on the second, third and fourth cycle.
The elbow velocities on the maximal start are demonstrated in Figure 16. Again the
subject A had greater velocities than the others but it seemed to smoothen when
reaching the third cycle. The mean elbow velocity on the first cycle was 1,94 m/s, 0,90

34
m/s and 0,72 m/s for subject A, B and C respectively. For the third cycle the same
values were 2,42 m/s, 1,89 m/s and 1,51 m/s.
a)
b)
FIGURE 16. The elbow velocity of the first (a) and third (b) cycle on the Max. The vertical
lines reflect the change from the propulsion phase to the recovery phase.
7.3 Angular variables and movement patterns
All subjects showed decreases in the changes of trunk angle, when velocity increased
during the start phase. Subject A had more changes in trunk angles (more trunk motion)
than other subjects and it should be noticed that the start position of subject A
demanded a larger start angle of the trunk (Fig. 17a). At start position, the angle varied
from 48,2˚ to 60,9˚. In the beginning of the propulsion phase the trunk angle decreased

35
but in some point of the propulsion phase trunk appeared to prepare for the recovery
phase with increasing the trunk angle to the end of the propulsion phase. The trunk
motion was smaller on the third cycle than on the first cycle.
a)
b)
FIGURE 17. Trunk angle of the first (a) and third (b) cycle on the Max. The vertical lines reflect
the change from the propulsion phase to the recovery phase.
The angular velocities of the trunk in maximum trials are illustrated in Figure 18. All
subjects had their maximum angular velocities of trunk just before the recovery phase.
Subject A had greater values than others.

36
a)
b)
FIGURE 18: The Trunk angular velocities in the first (a) and in the third (b) cycle in Maximum
trial. The vertical lines reflect the change from the propulsion phase to the recovery phase.
All the subjects had almost the same kind of shoulder angle at the start. The maximum
shoulder angle appeared to be just in the beginning of the recovery phase in all athletes.
The shoulder angle changes were the largest on the subject A (Fig. 19a). Few pushes
after, the changes in shoulder angle were smoothened. On the third cycle, the changes
between athletes were smaller than on the first cycle. Subject B had the largest changes
on shoulder angle on the third cycle (Fig. 19b).
37
a)
b)
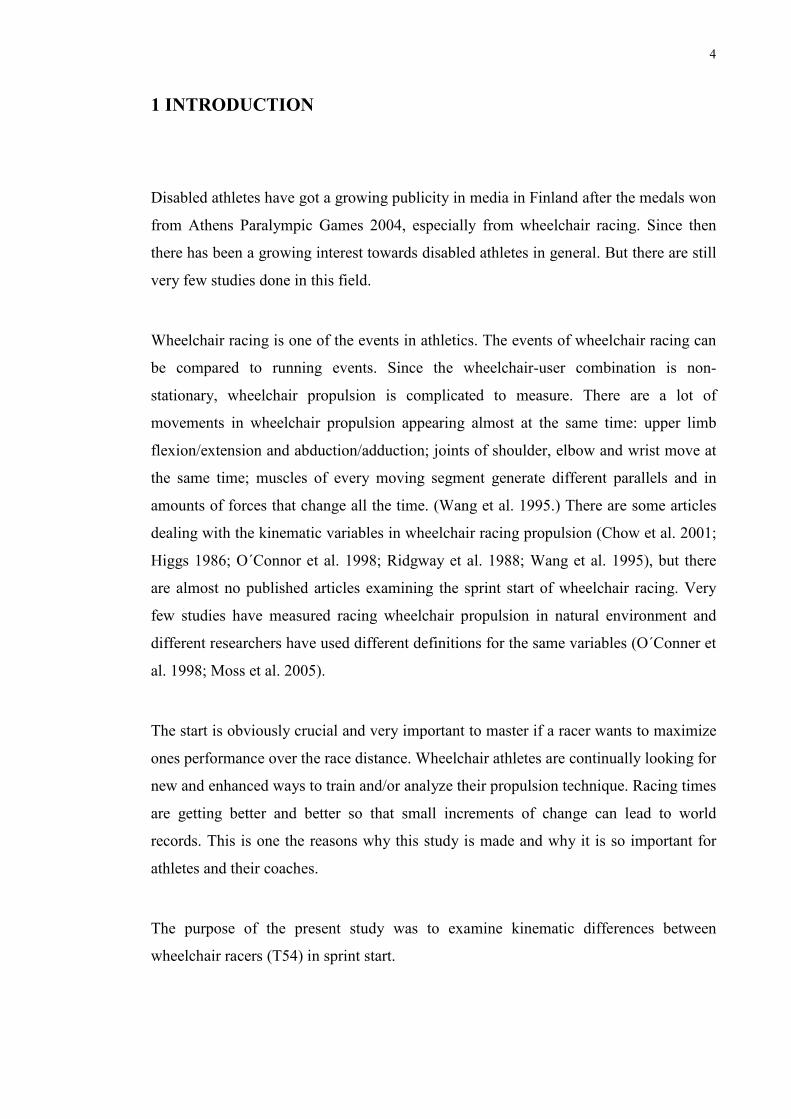
FIGURE 19. Shoulder angle of the first (a) and third (b) cycle on the Max. The vertical lines
reflect the change from the propulsion phase to the recovery phase.
The initial contact angle and the ranges of the wrist push angles in the three speed
conditions are presented in Table 4. The mean contact angle at maximum start was 34,7˚
and on the third cycle 12,0˚. Subject C had the smallest contact angles. In other words
subject C started the propulsion phase closest to the TDC.

38
TABLE 4. Contact angle and range of push angle of the trials
Contact angle (˚)
A B C
P1/100 50,4 37,6 16,1
P3/100 17 16,4 2,7
Range of push angle (˚)
A B C
P1/100 129,6 142,4 163,9
P3/100 163 163,6 177,3
Analysis of the point of contact and release of the propulsive phase of the stroke cycle
indicated several differences between the sprinters (Table 5). TDC negative value
indicated grasping after TDC and BDC negative value indicated releasing after BDC.
When speed decreased, the point of contact got close to the top or bottom of the
pushrim.
TABLE 5. Top Dead Center (TDC) = 0 cm and Below Dead Center (BDC) = 0 cm on the
performances.
TDC BDC
A P1/100 -20,9 -13,9
P3/100 -8,8 -2,5
B P1/100 -15,2 -9,9
P3/100 -6,7 -4
C P1/100 -4,9 -4,8
P3/100 1 -0,1

39
8 DISCUSSION
The purpose of the present study was to examine kinematic differences between elite
wheelchair racers (T54) in sprint start. The relationships between selected kinematic
factors were analyzed to investigate whether there were significant differences between
athletes. However, due to very few subjects one cannot assume the conclusions to be
absolutely valid and differences were hard to analyze. This research paper could be
considered as a descriptive case study of kinematic variables and their differences
between top wheelchair racers. Seating or positioning could be slightly improved
through coaching based on the results of this study.
The main findings of the study were as follows:
1. The racer with more velocity had smaller time on propulsive phase. The point
where hands contacted the pushrim seemed to got closer to TDC when speed
increased.
2. The racer with more velocity had larger movement of body forward in relation
to the axle of the wheel at start.
3. The racer with more velocity had larger velocity of wrist in the end of the
recovery phase and has larger velocity of elbow in the beginning of the
propulsive phase.
According to my knowledge there are only few studies investigating the kinematic
variables in wheelchair racing propulsion (Chow et al. 2001; Higgs 1986; O´Connor et
al. 1998; Ridgway et al. 1988; Wang et al. 1995). Furthermore, there are found only two
published articles about the sprint start of wheelchair racing. Moss et al. (2005)
analyzed the first six pushes of a sprint start in over-ground racing wheelchair
propulsion with one international male wheelchair athlete. The arm strength and
impulse generation of initiation of wheelchair were studied by Tupling et al. (1986).
Comparing literature data on wheelchair racing and on wheelchair sports in general,
findings should be dealt with caution due to several reasons. The development of
rehabilitation, the results of academic studies and the developments of the equipment
are just a couple of reasons to be mentioned. The differences between earlier studies and

40
the studies of this century can be attributed largely to differences in the wheelchair
itself/wheelchair user interface, specifically to the preference of smaller diameter
pushrims. This has occurred through developments in racing wheelchair design and the
differences in propulsion technique. Very few studies have categorized the pushes from
each other. There are also a lot of different definitions of the same variable and
experimental set-ups in the studies presented in literature. A considerable amount of
studies have simulated racing wheelchair propulsion in laboratory environments using
motor-driven treadmills, wheelchair ergometers or simulators. Able-bodied athletes are
also used in the studies of the disabled sport, which could give slightly invalid data.
8.1 Wheelchair racing propulsion at start
To initiate movement of the wheelchair/wheelchair user system first the inertia of that
system must be overcome. This is a function of starting technique, upper extremity
strength and stabilizing potential of the trunk musculature. (Moss et al. 2005; Tupling et
al. 1986.) The pushrim is grasped or punched forward and downward, thus rotating the
driving wheels. To achieve an explosive sprint start, it depends upon the net force
exerted backwards on the ground by the wheelchair/wheelchair user system and on time
interval over which these forces are applied. The initial position of the chair, the intent
of the movement, the starting technique and the strength of functional muscles in the
upper extremities and trunk influence the magnitude and direction of the impulse which
is generated. (Tupling et al. 1986.) In order to maintain or increase the acceleration of
the wheelchair a larger force must be applied to the pushrim with each subsequent push.
However, athlete has less time to apply this force due to increasing velocity of the
wheel. Moss et al. (2005) noticed that when velocity increased, the athlete increased the
range over which the hand was in contact with the pushrim. At same time, the athlete
was contacting the pushrim closer to TDC and releasing the pushrim closer to BDC
with each push. (Moss et al 2005.) This was also obtained in the present study (Table 4
and 5). The RPA values were somewhat the same than Wang et al. (1995) have
measured (Table 4). With these changes, athletes try to optimize the upper arm,
shoulder and elbow to an advantageous position in order to favour the acceleration of
the pushrim during the propulsion (Wang et al. 1995). Few studies have also examined
the directions of forces applied to the pushrim (Goosey –Tolfrey et al 2001; Roelevald
et al. 1994; Veeger et al. 1991). Goosey-Tolfrey et al. (2001) noticed that the ratios of

41
forces remained relatively constant due to forces were increased proportionally in both
tangential and medio-lateral directions. The increase of force was accompanied by an
increase in the cycle frequency.
The first push is unique because it starts stationary. The trunk appears to fall forward
and the trunk angle decreases (Fig. 17a). In the study by Moss et al. (2005) the elbow
appeared to flex slightly at first and then extended rapidly reaching the peak extension
at the point of release before returning to a flexed position at start. Where the trunk
began to flex with the elbow extended, it allowed the hands to follow further round the
pushrim and thus adding to the propulsive effect of the arms. (Moss et al. 2005.) The
shoulder angle (Fig. 19) showed that in the beginning of the propulsion the angle
decreased when humerus approached the body being almost in a vertical position. The
angle increased significantly before releasing. The range of motion might be related to
the positioning of the upper arm in a favourable position to maximize upper-extremity
muscle capacity and efficient propulsion technique. The differences between Moss et al.
(2005) and the present study can be attributed largely to differences in the definitions of
the shoulder angle.
The second push and thus the subsequent pushes are different from the first push since
those pushes are the first pushes when the racer has to contact the pushrim while the
wheelchair and thus the wheelchair wheel are in motion. The movement of the trunk
also decreased during the propulsion (Fig. 17b). As the wheelchair racing speed was
increased, the variations of the trunk angle decreased (i.e., the athlete’s upper trunk
became more horizontal). The same body positioning was also observed by Wang et al.
1995 and O´Connor et al. 1998. The third push and the subsequent pushes seemed to
follow the second push, but the range of motion of the trunk is reduced. This was
largely due to the reduced flexion at contact. (Moss et al. 2005.)
The trunk angular velocities were somewhat the same than Moss et al. (2005) have
studied. According to Moss et al. (2005) the relative consistency of the trunk angular
velocities suggests that the contribution of the trunk to propulsion mechanics is to place
the shoulder in favourable position at the start of each push.

42
Coutts (1990) and Moss et al. (2005) found similar mean peak velocity data for the first
push than in this present study. But it should be noted that there were quite different
values for the first push between the athletes on the present study. On the third push the
velocities were a bit higher than in the other studies (Fig. 13).
8.2 An efficient propulsion at start
The results from the kinematic variables analyzed prior to and on hand contact with the
pushrim are significant in developing a more efficient racing wheelchair propulsion
technique. The velocity of the wrist on hand contact with the pushrim and the technique
of transferring that velocity to the pushrim are major factors that determine the velocity
of the wheelchair. (O´Connor et al. 1998.)
The results showed that that the mean duration of the propulsive phase decreased with
all athletes while the recovery phase increased on subject A and C and decreased on
subject B. During the third cycle in the Max trial the cycle time was fastest on the
subject B, which furthermore explained that this subject used less time on 10 meter than
other subjects. Moss et al. (2005) found similar mean percentages of the propulsive
phase and the recovery phase than showed in this present study (Table 3). Also the
mean push and recovery times were almost identical with their study. Less time on the
pushrim minimized the risk for a decelerating force to be applied to the pushrim.
However, decreased time on the pushrim also indicates that there would be less time to
apply force to the pushrim. (Moss et al. 2005.) It could be evaluated that the push time
is more crucial than the recovery time in the start. Other researchers have found
different values for these variables but none of them reported the results of the start.
Wang et al. (1995) have come to the conclusions that to maximize wheelchair racing
speed, it is critical to obtain the maximal shoulder and elbow velocities at initial contact
of the propulsion phase and the maximal wrist velocity in the end of the recovery phase.
The elbow velocity plays a greater role in preloading the chest, which facilitates
involvement of more muscle mass in the propulsion phase. The present study showed
some of these statements to be true. The racer with more velocity had larger velocity of
wrist in the end of the recovery phase (just before the hand contact) and had larger
velocity of elbow in the beginning of the propulsive phase (just after the hand contact)

43
(Fig. 14, Fig. 15 and Fig. 16). Although Moss et al. (2005) noted that their velocity
profile did not indicate a braking effect caused by the hand travelling at lower velocity
compared to the pushrim at the instant of contact. According to them this is due to the
subjects ability to match the speed of the wheel at relatively slow speed of the first
pushes of the start. O´Connor et al. (1998) found a little bit higher values for the elbow
velocities in the end of the recovery phase (O´Connors´ prepatory phase) comparing to
this study.
Positioning and the size of the pushrim are also factors determining the efficient
propulsion. The degree of trunk mobility and control may be a limiting factor in the leg-
positioning options of the athlete. Any conclusions of a better start positioning,
according to this present study, cannot be drawn due to the small number of subjects.
Aerodynamic positioning has become a major component in optimising wheelchair
racing performance. It should be reminded that each sprint start was performed from a
stationary start along a 10 meter portion of an indoor running track, so it could be
assumed that there was minimal air resistance. Van der Woude et al. (1988) showed that
smaller pushrims are more efficient than larger pushrims when measuring the
physiological parameters. Increasing pushrim diameter had a significant effect on
movement pattern of the upper arm in the sagittal as well the frontal plane of motion.
On the other hand, the pushrim cannot be too small (Morrow et al. 2003). In this present
study all pushrims were somewhat the same size and thus did not give any advantages
to any of the subjects.
8.3 Kinematic differences between the wheelchair racers
No significant differences in kinematic variables were found between the athletes due to
small number of subjects. However, subject A had the fastest cycle time on the first
cycle at start. It could be assumed that this was due to the fastest wrist velocity in the
end of the first recovery phase and also the fastest elbow velocity in the beginning of
the second propulsive phase. The mean elbow velocity during the first push was highest.
In addition, subject A had more trunk motion at start than other subjects. The
combination of these factors might be the cause for the fastest cycle time. Subject B had
the fastest third cycle. The results showed that the wrist velocity in the end of the
second recovery phase and the elbow velocity in the beginning of the fourth propulsive

44
phase were higher than other subjects had. Changes in shoulder angle were also the
largest in the third cycle. This could be due to preloading the muscles of upper arm,
which facilitates involvement of more muscle mass in the propulsion phase. The
changes in shoulder angle could put the arm in an optimal position to apply more force
to the pushrim. However, further studies should be conducted in this area to confirm
these observations.
8.4 Recommendations for future studies
It should be emphasised that the muscles at work and therefore EMG of the upper
extremities and trunk muscles must be included in the future studies. The maximum
propulsion impulse which can be developed by an athlete depends also on the athletes
particular starting technique, and upon the strength of functional upper extremities and
trunk. The limiting factor for racing wheelchair propulsion velocity could be the force-
velocity relationship of the muscles involved in propulsion.
In addition, the magnitude and direction of the forces must be examined. Studies
concerning optimal starts should also analyze the wrist trajectory angle which is the
angle at which the wrist approaches the pushrim. This angle contributes to the velocity
or force generated tangentially (force acting around the hub causing rotation) or radially
(force directed toward the hub of the wheel). This was studied by Goosey-Tolfrey et al.
(2001), O´Connor et al. (1998) and Roelevald et al (1994). A sufficient amount of radial
force is needed to help maintain friction between the hand and the pushrim; otherwise
the hand might slip off the pushrim (O`Connor et al. 1998). Several materials i.e.
friction tape, sap and suede gloves are used to improve the quality of the contact. It goes
without saying that this is crucial for the optimal start.
Future studies should concentrate on three-dimensional analysis due to the fact that the
method will give more accurate information, for example about the movements of the
elbow. Even though Goosey and Campbell (1998) analyzed the bilateral symmetry of
the elbow movement pattern during wheelchair propulsion and it was valid for their
group, this did not appear to be the case for the subjects observed in this study and was
not analyzed.

45
This study used cinematography to identify the instants of contact and release of the
pushrim. The accuracy of the cinematographic method being used to identify the
wheelchair propulsion phases may have been questionable, since there were several
frames which were rather difficult to assign to either the propulsion or the recovery
phase. Due also to speed of hand movement and insufficient image clarity, the
identification of the propulsion and the recovery phase was extremely difficult but it
was made as accurate as possible. Despite of this inaccuracy, this method has been
widely used in wheelchair propulsion literature. Analysis of the velocity profile and
using the temporal information of the video film revealed features in the velocity profile
that appeared to be consistent with propulsion and the recovery phase thus confirming
the data.
Evaluating the biomechanics of wheelchair propulsion has been limited by the available
instrumentation and the apparent lack of coordination between the investigators. In the
future, it is crucial to use a standardised method and definitions for dividing the
propulsion to phases. Wang et al. (1995) investigated three-dimensional kinematic
features of the wheelchair across four selected speeds. They used a timing device for
dividing the propulsive and the recovery phase of a cycle during wheelchair propulsion.
This timing device consisted of a light emitting diode (LED) box. Wang and Beale
(1996) made a technical note of this same method and noticed that the propulsion phase
was approximately 10 % in comparison with the results of the method using
cinematography. However, the differences may also be due to some other factors, such
as chair style, seating positions, power output demands, training experiences and the
modification of the wheelchair propulsion techniques. Variations in the degree of the
spinal cord lesion (complete vs. incomplete) have a significant impact on the
biomechanical variables, which further confounds the results. (Wang & Beale 1996.)
However, this study showed the significance of analyzing the start technique of
wheelchair racer and the importance of using a natural environment and the athletes
wheelchair. But there are several possible sources for errors in kinematical
measurements obtained in this study. In addition to the possible errors due to manual
digitizing, limited resolution of the video images and the use of nonsynchronized
cameras define this study as a descriptive study.

46
In conclusion, it was found that in order to adapt a more efficient start technique, an
athlete must (a) perform the propulsion phase faster and faster as the racing speed
increases; (b) maximize the velocity of the wrist in the end of the recovery phase and
the velocity of the elbow in the beginning of the propulsive phase; (c) use more trunk
forward lean to develop a greater vertical motion and assisted acceleration. Caution
should be taken when generalising the specific values presented to the wider wheelchair
racing athletes. However, the findings are worthy for further investigation and could be
used through coaching.
Acknowledgements
I would like to thank KIHU - Research Institute for Olympic Sports: Tomi Vänttinen,
Executive Manager of Multimedia, Riku Valleala, M .Sc., Jani Talkkari, M. Sc. and
Jukka Viitasalo, Ph.D. for their assistance during data collection and University of
Jyväskylä / Department of Biology of Physical Activity: Juha Isolehto, Mikko
Virmavirta, Ph.D. and Elina Sillanpää, M. Sc. for their assistance during data analysis.
Tiia-Tytti Vartiainen, my family and friends were great support for me all the time. I
would also to thank the subjects and the Finnish Paralympic Committee for making this
study possible.

47
REFERENCES
Airaksinen, J. & Kataja, J. 1984. Vammaisurheilussa tarvittavat erikoisapuvälineet ja
niiden käyttö. Vammaisten urheiluvalmennus. Suomen Invalidien
Urheiluliitto ry, 151-166.
American Spinal Injury Association (ASIA) 2006. Standards for Neurological
Classification of SCI Worksheet (Dermatomes Chart). [Reference taken
on the 17th
of May 2008]. Available in internet: <URL: http://www.asia-
spinalinjury.org/publications/2006_Classif_worksheet.pdf>.
Alaranta, H. & Ahoniemi, E. 1998. Voisiko sukeltamisesta johtuvia selkäydinvaurioita
ehkäistä? Suomen lääkärilehti, 53, 1241-1242.
Alaranta, H. Ahoniemi, E. Dahlberg, A. Hokkinen, E-M Leppänen, P. Palomäki, H. &
Kannisto M. 1998. Kansainvälinen selkäydinvaurioiden neurologinen
tasoluokitus. Suomen Lääkärilehti, 53, 161-165.
Alaranta, H. Valtonen, K. Dahlberg, A.& Ahoniemi, E. 2000. Traumaattisten
selkäydinvaurioiden taustasyyt - entäpä primaaripreventio! Suomen
Lääkärilehti, 55, 2523-2526.
Bhambhani, Y. 2002. Physiology of Wheelchair Racing in Athletes with Spinal Cord
Injury. Sports Medicine, 32 (1), 23-51.
Bridwell, K. 2006. Nerve Structures of the Spine. [Reference taken on the 10th
of
February 2006]. Available in internet: <URL:http://www.spineuniverse.
com/displayarticle.php/article1275.html>.
Bromakin 2004. Aero-Racer. [Reference taken on the 13th
of June 2004]. Available in
internet: <URL: ht http://www.bromakin.co.uk/ sports>.
Cerquiglini, S. Figura, F. Marchetti, M. & Ricci, B. Biomechanics of Wheelchair
Propulsion. In: Morechi, A. & Fidelin, K. (Ed.) 1981. Biomechanics
VII-A. Baltimore: University Park, 1981. 410-419.
Chow, J. W. Millikan, T. A. Carlton, L. G. Morse, M. I. & Chae, W-S. 2001.
Biomechanical Comparison of Two Racing Wheelchair Propulsion
Technique. Medicine Science in Sport & Exercise, 33 (3), 476-484.
Cooper, R. A. 1990a. An Exploratory Study of Racing Wheelchair Propulsion
Dynamics. Adapted Physical Activity Quarterly, 7, 74-85.
Cooper, R. A. 1990b. Wheelchair Racing Sports Science: A review. Journal of
Rehabilitation Research & Development, 27 (3), 295-313.

48
Cooper, R. A. 1992. The Contribution of Selected Anthropometric and Physiological
Variables to 10 K Performance of Wheelchair Racers: A preliminary
study. Journal of Rehabilitation Research and Development, 29 (3), 29-34.
Cooper, R. A 1995. Rehabilitation Engineering Applied to Mobility an Manipulation.
Bristol, UK: Institute of Physics Publishing.
Coutts, K. 1990. Kinematics of Sport Wheelchair Propulsion. Journal of Rehabilitation
Research and Development, 27 (1), 21-26.
Dahlberg, A. & Alaranta, H. 1996. Maali, jäähy ja ”life time care”? Suomen
Lääkärilehti, 51, 653-654.
Dallmeijer, A. J. van der Woude, L. H. V. Veeger, D. & Hollander, A. P. 1998.
Effectiveness of Force Application in Manual Wheelchair Propulsion in
Persons with Spinal Cord Injuries. American Journal of Physical Medicine
& Rehabilitation, 77, 213-221.
Goosey, V. L. & Campbell, I. G. 1998. Symmetry of the Elbow Kinematics during
Racing Wheelchair Propulsion. Ergonomics, 41 (12), 1810-1820.
Goosey-Tolfrey, V. L. Fowler, N. E. Campbell, I. G. & Iwnicki, S. D. 2001. A kinetic
analysis of trained wheelchair racers during two speeds of propulsion.
Medical Engineering & Physics, 23, 259-266.
Gray, H. The Nervous System. In: Pickering Pick, T. & Howden, R. (Ed.) 1974, Gray´s
Anatomy. Running Press, Philadelphia, PA, 756-798.
van der Helm, F. C. T. & Veeger, H. E. J. 1996. Quasi-static Analysis of Muscle Forces
in the Shoulder Mechanism during Wheelchair Propulsion. Journal of
Biomechanics, 29 (1), 39-52.
Higgs, C. 1986. Propulsion of Racing Wheelchair. In: Sherill, C. (Ed.), Sport and
Disabled Athletes. Human Kinetics Publishers, Inc, Champaign, IL, 165-
172.
Hughes, C. J. Weimar, W. H. Sheth, P. N. & Brubaker, C. E. 1992. Biomechanics of
Wheelchair Propulsion as a Function of Seat Position and User-to-Chair
Interface. Archives of Physical Medicine & Rehabilitation, 73, 263-269.
International Paralympic Committee 2006. IPC Athletics Classification Handbook.
[Reference taken on the 17th
of May 2008].
Available in internet: <URL: http://www.paralympic.org/release/
Summer_Sports/Athletics//About_the_sport/Rules/IPC_Athletics_
Classification_Handbook_2006.pdf>.

49
Lamontagne, M. Biomechanical Study of Wheelchair Propulsion. In: Groot, G.
Hollander, A. P. Huijong. P. A. & van Ingen Schenau, G. J. (Ed.) 1981.
Biomechanics, XI-A. Amsterdam: Vrije Universiteit, 513-519.
MacLeish, M. S. Cooper, R. A. Harralson, J. & Ster, J. F. 1993. Design of a Composite
Monoque Frame Racing Wheelchair. Journal of Rehabilitation Research
and Development, 30 (2), 233-249.
Masse, L. C. & Lamontagne, M. 1992. Biomechanical Analysis of Wheelchair
Propulsion for Various Seating Positions. Journal of Rehabilitation
Research & Development, 29 (3), 12-17.
Maynard, F. M. Bracken, M. B. Creasey, G. Ditunno, J. F Jr Donovan, W. H. Ducker,
T. B. Garber, S. L. Marino, R. J. Stover, S. L. Tator, C. H. Waters, R. L.
Wilberger, J. E. & Young, W. 1997. International Standards for
Neurological and Functional Classification of Spinal Cord Injury. Spinal
Cord, 35, 266-274.
Morrow, D. A., Guo, L. Y., Zhao, K. D., Su, F. C. & An, K. N. 2003. A 2-D Model of
Wheelchair Propulsion. Disablility and Rehabilitation, 25 (4-5) 192-196.
Moss, A. D. Fowler, N. E. & Goosey-Tolfrey, V.L. 2005. The Intra-push Velocity
Profile of the Over-ground Racing Wheelchair Sprint Start. Journal of
Biomechanics, 38, 15-22.
Mueller, G. Perret, C. & Hopman, M. T. 2008. Effects of Respiratory Muscle
Endurance Training on Wheelchair Racing Performance in Athletes with
Paraplegia: a pilot study. Clinical Journal of Sport Medicine, 18 (1), 85-
88.
National Institute of Neurological Disorders and Stroke (NINDS) 2005. Spina Bifida
Fact Sheet [reference taken on the 14th
of November 2005]. Available in
internet: <URL: http:/ /www.ninds.nih.gov/disorders/spina_bifida
/detail_spina_bifida_pr.htm>.
O´Connor, T. J. Robertson, R. N. & Cooper, R. A. 1998. Three-Dimensional Kinematic
Analysis and Physiological Assessment of Racing Wheelchair Propulsion.
Adapted Physical Activity Quarterly, 15, 1-14.
Ridgway, M. Pope, C. & Wilkerson J. 1988. A Kinematic Analysis of 800-Meter
Wheelchair-racing Techniques. Adapted Physical Activity Quarterly, 5,
96-107.

50
Rodgers, M. M. Gayle, G. W. Figoni, S. F. Kobyashi, M. Lieh, J. & Glaser, R. M. 1994.
Biomechanics of Wheelchair Propulsion during Fatigue. Archives of
Physical Medicine & Rehabilitation, 75, 85-93.
Roelevald, K. Lute, E. Veeger, D. Gwinn, T. & van der Woude, L. 1994. Power Output
and Technique of Wheelchair Athletes. Adapted Physical Activity
Quarterly, 11, 71-85.
Ruggles, D. L. Cahalan, T. & An, K-N. 1994. Biomechanics of Wheelchair Propulsion
by Able-Bodied Subjects. Archives of Physical Medicine &
Rehabilitation, 75, 540-544.
Ryöppy, S. 1997. Yleiset tuki- ja liikuntaelimistön häiriöt; Neuromuskulaariset häiriöt;
Artrogrypoosi. Helsinki: Kustannus Oy Duodecim. 1598-161.
Sanderson, D. J. & Sommer III H. J. 1985. Kinematic Features of Wheelchair
Propulsion. Journal of Biomechanics, 18 (6), 423-429.
Sherill, C. 1993. Wheelchair Sports and Orthopedic Impairments. Adapted Physical
Activity, Recreation and Sport: Crossdisplinary and Lifespan. Fourth
edition. Dubyque, IA: Brown & Bencmark (A Division of Wm. C. Brown
Communications, inc.), 555-587.
The Spinal Cord Injury Resource Center [reference taken on the 17th
of May 2008].
Available in internet: <URL: http://www.spinalinjury.net/html>.
Stakes/Stakes Information, 2000. Congenital anomalies 1993-1999 and preliminary data
for 2000 - Data supplier Feedback 3/2002, Welfare and Health care
Statistics.
Swan, J. 2006. [reference taken on the 10th
of February 2006]. Available in internet:
<URL: http://www.unm.edu/~jimmy/spinal_notes.htm>.
Tupling, S. J., Davis, G. M., Pierrynowski, M. R. & Shephard, R. J. 1986. Arm Strength
and Impulse Generation: Initiation of Wheelchair Movement by the
Physically Disabled. Ergonomics, 29 (2), 303-311.
Valtonen, K. & Alaranta, H. 2001. Urheilun aiheuttamat vaikeat selkäydinvammat
Suomessa vuosina 1979–1998. Onko meillä syytä huoleen? Suomen
Lääkärilehti, 56, 17-19.
Vanlandewijck, Y. C. Spaepen, A. J. & Lysens R. J. 1994. Wheelchair Propulsion
Efficiency: Movement Pattern Adaptations to Speed Changes. Medicine
and Science in Sports and Exercise, 26 (11), 1373-1381.

51
Veeger, H. E. J. van der Woude, L. H. V. & Rozendal, R. H. 1989. Wheelchair
Propulsion Technique at Different Speeds. Scandinavian Journal of
Rehabilitation & Medicine, 21,197-203.
Veeger, H. E. J. van der Woude, L. H. V. & Rozendal, R. H. 1991. Within-cycle
Characteristics of the Wheeelchair Push in Sprinting on a Wheelchair
Ergometer. Medicine Science in Sports and Exercise, 23, 264-271.
Wang, Y. T. Deutsch, H. Morse, M. Hedrick, B. & Milikan, T. 1995.
Three-Dimensional Kinematics of Wheelchair Propulsion across Racing
Speeds. Adapted Physical Activity Quarterly, 12, 78-79.
Wang, Y. T. & Beale, D. 1996. An Electronic Device to Measure Drive and Recovery
Phases during Wheelchair Propulsion: A Technical Note. Journal of
Rehabilitation & Development, 33 (3), 305-310.
van der Woude, L. H. V., Veeger, H. E. J., Rozendal, R. H., van Ingen Schenau, G. J.,
Rooth, F. &van Nierop, P. 1988. Wheelchair racing: Effects of Rim
Diameter and Speed on Physiology and Technique. Medicine and Science
in Sports and Exercise, 20 (5), 492-500.
van der Woude, L. H. V., Veeger, H. E. J. & Dallmeijer, A. J. Manual Wheelchair
Propulsion. In: Zatsiorsky V. M. (Ed.) 2000. Biomechanics in Sport,
Performance enhancement and injury prevention, Blackwell Science,
USA, 609-635.

52
APPENDIX
Appendix 1: Information for the participant and agreement

/KIHU 2 Research Institute for Olympic Sports/KIHU 2004
52
APPENDIX
Appendix 1: Information for the participant and agreement
The Kinematic Differences between Racing Wheelchair Propulsion in 100 m (T54) in start INFORMATION FOR THE PARTICIPANT AND AGREEMENT It is required in researches which are done with people, to let each participant know the risks and benefits of the research. Prior to the experiment, each participant has to be voluntarily involved in that experiment. Athletes´ Personal and Wheelchair Data: Name:________________________________________________________________
Gender:_________________________________________
Date of Birth:_____________________________________
Weight: _______kg Height: ________cm
Disability:________________________________________
Level of Spinal Cord Damage:________________________
Years in Wheelchair:_______________________________
Wheelchair Model:_________________________________
Diameter of Pushrim:_______________________________
Diameter of Wheel:________________________________
Achievements:____________________________________________________________
________________________________________________________________________
________________________________________________________________________
________________________________________________________________________
Years of Racing:_____________________________________
Practises per week (hours/week):__________________________
Use of Gloves when Racing:__________________________
Other:___________________________________________________________________
________________________________________________________________________
continues

/KIHU 2 Research Institute for Olympic Sports/KIHU 2004
53
continues 1. The contact information
Katariina Järveläinen
Department of Biology of Physical Activity
(University of Jyväskylä)
Finnish Paralympic Committee
Radiokatu 20, 00240 Helsinki, Finland
Phone: 050–569 1836 E-mail: [email protected]
Jani Talkkari, M.Sc.
Research Institute for Olympic Sports/KIHU
Rautpohjankatu 6, 40700 Jyväskylä, Finland
Phone: 014–260 3186
E-mail: [email protected]
Riku Valleala, M.Sc.
Research Institute for Olympic Sports/KIHU
Rautpohjankatu 6, 40700 Jyväskylä, Finland
Phone: 014 – 260 3144
Email: [email protected]
Jukka Viitasalo, Ph.D.
Research Institute for Olympic Sports/KIHU
Rautpohjankatu 6, 40700 Jyväskylä, Finland
Phone: 014 – 260 3173
Email: [email protected]
2. The background Information
The experiment is done in co-operation with KIHU-Research Institute for Olympic Sports, Department of Biology of Physical Activity (University of Jyväskylä), Kuortane Training Center and Finnish Paralympic Committee.
3. The goal and purpose of the experiment The experiment focuses on racing wheelchair propulsion in sprint start. The goal is to find differences in the kinematic features and therefore try to find an optimal start for wheelchair racing. Researchers also film wheelchair propulsion so that the athlete can have a interactive feedback from his own performance. The analysis of the mechanical features of wheelchair propulsion will provide useful information to enhance the development of propulsion and with the same time improve the athletes performance. 4. Methods This pilot research studies wheelchair propulsion by biomechanical methods. Each participant will take few maximum wheelchair racing starts, few start on 80 % and the rest start on 60 %. Between the starts there are few minutes to recover. The kinematic data will be collected using two high-speed cameras in line. There are acceleration sensor fastened to the wheelchair. Radar measures the speed of the wheelchair. Reflective markers will be placed on ten anatomical positions of the participant’s or wheelchair’s other side: wheelchair hub and push rim, back of the ear, top of the head, shoulder (lig. A-C), elbow (epicondylus lateralis), wrist (processus styloideus ulnae), hand (third metacarpal), hip (spina iliaca anterior superior) and knee (patella´s proximal point). continues

/KIHU 2 Research Institute for Olympic Sports/KIHU 2004
54
continues 5. The risks and disadvantages There are minor risks and disadvantages in this experiment. It can be a little physically stressing but no more than normal racing wheelchair practises. The risk can be some kind of minor locomotor injury. There is no physician at the place but the physician can be contacted immediately by phone. 6. How the results are used The experiment is done in co-operation with KIHU-Research Institute for Olympic Sports, Department of Biology of Physical Activity (University of Jyväskylä), Kuortane Training Center and Finnish Paralympic Committee. The researcher will use the data to make a master thesis of this experiment. Also the summary of results is done for each participant and their coaches. In addition the results might be used in the national and international research articles. 7. Participant´s Rights All the results are dealt with confidentiality and the names won’t be published. If you have any questions about this experiment feel free to ask researchers about the methods, risks, advantages etc. Participation in this experiment is entirely voluntary and participants can interrupt the experiment when ever he/she feels like it. 8. Agreement I have read this paper and understood the purpose of this experiment. I also have understood that there are minor risks. I will be a volunteer in this experiment. I have rights to interrupt this test when ever I want. I also give the full rights for the researchers to use my results in their work. I am healthy and have no locomotor disease or injury, and I have not had fever in the past two weeks. The researcher and I have a copy of this agreement. Kuortane 23.6.2004 _________________________________
Participant Kuortane 23.6.2004 ________________________________ Researcher