kinondoni municipal council secondary education department. · 2017-05-17 · kinondoni municipal...
TRANSCRIPT

P a g e 1 | 16
KINONDONI MUNICIPAL COUNCIL
SECONDARY EDUCATION DEPARTMENT.
2.0. SECONDARY EDUCATION PROFILE.
Kinondoni Municipal Council has 22 Public Secondary Schools and 57 Non –
Government Secondary Schools. Enrolment in public Secondary Schools for 2017 is
19,630 students 9,574 are boys and 10,056 are girls. For private Schools owned the
enrolment for 2017is15,077 Students in which Boys are 7502 and Girls are 7575 they are
permanent Students for Secondary Schools.
Table 1: Education facilities in the Municipality 2016/17.
S/N GOVT NON GOVT TOTAL
1 Pre- primary schools 77 67 144
2 Primary Schools 77 63 140
3 Secondary Schools 22 57 79
4 Post Primary Schools 0 0 0
5. FDCs 0 1 1
6. VETA 0 5 5
7. Higher Learning
institutions / Colleges 1 5 6
Table 2: Government Secondary schools and Students population.
s/na
SCHOOL NAME FORM 1 FORM 2 FORM 3 FORM 4 GRAND TOTAL
M F M F M F M F M F TOTAL
1 BOKO 129 77 145 166 104 85 107 101 485 429 914
2 BUNJU A 189 176 131 135 97 96 103 136 520 543 1,063
3 HANANASIFU 162 153 163 175 64 66 78 85 467 479 946
4 KAMBANGWA 216 217 178 146 128 113 137 132 659 608 1,267

P a g e 2 | 16
5
KAWE
UKWAMANI 78 82 123 148 119 127 91 117
411 474 885
6 KIGOGO 145 146 132 129 97 120 89 101 463 496 959
7 KISAUKE 79 82 64 42 40 64 60 60 243 248 491
8 KONDO 106 166 119 137 114 134 73 99 412 536 948
9 MABWE 127 156 114 108 56 60 47 59 344 383 727
10 MAENDELEO 96 126 40 41 82 52 50 51 268 270 538
11
MAKONGO
JUU 170 212 124 122 114 104 59 103
467 541 1,008
12 MAKUMBUSHO 243 245 169 175 152 154 137 157 701 731 1,432
13 MBOPO 113 98 27 21 31 45 18 40 189 204 393
14 MBWENI 83 87 49 57 16 30 35 37 183 211 394
15 MBWENI TETA 56 64 50 71 66 83 51 60 223 278 501
16 MIKOCHENI 140 125 167 131 89 84 0 0 396 340 736
17
MTAKUJA
BEACH 171 161 154 164 120 133 143 169
588 627 1,215
18 NJECHELE 84 73 33 32 43 33 35 54 195 192 387
19 OYSTERBAY 221 189 148 148 116 114 96 126 581 577 1,158
20
SALMA
KIKWETE 216 213 158 159 125 155 110 128
609 655 1,264
21 TURIANI 220 229 197 215 186 166 114 202 717 812 1,529
22 TWIGA 114 77 128 152 110 109 101 84 453 422 875
TOTAL 3158 3154 2613 2674 2069 2127 1734 2101 9,574 10,056 19,630
Table 3: Private Secondary schools and Students population.
N
O
SCHOOL
NAME
FORM 1 FORM II FORM III FORM IV FORM V FORM VI GRAND TOTAL
M F M F M F M F M F M F M F TOTAL
1 ACADEMIC
INTERNATIO
NAL
23
25
29 36 36 31 30 28 17 17 21 18
156
155
311
2 ACTAS
16
17
21 17 21 14 23 20
81
68
149
3 ATLAS
84
65
42 48 28 23
154
136
290
4 AFRICANA
5
5
4 9 11 4 12 11
32
29
61
5 ALPHA
41
26
46 30 50 38 73 43 194 107 151 103
555
347
902
6 BAHARI
BEACH
15
23
6 7 7 5 11 12 7 0 9 6
55
53
108
7 CANOSSA
106
104 82 95 142 102
-
631
631
8 CORNELIUS
GIRLS
-
26
20 15
-
61
61
9 DAR PRIME
3
4
10 13 11 9 10 9 0
34
35
69
10 DAR-ES-
INDEPENDET
30
16
18 17 26 20 15 21 15 12 13 12
117
98
215

P a g e 3 | 16
11 DAR-ES-
SALAAM
BAPTIST
24
36
22 57 39 58 31 53
116
204
320
12 DESTINY
29
22
19 19 26 39 25 41
99
121
220
13 DYNAMIC
10
15
3 6 7 16 5 10
25
47
72
14 FAITH
5
7
11 11 10 13 11 11
37
42
79
15 FANAKA
MEMORIAL
17
15
20 33 15 27 24 25
76
100
176
16 FEZA BOYS
84
81 73 68 96 86
488
-
488
17 FEZA GIRLS
73
74 56 46 77 67
-
393
393
18 FEDHA
INTERNATIO
NAL
38
21
23 7 23 15 31 16 32 21 11 12
158
92
250
19 QIBRATAIN
SEMINARY
18
11
20 6 27 4
65
21
86
20 GHOMME
11
26
5 24 2 24 0 26 0 2
18
102
120
21 GOOD
SAMARITAN
19
10
20 12 23 14 20 13
82
49
131
22 GREEN
ACRES
27
53
35 43 30 32 81 81
173
209
382
23 HEAVEN OF
PEACE
13
11
12 13 13 26 12 10 11 24 15 20
76
104
180
24 HOPE AND
JOY
39
53
48 57 30 51 18 13
135
174
309
25 INTERNATIO
NAL
SCHOOL OF
TANGANYIK
A
44 36 37 35 26 32 28 35 37 44 35 29
207
211
418
26 JOHN THE
BAPTIST
39 49 36 53
-
177
177
27 JORDAN 7 7 20 17 19 17 35 38
81
79
160
28 KENTON
HIGH SHOOL
10 13 12 32 23 16 33 42
78
103
181
29 KINONDONI
MUSLIM
6 5 13 25 10 12 19 26 13 1 20 5
81
74
155
30 KUNDUCHI
GIRLS
93 78 110 89 27 28
-
425
425
31 LAUREATE
INTERNATIO
NAL
7 6 4 5 11 7 19 10 16 8 11 17
68
53
121
32 LAUREATE
BUNJU
5 1 17 4 2 4 5 2 0 5
29
16
45
33 LIBERMAN 132 137 130 124
523
-
523
34 LYCEUM 4 1 3 5 2 4 18 12
27
22
49
35 MAKONGO 152 126 236 138 214 112 134 140 184 81 141 46
1,0
61
643
1,704
36 MASJID
QUBAH
0 0 0 0 0 0 7 15 16 3 17 8
40
26
66

P a g e 4 | 16
37 MBEZI
BEACH
87 61 146 138 79 41 69 42 59 24 130 46
570
352
922
38 MIVUMONI
ISLAMIC
105 165 69 70 40 65 36 36
250
336
586
39 MSASANI
ISLAMIC
16 22 11 13 13 14 11 16
51
65
116
40 MWAMBAO 14 20 13 19 13 17 14 18
54
74
128
41 NUR
ISLAMIC
12 16 21 24 20 31 16 15
69
86
155
42 NEW ERA 12 4 12 19 16 14 31 19
71
56
127
43 ONE STOP 8 11 22 8 8 4 6 2
44
25
69
44 PATRICK
MISSION
40 37 35 36 44 42 16 11 18 7 12 11
165
144
309
45 RIDHWAA
ISLAMIC
14 25 24 47 32 43 39 53 35 34 42 10
186
212
398
46 SHAMSIYE
BOYS
61 48 42 41 20
212
-
212
47 SHREE
HINDU
MANDAL
18 17 25 16 17 15 19 15
79
63
142
48 SIERRA 7 16 8 9 3 5 13 10
31
40
71
49 ST.GASPER
DEL BUFALO
9 10 10 15 16 12 24 28
59
65
124
50 ST.MARYS 40 41 34 44 44 63 42 63
160
211
371
51 STAMARIA
SALOME
13 12 8 33 14 26 25 26
60
97
157
52 TEGETA 0 0 - - - - - - - - 25 11
25
11
36
53 UNUNIO SEM 0 0 21 44 0 0 0 0
21
44
65
54 WAZO HILL 42 34 40 25 64 32 40 27 9 7
195
125
320
55 WHITE LAKE 25 23 59 30 74 65 20 18 17 15 14 9
209
160
369
56 GREEN
LIGHT
51 78 44 64
-
237
237
57 ZUHURA
ISLAMIC
6 10 19 18 12 8 27 36
64
72
136
TOTAL
1,447
1,568
1599
1737
1496
1507
1411
1545
796
658
753
560
7,50
2
7,575
15,077
Table 4: Number of Government Secondary School Pupils by form.
FORM MALE FEMALE TOTAL
I 3158 3154 6,312
II 2613 2474 5,287
III 2069 2127 4,196

P a g e 5 | 16
IV 1734 2101 3,835
TOTAL 9574 9856 19,630
Table 5: Number of Private Secondary School Pupils by form.
FORM MALE FEMALE TOTAL
I 1447 1568 3015
II 1599 1737 3336
III 1496 1507 3003
IV 1411 1545 2956
V 796 658 1454
VI 753 560 1313
TOTAL 7,502 7575 15077
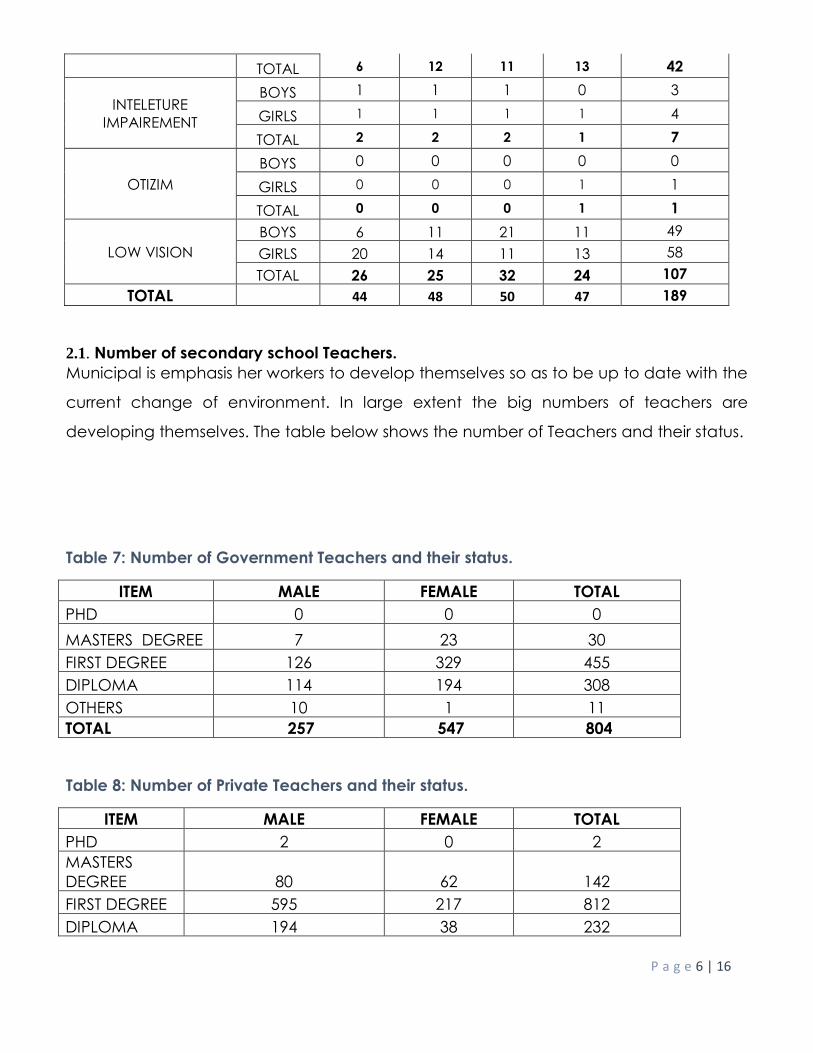
Table 6: Number of pupils with disabilities for Government Schools.
KIND OF IMPAIRMENT SEX FORM I FORM II FORM III FORM IV TOTAL
BLIND
BOYS 0 0 0 0 0
GIRLS 0 0 0 0 0
TOTAL 0 0 0 0 0
DEAF AND DUMB
BOYS 5 3 1 3 12
GIRLS 4 4 4 4 16
TOTAL 9 7 5 7 28
DEAF AND BLIND
BOYS 0 2 0 0 2
GIRLS 0 0 0 1 1
TOTAL 0 2 0 1 3
ALBINO
BOYS 0 0 0 0 0
GIRLS 1 0 0 0 1
TOTAL 1 0 0 0 1
PHYSICAL
IMPAIREMENT
BOYS 2 7 8 7 24
GIRLS 4 5 3 6 18
P a g e 6 | 16
TOTAL 6 12 11 13 42
INTELETURE
IMPAIREMENT
BOYS 1 1 1 0 3
GIRLS 1 1 1 1 4
TOTAL 2 2 2 1 7
OTIZIM
BOYS 0 0 0 0 0
GIRLS 0 0 0 1 1
TOTAL 0 0 0 1 1
LOW VISION
BOYS 6 11 21 11 49
GIRLS 20 14 11 13 58
TOTAL 26 25 32 24 107
TOTAL
44 48 50 47 189
2.1. Number of secondary school Teachers.
Municipal is emphasis her workers to develop themselves so as to be up to date with the
current change of environment. In large extent the big numbers of teachers are
developing themselves. The table below shows the number of Teachers and their status.
Table 7: Number of Government Teachers and their status.
ITEM MALE FEMALE TOTAL
PHD 0 0 0
MASTERS DEGREE 7 23 30
FIRST DEGREE 126 329 455
DIPLOMA 114 194 308
OTHERS 10 1 11
TOTAL 257 547 804
Table 8: Number of Private Teachers and their status.
ITEM MALE FEMALE TOTAL
PHD 2 0 2
MASTERS
DEGREE 80 62 142
FIRST DEGREE 595 217 812
DIPLOMA 194 38 232
P a g e 7 | 16
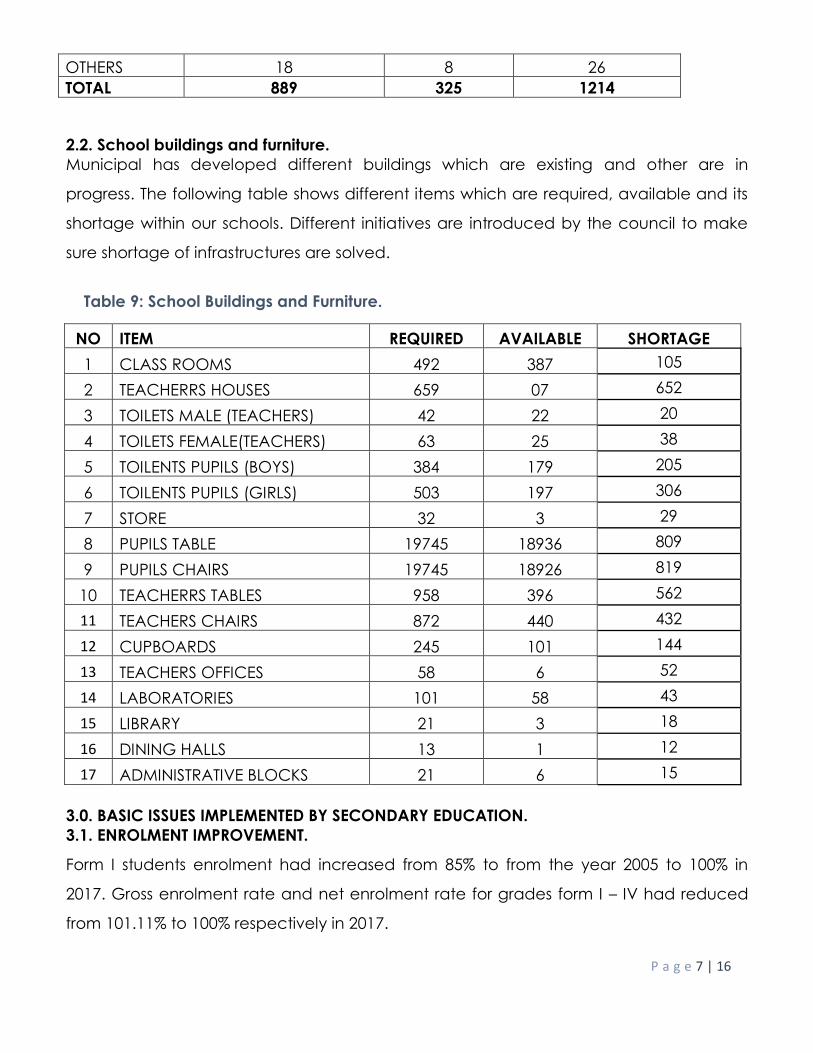
OTHERS 18 8 26
TOTAL 889 325 1214
2.2. School buildings and furniture.
Municipal has developed different buildings which are existing and other are in
progress. The following table shows different items which are required, available and its
shortage within our schools. Different initiatives are introduced by the council to make
sure shortage of infrastructures are solved.
Table 9: School Buildings and Furniture.
NO ITEM REQUIRED AVAILABLE SHORTAGE
1 CLASS ROOMS 492 387 105
2 TEACHERRS HOUSES 659 07 652
3 TOILETS MALE (TEACHERS) 42 22 20
4 TOILETS FEMALE(TEACHERS) 63 25 38
5 TOILENTS PUPILS (BOYS) 384 179 205
6 TOILENTS PUPILS (GIRLS) 503 197 306
7 STORE 32 3 29
8 PUPILS TABLE 19745 18936 809
9 PUPILS CHAIRS 19745 18926 819
10 TEACHERRS TABLES 958 396 562
11 TEACHERS CHAIRS 872 440 432
12 CUPBOARDS 245 101 144
13 TEACHERS OFFICES 58 6 52
14 LABORATORIES 101 58 43
15 LIBRARY 21 3 18
16 DINING HALLS 13 1 12
17 ADMINISTRATIVE BLOCKS 21 6 15
3.0. BASIC ISSUES IMPLEMENTED BY SECONDARY EDUCATION.
3.1. ENROLMENT IMPROVEMENT.
Form I students enrolment had increased from 85% to from the year 2005 to 100% in
2017. Gross enrolment rate and net enrolment rate for grades form I – IV had reduced
from 101.11% to 100% respectively in 2017.
P a g e 8 | 16
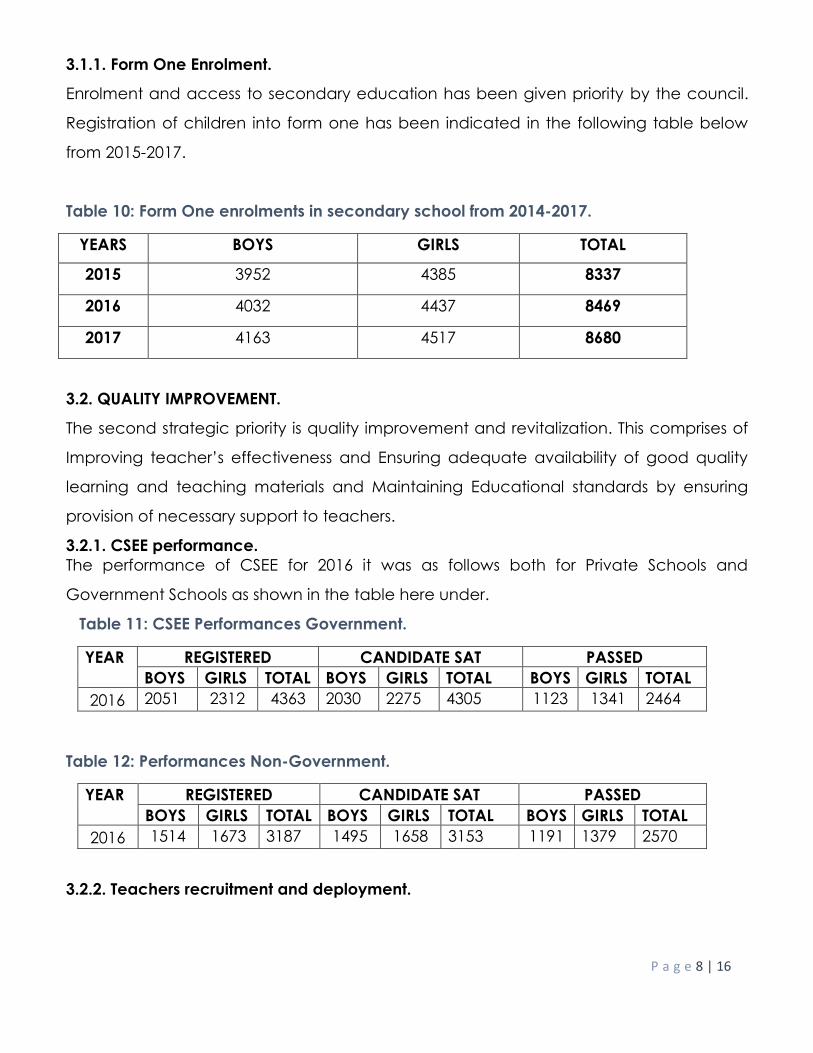
3.1.1. Form One Enrolment.
Enrolment and access to secondary education has been given priority by the council.
Registration of children into form one has been indicated in the following table below
from 2015-2017.
Table 10: Form One enrolments in secondary school from 2014-2017.
YEARS BOYS GIRLS TOTAL
2015 3952 4385 8337
2016 4032 4437 8469
2017 4163 4517 8680
3.2. QUALITY IMPROVEMENT.
The second strategic priority is quality improvement and revitalization. This comprises of
Improving teacher’s effectiveness and Ensuring adequate availability of good quality
learning and teaching materials and Maintaining Educational standards by ensuring
provision of necessary support to teachers.
3.2.1. CSEE performance.
The performance of CSEE for 2016 it was as follows both for Private Schools and
Government Schools as shown in the table here under.
Table 11: CSEE Performances Government.
YEAR REGISTERED CANDIDATE SAT PASSED
BOYS GIRLS TOTAL BOYS GIRLS TOTAL BOYS GIRLS TOTAL
2016 2051 2312 4363 2030 2275 4305 1123 1341 2464
Table 12: Performances Non-Government.
YEAR REGISTERED CANDIDATE SAT PASSED
BOYS GIRLS TOTAL BOYS GIRLS TOTAL BOYS GIRLS TOTAL
2016 1514 1673 3187 1495 1658 3153 1191 1379 2570
3.2.2. Teachers recruitment and deployment.

P a g e 9 | 16
Deliberate attempts have been made to address the problem of shortage of teachers
in the schools by recruiting more teachers and redeploying them, in order to bring
balance among schools.
3.2.3. Recruitment.
Efforts have been made to ensure that teachers are recruited as allocated by the
center. Teachers recruited in 2014-2017 were as follows.
Table 13: Recruitment of the teachers from 2014-2017.
s/na year Number of teachers recruited
1 2014 44
2 2015 27
3 2017 15
3.2.4. Recruitment and Deployment.
Recruitment and deployment has been done currently for 2017 for Diploma teachers
and degree teachers as the table shown here.
Table 14: recruitment of teachers’- 2017
S/N QUALIFICATION MALE FEMALE TOTAL
1 Degree 1 2 03
2 Diploma 9 3 12
GRAND TOTAL 10 5 15
3.2.5. Deployment.
There was deployment of secondary school teachers in this quarter which was as
follows,

P a g e 10 | 16
Table 15: Deployment of teachers to secondary schools from Jan-March,2017.
ITEM SEX
Male Female TOTAL
IN 1 9 10
OUT 3 2 05
TOTAL 4 11 15
3.2.6. Teaching and learning materials.
a. Availability of teaching and learning materials.
Text books are still inadequate despite efforts made by the Government and council to
address the problem. However the availability of books and other teaching and
learning materials is now improving. The current book pupils’ ratio is 1:2 up to 1:8.
Availability of learning materials has improved compare to past two years back. The
table number 17 shows the ratio of books per each subject.
Table 16: Availability of teaching learning Resources.
S/N SUBJECT NO OF BOOKS
AVAILABLE
NUMBER OF PUPILS RATIO
1 MATHEMATICS 15185 19,630 1:2
2 ENGLISH 11907 19,630 1:2
3 KISWAHILI 4523 19,630 1:4
4 BIOLOGY 12738 19,630 1:2
5 CHEMISRTY 10516 13,703 1:2
6 PHYSICS 10383 13,703 1:2
7 HISTORY 9415 19,630 1:2
8 CIVICS 2239 19,630 1:8
9 GEOGRAPHY 9017 19,630 1:2
b. Availability of teaching learning Resources.
Thefollowing table shows number of teachers in each subject and its ratio to students.
Table 17: Teacher Pupils ratio. SUBJECT NUMBER OF
TEACHERS NUMBER OF
PUPILS RATIO
MATHEMATICS 55 19,630 1:357
ENGLISH 138 19,630 1:142
KISWAHILI 119 19,630 1:165
BIOLOGY 61 19,630 1:322

P a g e 11 | 16
CHEMISRTY 48 13,703 1:285
PHYSICS 34 13,703 1:403
HISTORY 121 19,630 1:162
CIVICS 76 19,630 1:258
GEOGRAPHY 109 19,630 1:180
B/KEEPING 17 2345 1:138
COMMERCE 18 2345 1:130
Table 18: Classroom pupils Ratio.
S/N FORMS NUMBER OF
CLASSROOM
NUMBER OF
PUPILS
RATIO
I - IV 366 19,630 1:53
3.3. CAPACITY BUILDING.
3.3.1. Capitation Grants.
Through Implementation of free education by the Government to Primary and
Secondary schools from January 2015, the council have received the total amount of
tsh596,021,000.00 between Jan to March,2017. This have Motivate the enrollment of
students to school as well as decrease truancy to students.
3.3.2. Human Resource.
In order to mend the performance of the teachers the council allow them to have
further schooling so that they can advance their carrier. Therefore by 2016/17 the
following teachers have got the chances for development studies.
Table 19: Number of teachers or developmental studies table number 2016/2017.
S/N LEVEL OF STUDIES MALE FEMALE TOTAL
1. PHD 1 0 1
2. MASTERS 1 3 4
3. DEGREE 17 22 39
4. DIPLOMA 0 0 0
GRAND TOTAL 19 25 44

P a g e 12 | 16
There are six Colleges for the teachers training in the Municipal Council, which are
privately owned, called Open University,Kisanga Tc, Safina Tc, Kinondoni TC, Ununio Tc
and Mount Sinai Colleges. The Council is taking part in facilitating some students in
undertaking basic teachers training, from other teachers colleges. The council has
specific programs on teacher’s training, providing some funds for colleges fees every
year.
3.5. INSTITUTIONAL ARRANGEMENTS.
The Council is responsible for ensuring that every stakeholder in the delivery of
Secondary Education from Municipal Council to grassroots level is aware of the roles
and responsibilities. In carrying out this task Council involved itself in the raising of
awareness to the community through various intervention implemented in the Municipal
council.
3.5.1. SCHOOL BOARDIES.
These are key aspects in the perfection of our schools and in general development of
basic education of school level. Their main responsibility is to plan, implement and
supervise their development plans and fully participate in the overall management of
schools. Previously as an aforementioned, the council had activities aimed at raising the
capacity of school committees, which helped in making them more informed of their
roles.
3.5.2. WARD LEVEL
At ward level, the community leaders and officials (WEOs and WECs) have the
responsibility of ensuring that communities in their respective wards participative wards
participate fully in the development of education including registration of school age
children. The WECs play an essential role in coordination and supervision of education
activities.
3.6. CROSS – CUTTING ISSUES.
3.6.1. HIV/AIDS Situation.

P a g e 13 | 16
Despite efforts to improve Education in terms of quality and quantity, these efforts were
jeopardized by HIV/AIDS epidemic. Kinondoni Municipal council has also been
affected by HIV/AIDS cases and deaths. Factors contributing to this include:
commercial agriculture (tea plantation)
Alcoholism.
Inheritance of widows.
Prostitution.
Drug Abuse.
Rapping.
Unsafe sexual practices.
HIV/AIDS issues have also affected the Education sector in that teachers, students and
parents are dying because of HIV/AIDS. However, there were several initiatives made by
NGOs and CBOs in supporting HIV/AIDS activities and support of orphan children.
3.6.2. Efforts made against HIV/AIDS.
Several initiatives were made by the Municipal Council to deal with the HIV/AIDS
problem. The following are among measures which are being undertaken;-
To educate the community on HIV/AIDS through community meetings.
Twelve youth groups in the Municipal Council were oriented on HIV/AIDS
prevention.
Creation of awareness to the public on counseling and testing – VCT.
Identification of orphaned children is still going on with the aim of introducing
special programmers for orphanage. Some initiatives have been carried out. E.g.
support for schooling by the council, Government and NGOs.
3.6.3. Gender.
Gender perspectives in all walks of life are among other things that need to be
emphasized in the community and by the community at large. The Council is aware
of this and measures are taken to reduce gender imbalance in service provision and in
development issues. Among measures which are being taken in the education sector
include:-
P a g e 14 | 16
I. Creation of gender awareness in schools and communities through meeting and
courses to reduce gender blindness.
II. Promoting gender balance in the registration of students into form I and total
Enrolment i.e. 4163 are boys and 4517 are girls and the total of 8680 were registered
into form I in 2017.
III. Efforts are being made to create awareness on the importance of girls’
education.
IV. Measures are being taken in schools to promote girls academic achievements by
Encouraging girls to study hard and advising parents to reduce domestic chores
to girls, and encouraging their school attendance. These measures will help to
raise girls pass rate, which currently is increasing.
3.6.4. Corruption.
Corruption is another cross – cutting issue, which is important if the successful
implementation of our goals and overall provision of social service including education
is to be achieved. The Council particularly the education department is involved in
taking necessary measures to combat corruption in general and in the education
sector, measures taken to combat corruption are as follows:
a. Provision of education and training on good governance, constitution and
various laws to the public in order to make them aware of their basic rights.
b. The District Commissioner and municipal Director have provided education on
ways of combating corruption to the community in all 20 wards through meetings.
c. Prevention of corruption Bureau office (PCB) has been opened at the district
headquarters (DCS Office) and the public has been educated to use it.
d. Public meetings have been conducted and secret votes were made to identify
suspects of corruption. For those identified, information was sent to their
respective employing authorities for further investigation and action.
3.6.5. Environment.
Environment Among steps taken include sensitization of the community and to instruct
schools to plant more trees in order to protect land from degradation and hence

P a g e 15 | 16
conserve the environment. Cleanliness of waste products, environment and school
building are among other steps that are taken.
3.6.6. Construction.
The council have made construction of 03 new secondary school in order to reduce
the overcrowded of classroom and simplify supervision and management of schools.
These new schools are Mzimuni, Mbezijuu and Mivumoni.Also there are new construction
of 40 classrooms to 09 secondary schools which are still in progress
4.0. CONSTRAITS.
Despite the achievements so far attained in the implementation of Secondary
education, there were several constraints that had affected its successful. The
constraints are as follow:-
a. The current arts books pupil ratio have the average of 1:4 stills a problem. More
funds are needed to address this problem.
b. There is a shortage of science and commercial subjects’ teachers in the
municipal council, which has been contributed by increasing in enrolment of
students.
c. There are inadequate funds for in – service training hence very few teachers
accesses the training opportunities.
d. The problem of classrooms still exist in many schools therefore lead to overcrowd
of students in classes.
e. Insuffient student toilets which affect the school hygiene for both teachers and
student
5.0. RECOMMENDATIONS:
The council recommendations are based on the constraints aforementioned in this
issues, thus:
I. Funds, especially for constructions from general general government should be
disbursed earlier preferably in the first quarter. This will enable implementation of
activities to start earlier and be completed within the respective financial year.
II. Textbooks especially for arts subjects are still inadequate. The national ratio 1:1 still
far – fetched if budget allocation for this purpose is not increased. Hence budget
P a g e 16 | 16
for procurement of textbook should be increased two fold in order to accelerate
adequate availability of learning and teaching materials.
III. Adequate funds and opportunities for in – service training should be made
available in order to facilitate upgrading of teachers, academically and
professionally. This will consecutively promote higher pupils academic
achievements.
IV. Special HIV/AIDS intervention should be developed and targeted to teachers and
students in order to combat the deadly HIV/AIDS epidemic, which is jeopardizing
efforts to improve education in the council.
6.0. CONCLUSION.
Kinondoni Municipal Council through its education department and in collaboration
with various partners has taken deliberate measures to strengthen her efforts in the
provision of better service particularly in education. The achievements attained are an
indication of what the council has managed to do for the previous years. It is therefore
the hope of the council that the achievements registered so far will be sustained and
improved to ensure that goals set by council are attained for the betterment of the
people of Kinondoni and nation at large.