kj 2022 spectroscopic methods in organic …folk.ntnu.no/audunfor/6....
TRANSCRIPT
KJ 2022Spectroscopic Methods in Organic Chemistry
Laboratory exerciseReport
Audun F. [email protected]
Silje [email protected]
Alexander [email protected]
NTNUOctober 16, 2014

Contents
1 Introduction 3
2 Theory 42.1 UV/VIS spctroscopy . . . . . . . . . . . . . . . . . . . . . . . . . . 42.2 IR spectroscopy . . . . . . . . . . . . . . . . . . . . . . . . . . . . . 62.3 Mass Spectroscopy . . . . . . . . . . . . . . . . . . . . . . . . . . . 72.4 NMR spectroscopy . . . . . . . . . . . . . . . . . . . . . . . . . . . 9
3 Results 113.1 UV/VIS . . . . . . . . . . . . . . . . . . . . . . . . . . . . . . . . . 113.2 IR . . . . . . . . . . . . . . . . . . . . . . . . . . . . . . . . . . . . 113.3 MS . . . . . . . . . . . . . . . . . . . . . . . . . . . . . . . . . . . . 113.4 NMR . . . . . . . . . . . . . . . . . . . . . . . . . . . . . . . . . . . 13
4 Experimental 154.1 UV/VIS . . . . . . . . . . . . . . . . . . . . . . . . . . . . . . . . . 154.2 IR . . . . . . . . . . . . . . . . . . . . . . . . . . . . . . . . . . . . 154.3 NMR . . . . . . . . . . . . . . . . . . . . . . . . . . . . . . . . . . . 154.4 MS . . . . . . . . . . . . . . . . . . . . . . . . . . . . . . . . . . . . 15
5 Discussion 16
6 Conclusion 18
A UV/VIS spectrum II
B MS spectrum III
C IR spectrum V
D Collection of NMR spectrums VI
2

1 Introduction
This report is part of the compulsory laboratory exercise in the subject KJ 2022Spectroscopic methods in organic chemistry at NTNU in the spring of 2013. Theaim of this exercise is to elucidate the structure of an unknown compound. Thisis to be done using four spectroscopic methods: UV, IR, MS and NMR. The ex-periments will be carried out on the equipment mentioned, and the structure ofthe compound puzzled together piece by piece.
From the experimental spectroscopy data, the unknown compound assigned toGroup 2 was found to be mandelic acid. UV and IR didn’t give any big clues, butfrom MS it was clear that mandelic acid was the only possible compound. Both1H NMR and 13C NMR later confirmed that mandelic acid was the right decision.
3

2 Theory
2.1 UV/VIS spctroscopy
UV-VIS spectroscopy is based on a compound’s absorption of certain electromag-netic wavelengths in the visible spectrum as well as in the UV region of the elec-tromagnetic spectrum. The reason for this absorption of energy is that electronsin π systems as well as non-bonding electrons may be exited to orbitals of higherenergy. The normal excitation pattern is from a bonding π orbital (or non-bondingp orbital) to the anti-bonding π∗ og σ∗.
The bigger the gap between the HOMO and LUMO orbital, the shorter the wave-lengths have to be for the light to excite the electrons. This means that if shortwavelengths are required, the chemical bonds need a lot of energy to get excited.The energy of electromagnetic radiation ∆E depends on the wavelength λ.
∆E = h · ν = h · 1
λ(2.1)
where ν is the frequency and h is the Planck constant. The energy can be absorbedas electronic, vibrational or rotational energy, which are the energies making upthe total energy of a molecule.
UV-VIS spectroscopy is particularly useful for compounds containing conjugatedchromophores, such as dienes, aromatic rings and enones. However, for moleculesnot containing such systems, UV-VIS spectroscopy is useless and gives no infor-mation at all.
The UV-VIS instrument works by sending electromagnetic radiation of differentwavelengths through a cuvette containing the sample solution. The intensities ofthe radiation that makes it through is measured, and compared to a beam that hasbeen sent through a reference cuvette. The way to do this in the instrument is usu-ally solved in either of two ways. If the instrument is a double beam instrument,it has one lamp producing one beam, which is then split in two by a half mirror.The two beams are then sent through the sample and reference respectively. A
4
single beam instrument can not split the beam, and have to analyze the sampleand the reference separately.
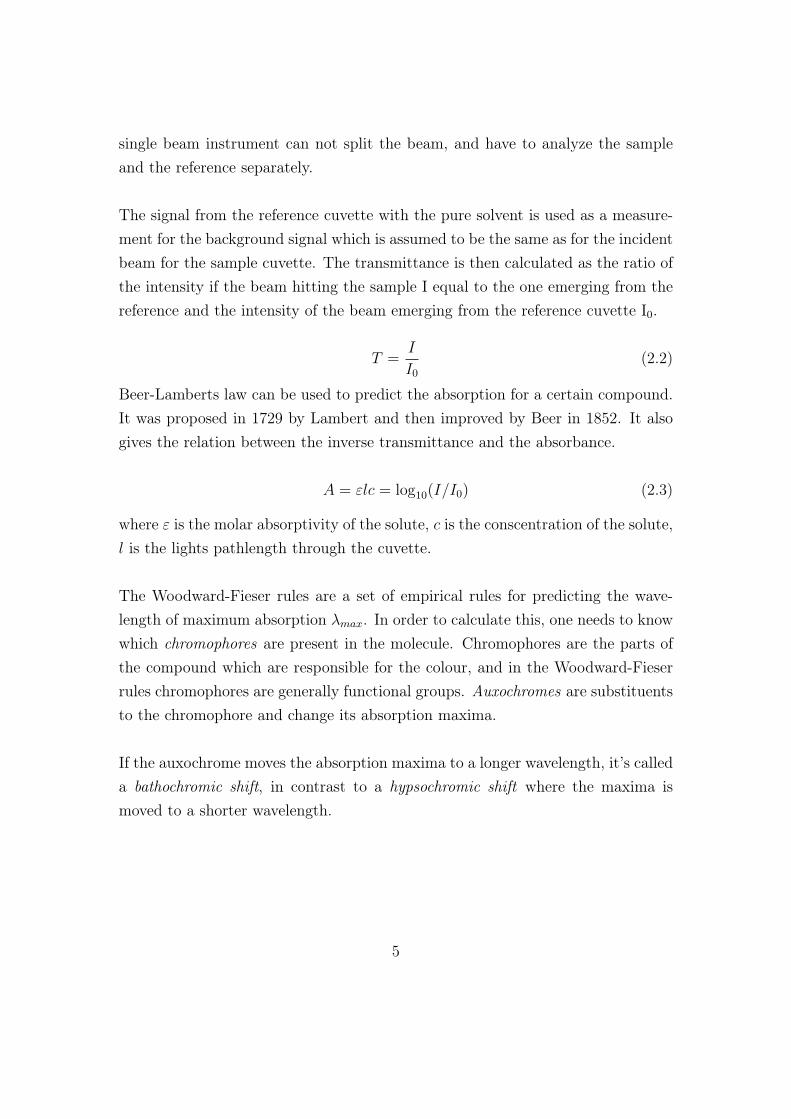
The signal from the reference cuvette with the pure solvent is used as a measure-ment for the background signal which is assumed to be the same as for the incidentbeam for the sample cuvette. The transmittance is then calculated as the ratio ofthe intensity if the beam hitting the sample I equal to the one emerging from thereference and the intensity of the beam emerging from the reference cuvette I0.
T =I
I0(2.2)
Beer-Lamberts law can be used to predict the absorption for a certain compound.It was proposed in 1729 by Lambert and then improved by Beer in 1852. It alsogives the relation between the inverse transmittance and the absorbance.
A = εlc = log10(I/I0) (2.3)
where ε is the molar absorptivity of the solute, c is the conscentration of the solute,l is the lights pathlength through the cuvette.
The Woodward-Fieser rules are a set of empirical rules for predicting the wave-length of maximum absorption λmax. In order to calculate this, one needs to knowwhich chromophores are present in the molecule. Chromophores are the parts ofthe compound which are responsible for the colour, and in the Woodward-Fieserrules chromophores are generally functional groups. Auxochromes are substituentsto the chromophore and change its absorption maxima.
If the auxochrome moves the absorption maxima to a longer wavelength, it’s calleda bathochromic shift, in contrast to a hypsochromic shift where the maxima ismoved to a shorter wavelength.
5

2.2 IR spectroscopy
Infrared (IR) radiation refers to that part of the electromagnetic spectrum betweenthe visible light and the microwave regions. Organic compounds will absorbeand convert infrared radiation between 10 000-100 cm−1 into energy of molecularvibration, but the most interesting region is between 4000-400 cm−1. The wholemolecule can vibrate or just some of the individual bonds or functional groupswithin the molecule. There are two types of molecular vibration: stretching andbending. It is only the vibrations that result in a change in the dipole momentthat can be observed in the IR spectra. It is possible with both asymmetrical andsymmetrical vibration. Since symmetrical vibrations doesn’t result in a change ofdipole moment, they are inactive in IR spectroscopy.
2.2.1 Fourier transform infrared spectroscopy
Fourier transform infrared (FTIR) spectroscopy is a technique used to obtain aninfrared spectrum. A beam of light containing the whole range of IR frequenciesis passed through the sample, and measure how much of the beam is absorbedby the sample. A second beam, which has travelled a longer path length, iscombined with the first beam and an interferogram is produced. A computeruses Fourier transformation to convert this interferogram into a plot of absorptionagainst frequency.
2.2.2 Sample preparation
Infrared spectra may be obtained for liquids, solids and gases. Liquids can eitherbe examined neat or in solutions. If it is examined neat, a few drops of the liquidis placed between two sodium chloride plates and the spectrum can be recorded.Both liquids and solids can be dissolved in a solvent. The solution is placed inan IR solution cell which consists of two rectangular sodium chloride plates. IRspectra for solids can also be recorded in the form of a KBr disk. The sample ismixed with potassium bromide and is exposed for a very high pressure with theuse of a hydraulic press. This high pressure causes potassium bromide to becomefluid and the result is a KBr disk containing the solid sample. Potassium bromide
6

is transparent throughout the IR range and therefore doesn’t interfere with thespectra.
2.3 Mass Spectroscopy
The concept of mass spectrometry is that a compound is ionized and the ions areseparated based on their mass/charge ratio, and the number of ions representingeach mass/charge unit is plotted as a spectrum. The spectrum will consist of x-axis with mass/ratio and intensity of the mass/ratio units at the y-axis.
The mass spectrometry instrument consist of sample introduction, ionization method,mass analyzer/ion separation method and detector. Some instruments have directinsertion of the sample into the ionization chamber.
There are different types of ion sources, one example is electron impact ioniza-tion. In the electron impact ionization method the mass spectrometer bombardsmolecules in vapour phase with a high-energy electron beam. This result in theejection of an electron from the sample molecule to produce a radical cation,molecular ion. Molecular ion, M+, then represents the intact molecule with oneless electron which is removed by the electron beam. The smaller ions are frag-ments of the molecular ion. The molecular ion is fragmented because of excessenergy recieved from the bombarding electron. Covalent bonds in the molecularion breaks in “predictable” patterns and is useful in the identification of an un-known compound.
The detector consist of collimating slits that direct only one set of ions at a timeinto a collector where they are detected and amplified by an electron multiplier.The signals are saved and plotted.
The fragmentation pattern and the molecular ions are helpful in the identificationof an unknown compound. From the molecular ion you find the molecular massof the compound. From the different fragments it is possible to find the differentunits the compound consist of and how the compound is constructed. The most
7

intense peak in the spectra is called the base peak (100%) and the other fragmentsare measured in percentage to this base peak. Often the base peak is the molecularion, this is however only when there are no fragments that are more stable than themolecular ion. The molecular ion is usually the peak with the highest m/z value.The probability that a given bond will be cleaved is related to the strength of thebond, to the possibilty of low energy transition, and to the stability of the formedfragments. There are some general signal and fragment patterns listed below:
• For straight-chained compounds the relative height of M+ is greatest, andthe height decreases with the degree of branching in the molecule.
• With an increasing molecular weight in a homologous series, the relativeheight of M+ decreases accordingly.
• Cleavage is favored at the alkyl-substituted carbon. The more substituted,the more likely is a cleavage. Generally the largest substituent is removedfirst, then the subsituent leaves as a radical.
• The double bonds, cyclic structures and aromatic systems stabilize the molec-ular ion.
• Allylic cleavage is favored for double bonds, because the allylic carbocationis resonance-stabilized.
• Saturated rings generally lose their alkyl side chains at the α position.
• In alkyl substituted aromatic compounds there is often a cleavage at thebond β to the ring, since this gives a resonance-stabilized ion.
• The carbon-carbon bond next to a heteroatom is easily cleaved. The chargeis then left on the fragment containing the heteroatom.
• Elimination of small, neutral molecules often result in cleavage. Example ofsuch small neutral molecules are carbon monoxide or water.
8

A computer calculate the molecular formula for the analyzed compound. Fromthe calculated molecular formula the index of hydrogen deficiency (IHD) can befound using Equation (2.4) relating it the the chemical formula CnHmXXNyOz.The hydrogen deficency index is the number of hydrogen molecules missing fromthe linear saturated version of the compound. From the hydrogen deficency onetherefore find if and how many multiple bonds and rings the compound contain.
IHD = n− m
2− x
2+y
2+ 1 (2.4)
2.4 NMR spectroscopy
Nuclear magnetic resonance (NMR) is an absorption spectrometry. A sample canabsorb electromagnetic radiation in the radio frequency region when it is in amagnetic field. A plot of the frequencies of the absorption peaks against peak in-tensities is a NMR spectra, and it provides more information about the molecularstructure than any other spectroscopic method.
All nuclei carry a charge, and if this charge spins on the nuclear axis a magneticdipole will be generated. Nuclear angular momentum is related to quantum spinnumber I. These numbers can have values of 0, 1/2, 1, 3/2 and so on. All isotopesthat contain an odd number of protons and/or neutrons, such as hydrogen, nitrogenand carbon-13, will have half-integer spin quantum number and will be NMRactive. It is the atomic nuclei that absorbs the electromagnetic radiation. Thisresults in change in the angular momentum. After some time the atomic nuclei willrelax back to ground state of angular momentum while emitting electromagneticradiation. This radiation is measured and plotted in the NMR spectra.
2.4.1 Chemical shift
Protons in a molecule is shielded by its electron cloud to a very small extent.The intensities of the shielding varies with the chemical environment that leadsto differences in chemical shift positions. The degree of shielding depends on thedensity of the circulating electrons and the inductive effect of other groups attachedto the carbon molecule. The difference in the absorption position of a proton from
9

the absorption position of a reference proton is called the chemical shift of theproton.
2.4.2 Spin coupling
Spin coupling is a phenomenon caused by coupling of proton spins through theintervening bonding electrons. This spin coupling results in multiplets in the NMRspectra. The number of peaks in a multiplet is n+1, where n is the number ofhydrogen atoms at the neighbouring carbon atoms. Spin coupling is typical for 1HNMR.
2.4.3 NMR spectra
There are different types of NMR spectra, for example 1H NMR, 13C NMR, HSQC,HMBC and COSY. They can be further divided in to one dimensional and twodimensional spectra. The one dimensional 1H NMR spectra illustrate what typeof chemical environment the different hydrogen atoms have in the compound. 13CNMR is similar to 1H NMR except that in 13C NMR the spin coupling is notexpressed. The two dimensional spectra is otained by preforming sevral one di-mensional analysis and plotting them together. COSY stands for Correlation spec-troscopy. In COSY spectra coupling between hydrogen atoms in the compound isdisplayed. HSQC stands for Heteronuclear single quantum coherence. In HSQCNMR the coupling between carbon atoms and hydrogen atoms displayed. HMBCstands for Heteronuclear multiple bond correlation. In HMBC spectra coupling be-tween carbon atoms and hydrogen atoms two to four carbons away from the givencarbon. COSY, HSQC and HMBC are all two dimensional methods/analysis.
10

3 Results
3.1 UV/VIS
The UV/VIS-spectroscopy analysis revealed a very weak absorption for the un-known compound, and the λmax was observed at 354 nm. The absorption spectrumis attached as Appendix A.
3.2 IR
The diamond tip FTIR spectroscopy experiment gave an absorption spectrumattached as Appendix C. The spectrum gave the following absorption for theunknown compound. IR (diamond tip, cm−1): 3437.14 (O-H stretch), 2894.48(νas (CH) stretch), 1710.02 (C=0 stretch), 1490.55 (C-C stretch), 1450.73 (C-C stretch), 1241.33 (C-O stretch, COOH), 1190.45 (C-C stretch), 1095.47 (C-Ostretch, sec. alc.), 1060.45 (C-C aromatic stretch).
3.3 MS
The MS spectrum is attached as Appendix B. The spectrum clearly shows themolecular ion peak at 152.1 m/z. And from high resolution MS the molecular ionpeak was determined to have a mass over charge ratio of exactly 152.0470. Whichleaves two potential formulas: C8H8O3 (152.0468) and CH8ON6S (152.0475).
The most important peaks in the MS spectrum are explained in Table 3.1, andthe important fragments are shown in Figure 3.1 and Figure 3.2.
11
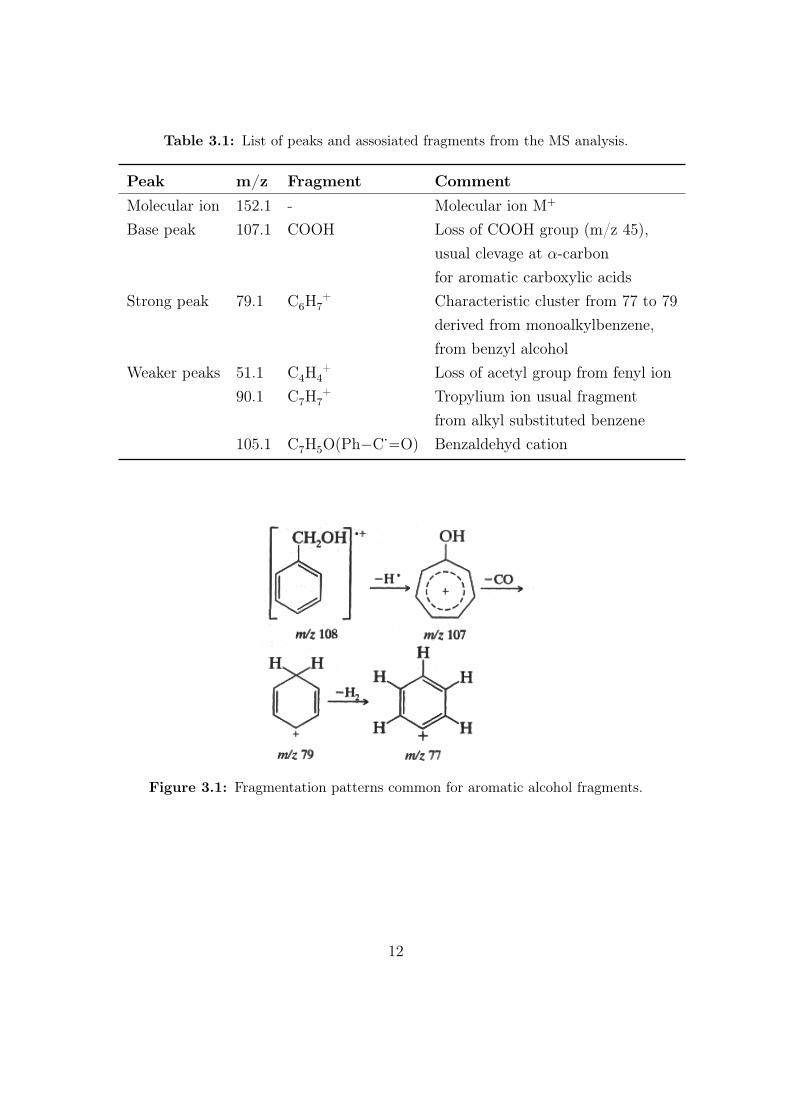
Table 3.1: List of peaks and assosiated fragments from the MS analysis.
Peak m/z Fragment CommentMolecular ion 152.1 - Molecular ion M+
Base peak 107.1 COOH Loss of COOH group (m/z 45),usual clevage at α-carbonfor aromatic carboxylic acids
Strong peak 79.1 C6H7+ Characteristic cluster from 77 to 79
derived from monoalkylbenzene,from benzyl alcohol
Weaker peaks 51.1 C4H4+ Loss of acetyl group from fenyl ion
90.1 C7H7+ Tropylium ion usual fragment
from alkyl substituted benzene105.1 C7H5O(Ph−C·−−O) Benzaldehyd cation
Figure 3.1: Fragmentation patterns common for aromatic alcohol fragments.
12

Figure 3.2: Fragment responsible for the 105.1 m/z signal in the MS spectrum.
From the molecular formula, one can find the hydrogren defficiency index of thecompound with Equation (2.4). For the unknown compound the calculation willbe:
IHD = 8 − 8
2− 0
2+
0
2+ 1
This means that in order to fully saturate the molecule, one would have to add 5molecules of H2.
3.4 NMR
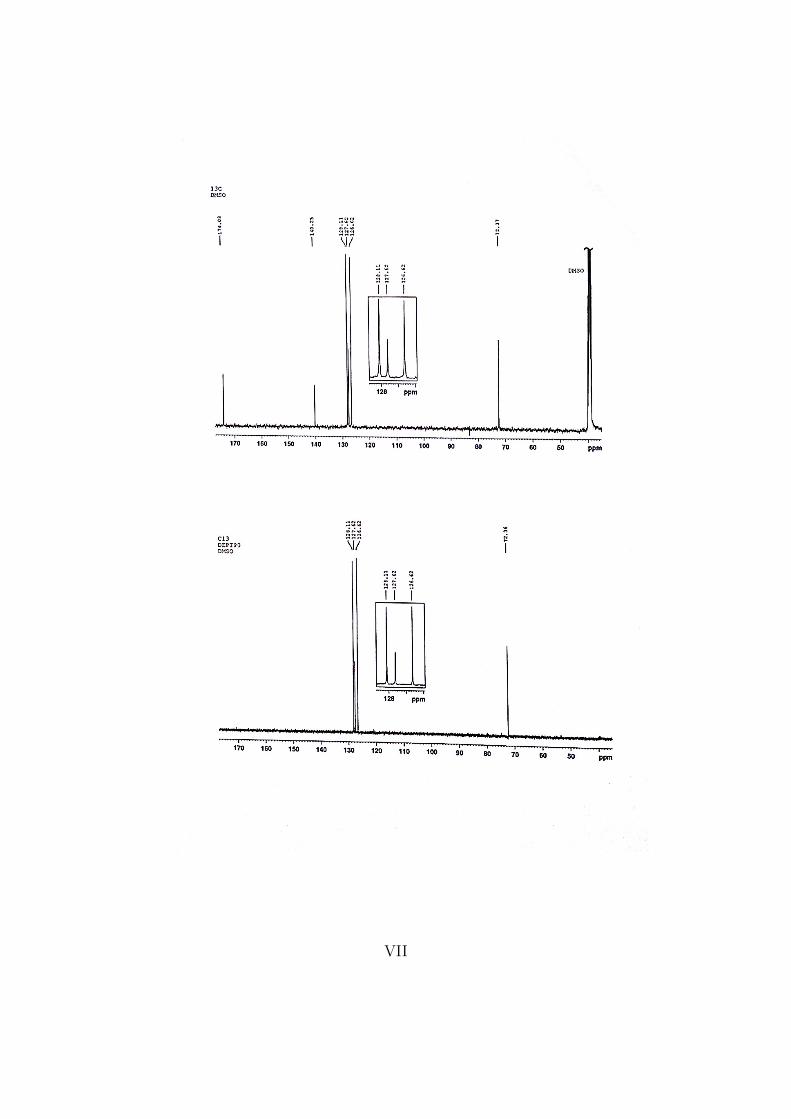
The various NMR spectrums are attached as Appendix D. It is clear from the 13CNMR spectrum that the compound has eight carbon atoms, the ortho and metacarbons being equivalent and showing higher intensities.
The integrals from the 1H NMR spectrum indicated that there are a ratio of 5 to1 of aromatic hydrogens to aliphatic hydrogens.
The following shifts were found from the 1H NMR and the 13C NMR spectrums.1H NMR (400 MHz, DMSO-d6) δ: 7.44 - 7.39 (m, 2H, CH), 7.38 - 7.31 (m,2H, CH), 7.31 - 7.25 (m, 1H, CH), 5.02 (s, 1H, C-H).13C NMR (400 MHz, DMSO-d6) δ: 174.08 (1H, COOH), 140.25 (1H, C),128.11 (2H, CH), 127.62 (1H, CH) , 126.62 (2H, CH), 72.37 (1H, CH).
Table 3.2 shows the correlations found using HSQC, while Table 3.3 shows the cor-relations found using HMBC. The COSY spectrum gave little information becauseof extensive coupling between almost all the protons.
13

Table 3.2: Correlations found using HSQC found from 1H NMR and 13C NMR spec-trums run at 400 MHz in DMSO-d6
δ1H [ppm] δ13C [ppm]5.02 72.37
7.44 - 7.39 126.627.31 - 7.25 127.627.38 - 7.31 128.11
- 140.25- 174.08
Table 3.3: Correlations found using HMBC found from 1H NMR and 13C NMR spec-trums run at 400 MHz in DMSO-d6
δ1H [ppm] δ13C [ppm]7.44 - 7.39 72.37
127.627.38 - 7.31 128.11
140.257.31 - 7.25 126.62
14

4 Experimental
4.1 UV/VIS
2.5 mg of the unknown compound was dissolved in methanol and transferred to avolumetric flask. The solution was then diluted to 10 ml. 1 ml of the first solutionwas transferred to another 10 ml volumetric flask and diluted to 10 ml. Thiswas done once again, so that three different dilutions of the compound had beenprepared. After analysis, another two samples were prepared, with even strongerconcentrations. The strongest of these concentrations (9.7 mg / 10 ml) gave barelyvisible UV absorption.
4.2 IR
A spatula tip of compound was transferred to the diamond tip FTIR instrument.The diamond tip was lowered until it was touching the compound. The IR spec-trum was obtained using a 32 smart scan setting.
4.3 NMR
The compound was dissolved in deuturated DMSO, transferred to an NMR tube,placed in a spinner and then loaded into the NMR instrument. The full charac-terization of the compound was performed, giving 1H NMR, 13C NMR, HSQC,HMBC, COSY, DEPT 95, DEPT 135 spectrums. During a meeting in the NMRlab the NMR spectras were handed over from the supervisor for the NMR lab.
4.4 MS
The MS spectrum was handed over from the superviser for the MS lab. TheMS-spectrum was obtained with Thermo Quest MAT95X double focusing highresolution instrument using electron impact ionization (EI) at 70eV.
15

5 Discussion
The low absorbance of the unknown compound was a bit unexpected, seeing thatit has an aromatic ring. The π-system of the conjugated ring should be quitevisible in UV/VIS spectroscopy, and the recorded λmax is higher than expectedfrom our compound. The low absorbance might come from the UV/VIS machinepossibly being broken on the day of the experiment. The most important infor-mation gathered from the UV/VIS spectrum is that the compound shows signs ofabsorbance. This indicates that there are some conjugated electrons present.
From the IR spectrum there are a few more pieces of information to notice. Theprimary being that there is a sharp absorbance peak around 1710 cm−1. This is avery clear indication of a carbonyl group with the C=O stretching vibration. Alsothe absorbance at 2894 cm−1 might indicate a methine C-H stretching vibration,as well as the 3437 which might be an indication of an O-H stretching vibration.In the fingerprint region between 1500 and 500 cm−1 the IR spectrum shows a lotof absorption which is in correspondence with aromatic C-H stretching vibrations.
From the high resolution MS spectrum the molecular ion peak gave the molecularmass of the unknown compound, 152.0470, which corresponds well with C8H8O3
(152.0468) and CH8ON6S (152.0475), where only the first is a real molecule. Thebase peak of [M-45] is characteristic for aromatic carboxylic acids, by cleavage atthe α-carbon, and loss of a COOH group. The 107.1 m/z peak comes from benzylalcohol, which follows the fragmentation pattern shown in Figure 3.1. This ex-plains the strong peaks at 79.1 m/z and 77 m/z as well.
The 105.1 m/z peak likely comes from loss of H2 from the benzyl alcohol. The 90.1m/z peak is usually strong in all alkyl substituted benzyl compounds, and is alsoclearly visible in our spectrum. The peaks in the MS spectrum is in accordancewith already reported peaks for mandelic acid, as well as the spectrum [2]. Noneof the other possible structures with the same molecular formula coincide with theMS-spectrum
16

The unknown compound consist of eight carbon atoms, this can be seen in the 13CNMR spectrum. In the spectrum there are six peaks, were two of them have verystrong intensities, indicating that there are two equivalent carbons for each peak,so eight carbon atoms in total.
A ratio of 5 to 1 of aromatic hydrogen to aliphatic hydrogen is found from the 1HNMR spectrum. In the 1H NMR the total integral of hydrogen atoms is 5 in thearomatic part of the spectrum and 1 in the aliphatic part of the spectrum. Thisindicates a ring with substitution in the ratio 5:1 hydrogen atoms. From the MS itis clear that there are 8 hydrogen atoms in the compound, the proton NMR onlyshows 6. Therefore one can conclude that there are two hydrogens bound throughheteroatons, in this case oxygen atoms.
The correlations between hydrogen and hydrogen atoms, and hydrogen and carbonatoms in the HSQC and HMBC spectra fits with the obtained structure.
17
6 Conclusion
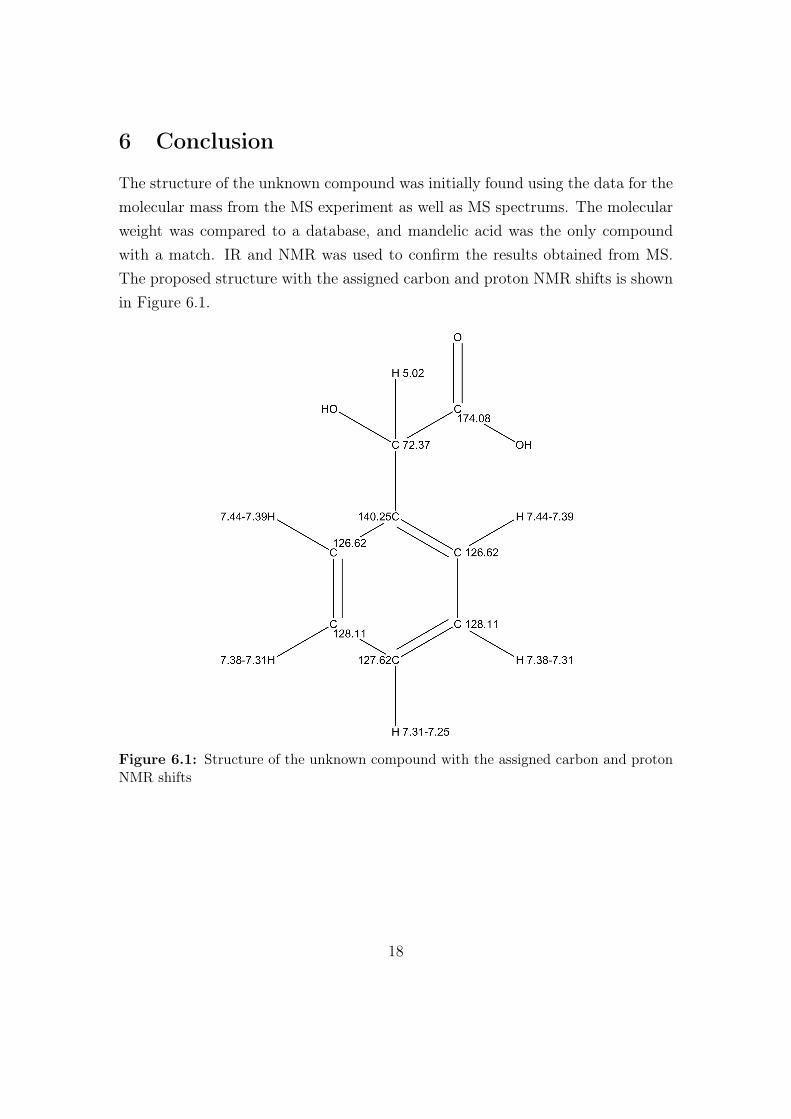
The structure of the unknown compound was initially found using the data for themolecular mass from the MS experiment as well as MS spectrums. The molecularweight was compared to a database, and mandelic acid was the only compoundwith a match. IR and NMR was used to confirm the results obtained from MS.The proposed structure with the assigned carbon and proton NMR shifts is shownin Figure 6.1.
Figure 6.1: Structure of the unknown compound with the assigned carbon and protonNMR shifts
18

Trondheim, October 16, 2014
References
[1] Silverstein, R., Webster, F. & Kiemle, D. Spectrometric Identification of Or-ganic Compounds, 7th ed., John Wiley & Sons Inc., 2005, Hoboken, USA.
[2] SDBSWeb : http://sdbs.riodb.aist.go.jp, National Institute of Advanced Indus-trial Science and Technology, 02.05.2013, CAS nr: 90-64-2.
I

A UV/VIS spectrum
II

B MS spectrum
III

IV

C IR spectrum
V

D Collection of NMR spectrums
VI
VII

VIII

IX

X

XI