k&s republic of hunger - ideas€¦ · the republic of hunger by utsa patnaik ... of various...
TRANSCRIPT
THE REPUBLIC OF HUNGER
by UTSA PATNAIK
Public Lecture on the occasion of the 50th Birthday of Safdar Hashmi, organized by SAHMAT (Safdar Hashmi Memorial Trust) on April 10, 2004, New Delhi.

Introduction In the course of the last five years (1998 to 2003), the population of the Republic of India has been sliding down towards sharply lowered levels of per capita foodgrains absorption, levels so low in particular years that they have not been seen for the last half century. Between the early 1990s when economic reforms began, and at present, taking three-year averages, the annual absorption of foodgrains per head has come down from 177 kg to 155 kg Such low absorption levels were last seen in the initial years of World War 11 - from where they had fallen further still. Again, after some recovery, the very first few years after Independence half a century ago and the food crisis of the mid-1960s, are comparable to present average absorption levels.
Over four-fifths of the total fall, has taken place in the last five years alone, from 174 kg in the three years ending in 1998 to 155 kg taking the average of the two pre-drought years. This steep and unprecedented fall in foodgrains absorption in the last five years has entailed a sharp increase in the numbers of people in hunger, particularly in rural areas, and for very many it has meant starvation. The average downward movement in turn is the outcome of divergent trends – foodgrains absorption is rising fast for the (mainly urban) well-to-do, and is either the same or falling faster than the average for the bulk of the (mainly rural) population.
This phenomenon of increasing numbers in hunger can be established both on the basis of the hardest and most reliable data (on output, trade and stocks) that we have from official data sources, as well as from the ground-level experience of individual researchers and of organizations working in rural areas. The phenomenon is completely independent of the recent drought, and indeed the lowest levels of foodgrains absorption to date, has been registered two years before the severe drought of 2002-03. The perception of the government and of the majority of academics, is however very different from that expressed above: they interpret the development as nothing out of the ordinary and many indeed even see it as a positive development, indicating a voluntarily chosen, more diversified basket of consumption by all segments of the population including the poor. When as a ground reality, the incidence of hunger rises, a ‘denial mode’ amongst those who govern and also amongst those who are associated with making or influencing policy during the period concerned, is common and is to be expected. But in the present case the divergence between the reality of increasing hunger, and the prevalent bland justifications of the phenomenon as a positive one, is so stark and so striking, that this divergence itself perhaps requires a theoretical explanation. Never before in the independent history of our country have we seen the kind of wholesale denial of a negative trend, and of its packaging and presentation as a positive development, as we are seeing at present. Moreover, the packaging and the justifications are not being put forward only by the right –wing political class which through its policy measures, is responsible for the present debacle. That the present government and ruling class in this country should seek to sanitize and justify the deeply anti-humanist and negative trend of increasing hunger, is to be expected. What is disturbing is that a large number of hitherto liberal academics are also advancing these justifications on the basis of various theories which are, needless to say, quite fallacious.
The International context of the discussion Before going on to the details of the story in India, let us situate this story within the broader context of the past international approaches to hunger and famine. For this I will take up two cases – the alleged massive famine in China during the Great Leap, 1958-61, and the internationally unrecognized famine in Russia in the first half of the 1990s. When we look at these cases it becomes clear enough that the entire field of the discussion of hunger and famine is a highly ideological one, and has been routinely characterized by the abandoning of the minimum academic criteria with respect to evidence and estimation. First, let us consider the allegation that 27 to 30 million people died in China during the ‘Great Leap’ period. This allegation is contained in the books of two US demographers Ansley J Coale (1984), and Judith Banister (1987). Few in the developing world however would have bothered to read the discussion of these demographers, couched in technical language. The main popularizer and ardently uncritical supporter of the conclusions of these US demographers, has been Amartya K. Sen and it is through Sen’s writings first in the New York Review of Books and subsequently in his many lectures and books including Development as Freedom (1999) that the world, and the reading public in this country has been informed that “China has had what is almost certainly the largest recorded famine in history (when thirty million people died in the famine that followed the Great Leap Forward) in 1958-61) whereas India has not had a famine since independence in 1947 ” (Sen, 1999, 43). The figure of 30 million has passed into popular folklore. However, a study of how it has been arrived at shows that this estimate has no scholarly basis whatsoever. The facts are that there was a run of three bad harvests and a steep 30% drop in foodgrains output took place in China in 1960, while the government’s procurement from the villages did not decline, lowering availability per head. The official death rate, which had been falling up to 1958 owing to public health and sanitation measures, registered a rise to 25.4 per thousand in 1960. (This peak ‘famine’ death rate in China was however little different from India’s actual, ‘normal’ death rate, 24.6, in the same year). The birth rate also fell steeply in 1958, mainly owing to labour mobilisation for collective work.
Two alternative routes have been used to estimate ‘famine deaths’, both of very dubious validity. In the first, the ‘missing millions’ totalling 27 millions in the population pyramid during 1958 to 1961, have been identified with ‘famine deaths’. The problem with this is that not only the people who were actually living and who died in excess of normal numbers are included in the missing millions, but so are all those hypothetical persons included, who were never born at all and who ‘should’ have been born if the birth rate had not fallen. This is not a common-sense definition nor is it a logical definition of famine deaths: for, to ‘die’ in a famine, a minimum necessary condition is to be born in the first place. The Chinese are a highly talented people but even they cannot achieve the feat of dying without being born. If a person is told that 30 million people died, then quite correctly she would infer that those 30 million were alive and then died. The fact that 19 million of them never existed because they were never born in the first place, is not conveyed by the formulation. Hence, there is disingenuousness involved in saying that 30 million people ‘died’: it is an untrue proposition.

The second route, followed by the demographers Coale and Banister, is perhaps even more dubious. They take the population totals yielded by the official 1953 and 1964 Censuses in China to be correct, but dispute the official fertility rate even though it was based on a very large sample of 30 million persons or 5% of the then population, especially canvassed along with the 1953 Census as Nai- Ruenn Chen (1966) had informed us. Instead, they use the much later, Census 1982 study to project back very high fertility rates to the past, thus constructing an entirely hypothetical larger total of births between 1953 and 1964.
If more people were born over the inter-censal period 1953 to 1964, correspondingly these extra people must also have died over the same period: for both authors despite rejecting every official vital rate, display a touching faith in the absolute Census population totals at these two dates. Hence the official increase in population is kept unchanged, enabling them to assume exactly as many extra deaths as they assume extra births. With this procedure the official figure of total deaths over the inter-censal period, was raised by a heroic 60 percent. Both authors then arbitrarily allocated the assumed higher numbers of deaths over the individual inter-censal years, by assuming varying rates by which deaths were allegedly ‘under-reported’ during each of these years. In short it was entirely up to the demographer how many extra deaths he or she assigned to the Great Leap years, and the totally arbitrary nature of the procedure can be gauged by the fact that Coale raised the 1960 death rate to nearly 39 while Banister raised it to 44.6 (compared to the official death rate of 25.4). There is no reasonable basis for either figure.
Nor is this all: a linear time trend was then fitted by both, to deaths derived from a variable - the death rate – which always behaves non-linearly, and the extent to which the (arbitrarily constructed) death rate was above this declining trend, was then used to derive total ‘excess deaths’, the figure being 27 million for Coale and 30 million for Banister. We know that deaths in a population can never reach zero, so fitting linear trends makes no sense. The linear trend procedure implies that the Chinese population would have reached zero deaths and attained immortality in a few years – a remarkable achievement indeed, an impossible achievement outside the nonsensical statistical procedures followed by the US demographers. It is a travesty of the norms of academic integrity, that grossly exaggerated estimates of ‘famine’ deaths derived in this arbitrary manner have been uncritically quoted and promoted and that they enjoy so much currency. In my detailed critique (Patnaik 2002) I have also shown the inconsistency of the peak death rates constructed by Coale and Banister, with the foodgrains output and availability figures in China. My calculations also show that the lowest possible availability figures we can get for China after taking into account government procurement, is still higher than in India, and it is a puzzle why, given a much more egalitarian distribution, the death rate should have risen even to the officially declared level. Because the internal political developments in China after 1978 were in the direction of attacking Maoist egalitarianism and the commune system, no repudiation from Chinese sources of the US estimates are to be seen. In sharp contrast to the retrospective, patently ideological construction of hypothetical large famine deaths in China’s Great Leap period and the publicizing of these figures, we find that the demographic collapse in Russia in the first half of the 1990s has been met with a deafening silence from the same academics. The estimation

methods which they applied to China are not applied by them to Russia. The facts are that so-called ‘shock therapy’ to usher in capitalism, under the advice of Western experts, led to a catastrophic collapse of GDP in the former socialist states between 1990 and 1996. As Table 1 summarizing United Nations data shows, the GDP level was half or less in Russia and Ukraine by 1996 compared to a decade earlier and collapsed to only one-fifth of the mid-eighties level in Georgia, which was the worst affected. Never in peacetime have we ever seen such a comprehensive destruction of productive capacities and outputs, entirely owing to the wrong macro-economic policies advised by foreign experts and followed by the local policy makers. The human effects have been devastating, with a sharp reversal of the decades of improvement in all human development indicators. The death rate among the able-bodied rose from nearly 49 to 58 (per thousand) comparing 1992 with 1990, and rose further to 84 per thousand by 1994.1 The male expectation of life declined by nearly 6 years in Russia. With the steep rise in the death rate, the total population of Russia showed absolute decline – again, an unprecedented situation in peacetime. Where were those academics who profess to be concerned with hunger and famine, when it came to analyzing the economic and demographic collapse in Russia? It can hardly be argued that journalists and the media had no access to the country after 1990. I have said earlier that it is not reasonable to count the effects of the decline in the birth rate if any, to estimate ‘famine deaths’. If we apply a reasonable method of simply taking the 1990 death rate in Russia as the bench mark and calculate the cumulated extra deaths among the able-bodied by 1996 owing to the observed rise in the death rate, we get a figure of more than 4 million excess deaths in Russia alone. Expressed in relation to Russia’s population, this famine was three times larger than the great Bengal famine in India in 1943-44 and twice as large as the Chinese excess mortality –accepting the official figures – during the Great Leap years. The Russian famine is neither internationally recognized nor publicized, for the very good reason that Russia was making a transition to capitalism and it is this process which gave rise to the famine. Those who are eager to try to discredit socialism even at the cost of indefensible statistical procedures, appear to be less than willing to recognize the existence of famine or estimate famine deaths in a ‘transitional’ society like Russia even though the case is a contemporary one and is well documented.
1 These death rates were presented in a paper on poverty in Russia, by Prof. P. Gregory, at an international workshop on country studies in poverty held at UNDP, New York on September 20, 1997 and attended by the author.

Table 1: Drop in real GDP and male life expectancy in the countries of the former Soviet Union, 1985–1995
Country Real GDP in 1995, percentage below real GDP level in 1985
Change in male life expectancy, no. of years
Armenia –62 –1.1
Belarus –39 –2.9
Georgia –82 —
Kazakhstan –55 —
Kyrgyzstan –50 –3.2
Russian Federation –45 –5.9
Tajikstan –60 –1.0
Turkmenistan –40 –0.2
Ukraine –54 –2.4
Uzbekistan –17 0.0
Source: UNDP Poverty Report 1998 New York 1998; and UNDP Poverty Report New York 2000.
The Significance of the decline in India’s Food Absorption in the light of Historical Trends We have not yet reached in India, the nadir of average foodgrains absorption seen in Sub-Saharan Africa under economic reforms and trade liberalization, where from 158 kg per head in 1980 there has been a decline to below 136 kg by the mid-1990s, and the masses are perpetually on the verge of being pushed over into famine whenever there is drought. The six most populous countries of Sub-Saharan Africa, accounting for 60% of the entire region’s population, have seen declining calorie intake per diem, because declining food aid is not compensating for lowered domestic food production.
A large segment of the rural masses in India with a much lower foodgrains absorption than the average, have been already reduced to the nutritional status of Sub-Saharan Africa, On the basis of the NSS data on calorie intake for 1999-2000, I estimate that about 40 % of the rural population was at the low absorption level of the SSA average. It is not for any lack of effort by the Indian Government that the situation is not worse. If the present incorrect policies of official denial of the widening ambit of hunger, failure to undertake expansionary development policies, and the official promotion of export oriented corporate agriculture continue to be followed, it may well be only a matter of another five years or so before we see the descent of the whole of rural India to the present average SSA nutritional status.
It is hardly possible to imagine amore drastic reversal of the goal of food security than has been seen in the last five years. The fifty years of a dying colonial rule before Independence had seen a decline of annual foodgrains availability per head by a quarter, from 199 kg to 148.5 kg, considering five-year averages and leaving aside the individual post-war year which was even lower (see Table 2). The War years included the terrible Bengal famine with a mortality of at least 3 million. I have elsewhere argued (Patnaik 1999) that although the proximate cause of the famine was the inflationary burden of

financing the war which was unjustly placed on India, the actual toll in the Bengal famine would not have been so large, without the preceding three decades of declining nutrition in Bengal which had seen a much larger than average drop in per capita foodgrains availability, by nearly 40% between 1911 and 1947.
Many who had seen the Bengal famine before their eyes, and in particular P. Mahalanobis, had an important role in formulating post-Independence policy: the goal of attaining food security at least in the limited sense of foodgrains self-sufficiency was given priority, and we saw a rise, albeit a painfully slow one, in the foodgrains availability per head from 152 kg during 1950-55 to 177 kg by 1989-91 (see Tables 3 and 4). While the new agricultural strategy and green revolution no doubt had many drawbacks as regards equity of distribution, the average rise in per head output and availability was a major achievement which should not be under-rated.
Forty years of effort have been lost in the last decade of neo-liberal economic reforms, with over four-fifths of the loss taking place in the last five years alone. The most remarkable and disastrous feature of the last five years of NDA rule in India, has been the slide-back to the low level of 151 kg per head food absorption in rural areas by 2001, a level not seen for fifty years. Reports of starvation, farmer suicides and deepening hunger, should cause little surprise when we consider the recent trends in the official data on foodgrains output and availability. If we exclude the abnormal drought year 2002-03 and consider the average output of the preceding two years, we find that net foodgrains output per capita has fallen by about 5.5 kg compared to the early nineties, owing to a slowing of output growth. This fall in per head output had been anticipated by this author (Patnaik 1996): as agriculture was opened up to the pull of global demand, 8 million hectares of foodgrains growing land has been diverted to exportable crops between 1991 and 2001, and yield has not risen enough to compensate, leading to a sharp decline of annual output growth which has fallen below population growth (even though the latter itself has been falling): hence we see fall in per head output.
Even more striking than output decline, however, has been the decline in foodgrains availability, or absorption per capita over the same period. Availability (which is defined as net output plus net imports and minus net additions to public stocks) has fallen by four times as much as output, or by 22 kg, as Table 4 shows. A large gap between per capita output and availability was last seen during the food crisis of the mid-1960s, but in the opposite direction - at that time, since output fell, 19 million tonnes of foodgrains were imported over two years to ensure enough domestic availability, apart from existing stocks being drawn down for the same purpose. By contrast in recent years even though output per head has fallen, both very large additions to stocks as well as massive food exports have taken place, resulting in large availability decline.
Availability is the same as the actual absorption of foodgrains, and the two terms will be used interchangeably. There was a slow decline in the absorption of food grains per head of the country’s population between 1991-2 and 1997-8, after which it has fallen very sharply, from an average annual level of 174.3 kg in the three year period ending in 1997-98, to only 151 kg by the individual pre-drought year 2000-01, an abysmally low level last seen during the early years of the Second World War, which included the years of the terrible Bengal famine. Thus, in 2000-01 the average Indian family of four members was absorbing 93 kg less of foodgrains compared to a mere four years earlier – a massive and unprecedented drop, entailing a fall in average daily intake by 64 gms per

head, or a fall in calorie intake by at least 225 calories from foodgrains which accounts for 65 to 70 percent of the food budget of the poor. Adequate energy intake from cereals normally ensures adequate protein intake and the converse is also true, as NNMB Reports point out2. Since the richest one-sixth to one-fifth of the population, mainly urban, has been improving and diversifying diets, the nutritional decline for the poorer three-fifths of the population, mainly rural, has been much greater than the average fall indicates.
Last year’s severe drought, despite very low output, galvanized efforts to implement food-for–work in the drought–hit areas, and therefore resulted in somewhat improved availability per head compared to 2000-01, though it remained lower than the 158 kg level of the previous year, 2001-02 which had registered the highest foodgrains output ever seen of 212 million tonnes. Nevertheless the average annual cereals absorption taking all three years ending in 2002-03 is only 146 kg, and the cereals plus pulses, or foodgrains absorption is only 155 kg per head, an absolutely inadequate level given the large inequality in its distribution.
Often the argument is heard that since per capita income is rising it is to be expected that people should consume less cereals and pulses which become inferior goods, and consume more high-value foods: in short, people would diversify their diets. A falling share of grains in the consumer budget as income rises is known as Engel’s Law. So, it is argued, there is nothing wrong if we see falling availability/absorption of foodgrains per head. This is a total misconception regarding Engel’s Law and it seems to have contributed to the incorrect official explanations of large stocks as arising from ‘overproduction’, discussed a little later. It is a misconception because Engel was referring to the fall in the share of food expenditure for the direct consumption of grains as income rises, and not to the total absorption of grains which includes both direct use as well as indirect use as feed for livestock (to produce milk, eggs, meat and so on), and as industrial raw material. The absorption of foodgrains per capita is always found to rise, not fall, as the consumer’s average income rises. The figures of availability we have given, as indeed the official figures of availability, refer to absorption of grain for all purposes. (Note that availability figures do not require any consumption data but are calculated directly from output data, which is the hardest data we have, and this is adjusted only for trade and for stocks, so by definition it has to meet all possible final uses).
Availability of foodgrains thus includes not only direct consumption (as roti, boiled rice and so on) but also the part converted to animal products by being used as commercial feedgrains, and at present a part of these animal products are exported. (The conversion coefficients are quite high, for example a kilo of mutton can require 3-4 kilos of feedgrain to produce). Availability also includes the part of grain converted to industrial products like starch and alcohol, and into processed foods like cornflakes and noodles with an urban market. The availability, or absorption of foodgrains per head, because it is for all uses, always rises as a nation’s per capita income rises. This is a very
2 The National Nutrition Monitoring Bureau, in 25 Years of NNMB (Delhi, 1997) says on p.3: “The NNMB has consistently confirmed in successive surveys that the primary bottleneck in the dietaries of even the poorest segments of Indians is energy and not protein as was hitherto believed…..The data also indicate that measurement of consumption of cereals can be used as a proxy for total energy intake. This observation is of considerable significance as it helps to determine rapid, though approximate, estimates of energy intakes at the HH (household) level.”

well known fact and is supported by an extensive literature on the responsiveness of demand for cereals to rising incomes, and by the FAO food balance sheets which give data over time for output, trade and stocks by individual crops, and cover virtually every country.
China, with about double India’s per capita income, absorbed 325 kg per capita of foodgrains (excluding tubers) in the mid-1990s compared to India’s less than 200 kg at that time. Mexico absorbed 375 kg per capita, high income Europe absorbed over 650 kg per capita and USA absorbed the maximum, 850 kg per capita of which less than a quarter was directly consumed and the rest converted to animal products, processed or put to industrial use (Calculated by author from FAO, Food Balance Sheets for 1992-94). The recent trend in this country of sharply declining foodgrains absorption per head while average per capita income has been rising, is thus highly abnormal, not only in the light of international experience but also in comparison with our own past experience – we have always seen rising grain absorption per capita as average incomes rose in the past in India. Between 1950 and 1991 per capita absorption rose slowly from 152 kg to 177 kg as per capita incomes rose.
As earlier observed these gains of four decades have been wiped out in a single decade of economic reform, and while availability fell by 3 kg per head in the seven years up to 1998, over eight-tenths of the total fall, namely a fall of 19 kg, has taken place in the mere five years of NDA rule (from 174 kg average for the three years ending in 1998 to 155 kg average for the three years ending in 2002-03) Table 2 British India, 1897 to1946: Net Output, Imports and Availability of Foodgrains (Five-year average except last year). ______________________________________________________________________________ Period Net FG Net FG Net FG Popu- Per Capita Output Imports Avail. lation Output Availa- m. ton m.ton m.ton m Kg bility Kg ______________________________________________________________________________________ 1897-1902 44196.84 -475.00 43721.84 219.74 201.1 199.0 1903-1908 41135.94 -1105.83 40030.11 225.79 182.2 177.3 1909-1914 47292.59 -1662.83 45629.76 231.30 204.5 197.3 1915-1920 45298.31 -336.00 44962.31 232.81 194.6 193.1 1921-1926 44607.21 -203.67 44403.54 239.18 186.5 185.6 1927-1932 43338.46 858.83 44197.29 253.26 171.1 174.5 1933-1938 41786.79 1374.67 43161.46 270.98 154.2 159.3 1939-1944 42702.91 521.83 43224.74 291.03 146.7 148.5 Individual year 1945-46 41397.13 596.00 41993.13 307.00 134.8 136.8 _____________________________________________________________________________________ Source: Net Output is obtained from gross output data in G. Blyn (1966) Agricultural Trends in India 1891-1949, by following the present day practice, of deducting one-eighth from Gross output on account of seed, feed and wastage. Net import figures also from the same source. Last two columns are roughly comparable with present day concepts of per head output and availability detailed in Table 3 and 4 below.

Table 3 Annual per capita output, imports and availability of foodgrains 1950-1 to 1989-90 in Kilograms (Five-year average) Period Net Net Change in Net Annual Availability of Food Grains per Capita, Cereals Import Stocks Cereals Pulses Total Pulses/ Output Total, % 1951-55 122.74 6.06 - 0.33 129.13 23.59 152.72 15.4 1956-60 121.81 8.30 - 5.82 135.93 24.84 160.77 15.5 1961-65 135.02 10.99 - 0.31 146.32 22.12 168.44 13.1 1966-70 129.83 12.45 1.34 140.94 17.78 158.72 11.2 1971-75 135.48 6.17 1.11 140.54 15.47 156.01 9.9 1976-80 147.13 - 0.77 0.57 145.79 15.63 161.42 9.7 1981-85 153.19 2.30 3.54 151.95 14.34 166.29 8.6 1986-90 155.95 0.65 - 1.56 158.16 14.61 172.77 8.5 Change in per Capita Availability, percent 1951-55 to 1971-75 2.15 1971-75 to 1986-90 10.74 Total Change, 1951-55 to 1986-90 13.12 _____________________________________________________________________________________- Source: Calculated from net output and availability data in Ministry of Finance, Economic Survey
for various years, supplemented by Reserve Bank of India, Report on Currency and Finance for various years.
Table 4 Summary of Annual per capita Foodgrains Output and Availability in India in the
Nineties (Three Year Average) _____________________________________________________________________________________ Three-yr. Average Net Output per Head Net Availability per Head Period Population Cereals Food- Cereals Pulses Foodgrains Ending in million Kg grains Kg Kg Kg/ Gms / Year day _____________________________________________________________________________________ 1991-92 850.70 163.43 178.77 162.8 14.2 177.0 485 1994-95 901.02 166.74 181.59 160.8 13.5 174.3 478 1997-98 953.07 162.98 176.81 161.6 12.6 174.2 477 2000-01 1008.14 164.84 177.71 151.7 11.5 163.2 447 -------------------------------------------------------------------------------------------------------------------------------- Individual Year 2000-01 1027.03 157.79 167.43 141.42 9.64 151.06 414 2001-02 1046.44 165.40 177.01 146.76 11.61 158.37 434 2002-03* 1066.22 140.54 150.09 148.14 9.55 157.69 427 Average of the Years 2000-01 & 2001-02 1036.74 161.63 173.30 144.51 10.64 155.15 425 Change in Per Capita Availability of Foodgrains, % Triennium ending 1991-92 to Triennium ending 1997-98 - 1.6 Triennium ending 1997-98 to biennium ending 2001-02 - 10.9 Total Change, 1991-92 to 2001-02. -12.3 ______________________________________________________________________________________________ Source: As Table 3. Population growth rate calculated as 1.89% using Census population totals of 1991 and 2001. The population figure for 2001 used above, is the March 2001 Census total of 1027million which is 6

million less than the mid-2001 figure of 1033.3 million used in the Economic Survey, 2002-03 in its Table S-21. Population for 2002 and 2003 in the table above is obtained by applying the growth rate of 1.89% to this March 2001Census figure. The underestimation of population by us is deliberate. The reader can check that actual availability per head would be lower by about 1 kg in each year from 2001 using the official population figures. * Note that 2002-03 estimate of availability is provisional, based on assuming the correctness of the data on individual items like procurement, off-take, and export over the months of 2002-03 as reported in RBI, Report on Currency and Finance 2002-03, Table 2.13 on p.12. It may be noted that the opening and closing stocks figures given in the same table are not consistent with the reported change in individual items – about 13 million tonnes of foodgrains are not accounted for.
What lies behind the decline in absorption of foodgrains? The massive decline at
present compared to 1998, is the result of an unprecedented decline in purchasing power in rural areas following directly from a number of deflationary policies at the macroeconomic level, combined with international price declines for the larger volumes of export crops produced in India following trade liberalization. Both deflationary policies and opening up to trade are integral to neo-liberal economic reforms. This has resulted in a deflation of effective demand as far as the mass of the rural population is concerned.
The continuous decline in purchasing power, hence decline in foodgrains absorption for direct consumption purposes, resulted in a continuous decline in foodgrains sales from the PDS, which therefore got reflected in the continuous and increasing additions to public food stocks year after year starting from 1998, with the total stocks standing at 63.1 million tonnes by the end of July 2002. This was nearly 40 million tonnes in excess of buffer norms – and this in spite of declining per capita foodgrains output, and 2 to 4 million tonnes of grain exports every year up to June 2002, after which exports undertaken by the government have surged to unprecedented levels.
Last year, the worst drought year for two decades, between June 2002 and June 2003, the NDA government exported a record 12 million tonnes of foodgrains out of stocks and continued to export a million tonnes a month, bringing the declared total exports to over 17 million tonnes by November 2003. Independent India has never before seen such huge exports, only made possible by more and more empty stomachs over the preceding years. It is an utter scandal and a disgrace, that at the same time that millions of the rural poor were going hungry and those already hungry were being pushed into starvation, rather than undertake widespread food-for–work programmes the government preferred to feed foreigners and their cattle by exporting foodgrains, applying a heavy subsidy to beat low world price. The f.o.b. export price was lower than the domestic BPL price. The concerned Ministry has had the gall to put full-page advertisements in newspapers in March as part of the government’s pre-election ‘shining India’ campaign, celebrating among other things its export earnings.
Now that the perception of drought has ended, food-for –work projects have been wound up, and the media are full of a good monsoon and record projected grain output in 2003-04, the prognosis for a recovery of absorption levels to anywhere near that of 1998, remain very bleak. Let us remember that millions more than before were going hungry at only 158 kg average absorption level in the year of the largest harvest seen to date – 212 million tonnes in 2001-02, or 177 kg average output. The difference of nearly 20 kg per head, between output and absorption, was going into addition to stocks, held at increasing cost, and into exports.
While a look at Table 3 shows that the difficult late 1960s and early 1970s also had fairly low availability, only somewhat higher than at present, it has to be recognized that the situation for the rural poor is worse today compared to then, because a larger part of the lowered absorption of today is going into animal products (the consumption of which is highly concentrated with the well-to-do) and into open market sales to processing units. Thus while in the last drought year 2002-03, a total of 33 million tonnes of grain were procured, the sales through the PDS plus allocations to special schemes for weaker sections amounted to almost the same, 35 million tonnes, implying that the mountainous stocks of 63 million tonnes, were drawn down by a negligible 2 million tonne only, on this account.
Thus no policies were followed of an expansionary nature to reduce stocks by implementing large-scale food-for –work schemes in all rural areas in order to generate employment and restore purchasing power to earlier levels, as had been widely suggested by the progressive movements. All that was done was to allocate larger amounts of foodgrains to relief works in drought-hit areas alone. It is the massive 12 million tonnes of exports plus 6 million tonnes of open market sales which mainly reduced stocks by July 2003, and these obviously did not benefit the poor. The very fact of as high as 33 million tonnes procurement in a severe drought year also indicates distress sales by farmers (see RBI, Report on Currency and Finance 2002-03 for these figures)3.
Neither government nor its policy makers are prepared to recognize the fact that falling availability reflects a contraction of effective demand. On the contrary, the explanation put forward in official publications of the Finance Ministry and the RBI and propagated by most academic economists, is precisely the opposite, namely that there is ‘overproduction’. The Economic Survey 2001-02 (pp.118-130) argued that excess stocks were a surplus over what people voluntarily wish to consume, and represented a "problem of plenty". NSS data on falling share of cereals in the spending on food were quoted to argue that not only the well-to-do, but all segments of the population were voluntarily diversifying their diets to high value foods away from cereals. It said that minimum support prices (MSP) to farmers have been "too high" resulting in excessive output and procurement. The RBI's Annual Report 2001-02 (pp.20-25) repeated this argument, explaining the alleged mismatch between supply and demand as arising from rising administered acquisition price for rice and wheat against the global trend of falling market prices, leading to ‘wrong’ price signals to the farmers and hence to ‘excessive’ output and procurement of these crops.
Evidently the authors of these arguments have never heard of the difference between direct consumption of grain and the absorption of grain for all purposes – both direct and indirect -, which has been already explained: if they had, they could not have given the above arguments or talked of overproduction, especially given the fact that the very same Reports show massive fall in availability per head. Further, their arguments 3 We are assuming here that the individual items given month-by-month in Table2.13 on p.12 of the RBI, Report on Currency and Finance 2002-03 up to November 2003, are correct. These individual items include procurement, off-take ( given separately on account of PDS sales, allocations to schemes for weaker sections and open- market sales and exports). The doubt arises because the opening stocks and closing stocks figures given in the Table are not consistent with the total of the individual items for ,closing are found to be understated in many months. The final closing stock of October 2003 is given as 22.1 million tonnes, but it should be 35 million tonnes if we calculate from the individual items. Thus 13 million tonnes of foodgrains are unaccounted for! Did it rot, or was it destroyed: is the question.
might have had some little persuasive power if rural growth rates, employment and incomes had been rising. But all the NSS and official data show that precisely the opposite is the case. For a country which has been seeing sharp deceleration of agricultural growth in the nineties, falling per capita foodgrains output and sharply rising rural unemployment, these arguments on voluntary dietary diversification for all rural population segments, are illogical to the point of being foolish. We now know why the central government undertook massive food exports last year in a situation of steeply falling food availability and despite a severe drought: it has all been justified and rationalized already, simply by interpreting deepening hunger and starvation as ‘voluntary choice,’ and way below-normal consumption as over-production, in a grotesque travesty of reality.
J. Maynard Keynes had once remarked that the world moves on little else but ideas: and the socially irrational outcome we see before our eyes, of increasing hunger amidst relative plenty, illustrates starkly the effects that fallacious theories and wrong policies following from them, can have in lowering mass welfare. The fallacy involved in the official view is the fallacy of composition, where a statement which is correct for a part of the whole, is wrongly inferred to be correct for the whole. With income distribution shifting sharply in their favour, the top one-sixth of the population has certainly been voluntarily diversifying diets, but the poorer majority of the population cannot afford to do so, any more than the hungry poor of Paris crying for bread, could heed Queen Marie Antoinette’s advice to eat cake.
It seems that the question of effective demand and of demand deflation is simply not understood by most people. While everyone understands food shortage as in a drought, namely a physical output shortfall which curtails supply, it appears to baffle many that even more severe consequences can arise when the effective demand, the purchasing power of the masses falls, so that even though the physical supplies of foodgrains are there, people starve or move into hunger, owing to their inability to purchase food or to access food.
The reasons for declining rural mass effective demand in the nineties to date are many, and are all connected with deflationary neo-liberal reforms combined with trade liberalization. They will be summarized only briefly here as they have been discussed at length elsewhere (Patnaik 2003). First, public rural development expenditures which averaged 14.5% of GDP during the period 1985-90, before reforms, were reduced to 8% of GDP by the early nineties as part of the deflationary policies advised by the BWI. Since 1998 they have been reduced further, averaging less than 6% of GDP and in some years falling to less than 5%. In real terms there has been a reduction of about Rs.30,000 crores annually in development expenditures on average during the last five years, compared to the pre-reform period. If we assume a plausible value of between 4 and 5 for the Keynesian multiplier, this means a drop in incomes in agriculture annually to the tune of between Rs.120000 crores to 150000 crores – a massive contraction indeed. This order of income fall, combined with real income declines owing to other causes detailed below, is broadly consistent with the observed fall in the contribution of agriculture to GDP during the nineties, from around one third to just over a quarter at present.
Let us remember that rural development expenditures include all employment generation programmes, special areas programmes, village industry, irrigation and flood control, energy and transport, apart from agriculture and rural development. Further,

public fixed capital formation in agriculture has also continued its decline even more sharply in the nineties. It is hardly surprising that the rate of agricultural growth has slowed drastically in the nineties and has fallen below population growth for the first time in thirty years, and that the NSS employment surveys show an alarming collapse of rural employment growth to below 0.6% annually during 1993-4 to 1999-00 compared to 2% annually during 1987-8 to 1993-4.Rural job losses are reflected in a lower participation rate, higher open unemployment, and an absolute decline in the numbers employed in agriculture.
Despite all its recent strident talk of development and the costly media publicity to every project, the reality is that no government has followed more systematically anti-development policies than has the NDA during the last five years. (It must be remembered that a rise in the size of the budget deficit as such, is no indicator of an expansionary impact on material production, if the rise is owing to reduction in the tax-GDP ratio and increasing interest payments to the well-to-do, as has been the case with reform policies). The decline in rural purchasing power has also contributed substantially to industrial recession, through demand linkages for simple consumer goods and manufactured inputs. The economy has undergone de-industrialization with the contribution of industry to GDP, which had been rising in the eighties, falling from 28% to just over 25% in the course of the nineties, and large net job losses have taken place in the organized sector. The only sector which has grown fast is the services sector which has ballooned, at the expense of the material productive sectors. As income distribution has shifted to the urban elites, a modern version of the medieval Mughal economy is emerging with dozens of service providers to each individual rich household. Only a small segment of the services sector is highly-paid IT related services: the major expansion comes from lower-paid service activities.
Second, at the very same time that unemployment was growing and real earnings of the rural masses falling owing to deflationary policies, the government, years before it was required to do so under WTO, bending to the pressure of advanced countries, removed all quantitative restrictions on trade by April 2001 and exposed our farmers to unfair trade, global price volatility and recession-hit external markets. While global primary prices were rising up to 1996, they went into a prolonged decline thereafter, with between 40-50% (cereals, cotton, sugar, jute) to 85 % (some edible oils) fall in unit dollar price between 1995 and 2001. Some goods like tea and coffee continue to fall for growers, and others have seen only 10 to 15 percent rise from the trough, in the last two years. It is one thing to open the economy to trade when markets are expanding and quite another to do so when the world capitalist economy is in recession.
Anyone with a rudimentary knowledge of the past behaviour of global commodity markets should have been able to predict the crashing prices after the sharp rise of the early nineties, and also predict the fact that advanced countries would immediately raise their subsidies as they have always done (this author had warned of both in a 1997 paper), but India’s policy makers have been unequal to the task and have in effect sacrificed our farmers on the altar of the BWI and WTO dogmas. These free trade dogmas ensure reduction of protection to their own producers by gullible developing country governments, at the same time that advanced countries increase their non-tariff barriers and massively raise their subsidies – the greater part of which they have, for their own convenience, already defined as non-trade distorting and placed outside reduction
commitments in the Agreement on Agriculture. The bound tariff rates on agricultural products which the Commerce Minister had repeatedly assured as being adequate (bound rates averaged 115%) have not been actually implemented to provide protection to our farmers. On the contrary even under the regime of sharply falling global prices, duties continued to be reduced by the Finance Minister in every budget, far below the bound rates and averaged only 35% by 2000, allowing imports of rice, fruit and dairy products undermining local incomes.
Producers of all export crops in India including raw cotton have also been badly hit by falling global prices, especially as input prices also rose with reform policies, inducing a severe squeeze on their already low incomes. With the implementation of the Narasimhan Committee Report after 1994, bank credit became more expensive and reliance on private high-cost credit perforce rose. Reduction of input subsidies and higher power tariffs, all part of the reforms pushed by the BWI, were mindlessly implemented even as farmers were already in difficulty, plunging virtually all farmers including the normally viable ones, into a downward spiral of indebtedness and causing many to lose land as the latest data indicate. Sale of kidneys and suicides are stark indices of deepening agrarian distress.
While the main prize for servile implementation of deflationary BWI dictates against mass interests, goes to the central government and its policy advisers, the next consolation prize for the most adverse state-level policies should go to the TDP government of Andhra Pradesh which, entering into a direct structural adjustment programme with the world Bank, has hiked power tariff on five occasions. This state has seen more than three thousand recorded farmer suicides in the last five years as well as suicides of entire families of weavers. In 2002 alone, according to police records (reported in The Hindu, Hyderabad edition of Jan.6, 2003) as many as 2,580 deeply indebted farmers killed themselves mainly by ingesting pesticides in three districts alone – Warangal, Karimnagar and Nizamabad. We have no record of suicides on this scale in colonial India: our present day politicians in their servile implementation of imperialist dictates routed through the BWI have out-done even the colonial masters of the past in their disregard for the welfare of the mass of the people. At least agrarian distress at that time led to some official commissions of inquiry and amendments to laws to restrict land transfer for debt: at present all we see is bad theory and open apologetics.
Advanced countries, as they have always done in the past, have been increasing support to their farmers as global prices fell (the US has legislated subsidies into the future, which will give transfers to its farm sector of $180 billion by 2008 compared to $84 billion in 1998). The majority of our economists by contrast, are busy attacking the Indian farmer when he is already down, by saying that ‘MSP is too high’ and should be cut for these kulaks, and by shedding crocodile tears for the poorer farmers and labourers, on the ground that they are net food purchasers and would benefit from lower prices. They are obsessed with the question of support price alone, not the issue price which is the relevant one, and which can be lowered in principle without affecting support price. Further, by focussing on price alone, they implicitly assume that the population is on the same demand curve as before, whereas in fact the demand curve itself has shifted down so drastically for the mass of the rural population that tinkering with the support price is now likely to deepen the crisis.

They seem not to realize that unemployment and income deflation has swamped this sector, that every price is also an income, and cutting MSP today when there is already agrarian crisis, would further widen and deepen income deflation and lead to more indebtedness and more suicides. They forget that for years and decades India’s surplus farmers, the much reviled ‘kulaks’, sold grain without complaining to the FCI at half the global price when global price was high, thus ensuring cheap food for urban areas. Now, when the global price has fallen below the local price, these farmers have a moral right not to be abandoned to unfair competition from heavily subsidized foreign grain and other products, and a right to be given enough price support to prevent their total ruin. If those misguided economists who put forward unethical arguments about lowering MSP, were seriously interested in the cause of the poorer farmers and labourers they should be demanding an expansionary fiscal stance, a large hike in public investment and in rural development expenditures to restore employment and purchasing power.
Thirdly, the introduction of PDS targeting in 1997 divided the population into ‘above poverty line’ (APL) and ‘below poverty line’ (BPL) with lower prices being payable by the latter but with a cut in quantity. The problem of wrong exclusion of large numbers of the actually poor from BPL status (which is determined by arbitrary criteria) has been a serious one and the denial of ration cards has further aided the fall in sales from the PDS already taking place owing to decline in purchasing power. Hardly 10 million tonnes were sold by 2000-01, compared to 21 million tonnes in 1991 despite the population needing ration grains, being much larger (Swaminathan 2002).
While real disposable incomes for the top segments of the urban population have been rising fast owing to reform policies of tax cuts and cheapening of primary goods and durable goods, on the contrary rural mass incomes in terms of command over goods have been falling faster than is evident from consumption data, since higher indebtedness and asset losses have taken place to maintain already low consumption. There is rising absorption of foodgrains for the elites with a higher proportion going to processed foods and animal products, while the majority in rural areas are plunged into deepening undernutrition, owing to their reduced purchasing power and reduced institutional access to food. Very recent analysis of NSS data by fractile groups has confirmed my earlier diagnosis of sharply widening inequalities in the last five years.
The five-year period of NDA rule has seen the most violent increase in rural-urban income inequalities ever seen since Independence. The urban elites have every reason to feel good as they play with their new toys in the form of the latest automobiles and consumer durables, enjoy a more diversified diet, eat out more and reduce their resulting adipose tissue in slimming clinics: but the same neo-liberal policies which have benefited them have immiserized millions of their fellow country men, women and children who are getting enmeshed in debt and land loss, and struggling harder merely to survive. The Imbroglio of Indirect Poverty Estimates
The NSS Rounds on consumption expenditure collect data not only on the
expenditure on food and non-food items but also the physical quantities of foods, and since the average calorie equivalent of different foods is known it also computes and

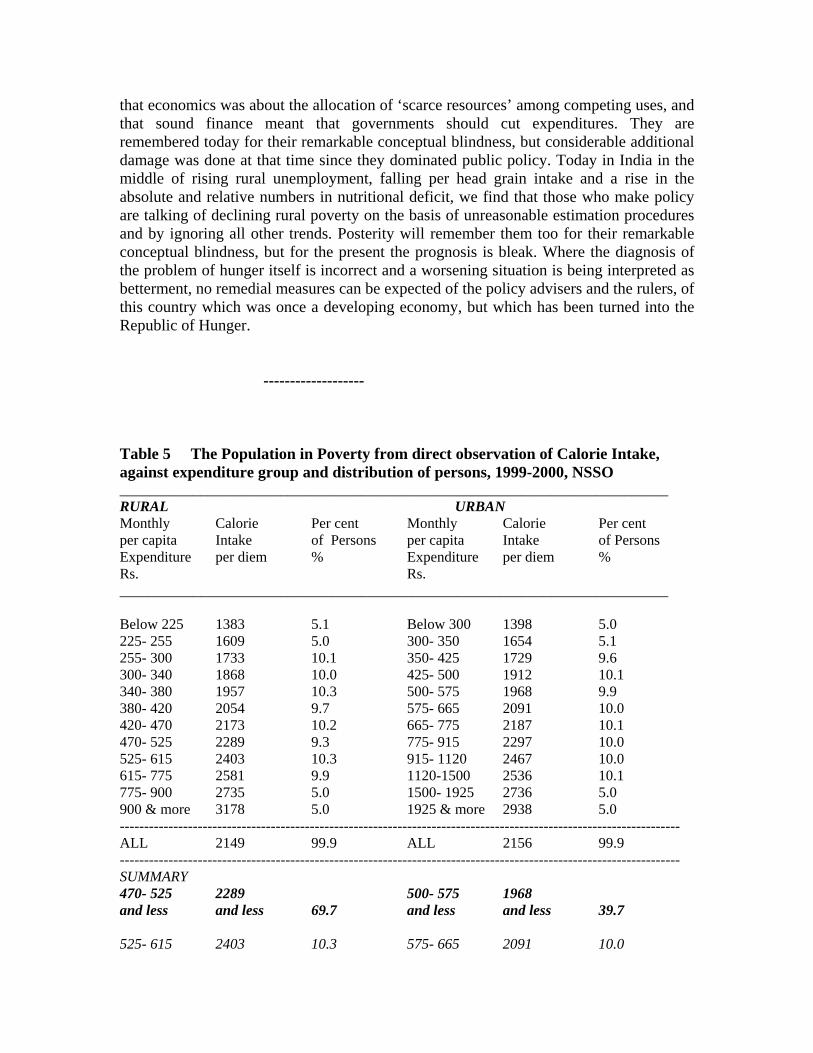
presents the calorie equivalent of average diets by expenditure groups. When we directly inspect these available NSS data on the calorie intake corresponding to the quantities of foods consumed by persons in the various per capita expenditure groups, we see that by 1999-2000, seven-tenths of the rural population was below the norm of 2400 calories per day (the norm originally adopted in all poverty studies), about one-tenth had an intake around the norm and only one-fifth had an intake above the norm. (See Table 5). Thus at least seven-tenths of the rural population was in poverty in 1999-2000. About two-fifths of the urban population was below the lower urban norm of 2100 calories. This method is direct, simple and transparent, and requires no estimation by the reader. Even if a much lower level of 2100 calories, equal to the urban norm, is considered for rural areas, we see by direct inspection that over half the rural population was below this level.
Even though the official and academic estimates of poverty started by using exactly the same poverty norm of 2400 calories for rural areas, they now arrive at an estimate of population in poverty which is 27 % or less for the same year, 1999-2000, and this, as we can see from Table 5, corresponds to a calorie intake of less than 1900 per diem. The very low estimate from the Planning Commission and the academics today, is because they all now use an indirect and non-transparent method of estimation, which moreover has proved to be increasingly incapable of capturing the ground reality of larger numbers of people moving into under-nutrition. This indirect method requires some explanation for the lay reader.
The direct inspection of calorie equivalent of quantities consumed by different expenditure classes was carried out by the Planning Commission using the 28th Round of the NSS for 1973-74, a date which is now thirty years in the past. From this, the per capita monthly expenditure whose food expenditure part, gave 2400 calories per diem in rural areas and 2100 in urban areas at that time, was obtained and this was called the poverty level income (though more correctly it is the poverty level expenditure. It came to Rs.49.1 for rural and Rs 56.6 for urban areas).
For later years no similar direct inspection of the calorie equivalent of changing expenditures was done, even though the relevant NSS data were there for many years, exactly in the same form as for the year 1999-2000 given in Table 5. Instead, in order to estimate poverty for later years, it was assumed that the quantities people consumed, hence the pattern of consumer expenditure, remained unchanged from 1973-74, and a price index was applied to the old poverty line to update it. The new rounds of consumer expenditure data, entered the picture not for directly revising the poverty line, but only to the extent that they were used to read off what percentage of persons came below the new poverty level, estimated indirectly by applying a price index to the old poverty level. Thus the method used amounts to a Laspeyres index, with quantities in a base year which by now is three decades in the past, and with adjustment being done only for price change.
If the Planning Commission, when it first estimated the poverty line expenditure for 1973-74, had said that it would base its estimate on quantities of foods people consumed thirty years earlier in 1943-44, obviously no-one would have taken its estimate seriously. Present day Planning Commission and academic estimates are based precisely on a three decade old consumption pattern relating to 1973-4, and they no longer deserve to be taken seriously. In fact they are no longer worth the paper on which they are written.

There had been no dearth of earlier, detailed criticisms of the indirect method, starting from the valid argument that it makes no sense to assume an unchanged consumption pattern for it has changed considerably over time and not necessarily owing to voluntary reasons: labourers are no longer paid wages as grain and meals (not fully valued earlier), and now have to purchase food against money wages; common property resources giving free goods have disappeared so that fuel and fodder have to be purchased, all impacting on the quantities of food that can be purchased by the poor out of a given income (Suryanarayana 1996). As a result, a considerably larger total expenditure is actually required than before, so that its food component can satisfy the calorie norm. The price-adjusted poverty line is therefore found to correspond to an actual calorie intake which over time, is further and further below the original calorie norm (thus the 1999-2000 indirectly estimated official poverty line of Rs.328 per month corresponds to less than 1900 calories per diem as inspecting Table 5 shows. The direct estimate gives a poverty line of Rs.567, over 60% higher than the official one).
The increasing divergence between the direct and indirect estimates have been pointed out by many scholars, as have the anomalies and arbitrariness in the indirect estimation method. An early demonstration of the divergence of the results using both the direct and the indirect method for two different years in the 1970s, had been carried out by Rohini.Nayyar (1991) who had explicitly concluded that “there is no doubt that the poverty estimates based on actual consumption data and set out in Table 3.4 are superior to those derived from a price-adjusted poverty line, particularly as the use of a deflator [price –index] poses many problems…” (Nayyar 1991, 38). She also pointed out that the two methods gave results which while different (the difference was relatively small, 15% of population in 1977-8) did move in the same direction over time: but this conclusion no longer holds in the late nineties, for reasons discussed later.
Mehta and Venkatraman (2000) gave the 1993-94 NSS consumption expenditure groups and calorie levels, which showed that 69.7% were below 2410 calories. Thus this direct estimate for rural areas included an additional 32 % of the rural population excluded by the official indirect estimate of poverty (which was 37.2%), a difference far too large to be ignored. They rightly questioned the logic of continuing with the indirect method.
All these criticisms have been completely ignored by the official and academic poverty estimators who use the indirect method, and who have continued full sail on their unregenerate course: they are rapidly discrediting the entire area of indirect-estimation poverty studies for their unreal estimates are foundering on the rocks of hard macroeconomic facts which contradict their estimates and which cannot be wished away. The fallacious official views on voluntary reduction in foodgrains absorption, and resulting official apathy and callousness towards the reality of increasing hunger, have been reinforced by the wrong official estimates showing an actual reduction of the rural population in poverty to 27% by 1999-2000.
A number of academics (A. Deaton, K. Sundaram and S. D. Tendulkar, S. Bhalla and others).have published the papers estimating poverty for 1999-2000 by the indirect method, which they had presented at a conference (see Economic and Political Weekly January 25-31, 2003). There is scope for variation in results among them as different price indices can be used. The estimate by A. Deaton using new price indices places the
rural poverty percentage in India at 25%, even lower than the official 27% (Deaton 2003b). Other estimates are either of a similar order to the official one or are even lower.
Another way of characterizing all the estimates using the indirect method would be: “Statistical poverty reduction via clandestine reduction of the calorie norm”. The official Planning Commission (Rs. 328) and Deaton, b (Rs.303) price-index updated poverty line for monthly per capita expenditure for 1999-2000, gives a daily calorie intake which is 1868 or less, as inspection of our Table 5 shows – a far cry indeed from the original 2400 calorie intake norm in the base-year. To meet the 2400 calorie norm, Table 5 shows that a person needed to spend at least Rs 567 per month or Rs.19 daily, equivalent to US 44 cents at the then exchange rate of Rs 43.33 to a dollar. This is the realistic poverty line, not the official one of Rs.328.
The Planning Commission is asking us to believe that people could survive on a mere Rs. 11, or U.S. cents 25 daily while Deaton’s estimate means that Rs.10 daily or US cents 23 is considered quite enough! This is less than a quarter of the World Bank’s own rough and ready dollar–a-day measure. At this rate poverty can be statistically eliminated completely from India by the indirect method with just a little more effort by the estimators to get a lower rise in the price index giving, say Rs.240 per month rather than Rs.303 (Deaton b) as the 1999-2000 poverty line. This, from Table 5, would reduce the poverty percentage dramatically to only 5, and as these people too would soon be dead, there would be a ‘final solution’ to all indirect estimation problems.
It is to be noted that none of the quoted papers making the low, indirect poverty estimates and published in EPW ( Jan. 21-25, 2003), tells the reader that the implication of their method is that the calorie standard is thereby being drastically diluted and the original concept of poverty based on nutritional norm, itself is being altered. To present estimates which imply a 500 calorie per diem or more cut in the calorie intake without explicitly informing the reader about it, is not acceptable by any academic standard. The NSS data for 1999-2000 relating actual calorie intake to expenditure groups (which we have put together in Table 5) is not presented by any of those making indirect estimates even though to do so they are using the percentage of persons by expenditure groups from the same source. None of these papers refer to even a single author among the several quoted earlier, who have criticized the indirect estimation method that they use. The student or newcomer to the area who reads the papers by the indirect method users, is not made aware that any other, direct estimation method using the latest NSS consumption data, even exists and is instead given the impression that the indirect method is the only one by which poverty can be estimated, which is untrue.4
Quite apart from the problem of a far distant base year, the indirect method of updating an old poverty level using price indices now no longer captures even the trend of change correctly, leave alone actual numbers, because the method can only reflect increase in poverty arising from rise in prices, and cannot capture increase in poverty
4 The only paper in the EPW Jan 21-25, 2003 collection which discusses calorie deprivation (Meenakshi and Vishwanathan) does so as though it is unrelated to poverty estimation. The paper does not connect the data on actual calorie deprivation, to the calorie intake levels implied by the indirect estimates presented in the same issue, nor does it discuss the crucial matter of the increasingly large difference between the head count percentage of population in poverty obtained by the direct and indirect methods.

arising from unemployment and income loss.5 This fact is proving to be the final nemesis of the prevalent poverty studies, for in the second half of the nineties and especially from 1998, as we have seen, worsening welfare in rural areas has been caused not by inflation, but owing to deflation and unemployment. So pervasive has mass income deflation become that, significantly, a very bad drought year has seen a historically low inflation rate.
It is to be expected therefore, that the indirect poverty studies should show, as they do, exactly the opposite trend compared to the actual ground reality worsening welfare owing to a higher percentage of persons moving below the calorie norm, hence rise in poverty. (The situation now is even worse than direct inspection of Table 5 indicates because foodgrains absorption per diem has fallen further by 25 gms by 2003 entailing a loss of another 95 calories per diem on this account).
. The bizarre element in all this arises from the loud celebrations of allegedly declining poverty by the government and by a number of academics engaged in indirect estimation, whereas the ‘decline’ is solely owing to the gross defects and the inappropriateness of their own indirect statistical methods. All the adverse macroeconomic trends official data reveal regarding rising unemployment and falling food absorption, which are completely inconsistent with any story of declining rural poverty, are never alluded to by the practitioners of the indirect method nor, as already noted, are the available NSS direct consumption data with calorie equivalents, presented by them in their papers..
The poverty estimators using the indirect method are doing a grave dis-service to the Indian people by continuing with an indefensible methodology which by now is giving the opposite result to the actual trends on the ground with respect to hunger. While in the late 1970s the difference between the direct and indirect methods was about 15% of the rural population and in 1993 the difference was 32% , for 1999-2000 the difference between the direct method (70% in poverty) and the indirect method (27 % according to Planning Commission) is 43% of the rural population.
Whether they wish to or not, the officials and academics using the indirect method and claiming a reduction in poverty in the 1990s, are contributing to the formulation of incorrect policies further lowering mass welfare. If these poverty estimates remained in the ivory towers of academia and of Yojana Bhavan, it would not matter: but now targeted food distribution is being directly linked to poverty estimates. The present Government is currently slashing the numbers of people designated as being ‘below poverty line ‘, and grain allocations at a low price to the states are correspondingly sought to be lowered, on the ground that poverty has declined. The failure of the prevailing indirect estimates today thus does not lie in the failure to capture ground reality alone: they have become positively dangerous in spreading wrong information and inducing the opposite policy measures to those required. It is high time that the academics and administrators working in the area of poverty estimation used the direct indicators provided by the NSS consumption data and by per head foodgrains availability, if they are at all concerned about real trends as regards hunger.
In the middle of the Great Depression in 1931 with one-fifth of workers unemployed and factories closed, many economists in advanced countries maintained 5 The process of employment and income loss are likely not to be not reflected fully in immediate fall in consumption but also involve in rising indebtedness and asset transfer.
that economics was about the allocation of ‘scarce resources’ among competing uses, and that sound finance meant that governments should cut expenditures. They are remembered today for their remarkable conceptual blindness, but considerable additional damage was done at that time since they dominated public policy. Today in India in the middle of rising rural unemployment, falling per head grain intake and a rise in the absolute and relative numbers in nutritional deficit, we find that those who make policy are talking of declining rural poverty on the basis of unreasonable estimation procedures and by ignoring all other trends. Posterity will remember them too for their remarkable conceptual blindness, but for the present the prognosis is bleak. Where the diagnosis of the problem of hunger itself is incorrect and a worsening situation is being interpreted as betterment, no remedial measures can be expected of the policy advisers and the rulers, of this country which was once a developing economy, but which has been turned into the Republic of Hunger.
-------------------
Table 5 The Population in Poverty from direct observation of Calorie Intake, against expenditure group and distribution of persons, 1999-2000, NSSO ___________________________________________________________________________ RURAL URBAN Monthly Calorie Per cent Monthly Calorie Per cent per capita Intake of Persons per capita Intake of Persons Expenditure per diem % Expenditure per diem % Rs. Rs. ___________________________________________________________________________ Below 225 1383 5.1 Below 300 1398 5.0 225- 255 1609 5.0 300- 350 1654 5.1 255- 300 1733 10.1 350- 425 1729 9.6 300- 340 1868 10.0 425- 500 1912 10.1 340- 380 1957 10.3 500- 575 1968 9.9 380- 420 2054 9.7 575- 665 2091 10.0 420- 470 2173 10.2 665- 775 2187 10.1 470- 525 2289 9.3 775- 915 2297 10.0 525- 615 2403 10.3 915- 1120 2467 10.0 615- 775 2581 9.9 1120-1500 2536 10.1 775- 900 2735 5.0 1500- 1925 2736 5.0 900 & more 3178 5.0 1925 & more 2938 5.0 ------------------------------------------------------------------------------------------------------------------- ALL 2149 99.9 ALL 2156 99.9 ------------------------------------------------------------------------------------------------------------------- SUMMARY 470- 525 2289 500- 575 1968 and less and less 69.7 and less and less 39.7 525- 615 2403 10.3 575- 665 2091 10.0

615-775 2581 19.9 665- 775 2187 50.2 _____________________________________________________________________________ Source: NSSO (1999-2000) Report No. 471, Nutritional Intake in India and Report No. 454, Household Consumer Expenditure in India – Key Results. Note: The monthly per capita expenditure refers to the expenditure on both food and non-food, with the food expenditure part, giving the calories indicated against each group. For the three groups in the summary, the per capita monthly expenditure was Rs.496.7 and less, Rs.566.62, and Rs.686.0 and more. (The average expenditure is close to but not exactly the mid-point of the relevant expenditure group owing to inequality within each group). The actual poverty-level expenditure, which commanded food quantities giving 2403 calories per day (almost equal to the 2400 calories norm), in 1999-2000 was Rs.566.6 per month (Rs.19 per day) in rural areas and 69.7 percent of all persons consumed below this level. In urban areas about 40% of all persons consumed below the urban calorie norm of 2100, closely approximated by the actual calorie intake 2091 of the expenditure group Rs. 575 to 665. For comparison, the official ‘poverty level’ expenditure (estimated by inflating an old poverty line by a price index) was only Rs.328 per month (Rs.11 per day) for rural areas at the same date, giving 27 % in poverty while Deaton 2003b estimated 25% in poverty taking Rs. 303 per month (Rs 10 per day) as the poverty line. The associated calorie intake is thereby lowered by both, to less than 1868 calories, far below the nutrition norm (since, from the above table, the Rs. 300-340 monthly expenditure group gave only 1868 per diem average intake).
REFERENCES BANISTER, J., 1987, China’s changing Population, Stanford University Press COALE, A. J., 1984, Rapid Population Change in China, 1952-1982 (National Academy Press, Washington, D.C.) DEATON, A. 2003, a) “Adjusted poverty estimates for 1999-2000” b) “Prices and Poverty 1987-2000”. Both papers in Economic and Political Weekly Vol.38, January 25-31. MEHTA, J., and VENKATARAMAN, 2000, “Poverty Statistics – Bermicide’s Feast” Economic and Political Weekly, Vol.35, July 1. NAI-RUENN CHEN, 1966, Chinese Economic Statistics – A Handbook for Mainland China (Edinburgh University Press). NAYYAR, R., 1991, Rural Poverty in India (Oxford University Press).

PATNAIK, U., 1991, “Food Availability and Famine – A longer View” Journal of Peasant Studies Vol. 19 No. 1, October. Reprinted in U. Patnaik; The Long Transition – Essays on Political Economy (Tulika, 1999) ____________, 1996, “Export oriented Agriculture and Food Security in Developing countries and in India” Economic and Political Weekly, Economic and Political Weekly, No. 35 to 37, September. Reprinted in The Long Transition - Essays on Political Economy (Tulika, 1999) ____________, 2002 “On Famine and measuring Famine Deaths” in S. Patel, J. Bagchi and Krishnaraj (Eds) Thinking Social Science in India – Essays in Honour of Alice Thorner (Sage) ___________, 2003 “Food Stocks and Hunger - Causes of Agrarian Distress” Social Scientist Vol.31 Nos.7-8 July-August. SEN, A.K., 1999, Development as Freedom New York: A Knopf. SURYANARAYANA, M. H., 1996, “Poverty Estimates and Indicators: Importance of Data Base” Economic and Political Weekly, No. 35 to 37, September. SWAMINATHAN, M., 2002 “Excluding the Needy – the Public Provisioning of Food in India” Social Scientist Vol.30 Nos. 3-4, March- April.