kvh industries, inc
TRANSCRIPT

UNITED STATESSECURITIES AND EXCHANGE COMMISSION
Washington, D.C. 20549
FORM 10-K(Mark One)
È ANNUAL REPORT PURSUANT TO SECTION 13 OR 15(d) OF THESECURITIES EXCHANGE ACT OF 1934
For the fiscal year ended December 31, 2012
OR
‘ TRANSITION REPORT PURSUANT TO SECTION 13 OR 15(d) OF THESECURITIES EXCHANGE ACT OF 1934
For the transition period from to
Commission File Number 0-28082
KVH Industries, Inc.(Exact Name of Registrant as Specified in its Charter)
Delaware 05-0420589(State or Other Jurisdiction ofIncorporation or Organization)
(I.R.S. EmployerIdentification Number)
50 Enterprise Center, Middletown, RI 02842(Address of Principal Executive Offices) (Zip Code)
(401) 847-3327(Registrant’s Telephone Number, Including Area Code)
Securities registered pursuant to Section 12(b) of the Act:Title of Each Class Name of Each Exchange on Which Registered
Common Stock, $0.01 par value per share The NASDAQ Global Market
Securities registered pursuant to Section 12(g) of the Act: None
Indicate by check mark if the registrant is a well-known seasoned issuer, as defined in Rule 405 of the SecuritiesAct. Yes ‘ No È
Indicate by check mark if the registrant is not required to file reports pursuant to Section 13 or Section 15(d) of the ExchangeAct. Yes ‘ No È
Indicate by check mark whether the registrant (1) has filed all reports required to be filed by Section 13 or 15(d) of the SecuritiesExchange Act of 1934 during the preceding 12 months (or for such shorter period that the registrant was required to file such reports),and (2) has been subject to such filing requirements for the past 90 days. Yes È No ‘
Indicate by check mark whether the registrant has submitted electronically and posted on its corporate Web site, if any, everyInteractive Data File required to be submitted and posted pursuant to Rule 405 of Regulation S-T during the preceding 12 months (orfor such shorter period that the registrant was required to submit and post such files). Yes È No ‘
Indicate by check mark if disclosure of delinquent filers pursuant to Item 405 of Regulation S-K is not contained herein, and will notbe contained, to the best of registrant’s knowledge, in definitive proxy or information statements incorporated by reference in Part IIIof this Form 10-K or any amendment to this Form 10-K. ‘
Indicate by check mark whether the registrant is a large accelerated filer, an accelerated filer, a non-accelerated filer, or a smallerreporting company. See the definitions of “large accelerated filer,” “accelerated filer” and “smaller reporting company” in Rule 12b-2of the Exchange Act. (Check one):
Large accelerated filer ‘ Accelerated filer È
Non-accelerated filer ‘ (Do not check if a smaller reporting company) Smaller reporting company ‘
Indicate by check mark whether the registrant is a shell company (as defined in Rule 12b-2 of the Exchange Act). Yes ‘ No ‘
As of June 29, 2012, the aggregate market value of the registrant’s common stock held by non-affiliates of the registrant was$163,717,600 based on the closing sale price of $12.50 per share as reported on the NASDAQ Global Market. Shares of commonstock held by executive officers and directors of the registrant and their affiliates have been excluded from this calculation becausesuch persons may be deemed affiliates.
As of March 28, 2013, the registrant had 15,111,370 shares of common stock outstanding.
DOCUMENTS INCORPORATED BY REFERENCE
Portions of the registrant’s Proxy Statement relating to its 2013 Annual Meeting of Stockholders are incorporated herein by referencein Part III.

INDEX TO FORM 10-K
Page
PART I
Item 1. Business 3
Item 1A. Risk Factors 13
Item 1B. Unresolved Staff Comments 26
Item 2. Properties 26
Item 3. Legal Proceedings 27
Item 4. Mine Safety Disclosures 27
PART II
Item 5. Market for the Registrant’s Common Equity, Related Stockholder Matters and Issuer Purchasesof Equity Securities 27
Item 6. Selected Financial Data 29
Item 7. Management’s Discussion and Analysis of Financial Condition and Results of Operations 30
Item 7A. Quantitative and Qualitative Disclosure About Market Risk 43
Item 8. Financial Statements and Supplementary Data 44
Item 9. Changes in and Disagreements with Accountants on Accounting and Financial Disclosure 44
Item 9A. Controls and Procedures 45
Item 9B. Other Information 48
PART III
Item 10. Directors, Executive Officers and Corporate Governance 49
Item 11. Executive Compensation 49
Item 12. Security Ownership of Certain Beneficial Owners and Management and Related StockholderMatters 49
Item 13. Certain Relationships and Related Transactions and Director Independence 49
Item 14. Principal Accountant Fees and Services 49
PART IV
Item 15. Exhibits and Financial Statement Schedules 50
Signatures 53
2

PART I
ITEM 1. Business
Cautionary Statement Regarding Forward-Looking Information
In addition to historical facts, this annual report contains forward-looking statements. Forward-lookingstatements are merely our current predictions of future events. These statements are inherently uncertain, andactual events could differ materially from our predictions. Important factors that could cause actual events tovary from our predictions include those discussed in this annual report under the headings “Item 7.Management’s Discussion and Analysis of Financial Condition and Results of Operations”, and “Item 1A. RiskFactors.” We assume no obligation to update our forward-looking statements to reflect new information ordevelopments. We urge readers to review carefully the risk factors described in this annual report and in the otherdocuments that we file with the Securities and Exchange Commission. You can read these documents atwww.sec.gov.
Additional Information Available
Our principal Internet address is www.kvh.com. Our website provides a hyperlink to a third-party websitethrough which our annual, quarterly, and current reports, as well as amendments to those reports, are availablefree of charge. We believe these reports are made available as soon as reasonably practicable after weelectronically file them with, or furnish them to, the SEC. We do not provide any information regarding our SECfilings directly to the third-party website, and we do not check its accuracy or completeness.
Introduction
We are a leading manufacturer of solutions that provide global high-speed Internet, television, and voiceservices via satellite to mobile users at sea, on land, and in the air. Our CommBox offers a range of toolsdesigned to increase communication efficiency, reduce costs, and manage network operations. We are also apremier manufacturer of high-performance navigational sensors and integrated inertial systems for defense andcommercial guidance and stabilization applications. Our research and development, manufacturing and qualitycontrol capabilities have enabled us to meet the demanding standards of our military, consumer and commercialcustomers for performance and reliability. This combination of factors has allowed us to create products offeringimportant differentiating advantages to our customers. We are based in Middletown, Rhode Island, with officesin Illinois, Denmark, Norway, Japan and Singapore.
We sell our mobile communications products and airtime services, including the TracVision, TracPhone,and CommBox systems and mini-VSAT Broadband airtime, through an extensive international network ofdistributors and retailers worldwide. In 2011, we completed our initial global coverage plan for our mini-VSATBroadband Ku-band service, which primarily supports maritime applications along with land-based mobile andaeronautical uses on a more limited basis currently. In addition, in February 2011, we introduced a new additionto our mini-VSAT Broadband-compatible antenna family, the 14.5-inch diameter TracPhone V3. In 2012, wecompleted the rollout of our C-band VSAT service overlay on our mini-VSAT network to complement our Ku-band service by increasing our global coverage from 70°S latitude to 75°N latitude. We also introduced a newdual-mode product, the TracPhone V11, which is able to transmit and receive both C and Ku-band signals fromour mini-VSAT Broadband network. We may also pursue expanded coverage in the future to support customer,market, or capacity demands. In addition, we are pursuing opportunities to apply our mobile communicationsexpertise to military applications that require affordable, high-bandwidth mobile connections.
Our guidance and stabilization products include precision fiber optic gyro (FOG)-based systems that helpstabilize platforms, such as gun turrets, remote weapon stations, and radar units, and provide guidance formunitions, as well as tactical navigation systems for a broad range of military vehicles. We sell our guidance andstabilization products directly to United States (U.S.) and allied governments and government contractors, as
3

well as through an international network of authorized independent sales representatives. Our fiber optic productsare also used in such commercial applications as train track geometry measurement systems, industrial robotics,surveying, optical stabilization, autonomous vehicles, and undersea remotely operated submersibles. InJune 2011, we introduced the DSP-1750, which we believe to be the world’s smallest high performance fiberoptic gyro and the first to use our new E•Core ThinFiber technology. The small size and weight of the DSP-1750make it well suited for applications with size and weight restrictions, such as night vision and thermal imagingsystems, aircraft-mounted gimbaled cameras for law enforcement and homeland security, and shipboard opticalsystems.
Our Products and Services
Mobile Satellite Communications
We believe that there is an increasing demand for mobile access to television, voice services and the Interneton the move. Our objective is to connect mobile users on sea, land, and air to the satellite TV, communications,and Internet services they wish to use. We have developed a comprehensive family of products and servicesmarketed under the TracVision, TracPhone, and CommBox brand names as well as the mini-VSAT Broadbandairtime network to address the unique needs of our communications markets.
Our mobile satellite products are typically installed on mobile platforms and use sophisticated robotics,stabilization and control software, sensing technologies, transceiver integration, and advanced antenna designs toautomatically search for, identify and point directly at the selected television and communications satellite whilethe vehicle, vessel, or plane is in motion. Our antennas use gyros and inclinometers to measure the pitch, roll andyaw of an antenna platform in relation to the earth. Microprocessors and our proprietary stabilization and controlsoftware use that data to compute the antenna movement necessary for the antenna’s motors to point the antennaproperly and maintain contact with the satellite. If an obstruction temporarily blocks the satellite signal, ourproducts continue to track the satellite’s location according to the movement of the antenna platform in order tocarry out automatic, rapid reacquisition of the signal when a direct line of sight to the satellite is restored.
Our Certified Support Network offers our TracVision and TracPhone customers an international network ofskilled technical dealers and support centers in many locations where our customers are likely to travel. We haveselected distributors based on their technical expertise, professionalism and commitment to quality and regularlyprovide them with extensive training in the sale, installation and support of our products.
We offer a broad array of products to address the needs of a variety of customers seeking mobilecommunications in maritime, land mobile and aeronautical applications.
Marine. In the marine market, we offer a range of mobile satellite TV and communications products. InDecember 2009, we began selling the TracVision HD7, a 24-inch diameter satellite TV antenna capable ofreceiving signals from two DIRECTV Ka-band satellites and one DIRECTV Ku-band satellite simultaneously tooffer a high-definition TV experience comparable to what a home DIRECTV HDTV subscriber would enjoy. Itincludes an Internet Protocol-enabled antenna control unit as well as optional antenna controls via a freeTracVision application for use on an Apple iPhone. We believe that this is the first marine antenna to offer thiscombination of capabilities. In January 2012, we began shipping our TracVision HD11. This system uses a 1-meter antenna to receive both Ku-band and Ka-band satellite television signals without changing out hardwareelements. It will work with any modern satellite television service in the world, including DIRECTV HDTV.Like the TracVision HD7, it features a customer application for the Apple iPhone or iPad to enable easy controlof the system. Our marine TracVision M-series satellite TV antennas are designed with the full spectrum ofvessel sizes in mind, ranging from recreational vessels as small as 20 to 25 feet to large commercial vessels. Theaward-winning family of marine TracVision products vary in size from a lower-profile elliptical parabolic systemsimilar to those offered for use on recreation vehicles (RV) to the 12.5-inch TracVision M1, 14.5-inchTracVision M3, 18-inch TracVision M5, 24-inch TracVision M7, and 32-inch diameter TracVision M9, each of
4

which employs a high-efficiency circular antenna. These products are compatible with Ku-band HDTVprogramming as well as high-powered regional satellite TV services around the globe, based on available signalstrength and antenna size requirements.
Broadband Internet. In 2007, we introduced our Ku-band airtime service branded as mini-VSATBroadband. This service utilizes spread spectrum technology and ArcLight modem technology, both of whichwere developed by ViaSat. This spread spectrum approach reduces the broadcast power requirements and thepointing accuracy necessary to track the high-bandwidth Ku-band satellites that carry the service. The resultingefficiencies allowed us to develop and bring to market the 24-inch diameter TracPhone V7 antenna, which wealso introduced in 2007. This antenna is 85% smaller by volume and 75% lighter than alternative 1-meter VSATantennas. In February 2011, we introduced a new addition to our mini-VSAT Broadband-compatible antennafamily, the 14.5-inch diameter TracPhone V3. We believe that the TracPhone V3 is the smallest maritime VSATsystem currently available. Its small size makes it practical for use on smaller vessels as well as land vehicles.
The high bandwidth offered by the Ku-band satellites also permits faster data rates than those supported byInmarsat’s L-band satellites. TracPhone V7 subscribers may select service packages with Internet dataconnections offering ship-to-shore satellite data rates as fast as 1 Mbps, or megabits per second, and shore-to-ship satellite data rates as fast as 2 Mbps. The TracPhone V3, due to its smaller dish diameter, offers ship-to-shore data rates as fast as 128 kilobits per second, or Kbps, and shore-to-ship satellite data rates as fast as 2Mbps. In addition, subscriptions include Voice over Internet Protocol (VoIP) telephone services optimized foruse over satellite connections. The TracPhone V7 can support two or more simultaneous calls while theTracPhone V3 can support one call at a time.
We currently offer our Ku-band mini-VSAT Broadband service in the Americas, Europe, the Middle East,Africa, Asia-Pacific, and Australian and New Zealand waters. We believe that our mini-VSAT Broadbandservice represents the only global multi-megabit commercial satellite communications network for vessels andairplanes.
In 2012, we completed the rollout of a major upgrade to the mini-VSAT Broadband network, adding threeglobal C-band transponders to deliver a fully global overlay to the Ku-band service. The dual-mode TracPhoneV11 antenna seamlessly tracks both C- and Ku-band satellites, making it the only 1-meter maritime VSATantenna to deliver seamless, fully global coverage outside of the far polar regions. Service for the combined C/Ku band network is sold on both traditional fixed-rate plans, where they are priced incrementally higher than theKu-band only service, and the new unrestricted plans for the same price as the Ku-band service. Unrestrictedplans are sold in “buckets,” whereby we provide between 5 and 40 gigabytes of data per month for a fixed price,with the ability to add data for a small incremental charge. The new plans are called “unrestricted” because theyallow customers to stream audio or video content to or from their vessels or use popular VoIP services likeSkype™, protocols often blocked on other VSAT plans due to the large amount of bandwidth they consume.
We are actively engaged in sales efforts for the TracPhone V3, V7, and V11 and mini-VSAT Broadbandservice to government agencies for maritime, military, and emergency responder use. In September 2010, theU.S. Coast Guard awarded us a 10-year, up to $42 million contract to supply TracPhone V7 systems and mini-VSAT Broadband airtime to as many as 216 U.S. Coast Guard cutters. We are also taking steps to expand ourability to support the commercial maritime market. In March 2011, we signed a contract to provide TracPhoneV7 and mini-VSAT Broadband service to Vroon B.V. and its fleet of more than 125 commercial vessels. InMarch 2012, V.Ships, the world’s largest independent ship manager serving a fleet of over 1,000 vessels,selected our mini-VSAT Broadband service as its preferred satellite communications solution. In June 2012,Tokyo-based shipping and logistics company, Nippon Yusen Kaisha (NYK Line), selected our TracPhone V7and mini-VSAT Broadband service for over 100 vessels.
Our unified C/Ku-band Broadband service enables us to offer commercial, leisure and governmentcustomers an integrated hardware and service solution for mobile communications and seamless region-to-region
5

roaming. It is our long-term plan to continue to invest in and enhance the mini-VSAT Broadband network incooperation with ViaSat under the terms of a 10-year agreement announced in July 2008. In February 2011, wecompleted a major capacity increase which doubled our network capacity in the Asian, African and the WestIndian Ocean regions, including waters off the coasts of Australia and New Zealand. As part of the networkexpansion to support regions with growing numbers of customers, we plan to continue to acquire, as needed,satellite capacity from commercial satellite operators and to purchase regional satellite hubs from ViaSat. Thesehubs use ViaSat’s ArcLight spread spectrum mobile broadband technology and are operated by ViaSat on ourbehalf. Over the course of the 10-year agreement, we and ViaSat also expect to implement future enhancementsto the mini-VSAT Broadband spread spectrum maritime services and related products. In August 2011, we, alongwith Viasat, rolled out enhancements to the global spread spectrum network that doubled the maximum uplinkspeeds and offered significant improvements in the network reliability. In addition, we announced new adaptivereturn link technology, which enables KVH TracPhone V3 and V7 systems to adjust system operationsautomatically to suit changing conditions. Under the terms of our revenue sharing arrangement with ViaSat,these types of expansions position us to earn revenue not only from the maritime and land-based use of the mini-VSAT Broadband service but also from aeronautical applications that roam throughout our network.
The mini-VSAT Broadband network is an end-to-end solution for offshore connectivity. We design andmanufacture the onboard TracPhone terminals and antennas, own the hub equipment installed in leased earthstations, lease the satellite capacity, manage the network, and provide 24/7/365 after-sale support. Using spread-spectrum modem technology from ViaSat, we can offer terminals with antennas that are 85% smaller thancompeting maritime VSAT solutions. Because we manufacture the onboard hardware, we can integrate the fullrack of discrete below decks equipment typically used on traditional VSAT systems into a single, streamlinedunit that is significantly easier to deploy than competing VSAT solutions.
Our mini-VSAT Broadband network currently uses a combination of 14 Ku-band transponders to providecoverage throughout the northern hemisphere and all of the major continents in the southern hemisphere. ThisKu-band capacity can be accessed by any of our TracPhone V-series antennas, and provides the exclusive sourceof service for the TracPhone V3, V7, and V7-IP. The compact TracPhone V3, with its 15.5" antenna andaffordable rate plans (starting at only $49 per month for 50 MB of service), is designed for smaller vessels orthose with seasonal data needs. The enterprise-grade TracPhone V7-IP offers a range of airtime service plans,including low-priced metered plans, traditional speed-based, fixed-rate plans, and the company’s newunrestricted rate plans. In addition to our TracPhone V3, V7 and V11 and mini-VSAT Broadband service, wealso offer a family of Inmarsat-compatible TracPhone products that provide in-motion access to global satellitecommunications. These products rely on services offered by Inmarsat, a satellite service provider that supportslinks for phone, fax and data communications as fast as 432 Kbps. The TracPhone FB150, FB250, and FB500antennas use the Inmarsat FleetBroadband service to offer voice as well as high-speed Internet service. TheTracPhone FB150, FB250, and FB500 are manufactured by Thrane & Thrane A/S of Denmark and distributed onan OEM basis by us in North America under the KVH TracPhone brand and distributed in other markets on anon-exclusive basis. Unlike mini-VSAT Broadband, where we control and sell the airtime, we purchase Inmarsatairtime from a distributor and resell it to our customers.
In September 2010, we acquired Virtek Communication, a Norwegian firm that developed CommBox, aship-to-shore network management product. CommBox, which comprises shipboard hardware, a KVH-hosted orprivately owned shore-based hub, and a suite of software applications, offers a range of tools designed to increasecommunication efficiency, reduce costs, and manage network operations. Key functions include web and datacompression and optimization to increase network capacity; remote PC management for customer ITdepartments; integrated e-mail, web compression, firewalls, and security; least-cost routing; and bandwidthmanagement on multiple communication carriers. CommBox is now offered as an option for the TracPhone V3,V7 and V11 and with our Inmarsat-compatible TracPhone and Iridium OpenPort systems. CommBox salesinclude both the shipboard hardware and optional private shore-based hub, subscriptions to the selected softwareapplications, and monthly system maintenance fees.
6

We offer Iridium OpenPort hardware and service to be used in conjunction with our mini-VSAT service.Iridium OpenPort service provides data rates up to 128 Kpbs and covers the entire world, including the polarregions. We offer the Iridium hardware and service along with our own mini-VSAT solution and our CommBox,which will switch over to the Iridium service if the mini-VSAT service is not available. Our customers mightchoose to add the Iridium service to expand the geographic coverage of the system, or as a backup service.
Land. We design, manufacture, and sell a range of TracVision satellite TV antenna systems for use on abroad array of vehicles, including recreational vehicles, trucks, conversion vans, and automobiles.
In the RV/truck market, we offer a line-up of our TracVision satellite TV products, including productsintended for both stationary and in-motion use. Our TracVision R1 was introduced in 2011, delivering DIRECTVor DISH Network service through a small 12.5" diameter dome. The TracVision A7 uses hybrid phased-arrayantenna technology to provide in-motion reception of satellite TV programming in the continental United Statesusing the DIRECTV service. Our TracVision A7 product includes a mobile satellite television antenna and anintegrated 12V mobile DIRECTV receiver/controller designed specifically for the mobile environment by KVHand DIRECTV. The TracVision A7 stands approximately five inches high and mounts either to a vehicle’s roofrack or directly to the vehicle’s roof, making it practical for use aboard minivans, SUVs and other passengervehicles. The TracVision A7 is also popular for tall motor coaches and buses. Automotive customers subscribe toDIRECTV’s TOTAL CHOICE MOBILE satellite TV programming package, which is specifically promoted forautomotive applications. Local channels and network programming are also available as an option for TracVisionA7 users as a result of the system’s integrated GPS and mobile receiver. At this time, we are the only companyauthorized by DIRECTV to sell, promote, and activate mobile users for the TOTAL CHOICE MOBILEprogramming package.
Aeronautical Applications. We designed, developed, and manufactured DIRECTV-compatible satellite TVantennas for use on narrowbody commercial aircraft, such as Boeing’s 737 and the Airbus A320, operating in theUnited States.
We currently have an agreement with LiveTV that began in September 2011 covering maintenance ofexisting satellite antennas as well as pricing terms for potential purchases of new antennas.
Guidance and Stabilization Products
We offer a portfolio of digital compass and fiber optic gyro-based systems that address the rigorousrequirements of military and commercial customers. Our systems provide reliable, easy-to-use and continuouslyavailable navigation and pointing data. Our guidance and stabilization products include our inertial measurementunit for precision guidance, fiber optic gyros for tactical navigation and stabilization, and digital compasses thatprovide accurate heading information for demanding applications.
Guidance and Stabilization. Our fiber optic gyro products use an all-fiber design that has no moving parts,resulting in an affordable combination of precision, accuracy and durability. Our fiber optic gyro productssupport a broad range of military applications, including stabilization of remote weapons stations, antennas,radar, optical devices or turrets; image stabilization and synchronization for shoulder-or tripod-mounted weaponsimulators; precision tactical navigation systems for military vehicles, and guidance for weapons and unmannedautonomous vehicles. Our fiber optic gyro products are also used in commercial and industrial applications, suchas train location control and track geometry measurement systems, robotics, surveying, optical stabilization,autonomous vehicles, and undersea remotely operated submersibles.
Our TG-6000 Inertial Measurement Unit (IMU) is a guidance system that provides precise measurement ofmotion and acceleration in three dimensions. It uses a three-axis configuration of our high-performance DSP-based (digital signal processing) fiber optic gyros integrated with three accelerometers. We believe that thisconfiguration provides outstanding performance, high reliability, low maintenance and easy system integration.
7

The TG-6000 IMU is a component in the U.S. Navy’s MK54 lightweight torpedo and is suitable for use in otherapplications that involve flight control, orientation, instrumentation and navigation, such as unmanned aerialvehicles. In June 2010, we introduced the CG-5100, our first commercial-grade inertial measurement unit. TheCG-5100 is focused on a wide range of applications such as 3D augmented reality, mobile mapping, platformnavigation and GPS augmentation for unmanned vehicle programs, precise mapping and imagery.
In October 2008, we introduced the CNS-5000 continuous navigation system, a self-contained navigationsystem that combines our fiber optic gyro-based inertial measurement technology with GPS technology fromNovAtel. This navigation solution provides precise position and orientation of a host platform on a continuousbasis, even during periods where GPS signals are blocked by natural or man-made obstructions or conditions.The CNS-5000 is designed for demanding commercial applications, such as dynamic surveying, precisionagriculture, container terminal management, and autonomous vehicle navigation, where the ability to determinethe precise position and orientation of a piece of equipment or a mobile platform is critical. The CNS-5000 is acommercial-off-the-shelf (COTS) product consisting of a FOG-based inertial measurement unit tightly integratedwith GPS within a single enclosure. This design reduces the operational complexities for customers whoseproducts cross international boundaries.
In June 2011, we introduced the DSP-1750, which we believe to be the world’s smallest high performancefiber optic gyro and the first to use our new E•Core ThinFiber technology. This new thin fiber, which is createdat our Tinley Park, Illinois manufacturing facility, is only 170 microns in diameter, enabling longer lengths offiber to be wound into smaller housings. Since the length of the fiber used in a fiber optic gyro directly relates togyro accuracy and performance, the new technology enables us to produce smaller and more accurate gyros. Thenew DSP-1750 is five times faster and has angle random walk (ARW) ten times better than our first small gyro,the DSP-1500, which has been replaced with the new design. The small size and weight of the DSP-1750 make itwell suited for applications with size and weight restrictions, such as night vision and thermal imaging systems,aircraft-mounted gimbaled cameras for law enforcement and homeland security, and shipboard optical systems.
Our open-loop DSP-1750, DSP-3000 series, and DSP-4000 fiber optic gyros provide precision measurementof the rate and angle of a platform’s turning motion typically for significantly less cost than competing closed-loop gyros. These DSP-based products deliver performance superior to analog signal processing devices, whichexperience greater temperature-sensitive drift and rotation errors. Applications for these products include inertialmeasurement units, integrated navigation systems, attitude/heading/reference systems, and stabilization ofantenna, radar and optical equipment.
The DSP-3000 series is slightly larger than a deck of playing cards and offers a variety of interface optionsto support a range of applications. High-performance 2-axis and 3-axis configurations can be realized byintegrating multiple DSP-3000 units. Currently, the DSP-3000 series is used in an array of pointing andstabilization applications, including the U.S. Army’s Common Remotely Operated Weapon Station (CROWS) toprovide the image and gun stabilization necessary to ensure that the weapon remains aimed at its target. Weestimate that more than 20 companies have developed or are developing stabilized remote weapons stations thatwe believe will require similar fiber optic gyro stabilization capabilities. Our fiber optic products are also used incommercial and industrial applications, such as train location control and track geometry measurement systems,robotics, precision surveying, augmented reality systems, optical stabilization, autonomous vehicles, andundersea remotely operated submersibles. The larger, militarized DSP-4000 is designed for use in high-shockand highly dynamic environments, such as gun turret stabilization.
In June 2012, we introduced the Series 1750 IMU, an advanced 6-degrees-of-freedom sensor designed tointegrate easily into the most demanding stabilization, pointing, and navigation applications, enhancingperformance at a lower cost than competing systems. The Series 1750 IMU marries the groundbreaking E•CoreThinFiber technology of our DSP-1750 with very low noise, solid state MEMS accelerometers to create acommercial-off-the-shelf IMU. The Series 1750 IMU offers exceptional precision in a very small form factor,making it suitable for applications where space is limited, such as unmanned and autonomous systems.
8

Tactical Navigation. Our TACNAV tactical navigation product line employs digital compass sensors andKVH fiber optic gyros to offer vehicle-based navigation and pointing systems with a range of capabilities,including GPS backup and enhancement, vehicle position, hull azimuth and navigation displays. Because ourdigital compass products measure the earth’s magnetic field rather than detect satellite signals from the GPS,they are not susceptible to GPS jamming devices.
TACNAV systems vary in size and complexity to suit a wide range of vehicles. The TACNAV Light is alow-cost, digital compass-based battlefield navigation system specifically designed for non-turreted vehicles,such as high mobility multi-wheeled vehicles (HMMWVs) and trucks. Turreted vehicles, includingreconnaissance vehicles, armored personnel carriers and light armored vehicles, are supported by the TACNAVTLS, a digital compass-based tactical navigation and targeting system that offers a fiber optic gyro upgrade forenhanced accuracy. We also manufacture the TACNAV II Fiber Gyro Navigation system, which offers acompact design, continuous output of heading and pointing data, and a flexible architecture that allows it tofunction as either a stand-alone navigation module or as the central component of an expanded, multifunctionalnavigation system.
Our navigation systems function as standalone tools and also aggregate, integrate and communicate criticalinformation from a variety of on-board systems. TACNAV can receive data from systems such as the vehicle’sodometer, military and commercial GPS devices, laser rangefinders, turret angle indicators and laser warningsystems. TACNAV can also output this data to an on-board computer for retransmission through the vehicle’scommunications systems to a digital battlefield management application.
Our TACNAV digital compass products have been sold for use aboard U.S. Army, Marine Corps, and Navyvehicles as well as to many allied countries, including Australia, the United Kingdom, Canada, Germany, Italy,New Zealand, Saudi Arabia, Spain, Sweden, Taiwan, Malaysia and Switzerland. We believe that we are amongthe leading manufacturers of such systems. Our standard TACNAV products can be customized to ourcustomers’ specifications. At customer request, we offer training and other services on a time-and-materialsbasis.
Sales, Marketing and Support
Our sales, marketing and support efforts target markets that are substantial and require dedicated dealers anddistributors to reach end customers. These channels vary from time to time, but currently include targeted effortsto reach the commercial and leisure maritime markets, the RV and high-end automotive markets, and thecommercial, industrial and government markets. We believe our brands are well known and well respected byconsumers within their respective niches. These brands include:
TracVision-satellite television systems for vessels and vehicles
TracPhone-two-way satellite communications systems
mini-VSAT Broadband-broadband mobile satellite communications network
CommBox-network management hardware and software for maritime communications
Azimuth-digital compass for powerboats
Sailcomp-digital compass for sailboats
TACNAV-tactical navigation systems for military vehicles
Our fiber optic gyros and digital compass sensors use an alphanumeric model numbering sequence such asC-100, DSP-1750 IMU, DSP-3000, DSP-4000, CNS-5000, CG-5100, and TG-6000 IMU.
We sell our mobile satellite communications products through an international network of independentretailers, chain stores and distributors, as well as to manufacturers of vessels and vehicles.
9

Our European headquarters, which is located in Denmark, coordinates our sales, marketing and supportefforts for our mobile satellite communications products in Europe, the Middle East, and Africa. Asian(excluding Japanese) and Australia/New Zealand sales are managed through our office located in Singapore.Japanese sales are managed through our office in Japan. All international offices are managed under theoversight of our North American sales and marketing office. Standalone CommBox sales are managed by ourNorwegian subsidiary in cooperation with members of our satellite sales teams in all offices worldwide. See note12 of the notes to our consolidated financial statements for information regarding our geographic segments.
We sell our guidance and stabilization products directly to U.S. and allied governments and governmentcontractors, as well as through an international network of authorized independent sales representatives. Thissame network also sells our fiber optic products to commercial/industrial entities.
In 2012, the U.S. Army Program Office—Saudi Arabian National Guard (SANG) represented 11% of ourtotal sales.
Backlog
Backlog is not a meaningful indicator for predicting revenue in future periods. Commercial resellers for ourmobile satellite communications products and legacy products do not carry extensive inventories and rely on usto ship products quickly. Generally due to the rapid delivery of our commercial products, our backlog for thoseproducts is not significant.
Our backlog for all products and services was approximately $35.0 million, $22.1 million, and $20.8 millionon December 31, 2012, 2011 and 2010, respectively. As of December 31, 2012, our backlog was scheduled forfulfillment in 2013, except for $3.0 million scheduled for fulfillment in 2014. The increase in backlog of $12.9million from December 31, 2011 to December 31, 2012 was primarily a result of the order for TACNAVproducts and services received in June 2012 for SANG. This increase was partially offset by decreased orders forfiber optic gyros. The increase in backlog of $1.3 million from December 31, 2010 to December 31, 2011 wasprimarily a result of increased orders for fiber optic gyros, a three-year agreement with LiveTV coveringmaintenance of existing satellite television antennas that began in September 2011, as well as an increase inorders of our mobile satellite communications products.
Backlog consists of orders evidenced by written agreements and specified delivery dates for customers whoare acceptable credit risks. We do not include satellite connectivity service sales in our backlog even thoughmany of our satellite connectivity customers have signed annual service contracts providing for a fixed monthlyfee. Military orders included in backlog are generally subject to cancellation for the convenience of the customer.When orders are cancelled, we generally recover actual costs incurred through the date of cancellation and thecosts resulting from termination. As of December 31, 2012, our backlog included approximately $9.3 million inorders that are subject to cancellation for convenience by the customer. Individual orders for guidance andstabilization products are often large and may require procurement of specialized long-lead components andallocation of manufacturing resources. The complexity of planning and executing larger orders generally requirescustomers to order well in advance of the required delivery date, resulting in backlog.
Intellectual Property
Our ability to compete effectively depends to a significant extent on our ability to protect our proprietaryinformation. We rely primarily on patents and trade secret laws, confidentiality procedures and licensingarrangements to protect our intellectual property rights. We own approximately 33 U.S. and foreign patents andhave additional patent applications that are currently pending. We also register our trademarks in the UnitedStates and other key markets where we do business. Our patents will expire at various dates between March 2013and May 2031. We enter into confidentiality agreements with our consultants, key employees and salesrepresentatives, and maintain controls over access to and distribution of our technology, software and other
10

proprietary information. The steps we have taken to protect our technology may be inadequate to prevent othersfrom using what we regard as our technology to compete with us.
We do not generally conduct exhaustive patent searches to determine whether the technology used in ourproducts infringes patents held by third parties. In addition, product development is inherently uncertain in arapidly evolving technological environment in which there may be numerous patent applications pending, manyof which are confidential when filed, with regard to similar technologies.
From time to time, we have faced claims by third parties that our products or technologies infringe theirpatents or other intellectual property rights, and we may face similar claims in the future. Any claim ofinfringement could cause us to incur substantial costs defending against the claim, even if the claim is invalid,and could distract the attention of our management. If any of our products is found to violate third-partyproprietary rights, we may be required to pay substantial damages. In addition, we may be required to re-engineerour products or seek to obtain licenses from third parties to continue to offer our products. Any efforts to re-engineer our products or obtain licenses on commercially reasonable terms may not be successful, which wouldprevent us from selling our products, and, in any case, could substantially increase our costs and have a materialadverse effect on our business, financial condition and results of operations.
Manufacturing
Manufacturing operations for our mobile satellite communications and navigation products consist of lightmanufacture, final assembly and testing. Manufacturing operations for our fiber optic gyro products are morecomplex. We produce specialized optical fiber, fiber optic components and sensing coils and combine them withcomponents purchased from outside vendors for assembly into finished goods. We own optical fiber drawingtowers with which we produce the specialized optical fiber that we use in all of our fiber optic products.Excluding the CommBox product, which we manufacture in Norway, we manufacture, warehouse and distributeour mobile satellite communications products at our headquarters in Middletown, Rhode Island. We manufactureour navigation and fiber optic gyro products in our facility located in Tinley Park, Illinois.
We contract with third parties for fabrication and assembly of printed circuit boards, injection-moldedplastic parts, machined metal components, connectors and housings. We believe there are a number of acceptablevendors for the components we purchase. We regularly evaluate both domestic and foreign suppliers for quality,dependability and cost effectiveness. In some instances we utilize sole-source suppliers to develop strategicrelationships to enhance the quality of materials and save costs. Our manufacturing processes are controlled byan ISO 9001:2008-certified quality standards program.
Competition
We encounter significant competition in all of our markets, and we expect this competition to intensify inthe future. Many of our primary competitors are well-established companies and some have substantially greaterfinancial, managerial, technical, marketing, operational and other resources than we do.
In the market for marine satellite TV equipment, we compete with Intellian, Cobham SATCOM,Raymarine, NaviSystem Marine Electronic Systems Srl, and King Controls.
In the marine market for voice, fax, data and Internet communications equipment and services, we competewith Cobham SATCOM, Furuno Electric Co., Ltd., Globalstar LP, Iridium Satellite LLC, Intellian, Ship Equipand JRC. We also face competition from providers of marine satellite data services and maritime VSATsolutions, including Inmarsat/ShipEquip/Stratos, MTN/SeaMobile, Speedcast, CapRock, Schlumberger, andVizada/Marlink.
In the market for land mobile satellite TV equipment, we compete with MotoSAT, King Controls, CobhamTracStar and Winegard Company.
11

In the markets for mobile satellite communications technology, the principal competitive factors are productsize, features, design, performance, reliability and price.
In the guidance and stabilization markets, we compete primarily with Honeywell International Inc., KearfottGuidance & Navigation Corporation, Northrop Grumman Corporation, Goodrich Aerospace, IAI, Fizoptica,SAGEM and Systron Donner Inertial. We believe the principal competitive factors in these markets areperformance, size, reliability, durability and price.
Research and Development
Focused investments in research and development are critical to our future growth and competitive positionin the marketplace. Our research and development efforts are directly related to timely development of new andenhanced products that are central to our core business strategy. The industries in which we compete are subjectto rapid technological developments, evolving industry standards, changes in customer requirements, and newproduct introductions and enhancements. As a result, our success depends in part upon our ability, on a cost-effective and timely basis, to continue to enhance our existing products and to develop and introduce newproducts that improve performance and meet customers’ operational and cost requirements. Our current researchand development efforts include projects to achieve additional cost reductions in our products and thedevelopment of new products for our existing marine and land mobile communications markets, and navigation,guidance and stabilization application markets. For example:
• in June 2012, we launched our new Series 1750 IMU at trade shows in Europe and the U.S. offeringhigh performance in an ultra compact form factor;
• in August 2012, we introduced a new addition to our mini-VSAT Broadband-compatible antennafamily, the TracPhone V7-IP, our new onboard terminal with a 3-axis antenna system and integratedbelow-decks unit incorporating CommBox Ship/Shore Network Manager; and
• in September 2012, we introduced the new dual-band TracPhone V11 for mini-VSAT Broadbandglobal C/Ku-band service.
Our research and development activities consist of projects funded by us, projects funded with the assistanceof customer-funded contract research and Small Business Innovative Research (SBIR) grants. Our customer-funded research efforts are made up of contracts with defense and OEM customers, whose performancespecifications are unique to their product applications. SBIR projects are generally directed towards thediscovery of specific information requested by the government research sponsor. Many of these grants haveenhanced our technologies, resulting in new or improved product offerings. Defense and OEM research oftenresults in new product offerings. We strive to be the first company to bring a new product to market, and we useour own funds to accelerate new product development efforts.
Government Regulation
Our manufacturing operations are subject to various laws governing the protection of the environment andour employees. These laws and regulations are subject to change, and any such change may require us to improveour technologies, incur expenditures, or both, in order to comply with such laws and regulations.
We are subject to compliance with the U.S. Export Administration Regulations. Some of our products havemilitary or strategic applications, and are on the Munitions List of the U.S. International Traffic in ArmsRegulations. These products require an individual validated license to be exported to certain jurisdictions. Thelength of time involved in the licensing process varies and can result in delays of the shipping of the products.Sales of our products to either the U.S. government or its prime contractors are subject to the U.S. FederalAcquisition Regulations.
12

We are also subject to the laws and regulations of the U.S. and foreign jurisdictions in which we offer andsell our satellite communication products and services, including those of the European Union, Brazil, Norway,Singapore and Japan. These laws and regulations, as well as the interpretation and application of these laws andregulations, are subject to change and any such change may affect our ability to offer and sell existing andplanned satellite communications products and services.
Employees
On December 31, 2012, we employed 355 full-time employees. We also employ temporary or contractpersonnel, when necessary, to provide short-term and/or specialized support for production and other functionalprojects.
We believe our future success will depend upon the continued service of our key technical and seniormanagement personnel and upon our continued ability to attract and retain highly qualified technical andmanagerial personnel. None of our employees is represented by a labor union. We have never experienced awork stoppage and consider our relationship with our employees to be good.
ITEM 1A. Risk Factors
An investment in our common stock involves a high degree of risk. You should carefully consider thefollowing risk factors in evaluating our business. If any of these risks, or other risks not presently known to us orthat we currently believe are not significant, develops into an actual event, then our business, financial conditionand results of operations could be adversely affected. If that happens, the market price of our common stockcould decline.
Our revenues and results of operations have been and may continue to be adversely impacted byworldwide economic turmoil, credit tightening, high fuel prices and associated declines in consumerspending.
Worldwide economic conditions have experienced a significant downturn over the last several years, includingslower economic activity, tightened credit markets, inflation and deflation concerns, increased fuel prices, decreasedconsumer confidence, reduced corporate profits, reduced or canceled capital spending, adverse business conditionsand liquidity concerns. These conditions make it difficult for businesses, governments and consumers to accuratelyforecast and plan future activities. Many governments are experiencing significant deficits that may cause them tocurtail spending significantly or reallocate funds away from defense programs. There can be no assurances thatgovernment responses to the disruptions in the economy will remedy these problems. As a result of these and otherfactors, customers could slow or suspend spending on our products and services. We may also incur increased creditlosses and need to increase our allowance for doubtful accounts, which would have a negative impact on ourearnings and financial condition. For example, our allowance for doubtful accounts increased from approximately$0.6 million at December 31, 2011 to approximately $0.9 million at December 31, 2012.
We cannot predict the timing, duration or ultimate impact of this downturn. We expect our business tocontinue to be adversely impacted by this downturn.
Net sales of many of our mobile communications products are largely generated by discretionary consumerspending, and demand for these products may demonstrate slower growth or decline as a result of continuingweak regional and global economic conditions. For example, sales of our land mobile products decreased 20%from 2011 to 2012. Consumer spending tends to decline during recessionary periods and may decline at othertimes. Some consumers have chosen not to purchase our mobile communications products due to a perceptionthat they are luxury items, and this could continue. As global and regional economic conditions change, includinguncertainty regarding federal budgetary pressures, overseas sovereign debt crisis, the general level of interestrates, fluctuating oil prices and demand for durable consumer products, demand for our products could continueto be materially and adversely affected.
13

Our financial performance is impacted by U.S. government contracts, which are subject to uncertain levelsof funding and termination.
We sell a substantial portion of our fiber optic gyro systems and tactical navigation products to the U.S.government, either directly or as a subcontractor to other contractors. The termination of these U.S. governmentcontracts, whether due to lack of funding, for convenience, or otherwise, or the occurrence of delays, couldnegatively impact our results of operations and financial condition.
The funding of U.S. government programs is subject to congressional appropriations. Congress generallyappropriates funds on a fiscal year basis even though a program may extend over several fiscal years.Consequently, programs are often only partially funded initially and additional funds are committed only asCongress makes further appropriations. If appropriations for any program in which we participate becomeunavailable, or are reduced or delayed, our contract or subcontract under such program may be terminated oradjusted by the government, which could have a negative impact on our future sales under such contract orsubcontract. When a formal appropriation bill has not been signed into law before the end of the U.S.government’s fiscal year, which has become more frequent in recent years, Congress may pass a continuingresolution that authorizes agencies of the U.S. government to continue to operate, generally at the same fundinglevels from the prior year, but that typically does not authorize new spending initiatives, during this period.Appropriations can also be impacted by other budgetary considerations, such as failure to increase the statutorydebt ceiling of the U.S. government. During such periods (or until the regular appropriation bills are passed),delays can occur in procurement of products and services due to lack of funding, and these delays can affect ourresults of operations during the period of delay.
Appropriations can also be affected by legislation that addresses larger budgetary issues of the U.S.government. Examples include the Budget Control Act of 2011 and its sequestration provisions which wereintended to significantly reduce appropriations below forecasted levels for most federal agencies, including theU.S. Department of Defense, in order to encourage passage of a compromise appropriations bill, as well aslegislation that limits the debt ceiling for the U.S. government.
In addition, U.S. government contracts generally also permit the government to terminate the contract, inwhole or in part, without prior notice, at the government’s convenience or for default based on performance. Ifone of our contracts is terminated for convenience, we would generally be entitled to payments for our allowablecosts and would receive some allowance for profit on the work performed. If one of our contracts is terminatedfor default, we would generally be entitled to payments for our work that has been accepted by the government.A termination arising out of our default could expose us to liability and adversely affect our ability to obtainfuture contracts and orders. Furthermore, on contracts for which we are a subcontractor and not the primecontractor, the U.S. government could terminate the prime contract for convenience or otherwise, irrespective ofour performance as a subcontractor.
Our results of operations could be adversely affected if unseasonably cold weather, prolonged winterconditions, disasters or similar events occur.
Our marine leisure business is highly seasonal and seasonality can also impact our commercial marinebusiness. Historically, we have generated the majority of our marine leisure product revenues during the first andsecond quarters of each year, and these revenues typically decline in the third and fourth quarters of each year,compared to the first two quarters. Temporary suspensions of our airtime services typically increase in the thirdand fourth quarters of each year as boats are placed out of service during winter months. Our marine leisurebusiness is also significantly affected by the weather. Unseasonably cool weather, prolonged winter conditions,hurricanes, unusual amounts of rain, and natural and other disasters may decrease boating, which could reduceour revenues. Specifically, we may encounter a decrease in new airtime activations as well as an increase in thenumber of cancellations or temporary suspensions of our airtime service.
14

We expect that we could derive an increasing portion of our revenues from commercial leases of mobilecommunications equipment, rather than sales, which could increase our credit and collection risk.
We are actively seeking to increase revenues from the commercial markets for our mini-VSAT Broadbandservice, particularly shipping companies and other companies that deploy a fleet of vessels. In marketing thisservice, we offer leasing arrangements for the TracPhone antennas to both commercial and leisure customers. Ifcommercial leases become increasingly popular with our customers, we could face increased risks of defaultunder those leases. Defaults could increase our costs of collection (including costs of retrieving leasedequipment) and reduce the amount we collect from customers, which could harm our results of operations.Moreover, fleet sales are likely to be less common than, and perhaps substantially larger than, our typical orders,which could lead to increased variability in our quarterly revenues.
Changes in the competitive environment or supply chain issues may require inventory write-downs.
From time to time, we have recorded significant inventory reserves and/or inventory write-offs as a result ofsubstantial declines in customer demand. Market or competitive changes could lead to future charges for excessor obsolete inventory, especially if we are unable to appropriately adjust the supply of material from our vendors.
Adverse economic conditions could result in financial difficulties or bankruptcy for any of our suppliers,which could adversely affect our business and results of operations.
The significant downturn in worldwide economic conditions and credit tightening could present challengesto our suppliers, which could result in disruptions to our business, increase our costs, delay shipment of ourproducts and impair our ability to generate and recognize revenue. To address their own business challenges, oursuppliers may increase prices, reduce the availability of credit, require deposits or advance payments or takeother actions that may impose a burden on us.
They may also reduce production capacity, slow or delay delivery of products, face challenges meeting ourspecifications or otherwise fail to meet our requirements. In some cases, our suppliers may face bankruptcy. Wemay be required to identify, qualify and engage new suppliers, which would require time and the attention ofmanagement. Any of these events could impair our ability to deliver our products to customers in a timely andcost-effective manner, cause us to breach our contractual commitments or result in the loss of customers.
Shifts in our product sales mix toward our mobile communications products and services may reduce ouroverall gross margins.
Our mobile communications products and services historically have had lower product and service grossmargins than our guidance and stabilization products. For example in 2012, we experienced a 10% year-over-year increase in sales of our mobile communications products versus a 3% year-over-year increase in sales of ourguidance and stabilization products. A continued shift in our sales mix towards mobile communications productsand services would likely cause lower gross margins in the future, especially if driven by reduced demand.
We must generate a certain level of sales of the TracPhone V3, V7 and V11 and our mini-VSATBroadband service in order to improve our service gross margins.
As a result of our mini-VSAT Broadband network infrastructure, our cost of service sales includes certainfixed costs that do not generally vary with the volume of service sales, and we have almost no ability to reducethese fixed costs in the short term. These fixed costs will increase if we further expand our network toaccommodate additional subscriber demand and/or coverage area expansion. If sales of our TracPhone V3, V7and V11 and the mini-VSAT Broadband service do not generate the level of revenue that we expect or decline,our service gross margins may remain below historical levels or decline. The failure to improve our mini-VSATBroadband service gross margins would have a material adverse effect on our overall profitability.
15

Competition may limit our ability to sell our mobile communications products and guidance andstabilization products.
The mobile communications markets and defense navigation, guidance and stabilization markets in whichwe participate are very competitive, and we expect this competition to persist and intensify in the future. We maynot be able to compete successfully against current and future competitors, which could impair our ability to sellour products. For example, improvements in the performance of lower cost gyros by competitors couldpotentially jeopardize sales of our fiber optic gyros. Foreign competition for our mobile satellite communicationsproducts has continued to intensify, most notably from companies that seek to compete primarily on price. Weanticipate that this trend of substantial competition will continue.
In the market for marine satellite TV equipment, we compete with Intellian, Cobham SATCOM,Raymarine, NaviSystem Marine Electronic Systems Srl, and King Controls.
In the marine market for voice, fax, data and Internet communications equipment and services, we competewith Inmarsat, Cobham SATCOM, Furuno Electric Co., Ltd., Globalstar LP, Iridium Satellite LLC, Intellian, andJRC. We also face competition from providers of marine satellite data services and maritime VSAT solutions,including Inmarsat, MTN/SeaMobile, Speedcast, CapRock, Schlumberger, and Astrium.
In the market for land mobile satellite TV equipment, we compete with MotoSAT, King Controls, CobhamTracStar and Winegard Company.
In the guidance and stabilization markets, we compete primarily with Honeywell International Inc., KearfottGuidance & Navigation Corporation, Northrop Grumman Corporation, Goodrich Aerospace, IAI, Fizoptica,SAGEM and Systron Donner Inertial.
Among the factors that may affect our ability to compete in our markets are the following:
• many of our primary competitors are well-established companies that could have substantially greaterfinancial, managerial, technical, marketing, personnel and other resources than we do;
• product improvements, new product developments or price reductions by competitors may weakencustomer acceptance of, and reduce demand for, our products;
• new technology or market trends may disrupt or displace a need for our products; and
• our competitors may have lower production costs than we do, which may enable them to compete moreaggressively in offering discounts and other promotions.
The emergence of a competing small maritime VSAT antenna and complementary service or other similarservice could reduce the competitive advantage we believe we currently enjoy with our 24-inch diameterTracPhone V7 and 14.5-inch diameter TracPhone V3 antennas along with our integrated Ku-band mini-VSAT Broadband service, or with our C/Ku-band mini-VSAT Broadband service and our new TracPhoneV11.
Our TracPhone V3 and V7 systems offer customers a range of benefits due to their integrated design,hardware costs that are lower than existing maritime Ku-band VSAT systems, and spread spectrum technology.We currently compete against companies that offer established maritime Ku-band VSAT service using, in somecases, antennas 1-meter in diameter or larger. While we are unaware of any company offering a 14.5-inch VSATsolution comparable to our TracPhone V3, we are encountering regional competition from companies offering24-inch VSAT systems and services, which are comparable in size to our TracPhone V7. Likewise, ourTracPhone V11 is approximately 85% smaller and lighter than competing C-band maritime VSAT systems,which uses antennas in excess of 2.4 m in diameter to provide similar global services. We are unaware of anycompetitor currently offering a similar size solution for global C-band coverage, but any introduction of such a
16

product could adversely impact our success. In addition, other companies could replicate some of thedistinguishing features of our TracPhone V3, V7 or V11, which could potentially reduce the appeal of oursolution, increase price competition and adversely affect sales. Moreover, consumers may choose other servicessuch as FleetBroadband or Iridium OpenPort for their service coverage and potentially lower hardware costsdespite higher service costs and slower data rates. Finally, it is possible that sales of our TracPhone V3 antennaswill reduce sales of our TracPhone V7 antennas.
Our ability to compete in the maritime airtime services market may be impaired if we are unable toprovide sufficient service capacity to meet customer demand.
The TracPhone V3, V7, and V11 and our mini-VSAT Broadband service offer a range of benefits tomariners, especially in commercial markets, due to the smaller size antenna and faster, more affordable airtime.We have completed the rollout of our original network coverage plan and currently offer service in the Americas,Europe, the Middle East, Africa, Asia-Pacific, and Australian and New Zealand waters. In the future, we mayneed to expand capacity in existing coverage areas to support an expanding subscriber base. If we are unable toreach agreement with third-party satellite providers to support the mini-VSAT Broadband service and its spreadspectrum technology or transponder capacity is unavailable should we need to increase our capacity to meetgrowing demand in a given region, our ability to support vessels and aeronautical applications globally will be atrisk and could reduce the attractiveness of the product and service to these customers.
The purchasing and delivery schedules and priorities of the U.S. military and foreign governments areoften unpredictable.
We sell our fiber optic gyro systems and tactical navigation products to U.S. and foreign military andgovernment customers, either directly or as a subcontractor to other contractors. These customers often use acompetitive bidding process and have unique purchasing and delivery requirements, which often makes thetiming of sales to these customers unpredictable. Factors that affect their purchasing and delivery decisionsinclude:
• increasing budgetary pressures, that may reduce or delay funding for military programs;
• changes in modernization plans for military equipment;
• changes in tactical navigation requirements;
• global conflicts impacting troop deployment, including troop withdrawals from the Middle East;
• priorities for current battlefield operations;
• new military and operational doctrines that affect military equipment needs;
• sales cycles that are long and difficult to predict;
• shifting response time and/or delays in the approval process associated with the export licenses wemust obtain prior to the international shipment of certain of our military products;
• delays in military procurement schedules; and
• delays in the testing and acceptance of our products, including delays resulting from changes incustomer specifications.
These factors can cause substantial fluctuations in sales of our TACNAV and FOG products from period toperiod. For example, sales of our FOG products decreased $17.9 million, or 44%, from 2010 to 2011 andincreased $0.7 million, or 3%, from 2011 to 2012. TACNAV product sales, which for 2012 include shipments ofa portion of the largest TACNAV order in our history, have increased $1.0 million, or 5% from 2011 to 2012.We do not currently have in backlog another TACNAV order of comparable size for 2013 or future years, and asa result we expect that our TACNAV revenues will decline in 2013 from 2012. The U.S. government may
17
change defense spending priorities at any time. Moreover, government customers such as the U.S. Coast Guardand their contractors can generally cancel orders for our products for convenience or decline to exercisepreviously disclosed contract options. Even under firm orders with government customers, funding must often beappropriated in the budget process in order for the government to complete the contract. The cancellation of orfailure to fund orders for our products could further reduce our net sales and results of operations.
Sales of our fiber optic gyro systems and TACNAV products generally consist of a few large orders, andthe delay or cancellation of a single order could substantially reduce our net sales.
KVH products sold to customers in the defense industry are purchased through orders that can generallyrange in size from several hundred thousand dollars to more than one million dollars. For example, we receivedorders for TACNAV products and services of $7.2 million, $35.6 million and $2.8 million in January 2013, June2012 and June 2012, respectively, and we received orders for fiber optic gyro products of $2.5 million and $7.6million in December 2011. Orders of this size are often unpredictable and difficult to replicate. As a result, thedelay or cancellation of a single order could materially reduce our net sales and results of operations. Weperiodically experience repeated and unanticipated delays in defense orders, which make our revenues andoperating results less predictable. Because our guidance and stabilization products typically have relativelyhigher product gross margins than our mobile communications products, the loss of an order for guidance andstabilization products could have a disproportionately adverse effect on our results of operations.
Only a few customers account for a substantial portion of our guidance and stabilization revenues, and theloss of any of these customers could substantially reduce our net sales.
We derive a significant portion of our guidance and stabilization revenues from a small number ofcustomers, many of whom are contractors for the U.S. government. For example, in the year ended December 31,2012, one customer accounted for approximately 11% of our total sales. The loss of business from any of thesecustomers could substantially reduce our net sales and results of operations and could seriously harm ourbusiness. Since we are often awarded a contract as a subcontractor to a major defense supplier that is engaged ina competitive bidding process as prime contractor for a major weapons procurement program, our revenuesdepend significantly on the success of the prime contractors with which we align ourselves.
Our mobile satellite products currently depend on satellite services and facilities provided by third parties,and a disruption in those services could adversely affect sales.
Our satellite products include only the equipment necessary to utilize satellite services; we do not broadcastsatellite television programming or own the satellites to directly provide two-way satellite communications. Wecurrently offer satellite television products compatible with the DIRECTV and DISH Network services in theUnited States, the Bell TV service in Canada, the Sky Mexico service and various other regional satellite TVservices in other parts of the world.
SES, Eutelsat, Sky Perfect-JSAT, GE Satellite, Telesat, EchoStar, Intelsat and Star One currently providethe satellite capacity to support the mini-VSAT Broadband service and our TracPhone V3, V7 and V11. Intelsatalso currently provides our C-band satellite coverage. In addition, we have agreements with various teleports andInternet service providers around the globe to support the mini-VSAT Broadband service. We rely on Inmarsatfor satellite communications services for our mini-M, Fleet and FleetBroadband compatible TracPhone products.
If customers become dissatisfied with the programming, pricing, service, availability or other aspects of anyof these satellite services, or if any one or more of these services becomes unavailable for any reason, we couldsuffer a substantial decline in sales of our satellite products. There may be no alternative service provideravailable in a particular geographic area, and our modem or other technology may not be compatible with thetechnology of any alternative service provider that may be available. In addition, the unexpected failure of asatellite could disrupt the availability of programming and services, which could reduce the demand for, orcustomer satisfaction with, our products.
18

We rely upon spread spectrum communications technology developed by ViaSat and transmitted by third-party satellite providers to permit two-way broadband Internet via our 24-inch diameter TracPhone V7antenna, our 14.5-inch diameter TracPhone V3 antenna, and our 1-meter diameter TracPhone V11, andany disruption in the availability of this technology could adversely affect sales.
Our mini-VSAT Broadband service relies on spread spectrum technology developed with ViaSat, Inc., foruse with satellite capacity controlled by SES, Eutelsat, Sky Perfect-JSAT, GE Satellite, Telesat, Echostar, Intelsatand Star One. Our TracPhone two-way broadband satellite terminals combines our stabilized antenna technologywith ViaSat’s ArcLight spread spectrum mobile broadband technology, along with ViaSat’s ArcLight spreadspectrum modem. The ArcLight technology is also integrated within the satellite hubs that support this service.Sales of the TracPhone V3, V7 and V11 and our mini-VSAT Broadband service could be disrupted if we fail toreceive approval from regulatory authorities to provide our spread spectrum service in the waters of variouscountries where our customers operate or if there are issues with the availability of the ArcLight maritimemodems.
High fuel prices, tight credit availability, environmental concerns and ongoing low levels of consumerconfidence are adversely affecting sales of our mobile satellite TV products.
Factors such as high fuel prices, tight credit, environmental protection laws and ongoing low levels ofconsumer confidence can materially and adversely affect sales of larger vehicles and vessels for which ourmobile satellite TV products are designed. Many customers finance their purchases of these vehicles and vessels,and tightened credit availability can reduce demand for both these vehicles and vessels and our mobile satelliteTV products. Moreover, in the current credit markets, financing for these purchases has sometimes beenunavailable or more difficult to obtain. The increased cost of operating these vehicles and vessels can adverselyaffect demand for our mobile satellite TV products.
We may continue to increase the use of international suppliers to source components for ourmanufacturing operations, which could disrupt our business.
Although we have historically manufactured and sourced raw materials for the majority of our productsdomestically, in order for us to compete with lower priced competitive products while also improving ourprofitability, we have found it desirable to source raw materials and manufactured components and assembliesfrom Europe, Asia and South America. Our increased reliance on foreign manufacturing and/or raw materialsupply has lengthened our supply chain and increased the risk that a disruption in that supply chain could have amaterial adverse effect on our operations and financial performance.
We have single dedicated manufacturing facilities for each of our mobile communications and guidanceand stabilization product categories, and any significant disruption to a facility could impair our ability todeliver our products.
Excluding the CommBox product, which we manufacture in Norway, we currently manufacture all of ourmobile communications products at our manufacturing facility in Middletown, Rhode Island, and the majority ofour guidance and stabilization products at our facility in Tinley Park, Illinois. Some of our production processes arecomplex, and we may be unable to respond rapidly to the loss of the use of either production facility. For example,our production facilities use some specialized equipment that may take time to replace if they are damaged orbecome unusable for any reason. In that event, shipments would be delayed, which could result in customer ordealer dissatisfaction, loss of sales and damage to our reputation. Finally, we have only a limited capability toincrease our manufacturing capacity in the short term. If short-term demand for our products exceeds ourmanufacturing capacity, our inability to fulfill orders in a timely manner could also lead to customer or dealerdissatisfaction, loss of sales and damage to our reputation.
19

We depend on sole or limited source suppliers, and any disruption in supply could impair our ability todeliver our products on time or at expected cost.
We obtain many key components for our products from third-party suppliers, and in some cases we use asingle or a limited number of suppliers. Any interruption in supply could impair our ability to deliver our productsuntil we identify and qualify a new source of supply, which could take several weeks, months or longer and couldincrease our costs significantly. Suppliers might change or discontinue key components, which could require us tomodify our product designs. For example, in the past, we have experienced changes in the chemicals used to coatour optical fiber, which changed its characteristics and thereby necessitated design modifications. In general, we donot have written long-term supply agreements with our suppliers but instead purchase components through purchaseorders, which expose us to potential price increases and termination of supply without notice or recourse. It isgenerally not our practice to carry significant inventories of product components, and this could magnify the impactof the loss of a supplier. If we are required to use a new source of materials or components, it could also result inunexpected manufacturing difficulties and could affect product performance and reliability. In addition, from timeto time, lead times for certain components can increase significantly due to imbalances in overall market supply anddemand. This, in turn, could limit our ability to satisfy the demand for certain of our products on a timely basis, andcould result in some customer orders being rescheduled or canceled.
Any failure to maintain and expand our third-party distribution relationships may limit our ability topenetrate markets for mobile communications products.
We market and sell our mobile communications products through an international network of independentretailers, chain stores and distributors, as well as to manufacturers of marine vessels and recreational vehicles. If weare unable to maintain or improve our distribution relationships, it could significantly limit our sales. Some of ourdistribution relationships are new, and our new distributors may not be successful in marketing and selling ourproducts and services. In addition, our distribution partners may sell products of other companies, includingcompeting products, and are generally not required to purchase minimum quantities of our products.
If we are unable to improve our existing mobile communications and guidance and stabilization productsand develop new, innovative products, our sales and market share may decline.
The markets for mobile communications products and guidance and stabilization products are each characterizedby rapid technological change, frequent new product innovations, changes in customer requirements and expectations,and evolving industry standards. If we fail to make innovations in our existing products and reduce the costs of ourproducts, our market share may decline. Products using new technologies, or emerging industry standards, couldrender our products obsolete. If our competitors successfully introduce new or enhanced products that eliminatetechnological advantages our products may have in a market or otherwise outperform our products, or are perceived byconsumers as doing so, we may be unable to compete successfully in the markets affected by these changes.
If we cannot effectively manage changes in our rate of growth, our business may suffer.
We have previously expanded our operations to pursue existing and potential market opportunities, and we arecontinuing to expand our international operations. For example, we recently opened a new sales office in Japan toservice local customers. This growth placed a strain on our personnel, management, financial and other resources. Ourguidance and stabilization product revenue decreased significantly during 2011 and then increased slightly from 2011to 2012. Our mobile communications product revenue showed no growth between 2010 and 2011 but then increasedfrom 2011 to 2012. If any portion of our business grows more rapidly than we anticipate and we fail to manage thatgrowth properly, we may incur unnecessary expenses, and the efficiency of our operations may decline. If we areunable to adjust our operating expenses on a timely basis in response to changes in revenue cycles, our results ofoperations may be harmed. To manage changes in our rate of growth effectively, we must, among other things:
• match our manufacturing facilities and capacity to demand for our products in a timely manner;
• successfully attract, train, motivate and manage appropriate numbers of employees for manufacturing,sales and customer support activities;
20

• effectively manage our inventory and working capital; and
• improve the efficiencies within our operating, administrative, financial and accounting systems, andour procedures and controls.
We identified a material weakness in our internal control over financial reporting as of December 31,2012, and the occurrence of this or any other material weakness could have a material adverse effect onour ability to report accurate financial information in a timely manner.
Our management recently concluded that, as described under the heading “Item 9A. Controls and Procedures,”we had a material weakness as of December 31, 2012 and therefore did not maintain effective internal control overfinancial reporting or effective disclosure controls and procedures, both of which are requirements of the SecuritiesExchange Act of 1934, as of that date. The material weakness related to our failure to detect misappropriation offunds by an employee whose employment has been terminated. Although we concluded that the amountmisappropriated was not material to our financial statements, it is possible that the internal controls in place on thatdate would not have detected a larger misappropriation that would have been material to our financial statements. Inany event, the existence of the material weakness prevented us from filing this annual report on Form 10-K on orbefore its due date. We have implemented additional controls, and are taking additional steps, to remediate thematerial weakness. However, the remedial measures we have taken may not be adequate to prevent futuremisappropriation or avoid other control deficiencies or material weaknesses. The effectiveness of our internalcontrol over financial reporting is subject to various inherent limitations, including cost limitations, judgments usedin decision making, assumptions about the likelihood of future events, the soundness of our systems, the possibilityof human error, and the risk of fraud. Moreover, projections of any evaluation of effectiveness to future periods aresubject to the risk that controls may become inadequate because of changes in conditions and the risk that thedegree of compliance with policies or procedures may deteriorate over time. Because of these limitations, there canbe no assurance that any system of or internal control over financial reporting will be successful in preventing allerrors or fraud or in making all material information known in a timely manner to the appropriate levels ofmanagement. As a result, it is possible that our financial statements will not comply with generally acceptedaccounting principles, will contain a material misstatement or will not be available on a timely basis, any of whichcould cause investors to lose confidence in us and lead to, among other things, unanticipated legal, accounting andother expenses, delays in filing required financial disclosures, enforcement actions by government authorities, fines,penalties, the delisting of our common stock and liabilities arising from stockholder litigation.
We may be unable to hire and retain the skilled personnel we need to expand our operations.
To meet our growth objectives, we must attract and retain highly skilled technical, operational, managerialand sales and marketing personnel. If we fail to attract and retain the necessary personnel, we may be unable toachieve our business objectives and may lose our competitive position, which could lead to a significant declinein net sales. We face significant competition for these skilled professionals from other companies, research andacademic institutions, government entities and other organizations.
Our success depends on the services of our executive officers.
Our future success depends to a significant degree on the skills and efforts of Martin Kits van Heyningen,our co-founder, President, Chief Executive Officer, and Chairman of the Board. If we lost the services ofMr. Kits van Heyningen, our business and operating results could be seriously harmed. We also depend on theability of our other executive officers to work effectively as a team. The loss of one or more of our executiveofficers could impair our ability to manage our business effectively.
Our international business operations expose us to a number of difficulties in coordinating our activitiesabroad and in dealing with multiple regulatory environments.
Historically, sales to customers outside the United States and Canada have accounted for a significantportion of our net sales. We have foreign sales offices in Denmark, Singapore, Japan and Norway, as well as a
21

subsidiary in Brazil that manages local sales. We otherwise support our international sales from our operations inthe United States. Our limited operations in foreign countries may impair our ability to compete successfully ininternational markets and to meet the service and support needs of our customers in countries where we havelittle to no infrastructure. We are subject to a number of risks associated with our international business activities,which may increase our costs and require significant management attention. These risks include:
• technical challenges we may face in adapting our mobile communications products to function withdifferent satellite services and technology in use in various regions around the world;
• satisfaction of international regulatory requirements and delays and costs associated with procurementof any necessary licenses or permits;
• restrictions on the sale of certain guidance and stabilization products to foreign military andgovernment customers;
• increased costs of providing customer support in multiple languages;
• increased costs of managing operations that are international in scope;
• potentially adverse tax consequences, including restrictions on the repatriation of earnings;
• protectionist laws and business practices that favor local competitors, which could slow our growth ininternational markets;
• potentially longer sales cycles, which could slow our revenue growth from international sales;
• potentially longer accounts receivable payment cycles and difficulties in collecting accountsreceivable;
• losses arising from foreign currency exchange rate fluctuations; and
• economic and political instability in some international markets.
Exports of certain guidance and stabilization products are subject to the International Traffic in ArmsRegulations and require a license from the U.S. Department of State prior to shipment.
We must comply with the United States Export Administration Regulations and the International Traffic inArms Regulations, or ITAR. Certain of our products have military or strategic applications and are on themunitions list of the ITAR and require an individual validated license in order to be exported to certainjurisdictions. Any changes in export regulations may further restrict the export of our products, and we maycease to be able to procure export licenses for our products under existing regulations. The length of timerequired by the licensing process can vary, potentially delaying the shipment of products and the recognition ofthe corresponding revenue. Any restriction on the export of a product line or any amount of our products couldcause a significant reduction in net sales.
Our business may suffer if we cannot protect our proprietary technology.
Our ability to compete depends significantly upon our patents, our source code and our other proprietarytechnology. The steps we have taken to protect our technology may be inadequate to prevent others from usingwhat we regard as our technology to compete with us. Our patents could be challenged, invalidated orcircumvented, and the rights we have under our patents could provide no competitive advantages. Existing tradesecrets, copyright and trademark laws offer only limited protection. In addition, the laws of some foreigncountries do not protect our proprietary technology to the same extent as the laws of the United States, whichcould increase the likelihood of misappropriation. Furthermore, other companies could independently developsimilar or superior technology without violating our intellectual property rights. Any misappropriation of ourtechnology or the development of competing technology could seriously harm our competitive position, whichcould lead to a substantial reduction in net sales.
22
If we resort to legal proceedings to enforce our intellectual property rights, the proceedings could beburdensome, disruptive and expensive, distract the attention of management, and there can be no assurance thatwe would prevail.
Also, we have delivered certain technical data and information to the U.S. government under procurementcontracts, and it may have unlimited rights to use that technical data and information. There can be no assurancethat the U.S. government will not authorize others to use that data and information to compete with us.
Claims by others that we infringe their intellectual property rights could harm our business and financialcondition.
Our industries are characterized by the existence of a large number of patents and frequent claims andrelated litigation regarding patent and other intellectual property rights. We cannot be certain that our products donot and will not infringe issued patents, patents that may be issued in the future, or other intellectual propertyrights of others.
We do not generally conduct exhaustive patent searches to determine whether the technology used in ourproducts infringes patents held by third parties. In addition, product development is inherently uncertain in arapidly evolving technological environment in which there may be numerous patent applications pending, manyof which are confidential when filed, with regard to similar technologies.
From time to time we have faced claims by third parties that our products or technology infringe theirpatents or other intellectual property rights, and we may face similar claims in the future. Any claim ofinfringement could cause us to incur substantial costs defending against the claim, even if the claim is invalid,and could distract the attention of our management. If any of our products are found to violate third-partyproprietary rights, we may be required to pay substantial damages. In addition, we may be required to re-engineerour products or obtain licenses from third parties to continue to offer our products. Any efforts to re-engineer ourproducts or obtain licenses on commercially reasonable terms may not be successful, which would prevent usfrom selling our products, and, in any case, could substantially increase our costs and have a material adverseeffect on our business, financial condition and results of operations.
Cybersecurity breaches could expose us to liability, damage our reputation, require us to incur significantcosts or otherwise adversely affect our financial results.
We retain sensitive data, including intellectual property, proprietary business information and personallyidentifiable information of our employees and customers on our computer networks. Although we take protectivemeasures and endeavor to modify them as circumstances warrant, our computer systems, software and networksmay be vulnerable to unauthorized access, misuse, computer viruses or other malicious code and other eventsthat could have a security impact. Any security breach may compromise information stored on our networks andmay result in significant data losses or theft of our, our customers’, our business partners’ or our employees’intellectual property, proprietary business information or personally identifiable information.
If any of these events were to occur, they could lead to the loss of sensitive information, cause us to loseexisting customers and fail to attract new customers, as well as subject us to regulatory actions, litigation, fines ordamage to our reputation, and could have a material adverse effect on our financial position, results of operationsor cash flows.
Fluctuations in our quarterly net sales and results of operations could depress the market price of ourcommon stock.
We have at times experienced significant fluctuations in our net sales and results of operations from onequarter to the next. Our future net sales and results of operations could vary significantly from quarter to quarter
23

due to a number of factors, many of which are outside our control. Accordingly, you should not rely on quarter-to-quarter comparisons of our results of operations as an indication of future performance. It is possible that ournet sales or results of operations in a quarter will fall below the expectations of securities analysts or investors. Ifthis occurs, the market price of our common stock could fall significantly. Our results of operations in anyquarter can fluctuate for many reasons, including:
• changes in demand for our mobile communications products and services and guidance andstabilization products and services;
• the timing and size of individual orders from military customers;
• the mix of products we sell;
• our ability to manufacture, test and deliver products in a timely and cost-effective manner, includingthe availability and timely delivery of components and subassemblies from our suppliers;
• our success in winning competitions for orders;
• the timing of new product introductions by us or our competitors;
• expense incurred in pursuing acquisitions;
• market and competitive pricing pressures;
• general economic climate; and
• seasonality of pleasure boat and recreational vehicle usage.
A large portion of our expenses, including expenses for network infrastructure, facilities, equipment, andpersonnel, are relatively fixed. Accordingly, if our net sales decline or do not grow as much as we anticipate, wemight be unable to maintain or improve our operating margins. Any failure to achieve anticipated net sales couldtherefore significantly harm our operating results for a particular fiscal period.
We may have exposure to additional tax liabilities, which could negatively impact our income tax expense,net income and cash flow.
We are subject to income taxes and other taxes in both the U.S. and the foreign jurisdictions in which wecurrently operate. The determination of our worldwide provision for income taxes and current and deferred taxassets and liabilities requires judgment and estimation. In the ordinary course of our business, there are manytransactions and calculations where the ultimate tax determination is uncertain. We are subject to regular reviewand audit by both domestic and foreign tax authorities and to the prospective and retrospective effects ofchanging tax regulations and legislation. Although we believe our tax estimates are reasonable, the ultimate taxoutcome may materially differ from the tax amounts recorded in our consolidated financial statements and maymaterially affect our income tax benefit or expense, net loss or income, and cash flows in the period in whichsuch determination is made.
Deferred tax assets are recognized for the expected future tax consequences of temporary differencesbetween the financial reporting and tax bases of assets and liabilities, and for operating losses and tax credit carryforwards. A valuation allowance reduces deferred tax assets to estimated realizable value, which assumes that itis more likely than not that we will be able to generate sufficient future taxable income to realize the net carryingvalue. We review our deferred tax assets and valuation allowance on a quarterly basis. As part of our review, weconsider positive and negative evidence, including cumulative results in recent years.
If, during our quarterly reviews of our deferred tax assets, we determine that it is more likely than not thatwe will not be able to generate sufficient future taxable income to realize the net carrying value of our deferredtax assets, we will record a valuation allowance to reduce the tax assets to estimated realizable value. This couldresult in a material income tax charge.
24

The market price of our common stock may be volatile.
Our stock price has historically been volatile. During the period from January 1, 2011 to December 31,2012, the trading price of our common stock ranged from $6.90 to $16.68. Many factors may cause the marketprice of our common stock to fluctuate, including:
• variations in our quarterly results of operations;
• the introduction of new products and services by us or our competitors;
• changing needs of military customers;
• changes in estimates of our performance or recommendations by securities analysts;
• the hiring or departure of key personnel;
• acquisitions or strategic alliances involving us or our competitors;
• market conditions in our industries; and
• the global macroeconomic and geopolitical environment.
In addition, the stock market can experience extreme price and volume fluctuations. Major stock marketindices experienced dramatic declines in 2008 and in the first quarter of 2009. These fluctuations are oftenunrelated to the operating performance of particular companies. These broad market fluctuations may adverselyaffect the market price of our common stock. When the market price of a company’s stock drops significantly,stockholders often institute securities litigation against that company. Any such litigation could cause us to incursignificant expenses defending against the claim, divert the time and attention of our management and result insignificant damages.
Compliance with the SEC’s new conflict minerals rules will increase our costs and adversely affect ourresults of operations.
We are subject to the SEC’s new disclosure requirements for public companies that manufacture, or contractto manufacture, products for which certain minerals and their derivatives, namely tin, tantalum, tungsten andgold, known as “conflict minerals,” are necessary to the functionality or production of those products. Theseregulations will require us to determine which of our products contain conflict minerals and, if so, to perform anextensive inquiry into our supply chain in an effort to determine whether or not such conflict minerals originatefrom the Democratic Republic of Congo, or DRC, or an adjoining country. We expect to incur additional costs tocomply with these disclosure requirements, including costs related to determining the source of any of therelevant minerals used in our products, which will adversely affect our results of operations. Because our supplychain is complex, the due diligence procedures that we implement may not enable us to ascertain the origins ofany conflict minerals that we use or determine that these minerals did not originate from the DRC or an adjoiningcountry, which may harm our reputation. We may also face difficulties in satisfying customers who may requirethat our products be certified as DRC conflict-free, which could harm our relationships with these customers andlead to a loss of revenue. These new requirements could also have the effect of limiting the pool of suppliersfrom which we source these minerals, and we may be unable to obtain conflict-free minerals at competitiveprices, which could increase our costs and adversely affect our manufacturing operations and our profitability.
Acquisitions may disrupt our operations or adversely affect our results.
We evaluate strategic acquisition opportunities to acquire other businesses as they arise. The expenses weincur evaluating and pursuing this and other such acquisitions could have a material adverse effect on our resultsof operations. If we acquire a business, we may be unable to manage it profitably or successfully integrate itsoperations with our own. Moreover, we may be unable to realize the strategic, financial, operational and otherbenefits we anticipate from any acquisition. Competition for acquisition opportunities could increase the price we
25

pay for businesses we acquire and could reduce the number of potential acquisition targets. Further, our approachto acquisitions may involve a number of special financial and business risks, such as:
• charges related to any potential acquisition from which we may withdraw;
• diversion of our management’s time, attention, and resources;
• loss of key acquired personnel;
• increased costs to improve or coordinate managerial, operational, financial, and administrative systems,including compliance with the Sarbanes-Oxley Act of 2002;
• dilutive issuances of equity securities;
• the assumption of legal liabilities; and
• losses arising from impairment charges associated with goodwill or intangible assets.
Our charter and by-laws and Delaware law may deter takeovers.
Our certificate of incorporation, by-laws and Delaware law contain provisions that could have an anti-takeover effect and discourage, delay or prevent a change in control or an acquisition that many stockholdersmay find attractive. These provisions may also discourage proxy contests and make it more difficult for ourstockholders to take some corporate actions, including the election of directors. These provisions relate to:
• the ability of our Board of Directors to issue preferred stock, and determine its terms, without astockholder vote;
• the classification of our Board of Directors, which effectively prevents stockholders from electing amajority of the directors at any one annual meeting of stockholders;
• the limitation that directors may be removed only for cause by the affirmative vote of the holders oftwo-thirds of our shares of capital stock entitled to vote;
• the prohibition against stockholder actions by written consent;
• the inability of stockholders to call a special meeting of stockholders; and
• advance notice requirements for stockholder proposals and director nominations.
ITEM 1B. Unresolved Staff Comments
None.
ITEM 2. Properties
The following table provides information about our facilities as of December 31, 2012.
Location Type Principal Uses
ApproximateSquareFootage Ownership
LeaseExpiration
Middletown, RhodeIsland
Office Corporate headquarters, research anddevelopment, sales and service,marketing and administration
75,000 Owned —
Middletown, RhodeIsland
Plant andwarehouse
Manufacturing and warehousing(mobile communications products)
75,300 Owned —
Tinley Park, Illinois Plant andwarehouse
Manufacturing, warehousing, researchand development (guidance andstabilization products)
101,000 Owned —
26

Location Type Principal Uses
ApproximateSquareFootage Ownership
LeaseExpiration
Kokkedal, Denmark Office andwarehouse
European headquarters, sales,marketing and support
11,000 Leased May 2014
Singapore Office Asian headquarters, sales office 2,000 Leased May 2013Horten, Norway Office Research and development, sales,
marketing and support4,400 Leased December
2013Japan Office Japanese, sales office 600 Leased October
2014
ITEM 3. Legal Proceedings
From time to time, we are involved in litigation incidental to the conduct of our business. In the ordinarycourse of business, we are a party to inquiries, legal proceedings and claims including, from time to time,disagreements with vendors and customers. We are not a party to any lawsuit or proceeding that, in management’sopinion, is likely to materially harm our business, results of operations, financial condition or cash flows.
ITEM 4. Mine Safety Disclosures
Not applicable.
PART II
ITEM 5. Market for Registrant’s Common Equity, Related Stockholder Matters and Issuer Purchasesof Equity Securities
Market Information. Our common stock trades on the NASDAQ Global Market under the symbol “KVHI”.The following table provides, for the periods indicated, the high and low sale prices for our common stock asreported on the NASDAQ Global Market.
High Low
Year Ended December 31, 2012:First quarter $10.98 $ 7.61Second quarter 12.95 8.51Third quarter 14.50 11.70Fourth quarter 14.66 10.38
Year Ended December 31, 2011:First quarter $15.53 $11.40Second quarter 16.68 10.27Third quarter 12.24 7.26Fourth quarter 8.62 6.90
Stockholders. As of March 28, 2013, we had 91 holders of record of our common stock. This number doesnot include stockholders for whom shares were held in a nominee or “street” name.
Dividends. We have never declared or paid cash dividends on our capital stock, and we have no plan to payany cash dividends in the foreseeable future. We currently intend to retain any future earnings to finance ouroperations and future growth. In addition, the terms of our bank line of credit place restrictions on our ability topay cash dividends on our common stock.
Issuer Purchases of Equity Securities. On November 26, 2008, our Board of Directors authorized a programto repurchase up to one million shares of our common stock. The repurchase program is funded using ourexisting cash, cash equivalents, marketable securities and future cash flows. Under the repurchase program, at
27
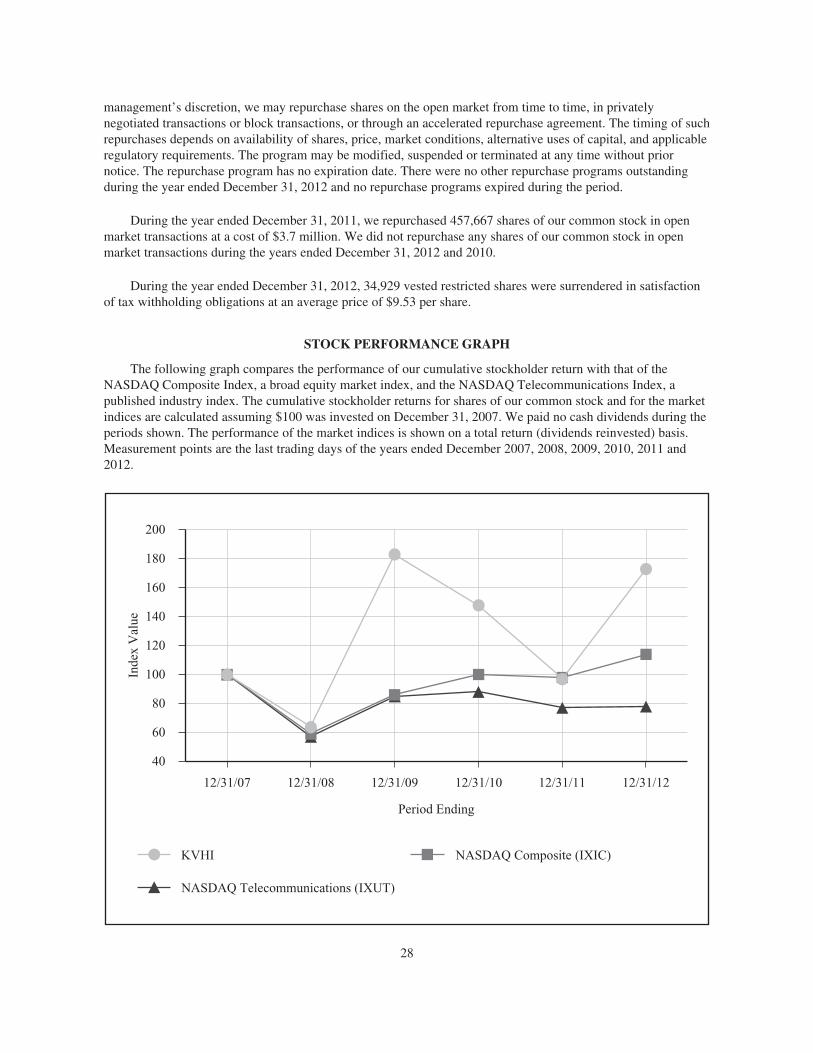
management’s discretion, we may repurchase shares on the open market from time to time, in privatelynegotiated transactions or block transactions, or through an accelerated repurchase agreement. The timing of suchrepurchases depends on availability of shares, price, market conditions, alternative uses of capital, and applicableregulatory requirements. The program may be modified, suspended or terminated at any time without priornotice. The repurchase program has no expiration date. There were no other repurchase programs outstandingduring the year ended December 31, 2012 and no repurchase programs expired during the period.
During the year ended December 31, 2011, we repurchased 457,667 shares of our common stock in openmarket transactions at a cost of $3.7 million. We did not repurchase any shares of our common stock in openmarket transactions during the years ended December 31, 2012 and 2010.
During the year ended December 31, 2012, 34,929 vested restricted shares were surrendered in satisfactionof tax withholding obligations at an average price of $9.53 per share.
STOCK PERFORMANCE GRAPH
The following graph compares the performance of our cumulative stockholder return with that of theNASDAQ Composite Index, a broad equity market index, and the NASDAQ Telecommunications Index, apublished industry index. The cumulative stockholder returns for shares of our common stock and for the marketindices are calculated assuming $100 was invested on December 31, 2007. We paid no cash dividends during theperiods shown. The performance of the market indices is shown on a total return (dividends reinvested) basis.Measurement points are the last trading days of the years ended December 2007, 2008, 2009, 2010, 2011 and2012.
12/31/07 12/31/08 12/31/09 12/31/10 12/31/11 12/31/12
40
60
80
100
120
140
160
180
200
KVHI NASDAQ Composite (IXIC)
NASDAQ Telecommunications (IXUT)
Period Ending
Inde
x V
alue
28

Value of investments as of December 31,
2007 2008 2009 2010 2011 2012
KVH Industries, Inc. $100 $64 $183 $148 $97 $173NASDAQ Composite 100 59 86 100 98 114NASDAQ Telecommunications 100 57 85 88 77 78
ITEM 6. Selected Financial Data
We have derived the following selected financial data from our audited consolidated financial statements.You should read this data in conjunction with “Item 7. Management’s Discussion and Analysis of FinancialCondition and Results of Operations” and “Item 8. Financial Statements and Supplementary Data.”
In September 2010, we acquired Virtek Communication for approximately $6.5 million. See note 1 to ourconsolidated financial statements for a summary of significant accounting policies and the effects on the year-to-year comparability of the selected financial data.
Year Ended December 31,
2012 2011 2010 2009 2008
(in thousands, except per share data)
Consolidated Statement of Operations Data:Sales:
Product $ 90,677 $ 85,136 $ 92,059 $75,191 $69,941Service 46,435 27,400 20,184 13,869 12,463
Net sales 137,112 112,536 112,243 89,060 82,404Costs and expenses:
Costs of product sales 51,775 46,598 51,348 46,552 42,552Costs of service sales 30,363 20,970 16,086 10,198 6,130Research and development 12,147 11,548 10,715 8,805 7,655Sales, marketing and support 24,069 23,473 18,469 16,316 16,162General and administrative 12,188 10,555 10,084 7,832 7,035
Total costs and expenses 130,542 113,144 106,702 89,703 79,534
Income (loss) from operations 6,570 (608) 5,541 (643) 2,870Interest income 510 297 301 358 1,220Interest expense 323 223 204 89 153Other income (expense) 86 910 23 (20) (231)
Income (loss) before income taxes 6,843 376 5,661 (394) 3,706Income tax expense (benefit) 3,262 (484) (2,612) (261) 648
Net income (loss) $ 3,581 $ 860 $ 8,273 $ (133) $ 3,058
Per share information:Net income (loss) per common share, basic 0.24 0.06 0.57 (0.01) 0.21
Net income (loss) per common share, diluted 0.24 0.06 0.56 (0.01) 0.21
Number of shares used in per share calculation:Basic 14,777 14,768 14,420 13,996 14,373
Diluted 15,019 15,072 14,850 13,996 14,377
29

December 31,
2012 2011 2010 2009 2008
(in thousands)
Consolidated Balance Sheet Data:Cash, cash equivalents and marketable securities $ 38,285 $ 30,570 $ 37,307 $41,304 $42,660Working capital 65,242 59,778 60,571 60,690 58,222Total assets 137,568 128,556 115,198 97,746 93,758Line of credit 7,000 9,000 — — —Long-term debt, excluding current portion 3,414 3,553 3,684 3,807 —Other long-term obligations 139 135 1,263 902 —Total stockholders’ equity 105,704 96,668 96,303 81,600 79,069
ITEM 7. Management’s Discussion and Analysis of Financial Condition and Results of Operations
The following discussion and analysis should be read in conjunction with the other financial informationand consolidated financial statements and related notes appearing elsewhere in this annual report. Thisdiscussion contains forward-looking statements that involve risks and uncertainties. Our actual results coulddiffer materially from those anticipated in the forward-looking statements as a result of a variety of factors,including those discussed under the heading “Item 1A. Risk Factors” and elsewhere in this annual report.
Overview
We design, develop, manufacture and market mobile communications products for the marine, land mobileand aeronautical markets, and navigation, guidance and stabilization products for both the defense andcommercial markets.
Our mobile communications products enable customers to receive voice and Internet services and livedigital television via satellite services in marine vessels, recreational vehicles and automobiles as well as livedigital television on commercial airplanes while in motion. Our CommBox offers a range of tools designed toincrease communication efficiency, reduce costs, and manage network operations. We sell our mobilecommunications products through an extensive international network of retailers, distributors and dealers. Wealso lease products directly to end users.
We offer precision fiber optic gyro-based (FOG) systems that enable platform and optical stabilization,navigation, pointing and guidance. Our guidance and stabilization products also include tactical navigationsystems that provide uninterrupted access to navigation and pointing information in a variety of military vehicles,including tactical trucks and light armored vehicles. Our guidance and stabilization products are sold directly toU.S. and allied governments and government contractors, as well as through an international network ofauthorized independent sales representatives. In addition, our guidance and stabilization products have numerouscommercial applications such as precision mapping, dynamic surveying, autonomous vehicles, train locationcontrol and track geometry measurement systems, industrial robotics and optical stabilization.
Our mobile communications service sales include sales earned from satellite voice and Internet airtimeservices, engineering services provided under development contracts, sales from product repairs, and certainDIRECTV account subsidies and referral fees earned in conjunction with the sale of our products and extendedwarranty sales. We provide, for monthly fixed and usage fees, satellite connectivity services for broadbandInternet, data and Voice over Internet Protocol (VoIP) service to our TracPhone V-series customers. We alsoearn monthly usage fees for third-party satellite connectivity for voice, data and Internet services to our InmarsatTracPhone customers who choose to activate their subscriptions with us. Under current DIRECTV programs, weare eligible to receive a one-time commission for each DIRECTV receiver activated for service and a new mobileaccount activation fee from DIRECTV for each customer who activates their DIRECTV service directly throughus. Our service sales have grown from 18% of our net sales in 2010 to 24% in 2011 to 34% in 2012.
30

Our guidance and stabilization service sales include engineering services provided under developmentcontracts, product repairs and extended warranty sales.
We generate sales primarily from the sale of our mobile satellite systems and services and our guidance andstabilization products and services. The following table provides, for the periods indicated, our sales by industrycategory:
Year Ended December 31,
2012 2011 2010
(in thousands)Mobile communications $ 87,685 $ 70,202 $ 62,473Guidance and stabilization 49,427 42,334 49,770
Net sales $137,112 $112,536 $112,243
Net sales to SANG accounted for approximately 11% of our net sales for the year ended December 31,2012, driven by a TACNAV related order received in 2012 for which the majority of the deliverables will becompleted in 2013. Net sales to General Dynamics Land Systems—Canada (General Dynamics) accounted forapproximately 11% of our net sales for the year ended December 31, 2011, and less than 10% of our net sales foreach of the years ended December 31, 2012 and 2010, respectively. The decrease in net sales to GeneralDynamics from 2011 to 2012 was primarily driven by the timing of deliverables in fulfillment of large TACNAVrelated order. Net sales to Kongsberg accounted for approximately 14% of our net sales for the year endedDecember 31, 2010. In addition, net sales to a subcontractor to Kongsberg accounted for approximately 5% ofour net sales for the year ended December 31, 2010. Net sales to Kongsberg, including the subcontractor forKongsberg, were less than 10% of our net sales for the years ended December 31, 2012 and 2011, respectively.The decrease in net sales to Kongsberg and this subcontractor was primarily driven by a slowdown of the U.S.Army’s procurement of Common Remotely Operated Weapon Stations (CROWS) under existing contracts. Theterms and conditions of sales to SANG, General Dynamics, Kongsberg and the subcontractor to Kongsberg areconsistent with our standard terms and conditions of product sales as discussed in note 1 of our consolidatedfinancial statements. The SANG receivable balance was current as of December 31, 2012 and the outstandingreceivable balance has been paid as of the date of this report. No other customer accounted for more than 10% ofour net sales for each of the years ended December 31, 2012, 2011 and 2010, respectively.
We have historically derived a substantial portion of our revenue from sales to customers located outside theUnited States and Canada. The following table provides, for the periods indicated, sales to specified geographicregions:
Year Ended December 31,
2012 2011 2010
(in thousands)Originating from the Americas locations
United States $ 71,489 $ 62,748 $ 70,620Canada 11,513 17,518 5,923Europe 12,210 8,315 17,892Other 22,202 7,143 3,950
Total Americas 117,414 95,724 98,385Originating from European and Asian locations
Europe 15,255 13,244 10,398Other 4,443 3,568 3,460
Total Europe and Asia 19,698 16,812 13,858
Net sales $137,112 $112,536 $112,243
See note 12 to our consolidated financial statements for more information on our geographic segments.
31

In addition to our internally funded research and development efforts, we also conduct research anddevelopment activities that are funded by our customers. These activities relate primarily to engineering studies,surveys, prototype development, program management and standard product customization. In accordance withaccounting principles generally accepted in the United States of America, we account for customer-fundedresearch as service revenue, and we account for the associated research and development costs as costs of serviceand product sales. As a result, customer-funded research and development are not included in the research anddevelopment expense that we present in our statement of operations. The following table presents our totalannual research and development effort, representing the sum of research costs of service and product sales andthe operating expense of research and development as described in our statement of operations. Our managementbelieves this information is useful because it provides a better understanding of our total expenditures on researchand development activities.
Year ended December 31,
2012 2011 2010
(in thousands)
Research and development expense presented on the statement of operations $12,148 $11,548 $10,715Costs of customer-funded research and development included in costs of service
sales 3,424 412 953Costs of customer-funded research and development included in costs of product
sales — — 1,001
Total consolidated statements of operations expenditures on research anddevelopment activities $15,572 $11,960 $12,669
As of December 31, 2012, we had approximately $38.3 million in cash, cash equivalents and marketablesecurities and accumulated earnings of approximately $7.3 million.
Results of Operations
The following table provides, for the periods indicated, certain financial data expressed as a percentage ofnet sales:
Year Ended December 31,
2012 2011 2010
Sales:Product 66.1% 75.6% 82.0%Service 33.9 24.4 18.0
Net sales 100.0 100.0 100.0Costs and expenses:
Costs of product sales 37.8 41.4 45.8Costs of service sales 22.1 18.6 14.3Research and development 8.9 10.2 9.5Sales, marketing and support 17.6 20.9 16.5General and administrative 8.9 9.4 9.0
Total costs and expenses 95.3 100.5 95.1
Income (loss) from operations 4.7 (0.5) 4.9Interest income 0.4 0.3 0.3Interest expense 0.2 0.2 0.2Other income 0.1 0.8 —
Income before income taxes 5.0 0.4 5.0Income tax (expense) benefit (2.4) 0.4 2.4
Net income 2.6% 0.8% 7.4%
32
Years ended December 31, 2012 and 2011
Net Sales
Product sales increased in 2012 by $5.5 million, or 7%, to $90.7 million from $85.1 million in 2011. Theprimary reason for the increase in 2012 was an increase in sales of our mobile communications products of $4.3million, or 10%. The increase was primarily due to an increase in sales of our marine products of $5.7 million, or15%, driven primarily by increased demand for our TracPhone V7 and TracPhone V3 products, as well as ournew HD11 and TracPhone V11 products that were released in first quarter of 2012 and the fourth quarter of2012, respectively. Also contributing to the marine products increase was increased sales of our HD7 product.Partially offsetting this increase was a decrease in land mobile products of $1.3 million, or 20%. The decrease inour land mobile products was primarily a result of decreased sales to original equipment manufacturers in therecreational vehicle market. We remain cautious about the prospects for our leisure mobile communicationsproduct sales as a result of ongoing challenges in the global economy. However, we expect our mini-VSATproduct revenue will continue to grow year-over-year.
Mobile communications product sales originating from the Americas increased $2.2 million, or 8%, in 2012as compared to 2011. Mobile communications product sales originating from our European and Asiansubsidiaries increased $2.1 million, or 13%, in 2012 as compared to 2011.
Also contributing to the increase in product sales was an increase of $1.3 million, or 3%, in sales ofguidance and stabilization products. Specifically, sales of our TACNAV defense products increased $1.0 million,or 5%, primarily as a result of product sales related to the previously announced SANG contract. Alsocontributing to the increase in sales of our guidance and stabilization products was an increase in sales of ourFOG products of $0.7 million, or 3%. Although we expect that TACNAV sales will continue to grow over thelong term, sales on a quarter-to-quarter or a year-to-year basis could continue to be very uneven. Largely as aresult of uncertainty regarding future military expenditures, we expect our TACNAV product sales will declinein 2013 from 2012. Subject to the disruptions that may arise from federal budgetary pressures, we expect ourFOG sales to increase on a year-over-year basis as we begin to receive orders under the U.S. Army’sprocurement of Common Remotely Operated Weapon Stations (CROWS) III program.
Service sales increased in 2012 by $19.0 million, or 69%, to $46.4 million from $27.4 million in 2011. Theprimary reason for the increase was a $12.6 million increase in airtime sales for our mini-VSAT Broadbandservice. Also contributing to the increase was a $4.4 million increase in contracted engineering services drivenprimarily by the SANG order and a separate TACNAV-related development effort, as well as contracted aviationantenna services, and a $1.9 million increase in service repair sales. We expect our mini-VSAT Broadbandservice revenue will continue to grow year-over-year, although at a slower rate of growth than we experiencedfrom 2011 to 2012. We also expect that a portion of our services revenue in 2013 will be derived from very lowmargin contracted engineering services related to the SANG order.
Costs of Sales
Our costs of product sales consist primarily of materials, manufacturing overhead and direct labor used toproduce our products. Costs of product sales in 2012 increased by $5.2 million, or 11%, to $51.8 million from$46.6 million in 2011. The primary reason for the increase in costs of product sales was the increase in sales ofour mobile communications products discussed above.
Our costs of service sales consist primarily of satellite service capacity, depreciation and service networkoverhead expense associated with our mini-VSAT Broadband network infrastructure, direct network servicelabor, engineering and related direct costs associated with customer-funded research and development, servicematerial and direct labor associated with non-warranty product repairs, as well as Inmarsat service costs. Costs ofservice sales increased by $9.4 million, or 45%, to $30.4 million in 2012 from $21.0 million in 2011. Theprimary reason for the increase was a $5.3 million increase in airtime costs of sales for our mini-VSAT
33

Broadband service. Also contributing to the increase was a $3.0 million increase in engineering services costs ofsales due primarily to the services provided in connection with the SANG contract as well as a $0.9 millionincrease in cost of service repair sales.
Gross margin from product sales decreased in 2012 to 43% from 45% in 2011. The decrease in our grossmargin from product sales was primarily due to the increase in mobile communications product sales discussedabove, which generally have lower margins than our TACNAV defense products.
Gross margin from service sales increased in 2012 to 35% from 23% in 2011. The increase in our grossmargin from service sales was primarily due to the increase in gross margin for mini-VSAT Broadband servicesales, which increased in 2012 to 31% from 15% in 2011. Although we expect that mini-VSAT Broadbandservice revenue will continue to grow year-over-year, we do not anticipate the same year-over-year increase ingross margin percentage. This expectation is driven by the larger mini-VSAT Broadband customer installationbase as of January 1, 2013 compared to January 1, 2012. This larger installed base requires a much largerincrease in growth in customer installations in order to generate a year-over-year improvement in gross marginpercentage comparable to that realized in 2012 from 2011. Partially offsetting the increase in gross margin for themini-VSAT Broadband service sales was a decrease in gross margin for contracted engineering services as aresult of facility construction services and project management services in Saudi Arabia, as these services underthe SANG contract had a gross margin of approximately 10%. We anticipate the gross margin percentage forcontracted engineering services will continue to decrease for the next several quarters as a result of the facilityconstruction and project management services portion of the SANG TACNAV contract. The contract value forthe services portion of the SANG TACNAV order remaining to be performed as of January 1, 2013 isapproximately $11.0 million. These project management services are estimated to continue to be performed wellinto 2014.
Operating Expenses
Sales, marketing and support expense consists primarily of salaries and related expenses for sales andmarketing personnel, commissions for both in-house and third-party representatives, other sales and marketingsupport costs such as advertising, literature and promotional materials, product service personnel and supportcosts, warranty-related costs and bad debt expense. Sales, marketing and support expense also includes theoperating expenses of our subsidiaries in Denmark, Singapore, Brazil and Japan. Sales, marketing and supportexpense in 2012 increased by $0.6 million, or 3%, to $24.1 million from $23.5 million in 2011. The primaryreasons for the increase in 2012 were a $0.8 million increase in sales, marketing and support expense related toour Danish and Singaporean subsidiaries driven by the international expansion of our sales channel presence forthe mini-VSAT Broadband satellite communication service, and a $0.4 million increase in variable sales expenseprimarily as a result of the sales related to the SANG TACNAV order and related facility construction thatcommenced in the third quarter of 2012. Also contributing to the increase was a $0.2 million increase in bad debtexpense, a $0.2 million increase in trade show expenses, and a $0.2 million increase in demonstration equipment.Partially offsetting these increases was a $0.4 million decrease in U.S.-based compensation for sales, marketingand support, a $0.4 million decrease in warranty expense, a $0.2 million total decrease in marketing literature andcooperative advertising, and a $0.2 million decrease in Norwegian-based compensation for sales, marketing andsupport. As a percentage of net sales, sales, marketing and support expense decreased in 2012 to 18% from 21%in 2011. We expect that our sales, marketing and support expenses will continue to grow in 2013 as we hireadditional sales, marketing and support personnel but will grow more slowly than our anticipated growth in netsales.
Research and development expense consists of direct labor, materials, external consultants and relatedoverhead costs that support our internally funded product development and product sustaining engineeringactivities. Research and development costs are generally expensed as incurred. Research and developmentexpense in 2012 increased by $0.6 million, or 5%, to $12.1 million from $11.5 million in 2011. The primaryreason for the increase in 2012 was a $0.5 million increase in U.S.-based employee compensation. Also
34

contributing to the increase was a $0.2 million increase in research and development expense related to ourNorwegian subsidiary. As a percentage of net sales, research and development expense decreased in 2012 to 9%from 10% in 2011.
General and administrative expense consists of costs attributable to management, finance and accounting,information technology, human resources, certain outside professional services and other administrative costs.General and administrative expense in 2012 increased by $1.6 million, or 15%, to $12.2 million from $10.6million in 2011. The primary reason for the increase in 2012 was a $0.9 million increase in U.S.-based employeecompensation. Also contributing to the increase was a $0.8 million increase in facility expenditures, a $0.2million increase in equipment lease expense and software maintenance expense, and a $0.1 million increase inrecruiting expense. Partially offsetting these increases was a $0.5 million decrease in legal expense. As apercentage of net sales, general and administrative expense was 9% in 2012, which was consistent with 2011.
Interest and Other Income, Net
Interest and other income, net decreased by $0.7 million to $0.3 million in 2012 from $1.0 million in 2011.The primary reason for the decrease was a $0.8 million net benefit in other income in September 2011 resultingfrom reaching agreement with LiveTV regarding the termination of our original antenna development andproduction agreement.
Income Tax (Expense) Benefit
Income tax expense increased by $3.7 million to $3.3 million as compared to an income tax benefit of $0.5million in 2011. The increase in income tax expense is primarily due to a $6.5 million increase in pre-tax income.Also, in 2011 we completed the construction of our new Rhode Island production facility, and as a result we hadfewer Rhode Island state investment tax credits in 2012. Further, Congress did not pass the 2012 federal researchand development tax credit until January 2013, which reduced our federal research and development tax creditsfor 2012. Instead, these credits will be treated as a discrete tax event that will be accounted for in the first quarterof 2013. Partially offsetting this tax expense was a reduction in income tax expense associated with windfalls fornon-qualified stock option exercises and restricted stock award vesting. We estimate that our effective tax ratefor 2013 will be in the range of 35% to 40%, subject to the tax effect of discrete events, such as stock optionexercises and restricted stock vesting.
Years ended December 31, 2011 and 2010
Net Sales
Product sales decreased in 2011 by $6.9 million, or 8%, to $85.1 million from $92.1 million in 2010. Theprimary reason for the decrease in 2011 was a decrease in sales of our guidance and stabilization products of $6.9million, or 14%. Specifically, sales of our FOG products decreased $17.9 million, or 44%, driven largely by aslowdown of the U.S. Army’s procurement of Common Remotely Operated Weapon Stations (CROWS) underexisting contracts, as the industry awaits updates on the outcome of the U.S. Army procurement for the nextCROWS program contract, which is in the solicitation phase. This decrease in FOG product sales was partiallyoffset by an increase in sales of our TACNAV defense products of $11.4 million, or 190%.
Mobile communications product sales in 2011 were $43.9 million, which was consistent with 2010. Sales ofour marine products increased $4.7 million, or 14%, driven primarily by demand for our TracPhone V3 and V7products and sales of our network management products from our Norwegian subsidiary, which was acquired inSeptember 2010. Partially offsetting this increase was a $4.3 million, or 97%, decrease in sales of our satellitetelevision antenna used on narrowbody commercial aircraft. We began shipping this antenna to LiveTV in thesecond quarter of 2009. However, this contract was terminated in March 2011, and we did not have anyshipments of this antenna to LiveTV after such termination. Sales of our land mobile products decreased $0.4million, or 5%, driven primarily by decreased sales to original equipment manufacturers in the recreationalvehicle market.
35
Mobile communications product sales originating from the Americas decreased $2.0 million, or 7%, in 2011as compared to 2010. Mobile communications product sales originating from our European and Asiansubsidiaries increased $2.0 million, or 14%, in 2011 as compared to 2010.
Service sales increased in 2011 by $7.2 million, or 36%, to $27.4 million from $20.2 million in 2010. Theprimary reason for the increase was a $7.2 million increase in airtime sales for our mini-VSAT Broadbandservice. Also contributing to the increase was a $0.3 million increase in Inmarsat service revenue. Partiallyoffsetting this increase was a $0.2 million decrease in DIRECTV account activation fees and service repair sales,primarily related to a decline in guidance and stabilization TACNAV product refurbishment and repair programs.
Costs of Sales
Costs of product sales in 2011 decreased by $4.8 million, or 9%, to $46.6 million from $51.3 million in2010. The primary reason for the decrease was the decrease in sales of FOG and aeronautical products discussedabove.
Costs of service sales increased by $4.9 million, or 30%, to $21.0 million in 2011 from $16.1 million in2010. The primary reason for the increase was a $5.7 million increase in airtime costs of sales for our mini-VSAT Broadband service. This increase was partially offset by a decrease of $0.7 million in contractedengineering services and service repair costs of sales.
Gross margin from product sales increased in 2011 to 45% from 44% in 2010. The primary reason for theincrease was the increase in TACNAV product sales discussed above.
Gross margin from service sales increased in 2011 to 23% from 20% in 2010. The increase in our grossmargin from service sales was primarily attributable to increased airtime sales for our mini-VSAT Broadbandservice and improved profitability on customer-funded engineering projects.
Operating Expenses
Sales, marketing and support expense in 2011 increased by $5.0 million, or 27%, to $23.5 million from$18.5 million in 2010. The primary reason for the increase in 2011 was a $2.5 million increase in variable salesexpense in part as a result of two large TACNAV orders that occurred in the second and fourth quarters. Alsocontributing to the increase in 2011 were costs related to the global and domestic expansion of our sales channeland support services presence for the mini-VSAT Broadband satellite communication service. Specifically, weexperienced a $1.3 million increase in sales, marketing and support expense related to our Singaporean,Norwegian, Danish and Brazilian subsidiaries, which (other than our Danish subsidiary), were incorporated oracquired during 2010, as well as a $0.5 million increase in U.S.-based compensation for sales, marketing andsupport, and a $0.3 million increase in warranty expense. As a percentage of sales, sales, marketing and supportexpense increased in 2011 to 21% from 16% in 2010.
During 2011, research and development costs were expensed as incurred, excluding the aviation antennadevelopment costs that were related to the original development project for LiveTV, which were capitalized from2009 through the second quarter of 2011 until the original antenna development and production agreement withLiveTV was terminated in March 2011. We reached an agreement with LiveTV regarding the termination of theproduction agreement in September 2011 and as a result, all such expenditures were expensed to other expense inthe third quarter. Prior to the third quarter of 2011 we had a contractual right to recover such costs. Research anddevelopment expense in 2011 increased by $0.8 million, or 8%, to $11.5 million from $10.7 million in 2010. Theprimary reason for the increase in 2011 expense was a $0.5 million decrease in customer-funded engineeringcosts for contracted engineering services. Also contributing to the increase was a $0.3 million increase inresearch and development expense related to our Norwegian subsidiary, which was acquired in September 2010.As a percentage of sales, research and development expense was 10% in 2011, which was consistent with 2010.
36

General and administrative expense in 2011 increased by $0.5 million, or 5%, to $10.6 million from $10.1million in 2010. The primary reason for the increase in 2011 expense was a $0.6 million increase in general andadministrative expenses related to our Norwegian subsidiary, which was acquired in September 2010. Alsocontributing to the increase was a $0.3 million increase in U.S.-based employee compensation for the general andadministrative department, and a $0.1 million increase in computer maintenance expense. Partially offsettingthese increases was a $0.6 million decrease in merger and acquisition costs related to the acquisition of ourNorwegian subsidiary, which was acquired in September 2010. As a percentage of sales, general andadministrative expense was 9% in 2011, which was consistent with 2010.
Interest and Other Income, Net
Interest and other income, net increased by $0.9 million to $1.0 million in 2011 from $0.1 million in 2010.The primary reason for the increase was a $0.8 million net benefit in other income resulting from reachingagreement with LiveTV relative to the termination of our original antenna development and productionagreement in September 2011.
Income Tax Benefit
The income tax benefit decreased by $2.1 million to $0.5 million in 2011 from $2.6 million in 2010. Theprimary reason for the decrease in 2011 was based upon our conclusion in 2010 that $3.3 million of our deferredtax asset valuation allowance was no longer required which led us to reverse a portion of the allowance, resultingin a substantial benefit. In 2011, our tax benefit was driven by Rhode Island state tax credits relating to theconstruction of our new production facility. Partially offsetting this tax benefit was income tax expenseassociated with tax shortfalls for non-qualified stock options expirations and certain non-qualified stock optionexercises, as well as shortfalls associated with restricted stock awards vesting in 2011 and losses in certainforeign jurisdictions for which we recorded no tax benefit.
Critical Accounting Policies and Significant Estimates
The discussion and analysis of our financial condition and results of operations are based upon ourconsolidated financial statements, which have been prepared in accordance with accounting principles generallyaccepted in the United States. The preparation of these financial statements requires us to make estimates andjudgments that affect the reported amounts of assets and liabilities, revenues and expenses, and related disclosureat the date of our financial statements. Our significant accounting policies are summarized in note 1 to ourconsolidated financial statements. The significant accounting policies that we believe are the most critical inunderstanding and evaluating our reported financial results include the following:
Revenue Recognition
Product sales. Product sales are recognized when persuasive evidence of an arrangement exists, goods areshipped, title has passed and collectability is reasonably assured. Our standard sales terms require that:
• All sales are final;
• Terms are generally Net 30;
• Shipments are tendered and shipped FOB (or as may be applicable, FCA or EXW) our plant orwarehouse; and
• Title and risk of loss or damage passes to the dealer or distributor at the point of shipment whendelivery is made to the possession of the carrier.
For certain guidance and stabilization product sales, customer acceptance or inspection may be requiredbefore title and risk of loss transfers to the customer. For those sales, revenue is recognized after transfer of titleand risk of loss and after notification of customer acceptance.
37
Under certain limited conditions, we, at our sole discretion, provide for the return of goods. No product isaccepted for return and no credit is allowed on any returned product unless we have granted and confirmed priorwritten permission by means of appropriate authorization. We establish reserves for potential sales returns,credits and allowances, and evaluate, on a monthly basis, the adequacy of those reserves based upon historicalexperience and our expectations for the future.
Multiple-element revenue arrangements. Some of our sales involve multiple-element arrangements thatinclude both hardware-related products and contracted service, or satellite connectivity. We analyze revenuearrangements with multiple deliverables to determine if the deliverables should be divided into more than oneunit of accounting. For contracts with more than one unit of accounting, we allocate the consideration we receiveamong the separate units of accounting based on a selling price hierarchy for determining the selling price ofeach deliverable, which includes: (1) vendor-specific objective evidence (VSOE) if available; (2) third-partyevidence (TPE) if VSOE is not available; and (3) best estimated selling price (BESP), if neither VSOE nor TPEis available. Best estimate selling price is determined based on prices of the deliverables if sold on a stand-alonebasis, or if not sold on a stand-alone basis, the prices we would charge if sold on a stand-alone basis. Werecognize revenue for each deliverable based on the revenue recognition policies described in this section.
We have accounted for our $35.6 million contract received in June 2012 from SANG to purchase TACNAVdefense products and services as a multiple-element arrangement. The total contract value associated withTACNAV defense products is $21.2 million for which shipments are estimated to continue through the first halfof 2013. The total contract value associated with all services is $14.4 million which are estimated to continuethrough 2014. The revenue for these services is recognized using the percentage of completion accountingmethod. Total revenue recognized on the SANG contract in 2012 was approximately $15.2 million.
Contracted service sales. We also have contracts for development, production and services activities that arerecognized primarily under the percentage of completion method of revenue recognition. The use of contractaccounting requires significant judgment relative to estimating total contract revenues and costs, includingassumptions relative to the length of time to complete the contract, the nature and complexity of the work to beperformed, and prices for subcontractor services and materials. Our estimates are based upon the professionalknowledge and experience of our engineers, program managers and other personnel, who review each long-termcontract monthly to assess the contract’s schedule, performance, technical matters and estimated cost atcompletion. A cancellation, schedule delay, or modification of a fixed-price contract which is accounted forusing the percentage of completion method may adversely affect our gross margins for the period in which thecontract is modified. Changes in estimates are applied when adjustments in estimated contract costs areidentified, such revisions may result in current period adjustments to earnings applicable to performance in priorperiods.
Satellite connectivity sales. Directly sold and re-sold satellite connectivity service for voice, data andInternet is recognized monthly based upon minutes or megabytes of traffic processed or contracted fixed feeschedules. Typically, all subscribers enter into a contracted one-year minimum service agreement. We record allsatellite connectivity service sales to subscribers as gross sales, as we are the primary obligor in the contractedservice arrangement. All associated regulatory service fees and costs are recorded net in our consolidatedfinancial statements. The accounting estimates related to the recognition of satellite connectivity service sales inour results of operations require us to make assumptions about future billing adjustments for disputes withsubscribers as well as unauthorized usage.
Accounts Receivable Allowance
Our estimate of allowance for doubtful accounts related to trade receivables is primarily based on specificand historical criteria. We evaluate specific accounts where we have information that the customer may have aninability to meet its financial obligations. We make judgments, based on facts and circumstances, regarding theneed to record a specific reserve for that customer against amounts owed to reduce the receivable to the amount
38

that we expect to collect. We also provide for a reserve based on an aging analysis of our accounts receivable.We evaluate these reserves on a monthly basis and adjust them as we receive additional information that impactsthe amount reserved. If circumstances change, we could change our estimates of the recoverability of amountsowed to us by a material amount.
We wrote off approximately $0.2 million, $0.2 million and $0.5 million of our accounts receivable in 2012,2011 and 2010, respectively. The write-offs in both years were driven largely by the financial deterioration of acouple of our mobile communications product distributors as well as a few of our airtime customers. The currenteconomic downturn could continue to adversely impact the financial condition of our customers, which couldresult in additional write-offs and increases in our allowance for doubtful accounts and have a negative impact onour results of operations.
Inventories
Inventory is valued at the lower of cost or market. We generally must order components for our productsand build inventory in advance of product shipments. We regularly review current quantities on hand, actual andprojected sales volumes and anticipated selling prices on products and write down, as appropriate, slow-movingand/or obsolete inventory to its net realizable value. In 2012, 2011 and 2010, we wrote off approximately $0.2million, $0.2 million and $0.6 million respectively, of fully reserved inventory. However, if we overestimateprojected sales or anticipated selling prices, our inventory might be overstocked or overvalued, and we wouldhave to reduce our inventory valuation accordingly.
Accounting for Income Taxes
As part of the process of preparing our financial statements, we are required to estimate our provision forincome taxes in each of the jurisdictions in which we operate. This involves estimating our actual current taxexposure, including assessing the risks associated with tax audits, together with assessing temporary differencesresulting from the different treatment of items for tax and accounting purposes. These differences result indeferred tax assets and liabilities. We assess the likelihood that our deferred tax assets will be recovered fromfuture taxable income and record a valuation allowance to reduce the deferred tax assets to an amount that, in ourjudgment, is more likely than not to be recovered.
Management judgment is required in determining our provision for income taxes, our deferred tax assetsand liabilities, and any valuation allowance recorded against our deferred tax assets. The valuation allowance isbased on our estimates of future taxable income and the period over which we expect the deferred tax assets to berecovered. Our assessment of future taxable income is based on historical experience and current and anticipatedmarket and economic conditions and trends. In the event that actual results differ from these estimates or weadjust our estimates in the future, we may need to adjust our valuation allowance, which could materially impactour consolidated financial position and results of operations. For example, in the year ended December 31, 2010,we determined that a $3.3 million reversal of our valuation allowance was appropriate, which resulted in asubstantial income tax benefit. At December 31, 2012, we had valuation allowances of $2.1 million to offsetgross deferred tax assets of $10.4 million.
Warranty Provision
We typically offer a one to two year warranty for all of our base products. We provide for the estimated costof product warranties at the time product revenue is recognized. Factors that affect our warranty reserves includethe number of units sold, historical and anticipated rates of warranty repairs and the cost per repair. While weengage in extensive product quality programs and processes, including actively monitoring and evaluating thequality of our component suppliers, our estimated warranty obligation is affected by ongoing product failurerates, specific product class failures outside our baseline experience, material usage and service delivery costsincurred in correcting a product failure. If actual product failure rates, material usage or service delivery costs
39

differ from our estimates, revisions to the estimated warranty liability would be required. Assumptions andhistorical warranty experience are evaluated to determine the appropriateness of such assumptions. We assess theadequacy of the warranty provision on a quarterly basis and we adjust this provision when necessary.
Stock-Based Compensation
Our stock-based compensation cost is measured at the grant date based on the fair value of the award and isrecognized as expense over the requisite service period, which is generally the vesting period.
We use the Black-Scholes valuation model for estimating the fair value on the date of grant ofcompensatory stock options. Determining the fair value of stock option awards at the grant date requiresjudgment regarding certain valuation assumptions, including the volatility of our stock price, expected term ofthe option, risk-free interest rate and expected dividends. Changes in these assumptions and estimates couldresult in different fair values and could therefore impact our earnings. These changes would not impact our cashflows. The fair value of restricted stock awards is based upon our stock price on the grant date.
The amount of stock-based compensation expense recorded in any period for unvested awards requiresestimates of the amount of stock-based awards that are expected to be forfeited prior to vesting.
Compensation costs for awards subject only to service conditions that vest ratably are recognized on astraight-line basis over the requisite service period for the entire award.
Goodwill and Intangible Assets
Goodwill and intangible assets with indefinite lives are tested at least annually for impairment. Intangibleassets with estimated lives and other long-lived assets are reviewed for impairment when events or changes incircumstances indicate that the carrying amount of an asset may not be recoverable. Recoverability of intangibleassets with estimated lives and other long-lived assets is measured by comparing the carrying amount of the assetto future net undiscounted cash flows expected to be generated by the asset. If these comparisons indicate that anasset is not recoverable, we will recognize an impairment loss for the amount by which the carrying value of theasset exceeds the related estimated fair value. Estimated fair value is based on either discounted future operatingcash flows or appraised values, depending on the nature of the asset. Considerable judgment is required toestimate discounted future operating cash flows. Judgment is also required in determining whether an event hasoccurred that may impair the value of goodwill or identifiable intangible or other long-lived assets. Factors thatcould indicate an impairment may exist include significant underperformance relative to plan or long-termprojections, changes in business strategy, significant negative industry or economic trends, a significant changein circumstances relative to a large customer, a significant decline in our stock price for a sustained period and adecline in our market capitalization to below net book value. We must make assumptions about future cashflows, future operating plans, discount rates and other factors in our models and valuation reports. To the extentthese future projections and estimates change, the estimated amounts of impairment could differ from currentestimates. Our annual testing for impairment of goodwill is completed as of August 31 of each year. As ofDecember 31, 2012, all goodwill and intangible assets are associated with the purchase of Virtek Communicationin September 2010.
Contingencies
We are subject to ongoing business risks arising in the ordinary course of business. An estimated losscontingency is accrued when it is probable that a liability has been incurred or an asset has been impaired and theamount of loss can be reasonably estimated. We regularly evaluate current information available to determinewhether such amounts should be adjusted and record changes in estimates in the period they become known. Wereserve for legal contingencies and legal fees when the amounts are probable and reasonably estimable. AtDecember 31, 2012, we have not recorded any material loss contingencies.
40

Liquidity and Capital Resources
We have historically funded our operations primarily from cash flows from operations, net proceeds frompublic and private equity offerings, bank financings and proceeds received from exercises of stock options. As ofDecember 31, 2012, we had $38.3 million in cash, cash equivalents and marketable securities, of which $0.8million, $0.5 million and $2.1 million in cash equivalents were held in a local currency by our foreignsubsidiaries located in Denmark, Brazil and Norway, respectively. There were no marketable securities held byour foreign subsidiaries as of December 31, 2012. As of December 31, 2012, we had $65.2 million in workingcapital.
Net cash provided by operations for 2012 was $15.1 million as compared to net cash provided by operationsof $1.9 million for 2011. The increase is primarily due to a $6.3 million decrease in cash outflows as a result ofdecreased inventory levels, a $5.2 million increase in cash inflows attributable to accounts receivable, as well asa $2.7 million increase in net income, which reflected a $2.8 million reduction in non-cash benefits related todeferred income taxes . Also contributing to the increase was a decrease in cash outflows of approximately $1.7million related to accrued expenses and a $1.1 million decrease in cash outflows related to other long-termliabilities. Partially offsetting the increase in cash inflows is an increase in cash outflows of $2.6 million relatedto other non-current assets and a $2.5 million decrease in cash inflows related to deferred revenue. In addition,there was an increase in cash outflows of $1.3 million related to accounts payables and a $0.9 million increase incash outflows related to prepaid expenses and other current assets.
Net cash used in investing activities for 2012 was $12.3 million as compared to net cash used in investingactivities of $7.6 million for 2011. The increase in cash outflows is due to a $12.3 million increase in our netinvestment in marketable securities. Partially offsetting the increase in cash outflows is a decrease in capitalexpenditures of approximately $7.6 million, which in 2011 included expenditures relating to the construction ofour new manufacturing facility in Middletown, Rhode Island.
Net cash used in financing activities for 2012 was $0.9 million as compared to net cash provided byfinancing activities of $5.5 million for 2011. The decrease in cash provided by financing activities is primarilythe result of repayments on our line of credit of $2.0 million in 2012, in comparison to $9.0 million inborrowings under our line of credit in 2011, which were used to finance the construction of our newmanufacturing facility in Middletown, Rhode Island. Partially offsetting this decrease was a $3.7 milliondecrease in common stock repurchases, a $0.6 million increase in proceeds from exercises of stock options andpurchases of shares under our employee stock purchase plan, as well as a $0.3 million decrease in paymentsrelated to employee restricted stock withholdings.
On April 6, 2009, we entered into a mortgage loan in the amount of $4.0 million related to our headquartersfacility in Middletown, Rhode Island. The loan term is 10 years, with a principal amortization of 20 years, andthe interest rate will be a rate per year adjusted periodically based on a defined interest period equal to the BBALIBOR Rate plus 2.25 percentage points. On June 9, 2011, we entered into an amendment to the mortgage loan,providing for an adjustment of the interest rate from the BBA LIBOR Rate plus 2.25 percentage points to theBBA LIBOR Rate plus 2.00 points. Land, building and improvements with an approximate carrying value of$4.4 million as of December 31, 2012 secure the mortgage loan. The monthly mortgage payment isapproximately $11,000, plus interest and increases in increments of $1,000 each year throughout the life of themortgage. Due to the difference in the term of the loan and amortization of the principal, a balloon payment of$2.6 million is due on April 1, 2019. The loan contains one financial covenant, a Fixed Charge Coverage Ratio,which applies in the event that our consolidated cash, cash equivalents and marketable securities balance fallsbelow $25.0 million at any time. As our consolidated cash, cash equivalents and marketable securities balancewas above $25.0 million throughout 2012, the Fixed Charge Coverage Ratio did not apply. Under the mortgageloan we may prepay our outstanding loan balance subject to certain early termination charges as defined in themortgage loan agreement. If we were to default on our mortgage loan, the land, building and improvementswould be used as collateral. As discussed in note 15 to the consolidated financial statements, effective April 1,2010, in order to reduce the volatility of cash outflows that arise from changes in interest rates, we entered into
41

two interest rate swap agreements that are intended to hedge our mortgage interest obligations by fixing theinterest rates specified in the mortgage loan to 5.9% for half of the principal amount outstanding and 6.1% for theremaining half of the principal amount outstanding as of April 1, 2010 until the mortgage loan expires onApril 16, 2019.
We currently have a revolving loan agreement with a bank that provides for a maximum available credit of$15.0 million and will expire on December 31, 2014. We pay interest on any outstanding amounts at a rate equalto the BBA LIBOR Daily Floating Rate plus 1.25%. The line of credit contains two financial covenants, aLiquidity Covenant, which requires us to maintain at least $20.0 million in unencumbered liquid assets, asdefined in the loan agreement, and a Fixed Charge Coverage Ratio. As of December 31, 2012, we were not indefault of either covenant. Subject to the terms of the agreement and so long as no event of default has occurred,until September 30, 2013, we have the option of converting up to $12.0 million of revolving loans into one ormore term loans at a floating interest rate equal to LIBOR plus 1.75%. We may terminate the loan agreementprior to its full term without penalty, provided we give 30 days’ advance written notice to the bank. As ofDecember 31, 2012, we had borrowed $7.0 million under the facility, the repayment of which is due no later thanthe maturity date of December 31, 2014.
On November 26, 2008, our Board of Directors authorized a program to repurchase up to one million sharesof our common stock. The share repurchase program is funded using our existing cash, cash equivalents,marketable securities and future cash flows. As of December 31, 2012, 341,009 shares of our common stockremain available for repurchase under the program. We did not purchase any shares of our common stock in2012.
It is our intent to continue to invest in the mini-VSAT Broadband network on a global basis in cooperationwith ViaSat under the terms of a 10-year agreement announced in July 2008. As part of the future potentialcapacity expansion, we would plan to seek to acquire additional satellite capacity from satellite operators, expendfunds to seek regulatory approvals and permits, develop product enhancements in anticipation of the expansion,and hire additional personnel. In addition, in December 2011, we entered into a five-year agreement to lease C-band satellite capacity from a satellite operator, effective February 1, 2012, and in 2012 we also purchased threesatellite hubs to support this C-band service. The total cost of the five-year satellite capacity agreement, thesatellite hubs, and teleport services is approximately $12.2 million, of which approximately $2.7 million relatedto the total cost of the three hubs. On January 30, 2013, we borrowed $4.7 million from a bank and pledged ascollateral six satellite hubs and related equipment, including the three hubs purchased in 2012. The term of theequipment loan is five years, at a fixed interest rate of 2.76%. The monthly payment is $83,000 including interestexpense.
We believe that the $38.3 million we hold in cash, cash equivalents and marketable securities, together withour other existing working capital and cash flows from operations, will be adequate to meet planned operatingand capital requirements through at least the next twelve months. However, as the need or opportunity arises, wemay seek to raise additional capital through public or private sales of securities or through additional debtfinancing. There are no assurances that we will be able to obtain any additional funding or that such funding willbe available on terms acceptable to us.
Contractual Obligations and Other Commercial Commitments
As of December 31, 2012, our contractual commitments consisted of satellite service capacity, near-termpurchase commitments, line of credit borrowings, a mortgage note payable, and equipment and facility leases.Our purchase commitments include unconditional purchase orders for inventory, manufacturing materials andfixed assets extending out over various periods throughout 2014. We are also obligated under satellite servicecapacity leases and multi-year facility leases that terminate at various times between 2013 and 2017.
42

The following table summarizes our obligations under these commitments, excluding interest, atDecember 31, 2012:
Payment Due by Period
Contractual Obligations TotalLess than
1 Year 1-3 Years 3-5 YearsMore than
5 Years
(in thousands)
Satellite service capacity and equipment lease obligations $33,618 $12,430 $15,441 $5,207 $ 540Inventory and fixed asset purchase commitments 21,160 17,035 4,125 — —Line of credit borrowings 7,000 — 7,000 — —Mortgage note payable 3,553 138 300 335 2,780Facility lease obligations 243 190 53 — —
Total $65,574 $29,793 $26,919 $5,542 $3,320
We did not have any off-balance sheet commitments, guarantees or standby repurchase obligations as ofDecember 31, 2012.
Recent Accounting Pronouncements
See note 1 of our accompanying audited consolidated financial statements for a description of recentaccounting pronouncements including the dates of adoption and effects on our results of operations, financialposition and disclosures.
ITEM 7A. Quantitative and Qualitative Disclosure About Market Risk
Our primary market risk exposure is in the area of foreign currency exchange risk. We are exposed tocurrency exchange rate fluctuations related to our subsidiary operations in Brazil, Denmark, Norway, Singaporeand Japan. Certain transactions in these locations are made in the local currency, yet are reported in the U.S.dollar, the functional currency. For foreign currency exposures existing at December 31, 2012, a 10%unfavorable movement in the foreign exchange rates for our subsidiary locations would not expose us to materiallosses in earnings or cash flows.
From time to time, we purchase foreign currency forward contracts generally having durations of no morethan five months. These forward contracts are intended to offset the impact of exchange rate fluctuations on cashflows of our foreign subsidiaries. Foreign exchange contracts are accounted for as cash flow hedges and arerecorded on the balance sheet at fair value until executed. Changes in the fair value are recognized in earnings.We did not enter into any such contracts during 2011 or 2012.
The primary objective of our investment activities is to preserve principal and maintain liquidity, while atthe same time maximize income. We have not entered into any instruments for trading purposes. Some of thesecurities that we invest in may have market risk. To minimize this risk, we maintain our portfolio of cashequivalents and short-term investments in a variety of securities that can include government agency bonds,money market mutual funds, corporate notes, and certificates of deposit. As of December 31, 2012, ahypothetical 100 basis-point increase in interest rates would result in an immaterial decrease in the fair value ofour investments that have maturities of greater than one year. Due to the conservative nature of our investmentsand the relatively short duration of their maturities, we believe interest rate risk is substantially mitigated. As ofDecember 31 2012, 77% of the $29.3 million classified as available-for-sale marketable securities will mature orreset within one year. Accordingly, long-term interest rate risk is not considered material. We did not invest inany financial instruments denominated in foreign currencies as of December 31, 2012.
To the extent that we borrow against our variable-rate credit facility, we will be subject to interest rate risk,as we will pay interest on any outstanding amounts at a rate equal to the BBA LIBOR Daily Floating Rate plus
43

1.25%. There was $7 million in borrowings outstanding under this facility at December 31, 2012. Subject to theterms of the agreement and so long as no event of default has occurred, until September 30, 2013, we have theoption of converting up to $12.0 million of outstanding amounts against our variable-rate facility into one ormore term loans at a floating interest rate equal to LIBOR plus 1.75%.
As discussed in note 15 to the consolidated financial statements, effective April 1, 2010, in order to reducethe volatility of cash outflows that arise from changes in interest rates, we entered into two interest rate swapagreements. These interest rate swap agreements are intended to hedge our mortgage loan related to ourheadquarters facility in Middletown, Rhode Island by fixing the interest rates specified in the mortgage loan to5.9% for half of the principal amount outstanding and 6.1% for the remaining half of the principal amountoutstanding as of April 1, 2010 until the mortgage loan expires on April 16, 2019.
ITEM 8. Financial Statements and Supplementary Data
Our consolidated financial statements and supplementary data, together with the report of KPMG LLP, ourindependent registered public accounting firm, are included in Part IV of this annual report on Form 10-K.
ITEM 9. Changes in and Disagreements with Accountants on Accounting and Financial Disclosure
None.
44

ITEM 9A. Controls and Procedures
Evaluation of Disclosure Controls and Procedures
We maintain disclosure controls and procedures, as defined in Rules 13a-15(e) and 15d-15(e) under theSecurities Exchange Act of 1934, as amended, or the Exchange Act, which are designed to ensure thatinformation required to be disclosed in the reports we file or submit under the Exchange Act is recorded,processed, summarized and reported within the time periods specified in the Securities and ExchangeCommission’s rules and forms, and that such information is accumulated and communicated to our management,including our President, Chief Executive Officer and Chairman of the Board, or CEO, and Chief Financial andAccounting Officer, or CFO, as appropriate to allow timely decisions regarding required disclosure.
Under the supervision and with the participation of our CEO and CFO, our management has evaluated theeffectiveness of our disclosure controls and procedures as of December 31, 2012, the end of the period coveredby this annual report. Based on that evaluation, our CEO and CFO concluded that our disclosure controls andprocedures were not effective as of December 31, 2012 due to the material weakness in our internal control overfinancial reporting described below.
Background
In March 2013, our management identified that the most senior member of our accounting staff at ourDanish subsidiary had engaged in a fraudulent scheme to misappropriate assets from us over a period of at leastthree years. The scheme included fraudulent wire transfers to a personal bank account, fraudulent documentation,forged signatures and use of a corporate credit card for personal expenses. For the three years endedDecember 31, 2012, the aggregate amount of misappropriated funds in any year ranged from approximately$118,000 to $250,000. Management is seeking to determine whether any of the losses may be covered by ourinsurance policies.
Management’s Report on Internal Control over Financial Reporting
Our management is responsible for establishing and maintaining adequate internal control over financialreporting. Our internal control over financial reporting is the process designed by and under the supervision ofour CEO and CFO to provide reasonable assurance regarding the reliability of our financial reporting and thepreparation of our financial statements for external reporting in accordance with accounting principles generallyaccepted in the United States of America. Management has evaluated the effectiveness of our internal controlover financial reporting using the criteria set forth by the Committee of Sponsoring Organizations of theTreadway Commission (COSO) in Internal Control-Integrated Framework.
Under the supervision and with the participation of our CEO and CFO, our management has assessed theeffectiveness of our internal control over financial reporting as of December 31, 2012 and concluded that it wasnot effective because of the material weakness described below.
A material weakness is a deficiency, or a combination of deficiencies, in internal control over financialreporting, such that there is a reasonable possibility that a material misstatement of our annual or interimfinancial statements will not be prevented or detected on a timely basis. Management’s assessment identified thefollowing control deficiencies in our internal control over financial reporting at our Danish subsidiary as amaterial weakness:
• override of access controls over banking security devices and personal identification numbers enablingthe unauthorized execution of wire transfers;
• ineffective review controls over the supporting documentation by the subsidiary country generalmanager over expenditures and expenses; and
• override of review controls designed to address the accuracy and approval of manual journal entries atthe Danish subsidiary.
45

The material weakness resulted in immaterial misstatements related to cost of goods sold and sales andmarketing expenses and, as a result, we concluded that, as of December 31, 2012, there was a reasonablepossibility that material misstatements could occur in the consolidated financial statements.
Our independent registered public accounting firm, KPMG LLP, has issued an adverse report regarding theeffectiveness of our internal control over financial reporting as of December 31, 2012, and that report is includedin Item 8 in this annual report.
Evaluation of Changes in Internal Control over Financial Reporting
Under the supervision and with the participation of our CEO and CFO, our management has evaluatedchanges in our internal control over financial reporting that occurred during the fourth quarter of 2012. Based onthat evaluation, our CEO and CFO did not identify any change in our internal control over financial reporting thathas materially affected, or is reasonably likely to materially affect, our internal control over financial reporting.
However, following the identification of the foregoing control deficiencies in March 2013, managementimplemented a remediation plan. Management believes that the implementation of this plan will remediate thecontrol deficiencies described above. The following steps of the remediation plan have been completed as of thefiling of this annual report:
• termination of the employment of the individual involved and reassignment of his duties to an interimcontroller for our Danish subsidiary;
• implementation of a new corporate-level control to review manual journal entries of foreignsubsidiaries; and
• implementation of new controls regarding the physical safekeeping of banking security devices andpersonal identification numbers, which are designed to prevent one person from gaining access to twodevices and personal identification numbers required to execute wire transfers.
The following steps of the remediation plan are currently in process, and management may determine toenhance existing controls and/or implement additional controls as the implementation progresses:
• management is in the process of reviewing the design and operation of our process-level andtransaction-level controls at our foreign subsidiaries in relation to cash management and manualjournal entry review and approvals; and
• management also intends to conduct training sessions at its various locations to reinforce controlconsciousness.
Important Considerations
The effectiveness of our disclosure controls and procedures and our internal control over financial reportingis subject to various inherent limitations, including cost limitations, judgments used in decision making,assumptions about the likelihood of future events, the soundness of our systems, the possibility of human error,and the risk of fraud. Moreover, projections of any evaluation of effectiveness to future periods are subject to therisk that controls may become inadequate because of changes in conditions and the risk that the degree ofcompliance with policies or procedures may deteriorate over time. Because of these limitations, there can be noassurance that any system of disclosure controls and procedures or internal control over financial reporting willbe successful in preventing all errors or fraud or in making all material information known in a timely manner tothe appropriate levels of management.
46

Report of Independent Registered Public Accounting Firm
The Board of Directors and StockholdersKVH Industries, Inc.:
We have audited KVH Industries, Inc.’s internal control over financial reporting as of December 31, 2012, based oncriteria established in Internal Control—Integrated Framework issued by the Committee of Sponsoring Organizationsof the Treadway Commission (COSO). KVH Industries, Inc.’s management is responsible for maintaining effectiveinternal control over financial reporting and for its assessment of the effectiveness of internal control over financialreporting, included in the accompanying Management’s Report on Internal Control over Financial Reporting. Ourresponsibility is to express an opinion on the Company’s internal control over financial reporting based on our audit.
We conducted our audit in accordance with the standards of the Public Company Accounting Oversight Board(United States). Those standards require that we plan and perform the audit to obtain reasonable assurance aboutwhether effective internal control over financial reporting was maintained in all material respects. Our auditincluded obtaining an understanding of internal control over financial reporting, assessing the risk that a materialweakness exists, and testing and evaluating the design and operating effectiveness of internal control based on theassessed risk. Our audit also included performing such other procedures as we considered necessary in thecircumstances. We believe that our audit provides a reasonable basis for our opinion.
A company’s internal control over financial reporting is a process designed to provide reasonable assuranceregarding the reliability of financial reporting and the preparation of financial statements for external purposes inaccordance with generally accepted accounting principles. A company’s internal control over financial reportingincludes those policies and procedures that (1) pertain to the maintenance of records that, in reasonable detail,accurately and fairly reflect the transactions and dispositions of the assets of the company; (2) provide reasonableassurance that transactions are recorded as necessary to permit preparation of financial statements in accordancewith generally accepted accounting principles, and that receipts and expenditures of the company are being madeonly in accordance with authorizations of management and directors of the company; and (3) provide reasonableassurance regarding prevention or timely detection of unauthorized acquisition, use, or disposition of the company’sassets that could have a material effect on the financial statements.
Because of its inherent limitations, internal control over financial reporting may not prevent or detect misstatements.Also, projections of any evaluation of effectiveness to future periods are subject to the risk that controls maybecome inadequate because of changes in conditions, or that the degree of compliance with the policies orprocedures may deteriorate.
A material weakness is a deficiency, or a combination of deficiencies, in internal control over financial reporting,such that there is a reasonable possibility that a material misstatement of the company’s annual or interim financialstatements will not be prevented or detected on a timely basis. A material weakness related to control activities overthe execution of wire transfers, approval of cash disbursements and other purchase transactions and review andapproval of manual journal entries has been identified and included in management’s assessment. We also haveaudited, in accordance with the standards of the Public Company Accounting Oversight Board (United States), theconsolidated balance sheet of KVH Industries, Inc. and subsidiaries as of December 31, 2012 and the relatedconsolidated statements of operations, comprehensive income, stockholders’ equity and accumulated othercomprehensive income (loss), and cash flows for the year ended December 31, 2012. This material weakness wasconsidered in determining the nature, timing, and extent of audit tests applied in our audit of the 2012 consolidatedfinancial statements, and this report does not affect our report dated April 2, 2013, which expressed an unqualifiedopinion on those consolidated financial statements.
In our opinion, because of the effect of the aforementioned material weakness on the achievement of theobjectives of the control criteria, KVH Industries, Inc. has not maintained effective internal control over financialreporting as of December 31, 2012, based on criteria established in Internal Control—Integrated Frameworkissued by the Committee of Sponsoring Organizations of the Treadway Commission.
/s/ KPMG LLP
Providence, Rhode IslandApril 2, 2013
47

ITEM 9B. Other Information
None.
48

PART III
We have omitted the information required in Part III of this annual report because we intend to include thatinformation in our definitive proxy statement for our 2013 annual meeting of stockholders, which we expect tofile before 120 days after the end of fiscal 2012. We incorporate the information required in Part III of thisannual report by reference to our 2013 proxy statement.
ITEM 10. Directors, Executive Officers and Corporate Governance
Except as set forth below, the information required by this item is incorporated by reference to our 2013proxy statement.
Our Board of Directors has adopted a Code of Business Conduct and Ethics that applies to our directors,executive officers and employees. Our Code of Business Conduct and Ethics can be found on our website, whichis located at www.kvh.com. We intend to make all required disclosures concerning any amendments to orwaivers from, our Code of Business Conduct and Ethics on our website. Any person may request a copy of theCode of Business Conduct and Ethics, at no cost, by writing to us at the following address: KVH Industries, Inc.,50 Enterprise Center, Middletown, Rhode Island, 02842, Attention: Investor Relations.
ITEM 11. Executive Compensation
The information required by this item is incorporated by reference to our 2013 proxy statement.
ITEM 12. Security Ownership of Certain Beneficial Owners and Management and Related StockholderMatters
The information required by this item is incorporated by reference to our 2013 proxy statement.
ITEM 13. Certain Relationships and Related Transactions and Director Independence
The information required by this item is incorporated by reference to our 2013 proxy statement.
ITEM 14. Principal Accountant Fees and Services
The information required by this item is incorporated by reference to our 2013 proxy statement.
49

PART IV
ITEM 15. Exhibits and Financial Statement Schedules
Page
(a) 1. Financial Statements
Report of Independent Registered Public Accounting Firm 54
Consolidated Balance Sheets as of December 31, 2012 and 2011 55
Consolidated Statements of Operations for the years ended December 31, 2012, 2011 and 2010 56
Consolidated Statements of Comprehensive Income for the years ended December 31, 2012, 2011and 2010 57
Consolidated Statements of Stockholders’ Equity and Accumulated Other Comprehensive Income(Loss) for the years ended December 31, 2012, 2011 and 2010 58
Consolidated Statements of Cash Flows for the years ended December 31, 2012, 2011 and 2010 59
Notes to Consolidated Financial Statements 60
(a) 2. Financial Statement Schedules
None.
3. Exhibits
50

Exhibit No. Description
Filed withthis Form
10-K
Incorporated by Reference
Form Filing Date Exhibit No.
3.1 Amended and Restated Certificate of Incorporation, asamended
10-Q August 6,2010
3.1
3.2 Amended, Restated and Corrected Bylaws of KVHIndustries, Inc.
8-K July 31, 2007 3
4.1 Specimen certificate for the common stock S-1/A March 22,1996
4.1
*10.1 Amended and Restated 1996 Incentive and NonqualifiedStock Option Plan
8-K July 31, 2007 10.3
*10.2 Amended and Restated 1996 Employee Stock PurchasePlan
8-K June 2, 2010 10.2
*10.3 Second Amended and Restated 2003 Incentive andNonqualified Stock Option Plan
10-Q May 6, 2009 10.21
*10.4 Third Amended and Restated 2006 Stock Incentive Plan 8-K June 2, 2010 10.1
*10.5 Form of Nonqualified Stock Option agreement grantedunder the Second Amended and Restated 2003 Incentiveand Nonqualified Stock Option Plan
10-K March 15,2005
10.14
*10.6 Form of Incentive Stock Option agreement granted underthe Second Amended and Restated 2003 Incentive andNonqualified Stock Option Plan
10-K March 15,2005
10.15
*10.7 Form of Incentive Stock Option agreement granted underthe Third Amended and Restated 2006 Stock IncentivePlan
8-K August 28,2006
10.1
*10.8 Form of Non-Statutory Stock Option agreement grantedunder the Third Amended and Restated 2006 StockIncentive Plan
8-K August 28,2006
10.2
*10.9 Form of Restricted Stock Agreement granted under theThird Amended and Restated 2006 Stock Incentive Plan
8-K August 16,2007
10.1
*10.10 Policy Regarding Automatic Grants to Non-EmployeeDirectors
10-Q May 6, 2009 10.23
10.11 Amended and Restated Credit and Security Agreementdated July 17, 2003 with Fleet Capital Corporation
8-K July 18, 2003 99.1
10.12 Assignment and Assumption and Amendment and NoteModification Agreement, dated July 17, 2006 by andamong KVH Industries, Inc., Banc of America Leasing &Capital, LLC (successor-by-merger to Fleet CapitalCorporation) (“assignor”), and Bank of America, N.A.(successor-by-merger to Fleet National Bank)(“assignee”)
8-K July 20, 2006 10.1
10.13 Second Amendment and Note Modification Agreement,dated December 28, 2006 by and among KVH Industries,Inc., and Bank of America, N.A.
8-K January 3,2007
10.1
51

Exhibit No. Description
Filed withthis Form
10-K
Incorporated by Reference
Form Filing Date Exhibit No.
10.14 Third Amendment and Note Modification Agreement,dated August 20, 2007 by and among KVH Industries,Inc., and Bank of America, N.A.
10-K March 8,2010
10.15 Fourth Amendment and Note Modification Agreement,dated December 31, 2008 by and among KVH Industries,Inc., and Bank of America, N.A.
8-K January 2,2009
10.1
10.16 Fifth Amendment and Note Modification Agreement,dated June 9, 2011 by and between KVH Industries, Inc.and Bank of America, N.A.
8-K June 14,2011
10.1
10.17 Sixth Amendment, dated March 1, 2012 by and betweenKVH Industries, Inc. and Bank of America, N.A.
8-K March 6,2012
10.1
10.18 Seventh Amendment, dated September 17, 2012 by andbetween KVH Industries, Inc. and Bank of America, N.A.
8-K September 19,2012
10.1
10.19 Loan Agreement dated April 6, 2009 by and among KVHIndustries, Inc., and Bank of America, N.A.
8-K April 8,2009
10.1
10.20 Second Amendment, dated June 9, 2011 by and betweenKVH Industries, Inc. and Bank of America, N.A.,amending the Loan Agreement, dated April 6, 2009, asamended
8-K June 14,2011
10.2
21.1 List of Subsidiaries X
23.1 Consent of KPMG LLP X
31.1 Rule 13a-14(a)/15d-14(a) certification of principalexecutive officer
X
31.2 Rule 13a-14(a)/15d-14(a) certification of principalfinancial officer
X
32.1 Rule 1350 certification X
**101.1 Interactive Data File regarding (a) our ConsolidatedBalance Sheets as of December 31, 2012 and 2011, (b)our Consolidated Statements of Operations for the yearsended December 31, 2012, 2011 and 2010, (c) ourConsolidated Statements of Comprehensive Income forthe years ended December 31, 2012, 2011 and 2010, (d)our Consolidated Statements of Stockholders’ Equity andAccumulated Other Comprehensive Income (Loss) for theyears ended December 31, 2012, 2011 and 2010, (e) ourConsolidated Statements of Cash Flows for the yearsended December 31, 2012, 2011 and 2010 and (e) theNotes to such Consolidated Financial Statements
X
* Management contract or compensatory plan.** Pursuant to Rule 406T of Regulation S-T, the Interactive Data Files included as Exhibit 101.1 hereto are
deemed not filed or part of a registration statement or prospectus for purposes of Sections 11 or 12 of theSecurities Act of 1933, as amended, are deemed not filed for purposes of Section 18 of the SecuritiesExchange Act of 1934, as amended, and otherwise are not subject to liability under those sections
52

SIGNATURES
Pursuant to the requirements of Section 13 or Section 15(d) of the Securities Exchange Act of 1934, theregistrant has duly caused this report to be signed on its behalf by the undersigned, thereunto duly authorized.
KVH Industries, Inc.
Date: April 2, 2013 By: /S/ MARTIN A. KITS VAN HEYNINGEN
Martin A. Kits van Heyningen
President, Chief Executive Officer and Chairman of the Board
Pursuant to the requirements of the Securities Exchange Act of 1934, this report has been signed below bythe following persons in the capacities and on the dates indicated.
Name Title Date
/S/ MARTIN A. KITS VAN HEYNINGEN
Martin A. Kits van Heyningen
President, Chief Executive Officerand Chairman of the Board(Principal Executive Officer)
April 2, 2013
/S/ PETER RENDALL
Peter Rendall
Chief Financial Officer(Principal Financial andAccounting Officer)
April 2, 2013
/S/ ROBERT W.B. KITS VAN HEYNINGEN
Robert W.B. Kits van Heyningen
Director April 2, 2013
/S/ MARK S. AIN
Mark S. Ain
Director April 2, 2013
/S/ STANLEY K. HONEY
Stanley K. Honey
Director April 2, 2013
/S/ BRUCE J. RYAN
Bruce J. Ryan
Director April 2, 2013
/S/ CHARLES R. TRIMBLE
Charles R. Trimble
Director April 2, 2013
53

Report of Independent Registered Public Accounting Firm
The Board of Directors and StockholdersKVH Industries, Inc.:
We have audited the accompanying consolidated balance sheets of KVH Industries, Inc. and subsidiaries(the “Company”) as of December 31, 2012 and 2011, and the related consolidated statements of operations,comprehensive income, stockholders’ equity and accumulated other comprehensive income (loss), and cashflows for each of the years in the three-year period ended December 31, 2012. These consolidated financialstatements are the responsibility of the Company’s management. Our responsibility is to express an opinion onthese consolidated financial statements based on our audits.
We conducted our audits in accordance with the standards of the Public Company Accounting OversightBoard (United States). Those standards require that we plan and perform the audits to obtain reasonableassurance about whether the financial statements are free of material misstatement. An audit includes examining,on a test basis, evidence supporting the amounts and disclosures in the financial statements. An audit alsoincludes assessing the accounting principles used and significant estimates made by management, as well asevaluating the overall financial statement presentation. We believe that our audits provide a reasonable basis forour opinion.
In our opinion, the consolidated financial statements referred to above present fairly, in all material respects,the financial position of the Company as of December 31, 2012 and 2011, and the results of its operations and itscash flows for each of the years in the three-year period ended December 31, 2012, in conformity with U.S.generally accepted accounting principles.
We also have audited, in accordance with the standards of the Public Company Accounting Oversight Board(United States), the Company’s internal control over financial reporting as of December 31, 2012, based oncriteria established in Internal Control-Integrated Framework issued by the Committee of SponsoringOrganizations of the Treadway Commission (COSO), and our report dated April 2, 2013 expressed an adverseopinion on the effectiveness of the Company’s internal control over financial reporting.
/s/ KPMG LLPProvidence, Rhode Island
April 2, 2013
54

KVH INDUSTRIES, INC. AND SUBSIDIARIES
CONSOLIDATED BALANCE SHEETS
December 31,
2012 2011
ASSETSCurrent assets:
Cash and cash equivalents $ 8,978,156 $ 7,017,198Marketable securities 29,306,444 23,553,203Accounts receivable, net of allowance for doubtful accounts of $929,294 as of
December 31, 2012 and $622,687 as of December 31, 2011 27,654,094 25,958,516Inventories 16,203,380 18,614,726Prepaid expenses and other assets 3,264,175 2,552,146Deferred income taxes 1,145,600 1,281,327
Total current assets 86,551,849 78,977,116
Property and equipment, less accumulated depreciation of $31,657,385 as of December 31,2012 and $27,508,397 as of December 31, 2011 36,733,118 34,009,872
Intangible assets, less accumulated amortization of $825,639 as of December 31, 2012 and$434,318 as of December 31, 2011 1,683,676 1,902,771
Goodwill 4,711,942 4,425,711Other non-current assets 4,363,531 3,834,752Deferred income taxes 3,523,691 5,405,492
Total assets $137,567,807 $128,555,714
LIABILITIES AND STOCKHOLDERS’ EQUITYCurrent liabilities:
Accounts payable $ 7,086,552 $ 6,140,589Accrued compensation and employee-related expenses 6,785,234 4,284,837Accrued other 4,594,730 5,026,159Accrued product warranty costs 813,802 933,184Deferred revenue 1,891,792 2,683,982Current portion of long-term debt 138,239 130,857
Total current liabilities 21,310,349 19,199,608
Other long-term liabilities 139,411 135,166Line of credit 7,000,000 9,000,000Long-term debt, excluding current portion 3,414,440 3,552,679
Total liabilities 31,864,200 31,887,453
Commitments and contingencies (notes 1, 5, 6 and 16)Stockholders’ equity:
Preferred stock, $0.01 par value. Authorized 1,000,000 shares; none issued — —Common stock, $0.01 par value. Authorized 30,000,000 shares, 16,563,836 and
16,207,268 shares issued; 14,904,845 and 14,548,277 shares outstanding atDecember 31, 2012 and December 31, 2011, respectively 165,726 162,160
Additional paid-in capital 111,513,635 106,592,491Accumulated earnings 7,307,480 3,726,865Accumulated other comprehensive loss (132,988) (663,009)
118,853,853 109,818,507Less: treasury stock at cost, common stock, 1,658,991 shares as of December 31, 2012
and December 31, 2011, respectively (13,150,246) (13,150,246)
Total stockholders’ equity 105,703,607 96,668,261
Total liabilities and stockholders’ equity $137,567,807 $128,555,714
See accompanying Notes to Consolidated Financial Statements.
55

KVH INDUSTRIES, INC. AND SUBSIDIARIES
CONSOLIDATED STATEMENTS OF OPERATIONS
Year Ended December 31,
2012 2011 2010
Sales:Product $ 90,677,292 $ 85,135,618 $ 92,058,745Service 46,434,918 27,400,246 20,184,049
Net sales 137,112,210 112,535,864 112,242,794Costs and expenses:
Costs of product sales 51,774,588 46,598,595 51,347,555Costs of service sales 30,362,866 20,969,805 16,086,394Research and development 12,147,998 11,548,247 10,714,889Sales, marketing and support 24,069,079 23,472,521 18,470,019General and administrative 12,187,794 10,555,026 10,083,851
Total costs and expenses 130,542,325 113,144,194 106,702,708
Income (loss) from operations 6,569,885 (608,330) 5,540,086Interest income 510,471 296,953 301,352Interest expense 323,431 223,061 204,076Other income 86,247 909,619 23,448
Income before income tax (expense) benefit 6,843,172 375,181 5,660,810Income tax (expense) benefit (3,262,557) 484,468 2,612,402
Net income $ 3,580,615 $ 859,649 $ 8,273,212
Per share information:Net income per share, basic $ 0.24 $ 0.06 $ 0.57
Net income per share, diluted $ 0.24 $ 0.06 $ 0.56
Number of shares used in per share calculation:Basic 14,777,175 14,767,606 14,419,599
Diluted 15,018,951 15,072,342 14,850,325
See accompanying Notes to Consolidated Financial Statements.
56

KVH INDUSTRIES, INC. AND SUBSIDIARIES
CONSOLIDATED STATEMENTS OF COMPREHENSIVE INCOME
Year Ended December 31,
2012 2011 2010
Net income $3,580,615 $ 859,649 $8,273,212Other comprehensive income (loss), net of tax:Unrealized loss on marketable securities (1,303) (1) (47,141)Currency translation adjustment 562,568 (415,447) 260,256Unrealized loss on interest rate swaps (31,244) (267,378) (242,880)
Other comprehensive income (loss), net of tax 530,021 (682,826) (29,765)
Total comprehensive income $4,110,636 $ 176,823 $8,243,447
See accompanying Notes to Consolidated Financial Statements.
57

KVH INDUSTRIES, INC. AND SUBSIDIARIES
CONSOLIDATED STATEMENTS OF STOCKHOLDERS’ EQUITY ANDACCUMULATED OTHER COMPREHENSIVE INCOME (LOSS)
Common Stock AdditionalPaid-inCapital
Accumulated(Deficit)Earnings
AccumulatedOther
ComprehensiveIncome (Loss)
TreasuryStock
TotalStockholders’
EquityShares Amount
Balance at December 31, 2009 14,154,278 $153,644 $ 96,274,199 $(5,405,996) $ 49,582 $ (9,471,119) $ 81,600,310
Comprehensive income:Net loss — — — 8,273,212 — — 8,273,212Currency translation adjustment 260,256 260,256Unrealized loss on interest rate
swaps (242,880) (242,880)Unrealized loss on marketable
securities — — — — (47,141) — (47,141)
Comprehensive income — — — — — — 8,243,447Stock-based compensation — — 2,522,737 — — — 2,522,737Registration fees — — (6,962) — — — (6,962)Tax benefit from exercise of stock
options 478,947 478,947Common stock issued under benefit plan 21,654 217 259,767 — — — 259,984Acquisition of treasury stock — — — — — — —Payment of restricted stock withholdings (37,726) (377) (480,409) — — — (480,786)Exercise of stock options, vesting of
restricted stock awards 550,553 5,505 3,679,482 — — — 3,684,987
Balance at December 31, 2010 14,688,759 $158,989 $102,727,761 $ 2,867,216 $ 19,817 $ (9,471,119) $ 96,302,664
Comprehensive income:Net income — — — 859,649 — — 859,649Currency translation adjustment — — — — (415,447) — (415,447)Unrealized loss on interest rate
swaps — — — — (267,378) — (267,378)Unrealized loss on marketable
securities — — — — (1) — (1)
Comprehensive income — — — — — — 176,823Stock-based compensation — — 3,541,501 — — — 3,541,501Registration fees — — (10,000) — — — (10,000)Tax benefit from exercise of stock
options — — 19,396 — — — 19,396Common stock issued under benefit plan 38,718 387 288,790 — — — 289,177Acquisition of treasury stock (457,667) (3,679,127) (3,679,127)Payment of restricted stock withholdings (46,444) (465) (624,068) — — — (624,533)Exercise of stock options, vesting of
restricted stock awards 324,911 3,249 649,111 — — — 652,360
Balance at December 31, 2011 14,548,277 $162,160 $106,592,491 $ 3,726,865 $(663,009) $(13,150,246) $ 96,668,261
Comprehensive income:Net income — — — 3,580,615 — — 3,580,615Currency translation adjustment — — — — 562,568 — 562,568Unrealized loss on interest rate
swaps — — — — (31,244) — (31,244)Unrealized loss on marketable
securities — — — — (1,303) — (1,303)
Comprehensive income — — — — — — 4,110,636Stock-based compensation — — 3,679,248 — — — 3,679,248Tax benefit from exercise of stock
options — — 619,138 — — — 619,138Common stock issued under benefit plan 27,308 273 270,225 — — — 270,498Payment of restricted stock withholdings (34,929) (349) (332,361) — — — (332,710)Exercise of stock options, vesting of
restricted stock awards 364,189 3,642 684,894 — — — 688,536
Balance at December 31, 2012 14,904,845 $165,726 $111,513,635 $ 7,307,480 $(132,988) $(13,150,246) $105,703,607
See accompanying Notes to Consolidated Financial Statements.
58

KVH INDUSTRIES, INC. AND SUBSIDIARIES
CONSOLIDATED STATEMENTS OF CASH FLOWS
Year Ended December 31,
2012 2011 2010
Cash flows from operating activities:Net income $ 3,580,615 $ 859,649 $ 8,273,212Adjustments to reconcile net income to net cash provided by
operating activities:Provision for doubtful accounts 535,617 275,526 280,578Depreciation and amortization 4,609,654 4,374,169 3,845,016Deferred income taxes 2,046,278 (737,496) (3,133,858)Loss on interest rate swaps 128,102 132,589 102,572Compensation expense related to stock-based awards and
employee stock purchase plan 3,679,248 3,532,909 2,523,799Changes in operating assets and liabilities:
Accounts receivable (2,230,743) (7,438,392) (2,660,238)Inventories 2,420,196 (3,850,824) (1,215,185)Prepaid expenses and other assets (716,697) 164,089 (1,078,556)Other non-current assets (557,820) 2,028,341 645,674Accounts payable 942,852 2,223,153 178,539Deferred revenue (785,415) 1,683,950 (43,713)Accrued expenses 1,400,873 (253,089) 1,499,612Other long-term liabilities 4,245 (1,127,359) 360,411
Net cash provided by operating activities $ 15,057,005 $ 1,867,215 $ 9,577,863
Cash flows from investing activities:Capital expenditures (6,504,094) (14,064,106) (11,010,756)Net cash paid for business acquired — — (6,365,518)Purchases of marketable securities (21,944,408) (49,541,143) (87,886,677)Maturities and sales of marketable securities 16,189,864 56,053,571 93,207,446
Net cash used in investing activities $(12,258,638) $ (7,551,678) $(12,055,505)
Cash flows from financing activities:Repayments of long-term debt (130,857) (123,870) (117,256)Proceeds from stock options exercised and employee stock
purchase plan 1,578,172 941,537 4,423,918Repurchase of common stock — (3,679,127) —Payment of employee restricted stock withholdings (332,710) (624,533) (480,786)Repayments of line of credit borrowings (2,000,000) — —Proceeds from line of credit borrowings — 9,000,000 —Payment of stock registration fee — (10,000) (6,962)
Net cash (used in) provided by financing activities (885,395) 5,504,007 3,818,914
Effect of exchange rate changes on cash and cash equivalents 47,986 (43,534) 29,145Net increase (decrease) in cash and cash equivalents 1,960,958 (223,990) 1,370,417Cash and cash equivalents at beginning of period 7,017,198 7,241,188 5,870,771
Cash and cash equivalents at end of period $ 8,978,156 $ 7,017,198 $ 7,241,188
Supplemental disclosure of cash flow information:Cash paid for interest $ 200,624 $ 267,281 $ 189,931
Cash paid for income taxes $ 322,856 $ 57,968 $ 881,025
Supplemental disclosure of noncash investing activity:
Changes in accrued liabilities related to fixed asset additions $ 435,000 $ 944,649 $ —
See accompanying Notes to Consolidated Financial Statements.
59
KVH INDUSTRIES, INC. AND SUBSIDIARIES
NOTES TO CONSOLIDATED FINANCIAL STATEMENTSDecember 31, 2012, 2011 and 2010
(in thousands except share and per share amounts)
(1) Summary of Significant Accounting Policies
(a) Description of Business
KVH Industries, Inc. (the Company or KVH) designs, develops, manufactures and markets mobilecommunications products for the marine, land mobile and aeronautical markets, and navigation, guidance andstabilization products for both the defense and commercial markets.
KVH’s mobile communications products enable customers to receive voice and Internet services, and livedigital television via satellite services in marine vessels, recreational vehicles and automobiles as well as livedigital television on commercial airplanes while in motion. KVH’s CommBox offers a range of tools designed toincrease communication efficiency, reduce costs, and manage network operations. KVH sells its mobilecommunications products through an extensive international network of retailers, distributors and dealers. KVHalso leases products directly to end users.
KVH offers precision fiber optic gyro-based (FOG) systems that enable platform and optical stabilization,navigation, pointing and guidance. KVH’s guidance and stabilization products also include tactical navigationsystems that provide uninterrupted access to navigation and pointing information in a variety of military vehicles,including tactical trucks and light armored vehicles. KVH’s guidance and stabilization products are sold directlyto U.S. and allied governments and government contractors, as well as through an international network ofauthorized independent sales representatives. In addition, KVH’s guidance and stabilization products havenumerous commercial applications such as precision mapping, dynamic surveying, autonomous vehicles, trainlocation control and track geometry measurement systems, industrial robotics and optical stabilization.
KVH’s mobile communications service sales include sales earned from satellite voice and Internet airtimeservices, engineering services provided under development contracts, sales from product repairs, certain DIRECTVaccount subsidies and referral fees earned in conjunction with the sale of its products and extended warranty sales.KVH provides, for monthly fixed and usage fees, satellite connectivity sales from broadband Internet, data andVoice over Internet Protocol (VoIP) service to its TracPhone V7 customers. KVH also earns monthly usage fees forthird-party satellite connectivity for voice, data and Internet services to its Inmarsat TracPhone customers whochoose to activate their subscriptions with KVH. Under current DIRECTV programs, KVH is eligible to receive aone-time commission for each DIRECTV receiver activated for service and a new mobile account activation feefrom DIRECTV for each customer who activates their DIRECTV service directly through KVH.
KVH’s guidance and stabilization service sales include product repairs, engineering services provided underdevelopment contracts and extended warranty sales.
(b) Principles of Consolidation
The accompanying consolidated financial statements of KVH Industries, Inc. and its wholly-ownedsubsidiaries, KVH Industries AS, KVH Industries Pte. Ltd., KVH Industries Brasil Comunicacao Por SateliteLtda., KVH Industries Japan Co. Ltd., and KVH Industries Norway A/S (collectively, KVH or the Company),have been prepared in accordance with accounting principles generally accepted in the United States of America.The Company has evaluated all subsequent events through the date of this filing. Given that KVH Industries A/S,KVH Industries Pte. Ltd., KVH Industries Japan Co. Ltd., and KVH Industries Brasil Comunicacao Por SateliteLtda. operate as the Company’s European, Singaporean, Japanese and Brazilian international distributors, all oftheir operating expenses are reflected within sales, marketing and support within the accompanying consolidatedstatements of operations. KVH Industries Norway AS, a subsidiary of KVH Industries A/S that was purchased inSeptember 2010, develops and distributes middleware software solutions known as CommBox technology,
60

KVH INDUSTRIES, INC. AND SUBSIDIARIES
NOTES TO CONSOLIDATED FINANCIAL STATEMENTS—(Continued)December 31, 2012, 2011 and 2010
(in thousands except share and per share amounts)
which is included in the Company’s satellite communications products and services. All significant intercompanyaccounts and transactions have been eliminated in consolidation.
(c) Significant Estimates and Assumptions
The preparation of financial statements in conformity with accounting principles generally accepted in theUnited States of America requires management to make estimates and assumptions that affect the reportedamounts of assets and liabilities and disclosure of contingent assets and liabilities as of the date of the financialstatements and the reported amounts of sales and expenses during the reporting periods. Significant estimates andassumptions by management affect the Company’s revenue recognition, valuation of accounts receivable,valuation of inventory, assumptions used to determine fair value of goodwill and intangible assets, deferred taxassets and related valuation allowance, stock-based compensation, warranty and accounting for contingencies.
Although the Company regularly assesses these estimates, actual results could differ materially from theseestimates. Changes in estimates are recorded in the period in which they become known. The Company bases itsestimates on historical experience and various other assumptions that it believes to be reasonable under thecircumstances.
The Company has accounted for its $35,600 contract received in June 2012 from SANG to purchaseTACNAV products and services under ASC 605-25, Multiple-Element Arrangements. See section (e) of this notefor estimates and assumptions related to multiple-element-arrangements and completed contract sales accounting.
The total contract value associated with TACNAV products is $21,200 for which shipments are estimated tocontinue through the first half of 2013. Revenue is recognized for these product sales after transfer of title andrisk of loss after inspection occurs. The total contract value associated with all services is $14,400 which areestimated to continue through 2014. The revenue for these services is recognized using the percentage ofcompletion accounting method. The Company limits the amount of revenue recognized for delivered elements tothe amount that is not contingent on the future delivery of products or services, future performance obligations,or subject to customer-specific return or refund privileges. Total revenue recognized on the SANG contract in2012 was approximately $15,200.
(d) Concentration of Credit Risk and Single Source Suppliers
Cash, cash equivalents and marketable securities. The Company is potentially subject to financialinstrument concentration of credit risk through its cash, cash equivalent and marketable securities investments.To mitigate these risks the Company maintains cash, cash equivalents and marketable securities with reputableand nationally recognized financial institutions. As of December 31, 2012, $29,306 classified as marketablesecurities was held by Wells Fargo and substantially all of the cash and cash equivalents were held by Bank ofAmerica, N.A. See note 2 for a description of marketable securities.
Trade accounts receivable. Concentrations of risk (see note 11) with respect to trade accounts receivable aregenerally limited due to the large number of customers and their dispersion across several geographic areas.Although the Company does not foresee credit risk associated with these receivables to deviate from historicalexperience, repayment is dependent upon the financial stability of those individual customers. The Companyestablishes allowances for potential bad debts and evaluates, on a monthly basis, the adequacy of those reserves
61

KVH INDUSTRIES, INC. AND SUBSIDIARIES
NOTES TO CONSOLIDATED FINANCIAL STATEMENTS—(Continued)December 31, 2012, 2011 and 2010
(in thousands except share and per share amounts)
based upon historical experience and its expectations for future collectability concerns. Activity within theCompany’s allowance for doubtful accounts for the periods presented is as follows:
2012 2011 2010
Beginning balance $ 623 $ 592 $ 844Additions charged to expense 536 276 281Deductions (write-offs/recoveries) from reserve (230) (245) (533)
Ending balance $ 929 $ 623 $ 592
Certain components from third parties used in the Company’s products are procured from single sources ofsupply. The failure of a supplier, including a subcontractor, to deliver on schedule could delay or interrupt theCompany’s delivery of products and thereby materially adversely affect the Company’s revenues and operating results.
(e) Revenue Recognition
Product sales. Product sales are recognized when persuasive evidence of an arrangement exists, goods areshipped, title has passed and collectability is reasonably assured. The Company’s standard sales terms require that:
• All sales are final;
• Terms are generally Net 30;
• Shipments are tendered and shipped FOB (or as may be applicable, FCA, or EXW) the Company’splant or warehouse; and
• Title and risk of loss or damage passes to the dealer or distributor at the point of shipment whendelivery is made to the possession of the carrier.
For certain guidance and stabilization product sales, customer acceptance or inspection may be requiredbefore title and risk of loss transfers. For those sales, revenue is recognized after transfer of title and risk of lossand after notification of customer acceptance.
Under certain limited conditions, the Company, at its sole discretion, provides for the return of goods. Noproduct is accepted for return and no credit is allowed on any returned product unless the Company has grantedand confirmed prior written permission by means of appropriate authorization. The Company establishes reservesfor potential sales returns, credits, and allowances, and evaluates, on a monthly basis, the adequacy of thosereserves based upon historical experience and expectations for the future.
Multiple-element revenue arrangements. Some of our sales involve multiple-element arrangements thatinclude both hardware-related products and contracted service, or satellite connectivity that are accounted underASC 605-25, Multiple-Element Arrangements.
Multiple elements, arrangement consideration is allocated to each element based on the relative sellingprices of all of the elements in the arrangement using the fair value hierarchy as required by “RevenueRecognition (Topic 605): Multiple-Deliverable Revenue Arrangements,” (Accounting Standards Update “ASU”2009-13). The Company adopted the provisions of ASU 2009-13 as of January 1, 2010. ASU 2009-13 requiresthe Company establish VSOE of fair value based upon the price charged when the same element is sold
62

KVH INDUSTRIES, INC. AND SUBSIDIARIES
NOTES TO CONSOLIDATED FINANCIAL STATEMENTS—(Continued)December 31, 2012, 2011 and 2010
(in thousands except share and per share amounts)
separately or established by management having the relevant pricing authority. When VSOE exists it is used todetermine the selling price of a deliverable. When VSOE is not established, the Company attempts to establishthe selling price of each element based on TPE. When the Company is unable to establish selling price usingVSOE or TPE, the Company uses BESP in the allocation of arrangement consideration for the relevantdeliverables. The objective of BESP is to determine the price at which the Company would transact a sale if aproduct or service was sold on a stand-alone basis. The Company determines BESP for our products and certainservices by considering multiple factors including, but not limited to, overall market conditions, includinggeographic or regional-specific market factors and profit objectives for such deliverables.
Each deliverable within the Company’s multiple-deliverable revenue arrangements is accounted for as aseparate unit of accounting under the guidance of ASU 2009-13 if both of the following criteria are met: thedelivered item or items have value to the customer on a standalone basis; and for an arrangement that includes ageneral right of return relative to the delivered item(s), delivery or performance of the undelivered item(s) isconsidered probable and substantially in the control of the Company. The Company considers a deliverable tohave standalone value if the item is sold separately by the Company or another vendor or if the item could beresold by the customer. Further, the Company’s revenue arrangements generally do not include a general right ofreturn relative to delivered products.
Deliverables not meeting the criteria for being a separate unit of accounting are combined with a deliverablethat does meet that criterion. The appropriate allocation of arrangement consideration and recognition of revenueis then determined for the combined unit of accounting.
Satellite connectivity sales. Directly sold and re-sold satellite connectivity service for voice, data andInternet is recognized monthly based upon minutes or megabytes of traffic processed or contracted fixed feeschedules. Typically subscribers enter into a contracted one year minimum service agreement. The Companyrecords all satellite connectivity service sales to subscribers as gross sales, as the Company is the primary obligorin the contracted service arrangement. All associated regulatory service fees and costs are recorded net in theconsolidated financial statements. The accounting estimates related to the recognition of satellite connectivityservice sales in the results of operations require the Company to make assumptions about future billingadjustments for disputes with subscribers as well as unauthorized usage.
Lease financing. Lease financing consists of sales-type leases primarily of the TracPhone V7. The Companyrecords the leases at a price typically equivalent to normal selling price and in excess of the cost or carryingamount. Upon delivery, the Company records the present value of all payments under these leases as revenues,and the related costs of the product are charged to cost of sales. Interest income is recognized throughout thelease term (typically 3 years) using an implicit interest rate. Through December 31, 2012, lease sales have notbeen a significant portion of the Company’s total sales.
Contracted service sales. The Company engages in contracts for development, production and servicesactivities which it accounts for consistent with FASB ASC 605-35, Accounting for Performance of Construction-Type and Certain Production-Type Contracts, and other relevant revenue recognition accounting literature. TheCompany considers the nature of these contracts and the types of products and services provided whendetermining the proper accounting for a particular contract. Customer and government-agency contractedengineering service and grant sales under development contracts are recognized primarily under the percentageof completion method during the period in which the Company performs the service or development efforts inaccordance with the agreement. Services performed under these types of contracts include engineering studies,
63

KVH INDUSTRIES, INC. AND SUBSIDIARIES
NOTES TO CONSOLIDATED FINANCIAL STATEMENTS—(Continued)December 31, 2012, 2011 and 2010
(in thousands except share and per share amounts)
surveys, building construction, prototype development and program management. Performance is determinedprincipally by comparing the accumulated costs incurred to date with management’s estimate of the total cost tocomplete the contracted work. The Company establishes billing terms at the time project deliverables andmilestones are agreed. Revenues recognized in excess of the amounts invoiced to clients are classified within theaccompanying consolidated balance sheets in the caption “prepaid expenses and other assets.”
Sales related to customer contracts that call for standard product modification or enhancement arerecognized upon the complete delivery and title transfer of all customer-approved products. Costs of contracts inprogress are accumulated within the accompanying consolidated balance sheets in the caption “prepaid expensesand other assets” and relieved upon product delivery or when billed.
The use of contract accounting requires significant judgment relative to estimating total contract revenuesand costs, including assumptions relative to the length of time to complete the contract, the nature andcomplexity of the work to be performed, and prices for subcontractor services and materials. The risk to theCompany on a fixed-price contract is that if estimates to complete the contract change from one period to thenext, profit levels will vary from period to period. The Company’s estimates are based upon the professionalknowledge and experience of its engineers, program managers and other personnel, who review each long-termcontract monthly to assess the contract’s schedule, performance, technical matters and estimated cost atcompletion. Changes in estimates are applied when adjustments in estimated contract costs are identified, suchrevisions may result in current period adjustments to earnings applicable to performance in prior periods. Anyadvance payments arising from such extended-term development contracts are recorded as deposits. If, in anyperiod, estimated total costs under a contract indicate an expected loss, then such loss is provided for in thatperiod. Through December 31, 2012, contracted service revenue has not been a significant portion of theCompany’s total sales.
Product service sales. Product service sales other than under development contracts are recognized whencompleted services are provided to the customer and collectability is reasonably assured. The Companyestablishes reserves for potential sales returns, credit and allowances, and evaluates, on a monthly basis, theadequacy of those reserves based upon historical experience and its expectations for the future. ThroughDecember 31, 2012, product service sales have not been a significant portion of the Company’s total sales.
DIRECTV subsidies and commissions. One-time subsidies and new mobile account activation fees fromDIRECTV for customers who activate their DIRECTV service directly through KVH are recognized in themonth of activation. The Company establishes reserves for potential credits for early customer cancellations, on aquarterly basis. The adequacy of those reserves is based upon historical experience. Through December 31, 2012,such payments from DIRECTV have not been a significant portion of the Company’s total sales.
Extended warranty sales. The Company sells extended warranty contracts on mobile communications andguidance and stabilization products. Sales under these contracts are recognized ratably over the contract term.Through December 31, 2012, warranty sales have not been a significant portion of the Company’s total sales.
(f) Fair Value of Financial Instruments
The carrying amounts of the Company’s financial instruments, which include cash equivalents, investments,accounts receivable, accounts payable and accrued expenses approximate their fair values due to the shortmaturity of these instruments. The carrying amount of the Company’s mortgage loan approximates fair value
64

KVH INDUSTRIES, INC. AND SUBSIDIARIES
NOTES TO CONSOLIDATED FINANCIAL STATEMENTS—(Continued)December 31, 2012, 2011 and 2010
(in thousands except share and per share amounts)
based on currently available quoted rates of similarly structured mortgage facilities. See note 2 for moreinformation on the fair value of the Company’s marketable securities.
(g) Cash, Cash Equivalents and Marketable Securities
In accordance with the Company’s investment policy, cash in excess of operational needs is invested inmoney market mutual funds, government agency bonds, United States treasuries, corporate notes, and certificatesof deposit, which are reflected within marketable securities in the accompanying consolidated balance sheets.The Company determines the appropriate classification of marketable securities at each balance sheet date. As ofDecember 31, 2012 and 2011, all of the Company’s marketable securities have been designated as available-for-sale and are carried at their fair value with unrealized gains and losses included in accumulated othercomprehensive (loss) income in the accompanying consolidated balance sheets.
The Company reviews investments in debt securities for other than temporary impairment whenever the fairvalue of an investment is less than amortized cost and evidence indicates that an investment’s carrying amount isnot recoverable within a reasonable period of time. To determine whether an impairment is other-than-temporary,the Company considers whether it intends to sell the security, whether it expects to recover the credit loss, and ifit is more likely than not that the Company will be required to sell the security prior to recovery. Evidenceconsidered in this assessment includes the reasons for the impairment, compliance with the Company’sinvestment policy, the severity and duration of the impairment, changes in value subsequent to year-end andforecasted performance of the investee. The Company has reviewed its securities with unrealized losses as ofDecember 31, 2012 and 2011, and has concluded that no other-than-temporary impairments exist.
(h) Inventories
Inventories are stated at the lower of cost or market using the first-in first-out costing method. The Companyprovides inventory reserves based on excess and obsolete inventory determined primarily by future demandforecasts. The Company records inventory charges to costs of product sales.
(i) Property and Equipment
Property and equipment are stated at cost. Depreciation and amortization are computed on the straight-linemethod over the estimated useful lives of the respective assets. The principal lives used in determining thedepreciation rates of various assets are: buildings and improvements, 5-40 years; machinery, satellite hubs andequipment, 5-10 years; office and computer equipment, 3-7 years; and motor vehicles, 5 years.
(j) Goodwill and Long-lived Assets
All of the Company’s goodwill and intangible assets are associated with the purchase of VirtekCommunication in September 2010.
Goodwill is recorded when the consideration for an acquisition exceeds the fair value of net tangible andidentifiable intangible assets acquired. Goodwill is not amortized, but instead is tested for impairment at leastannually, or if indicators of potential impairment exist by comparing the fair value of the Company’s reportingunit to its carrying value. The Company estimates the fair value of the Virtek Communication reporting unitusing a discounted cash flow model or other valuation models, such as comparative transactions and marketmultiples. The Company performed its annual impairment test as of August 31, 2012 and noted no indicators ofpotential goodwill impairment.
65

KVH INDUSTRIES, INC. AND SUBSIDIARIES
NOTES TO CONSOLIDATED FINANCIAL STATEMENTS—(Continued)December 31, 2012, 2011 and 2010
(in thousands except share and per share amounts)
Intangible assets are comprised of intellectual property, which is amortized over its estimated useful life ofseven years. Intangible assets are reviewed for impairment when events or changes in circumstances indicate thattheir carrying amounts may not be recoverable based upon the estimated undiscounted cash flows. No events orchanges in circumstances indicated that any of the carrying amounts of the Company’s intangible assets may notbe recoverable during 2012.
Intangible assets with estimated lives and other long-lived assets are reviewed for impairment when eventsor changes in circumstances indicate that the carrying amount of an asset may not be recoverable. Recoverabilityof intangible assets with estimated lives and other long-lived assets is measured by a comparison of the carryingamount of an asset or asset group to future net undiscounted cash flows expected to be generated by the asset orasset group. If these comparisons indicate that an asset is not recoverable, the Company will recognize animpairment loss for the amount by which the carrying value of the asset or asset group exceeds the relatedestimated fair value. Estimated fair value is based on either discounted future operating cash flows or appraisedvalues, depending on the nature of the asset. See note 9 for further discussion of goodwill and intangible assets.
(k) Other Non-Current Assets
Other non-current assets are primarily comprised of long-term lease receivables, prepaid expenses, anddeposits.
(l) Product Warranty
The Company’s products carry limited warranties that range from one to four years and vary by product.The warranty period begins on the date of retail purchase or lease by the original purchaser. The Companyaccrues estimated product warranty costs at the time of sale and any additional amounts are recorded when suchcosts are probable and can be reasonably estimated. Factors that affect the Company’s warranty liability includethe number of units sold or leased, historical and anticipated rates of warranty repairs and the cost per repair.Warranty and related costs are reflected within sales, marketing and support in the accompanying statements ofoperations. As of December 31, 2012 and 2011, the Company had accrued product warranty costs of $814 and$933, respectively. The following table summarizes product warranty activity during 2012 and 2011:
2012 2011
Beginning balance $ 933 $ 887Charges to expense 419 772Costs incurred (538) (726)
Ending balance $ 814 $ 933
(m) Shipping and Handling Costs
Shipping and handling costs are expensed as incurred and included in cost of sales. Billings for shipping andhandling are reflected within net sales in the accompanying statements of operations.
66

KVH INDUSTRIES, INC. AND SUBSIDIARIES
NOTES TO CONSOLIDATED FINANCIAL STATEMENTS—(Continued)December 31, 2012, 2011 and 2010
(in thousands except share and per share amounts)
(n) Research and Development
Expenditures for research and development, including customer-funded research and development, areexpensed as incurred. Revenue and related development costs from customer-funded research and developmentare as follows:
Year Ended December 31,
2012 2011 2010
Customer-funded product sales $ — $ — $4,478Customer-funded service sales 5,470 1,061 1,062Customer-funded costs included in costs of service sales 3,424 412 953Customer-funded costs included in costs of product sales — — 1,001
(o) Advertising Costs
Costs related to advertising are expensed as incurred. Advertising expense was $2,523, $2,081, and $2,171for the years ended December 31, 2012, 2011, and 2010, respectively, and is included in sales, marketing, andsupport expense in the accompanying consolidated statements of operations.
(p) Foreign Currency Translation
The financial statements of the Company’s foreign subsidiaries located in Denmark and Singapore aremaintained using the United States dollar as the functional currency. Exchange rates in effect on the date of thetransaction are used to record monetary assets and liabilities. Revenue and other expense elements are recordedat rates that approximate the rates in effect on the transaction dates. Realized foreign currency remeasurementgains and losses are recognized within “other income (expense)” in the accompanying consolidated statements ofoperations. For the years ended December 31, 2012, 2011, and 2010, the Company experienced foreign currencylosses of $37, $79 and $22, respectively.
The financial statements of the Company’s Brazilian, Norwegian and Japanese subsidiaries use the foreignsubsidiaries’ respective local currencies as the functional currency. The Company translates the assets andliabilities of these foreign subsidiaries at the exchange rates in effect at year-end. Net sales, costs and expensesare translated using average exchange rates in effect during the year. Gains and losses from foreign currencytranslation are credited or charged to accumulated other comprehensive (loss) income included in stockholders’equity in the accompanying consolidated balance sheets.
(q) Income Taxes
Income taxes are accounted for under the asset and liability method. Under the asset and liability method,deferred tax assets and liabilities are recognized for the future tax consequences attributable to differencesbetween the financial statement carrying amounts of existing assets and liabilities and their respective tax bases.
Deferred tax assets and liabilities are measured using enacted tax rates expected to apply to taxable incomein the years in which those temporary differences are expected to be recovered or settled. The effect on deferredtax assets and liabilities of a change in tax rates is recognized in income in the period that includes the enactmentdate. The Company records valuation allowances to reduce deferred income tax assets to the amount that is more
67

KVH INDUSTRIES, INC. AND SUBSIDIARIES
NOTES TO CONSOLIDATED FINANCIAL STATEMENTS—(Continued)December 31, 2012, 2011 and 2010
(in thousands except share and per share amounts)
likely than not to be realized. The Company determines whether it is more likely than not that a tax position willbe sustained upon examination. If it is not more likely than not that a position will be sustained, no amount of thebenefit attributable to the position is recognized. The tax benefit to be recognized of any tax position that meetsthe more likely than not recognition threshold is calculated as the largest amount that is more than 50% likely ofbeing realized upon resolution of the contingency. See note 8 for further discussion of income taxes.
(r) Net Income per Common Share
Basic net income per share is calculated based on the weighted average number of common sharesoutstanding during the period. Diluted net income per share incorporates the dilutive effect of common stockequivalent options, warrants and other convertible securities, if any, as determined in accordance with thetreasury stock accounting method. Common stock equivalents related to options and restricted stock awards for861,823, 597,463, and 196,076 shares of common stock for the years ended December 31, 2012, 2011, and 2010respectively, have been excluded from the fully diluted calculation of net income per share, as inclusion wouldbe anti-dilutive.
A reconciliation of the basic and diluted weighted average common shares outstanding is as follows:
2012 2011 2010
Weighted average common shares outstanding—basic 14,777,175 14,767,606 14,419,599Dilutive common shares issuable in connection with stock plans 241,776 304,736 430,726
Weighted average common shares outstanding—diluted 15,018,951 15,072,342 14,850,325
(s) Contingent Liabilities
The Company estimates the amount of potential exposure it may have with respect to claims, assessmentsand litigation in accordance with ASC 450, Contingencies. The Company is not party to any lawsuit orproceeding that, in management’s opinion, is likely to materially harm the Company’s business, results ofoperations, financial condition or cash flows, as described in note 16. It is not always possible to predict theoutcome of litigation, as it is subject to many uncertainties. Additionally, it is not always possible formanagement to make a meaningful estimate of the potential loss or range of loss associated with such litigation.As of December 31, 2012, no losses have been accrued with respect to pending litigation.
(t) Operating Segments
The Company operates in a single segment. Operating segments are identified as components of anenterprise about which separate discrete financial information is available for evaluation by the chief operatingdecision maker in making decisions regarding resource allocation and assessing performance. To date, the chiefoperating decision maker has made such decisions and assessed performance at the company level, as onesegment. The Company’s chief operating decision maker is its President, Chief Executive Officer and Chairmanof the Board.
(u) Recent Accounting Pronouncements Adopted During the Year Ended December 31, 2012
In May 2011, the Financial Accounting Standards Board, or FASB issued Accounting Standards Update 2011-04,“Fair Value Measurement (Topic 820): Amendments to Achieve Common Fair Value Measurement and DisclosureRequirements in U.S. GAAP and IFRS”, which amended ASC 820, “Fair Value Measurements and Disclosures.” This
68

KVH INDUSTRIES, INC. AND SUBSIDIARIES
NOTES TO CONSOLIDATED FINANCIAL STATEMENTS—(Continued)December 31, 2012, 2011 and 2010
(in thousands except share and per share amounts)
guidance addresses efforts to achieve convergence between U.S. GAAP and International Financial ReportingStandards (IFRS) requirements for measurement of and disclosures about fair value. The amendments are not expectedto have a significant impact on companies applying U.S. GAAP. Key provisions of the amendment include: aprohibition on grouping financial instruments for purposes of determining fair value, except when an entity managesmarket and credit risks on the basis of the entity’s net exposure to the group; an extension of the prohibition against theuse of a blockage factor to all fair value measurements (that prohibition currently applies only to financial instrumentswith quoted prices in active markets); and a requirement that for recurring Level 3 fair value measurements, entitiesdisclose quantitative information about unobservable inputs, a description of the valuation process used and qualitativedetails about the sensitivity of the measurements. In addition, for items not carried at fair value but for which fair valueis disclosed, entities will be required to disclose the level within the fair value hierarchy that applies to the fair valuemeasurement disclosed. This guidance is effective for the Company in its interim and annual reporting periodsbeginning after December 15, 2011. Adoption of this guidance did not have a significant impact on the determinationor reporting of the Company’s financial results.
In June 2011, the FASB issued Accounting Standards Update 2011-05, “Comprehensive Income (ASCTopic 220): Presentation of Comprehensive Income,” (ASU 2011-05) which amends current comprehensiveincome guidance. This accounting update eliminates the option to present the components of othercomprehensive income as part of the statement of shareholders’ equity. Instead, the Company must reportcomprehensive income in either a single continuous statement of comprehensive income which contains twosections, net income and other comprehensive income, or in two separate but consecutive statements. ASU 2011-05 is effective for public companies during the interim and annual periods beginning after December 15, 2011with early adoption permitted. The adoption of ASU 2011-05 did not have an impact on the Company’sconsolidated financial position, results of operations or cash flows as it only requires a change in the format ofthe current presentation.
In September 2011, the FASB issued Accounting Standards Update 2011-08, “Intangibles—Goodwill andOther (Topic 350): Testing for Goodwill Impairment,” (ASU 2011-8). ASU 2011-8 gives companies the optionto perform a qualitative assessment to determine whether it is more likely than not (a likelihood of more than50%) that the fair value of a reporting unit is less than its carrying amount, and in some cases, skip the two-stepimpairment test. The objective of the revised standard is to simplify how an entity tests goodwill for impairmentand to reduce the cost and complexity of the annual goodwill impairment test. ASU 2011-8 is effective for fiscalyears beginning after December 15, 2011, with early adoption permitted. The adoption of ASU 2011-8 did nothave a significant impact on the determination or reporting of the Company’s financial results.
In December 2011, the FASB issued Accounting Standards Update No. 2011-12, “Deferral of the EffectiveDate for Amendments to the Presentation of Reclassifications of Items Out of Accumulated OtherComprehensive Income in Accounting Standards Update No. 2011-5,” (ASU 2011-12). ASU 2011-12 defers theprovisions of ASU 2011-05 that relate to the presentation of reclassification adjustments. The amendments in thisupdate are effective for fiscal years beginning after December 15, 2011. The Company adopted the deferralprovisions of this pronouncement as of January 1, 2012. The adoption did not have an impact on the Company’sfinancial position or results of operations.
In July 2012, the FASB issued Accounting Standards Update 2012-02, “Testing Indefinite-Lived IntangibleAssets for Impairment,” which allows an organization to first assess qualitative factors to determine whether it isnecessary to perform the quantitative impairment test for indefinite-lived intangible assets. An organization thatelects to perform a qualitative assessment no longer is required to calculate the fair value of an indefinite-livedintangible asset unless it determines that it is more likely than not that the asset is impaired. The guidance, which
69

KVH INDUSTRIES, INC. AND SUBSIDIARIES
NOTES TO CONSOLIDATED FINANCIAL STATEMENTS—(Continued)December 31, 2012, 2011 and 2010
(in thousands except share and per share amounts)
applies to all public, private, and not-for-profit organizations, is effective for annual and interim impairment testsperformed for fiscal years beginning after September 15, 2012, with early adoption permitted. The adoption ofthis guidance did not have a significant impact on the Company’s financial position or results of operations.
(2) Marketable Securities
Included in marketable securities as of December 31, 2012 and 2011 are the following:
December 31, 2012Amortized
Cost
GrossUnrealized
Gains
GrossUnrealized
LossesFair
Value
Money market mutual funds $ 9,921 $— $— $ 9,921Government agency bonds 6,816 1 — 6,817United States treasuries 6,089 — — 6,089Corporate notes 4,682 (3) 4,679Certificates of deposit 1,800 — — 1,800
Total marketable securities designated as availablefor sale $29,308 $ 1 $ (3) $29,306
December 31, 2011Amortized
Cost
GrossUnrealized
Gains
GrossUnrealized
LossesFair
Value
Money market mutual funds $ 8,818 $— $— $ 8,818Government agency bonds 9,014 1 — 9,015United States treasuries — — — —Corporate notes 3,019 — — 3,019Certificates of deposit 2,701 — — 2,701
Total marketable securities designated as availablefor sale $23,552 $ 1 $— $23,553
The amortized costs and fair value of debt securities as of December 31, 2012 and 2011 are shown below byeffective maturity. Effective maturities may differ from contractual maturities because the issuers of thesecurities may have the right to prepay obligations without prepayment penalties.
December 31, 2012Amortized
CostFair
Value
Due in less than one year $22,485 $22,485Due after one year and within two years 6,823 6,821
$29,308 $29,306
December 31, 2011Amortized
CostFair
Value
Due in less than one year $15,538 $15,538Due after one year and within two years 8,014 8,015
$23,552 $23,553
70

KVH INDUSTRIES, INC. AND SUBSIDIARIES
NOTES TO CONSOLIDATED FINANCIAL STATEMENTS—(Continued)December 31, 2012, 2011 and 2010
(in thousands except share and per share amounts)
No realized gains or losses were recognized on the Company’s marketable securities during the years endedDecember 31, 2012 and 2011.
(3) Inventories
Inventories as of December 31, 2012 and 2011 include the costs of material, labor, and factory overhead.Inventories consist of the following:
December 31,
2012 2011
Raw materials $ 9,173 $11,039Work in process 1,789 1,805Finished goods 5,241 5,771
$16,203 $18,615
(4) Property and Equipment
Property and equipment, net, as of December 31, 2012 and 2011 consist of the following:
December 31,
2012 2011
Land $ 3,827 $ 3,827Building and improvements 21,297 19,815Leasehold improvements 286 222Machinery and equipment 32,266 27,701Office and computer equipment 10,663 9,887Motor vehicles 51 66
68,390 61,518Less accumulated depreciation (31,657) (27,508)
$ 36,733 $ 34,010
Depreciation for the years ended December 31, 2012, 2011, and 2010 amounted to $4,216, $4,043, and$3,744, respectively.
(5) Debt and Line of Credit
On April 6, 2009, the Company entered into a mortgage loan in the amount of $4,000 related to itsheadquarters facility in Middletown, Rhode Island. The loan term is ten years, with a principal amortization oftwenty years, and the interest rate will be a rate per year adjusted periodically based on a defined interest periodequal to the BBA LIBOR Rate plus 2.25 percentage points. On June 9, 2011, the Company entered into anamendment to the mortgage loan, providing for an adjustment of the interest rate from the BBA LIBOR Rate plus2.25 percentage points to the BBA LIBOR Rate plus 2.00 points. Land, building and improvements with anapproximate carrying value of $4,362 as of December 31, 2012 secure the mortgage loan. The monthly mortgagepayment is approximately $11 plus interest and increases in increments of approximately $1 each year throughout
71

KVH INDUSTRIES, INC. AND SUBSIDIARIES
NOTES TO CONSOLIDATED FINANCIAL STATEMENTS—(Continued)December 31, 2012, 2011 and 2010
(in thousands except share and per share amounts)
the life of the mortgage. Due to the difference in the term of the loan and amortization of the principal, a balloonpayment of $2,551 is due on April 1, 2019. The loan contains one financial covenant, a Fixed Charge CoverageRatio, which applies in the event that the Company’s consolidated cash, cash equivalents and marketable securitiesbalance falls below $25,000 at any time. As the Company’s consolidated cash, cash equivalents and marketablesecurities balance was above $25,000 throughout the year ended December 31, 2012, the Fixed Charge CoverageRatio did not apply. Under the mortgage loan, the Company may prepay its outstanding loan balance subject tocertain early termination charges as defined in the mortgage loan agreement. If the Company were to default on itsmortgage loan, the land, building and improvements would be used as collateral.
The following is a summary of future principal payments under the mortgage:
Year ending December 31,PrincipalPayment
2013 $ 1382014 1462015 1542016 1632017 172Thereafter 2,780
Total outstanding at December 31, 2012 $3,553
The Company currently has a revolving loan agreement with a bank that provides for a maximum availablecredit of $15,000 and will expire on December 31, 2014. The Company pays interest on any outstanding amountsat a rate equal to the BBA LIBOR Daily Floating Rate plus 1.25%. The line of credit contains two financialcovenants, a Liquidity Covenant, which requires the Company to maintain at least $20,000 in unencumberedliquid assets, as defined in the loan agreement, and a Fixed Charge Coverage Ratio. As of December 31, 2012,the Company was not in default of either covenant. Subject to the terms of the agreement and so long as no eventof default has occurred, until September 30, 2013, the Company has the option of converting up to $12,000 ofrevolving loans into one or more term loans at a floating interest rate equal to LIBOR plus 1.75%. The Companymay terminate the loan agreement prior to its full term without penalty, provided the Company gives 30 days’advance written notice to the bank. As of December 31, 2012, the Company had borrowed $7,000 under thefacility, the repayment of which is due no later than the maturity date of December 31, 2014.
Total commitment fees related to the line of credit were $27, $49, and $49 for the years ended December 31,2012, 2011, and 2010, respectively.
72

KVH INDUSTRIES, INC. AND SUBSIDIARIES
NOTES TO CONSOLIDATED FINANCIAL STATEMENTS—(Continued)December 31, 2012, 2011 and 2010
(in thousands except share and per share amounts)
(6) Commitments and Contingencies
The Company has certain operating leases for satellite capacity, various equipment, and facilities. Thefollowing reflects future minimum payments under operating leases that have initial or remaining non-cancelablelease terms at December 31, 2012:
Years ending December 31,Operating
Leases
2013 $12,6202014 10,0402015 5,4542016 3,1732017 2,034Thereafter 540
Total minimum lease payments $33,861
Total rent expense incurred under facility operating leases for the years ended December 31, 2012, 2011,and 2010 amounted to $302, $745, and $754, respectively.
In the normal course of business, the Company enters into unconditional purchase order obligations with itssuppliers for inventory and other operational purchases. Outstanding and unconditional purchase orderobligations were $21,200 as of December 31, 2012.
The Company did not have any off-balance sheet commitments, guarantees, or standby repurchaseobligations as of December 31, 2012.
(7) Stockholders’ Equity
(a) Employee Stock Options
Options are granted with an exercise price equal to the fair market value of the common stock on the date ofgrant and generally vest in equal annual amounts over four years beginning on the first anniversary of the date ofthe grant. No options are exercisable for periods of more than 5 years after date of grant. Under the Company’sAmended and Restated 2006 Stock Incentive Plan, each share issued under awards other than options will reducethe number of shares reserved for issuance by two shares. Shares issued under options will reduce the sharesreserved for issuance on a share-for-share basis. All plans were approved by the Company’s shareholders,pursuant to which 7,165,000 shares of the Company’s common stock were reserved for issuance. As ofDecember 31, 2012, 6,028,661 options and awards to purchase shares of common stock had been issued orexpired and 1,136,339 were available for future grants. The Compensation Committee of the Board of Directorsadministers the plans, approves the individuals to whom options will be granted and determines the number ofshares and exercise price of each option. Outstanding options under the plans at December 31, 2012 expire fromJanuary 2013 through November 2017. None of the Company’s outstanding options includes performance-basedor market-based vesting conditions as of December 31, 2012.
The Company has estimated the fair value of each option grant on the date of grant using the Black-Scholesoption-pricing model. The expected volatility assumption is based on the historical daily price data of theCompany’s common stock over a period equivalent to the weighted average expected life of the Company’soptions. The expected term of options granted is derived using assumed exercise rates based on historical exercise
73

KVH INDUSTRIES, INC. AND SUBSIDIARIES
NOTES TO CONSOLIDATED FINANCIAL STATEMENTS—(Continued)December 31, 2012, 2011 and 2010
(in thousands except share and per share amounts)
patterns and represents the period of time the options granted are expected to be outstanding. The risk-free interestrate is based on the actual U.S. Treasury zero-coupon rates for bonds matching the expected term of the option as ofthe option grant date. The dividend yield of zero is based upon the fact that the Company has not historicallydeclared or paid cash dividends, and does not expect to declare or pay dividends in the foreseeable future.
The per share weighted-average fair values of stock options granted during 2012, 2011 and 2010 were$4.97, $6.36, and $6.54, respectively. The weighted-average assumptions used to value options as of their grantdate were as follows:
Year EndedDecember 31,
2012 2011 2010
Risk-free interest rate 0.69% 1.65% 0.95%Expected volatility 64.6% 60.4% 60.0%Expected life (in years) 4.22 4.23 4.18Dividend yield 0% 0% 0%
The changes in outstanding stock options for the year ended December 31, 2012, are as follows:
Number of OptionsWeighted Average
Exercise Price
Weighted AverageRemaining
Contractual Life(in Years)
Aggregate IntrinsicValue
Outstanding at December 31, 2011 816,077 $11.28Granted 496,240 9.92Exercised (80,255) 8.58Expired, canceled or forfeited (154,264) 10.72
Outstanding at December 31, 2012 1,077,798 $10.93 3.28 $3,391
Exercisable at December 31, 2012 290,911 $10.52 1.78 $1,032
The total intrinsic value of options exercised was $173, $183, and $1,157 in 2012, 2011 and 2010,respectively. The total aggregate intrinsic value of options outstanding at December 31, 2011 and 2010 was $112and $1,254, respectively. The total aggregate intrinsic value of options exercisable at December 31, 2011 and2010 was $85 and $851, respectively.
As of December 31, 2011 and 2010, the number of options exercisable was 361,994 and 416,710,respectively, and the weighted average exercise price of those options was $9.36 and $10.06 per share,respectively. The weighted average remaining contractual term for options exercisable at December 31, 2011 and2010 was 1.18 and 1.44 years, respectively. The weighted average remaining contractual term for optionsoutstanding at December 31, 2011 and 2010 was 2.63 and 2.28 years, respectively.
As of December 31, 2012, there was $2,913 of total unrecognized compensation expense related to stockoptions, which is expected to be recognized over a weighted-average period of 2.83 years. In 2012, 2011 and2010, the Company recorded compensation charges of $1,130, $709 and $514, respectively, related to stockoptions. Compensation costs for options subject only to service conditions that vest ratably are recognized on astraight-line basis over the requisite service period for the entire award. During 2012, 2011 and 2010, cashreceived under stock option plans for exercises was $689, $652 and $3,685, respectively.
74

KVH INDUSTRIES, INC. AND SUBSIDIARIES
NOTES TO CONSOLIDATED FINANCIAL STATEMENTS—(Continued)December 31, 2012, 2011 and 2010
(in thousands except share and per share amounts)
(b) Restricted Stock
The Company granted 43,340, 167,500 and 324,321 restricted stock awards to employees under the terms ofthe Amended and Restated 2006 Stock Incentive Plan for the years ended December 31, 2012, 2011, and 2010,respectively. The restricted stock awards vest annually over four years from the date of grant subject to therecipient remaining an employee through the applicable vesting dates. Compensation expense for restricted stockawards is measured at fair value on the date of grant based on the number of shares granted and the quotedmarket closing price of the Company’s common stock. Such value is recognized as expense over the vestingperiod of the award, net of estimated forfeitures. The weighted-average grant-date fair value of restricted stockgranted during 2012, 2011 and 2010 was $12.53, $13.29 and $13.12 per share, respectively.
As of December 31, 2012, there was $2,448 of total unrecognized compensation expense related to restrictedstock awards, which is expected to be recognized over a weighted-average period of 1.16 years. Compensation costsfor awards subject only to service conditions that vest ratably are recognized on a straight-line basis over therequisite service period for the entire award. Compensation cost for awards initially subject to certain performanceconditions are recognized on a ratable basis over the requisite service period for the entire award. In 2012, 2011 and2010, the Company recorded compensation charges of $2,495, $2,728 and $1,942, respectively, related to restrictedstock awards.
Restricted stock activity under the Amended and Restated 2006 Stock Incentive Plan for 2012 is as follows:
Number ofShares
Weighted-average
grant datefair value
Outstanding at December 31, 2011, nonvested 615,848 $10.10Granted 43,340 12.53Vested (283,934) 9.23Forfeited (3,643) 10.33
Outstanding at December 31, 2012, nonvested 371,611 $11.05
(c) Employee Stock Purchase Plan
Under the Company’s Amended and Restated Employee Stock Purchase Plan (ESPP), the Company isauthorized to issue up to 600,000 shares of common stock, of which 36,100 shares remain available as ofDecember 31, 2012.
The ESPP covers all of the Company’s employees. Under the terms of the ESPP, eligible employees canelect to have up to six percent of their pre-tax compensation withheld to purchase shares of the Company’scommon stock on a semi-annual basis. The ESPP allows eligible employees the right to purchase the Company’scommon stock on a semi-annual basis at 85% of the market price at the end of each purchase period. During2012, 2011 and 2010, 27,308, 38,718, and 21,654 shares, respectively, were issued under this plan. The Companyutilizes the Black-Scholes option-pricing model to calculate the fair value of these discounted purchases. The fairvalue of the 15% discount is recognized as compensation expense over the purchase period. The Companyapplies a graded vesting approach because the ESPP provides for multiple purchase periods and is, in substance,a series of linked awards. In 2012, 2011 and 2010, the Company recorded compensation charges of $54, $96 and$68, respectively, related to the ESPP. During 2012, 2011 and 2010, cash received under the ESPP was $270,$289 and $260, respectively.
75

KVH INDUSTRIES, INC. AND SUBSIDIARIES
NOTES TO CONSOLIDATED FINANCIAL STATEMENTS—(Continued)December 31, 2012, 2011 and 2010
(in thousands except share and per share amounts)
(8) Income Taxes
Income tax expense (benefit) for the years ended December 31, 2012, 2011, and 2010 attributable to income(loss) from operations is presented below.
Current Deferred Total
Year ended December 31, 2012Federal $ 715 $ 2,036 $ 2,751State 146 254 400Foreign 248 (137) 111
$1,109 $ 2,153 $ 3,262
Year ended December 31, 2011Federal $ (16) $ 120 $ 104State 179 (955) (776)Foreign 212 (24) 188
$ 375 $ (859) $ (484)
Year ended December 31, 2010Federal $ 217 $(2,142) $(1,925)State 136 (998) (862)Foreign 154 21 175
$ 507 $(3,119) $(2,612)
The actual income tax expense (benefit) differs from the “expected” income tax expense (benefit) computedby applying the United States Federal corporate income tax rate of 35% to income before tax expense (benefit) asfollows:
Year Ended December 31,
2012 2011 2010
Computed “expected” tax expense $2,395 $ 131 $ 1,981Decrease in income taxes resulting from:State income tax expense, net of federal benefit 674 83 636State research and development, investment credits (301) (1,006) (342)Non-deductible expenses 116 101 268Foreign tax rate differential (27) (42) (28)Federal research and development credits — (351) (378)Adjustments to operating loss carry-forwards and other
deferred taxes, net (33) (44) (346)Stock-based compensation (30) 306 146Change in valuation allowance 468 338 (4,549)
Net income tax expense (benefit) $3,262 $ (484) $(2,612)
76

KVH INDUSTRIES, INC. AND SUBSIDIARIES
NOTES TO CONSOLIDATED FINANCIAL STATEMENTS—(Continued)December 31, 2012, 2011 and 2010
(in thousands except share and per share amounts)
The components of results of income from operations before income tax expense (benefit) determined bytax jurisdiction, are as follows:
Year Ended December 31,
2012 2011 2010
United States $ 7,917 $ 971 $5,458Denmark (295) (161) 390Norway 570 726 61Brazil (1,375) (1,210) (260)Singapore 25 49 12Japan 1 — —
Total $ 6,843 $ 375 $5,661
The tax effects of temporary differences that give rise to significant portions of deferred tax assets andliabilities as of the dates presented are as follows:
December 31,
2012 2011
Deferred tax assets:Accounts receivable, due to allowance for doubtful accounts $ 313 $ 355Inventories 289 283Operating loss carry-forwards 1,011 2,674Stock-based compensation expense 1,194 1,197Intangible assets due to differences in amortization 74 56Research and development, alternative minimum tax credit
carry-forwards 3,507 3,838Foreign tax credit carry-forwards 1,111 1,146State tax credit carry-forwards 2,228 2,415Accrued expenses 688 741
Gross deferred tax assets 10,415 12,705Less valuation allowance (2,136) (2,576)
Total deferred tax assets 8,279 10,129
Deferred tax liabilities:Purchased intangible assets (433) (543)Property and equipment, due to differences in depreciation (3,176) (2,900)
Total deferred tax liabilities (3,609) (3,443)
Net deferred tax assets $ 4,670 $ 6,686
Net deferred tax asset—current $ 1,146 $ 1,281Net deferred tax asset—noncurrent $ 3,524 $ 5,405
As of December 31, 2012, the Company had federal net operating loss carry-forwards available to offsetfuture taxable income of $521. The Company also had foreign net operating loss carry-forwards available tooffset future foreign income of $2,936. The federal net operating loss carry-forwards expire in years 2024
77

KVH INDUSTRIES, INC. AND SUBSIDIARIES
NOTES TO CONSOLIDATED FINANCIAL STATEMENTS—(Continued)December 31, 2012, 2011 and 2010
(in thousands except share and per share amounts)
through 2031. The foreign net operating loss carry-forwards have no expiration. The tax benefit related to $521of federal net operating loss carry-forwards would occur upon utilization of these deferred tax assets to reducetaxes payable and would result in a credit to additional paid-in capital within stockholders’ equity rather than theprovision for income taxes.
As of December 31, 2012, the Company had federal research and development tax credit carry-forwards inthe amount of $3,916 that expire in years 2021 through 2031, and foreign tax credit carry-forwards in the amountof $1,146 that expire in years 2015 through 2021. The Company also had alternative minimum tax credits of$223 that have no expiration date. As of December 31, 2012, the Company had state research and developmenttax credit carry-forwards in the amount of $2,936 that expire in years 2012 through 2018. The Company also hadother state tax credit carry-forwards of $714 available to reduce future state tax expense that expire in years 2012through 2018. The tax benefit related to $1,870 of federal and state tax credits would occur upon utilization ofthese deferred tax assets to reduce taxes payable and would result in a credit to additional paid-in capital withinstockholders’ equity rather than the provision for income taxes.
The Company’s ability to utilize these net operating loss carry-forwards and tax credit carry-forwards maybe limited in the future if the Company experiences an ownership change pursuant to Internal Revenue CodeSection 382. An ownership change occurs when the ownership percentages of 5% or greater stockholders changeby more than 50% over a three-year period.
For the years ended December 31, 2012, 2011, and 2010, the Company generated income before incometaxes of $6,843, $375 and $5,661, respectively. In assessing the realizability of its net deferred tax assets, theCompany considered whether it is more likely than not that some portion or all of the deferred tax assets will notbe realized. The ultimate realization of deferred tax assets depends upon the generation of future taxable incomeduring the periods in which those temporary differences become deductible. As of December 31, 2012, basedupon an evaluation of the positive and negative evidence, the Company concluded that a reduction of $440 of thedeferred tax asset valuation allowance was appropriate, resulting in a remaining valuation allowance of $2,136 asof December 31, 2012. The net decrease in valuation allowance of $440 resulted in additional tax expense of$267 primarily from net operating losses incurred in 2012 that the Company does not expect to realize the taxbenefit. The valuation allowance change also includes the expiration of previously reserved state tax creditcarryforwards, and a decrease in net operating losses and credit carryforwards attributed to tax deductions inexcess of recognized stock compensation expense that did not impact tax expense. For the year endedDecember 31, 2012, the Company has recorded valuation allowances of approximately $1,086 against certainstate tax credits and foreign net operating loss carryforwards, and intends to maintain the valuation allowanceuntil sufficient evidence exists to support the reversal of all or a portion of these valuation allowances.
In addition, the Company continues to maintain a $1,050 valuation allowance against net operating lossesand credits carryforwards attributed to tax deductions in excess of recognized compensation cost from employeestock compensation awards that existed as of the adoption of ASC 718. The Company will recognize the netdeferred tax asset and corresponding benefit to additional paid-in capital for these windfall tax benefits once suchamounts reduce income taxes payable, in accordance with the requirements of ASC 718.
The Company’s income taxes currently payable for federal and state purposes have been reduced by thebenefit of the tax deduction in excess of recognized compensation cost from employee stock compensationtransactions in the amount of $619 which has been recorded as an increase to additional paid-in capital for theyear ended December 31, 2012.
78

KVH INDUSTRIES, INC. AND SUBSIDIARIES
NOTES TO CONSOLIDATED FINANCIAL STATEMENTS—(Continued)December 31, 2012, 2011 and 2010
(in thousands except share and per share amounts)
As of December 31, 2012, the Company has not provided for U.S. deferred income taxes on undistributedearnings of its foreign subsidiaries of approximately $1,692 since these earnings are expected to be indefinitelyreinvested. Upon distribution of those earnings in the form of dividends or otherwise, the Company will besubject to additional U.S. and state income taxes (less foreign tax credits), as well as withholding taxes in itsforeign locations. The amount of taxes attributable to the undistributed earnings is not practicably determinable.
On January 2, 2013, the President signed into law The American Taxpayer Relief Act of 2012. Under theprior law, a taxpayer was entitled to a research tax credit for qualifying amounts paid or incurred on or beforeDecember 31, 2011. The 2012 American Taxpayer Relief Act extends the research credit for two years toDecember 31, 2013. The extension of the research credit is retroactive and includes amounts paid or incurredafter December 31, 2011. As a result of the retroactive extension, we expect to recognize a benefit ofapproximately $128 for qualifying amounts incurred in 2012. The benefit will be recognized in the period ofenactment, which is the first quarter of 2013.
The Company establishes reserves for uncertain tax positions based on management’s assessment ofexposure associated with tax deductions, permanent tax differences and tax credits. The tax reserves are analyzedperiodically and adjustments are made as events occur to warrant adjustment to the reserve.
The Company did not have any material unrecognized tax benefits at December 31, 2012, 2011 or 2010.The Company’s policy is to recognize interest and penalties related to unrecognized tax benefits as a componentof income tax expense. The Company’s tax jurisdictions include the United States, Denmark, Brazil, Norway,Singapore and Japan. In general, the statute of limitations with respect to the Company’s United States federalincome taxes has expired for years prior to 2008, and the relevant state and foreign statutes vary. However,preceding years remain open to examination by United States federal and state and foreign taxing authorities tothe extent of future utilization of net operating losses and research and development tax credits generated in eachpreceding year. The Company is no longer subject to income tax examinations by the Danish tax authorities foryears prior to 2009.
(9) Goodwill and Intangible Assets
On September 13, 2010, the Company’s Danish subsidiary, KVH Europe A/S, completed the purchase ofVirtek Communication for approximately $6,500. The purchase was made using existing cash, cash equivalentsand marketable securities. In connection with this acquisition, the Company recorded $4,517 of goodwill,primarily related to expected synergies from combining operations and the value of the existing workforce, and$2,372 of intangible assets related to intellectual property.
December 31, 2012 Useful Life CostAccumulatedAmortization
ForeignCurrency
TranslationAdjustment
Net CarryingValue
Intellectual property 7 years $2,372 $826 $138 $1,684
The Company amortizes its intangible assets over the estimated useful lives of the respective assets.Amortization expense related to intangible assets was $394, $333 and $101 for years ended December 31, 2012,2011, and 2010, respectively.
79

KVH INDUSTRIES, INC. AND SUBSIDIARIES
NOTES TO CONSOLIDATED FINANCIAL STATEMENTS—(Continued)December 31, 2012, 2011 and 2010
(in thousands except share and per share amounts)
Estimated future amortization expense for intangible assets recorded by the Company at December 31, 2012is as follows:
Years ending December 31,Amortization
Expense
2013 $ 3582014 3582015 3582016 3582017 252
Thereafter —
Total amortization expense $1,684
Goodwill is recorded when the consideration for an acquisition exceeds the fair value of net tangible andidentifiable intangible assets acquired. The changes in the carrying amount of goodwill during the year endedDecember 31, 2012 is as follows:
2012
Balance at January 1 $4,426Foreign currency translation adjustment 286
Balance at December 31 $4,712
(10) 401(k) Plan
The Company has a 401(k) Plan (the Plan) for all eligible employees. Participants may defer a portion oftheir pre-tax earnings subject to limits determined by the Internal Revenue Service. Participants age 50 or oldermay be eligible to make additional contributions. As of December 31, 2012, the Company matches one half ofthe first 4% contributed by the Plan participants. The Company’s contributions vest over a five-year period fromthe date of hire. Total Company matching contributions were $352, $335 and $326 for the years endedDecember 31, 2012, 2011, and 2010, respectively. In addition, the Company may make contributions to the Planat the discretion of the Compensation Committee of the Board of Directors. There were no discretionarycontributions in 2012, 2011, or 2010.
(11) Business and Credit Concentrations
Significant portions of the Company’s net sales are as follows:
Year EndedDecember 31,
2012 2011 2010
Net sales to foreign customers outside the U.S. and Canada 40% 29% 32%Net sales to SANG 11% * *Net sales to General Dynamics Land Systems-Canada * 11% *Net sales to Kongsberg Defence & Aerospace AS (Kongsberg) * * 14%
* Represents less than 10% of net sales.
80

KVH INDUSTRIES, INC. AND SUBSIDIARIES
NOTES TO CONSOLIDATED FINANCIAL STATEMENTS—(Continued)December 31, 2012, 2011 and 2010
(in thousands except share and per share amounts)
The terms and conditions of sales to SANG, General Dynamics and Kongsberg are consistent with theCompany’s standard terms and conditions of product sales as discussed in note 1 of the Company’s consolidatedfinancial statements. All receivable balances outstanding for these customers as of December 31, 2012 were paidas of the date of this report. No other individual customer accounted for more than 10% of the Company’s netsales for the years ended December 31, 2012, 2011, and 2010, respectively.
(12) Segment Reporting
Under common operational management, the Company designs, develops, manufactures and markets itsnavigation, guidance and stabilization and mobile communications products for use in a wide variety ofapplications. Products are generally sold directly to third-party consumer electronic dealers and retailers, originalequipment manufacturers, government contractors or to U.S. and other foreign government agencies. Primarily,sales originating in the Americas consist of sales within the United States and Canada and, to a lesser extent,Mexico and some Latin and South American countries. The Americas’ sales also include all guidance andstabilization product sales throughout the world. Sales originating from the Company’s European and Asiansubsidiaries principally consist of sales into all European countries, both inside and outside the European Union,as well as Africa, Asia/Pacific, the Middle East and India.
The Company operates in two geographic segments, exclusively in the mobile communications, navigationand guidance and stabilization equipment industry, which it considers to be a single business activity. TheCompany has two primary product categories: mobile communication and guidance and stabilization. Mobilecommunication sales and services include marine, land mobile, automotive, and aeronautical communicationequipment and satellite-based voice, television and Broadband Internet connectivity services, as well asDIRECTV account subsidies and referral fees earned in conjunction with the sale of our products. Guidance andstabilization sales and services include sales of defense-related navigation and guidance and stabilizationequipment based upon digital compass and fiber optic sensor technology. Mobile communication and guidanceand stabilization sales also include development contract revenue, product repairs and extended warranty sales.
The following table summarizes information regarding the Company’s operations by geographic segment:
Sales Originating From
Year ended December 31, 2012 AmericasEurope
and Asia Total
Mobile communication sales to the United States $ 62,857 $ — $ 62,857Mobile communication sales to Canada 777 — 777Mobile communication sales to Europe 417 15,255 15,672Mobile communication sales to other geographic areas 3,936 4,443 8,379Guidance and stabilization sales to the United States 8,632 — 8,632Guidance and stabilization sales to Canada 10,736 — 10,736Guidance and stabilization sales to Europe 11,793 — 11,793Guidance and stabilization sales to other geographic areas 18,266 — 18,266Intercompany sales 8,485 2,064 10,549
Subtotal 125,899 21,762 147,661Eliminations (8,485) (2,064) (10,549)
Net sales $117,414 $19,698 $137,112
81

KVH INDUSTRIES, INC. AND SUBSIDIARIES
NOTES TO CONSOLIDATED FINANCIAL STATEMENTS—(Continued)December 31, 2012, 2011 and 2010
(in thousands except share and per share amounts)
Sales Originating From
Year ended December 31, 2012 AmericasEurope
and Asia Total
Segment net income (loss) $ 4,317 $ (736) $ 3,581Depreciation and amortization $ 4,116 $ 494 $ 4,610Total assets $118,076 $19,492 $137,568
Sales Originating From
Year ended December 31, 2011 AmericasEurope
and Asia Total
Mobile communication sales to the United States $ 50,797 $ — $ 50,797Mobile communication sales to Canada 875 — 875Mobile communication sales to Europe 438 13,244 13,682Mobile communication sales to other geographic areas 1,280 3,568 4,848Guidance and stabilization sales to the United States 11,951 — 11,951Guidance and stabilization sales to Canada 16,643 — 16,643Guidance and stabilization sales to Europe 7,877 — 7,877Guidance and stabilization sales to other geographic areas 5,863 — 5,863Intercompany sales 7,793 1,084 8,877
Subtotal 103,517 17,896 121,413Eliminations (7,793) (1,084) (8,877)
Net sales $ 95,724 $16,812 $112,536
Segment net income $ 396 $ 464 $ 860Depreciation and amortization $ 3,948 $ 426 $ 4,374Total assets $112,557 $15,999 $128,556
Sales Originating From
Year ended December 31, 2010North
America Europe Total
Mobile communication sales to the United States $ 46,358 $ — $ 46,358Mobile communication sales to Canada 571 — 571Mobile communication sales to Europe 524 10,398 10,922Mobile communication sales to other geographic areas 1,162 3,460 4,622Guidance and stabilization sales to the United States 24,262 — 24,262Guidance and stabilization sales to Canada 5,353 — 5,353Guidance and stabilization sales to Europe 17,368 — 17,368Guidance and stabilization sales to other geographic areas 2,787 — 2,787Intercompany sales 6,528 413 6,941
Subtotal 104,913 14,271 119,184Eliminations (6,528) (413) (6,941)
Net sales $ 98,385 $13,858 $112,243
Segment net (loss) income $ 8,201 $ 72 $ 8,273Depreciation $ 3,711 $ 134 $ 3,845Total assets $101,116 $14,082 $115,198
82

KVH INDUSTRIES, INC. AND SUBSIDIARIES
NOTES TO CONSOLIDATED FINANCIAL STATEMENTS—(Continued)December 31, 2012, 2011 and 2010
(in thousands except share and per share amounts)
(13) Share Buyback Program
On November 26, 2008, the Company’s Board of Directors authorized a program to repurchase up to onemillion shares of the Company’s common stock. As of December 31, 2012, 341,009 shares of the Company’scommon stock remain available for repurchase under the authorized program. The repurchase program is fundedusing the Company’s existing cash, cash equivalents, marketable securities and future cash flows. Under therepurchase program, the Company, at management’s discretion, may repurchase shares on the open market fromtime to time, in privately negotiated transactions or block transactions, or through an accelerated repurchaseagreement. The timing of such repurchases depends on availability of shares, price, market conditions, alternativeuses of capital, and applicable regulatory requirements. The program may be modified, suspended or terminatedat any time without prior notice. The repurchase program has no expiration date. There were no other repurchaseprograms outstanding during the year ended December 31, 2012 and no repurchase programs expired during theperiod.
During the years ended December 31, 2012, 2011, and 2010 the Company repurchased 0, 457,667 and 0shares of its common stock in open market transactions at a cost of $0, $3,679 and $0, respectively.
(14) Fair Value Measurements
Effective January 1, 2008, the Company adopted the required provisions of ASC 820, Fair ValueMeasurements and Disclosures. ASC 820 defines fair value as the exchange price that would be received for anasset or paid to transfer a liability (an exit price) in the principal or most advantageous market for the asset orliability in an orderly transaction between market participants on the measurement date. ASC 820 also establishesa fair value hierarchy, which requires an entity to maximize the use of observable inputs and minimize the use ofunobservable inputs when measuring fair value. ASC 820 describes three levels of inputs that may be used tomeasure fair value:
Level 1: Unadjusted quoted prices in active markets that are accessible at the measurement date foridentical, unrestricted assets or liabilities. The Company’s Level 1 assets are investments inmoney market mutual funds, government agency bonds, United States treasuries, corporate notes,and certificates of deposit.
Level 2: Quoted prices for similar assets or liabilities in active markets; or observable prices that are basedon observable market data, based on directly or indirectly market-corroborated inputs. TheCompany’s Level 2 liabilities are interest rate swaps.
Level 3: Unobservable inputs that are supported by little or no market activity, and are developed based onthe best information available given the circumstances. The Company has no Level 3 assets.
Assets and liabilities measured at fair value are based on one or more of four valuation techniques. The fourvaluation techniques are identified in the table below and are as follows:
(a) Market approach—prices and other relevant information generated by market transactions involvingidentical or comparable assets
(b) Cost approach—amount that would be required to replace the service capacity of an asset (replacementcost)
(c) Income approach—techniques to convert future amounts to a single present amount based on marketexpectations (including present value techniques, option-pricing and excess earnings models)
83

KVH INDUSTRIES, INC. AND SUBSIDIARIES
NOTES TO CONSOLIDATED FINANCIAL STATEMENTS—(Continued)December 31, 2012, 2011 and 2010
(in thousands except share and per share amounts)
(d) The valuations of the interest rate swaps intended to mitigate the Company’s interest rate risk aredetermined with the assistance of a third-party financial institution using widely accepted valuationtechniques, including discounted cash flow analysis on the expected cash flows of each instrument.This analysis utilizes observable market-based inputs, including interest rate curves and interest ratevolatility, and reflects the contractual terms of these instruments, including the period to maturity.
The following tables present financial assets at December 31, 2012 and December 31, 2011 for which theCompany measures fair value on a recurring basis, by level, within the fair value hierarchy:
December 31, 2012 Total Level 1 Level 2 Level 3ValuationTechnique
AssetsMoney market mutual funds $9,921 $9,921 $— $— (a)Government agency bonds 6,817 6,817 — — (a)United States treasuries 6,089 6,089 — — (a)Corporate notes 4,679 4,679 — — (a)Certificates of deposit 1,800 1,800 — — (a)
LiabilitiesInterest rate swaps $ 542 $ — $542 $— (d)
December 31, 2011 Total Level 1 Level 2 Level 3ValuationTechnique
AssetsMoney market mutual funds $8,818 $8,818 $— $— (a)Government agency bonds 9,015 9,015 — — (a)United States treasuries — — — —Corporate notes 3,019 3,019 — — (a)Certificates of deposit 2,701 2,701 — — (a)
LiabilitiesInterest rate swaps $ 510 $ — $510 $— (d)
Certain financial instruments are carried at cost on the consolidated balance sheets, which approximates fairvalue due to their short-term, highly liquid nature. These instruments include cash and cash equivalents, accountsreceivable, accounts payable and accrued expenses.
(15) Derivative Instruments and Hedging Activities
Effective April 1, 2010, in order to reduce the volatility of cash outflows that arise from changes in interestrates, the Company entered into two interest rate swap agreements. These interest rate swap agreements areintended to hedge the Company’s mortgage loan related to its headquarters facility in Middletown, Rhode Islandby fixing the interest rates specified in the mortgage loan to 5.91% for half of the principal amount outstandingand 6.07% for the remaining half of the principal amount outstanding as of April 1, 2010 until the mortgage loanexpires on April 16, 2019.
As required by ASC Topic 815, Derivatives and Hedging, the Company records all derivatives on thebalance sheet at fair value. As of December 31, 2012, the fair value of the derivatives is included in other accruedliabilities and the unrealized loss is included in other comprehensive loss.
84

KVH INDUSTRIES, INC. AND SUBSIDIARIES
NOTES TO CONSOLIDATED FINANCIAL STATEMENTS—(Continued)December 31, 2012, 2011 and 2010
(in thousands except share and per share amounts)
As of December 31, 2012, the Company had the following outstanding interest rate derivatives that weredesignated as cash flow hedges of interest rate risk:
Interest Rate DerivativesNotional
(in thousands)Asset
(Liability) Effective Date Maturity Date Index Strike Rate
Interest rate swap $1,776 (263) April 1, 2010 April 1, 2019 1-month LIBOR 5.91%Interest rate swap $1,776 (279) April 1, 2010 April 1, 2019 1-month LIBOR 6.07%
(16) Legal Matters
From time to time, the Company is involved in litigation incidental to the conduct of its business. In theordinary course of business, KVH is a party to inquiries, legal proceedings and claims including, from time totime, disagreements with vendors and customers. The Company is not a party to any lawsuit or proceeding that,in management’s opinion, is likely to materially harm the Company’s business, results of operations, financialcondition or cash flows.
(17) Quarterly Financial Results (Unaudited)
Financial information for interim periods was as follows:
FirstQuarter
SecondQuarter
ThirdQuarter
FourthQuarter
(in thousands, except per share amounts)
2012Product sales $17,083 $21,041 $24,529 $28,024Service sales 9,645 10,978 14,293 11,519Gross profit 9,943 12,451 15,490 17,090Net (loss) income $ (1,375) $ 453 $ 1,745 $ 2,757Net (loss) income per share (a):
Basic $ (0.09) $ 0.03 $ 0.12 $ 0.19
Diluted $ (0.09) $ 0.03 $ 0.12 $ 0.18
2011Product sales $18,884 $24,331 $17,987 $23,933Service sales 5,525 6,241 7,634 8,000Gross profit 9,078 11,995 10,412 13,481Net (loss) income (1,534) 190 600 1,604Net (loss) income per share (a):
Basic $ (0.10) $ 0.01 $ 0.04 $ 0.11
Diluted $ (0.10) $ 0.01 $ 0.04 $ 0.11
(a) Net (loss) income per share is computed independently for each of the quarters. Therefore, the net (loss)income per share for the four quarters may not equal the annual net income (loss) per share data.
This financial information includes transactions which affect the comparability of the quarterly results forthe year ended December 31, 2011. During the third quarter of 2011, the Company reached agreement withLiveTV regarding the termination of a long-term antenna production agreement. The Company recorded a charge
85
KVH INDUSTRIES, INC. AND SUBSIDIARIES
NOTES TO CONSOLIDATED FINANCIAL STATEMENTS—(Continued)December 31, 2012, 2011 and 2010
(in thousands except share and per share amounts)
to other expense of $2,868 in the third quarter of 2011 to write off all of the remaining capitalized aviationantenna research and development costs. This charge was offset by a termination fee paid to the Company byLiveTV that resulted in a net benefit of $841, which is reflected in other income as of September 30, 2011.
(18) Subsequent Event
On January 30, 2013, the Company entered into an equipment security note in the amount of $4,700 tofinance satellite hubs that were originally purchased with cash in 2012 and 2010. The term of the equipment noteis five years, at a fixed interest rate of 2.76%. The monthly payment is $83 including interest expense.
86


002CSN257C