l imi tin g th e p o w e r co n s u mp tio n o f m a in m...
TRANSCRIPT
Limiting the Power Consumption of Main Memory ∗
Bruno Diniz, Dorgival Guedes,Wagner Meira Jr.
Federal University of Minas Gerais, Brazil{diniz,dorgival,meira}@dcc.ufmg.br
Ricardo BianchiniRutgers University, USA
ABSTRACTThe peak power consumption of hardware components affects theirpower supply, packaging, and cooling requirements. When thepeak power consumption is high, the hardware components or thesystems that use them can become expensive and bulky. Giventhat components and systems rarely (if ever) actually require peakpower, it is highly desirable to limit power consumption to a less-than-peak power budget, based on which power supply, packaging,and cooling infrastructures can be more intelligently provisioned.In this paper, we study dynamic approaches for limiting the pow-
er consumption of main memories. Specifically, we propose fourtechniques that limit consumption by adjusting the power states ofthe memory devices, as a function of the load on the memory sub-system. Our simulations of applications from three benchmarksdemonstrate that our techniques can consistently limit power toa pre-established budget. Two of the techniques can limit powerwith very low performance degradation. Our results also show that,when using these superior techniques, limiting power is at least aseffective an energy-conservation approach as state-of-the-art tech-niques explicitly designed for performance-aware energy conserva-tion. These latter results represent a departure from current energymanagement research and practice.
Categories and Subject DescriptorsB.3 [Memory structures]: Miscellaneous
General TermsDesign, experimentation
KeywordsMain memory, power and energy management, performance
1. INTRODUCTIONThe constant quest for higher performance and greater function-
ality has been producing hardware components and systems thatconsume significant amounts of power when fully utilized. Due to∗This research has been supported by NSF under grant #CCR-0238182 (CAREER award), CNPq, FAPEMIG, and FINEP, Brazil.
Permission to make digital or hard copies of all or part of this work forpersonal or classroom use is granted without fee provided that copies arenot made or distributed for profi t or commercial advantage and that copiesbear this notice and the full citation on the fi rst page. To copy otherwise, torepublish, to post on servers or to redistribute to lists, requires prior specifi cpermission and/or a fee.ISCA’07, June 9–13, 2007, San Diego, California, USA.Copyright 2007 ACM 978-1-59593-706-3/07/0006 ...$5.00.
these high peak power consumptions, the power supply, packag-ing, and cooling infrastructures of these components and systemsare becoming expensive and bulky. Modern high-end processorsare an example of this trend, as they may consume in excess of 100Watts when fully utilized, requiring expensive packaging and bulkyheat sinks to prevent thermal emergencies. Another interesting ex-ample is hand-held devices, which are limited in their capacity bythe bulky packaging that would be required by faster processorsand larger memories. As a final and more extreme example, largedata centers incur extremely high costs in provisioning power andcooling infrastructures for peak power consumption.Given that hardware components and systems rarely (if ever)
need to consume their peak power, it is cheaper to design packag-ing and cooling infrastructures for the “common-case” power con-sumption. Some processors have been designed this way, e.g. thePentium 4. They do not limit their power consumption, but slowthemselves down when temperatures increase beyond a pre-definedthreshold. This approach works well but the supply of power is pro-visioned to withstand the processors’ peak power consumption.A different approach is to limit power consumption at all times
to a less-than-peak power budget. This approach allows for tighterprovisioning of the power supply infrastructure, as well as cheaperpackaging and cooling. For this reason, this approach is more ap-propriate for scenarios where the supply of power is limited (e.g.,hand-held devices), expensive to over-provision (e.g., data centers),or can be reduced due to unit failures (e.g., blade systems with mul-tiple power supplies).In this paper, we study techniques for limiting the power con-
sumption of the main memory of a stand-alone computer. The rea-son for this focus is four-fold. First, memory capacities (and asso-ciated power consumptions) have been increasing significantly toavoid accesses to lower levels of the memory hierarchy in serversand desktop systems or enable the execution of more sophisticatedapplications in hand-held devices. Second, regardless of the envi-ronment, the memory subsystem is typically highly under-utilizedin the sense that only a few devices need to be active at the sametime. Third, if the power consumption of entire computers is tobe limited with minimal performance degradation, we need to de-velop strategies to manage all subsystems intelligently, not just theprocessors. Fourth, since the low-power states of memory devicesretain the data they store, limiting memory power can also bene-fit systems where the supply of power, packaging, and cooling in-frastructures have already been provisioned: for a given system, itenables increases in memory size without the risk of violating thesystem’s specifications, e.g. without demanding more power thanthe supply can provide.We propose and evaluate four techniques, called Knapsack, LRU-
Greedy, LRU-Smooth, and LRU-Ordered, that dynamically limit

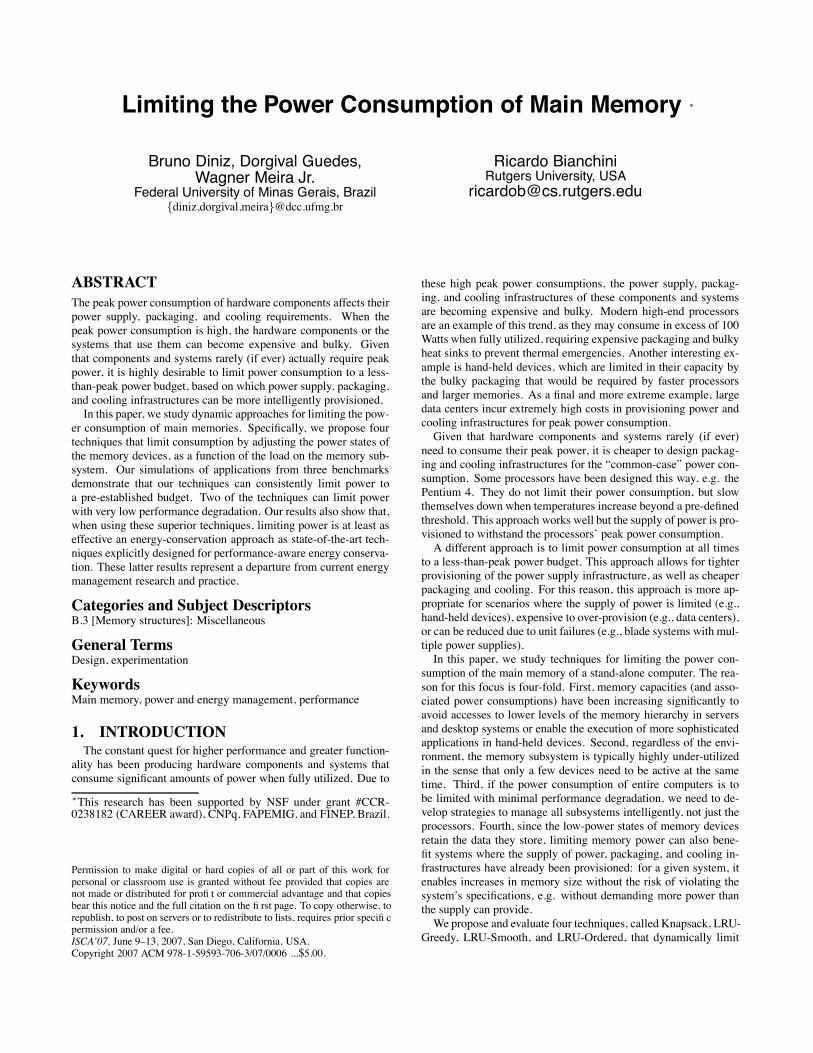
Power State/Transition Power (mW) DelayAccessing 1167 –Active 300 –Standby 180 –Nap 30 –Powerdown 3 –Active→ Standby 240 1 memory cycleActive→ Nap 160 8 memory cyclesActive→ Powerdown 15 8 memory cyclesStandby→ Active 240 +6 nsNap→ Active 160 +60 nsPowerdown→ Active 15 +6000 nsStandby→ Nap 160 +4 nsNap→ Powerdown 15 +∼0 ns
Table 1: RDRAM power states, consumptions, and overheads.
memory power consumption by adjusting the power states of thedifferent memory devices, as a function of the load on the mem-ory subsystem. We also propose energy- and performance-awareversions of our techniques, while studying the tradeoffs betweenpower budgets, energy consumption, and performance.Our evaluation is based on detailed full-system simulations of
nine applications from three types of systems: MediaBench bench-marks, representing the workloads of hand-held devices; SPECCPU2000 benchmarks, representing the workloads of desktop sys-tems; and a client-server benchmark, representing the workloads ofserver systems. Most of our study assumes RDRAM-based mem-ory subsystems for the ability to control the power state of eachmemory chip independently. However, our techniques are alsoapplicable to DDR SDRAM technologies and their module-level,multi-chip access and power control; the techniques can treat entireDDR modules as they do single RDRAM chips. To demonstratethe generality of our techniques, we also discuss some results forDDR2 SDRAM subsystems.Our results demonstrate that the techniques can consistently limit
power consumption. Our results make two main contributions:
• They demonstrate that two of the techniques, Knapsack andLRU-Ordered, can limit power with very low performancedegradation.
• They show that, when using these techniques, limiting poweris at least as effective for energy conservation as state-of-the-art techniques explicitly designed for performance-awareenergy conservation.
The last contribution is particularly interesting in that limitingthe power consumption to a less-than-peak budget is quite differentthan the current approaches to energy conservation. Specifically,energy conservation approaches send devices to increasingly lowerpower states without any constraints on the power consumption,i.e. during execution, power consumption may (and often does)reach the peak. Our work shows that limiting power is enough forsignificant energy savings with minimal performance degradation;sending devices to very low-power states may actually be counter-productive. Thus, our work paves the way for a new approach toenergy conservation, representing a departure from current energymanagement research and practice.
2. LIMITING POWER CONSUMPTIONIn this section, we present techniques for limiting the power
consumption of the main memory subsystem to a less-than-peakbudget. Our techniques leverage the fact that modern memory de-vices have multiple low-power states that retain the stored data.
Each power state consumes a different amount of power, whereasthe transitions between states involve different energy and perfor-mance overheads. As an example, Table 1 lists the power states,their power consumptions, and transition overheads of RDRAMmemory chips [22, 31], each of which can be transitioned inde-pendently. Memory accesses (to cache-line-sized memory blocks)can only occur in active state, although the data is retained even inpowerdown state.The idea behind our techniques is to have the memory controller
adjust the power state of the memory devices so that their overallpower consumption does not exceed the budget. We assume thatthe budget is pre-defined by the user or the manufacturer of thesystem containing the memory. Obviously, the budget has to behigh enough that at least one device can be accessed at any time.Our techniques reserve enough power for active devices to be
accessed. Thus, adhering to the power budget means that, whena memory device that is not in active state needs to be accessed,the controller may need to change the state of one or more otherdevices. The main challenge is to design techniques to guide thememory controller in selecting power states, so that it can avoidexceeding the budget while minimizing transition overheads. Inparticular, when the power budget is relatively low, some applica-tions may suffer performance degradations; nevertheless, it is im-portant to minimize these degradations by intelligently selectingpower states.Because the memory subsystem is a major energy consumer in
several environments (e.g., server systems [21]), another impor-tant challenge for the state-selection techniques is to adhere to thepower budget while enabling as much memory energy conserva-tion as possible without excessive performance degradation. Thus,instead of keeping the power consumption just below the budget,the techniques can reduce power consumption further, as long asthe resulting performance degradation is acceptable. Again, we as-sume that the user or the manufacturer of the system pre-defines amaximum acceptable performance degradation resulting from en-ergy conservation.In the next four subsections, we introduce our techniques. The
unifying principle behind the techniques is that they represent dif-ferent approaches to solving the well-known Multi-Choice Knap-sack problem (MCKP) [25], as we explain below. The Knapsacktechnique is the optimal static approach, whereas the others are dy-namic heuristics that differ in how they form and traverse a list ofrecently accessed memory devices. (Note that an optimal dynamictechnique would consider, at each decision point, the sequence offuture memory accesses. Because this sequence is not availablein practice, we do not consider such a technique.) The fifth sub-section describes extensions to the techniques that enable energyconservation without excessive performance degradation. The lastsubsection discusses the complexity and overheads our techniquesimpose on the memory controller.
2.1 KnapsackThis technique is based on the observation that the goal of limit-
ing power consumption to a pre-established budget is equivalent tothe MCKP. The budget represents the knapsack’s capacity, whereaseach memory device and potential power state represent an object.Objects are grouped by memory device, so that each group con-tains objects representing all the potential power states of the de-vice. The weight of each object is its power consumption, whereasthe object’s cost is the performance overhead of transitioning fromits power state to active state. The goal is to pick one object fromeach set (i.e., a power state for each memory device), so that thepotential performance degradation (i.e., the average device activa-

tail (most recent)head (least recent)
Non−Active chips
Active chips
N
A A
0 2
3 1
N
(a)
1 2
tail (most recent)head (least recent)
Non−Active chips
Active chips
0 3
A A
N N
(b)
Figure 1: Illustration of Knapsack.
tion delay) is minimized under the constraint that the power budgetis not exceeded. Typically, the optimal solution is the one in whichthe most memory devices can be in active state.Based on this formulation, our Knapsack technique computes
the optimal configuration of power states for a given power budget.Specifically, the configuration determines the number of devicesthat should be in each state. For example, assuming the RDRAMinformation in Table 1 and 4 memory chips, the optimal configura-tion would be 1 chip in active state and 3 chips in nap state for apower budget of 1399 mWatts. (1399 mWatts = 25% of the rangebetween the lowest possible budget, 1176 mWatts, and the highestpossible budget, 2067 mWatts, plus the lowest budget. However,out of these 1399 mWatts, the difference between the accessing andactive power consumptions, 867 mWatts, is reserved to allow a chipto be activated. Thus, the actual 25% power budget for 4 RDRAMchips is 532 = 1399 - 867 mWatts. Henceforth, the absolute valueswe list for the power budgets already exclude the 867 mWatts.) Fora budget of 755 mWatts (50% of the same range mentioned aboveplus 1176 mWatts minus 867 mWatts), the best configuration wouldbe 2 chips in active state and 2 chips in nap state.The computation of the optimal configuration is performed of-
fline, so that the memory controller can be initialized with the con-figuration information. Although the MCKP is NP-hard, the num-ber of memory devices is typically small enough that even a bruteforce solution is feasible. For example, our executions for 16 mem-ory devices take only a few minutes to explore all the possibleconfigurations. However, when the number of devices is moder-ate to large, a heuristic algorithm (and likely more search time) isrequired. For now, we use brute force.Regardless of how the optimal configuration is computed, the
initialization of the memory controller assigns the states describedin the configuration to each device randomly. To guarantee thatthe power budget is not exceeded at run time, Knapsack managespower states dynamically as follows. When the memory device tobe accessed, the “target” device, is already in active state, no actionis taken; it can be accessed without transitioning any other devices.When it is in a low-power state, an active device is selected to tran-sition to the current power state of the target device. After thistransition occurs, the target device can be activated and accessed.This approach maintains the invariant that the number of devices ineach state is always as determined by solving the MCKP offline.To account for the locality of accesses across the different de-
vices, Knapsack selects the active device to be transitioned to alow-power state using an LRU queue. Specifically, the LRU activedevice is selected as the victim.Figure 1 shows a detailed example of the Knapsack technique.
We assume 4 RDRAM memory chips and a power budget of 755mWatts. The figure shows one box per chip, listing the chip num-ber on the left and its current power state on the right (A = active,S = standby, N = nap, and P = powerdown). Figure 1(a) illustratesthe configuration when chip 2, currently in nap state, needs to be
head (least recent) tail (most recent)
0 132 A AN N
(a)
tail (most recent)
0 13
2
head (least recent)
A AN
N
(b)
tail (most recent)
0 13
2
head (least recent)
P
N
AN
(c)
0 13
head (least recent)
2
tail (most recent)
P N A A
(d)
Figure 2: Illustration of LRU-Greedy.
accessed: chips 0, 3, and 1 are in nap, active, and active state, re-spectively. Chips 3 and 1 are on the LRU queue of active chips.This is one of the optimal configurations for this number of chipsand power budget. Because the total power consumption is 660mWatts at this point, simply activating chip 2 would violate thebudget. To remain at an optimal configuration after chip 2 is acti-vated, Knapsack changes the state of the LRU active chip (chip 3)to that of chip 2 and then allows the access to proceed, leading tothe configuration in Figure 1(b).The main problem with Knapsack is that it is only feasible when
the number of devices is small enough that a heuristic algorithm canproduce a close-to-optimal solution within a reasonable amount oftime. Furthermore, every time a change in power budget is desired,Knapsack involves a recomputation of the configuration.Because recomputing the configuration may be time-consuming
when the number of devices is relatively large, we next describethree techniques that do not rely on finding an optimal or close-to-optimal configuration: LRU-Greedy (Section 2.2), LRU-Smooth(Section 2.3), and LRU-Ordered (Section 2.4). As we mentionedabove, the techniques leverage an LRU queue of memory devices.The main difference between them is the way each one traversesthe LRU queue and which devices are included in it.
2.2 LRU-GreedyLRU-Greedy tries to keep as many devices as possible in ac-
tive state. It involves a single data structure kept by the memorycontroller, the LRU queue of memory devices. All changes to thequeue are performed dynamically, as accesses arrive at the con-troller. Specifically, when a device is about to be accessed, it isremoved from the LRU queue. At this point, we have two possiblescenarios: (1) if the target device is active, the controller moves itto the end of the queue and proceeds with the access; and (2) ifthe target device is in a low-power state, the controller calculateswhether activating it would violate the budget. If not, the controllermoves it to the end of the queue, activates it, and allows the accessto proceed. If so, one or more other devices will have to changestates before the access can proceed.The distinguishing feature of LRU-Greedy is how its traverses
the LRU queue to decide on these state changes. Specifically, LRU-Greedy starts with the LRU memory device, sending it to the shal-lowest power state that would satisfy the budget. If changing thestate of the LRU device alone is not enough, it is left in powerdownstate and the process is repeated for the next device on the queue,and so forth, until the budget is finally satisfied.Figure 2 illustrates the operation of LRU-Greedy in the same
scenario as Figure 1. Figure 2(a) illustrates the status of the queue

head (least recent) tail (most recent)
0 132 A AN N
(a)
tail (most recent)
0 13
2
head (least recent)
A AN
N
(b)
tail (most recent)
0 13
2
head (least recent)
P S S
N
(c)
0 13
head (least recent)
2
tail (most recent)
P S S A
(d)
Figure 3: Illustration of LRU-Smooth.
when chip 2, currently the LRU chip, needs to be accessed: chips2, 0, 3, and 1 are in nap, nap, active, and active state, respectively.Again, because the total power consumption is 660 mWatts at thispoint, simply activating chip 2 would violate the budget. Thus,Figure 2(b) shows the queue after chip 2 is removed from it. Sincechip 2 will consume 300 mWatts when activated, the chips still onthe queue can consume at most 755 - 300 = 455 mWatts. LRU-Greedy then traverses the queue to reduce the consumption belowthis value. Figure 2(c) shows the queue after chip 0 is sent to pow-erdown state and chip 3 is sent to nap state. These changes bringthe consumption of the queue to 333 mWatts. Finally, Figure 2(d)shows the queue after chip 2 is activated and moved to the end ofthe queue, leading to a consumption of 633 mWatts. The memoryaccess can proceed at that point.
2.3 LRU-SmoothThe LRU-Smooth technique tries to keep more devices in shal-
low low-power states, rather than fewer devices in deeper powerstates as in LRU-Greedy. To accomplish this, LRU-Smooth tra-verses the LRU queue differently than LRU-Greedy when the tar-get device is in low-power state and activating it would violate thepower budget. Specifically, LRU-Smooth goes through the LRUqueue (from the LRU device to the MRU device) sending each de-vice to the next lower power state (and eventually returning to thefront of the queue, if necessary) until the set of devices in the queueconsumes less power than the budget minus the power consumptionof one active device.Figure 3 illustrates how LRU-Smooth works in the same sce-
nario as Figures 1 and 2. Figures 3(a) and 3(b) are the same asin LRU-Greedy. However, as Figure 3(c) depicts, LRU-Smoothswitches chips 0, 3, and 1 to powerdown, standby, and standby.These changes bring the consumption of the chips on the LRUqueue to 363 mWatts. At that point, chip 2 can be inserted back,activated, and accessed, for a final consumption of 663 mWatts.
2.4 LRU-OrderedLRU-Ordered addresses the problems of LRU-Greedy and LRU-
Smooth at the same time. The idea is to assign low-power statesevenly (as in LRU-Smooth) but avoid sending active devices tolow-power mode if possible (as in LRU-Greedy and Knapsack).This is accomplished by creating an additional data structure: apriority queue (implemented as a heap) for the memory devicesthat are in low-power states. The queue is ordered by how shallowthe power mode is; devices in shallower states are selected to go todeeper states first. For this reason, we refer to it as the “ordered”queue. The LRU queue is then reserved for active devices only.
3 1
tail (most recent)
0 2
Non−Active chips (Ordered queue)
Active chips (LRU queue)
head tail
head (least recent)
N
A A
N
(a)
tail (most recent)
3 0
Non−Active chips (Ordered queue)
Active chips (LRU queue)
head tail
head (least recent)
1 2A A
N N
(b)
Figure 4: Illustration of LRU-Ordered.
In more detail, LRU-Ordered operates in a similar manner toLRU-Greedy and LRU-Smooth. The differences are (1) the han-dling of the two queues; and (2) the actions that are taken when thetarget device is in low-power state and activating it would violatethe power budget. The handling of the queues is done in the obvi-ous manner. When (2) occurs, the controller first moves the LRUactive device to the front of the ordered queue. Then, it repeatedlysends the device at the top of the heap to the next lower power stateuntil the overall power consumption is lower than the budget minusthe power consumption of one active device.Figure 4 depicts how LRU-Ordered works in the same scenario
as Figures 1, 2, and 3. Figure 4(a) shows the ordered (top) andLRU (bottom) queues when the access for chip 2 arrives, whereasFigure 4(b) shows the configuration after chip 3 is downgraded tonap state and the access is allowed to proceed. The final configura-tion consumes 660 mWatts and is actually optimal for this numberof chips and power budget.
2.5 Performance-Aware Energy ConservationMemory energy conservation is an important goal in many en-
vironments. For example, because batteries should last as long aspossible in battery-operated devices, conserving memory energy inthese devices is beneficial. More interestingly, in the two IBM p670servers measured in [21], memory power represents 19% and 41%of the total power, whereas the processors account for only 24%and 28%; conserving memory energy is key for these servers. Withthese different environments in mind, we should conserve as muchenergy as possible (beyond the conservation that comes naturallyfrom the lower power budget), at the same time as limiting powerconsumption. Thus, we developed versions of our techniques thatconserve additional energy, as long as doing so does not degradeperformance beyond a pre-established threshold.
2.5.1 Memory Energy ConservationOur approach for conserving additional energy is simple: the
memory controller is responsible for sending a device to a lowerpower state when the device has been idle at the current state forthe state’s “break-even” time. The break-even time is defined asthe time it takes for the energy consumption in the current state toequal the energy it would take to go down to the next lower powerstate and then immediately go up to active state. Assuming theRDRAM states and transition costs from Table 1, the break-eventimes for the transitions from active to standby, standby to nap,and nap to powerdown are 14 ns, 69 ns, and 3333 ns, respectively.Our energy conservation approach uses the break-even time as thetransition threshold time. This same power-management approachhas been used in a number of previous papers on memory energyconservation, e.g. [20, 29].Given our approach to energy conservation, we modified our
techniques as follows:

Knapsack. We modified this technique to compute (still offline)the optimal configurations for all possible numbers of active de-vices, i.e. from 1 to the total number of devices in the system,and store them in a table at the memory controller. However, in-stead of trying to minimize the average transition delay, we modi-fied the technique to minimize the average delay ! power2, givingmore importance to low power than low transition delay. (This met-ric should not be confused with execution-time energy ! delay2,which is often used to compare energy conservation techniqueswhen performance is a key concern.) With the optimal configura-tion information, the memory controller dynamically changes con-figurations when the number of active devices is about to change,i.e. (1) when an active device’s transition threshold elapses and thedevice is about to be sent to the first low-power state; or (2) whenthe target device is in low-power state and activating it would notviolate the power budget. In those situations, the controller looksup the best configuration for the new number of active devices andadjusts states accordingly. The adjustments are made so that thesmallest possible number of state changes is performed. When ac-tivating a device would violate the budget, the basic strategy ofexchanging power states is used.LRU-Greedy, LRU-Smooth, and LRU-Ordered. The small mod-ification we made to these techniques is the same. Whenever thethreshold time associated with the current state of a device expires,the new state of the device (the next lower power state) is recorded.In case of LRU-Ordered, the new state may also cause a change inthe ordered queue.The energy-conserving versions of our techniques have the label
“EC” appended to their names.
2.5.2 Performance GuaranteeGuaranteeing a certain performance level in the context of a less-
than-peak power budget may not be possible. The reason is thatthe actual performance degradation experienced by an applicationdepends on its memory access properties, on the power budget, andon the technique used to limit the power consumption. If the accessproperties are not ideal for the technique or the power budget islow, significant performance degradation may ensue.However, it is certainly possible to limit the performance degra-
dation resulting from attempting to conserve additional energy toan acceptable percent threshold. The reason is that we have theoption to stop trying to conserve additional energy when the degra-dation starts to exceed the threshold. (In contrast, we cannot stoprespecting the power budget.)We created modified versions of our energy-conserving tech-
niques for them to provide a soft performance guarantee. Theseversions have the label “EC-Perf” appended to their names.In detail, the performance guarantee is based on the notions of
slack and epoch. The slack is the total sum of delays that the mem-ory accesses are allowed to experience without violating the perfor-mance guarantee. For example, if the performance guarantee is Gand the average memory access time without energy conservationis T , the average memory access time with energy conservationshould be no worse than (1 + G)T . Note that, in our approach,delays in memory access time are assumed to translate directly intodelays in end-performance. Although this is a pessimistic assump-tion for modern processors, it does make sure that our techniquesdo not violate the performance guarantee.An epoch defines a fixed-length interval (5M processor cycles in
our experiments) of the application’s execution. At the start of eachepoch, the available slack for the epoch is computed as the epoch’sfair share of the allowed slowdown plus any leftover slack fromprevious epochs. Because the state of the lists and memory devices
in the EC-Perf versions of our techniques can deviate significantlyfrom their corresponding base versions, correctly maintaining theavailable slack during an epoch is a major challenge. To solve thisproblem, the EC-Perf versions compare the (list-processing andstate-transition) overhead they incur on each memory access withthe overhead that would have been incurred by their correspondingbase versions. To determine the overhead of the base version, thememory controller “simulates” the lists and device states under thebase version without actually performing any memory accesses orstate transitions. The simulation is performed off the critical pathof the access, i.e. while the corresponding memory block is beingtransferred on the bus. The slack is decreased by the differencebetween the overhead of the EC-Perf version and that of the baseversion. If the former overhead is higher, the slack decreases; oth-erwise, it increases.If the available slack ever becomes non-positive during an epoch,
our techniques turn off energy conservation until the end of theepoch and send chips to their corresponding states in the simula-tion. When an epoch ends, we adjust transition thresholds listed inthe previous subsection using the same approach as Li et al. [22].Intuitively, if some slack is left unused at the end of the epoch, thethresholds are reduced. If not, the thresholds are increased.Our approach for providing performance guarantees is inspired
by [22] but with three key differences. First, turning energy con-servation off in our context does not mean keeping all devices inactive state. Because we still need to respect the power budget,our techniques revert back to a configuration that does so. Second,again due to the less-than-peak budget, we need to identify the de-lays that are really caused by trying to conserve additional energy.Finally, our handling of epochs is different in that they correspondto fixed time periods (independent of the instructions executed bythe processor) in our approach.
2.6 Complexity and OverheadsOur techniques are simple to implement. Many memory con-
trollers, e.g. [40], include low-power processors and highly inte-grated buffering resources. We assume that the controller residesin the processor chip, as in the Niagara processors from Sun andthe Opteron processors from AMD.In terms of buffering, our techniques require enough space to
store their one or two queues, each of which can have at mosttotal memory devices entries. Knapsack and its variants also re-quire space for storing the best state configurations, each of whichhas exactly total memory devices entries. For energy conserva-tion, our techniques require a counter per device to account for thetransition threshold. To provide performance guarantees, our EC-Perf techniques require a counter for the available slack, a counterfor the epochs, a counter for list-processing and state-transitionoverheads, buffer space for simulating their respective base ver-sions, and a counter for the overhead of these versions.In terms of processing overheads, our techniques need to update
their LRU queues whenever a memory access arrives for a devicethat is different than the last device accessed. LRU-Ordered andits variations also need to update the ordered queue, but only whena device changes power state. The overhead of these updates isa few pointer manipulations. In contrast, an access to a device inlow-power state that can be activated without violating the budgetalso involves a few arithmetic/logic operations to verify that this isindeed the case. The techniques need to traverse their queue(s), butonly when an access is directed to a device in low-power state andactivating the device would violate the power budget. To provideperformance guarantees, the available slack needs to be dynami-cally updated. Because the simulation of the base version must be

performed off the critical path of memory accesses, the controllermust be capable of simulating base accesses while the cache linesare transferred on the bus. This can be done without impactingrunning time, since line transfers take (56 processor cycles in ourRDRAM experiments) much longer than the simulation overhead.In our evaluation, we simulate all of these processing overheads
in detail. In fact, we carefully assessed them by first implementingthe required operations explicitly and then counting the number ofx86 assembly instructions to which they translate. From this study,we found that updating a queue entry, removing a queue entry (af-ter it has been found), and inserting a queue entry should take 6instructions, 3 instructions, and 4 instructions, respectively. Weassume that the controller can process one x86 instruction per cy-cle. Given these values, we find the list-processing overheads tobe a small fraction of the latency of an actual (cache-line-sized)memory access. For example, for 8 chips and a 50% budget, theaverage number of list-processing overhead cycles per memory ac-cess is 9.0, 10.9, 11.2, and 12.9 for Knapsack, LRU-Greedy, LRU-Smooth, and LRU-Ordered, respectively. When performance-awareenergy conservation is being used, the average number of overheadcycles per memory access in LRU-Ordered is 15.0, again with 8chips and a 50% budget. Thus, in the worst case for this configu-ration, the list-processing overheads represent a 16% increase inthe average memory access latency of 92.1 processor cycles (inthe absence of a power limitation, memory controller overheads,or energy conservation) in our experiments. In the most challeng-ing configuration we study, with 16 chips and a 25% budget, thelist-processing overheads increase to 21%.
3. EVALUATION
3.1 MethodologyOur evaluation is based on detailed full-system simulations using
Simics [38] version 2.2.19, and our simulation code for the mem-ory subsystem and the power-limiting techniques. We simulate anx86 in-order, single-core processor running at 2.8 GHz. The cachehierarchy is composed of two levels. The first level (L1) is a split,2-way set associative, 64-KB cache with 32-byte lines and a 2-cycle access time. The second level (L2) is a 4-way set associative,256-KB cache with 64-byte lines and an 8-cycle access time. TheSimics processor model we use only allows the L2 cache to haveone outstanding miss at a time. Simulating one outstanding miss ata time exposes any memory access overheads associated with lim-iting power. Nevertheless, we do study the sensitivity of our resultsto the number of concurrent outstanding misses in Section 3.3.Because full-system simulations take extremely long to com-
plete, each Simics run generates a trace of the memory accessesperformed by an application. The trace is later used to drive de-tailed simulations of the memory subsystem under our differenttechniques. We simulate memories with 512 MBytes. Through-out most of the evaluation, we simulate RDRAM chips running at1.6 GHz (Table 1). Each memory chip is capable of transferring 2bytes per memory cycle, providing a peak transfer rate of 3.2 GB/s.Recall that we simulate RDRAM by default, but also discuss resultsfor DDR2 SDRAM in Section 3.3.Based on the RDRAM manuals, we define that filling an L2
cache miss on a load from an active chip takes 130 processor cycles,when both a row and a column access are necessary. An L2 cachewriteback to an active chip takes 88 processor cycles, again whenboth row and column accesses are necessary. These times includethe 56 processor cycles required to transfer the L2 cache line onthe memory bus. We simulate one open 2-KByte page per chip. Incontrast with some RDRAM memory controllers, our techniques
do not transition a chip to standby state immediately after an ac-cess, since they are primarily intended to limit power consumption(rather than conserve energy).We use a set of eight applications from three types of systems:
four from theMediaBench benchmarks [26], representing the work-loads of hand-held devices; three from the SPEC CPU2000 bench-marks [6], representing the workloads of desktop systems; and aclient-server benchmark, representing the workloads of server sys-tems. We carefully selected the applications. The MediaBench ap-plications we study are epic, gsdecode, gsmencode, and mpeg2en-code. They are the longest-running applications in MediaBench.The SPEC CPU2000 applications are bzip2, gzip, and vortex withthe train input set (running with ref input sets would have been im-practical in terms of simulation time). The reason we chose theseCPU2000 applications is that their behavior is similar under ref andtrain input sets [39]. In Section 3.3, we also study mcf, the mostmemory-bound application in the CPU2000 suite, to assess the be-havior of our techniques in an extremely unfavorable scenario. Fi-nally, the client-server application (called CS hereafter) comprisesan Apache server and a client, each being simulated by an instanceof Simics. Simics also simulates the network. The HTTP workloadis the Clarknet publicly available Web-server trace. We run 30,600requests of it to limit the simulation time and show results for theserver. Our experiments simulate the applications and the operatingsystem (Linux 2.6.8). Thus, the allocation of virtual pages to phys-ical frames is done by Linux itself. We assign consecutive physicalframes to the same chip until the chip runs out of space, moving onto the next chip after that.We study the effect of several parameters on the behavior of our
techniques: the power limit, the number of memory chips, the max-imum number of outstanding cache misses, the memory technol-ogy, whether memory energy conservation is enabled, whether per-formance guarantees are provided when conserving energy. Thepower limit is defined as a fraction of the range of possible powerbudgets. Specifically, the power limit is: percent budget!maxpb+(1"percent budget)!minpb"(paccess"pactive)!accesssize, where maxpb is the maximum power budget (i.e., the peakpower consumption), minpb is the minimum power budget (whichis not the consumption of the powerdown state times the numberof chips, because it must be possible to access at least one chip),percent budget is a value from 0 to 1, paccess and pactive arethe power consumption in accessing and active states, respectively,and access size is the number of chips involved in each memoryaccess. We study 25%, 50%, and 75% as values for the budget. Interms of the number of memory chips, we study 4, 8, and 16. Thesenumbers cover the range from hand-held devices to small-scaleservers. Although larger servers may use more than 16 chips, thesesystems also typically have multiple memory controllers, whichlimits the number of chips assigned to each controller [21]. In sucha system, the budget can be partitioned between the controllers,each of which can enforce its fraction as in this paper.We scaled down the sizes of the caches that we simulate because
the applications are run with relatively small inputs. With our set-tings, the CPU is stalled waiting for the memory subsystem in epic,gsdecode, gsmencode, mpeg2encode, bzip2, gzip, vortex, and CSfor 9.9%, 2.2%, 13.6%, 2.2%, 20.6%, 2.6%, 3.5%, and 10.9% ofthe execution time (without limiting power or conserving energy),respectively. The same quantity for mcf is 55.5%.Our simulations fix the memory size at 512 MBytes to avoid in-
troducing an extra parameter that is not as important as the otherswe study. Although this memory size may seem excessive for someof these applications, recall that we simulate the operating system(and its mapping of virtual pages to physical memory frames) as

0
200
400
600
800
1000
1200
1400Po
wer (
mW
atts
)
Time
Power Consumption Limitation (CS - 8 chips - 50% budget - LRU-O - PL-EC-Perf)
Limit Max Avg
Figure 5: Power limit, and maximum and average power.
well. In fact, for these applications and numbers of chips, the ac-cesses are spread across all chips. However, there are always a fewchips that receive a larger fraction of the accesses. For example, CSon 8 chips exhibits two chips that each receive around 29% of theaccesses, whereas the other chips receive between 3% and 19% ofthe accesses. Bzip2 on 8 chips exhibits a similar behavior, wheretwo chips receive 29% and 23% of the accesses, whereas the oth-ers receive between 1% and 18% of the accesses. Decreasing thememory size (while keeping the same number of chips) would havethe effect of more evenly distributing the accesses across the chips.This effect is akin to increasing the number of chips (while keepingthe same memory size), as we do in this paper.Our graphs refer to the techniques as Knap (Knapsack), LRU-G
(LRU-Greedy), LRU-S (LRU-Smooth), and LRU-O (LRU-Order-ed). We refer to the (base) versions that only limit power con-sumption as PL (for Power-Limited), the versions that also con-serve memory energy as PL-EC (for Energy-Conserving), and theversions that limit power, conserve memory energy, and limit theperformance degradation resulting from energy conservation as PL-EC-Perf (for Performance). The degradation threshold was alwayskept at 3% in the PL-EC-Perf simulations. Because the parameterspace comprises 7 dimensions (technique, variation, application,power limit, number of chips, maximum number of outstandingmisses, and memory technology), we present figures for the inter-esting (2D) parts of the space.Finally, the two key metrics we consider are overall application
performance degradation and memory energy savings. We do notmodel processor or system energy explicitly in our simulations.However, as the results in the next subsection demonstrate, our bestpower-limiting techniques degrade performance only slightly (#2% in the vast majority of cases), i.e. the memory energy savingswe report are a close estimate of the overall energy savings that areachievable. In fact, we can easily estimate the overall energy sav-ings by assuming a particular breakdown between the energy con-sumed by the memory and the rest of the system (without a powerlimitation or energy conservation). If the memory represents M%of the total system energy, the memory energy savings ism%, andthe degradation is assumed to be 0%, the overall system-wide en-ergy savings is S% =M ! m/100.
3.2 Base ResultsBefore getting into an extensive analysis of results, it is important
to emphasize that our techniques are successful at limiting powerconsumption to the pre-established budget at all times and for allapplications. As an example of the power consumption behavior
of applications under a power limit, Figure 5 plots the power con-sumption of part of the execution of CS under LRU-Ordered withperformance-aware energy conservation (PL-EC-Perf), assuming 8memory chips and a power limit of 1361 mWatts (50% budget for8 chips). The figure plots the power limit, the maximum powerconsumption of each interval of 1M processor cycles, and the av-erage power consumption during those intervals, as a function oftime. During the second half of the slice illustrated in the figure,the performance slack is exhausted, causing the maximum and av-erage power consumptions to concentrate close to the limit. Notethat, in this region, there are still power state changes since the limitdoes not allow all memory chips to be active at the same time. Wecan also clearly see that the limit is never violated, despite the factthat power-state configurations changed a large number of times.Further, we observe that the average power consumption is closeto the maximum consumption most of the time, suggesting thatperformance degradations should be small. The result for CS inFigure 6(left) shows that this is indeed the case.Performance degradation due to limiting power consumption.Figure 6 shows the performance degradation suffered by each ap-plication, as a function of different parameters. In Figures 6(left)and 6(middle), each degradation is computed with respect to an“unrestricted” execution that does not impose any limits on thepower consumption, does not attempt to conserve energy (all chipsare active all the time), and involves no memory controller over-heads. In Figure 6(right), the degradations are computed with re-spect to the unrestricted execution with the corresponding numberof memory chips. The set of three bars on the right of each graphpresents the average across all applications.Figure 6(left) compares the performance degradation of the four
techniques we study, assuming 8 chips and a 50% power budget.For all applications, Knapsack and LRU-Ordered degrade perfor-mance only slightly: less than 3% in all cases; less than 1% inall but one case (bzip2). Knapsack behaves so well because it opti-mizes performance within the available power budget. On the otherhand, LRU-Ordered does well by achieving a similar effect; it at-tempts to avoid going down to deep low-power states, even if anactive chip needs to be sent to a (shallow) low-power state.In contrast, LRU-Greedy and LRU-Smooth degrade performance
more substantially; they can exhibit degradations as high as 76%and 67%, respectively. Surprisingly, these two techniques do poorlyfor the same applications (epic, bzip2, and vortex), despite the factthat they traverse their LRU queues very differently. At closer in-spection, one can easily understand these results: neither techniqueis capable of effectively limiting average transition delays. Specifi-cally, LRU-Greedy sends a few chips to deep power states, whereasLRU-Smooth sends more chips to shallow low-power states, in-cluding multiple active chips. Although neither technique doeswell, LRU-Smooth performs a little better than LRU-Greedy.Figure 6(middle) compares performance degradations as a func-
tion of the power budget for LRU-Ordered, again assuming 8 chips.As we would expect, increasing the budget decreases the degrada-tions, since chips can stay in shallower power states. More inter-estingly, even with a small budget of 25%, LRU-Ordered degradesperformance by less than 2.5%, except in the case of bzip2 (13%degradation). Knapsack achieves similar results, whereas LRU-Greedy and LRU-Smooth exhibit significant degradations with the25% budget (not shown).Figure 6(right) compares performance degradations as a function
of the number of memory chips for LRU-Ordered, assuming a 50%budget. Interestingly, note that, in all but one case, degradations de-crease as we increase the number of chips from 4 to 8, but increasewhen we go from 8 to 16 chips. Initially, we expected degrada-

0
1
2
3
4
5
epic gs gsm mpeg bz gz vor CS avg
Perfo
rman
ce D
egra
datio
n (%
)
Performance Degradation by Techniques22%
20% 76% 67% 35% 31% 18%
16%
Knap LRU−G LRU−S LRU−O
0
0.5
1
1.5
2
2.5
3
3.5
4
epic gs gsm mpeg bz gz vor CS avg
Perfo
rman
ce D
egra
datio
n (%
)
Performance Degradation by Power Limits
13%
25% 50% 75%
0
0.5
1
1.5
2
2.5
3
3.5
4
epic gs gsm mpeg bz gz vor CS avg
Perfo
rman
ce D
egra
datio
n (%
)
Performance Degradation by Number of Chips
8% 9% 11%
4 chips 8 chips 16 chips
Figure 6: Performance as a function of technique (left), budget (middle), number of chips (right), and application.
0
10
20
30
40
50
epic gs gsm mpeg bz gz vor CS avg
Ener
gy s
avin
gs (%
)
Energy Savings by Techniques
Knap LRU−G LRU−S LRU−O
0
10
20
30
40
50
60
70
epic gs gsm mpeg bz gz vor CS avg
Ener
gy s
avin
gs (%
)Energy Savings by Power Limits
25% 50% 75%
0
5
10
15
20
25
30
35
40
45
50
epic gs gsm mpeg bz gz vor CS avg
Ener
gy s
avin
gs (%
)
Energy Savings by Number of Chips
4 chips 8 chips 16 chips
Figure 7: Energy savings as a function of technique (left), budget (middle), number of chips (right), and application.
tions to consistently decrease with increasing number of chips, sothis result surprised us. Upon closer inspection, it becomes clearthat our intuition missed the fact that a larger number of chips mayresult in a combination of more active chips but also more chipsin powerdown state. As an example, note that the optimal Knap-sack configuration for 8 chips dictates 4 active chips and 4 chips innap state, whereas that for 16 chips dictates 8 active chips, 5 chipsin nap state, and (the culprits for the performance degradation)3 chips in powerdown state. To address this problem, we couldchange Knapsack to minimize delay2 and change LRU-Ordered toinclude 2 (rather than 1) active chips in the ordered queue whenthe activation of a chip in low-power state would violate the bud-get. However, note that degradations are never higher than 11%even with 16 chips, so we did not pursue these changes. Knapsackexhibits similar trends and absolute degradations as LRU-Ordered(not shown). LRU-Greedy and LRU-Smooth exhibit much higherabsolute degradations and the trends that we initially expected, asthe increase in number of chips reduces their percentage of chips inpowerdown state (not shown).Energy conservation due to limiting power consumption. Fig-ure 7 shows the memory energy savings, as a function of differ-ent parameters. In Figures 7(left) and 7(middle), each amount ofsavings is computed with respect to an unrestricted execution thatdoes not impose any limits on the power consumption, does notinvolve memory controller overheads, and does not attempt to con-serve energy. In Figure 7(right), the savings are computed withrespect to the unrestricted execution with the corresponding num-ber of chips. Note that the savings depicted in these figures comeexclusively from the less-than-peak budget.Figure 7(left) compares the energy savings achieved by the four
techniques we study, assuming 8 chips and a 50% power budget.For all applications but bzip2, all techniques conserve substantial
energy; at least 34%. Knapsack and LRU-Ordered do well forbzip2, but LRU-Greedy and LRU-Smooth do not. In fact, the lat-ter techniques also conserve noticeably less energy than the formerones for epic and vortex. The reason for these results is that LRU-Greedy and LRU-Smooth increase execution time tremendously(thereby increasing overall energy consumption) for these applica-tions and simulation parameters, as we illustrated in Figure 6(left).Figure 7(middle) compares energy savings as a function of the
power budget for LRU-Ordered, again assuming 8 chips. As wewould expect, increasing the budget decreases the savings, sincechips can stay in shallower power states. The most interesting resulthere, though, is that the applications’ characteristics have a muchweaker impact on the savings than the budgets do. The reason isthat what really matters in terms of energy is the ratio between lim-ited and unlimited power consumption. Knapsack behaves simi-larly to LRU-Ordered (not shown). LRU-Greedy and LRU-Smoothdo so as well, with the only difference that savings actually increasefor bzip2, as we increase the budget (not shown). This behavior dif-fers from that of other applications and is explained by the fact thathigher budgets produce substantially smaller performance degrada-tions for bzip2 with these techniques.Figure 7(right) compares energy savings as a function of the
number of chips for LRU-Ordered, assuming a 50% budget. Assuggested by our comments above, the number of chips has a rel-atively small effect on the percentage energy savings due to thepower limitation. Again, the exception to this observation is bzip2with LRU-Greedy and LRU-Smooth, since using more chips alsoimproves performance significantly (not shown).Performance-aware energy conservation under power limita-tions. First, note that our performance guarantee algorithm alwayslimits the degradation caused by explicitly trying to conserve addi-tional energy.

0
2
4
6
8
10
epic gs gsm mpeg bz gz vor CS avg
Perfo
rman
ce D
egra
datio
n (%
)
Performance Degradation by Techniques Versions
237% 60% 66% 35% 1153% 67% 206% 32%
282%
PL PL−EC PL−EC−Perf
0
10
20
30
40
50
60
70
80
90
100
epic gs gsm mpeg bz gz vor CS avg
Ener
gy s
avin
gs (%
)
Energy Savings by Techniques Versions
PL PL−EC PL−EC−Perf
Figure 8: Performance (left) and energy savings (right) as a function of variation of LRU-Ordered and application.
0
1
2
3
4
5
6
7
8
epic gs gsm mpeg bz gz vor CS avg
Perfo
rman
ce D
egra
datio
n (%
)
Perfomance Degradation for PL vs PD (PL) vs PL−EC−Perf vs PD (PL−EC−Perf)
13% 16%
PL (25%)PD (PL)
PL−EC−Perf (25%)PD (PL−EC−Perf)
0
10
20
30
40
50
60
70
80
90
100
epic gs gsm mpeg bz gz vor CS avgEn
ergy
Sav
ings
(%)
Energy Savings for PL vs PD (PL) vs PL−EC−Perf vs PD (PL−EC−Perf)
PL (25%)PD (PL)
PL−EC−Perf (25%)PD (PL−EC−Perf)
Figure 9: Comparing the performance degradation (left) and energy savings (right) of PL, PL-EC-Perf, and PD as a function ofapplication. The graphs assume 8 chips, a 25% power budget, and a 3% maximum degradation due to energy conservation.
To assess the performance degradations with respect to unre-stricted executions that impose no limits on power consumption,do not involve memory controller overheads, and do not attempt toconserve energy, consider Figure 8(left). It compares performancedegradations as a function of the variations of the LRU-Orderedtechnique, assuming 8 chips, a 50% power budget, and a maxi-mum acceptable performance degradation of 3%. The base ver-sion of LRU-Ordered is referred to as PL in the figure. These re-sults show that PL causes the smallest degradation in performance,less than 1% on average. In contrast, the energy-conserving vari-ation (PL-EC) causes tremendous performance degradation; morethan 1500% in one case (bzip2). Similar dramatic degradationshave been observed before when memory energy conservation isnot performance-aware [22]. When a performance guarantee is im-posed on the energy-conserving variation (PL-EC-Perf), degrada-tions are reduced to the range 3-6% (recall that these results includethe degradation coming from the power limitation and from tryingto conserve additional energy). Knapsack exhibits similar behavior.In contrast, LRU-Greedy and LRU-Smooth exhibit high degrada-tions for bzip2 and vortex, even under our performance guarantee(not shown).Figure 8(right) shows the energy savings that can be achieved
by the variations of LRU-Ordered, assuming 8 chips, a 50% powerbudget, and a maximum acceptable degradation of 3%. The savingsare computed with respect to the unrestricted executions. Thesedata show that the PL-EC variation of our techniques can typicallyincrease energy savings significantly, but only at the cost of the in-creased execution time as we just saw. In the case of bzip2, the
tremendous increase in execution time actually induces substan-tially lower savings. This effect is less pronounced for the otherapplications, as they exhibit lower degradations. The other tech-niques exhibit similar behaviors (not shown).When our performance guarantee is in place (PL-EC-Perf), the
additional energy savings achieved by our techniques (only resultsfor LRU-Ordered are shown) are significant compared to those ofPL for all applications, except bzip2. As we discuss below, de-creasing the budget also decreases the difference in energy savingsbetween PL and PL-EC-Perf, as chips have to stay in the deeperpower states a larger fraction of the time just to respect the budget.Comparing PL and PL-EC-Perf against state-of-the-art energyconservation. More importantly, the PL and PL-EC-Perf variationsof Knapsack and LRU-Ordered can conserve at least as much en-ergy as state-of-the-art techniques that conserve energy explicitly inthe absence of a power limit, for equally small performance degra-dations. In particular, these techniques can match the energy sav-ings of the latter approach by appropriately setting the power bud-get. To support these claims, Figure 9 compares the PL and PL-EC-Perf variations of LRU-Ordered (with a 25% budget) against thebest performance-aware memory energy conservation technique,the PD technique described in [22], for 8 chips. PD dynamicallychanges transition thresholds according to predicted access patternsand available slack. Note that there are two PD bars for each ap-plication: PD(PL) represents the execution where we allow PD todegrade performance by the same amount as PL with a 25% bud-get; PD(PL-EC-Perf) represents the execution where we allow PDto degrade performance by the same amount as PL-EC-Perf with a

25% budget. To achieve the best possible results for PD, we chosethe epoch length that exhibits the highest energy savings on averagefor our set of applications, namely 50M processor cycles.The figure shows that PD(PL) achieves significant energy sav-
ings for most of the applications, 55% on average. In terms of per-formance, as intended, PD(PL)matches the degradation of PL in allcases, except bzip2. For bzip2, PD(PL) is unable to exploit the ad-ditional slack to conserve more energy. PL conserves more energythan PD(PL) in almost all cases, achieving 66% savings on aver-age. Similar observations can be made when comparing PD(PL-EC-Perf) and PL-EC-Perf. On average, our technique achieves83% energy savings, whereas PD(PL-EC-Perf) produces 68% sav-ings. In fact, PD(PL-EC-Perf) conserves only slightly more energythan PL on average, even though we allowed PD(PL-EC-Perf) a3% degradation in performance beyond the degradation of PL.Comparing Figures 8(right) and 9(right) shows that the differ-
ence in energy savings between PL and PL-EC-Perf decreases sig-nificantly with lower budgets. The more we reduce the power bud-get or the maximum acceptable degradation, the more similar PLand PL-EC-Perf become.Despite their positive results, the behavior of PL and PL-EC-
Perf for bzip2 is a concern. For this budget of 25%, their perfor-mance degradations are clearly unacceptable. Although they con-serve less energy than our techniques, PD(PL) and PL(PL-EC-Perf)exhibit better performance for bzip2 (less than 6% degradations).As we had already seen in Figure 6(middle), our techniques exhibitlow performance degradations for bzip2 with power budgets higherthan 25%. For higher budgets, PL and PL-EC-Perf can again be-have better than PD for this application.These results demonstrate that, with an appropriately set power
budget, PL and PL-EC-Perf are indeed superior to the best energyconservation techniques proposed to date. The key intuition here isthat there is little point in (eventually) sending chips to very deepstates, as in PD, if activating these chips a little later will con-sume a large fraction of the slack. The more states there are, thegreater the potential problem is. In PL-EC-Perf this effect is not aspronounced because the power limit still has to be respected whenthe slack runs out. The better approach, as in Knapsack and LRU-Ordered, is to keep chips at their “best”, deep-enough states, re-gardless of how long they stay there; energy conservation comesfrom the power limitation itself.
3.3 Additional ResultsLimiting power under greater concurrency in the memory sub-system. So far, our simulations assumed a maximum of 1 out-standing L2 cache miss. However, modern systems often allowmultiple concurrent cache misses. To understand the effect thatour techniques would have on systems with greater memory-accessconcurrency, we developed a new version of our simulator. Specif-ically, we implemented an idealized processor capable of issuingmemory requests without ever stopping instruction execution, un-til a maximum number of outstanding misses is reached. In otherwords, the idealized processor is capable of completely overlappinginstruction execution with cache misses until a cache miss occursthat would exceed the maximum number of outstanding misses.This behavior is equivalent to always predicting load values cor-rectly [24]. Thus, our idealized processor exacerbates the amountof concurrency that the memory subsystem would see in reality.Using the new version of the simulator, we studied the behavior
of LRU-Ordered with 8 chips and a 50% power budget, for systemswith at most 1, 2, and 4 outstanding cache misses. Each degra-dation and savings was computed with respect to the (idealized)execution with the corresponding maximum number of outstand-
ing misses, no limits on power, and no energy conservation. Ourresults show that performance degradations associated with limit-ing power consumption are even smaller for systems with greatermemory-access concurrency. For example, systems with a maxi-mum of 4 outstanding misses exhibit less than 0.2% degradationfrom LRU-Ordered on average. The main reason for this resultis that an increasing fraction of the overheads of limiting powerconsumption, namely controller and state-transition overheads, canbe overlapped as we increase the maximum number of outstand-ing misses. Interestingly, the energy savings associated with limit-ing power are almost unaffected by systems with greater memory-access concurrency. The reasons are that all degradations are verysmall and, most importantly, the energy savings are dominated bythe power budget, as we saw in Figure 7.Limiting power under high memory boundness. The applica-tions we studied so far place light or moderate demands on thememory subsystem. To assess the behavior of our techniques forapplications that are highly memory-bound, we studied mcf, themost memory-bound application in the CPU2000 suite. As onewould expect, limiting the power consumption of a highly memory-bound application to a low budget results in high performance de-gradations, especially when the number of chips is large. Specifi-cally, assuming 8 memory chips and a maximum of 1 outstandingmiss, mcf exhibits degradations of 23%, 8%, and 5% for budgetsof 25%, 50%, and 75%, respectively, compared to the unrestrictedexecution of mcf. Despite the high performance degradation for abudget of 25%, LRU-Ordered can still achieve an energy savingsof 54%. For a budget of 50%, LRU-Ordered conserves 36% en-ergy, which is still quite significant. The EC-Perf version of LRU-Ordered is not able to conserve more energy (with an acceptabledegradation of 3%) than the base version.The impact of DDR SDRAM technology. To demonstrate thegenerality of our techniques, we applied them to DDR2 SDRAM.Specifically, we modeled DDR2 with five power states, namely ac-cessing, active standby, pre-charge quiet, pre-charge powerdown,and self-refresh [34]. The power consumptions and transition over-heads also came from [34]. We simulated memory subsystems with2 and 8 ranks, where each rank corresponds to 8 chips that are ac-cessed and power-managed together. The 2-rank scenario is partic-ularly challenging, since the memory controller has little room tomanage power states, i.e. any access to a different rank requires astate change. Nevertheless, the 2-rank simulations show that theperformance degradations resulting from LRU-Ordered are onlyslightly higher, on average, than under RDRAM. For example, theDDR2 performance degradations are 3.2%, on average, with a bud-get of 50% and a maximum of 1 outstanding miss. An RDRAMmemory subsystem with the same number of chips, a budget of50%, and a maximum of 1 outstanding miss leads to a degradationof 3%, on average. Despite its slightly higher performance degrada-tions under DDR2, LRU-Ordered still conserves 41% of the energyof the unrestricted execution, on average. The equivalent measurefor the comparable RDRAM memory subsystem is 45%. In con-trast, the 8-rank simulations show that LRU-Ordered exhibits anaverage performance degradation of 0.6% and an average energysavings of 43%, again assuming a budget of 50% and a maximumof 1 outstanding miss.
3.4 SummarySeveral interesting observations can be made from these results:
• Knapsack and LRU-Ordered are clearly the best techniquesfor limiting power consumption. The choice between thesetwo techniques comes down to the characteristics of the en-

vironment, such as the frequency with which one expectsin-the-field changes to the power budget and the number ofmemory chips. LRU-Greedy and LRU-Smooth generate highoverheads in most of the parameter space.
• With good techniques for limiting power, the resulting per-formance degradations are very small for applications thatimpose light or moderate requirements on the memory sub-system, even for low budgets. Highly memory-bound appli-cations require correspondingly high budgets for good per-formance.
• The very fact that power consumption is limited translatesinto significant energy savings. Attempting to conserve ad-ditional energy without excessive performance degradationmay require a high budget.
• When using good techniques, limiting power consumptionis at least as effective an energy-conservation approach, asdoing (performance-aware) energy conservation explicitly.
• Given the energy benefits of limiting power consumption,the power budget dominates all other parameters, includingapplication characteristics, in determining how much energycan be conserved.
• The number of memory chips and the characteristics of ap-plications have a significant impact on the performance ofthe techniques for limiting power. The impact is not as highon the energy savings.
• The maximum number of outstanding cache misses does nothave a significant effect on the performance degradation orenergy savings that our techniques produce.
• Our good techniques work well for DDR2 on average, evenwhen the number of memory ranks is small.
4. RELATED WORKOur work touches three main areas: limiting power consumption,
managing temperature, and memory energy conservation. Next, weoverview the related works in each of these areas.Limiting power. Felter et al. [10] were the only ones to con-sider limiting the power consumption of the memory subsystem.They proposed to continuously re-budget the available power be-tween the processor and the memory subsystem. Their base power-control mechanism was a throttling scheme that limits the numberof operations performed by each subsystem (instruction dispatchesand memory accesses) during an interval of time; once the thresh-old number of operations in reached, no additional operations areperformed until the next interval. Improperly selecting the intervallength may cause power budget violations and unnecessary perfor-mance degradation.In [1], the authors proposed Energy per Instruction (EPI) throt-
tling for chip multiprocessors (CMPs), as a way to minimize theexecution times of multithreaded applications while limiting thepower consumed by the CMP. As their base power-control mecha-nism, the authors used clock throttling of each processor core tomanage its duty cycle. During periods of low thread-level par-allelism, the CMP can spend more EPI by running the availablethread(s) on fewer cores, each of which at a higher duty cycle. Con-versely, during periods of high thread-level parallelism, the CMPshould spend less EPI by running on more cores, each of which ata lower duty cycle.
In [18], the authors considered scaling the voltage/frequency ofeach core of a chip multiprocessor independently to enforce a chip-level power budget. Power mode assignments are re-evaluated peri-odically by a global power manager, based on the performance andaverage power consumption observed in the most recent period.Our work differs from these contributions in that we focus on
the memory subsystem, limit the power consumption strictly bydynamically changing memory device states (rather than limitingthe number of memory accesses during an interval), and combinethe power limitation with explicit energy conservation.For clusters of computers, [11, 32] used CPU voltage/frequency
scaling at each node and a cluster-wide controller to limit the powerconsumption of the entire system. In both works, the controller wasresponsible for deciding how much of the power budget to assignto each node. Fan et al. [9] assessed the power consumption ofdata centers under different workloads and the potential benefits oflimiting power consumption.Our work differs from these three studies as we focus on stand-
alone computers from hand-helds to servers. For clusters and datacenters, coarser-grained approaches that limit the power consump-tion across multiple computers may indeed be more appropriatethan doing so on a per-server level. Still, per-server techniquesmay be used in guaranteeing that each server does not exceed itsassigned fraction of the budget.Managing temperature. Researchers have considered dynamicthermal management of processors [2, 3, 4, 14, 17, 23, 27, 30,33, 35, 36, 37], disks [12, 19], and data centers [13, 5, 28]. Mostof these contributions apply throttling, dynamic voltage/frequencyscaling, and/or activity migration when temperatures exceed somepre-established threshold.Although these works are related to our approach of limiting
power consumption, they all assume that the supply of power isprovisioned to withstand the peak power consumption of the dif-ferent subsystems. However, there are several types of scenarios inwhich such an assumption cannot be made. For example, the sup-ply of power may be limited (as in hand-held devices), expensiveto over-provision (as in data centers), or can be reduced due to unitfailures (as in blade systems with multiple power supplies). Ourwork targets these types of scenarios.Conserving memory energy. Several previous works have soughtto conserve memory energy [7, 8, 15, 16, 20, 22, 29, 41]. Thesepapers mainly address techniques for intelligently setting idlenessthresholds, and data layout techniques for increasing the achiev-able energy savings. In particular, some works [15, 16, 20, 29]have considered page layouts that concentrate accesses on a subsetof chips. We did not consider these layouts; doing so would havemade it easier for our techniques to limit power with little perfor-mance degradation. Instead, we focused on the more challengingscenario that uses Linux’s own virtual/physical page mapping.Previous works have cast memory energy conservation as an
MCKP [22, 42]. Our Knapsack technique was also formulated asan MCKP. However, our formulation differs substantially from pre-vious works. For example, the PS algorithm in [22] seeks to min-imize energy under a performance constraint, whereas Knapsackseeks to minimize performance degradation under a power con-straint. Furthermore, PS is epoch-based and keeps all chips at stati-cally defined power states during each epoch. The EC-Perf versionof Knapsack also uses epochs, but does not restrict chips to specificpower states. The base version of Knapsack does neither.Overall, our techniques differ from these previous contributions
as they primarily seek to limit power consumption; they try to con-serve additional memory energy in the context of this hard limit.

More fundamentally, our work demonstrates that limiting powerconsumption can actually be used as a very effective means of con-serving energy.
5. CONCLUSIONSIn this paper, we studied four techniques for limiting the power
consumption of the memory subsystem: Knapsack, LRU-Greedy,LRU-Smooth, and LRU-Ordered. We also studied variations ofthe techniques that attempted to conserve energy explicitly and tolimit the resulting performance degradation of doing so. Finally,we studied the impact of different parameters on the behavior of thetechniques and variations. Our simulation-based evaluation led usto a number of interesting observations (Section 3.4). One impor-tant observation is that Knapsack and LRU-Ordered are clearly su-perior to the other techniques. Another important (and fundamen-tal) observation is that, using these superior techniques, limitingpower consumption is at least as effective for energy conservationas state-of-the-art techniques explicitly designed for performance-aware energy management. It is important to emphasize: it isnot surprising that limiting power consumption also conserves en-ergy; what is surprising is that power consumption can be limitedwith small enough performance degradation over a wide parameterspace to make it better than techniques explicitly designed to con-serve energy without excessive performance degradation. Thus, amajor advantage of using our power-limiting approach is that wecan limit power consumption and conserve substantial energy atthe same time.Limitations and future work. So far, we have not considered mul-tiprogramming workloads or different policies for allocating pagesto memory chips. In addition, although we did study the effectof greater concurrency in memory accesses in the context of thenumber of outstanding cache misses, we have not explicitly consid-ered chip multiprocessors. Finally, we presented a parameter spacestudy of the behavior of our techniques, but did not consider howto select the ideal power budget in different scenarios. Addressingthese limitations is the focus of our future work.
AcknowledgementsWe would like to thank Luiz Barroso, Eugene Gorbatov, ParthaRanganathan, the members of the Vice-Versa seminar, and the ano-nymous referees for comments that helped improve this paper.
6. REFERENCES[1] M. Annavaram, E. Grochowski, and J. Shen. Mitigating Amdahl.s Law
Through EPI Throttling. In Proceedings of ISCA, June 2005.[2] F. Bellosa, S. Kellner, M. Waitz, and A. Weissel. Event-Driven Energy
Accounting of Dynamic Thermal Management. In Proceedings of COLP,September 2003.
[3] D. Brooks and M. Martonosi. Dynamic Thermal Management forHigh-Performance Microprocessors. In Proceedings of HPCA, January 2001.
[4] P. Chaparro, G. Magklis, J. Gonzalez, and A. Gonzalez. Distributing theFrontend for Temperature Reduction. In Proceedings of HPCA, February 2005.
[5] J. Choi, Y. Kim, A. Sivasubramaniam, J. Srebric, Q. Wang, and J. Lee.Modeling and Managing Thermal Profi les of Rack-Mounted Servers withThermoStat. In Proceedings of HPCA, February 2007.
[6] Standard Performance Evaluation Corporation. Spec2000. http://www.spec.org.[7] V. Delaluz, M. Kandemir, N. Vijaykrishnan, A. Sivasubramaniam, and M. J.
Irwin. Hardware and Software Techniques for Controlling DRAM PowerModes. IEEE Transactions on Computers, 50(11), 2001.
[8] X. Fan, C. Ellis, and A. Lebeck. Memory Controller Policies for DRAM PowerManagement. In Proceedings of ISLPED, August 2001.
[9] X. Fan, W.-D. Weber, and L. A. Barroso. Power Provisioning for aWarehouse-sized Computer. In Proceedings of ISCA, June 2007.
[10] W. Felter, K. Rajamani, T. Keller, and C. Rusu. A Performance-ConservingApproach for Reducing Peak Power Consumption in Server Systems. InProceedings of ICS, June 2005.
[11] M. Femal and V. Freeh. Boosting Data Center Performance ThroughNon-Uniform Power Allocation. In Proceedings of ICAC, June 2005.
[12] S. Gurumurthi, A. Sivasubramaniam, and V. Natarajan. Disk Drive Roadmapfrom the Thermal Perspective: A Case for Dynamic Thermal Management. InProceedings of ISCA, June 2005.
[13] T. Heath, A. P. Centeno, P. George, Y. Jaluria, and R. Bianchini. Mercury andFreon: Temperature Emulation and Management in Server Systems. InProceedings of ASPLOS, October 2006.
[14] S. Heo, K. Barr, and K. Asanovic. Reducing Power Density Through ActivityMigration. In Proceedings of ISLPED, August 2003.
[15] H. Huang, P. Pillai, and K. G. Shin. Design and Implementation ofPower-Aware Virtual Memory. In Proceedings of USENIX, June 2003.
[16] H. Huang, K. Shin, C. Lefurgy, K. Rajamani, T. Keller, E. Hensbergen, andF. Rawson. Co-operative Software-Hardware Power Management for MainMemory. In Proceedings of PACS, December 2004.
[17] M. Huang, J. Renau, S-M. Yoo, and J. Torrellas. A Framework for DynamicEnergy Effi ciency and Temperature Management. In Proceedings of Micro,December 2000.
[18] C. Isci, A. Buyuktosunoglu, C.-Y. Cher, P. Bose, and M. Martonosi. AnAnalysis of Effi cient Multi-Core Global Power Management Policies:Maximizing Performance for a Given Power Budget. In Proceedings of Micro,December 2006.
[19] Y. Kim, S. Gurumurthi, and A. Sivasubramaniam. Understanding thePerformance-Temperature Interactions in Disk I/O of Server Workloads. InProceedings of HPCA, February 2006.
[20] A. R. Lebeck, X. Fan, H. Zeng, and C. S. Ellis. Power-Aware Page Allocation.In Proceedings of ASPLOS, November 2000.
[21] C. Lefurgy, K. Rajamani, F. Rawson, W. Felter, M. Kistler, and T. W. Keller.Energy Management for Commercial Servers. IEEE Computer, 36(12),December 2003.
[22] X. Li, Z. Li, F. M. David, P. Zhou, Y. Zhou, S. V. Adve, and S. Kumar.Performance-Directed Energy Management for Main Memory and Disks. InProceedings of ASPLOS, October 2004.
[23] Y. Li, D. Brooks, Z. Hu, and K. Skadron. Performance, Energy, and ThermalConsiderations for SMT and CMP Architectures. In Proceedings of HPCA,February 2005.
[24] M. Lipasti, C. Wilkerson, and J. Shen. Value Locality and Load ValuePrediction. In Proceedings of ASPLOS, October 1996.
[25] S. Martello and P. Toth. Knapsack Problems: Algorithms and ComputerImplementations. Wiley, 1990.
[26] MediaBench. Mediabench. http://cares.icsl.ucla.edu/MediaBench/.[27] A. Merkel and F. Bellosa. Balancing Power Consumption in Multiprocessor
Systems. In Proceedings of Eurosys 2006, April 2006.[28] J. Moore, J. Chase, P. Ranganathan, and R. Sharma. Making Scheduling Cool:
Temperature-Aware Resource Assignment in Data Centers. In Proceedings ofUSENIX, April 2005.
[29] V. Pandey, W. Jiang, Y. Zhou, and R. Bianchini. DMA-Aware Memory EnergyManagement. In Proceedings of HPCA, February 2006.
[30] M. Powell, M. Gomaa, and T. N. Vijaykumar. Heat-and-Run: Leveraging SMTand CMP to Manage Power Density Through the Operating System. InProceedings of ASPLOS, October 2004.
[31] Rambus. RDRAM. http://www.rambus.com.[32] P. Ranganathan, P. Leech, D. Irwin, and J. Chase. Ensemble-Level Power
Management for Dense Blade Servers. In Proceedings of ISCA, June 2006.[33] E. Rohou and M. D. Smith. Dynamically Managing Processor Temperature and
Power. In Proceedings of FDO, November 1999.[34] Samsung. 512Mb E-die DDR2 SDRAM Specifi cation.
http://www.samsung.com/Products/Semiconductor/DDR DDR2/-DDR2SDRAM/Component/512Mbit/K4T51083QE/ds k4t51xx3qe rev14.pdf.
[35] L. Shang, L.-S. Peh, A. Kumar, and N. Jha. Characterization and Managementof On-Chip Networks. In Proceedings of Micro, December 2004.
[36] K. Skadron, M. Stan, W. Huang, S. Velusamy, K. Sankaranarayanan, andD. Tarjan. Temperature-Aware Microarchitecture. In Proceedings of ISCA, June2003.
[37] J. Srinivasan, S. Adve, P. Bose, and J. Rivers. The Case for LifetimeReliability-Aware Microprocessors. In Proceedings of ISCA, June 2004.
[38] Virtutech. Simics. http://www.simics.net.[39] J. J. Yi, S. V. Kodakara, R. Sendag, D. J. Lilja, and D. M. Hawkins.
Characterizing and comparing prevailing simulation techniques. In Proceedingsof HPCA, February 2005.
[40] L. Zhang, Z. Fang, M. Parker, B.K. Mathew, L. Schaelicke, J.B. Carter, W.C.Hsieh, and S.A. McKee. The Impulse Memory Controller. IEEE Transactionson Computers, Special Issue on Advances in High-Performance MemorySystems, November 2001.
[41] P. Zhou, V. Pandey, J. Sundaresan, A. Raghuraman, Y. Zhou, and S. Kumar.Dynamic Tracking of Page Miss Ratio Curve for Memory Management. InProceedings of ASPLOS, October 2004.
[42] Q. Zhu and Y. Zhou. Power-Aware Storage Cache Management. IEEETransactions on Computers, 54(5), 2005.