l4: studies on the demand for health care and health
TRANSCRIPT

L4: Studies on the demand for health care and healthinequality
Marcelo Coca Perraillon
University of ColoradoAnschutz Medical Campus
Health EconomicsHSMP 6604
2021
1

Outline
A detour on causal inference
Another detour on elasticities
Do demand curves slope downward?
Does health insurance affect health outcomes?
The RAND health insurance experiment
The Oregon health insurance experiment
Health disparities and economics
2

Causal inference
Before we talk about study results, we need to take a brief detour and talkabout causality, and later, elasticities
If you made it this far in your education, by know you know that correlationdoes not imply causation
If something happens after another thing happens, it doesn’t mean that oneof them caused the other
If a person who has a health plan with higher copays uses less medical carethan a person with lower copays, it doesn’t mean that it is because of thehigher copays
If we look at the data and find that people who take antidepressants haveworse outcomes, it doesn’t mean that antidepressants are bad for health
If the health outcomes of a person who is covered by Medicaid compared to asimilar person without Medicaid are worse, it doesn’t mean that Medicaid isbad for health
The more interesting question is: under which circumstance correlationdoes imply causation?
3

Populations, samples, inference, causal inference
We have this model in statistics, econometrics, biostatistics (same stuff,different jargon) that is very powerful
We assume that there is a population out there that is very large (infinity fortechnical reasons) – people with Medicaid, people who have depression
We take a sample from that population, we analyze it, and then we makeinferences about the population
Inference: “a conclusion reached on the basis of evidence and reasoning”
To be able make good inferences, a lot of conditions must hold, and that’swhen life gets fairly complicated
Even the decennial “census” is not truly a census and is also based onsampling and adjusting for non-response
To make inferences are about cause and effect, we need even more conditionsto hold – that’s causal inference
4

Randomization
A powerful method that in the history of humanity scale was developedtoday, about 4 hours ago, is randomization
The idea is very simple: you have a large number of “units” (people,hospitals, classrooms, ect)
You randomly divide the units into two or more groups. You them apply atreatment to one group and not the other (or different versions of atreatment)
You compare average outcomes among the groups to determine if atreatment (aka exposure in epi) causes the outcome
The reason randomization works is that the groups are, on average, identical.If you truly used a random system to assign them to the different groups andsample sizes are large enough, the fact that one received the treatment hasnothing to do with anything else – it was random
If the group (as a group!) are the same and the only thing that changes isthe treatment, then one group provides a conterfactual for the other
Conterfactual: relating to or expressing what has not happened or is not thecase.
5
Definition of causal effects
The definition of causal requires an alternative universe to make sense
What we need to understand is, what would have happened to the controlhad the control group received the treatment? And the other part too: whatwould have happened to the treated group had the treated group not beentreated? The conterfactuals
Since we can’t observe both universes, we rely on randomization to obtainaverage treatment effects (that’s often called the “fundamental problem ofcausal inference”)
In a sense, causal inference is a prediction problem. We want to predictwhat would have happened. We use one group to make predictions about theother
We can’t obtain individual-level treatment effects (unless we startmaking strong assumptions)
Note that the key ingredient in this mind-bending story was randomtreatment assignment
6

What if treatment is not random?
Outside controlled experiments, treatment assignment is not random
In an observational study (that is, without manipulation), individuals nottaking an antidepressant are not comparable to those who do not takeantidepressants
Individuals who obtain Medicaid are different than “similar” individuals whodo not have Medicaid. The reason is that we can only compare things we canobserve. They may look “similar” in things we can see but not in things wecannot see
One of them is disease. Low-income individuals tend to obtain Medicaidbecause they are sicker
People who enroll in high copay plans are different than those who don’t
Without experiments, it’s very difficult to use observational data tomake causal statements
Think about using observed prices and quantities to estimate supply anddemand curves. How could we estimate any if what we observe areequilibrium prices and quantities?
7

The key question to ask
The key question when you try to come up with a method to studyobservation data is this: Why some people ended up receiving“treatment”?
Treatment can be actual treatment as we often use the word or it can be apolicy change or a different set of conditions: having insurance, having highercopays, etc
Once you start thinking about the reasons why some people receivedtreatment, you notice the selection problem
Antidepressants? Severity of depression, family history, suicidal thoughts.Medicaid? Disease. Higher copay? Expectation of lower health care needs(often higher copays mean lower premiums)
8

Not all is lost
Coming up with research designs using observational data is not easy but it’snot impossible either
There a lot of clever things that we could do to get answers, although it’shard to know if the clever things work
In general, these methods are called “quasi-experimental” or “naturalexperiments;” they come in different names
If you are interested in more details on causal inference, see these class notes:https://clas.ucdenver.edu/marcelo-perraillon/sites/default/
files/attached-files/w2_causal_inference_perraillon_0.pdf
Or take my other class:https://clas.ucdenver.edu/marcelo-perraillon/teaching/
health-services-research-methods-i-hsmp-7607
9

Elasticity
Elasticity is one of those econ concepts that confuses students even thoughit’s fairly simple
When we talk about how a change in the the price of something affects thequantity demanded, units matter
A $20 increase in the price of of a hamburger is not the same as $20 increasein the price of a new Tesla
Intuitively, percentages matter. $20 increase in the price of a hamburgercould be a 50% increase, while for a new Tesla is a minuscule increase
Economists use elasticities to measure the effect of price changes in the samescale: percentages. That’s it. Really, that’s all you need to remember
If prices increased by 1 percent, what is the percent decrease in quantitydemanded?
10
Elasticity, calculation
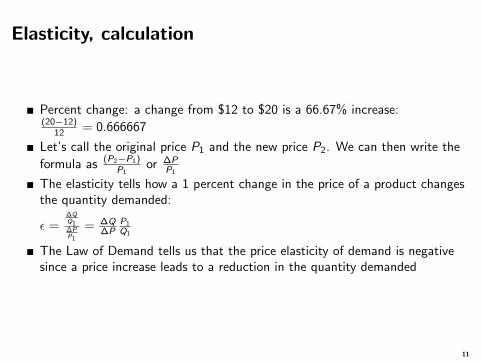
Percent change: a change from $12 to $20 is a 66.67% increase:(20−12)
12 = 0.666667
Let’s call the original price P1 and the new price P2. We can then write the
formula as (P2−P1)P1
or ∆PP1
The elasticity tells how a 1 percent change in the price of a product changesthe quantity demanded:
ε =∆QQ1∆PP1
= ∆Q∆P
P1
Q1
The Law of Demand tells us that the price elasticity of demand is negativesince a price increase leads to a reduction in the quantity demanded
11

Elasticity, calculation
When calculating percent changes, the base matters. The change from $12 to
$20 could be expressed the other way around, as a reduction (12−20)20 = −0.4
(People get confused with this a lot. If the stock market declines by 50% oneday, it needs to increase by much more than 50% to get back to the samelevel. Say, it was 100. 50% decline is 50. To get back to 100, it needs toincrease by a 100%)
To avoid the issue of defining elasticities using a starting point, the arcelasticity used. Pick up the mid point instead:
E =∆Q
(Q1+Q2)/2∆P
(P1+P2)/2
Dividing by two is the same as multiplying by 12 so that will cancel out (your
textbook has the formula without dividing by 2)
Elasticity less than 1 in absolute value are usually considered “inelastic”
12

Elasticity tells us about the slope of the demandcurve
Is the demand curve sort of vertical or close to horizontal?
If more vertical, then the demand is inelastic (close to zero). People demandthe same quantity regardless of the price. Below are 3 different demandcurves
13

More elastic
The flatter the curve the more elastic (close to infinity). Small price changeshave large effects on the quantity demanded
14

Elasticity, intuitionIntuitively, things are that are cheaper or essential or not a big proportion ofour income will be inelastic: salt, sugar, flour, waterThings that are not essential or can be a large part of our budgets are goingto be more elastic: cocktails, restaurant meals, ski passes, gym memberships,cars. The ability to find substitutes matter, of course
Figure: Adapted form BHT, Chapter 215

What is the elasticity of health care products andservices?
This is a fundamental question in health economics with implications forhealth reform and policy
Historically, the first question was whether the demand for health care“slopes downward” or was sort of vertical
If people care so much about their health, aren’t they going to have a rathervertical demand curve? Regardless of price, they will not change theirquantity demanded
This is the question the RAND health insurance experiment tried to answer
The historical context matters. The RAND HIE was in the 80s, when healthcare prices and income inequality were not like they are today
There is not much of a surprise regarding RAND HIE findings: health careelasticity is not zero – the law of demand holds
16

Big picture
Read your textbook... But your textbook presents the RAND healthinsurance experiment and the Oregon “experiment” together
I think that’s a conceptual mistake. Very different populations with differentresearch questions and different circumstances
RAND: what is the effect of prices (copays) on quantity demanded in arepresentative sample with insurance coverage in the 80s?
Oregon: What is the effect of obtaining Medicaid coverage versus nocoverage in a low-income population around 2008?
Different research questions and settings even if both can tell us somethingabout the demand for health care
Both are less able to tell us something about the effect of insurance on healthoutcomes (we’ll see why)
17
RAND HIE basics
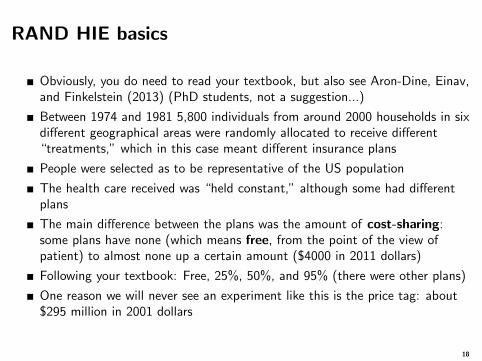
Obviously, you do need to read your textbook, but also see Aron-Dine, Einav,and Finkelstein (2013) (PhD students, not a suggestion...)
Between 1974 and 1981 5,800 individuals from around 2000 households in sixdifferent geographical areas were randomly allocated to receive different“treatments,” which in this case meant different insurance plans
People were selected as to be representative of the US population
The health care received was “held constant,” although some had differentplans
The main difference between the plans was the amount of cost-sharing:some plans have none (which means free, from the point of the view ofpatient) to almost none up a certain amount ($4000 in 2011 dollars)
Following your textbook: Free, 25%, 50%, and 95% (there were other plans)
One reason we will never see an experiment like this is the price tag: about$295 million in 2001 dollars
18

RAND HIE
Figure: Source: Dine, Einav, and Finkelstein (2013)19

RAND HIE, main findings
Remember that in the RAND HIE, nobody was uninsured. The point ofRAND was about the impact of cost-sharing (copays) on quantity demanded
I’ll use your textbook numbers. The most quoted number of the RAND HIEis the overall elasticity: -0.2. A 10% increase in copays reduces quantitydemanded by 2%
Outpatient care: As copayments increased, the number of outpatientsepisodes decreased – a large decrease: 36% difference from free to 95%
The same was true for those with chronic and acute conditions. So a personwith diabetes may not not visit the doctor as much; same as a person whohas a bad headache
Or people might skip on cancer screening; that’s clearly not good
20

RAND HIE, main findings
Similar results were found for other types of utilization like inpatient andoutpatient
The exact numbers are different than outpatient visits but not that different
There was even a difference for ER use. You would think that ER visits wouldbe more inelastic
The probability of ER visits went down from 22% for the free group to 15%for the 95% (remember, there was a cap to out of pocket expenses; it’s notthat they had to pay 95% of price of a surgery, for example). That’s a 30percent decline
So the law of demand holds in health care
See this another way: If we make health care free for all, that means thatutilization, and therefore costs, will increase, not decrease
For a comprehensive description of RAND HIE, see Joseph Newhouses’s(1993) book “Free for all?”
21

The Oregon Medicaid “experiment”The Oregon Medicaid experiment is more recent, around 2008. The reason Iput experiment in quotation marks is that it wasn’t really an experiment
Oregon had some extra money for their Medicaid program. Rather thangiving more Medicaid coverage to some people, they had a lottery to givepeople the chance to receive Medicaid
So they accidentally created a sort of randomized experiment since thelottery was, well, random. So it was (sort of) random who got Medicaid
One important caveat is that not all the people who won the lottery actuallyenrolled. Some decided not to. What was randomized was theopportunity to enroll in Medicaid, not the same as randomizingreceiving Medicaid
This creates some technical issues. The groups are not comparable since wedon’t know why some people decided to not enroll in Medicaid. Maybe thisare the people that are healthier so they didn’t bother to enroll?
The analysis of the Oregon used instrumental variables in the analysis. Seetowards the end of these slides for an intro to this method:https://clas.ucdenver.edu/marcelo-perraillon/sites/default/
files/attached-files/week_10_rdd_perraillon_0.pdf22

The Oregon Medicaid “experiment”
Note the key difference with RAND HIE
Those who got Medicaid would incur Medicaid copays, which in general arelow or non-existing – vary by state
Those who did not win the lottery presumably had no insurance and mustpay out-of-pocket or just don’t pay if they need emergency care
We still can get some information about elasticities, but the setting isdifferent and the population very different
Not to mention the world in 2008 is very different than the world around 1980
There is also the underlying (rather political) issue behind Medicaid: Medicaidis often seen as a very costly program without much apparent benefits
23

What are the main findings?
Similar to RAND’s for outpatient but no so much for inpatient and ER
ER utilization was a surprise. One way low-income people can get medical iscare is by going to the ER, since care cannot be denied
The logic was that having access to Medicaid would significantly reduce ERvisits
But that did not happen. One reasonable explanation is that just havingMedicaid does not translate into having access to a regular doctor
24

What about health and other outcomes?
If people do not seek medical care because of prices, is health affected?
Both RAND and Oregon did not find much evidence of an effect on health(with some exceptions here and there)
There are many reasons for this finding, the most likely being that thefollow-up was limited
There are other observational or quasi-experimental studies that can betteranswer this question
The Oregon experiment found effects on financial security and mental health
A note on the term “moral hazard:” Different usage. Original: “medicalinsurance increases the demand for medical care” or more often used as in“price sensitivity of health care demand.” The problem is that moral hazardimplies an underlying mechanism. Why is price sensitivity a “moral” hazard?The law of demand is not related to morality. Better to save the term for:“tendency for insurance against loss to reduce incentives to prevent orminimize the cost of loss.” Not sure if moral either by just a word
25
Health inequality
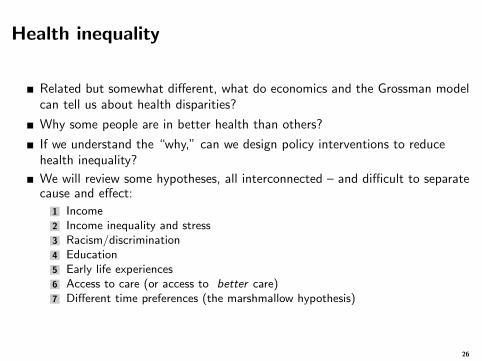
Related but somewhat different, what do economics and the Grossman modelcan tell us about health disparities?
Why some people are in better health than others?
If we understand the “why,” can we design policy interventions to reducehealth inequality?
We will review some hypotheses, all interconnected – and difficult to separatecause and effect:
1 Income2 Income inequality and stress3 Racism/discrimination4 Education5 Early life experiences6 Access to care (or access to better care)7 Different time preferences (the marshmallow hypothesis)
26

Grossman model, summary
I’ll mix the one-period and lifetime versions to keep the notation simpler (wewould need to discount budget constraint)
Lifetime utility (dynamic):∑T
t=01
(1+ρ)t U(Ht ,Zt)
Production functions:
1 Ht+1 = It + (1 − γt)Ht , or: Ht+1 = θH(Mt ,THt ) + (1 − γt)Ht
2 Zt = Z(T Zt , Jt)
Constraints (one-period):
1 Θt = TWt + T Z
t + THt + T S
t
2 Jt ∗ PJ + Mt ∗ PM = w ∗ TWt
Remember a feature (quirk?) of this model: wage is exogenous. But wagesdepend on skills, knowledge, education, which are also investment decisionsthat take time and resources. Education in Grossman affects productionefficiency, so it’s there – it’s just that we don’t model where it’s coming from
The other human capital model (Becker’s) is about skill formation (formal,like getting a degree) or informal (on-the-job training, knowledge/skillsobtained by other means). That determines wage – it’s harder to talk abouthealth disparities with just the Grossman side of human capital
27

Income
What is it about income that could have an effect on health? You can buymore things
Imagine two identical people with the same preferences. One has a higherwage than the other
The person with higher wages will “produce” more health because thisperson can consume more J and more M. That means that the person withhigher wages has an expanded production possibility frontier
Said another way, the optimal level of health for this person will be higher. Ina sense, the person with higher wage has more incentives to stay healthybecause his time is more valuable than the person with lower wages. This is abit odd to make sense outside the Grossman model’s logic
This of course begs the question, why is it that one person has higher wagesif they are identical? Where is wage coming from? In economics, it’s linkedto productivity (and formal education or on-the-job training), but inGrossman wage is “exogenous.” Let’s not forget about trust-fund kidshere – it’s also luck
28

Income inequality
Income inequality is related but somewhat different: is it the level of incomethat matters or the fact that some people make less than others?
In a country where we perceive that anybody has a chance to prosperity andbe president, does not being prosperous and a leader implies poorer health?
In other words, relative income, not just absolute income matters
This is related to the idea that stress has pervasive effects on health(allostatic load theory) – “allostatic” is the “the process by which the bodyresponds to stressors in order to regain homeostasis”
There is plenty of evidence of this in animals, from monkeys to chickens (asin “pecking order” )
In the Grossman model, this would be reflected in the rate of depreciation γt
We saw that a higher depreciation rate makes investments in health morecostly. If that comes along with less income to buy M or J, the situation iseven worse
29

Racism and discrimination
If we are talking about the allostatic load theory, we need to talk aboutracism and discrimination
Both are insidious (“proceeding in a gradual, subtle way, but with harmfuleffects”) and pervasive (“spreading widely throughout an area or a group ofpeople”)
One mechanism is stress, but of course not the only one
Using the Grossman model, discrimination and stress affect every single leverin the model
They affect educational attainment (therefore the marginal efficiency ofhealth capital), wages, sick time, and the depreciation rate
The saddest part is that racism and discrimination can have an impact byjust knowing/believing it’s there, everywhere (impostor syndrome? Feelingsof not belonging?). Don’t fall into this trap
30

Education
Another source of health inequality is education or knowledge more generally– “human capital”
Similar to income: education makes people better at “producing” health,identical people with different levels of education will have different levels ofhealth
We saw last week the many ways in which education can have an effect onhealth
As with wages, this begs the question of why people would have differentlevels of educations, which leads us to find explanations about early lifefactors
One way of thinking about investments in education and health is thatthey are complementary. They are synergistic – so much evidence showingthat education impacts health outcomes
Feel better: you’re getting a degree and increasing your life expectancy, allin one
31

Time preferences
We saw this already, one way in which education affects health in the idea oftime preferences, or the discount rate
How we make trade-offs between present and future has an impact on ourdecisions. In Grossman, it’s the discount rate (ρ):
∑Tt=0
1(1+ρ)t U(Ht ,Zt)
Exercise doesn’t feel that great. Eating a hamburger with fries tastes betterthan a salad. Studying takes a lot of effort – hanging out with friends orwatching TV feels better. Checking your email or Twitter or shopping whilein class gives you immediate gratification
We do the hard things because we think the effort will pay-off in the future,not now
You probably have heard of the marshmallow experiments
But is delaying gratification innate? Not sure. There is evidence thatinheritance is a factor, but not everything:https://www.ncbi.nlm.nih.gov/pmc/articles/PMC3036802/
32

Barker hypothesis
The barker hypothesis (or “fetal origins”) has generated a lot of interest inmedicine, epidemiology, and economics
The idea is that the environment during gestation (especiallynutrition)“programs” the fetus to develop disease in the future
This view has been fairly controversial, too. The Barker studies wereobservational
As I told you last class: think about why people get “treatment”? Treatmenthere is being exposed to bad things during gestation: mother smoking, poornutrition, stress, environmental toxins. Obviously, it’s not random
But... some kind of are, so we can study them better: hurricanes,earthquakes, policies implemented in one place but not others, natural events
Although, you then have to ask: is it random that people live in ahurricane-prone area? Is it random that some people were exposed to famine?
33

Barker hypothesisIn the Grossman model, the dynamics of health is given byHt+1 = It + (1 − γt)Ht
But in this model, early health shocks would not last a lifetime, they wouldeventually fade away
Figure: From Almond and Currie (2011)
34

Barker hypothesis
Other models have been proposed based on the idea that investments arecomplementary: investments during pregnancy and after are complements;it’s the fact that they complement each other that makes the effectsustainable – in this way, a good start in life has a long-term effect, but sodoes a bad start
(The idea of complementary in time has been used to model addiction aswell)
Although there is some evidence on the Barker hypothesis, it probablydoesn’t explain a large portion of health disparities
The effects are perhaps not without the possibility of “fixing” with earlychildhood interventions
It does highlight the importance of early interventions: prenatal care,nutrition, programs to prevent smoking and/or drug use during pregnancy –even stress-reduction interventions like yoga or meditation during pregnancy
35

Policy
Taking all these potential explanations together, we can see the importanceof policy proposals that target each possible cause
Some are about health care, but others are actually not about the medicalsystem: they are about socioeconomic disparities
But we can’t address each cause independently. The human capitalmodels (not just Grossman’s) provide a framework to think about theseproblems
It also brings back the issue of choice. Is the level of health a choice? To acertain extent. It’s also about circumstances – and bad luck
How we frame this problem matters a lot. Look at all the causes again;people with different political views (different “conceptual frameworks”) tendto think of the origin of each in a different way
A lot of this is related to the concept of agency. Is it about personalefforts/behavior or about circumstances? Nature or nurture?
36