labor hia analyses
TRANSCRIPT
HIA and Labor Policies: Examples of Analytic Approaches
Rajiv Bhatia, MD, MPHSan Francisco Department of Public Health
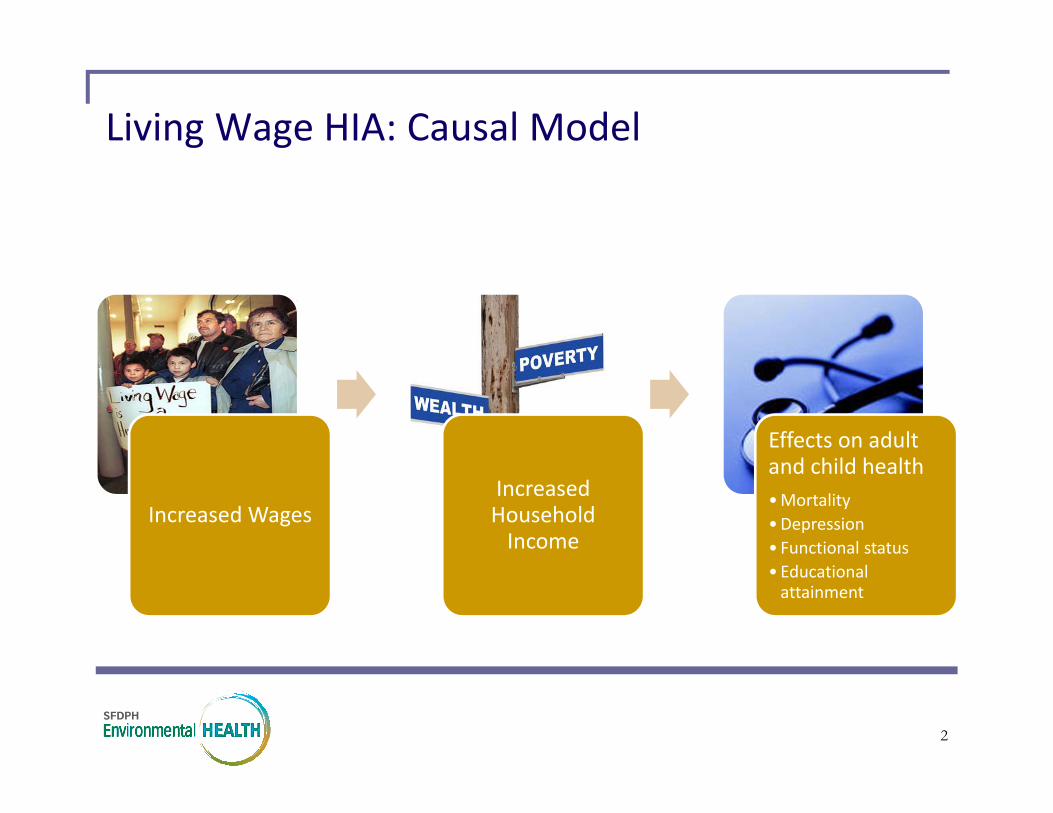
Living Wage HIA: Causal Model
Increased WagesIncreased Household Income
Effects on adult and child health•Mortality•Depression• Functional status• Educational attainment
2
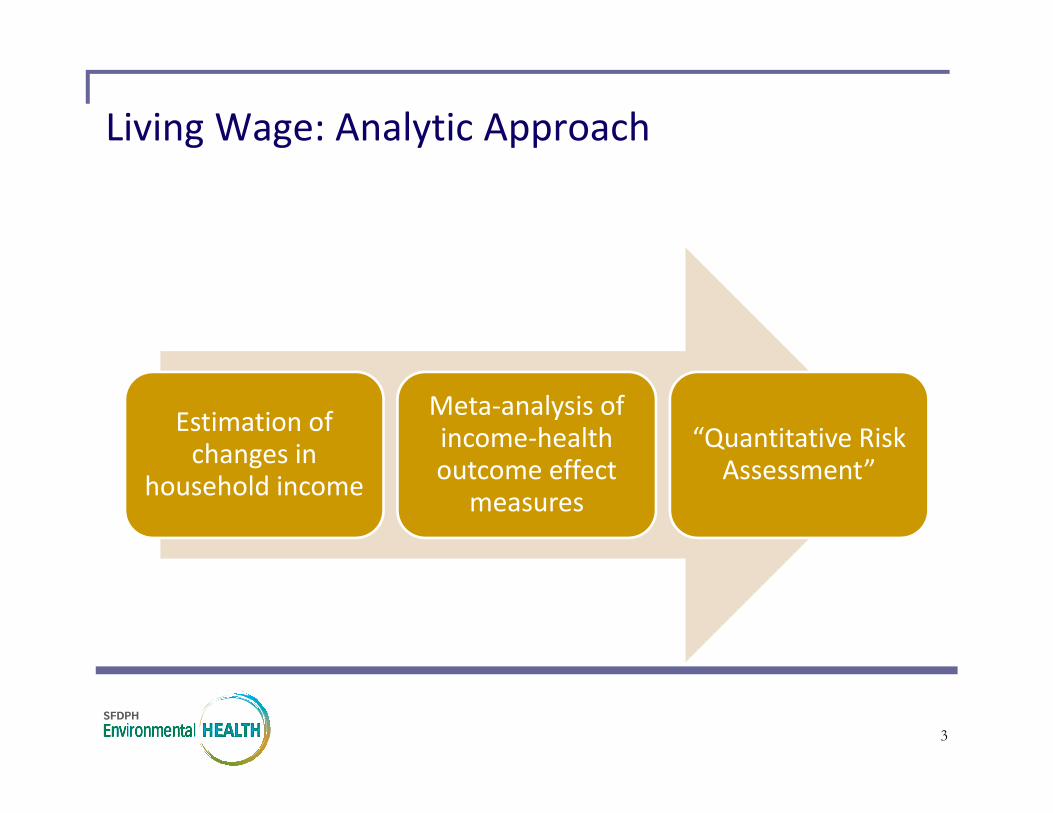
Living Wage: Analytic Approach
Estimation of changes in
household income
Meta‐analysis of income‐health outcome effect
measures
“Quantitative Risk Assessment”
3
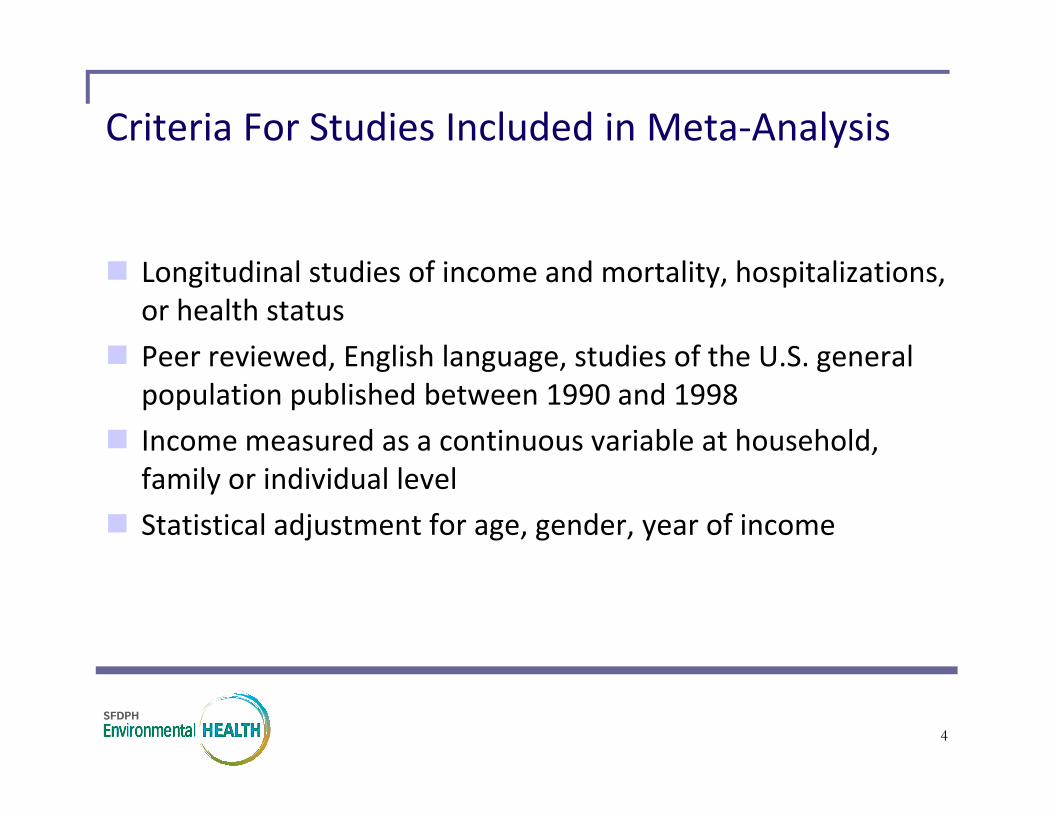
Criteria For Studies Included in Meta‐Analysis
Longitudinal studies of income and mortality, hospitalizations, or health status
Peer reviewed, English language, studies of the U.S. general population published between 1990 and 1998
Income measured as a continuous variable at household, family or individual level
Statistical adjustment for age, gender, year of income
4

HIA Findings: Estimated Health Effects of Living Wage for Workers with $20K Family Incomes
Study/Outcome Model Effect Measure Full Time Workers Part Time Workers Backlund, 1996
Mortality‐Male Proportional Hazards Hazard Ratio 0.94 (0.92‐0.97) 0.97 (0.96‐0.98)
Mortality‐Female Proportional Hazards Hazard Ratio 0.96 (0.95‐0.98) 0.98 (0.97‐0.99)
Ettner, 1996
Health Status Ordered Probit Relative Risk 0.94 (0.93‐0.96) 0.97 (0.96‐0.98)
ADL Limitations Probit Relative Risk 0.96 (0.95‐0.98) 0.98 (0.97‐0.99)
Work Limitations Probit Relative Risk 0.94 (0.92‐0.96) 0.97 (0.95‐0.98)
CES—Depression Scale Two Part Elasticity ‐1.9% ‐1.1%
Number of Sick Days Two Part Elasticity ‐5.8% ‐3.2%
Alcohol Consumption Two Part Elasticity +2.4% +1.3%
Duncan, 1998
Completed Schooling OLS Regression Years of Schooling 0.25 (0.20‐0.30) 0.15 (0.12‐0.17)
H.S. Completion Logistic Regression Odds Ratio 1.34 (1.20‐1.49) 1.18 (1.11‐1.26)
Non‐Marital Birth Proportional Hazards Hazard Ratio 0.78 (0.69‐0.86) 0.86 (0.81‐0.92)

Paid Sick Days: Causal Model
Need for Sick Leave from Work•Injury, illness, or chronic condition, in worker or family member
Direct effects of Leave•Recovery / care•Medical visits•Community / workplace exposure
Health outcomes of Leave•Disease morbidity•Appropriate service utilization•Functional status / productivity•Communicable disease incidence
6
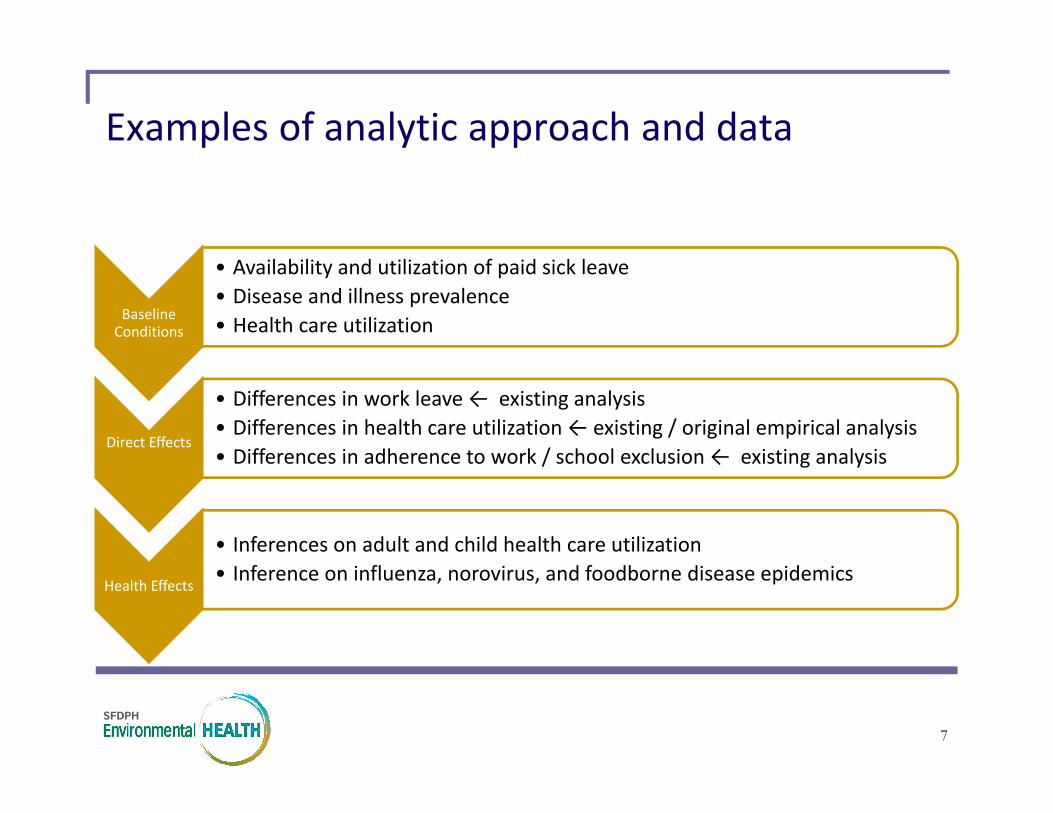
Examples of analytic approach and data
Baseline Conditions
• Availability and utilization of paid sick leave• Disease and illness prevalence• Health care utilization
Direct Effects
• Differences in work leave ← existing analysis• Differences in health care utilization ← existing / original empirical analysis• Differences in adherence to work / school exclusion ← existing analysis
Health Effects
• Inferences on adult and child health care utilization • Inference on influenza, norovirus, and foodborne disease epidemics
7
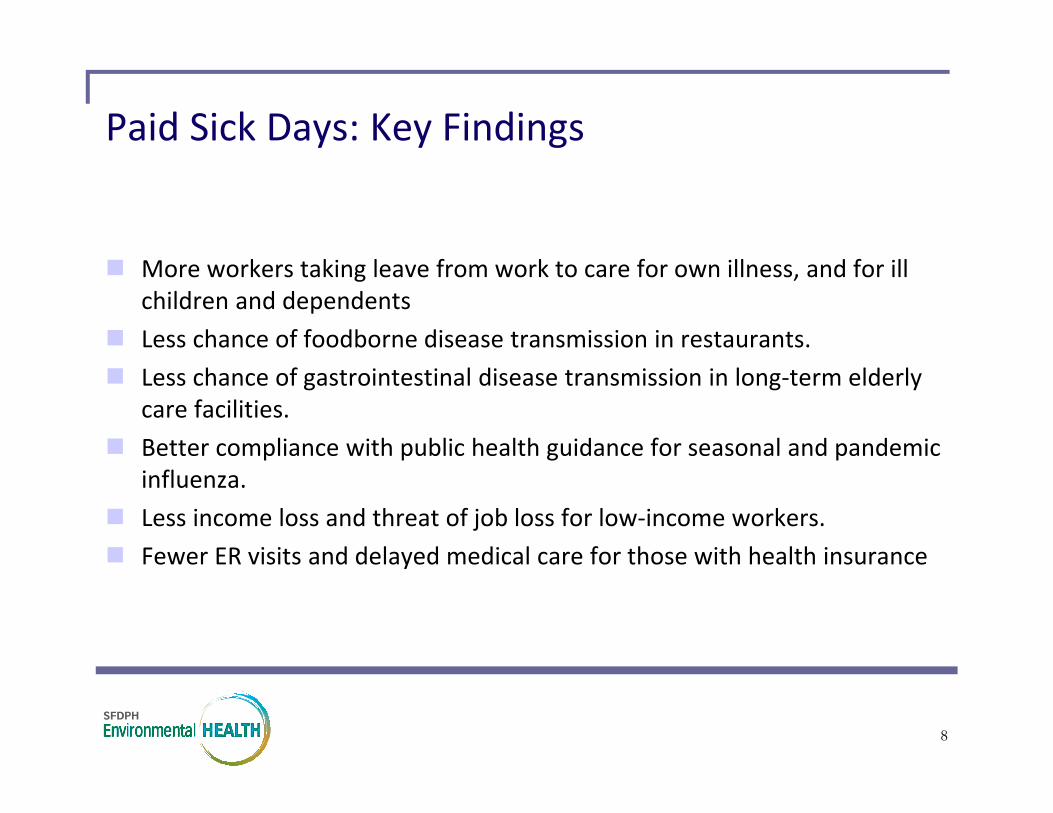
Paid Sick Days: Key Findings
More workers taking leave from work to care for own illness, and for ill children and dependents
Less chance of foodborne disease transmission in restaurants. Less chance of gastrointestinal disease transmission in long‐term elderly
care facilities. Better compliance with public health guidance for seasonal and pandemic
influenza. Less income loss and threat of job loss for low‐income workers. Fewer ER visits and delayed medical care for those with health insurance
8

8 Hrs Uninterrupted Sleep
Domestic Workers HIA: Causal Models
Direct Effects
• Sleep quality• Sleep quantity• Sleepiness and fatigue
Health Effects
•Cognitive and motor Performance•Endocrine system function• Stress related diseases•Adverse pregnancy outcomes
Indirect Effects
•Caregiving job performance•Unintentional Injuries
9
Direct Effects
•Timely treatment of work‐related injuries and illnesses
• Temporary disability payments
Health Effects
•Musculoskeletal injury & pain•Duration of disability•Basic material needs
Indirect Effects
• Job performance•Employee retention•Cost‐shifting to public sector
Access to Workers’ Comp
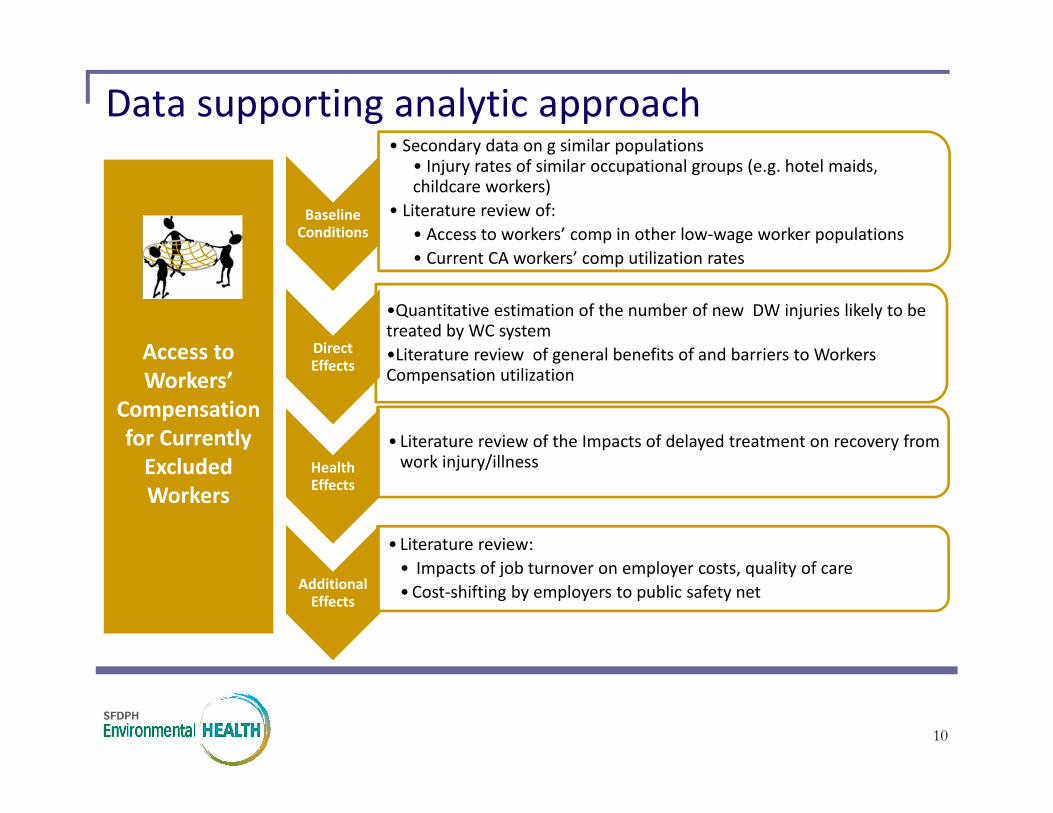
Access to Workers’
Compensation for Currently Excluded Workers
Data supporting analytic approach
Baseline Conditions
• Secondary data on g similar populations• Injury rates of similar occupational groups (e.g. hotel maids, childcare workers)
• Literature review of:• Access to workers’ comp in other low‐wage worker populations• Current CA workers’ comp utilization rates
Direct Effects
•Quantitative estimation of the number of new DW injuries likely to be treated by WC system•Literature review of general benefits of and barriers to Workers Compensation utilization
Health Effects
• Literature review of the Impacts of delayed treatment on recovery from work injury/illness
Additional Effects
• Literature review:• Impacts of job turnover on employer costs, quality of care•Cost‐shifting by employers to public safety net
10

Domestic Worker HIA: Key Findings ad Recommendations
Recommendations Increase sleep protection to 8 hours Address barriers to worker utilization of legal
benefits Improve data collections on domestic worker
occupational health
11
218,000 DWs in CA; many experience wage theft; not protected by safety & labor laws
Compared to general workers, DWs experience higher risk of occupational injury
Impacts of Workers’ Comp: Up to 620 domestic workers would be
eligible for workers’ comp benefits under AB 889
Prevention of long‐term disability among workers;
Impacts of Sleep: Reduced risk of pre‐mature death,
chronic disease, and depression for some 24‐hr/live‐in
SF HIA Collaborativewww.hiacollaborative.org
SF Department of Public Healthwww.sfphes.org
Healthy Development Toolwww.thehdmt.org
UC Berkeley HIA Grouphttp://sites.google.com/site/ucbhia
Human Impact Partnerswww.humanimpact.org
Resources: