labor market update 2016
TRANSCRIPT

LABOR MARKET UPDATE
PREPARED BY:
GLOBAL MARKET INSIGHTS
APRIL, 2016

WORLD EMPLOYMENT & SOCIAL OUTLOOK
• The global economy is showing new signs of weakness pushing unemployment to over 197 million in 2015 and making existing jobs increasingly vulnerable
• The outlook is for unemployment to increase by a further 3.4 million over the next two years and for slower progress in reducing vulnerable employment, which could reach 1.5 billion by 2016 leading to a pause in the expansion of the middle class and, in some cases, intensified risk of social unrest stalling efforts to further reduce working poverty and complicating the tasks of increasing growth and meeting demographic challenges
• Policy focus on quantity and quality of jobs and tackling income inequality is paramount
2
2016 TRENDS
Source: International Labour Office, ILO.org, “World Employment and Social Outlook – Trends 2016”

WORLD ECONOMIC OUTLOOK - UPDATE
• Global growth, currently estimated at 3.1 percent in 2015, is projected at 3.4 percent in 2016 and 3.6 percent in 2017
3
SUBDUED DEMAND, DIMINISHED PROSPECTS
Source: International Monetary Fund, imf.org, “World Economic Outlook – Update”, January 2016
3.43.1
3.43.6
2.4 2.5 2.6 2.62.9
2.2 2.2 2.2
0.2
1.11.3
1.51.6 1.51.7 1.7
-0.4
0.8
1.3 1.2
2014 2015 2016 2017
World Economic Outlook Projections, % YoY
World Output United States United Kingdom France Germany Italy
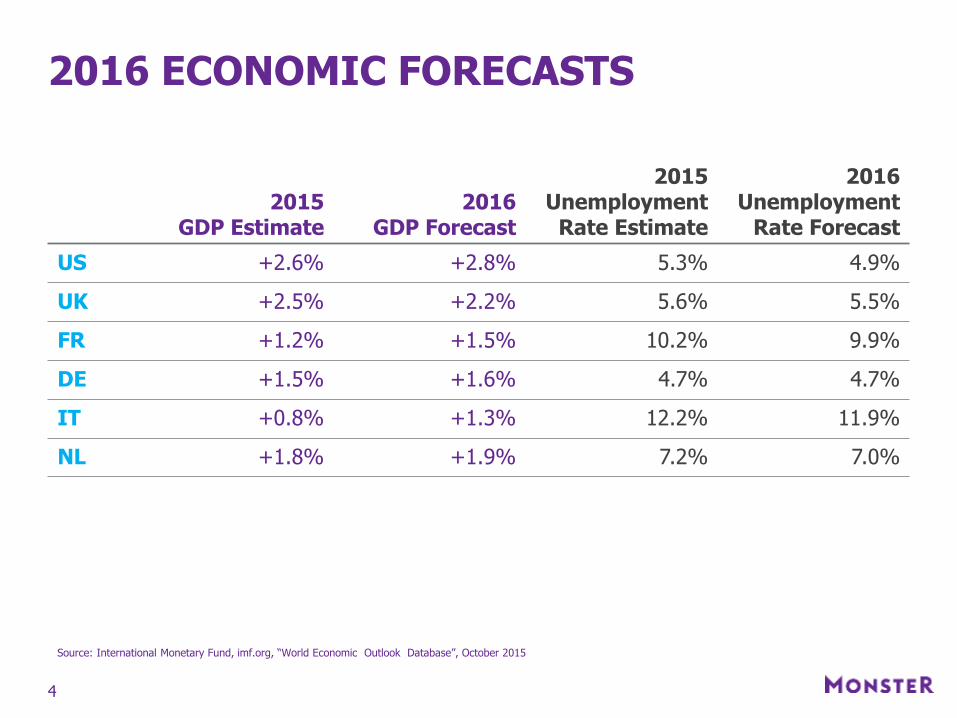
2016 ECONOMIC FORECASTS
2015GDP Estimate
2016GDP Forecast
2015Unemployment
Rate Estimate
2016 Unemployment
Rate Forecast
US +2.6% +2.8% 5.3% 4.9%
UK +2.5% +2.2% 5.6% 5.5%
FR +1.2% +1.5% 10.2% 9.9%
DE +1.5% +1.6% 4.7% 4.7%
IT +0.8% +1.3% 12.2% 11.9%
NL +1.8% +1.9% 7.2% 7.0%
4
Source: International Monetary Fund, imf.org, “World Economic Outlook Database”, October 2015

LABOR SHORTAGE AND SURPLUS PROJECTIONS
5
By 2030, most countries will face labor shortages including those with slight surpluses of between 0 and 5 percent; representing natural unemployment, in which job openings are already difficult to fill
Source: The Boston Consulting Group

UNITED STATES LABOR MARKET
UPDATE

US LABOR MARKET UPDATE
• U.S. adds 215,000 new jobs in March as more workers enter the labor force
• The unemployment rate rose a notch to 5% from 4.9% because more Americans joined the labor force
• The size of the labor force has increased by 2 million people in the past five months
• The influx of new workers and jobseekers pushed the labor force participation rate up to 63% - the highest level in two years
• 4th-quarter GDP raised to 1.4% almost entirely because of higher consumer spending on recreation and transportation
7

CURRENT EMPLOYMENT
SITUATION: MAR 2016
Change from February 2016:
Total non-farm payroll: +215,000
Private-sector payroll: +195,000
• Retail +48K
• Leisure/Hospitality +40K
• Healthcare +37K
• Construction +37K
• Professional/Business Services +33K
• Finance +15K
• Transportation -3K
• Manufacturing -29K
Temporary Help: +4,000
Government: +20,000
UNEMPLOYMENT RATE: 5.0%
8
5.5M AVAILABLEJOBS
159MIN THE U.S. WORKFORCE
8.0M UNEMPLOYED PEOPLE IN THE U.S.
GDP +1.4% IN Q4 2015
LABOR PARTICIPATION
RATE: 63.0%

US JOBS: AT A GLANCE
9
The U.S. unemployment rate was relatively unchanged at 5.0% in March 2016, near the post peak low of 4.9%. The unemployment rate peaked in October 2009 at 10.0% and is now 5.0 percentage points lower.
0%
2%
4%
6%
8%
10%
12%
'06 '07 '08 '09 '10 '11 '12 '13 '14 '15 '16
U.S. UNEMPLOYMENT RATE
-1,000
-800
-600
-400
-200
0
200
400
600
'06 '07 '08 '09 '10 '11 '12 '13 '14 '15 '16
U.S. MONTHLY JOBS GROWTH (IN THOUSANDS)
The U.S. created 215,000 new jobs in March 2016. The U.S. has been creating more than 200,000 jobs a month since 2014.
MAR: 5.0%
MAR: 215K
Source: Bureau of Labor Statistics
NonFarm

U.S. JOBS BY INDUSTRY: MAR 2016
IndustryEmployment(in thousands)
Employment, %
MoM% Change
MoM Net Change
Total nonfarm 143,774K 100% +0.1% +215K
Total private 121,692K 85% +0.2% +195KProfessional and business
services 20,042K 14% +0.2% +33K
Retail trade 15,942K 11% +0.3% +48K
Leisure and hospitality 15,461K 11% +0.3% +40K
Health care 15,420K 11% +0.2% +37K
Manufacturing 12,291K 9% -0.2% -29K
Financial activities 8,227K 6% +0.2% +15K
Construction 6,672K 5% +0.6% +37K
Transportation / warehousing 4,859K 3% -0.1% -3K
All Other Industries 22,778K 16% +0.1% +17K
Government 22,082K 15% +0.1% +20K
10
Source: Bureau of Labor Statistics

PRIVATE SECTOR
TOTAL NON-FARM PAYROLL
+586K
GOVERNMENT
+42K
+628K
UNEMPLOYMENT RATE
5.0%
Retail +181K
Leisure/hospitality +119K
Health Care +118K
Construction +75K
Professional +61K
- Temporary -52K
Financial activities +37K
Education +15K
Manufacturing -29K
Transportation -30K
EMPLOYMENT SITUATION2016-YTD
Source: Bureau of Labor Statistics
11
U.S. ECONOMY
12
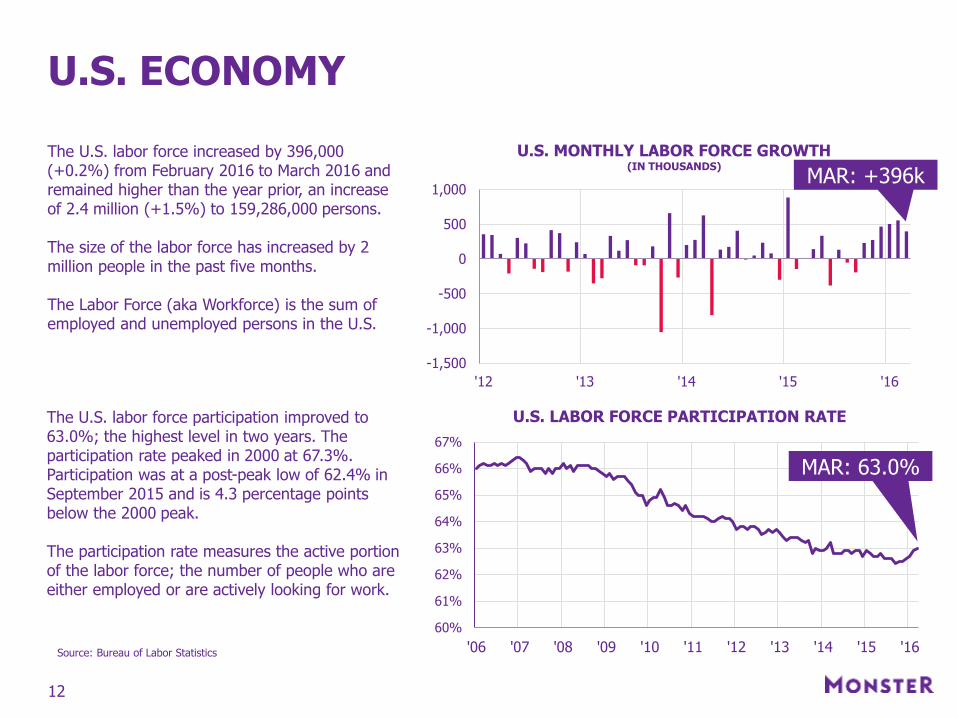
The U.S. labor force increased by 396,000 (+0.2%) from February 2016 to March 2016 and remained higher than the year prior, an increase of 2.4 million (+1.5%) to 159,286,000 persons.
The size of the labor force has increased by 2 million people in the past five months.
The Labor Force (aka Workforce) is the sum of employed and unemployed persons in the U.S.
The U.S. labor force participation improved to 63.0%; the highest level in two years. The participation rate peaked in 2000 at 67.3%. Participation was at a post-peak low of 62.4% in September 2015 and is 4.3 percentage points below the 2000 peak.
The participation rate measures the active portion of the labor force; the number of people who are either employed or are actively looking for work.
Source: Bureau of Labor Statistics
-1,500
-1,000
-500
0
500
1,000
'12 '13 '14 '15 '16
U.S. MONTHLY LABOR FORCE GROWTH (IN THOUSANDS)
MAR: +396k
60%
61%
62%
63%
64%
65%
66%
67%
'06 '07 '08 '09 '10 '11 '12 '13 '14 '15 '16
U.S. LABOR FORCE PARTICIPATION RATE
MAR: 63.0%

-2%-1%0%1%2%3%4%5%
$15,200$15,400$15,600$15,800$16,000$16,200$16,400$16,600
4Q
2013
1Q
2014
2Q
2014
3Q
2014
4Q
2014
1Q
2015
2Q
2015
3Q
2015
4Q
2015
% Y
ea
r-o
ve
r-Y
ea
r
Re
al G
DP
(in
bil
lio
ns)
U.S. REAL GDP
Real GDP (2009 Chained Dollars) % YoY
U.S. GDP
13
The U.S. Real GDP was $16,455.1 billion in the fourth quarter of 2015. Real GDP increased at an annual rate of 1.4% (third estimate), down from an increase of 2.0% in the third quarter of 2015.
Real GDP is the value of the goods and services produced by the nation’s economy less the value of the goods and services used up in production, adjusted for price changes.
Source: BEA.gov

U.S. JOB OPENINGS
14
There were 5.5 million job openings on the last business day of January 2016, an increase of 260,000 jobs (+4.9%) since December 2015. Job openings rose by 569,000 jobs (+11.4%) since the year prior.
(February 2016 results have not yet been released.)
The number of quits fell to 2.8 million (-284,000) in January 2016. The quits rate fell to 2% from 2.2%.
The quits rate is a proxy for worker confidence as willingness to leave a job usually indicates a better job is on the horizon.
(February 2016 results have not yet been released.)
0
1000
2000
3000
4000
5000
6000
7000
'06 '07 '08 '09 '10 '11 '12 '13 '14 '15 '16
U.S. JOB OPENINGS (IN THOUSANDS)
Source: Bureau of Labor Statistics
JAN: 5.54M
0.0%
0.5%
1.0%
1.5%
2.0%
2.5%
'06 '07 '08 '09 '10 '11 '12 '13 '14 '15 '16
U.S. QUIT RATE
JAN: 2.0%

U.S. TEMPORARY HELP EMPLOYMENT
15
-150
-100
-50
0
50
100
'06 '07 '08 '09 '10 '11 '12 '13 '14 '15 '16
U.S. TEMPORARY HELP SERVICES –MONTHLY JOB GROWTH (IN THOUSANDS)There were 2.9 million temporary help jobs in the
U.S. in March 2016. The number of persons employed in U.S. temporary help jobs increased by 4,000 (+0.1%) jobs over the month or rose by 55,000 (+1.9%) from the year prior.
Temporary help services employment has traditionally been viewed as a leading economic indicator to overall employment or the general economy.
The temporary help services industry is the largest component of the staffing industry and is comprised of companies that employ workers to do temporary work on the premises of, and under the supervision of, customers.
Source: Bureau of Labor Statistics
MAR: +4k

U.S. BEVERIDGE CURVE
16
Job openings continue to climb, yet unemployment remains higher than pre-recession levels.
In January 2016, the job openings rate was 3.7% and the unemployment rate was 4.9%, which is higher than the job openings rate before the most recent recession for the same unemployment rate.
From 2010 to today, nearly each month’s point moved up and to the left as the job openings rate increased and the unemployment rate decreased.
Source: Bureau of Labor Statistics

U.S. ECONOMIC OUTLOOK
17
New projections from October 2015 show GDP growth in the U.S. is forecast to be 2.6% in 2015 and 2.8% in 2016.
The U.S. unemployment rate is projected to be 5.3% in 2015 and 4.9% in 2016; the forecast was updated in October 2015.
-4.0%
-3.0%
-2.0%
-1.0%
0.0%
1.0%
2.0%
3.0%
4.0%
2008
2009
2010
2011
2012
2013
2014
2015
2016
2017
2018
2019
2020
U.S. GDP GROWTH RATE, %
Actual Forecast
0.0%
2.0%
4.0%
6.0%
8.0%
10.0%
12.0%
2008
2009
2010
2011
2012
2013
2014
2015
2016
2017
2018
2019
2020
U.S. UNEMPLOYMENT RATE, %
Actual Forecast
Source: IMF World Economic Outlook
U.S. SUPPLY AND DEMAND
18
2,000
4,000
6,000
8,000
10,000
12,000
153
154
155
156
157
158
159
160
Mar-
14
May-1
4
Jul-14
Sep-1
4
Nov-1
4
Jan-1
5
Mar-
15
May-1
5
Jul-15
Sep-1
5
Nov-1
5
Jan-1
6
Mar-
16
Jo
bs (
in t
ho
usa
nd
s)
La
bo
r Fo
rce
(in
mil
lio
ns)
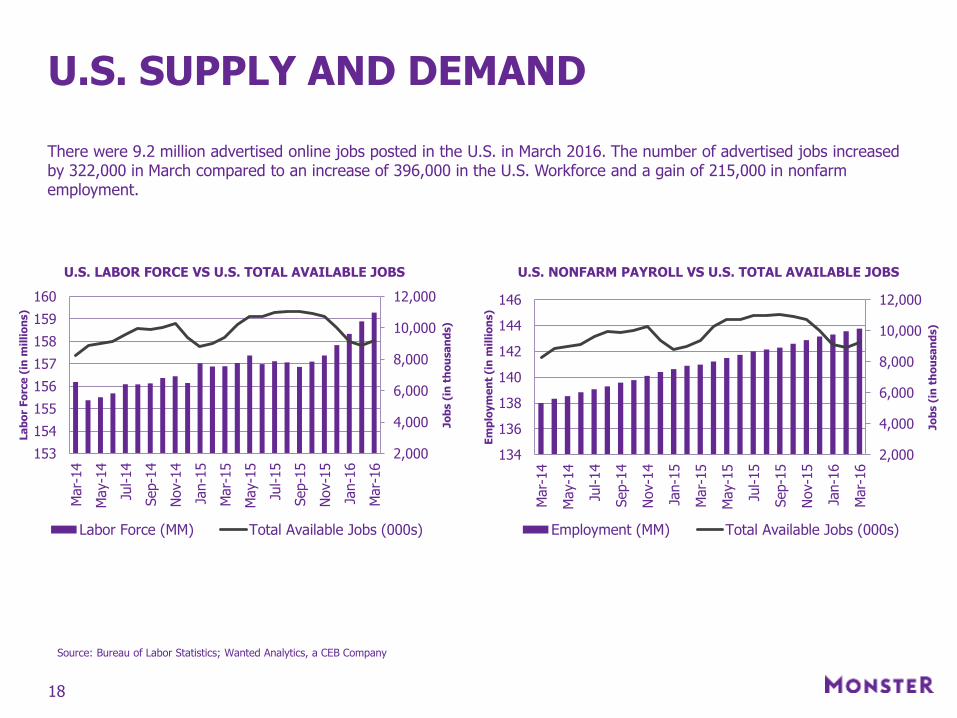
U.S. LABOR FORCE VS U.S. TOTAL AVAILABLE JOBS
Labor Force (MM) Total Available Jobs (000s)
2,000
4,000
6,000
8,000
10,000
12,000
134
136
138
140
142
144
146
Mar-
14
May-1
4
Jul-14
Sep-1
4
Nov-1
4
Jan-1
5
Mar-
15
May-1
5
Jul-15
Sep-1
5
Nov-1
5
Jan-1
6
Mar-
16
Jo
bs (
in t
ho
usa
nd
s)
Em
plo
ym
en
t (i
n m
illi
on
s)
U.S. NONFARM PAYROLL VS U.S. TOTAL AVAILABLE JOBS
Employment (MM) Total Available Jobs (000s)
There were 9.2 million advertised online jobs posted in the U.S. in March 2016. The number of advertised jobs increased by 322,000 in March compared to an increase of 396,000 in the U.S. Workforce and a gain of 215,000 in nonfarm employment.
Source: Bureau of Labor Statistics; Wanted Analytics, a CEB Company

U.S. MILLENNIALS, AGED 16 TO 34
19
-400
-200
0
200
400
600
800
'12 '13 '14 '15 '16
U.S. MILLENNIALS – MONTHLY JOBS GROWTH (IN THOUSANDS)
There were 52.6 million millennials employed in the U.S. in March 2016. The number of millennials employed in U.S. jobs increased by 126,000 (+0.2%) jobs over the month or rose by 1.3 million (+2.5%) from the year prior.
The Millennial generation is defined here as those born between 1982 and 2000 and are between the ages of 16 and 34 in 2016.
0%
2%
4%
6%
8%
10%
12%
14%
16%
'06 '07 '08 '09 '10 '11 '12 '13 '14 '15 '16
U.S. MILLENNIALS - UNEMPLOYMENT RATE
The U.S. unemployment rate for Millennials remained at 7.1% in March 2016 at a post peak low. The unemployment rate peaked in April 2010 at 13.9% and is now 6.8 percentage points lower.
Source: Bureau of Labor Statistics
MAR: 7.1%
MAR: 126K

UNITED KINGDOM
LABOR MARKET UPDATE

U.K. ECONOMIC OVERVIEW
21
There were 31,331,000 jobs in the U.K. in Q4 2015. The number of persons employed increased by 210,000 jobs (+0.7%) from the prior quarter or gained 520,000 jobs (+1.7%) year-over-year.(Q1 data are not currently available)
The UK harmonised unemployment rate for Q3 2015 was 5.3%, down from 5.9% a year ago. (Q4 data are not currently available)
Source: OECD.StatExtracts
0.0%
0.5%
1.0%
1.5%
2.0%
2.5%
3.0%
28,500
29,000
29,500
30,000
30,500
31,000
31,500
4q2012
1q2013
2q2013
3q2013
4q2013
1q2014
2q2014
3q2014
4q2014
1q2015
2q2015
3q2015
4q2015
UK EMPLOYMENT (000)
Employment YoY
0.0%
1.0%
2.0%
3.0%
4.0%
5.0%
6.0%
7.0%
8.0%
9.0%
3q2012
4q2012
1q2013
2q2013
3q2013
4q2013
1q2014
2q2014
3q2014
4q2014
1q2015
2q2015
3q2015
UK UNEMPLOYMENT RATE, %

U.K. ECONOMIC OUTLOOK
22
Projections updated in October 2015 show GDP growth in the U.K. is forecast to be 2.5% in 2015 and 2.2% in 2016.
The U.K. unemployment rate is projected to be 5.6% in 2015 and 5.5% in 2016.
-6.0%
-4.0%
-2.0%
0.0%
2.0%
4.0%
2008
2009
2010
2011
2012
2013
2014
2015
2016
2017
2018
2019
2020
UK GDP GROWTH RATE, % YOY
Actual Forecast
0.0%
2.0%
4.0%
6.0%
8.0%
10.0%
2008
2009
2010
2011
2012
2013
2014
2015
2016
2017
2018
2019
2020
UK UNEMPLOYMENT RATE, %
Actual Forecast
Source: IMF World Economic Outlook

FRANCE LABOR MARKET
UPDATE

FRANCE ECONOMIC OVERVIEW
24
There were 26,397,000 jobs in France in Q4 2015. The number of persons employed decreased by 4,000 jobs compared to the prior quarter yet rose by 20,000 jobs compared to the prior year’s quarter. (Q1 data are not currently available)
The France harmonised unemployment rate for Q4 2015 was 10.1%, up from 10.5% a year ago. (Q1 data are not currently available)
Source: OECD.StatExtracts
-0.5%
0.0%
0.5%
1.0%
1.5%
2.0%
2.5%
3.0%
25,200
25,400
25,600
25,800
26,000
26,200
26,400
26,600
4q2012
3q2012
4q2012
1q2013
2q2013
3q2013
4q2013
1q2014
2q2014
3q2014
4q2014
1q2015
2q2015
FRANCE EMPLOYMENT (000)
Employment YoY
9.9%
10.0%
10.1%
10.2%
10.3%
10.4%
10.5%
10.6%
4q2012
1q2013
2q2013
3q2013
4q2013
1q2014
2q2014
3q2014
4q2014
1q2015
2q2015
3q2015
4q2015
FRANCE UNEMPLOYMENT RATE, %

FRANCE ECONOMIC OUTLOOK
25
Projections updated in October 2015 show GDP growth in France is forecast to be 1.2% in 2015 and 1.5% in 2016.
The France unemployment rate is projected to be 10.2% in 2015 and 9.9% in 2016.
-4.0%
-3.0%
-2.0%
-1.0%
0.0%
1.0%
2.0%
3.0%
2008
2009
2010
2011
2012
2013
2014
2015
2016
2017
2018
2019
2020
FRANCE GDP GROWTH RATE, % YOY
Actual Forecast
0.0%
2.0%
4.0%
6.0%
8.0%
10.0%
12.0%
2008
2009
2010
2011
2012
2013
2014
2015
2016
2017
2018
2019
2020
FRANCE UNEMPLOYMENT RATE, %
Actual Forecast
Source: IMF World Economic Outlook

GERMANY LABOR MARKET
UPDATE
GERMANY ECONOMIC OVERVIEW
27
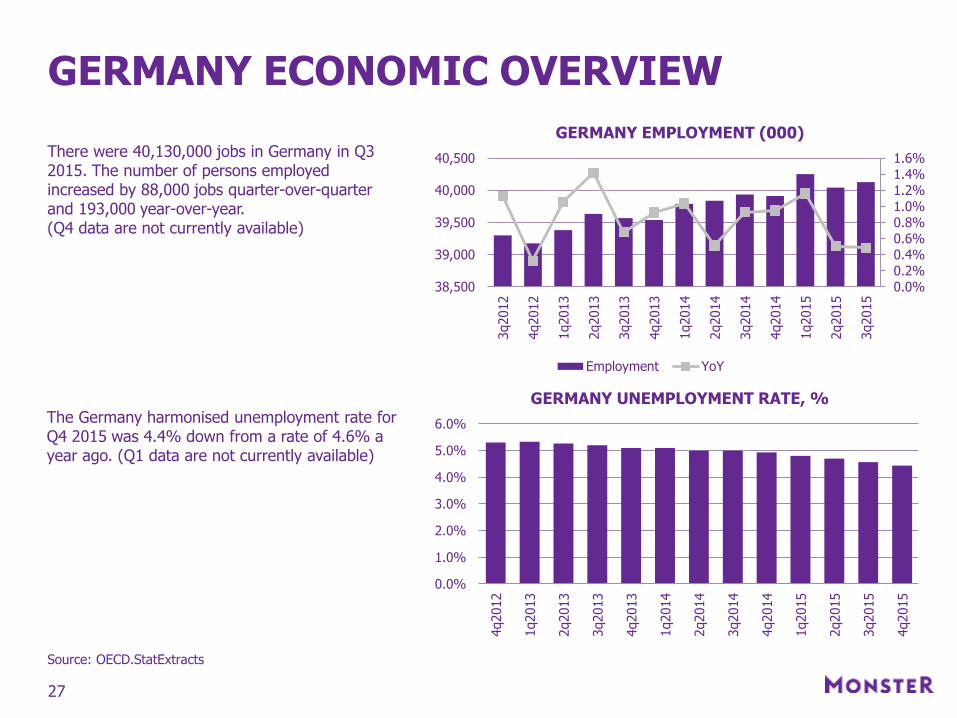
There were 40,130,000 jobs in Germany in Q3 2015. The number of persons employed increased by 88,000 jobs quarter-over-quarterand 193,000 year-over-year. (Q4 data are not currently available)
The Germany harmonised unemployment rate for Q4 2015 was 4.4% down from a rate of 4.6% a year ago. (Q1 data are not currently available)
Source: OECD.StatExtracts
0.0%0.2%0.4%0.6%0.8%1.0%1.2%1.4%1.6%
38,500
39,000
39,500
40,000
40,500
3q2012
4q2012
1q2013
2q2013
3q2013
4q2013
1q2014
2q2014
3q2014
4q2014
1q2015
2q2015
3q2015
GERMANY EMPLOYMENT (000)
Employment YoY
0.0%
1.0%
2.0%
3.0%
4.0%
5.0%
6.0%
4q2012
1q2013
2q2013
3q2013
4q2013
1q2014
2q2014
3q2014
4q2014
1q2015
2q2015
3q2015
4q2015
GERMANY UNEMPLOYMENT RATE, %

GERMANY ECONOMIC OUTLOOK
28
Projections updated in October 2015 show GDP growth in Germany is forecast to be 1.5% in 2015 and 1.6% in 2016.
The Germany unemployment rate is projected to be 4.7% in 2015 and 2016.
-8.0%
-6.0%
-4.0%
-2.0%
0.0%
2.0%
4.0%
6.0%
2008
2009
2010
2011
2012
2013
2014
2015
2016
2017
2018
2019
2020
GERMANY GDP GROWTH RATE, % YOY
Actual Forecast
0.0%
2.0%
4.0%
6.0%
8.0%
10.0%
2008
2009
2010
2011
2012
2013
2014
2015
2016
2017
2018
2019
2020
GERMANY UNEMPLOYMENT RATE, %
Actual Forecast
Source: IMF World Economic Outlook

ITALY LABOR MARKET
UPDATE

ITALY ECONOMIC OVERVIEW
30
There were 22,516,000 jobs in Italy in Q4 2015. The number of persons employed remained unchanged quarter-over-quarter and rose 178,000 year-over-year. (Q1 data are not currently available)
The Italy harmonised unemployment rate for Q4 2015 was 11.5%, down from 12.8% a year ago. (Q1 data are not currently available)
Source: OECD.StatExtracts
-2.5%-2.0%-1.5%-1.0%-0.5%0.0%0.5%1.0%1.5%
21,900
22,000
22,100
22,200
22,300
22,400
22,500
22,600
4q2012
1q2013
2q2013
3q2013
4q2013
1q2014
2q2014
3q2014
4q2014
1q2015
2Q
2015
3q2015
4Q
2015
ITALY EMPLOYMENT (000)
Employment YoY
10.5%
11.0%
11.5%
12.0%
12.5%
13.0%
4q2012
1q2013
2q2013
3q2013
4q2013
1q2014
2q2014
3q2014
4q2014
1q2015
2q2015
3q2015
4q2015
ITALY UNEMPLOYMENT RATE, %

ITALY ECONOMIC OUTLOOK
31
New October 2015 projections show GDP growth in Italy is forecast to turn positive and be 0.8% in 2015 and 1.3% in 2016.
The Italy unemployment rate is projected to be 12.2% in 2015 and 11.9% in 2016.
-6.0%-5.0%-4.0%-3.0%-2.0%-1.0%0.0%1.0%2.0%3.0%
2008
2009
2010
2011
2012
2013
2014
2015
2016
2017
2018
2019
2020
ITALY GDP GROWTH RATE, % YOY
Actual Forecast
0.0%
2.0%
4.0%
6.0%
8.0%
10.0%
12.0%
14.0%
2008
2009
2010
2011
2012
2013
2014
2015
2016
2017
2018
2019
2020
ITALY UNEMPLOYMENT RATE, %
Actual Forecast
Source: IMF World Economic Outlook

NETHERLANDS LABOR MARKET
UPDATE
NETHERLANDS ECONOMIC OVERVIEW
33
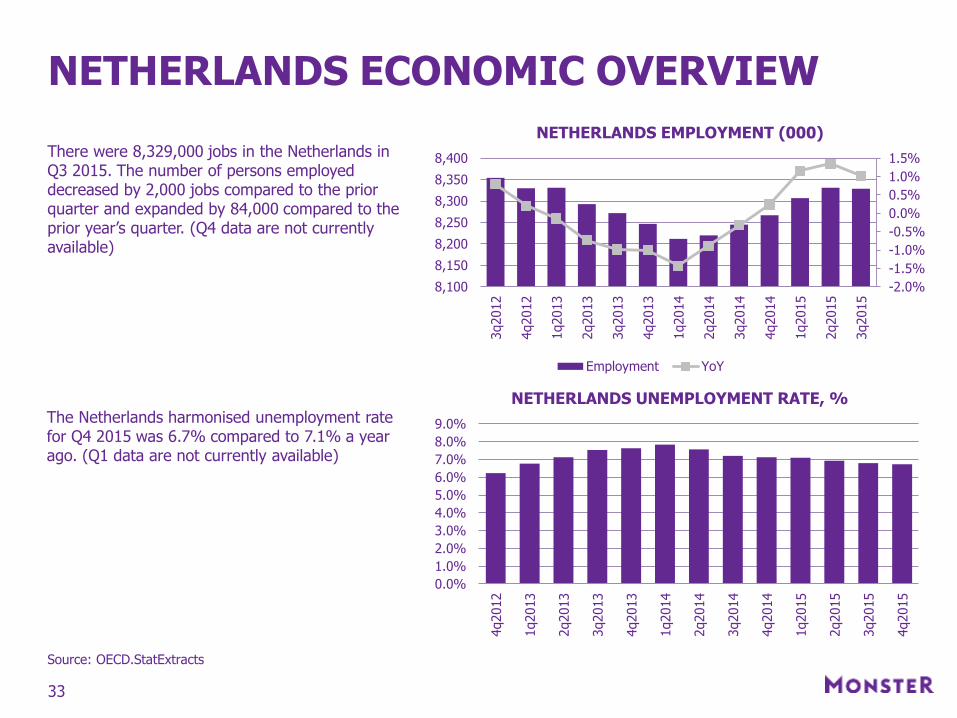
There were 8,329,000 jobs in the Netherlands in Q3 2015. The number of persons employed decreased by 2,000 jobs compared to the prior quarter and expanded by 84,000 compared to the prior year’s quarter. (Q4 data are not currently available)
The Netherlands harmonised unemployment rate for Q4 2015 was 6.7% compared to 7.1% a year ago. (Q1 data are not currently available)
Source: OECD.StatExtracts
-2.0%
-1.5%
-1.0%
-0.5%
0.0%
0.5%
1.0%
1.5%
8,100
8,150
8,200
8,250
8,300
8,350
8,400
3q2012
4q2012
1q2013
2q2013
3q2013
4q2013
1q2014
2q2014
3q2014
4q2014
1q2015
2q2015
3q2015
NETHERLANDS EMPLOYMENT (000)
Employment YoY
0.0%
1.0%
2.0%
3.0%
4.0%
5.0%
6.0%
7.0%
8.0%
9.0%
4q2012
1q2013
2q2013
3q2013
4q2013
1q2014
2q2014
3q2014
4q2014
1q2015
2q2015
3q2015
4q2015
NETHERLANDS UNEMPLOYMENT RATE, %
NETHERLANDS ECONOMIC OUTLOOK
34
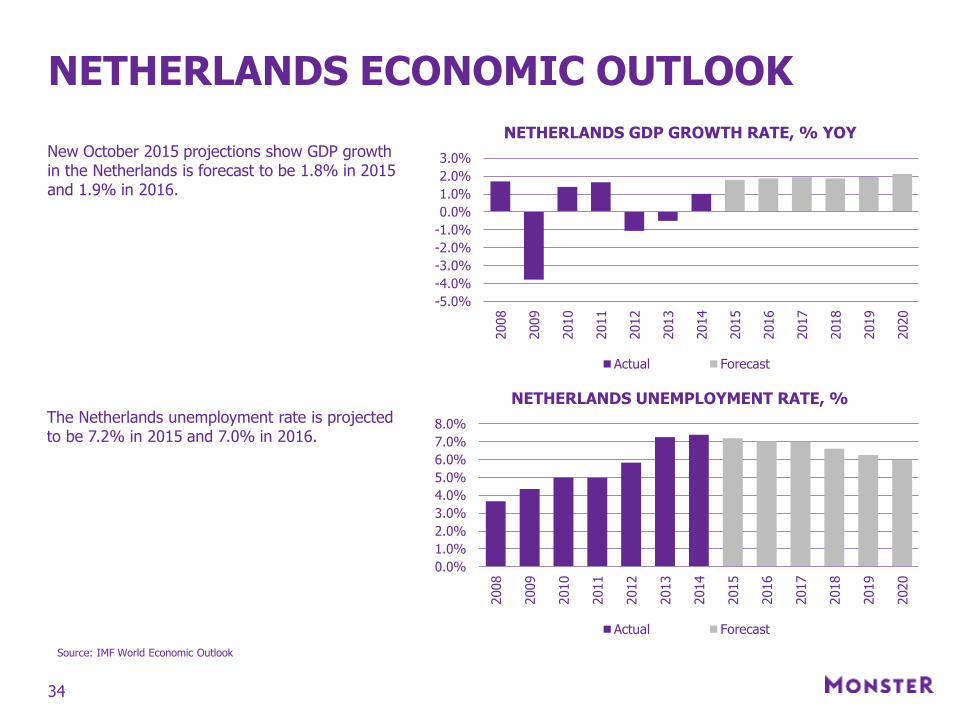
New October 2015 projections show GDP growth in the Netherlands is forecast to be 1.8% in 2015 and 1.9% in 2016.
The Netherlands unemployment rate is projected to be 7.2% in 2015 and 7.0% in 2016.
-5.0%
-4.0%
-3.0%
-2.0%
-1.0%
0.0%
1.0%
2.0%
3.0%
2008
2009
2010
2011
2012
2013
2014
2015
2016
2017
2018
2019
2020
NETHERLANDS GDP GROWTH RATE, % YOY
Actual Forecast
0.0%
1.0%
2.0%
3.0%
4.0%
5.0%
6.0%
7.0%
8.0%
2008
2009
2010
2011
2012
2013
2014
2015
2016
2017
2018
2019
2020
NETHERLANDS UNEMPLOYMENT RATE, %
Actual Forecast
Source: IMF World Economic Outlook