laboratory investigation of multiphase …
TRANSCRIPT
The Pennsylvania State University
The Graduate School
Department of Energy and Mineral Engineering
LABORATORY INVESTIGATION OF MULTIPHASE PERMEABILITY EVOLUTION
DUE TO FRACTURING FLUID FILTRATE IN TIGHT GAS SANDSTONES
A Dissertation in
Energy and Mineral Engineering
by
Kelvin Nder Abaa
2016 Kelvin Nder Abaa
Submitted in Partial Fulfillment
of the Requirements
for the Degree of
Doctor of Philosophy
May 2016
The dissertation of Kelvin Nder Abaa was reviewed and approved* by the following:
John Yilin Wang
Assistant Professor of Petroleum and Natural Gas Engineering
Dissertation Co-Advisor
Co-Chair of Committee
M.Thaddeus Ityokumbul
Associate Professor of Mineral Processing and Geo-Environmental Engineering
Dissertation Co-Advisor
Co-Chair of Committee
Derek Elsworth
Professor of Energy and Geo-Environmental Engineering
Kwadwo Osseo-Asare
Professor of Metallurgy and Energy and Geo Environmental Engineering
Department of Materials Sciences and Engineering
Luis Ayala H.
Professor of Petroleum and Natural Gas Engineering
Associate Department Head of Graduate Education
*Signatures are on file in the Graduate School

iii
ABSTRACT
Injection of large volumes of fluids during fracture treatment may result in leak-off,
capillary imbibition and trapping of the fracturing fluid filtrate in the pores of the reservoir. The
trapped fluid affects the mobility of hydrocarbons during clean-up and production. Additionally,
the fracturing fluid filtrate near wellbore and fracture region is one of variable composition and
can induce alterations in rock-fluid and fluid-fluid interactions. The concomitant changes in
multiphase permeability during fluid invasion and clean-up is one that is not fully understood.
The aim of this study is to investigate the role fracturing fluid filtrate composition has on
the evolution of multiphase permeability during imbibition and drainage of the aqueous phase. In
this work, multiphase flow of fracturing fluid filtrate in low permeability sandstones was
investigated by means of laboratory experiments for three commonly employed fracturing fluids.
The multiphase flow experiments were conducted using brine, helium and filtrate from various
fracturing fluids in sandstones cores of different permeabilities. The alteration of rock-fluid
properties and changes in interfacial tension in the presence of gas were determined by evaluation
of the obtained relative permeability curves to both gas and liquid/filtrate phase. Experimental
results indicate that there was a reduction in end-point and liquid phase relative permeability
following imbibition of slickwater into the core sample. The liquid phase relative permeability
decreases with increasing concentration of friction reducer (Polyacrylamide solution) present in
the fluid system. Adsorption flow experiments with slickwater confirm the adsorption of
polyacrylamide molecules to the pore walls of the rock sample and results in increased wettability
of the rock sample. This process was found to increase liquid trapping potential of the rock
surface. For linear and crosslinked gels, filtrate composition does not have a significant effect on
liquid relative permeability during fluid invasion due to limited polymer invasion into the core.
iv
This study also investigated the effect of alcohol and surfactant used as remediation
additives on multiphase permeability evolution with different fracturing fluid systems.
Multiphase permeability flow tests were conducted to determine, understand and quantify the
mechanisms that govern multiphase permeability evolution using alcohols and surfactants to
remediate aqueous phase trapping. Methanol and two surfactant chemicals, Novec FC-4430 and
Triton X-100 were used as remediation additives in this study.
Results from multiphase permeability flow tests conducted with methanol indicated that
the volume of liquid removed by displacement increases with methanol concentrations for all
fracturing fluids. This is attributed to increased liquid mobility from addition of methanol during
the displacement process. Interfacial tension does not contribute to multiphase permeability
during the displacement phase. Additionally, friction reducer alters the flow properties of the
trapped liquid as indicated by increased surface tension, lower volumes of liquid removed and
lower gas endpoint permeability at the same methanol concentration for cores saturated with
slickwater. Majority of the improvement in gas permeability from methanol addition is by
evaporation of the trapped liquid phase and is caused by increased volatility of the fracturing
fluid. Results from multiphase permeability flow tests conducted with surfactant indicated that
multiphase permeability evolution is driven by wettability alteration of the rock surface.
Pretreatment of core sample with Novec FC-4430 before flooding with fracturing fluid results in
best gas permeability improvement and liquid recovery. Triton X-100 did not improve gas
permeability or liquid recovery during cleanup. Findings from this study can be used to optimize
fracturing fluid and additive selection for field applications. Multiphase permeability data
obtained is also useful for model assisted analysis of post fractured production performance in
low permeability reservoirs.

v
TABLE OF CONTENTS
LIST OF FIGURES ................................................................................................................. …viii
LIST OF TABLES ................................................................................................................... ….xii
NOMENCLATURE ................................................................................................................ ….xv
ACKNOWLEDGEMENTS ..................................................................................................... ...xvii
Chapter 1 Introduction ............................................................................................................ …...1
Chapter 2 Literature Review ................................................................................................... …...5
2.1 Petrophysical Attributes of Tight Gas Sandstones ....................................................... …...6
2.2 Porosity,Permeability and Overburden Stress ............................................................. …...8 2.3 Relative Permeability and Cappilary Pressure .............................................................. …...9 2.4 Stimulation and Fracturing Fluid Selection ................................................................. ….13 2.5 Laboratory and Field assesment of Formation Damage ............................................... ….18 2.6 Numerical Simulation of Aqeous Phase Damage ......................................................... ….21
Chapter 3 Problem Statement ................................................................................................. ….24
Part I Multiphase Permeability Evolution for Fracturing Fluid Systems .............................. …..26
Chapter 4 Experimental Methodology ................................................................................... …..26
4.1 Samples…..………………………………………………………………………...26
4.2 Petrographic Analysis……..……………………………………………………….27
4.3 Test Fluids…………………..……………………………………………………...28
4.1 Petrophysical Properties and Measurement Techniques……………………….......30
4.4.1 Porosity………………………………………………………………..…….30
4.4.2 Permeability, ………………………………………………………………....30
4.4.3 Pulse Decay Permeametry-Apparatus, Procedure and Analysis…………......32
4.5 Multiphase Permeability Experiments with Fracturing Fluids.………………….....36
4.6 Leak-off/Filtration Test…………………………………………………………......38
4.7 Adsorption Flow Experiments………...………………………………………… ...38
4.8 Spontaneous Imbibition and Contact Angle Experiments……………………… ....40
vi
Chapter 5 Experimental Results ............................................................................... ..…43
5.1 Petrophysical properties of samples……………….…..………...…….…………… 43
5.2 Petrographic Analysis of Tight Gas Sandstone Samples…………….………..……..44
5.3 Analysis of Flow Experiments with Slickwater…..………………...…………….… 49
5.3.1 Analysis of Leak-off Test ………………...……………………………………49
5.3.2 Analysis of Two-phase Flow Relative Permeability ………………….….........50
5.3.3 Analysis of Adsorption Flow Experiments…………...……..………………….56
5.3.4 Analysis of Imbibition and Contact Angle Experiments...……….…………….59
5.4 Analysis off Flow Experiments: Effect of Linear Gel…..…...……...…………….… 62
5.4.1 Results of Leak-off Test ………………...……………………………………..62
5.4.2 Results of Two-phase Flow Relative Permeability ………………….…........…65
5.5 Analysis of Flow Experiments: Effect of Crosslinked Gel…..……...…………….… 68
5.5.1 Analysis of Leak-off Test ………………...……………………………………68
5.5.2 Analysis of Two-phase Flow Relative Permeability ………………….…... …70
Part II Multiphase Permeability with Remediation Additives .............................................. …..74
Chapter 6 Multiphase Permeability Evolution with Methanol Based Treatment Solutions ……74
6.0 Abstract…..……………………..………………………………... ………..………..74
6.1 Introduction……………………..………………………………... ………..………..75
6.2 Experimental Methodology…….…..…………...………………………………...… 77
6.2.1 Porous Media ………………...………………………………………………...77
6.2.2 Test Fluid Systems …………..………………...……………………………….77
6.2.3 Surface Tension Measurement Procedure...……… ………………….…... ….80
6.2.4 Multiphase Permeability Flow Test…...……………...……..………………….81
6.2.5 Core Flood Apparatus…...……………...……..………………………………..82
6.2.6 Core Flood Procedure…………….…...……………...……..………………….83
6.3 Results and Discussions…….…..…………...………………………………...………84
6.3.1 Surface Tension Measurements .…...………………………………………...84
6.3.2 Multiphase Permeability Evolution……...……………………………………..84
6.3.3 Effect of Methanol on Slickwater…...……… ………………….…... ………..86
6.3.4 Effect of Methanol on Linear and Crosslinked Gels…..……………………….89
6.4 Conclusions…………..…….…..…………...………………………………...………94
Chapter 7 Impact of Surfactant on Multiphase Permeability Evolution with Fracturing Fluids in
Low Permeability Sandstones ………………………………………………………96
7.0 Abstract…..……………………..………………………………... ………..………..96
7.1 Introduction……………………..………………………………... ………..………..97
7.2 Experimental Methodology…….…..…………...………………………………...… 99
7.2.1 Porous Media.………………...…………………………..…………………...100
7.2.2 Surfactant Chemicals …………..………………...…………………..……….100
7.2.3 Surfactant Treatment Solutions…………....……… ………………...…... ….101
7.2.4 Fracturing Fluid Test Mixtures………..……………...……..………………...101
7.2.5 Surface Tension Measurement Procedure….…………………………..……..104

vii
7.2.6 Multiphase Permeability Flow Tests.……………...……..…………..……….105
7.2.7 Core Flood Procedures…………….…...……………...……..……………….105
7.2.7 Spontaneous Imbibition Experiments….…...…..……...……..……………..…107
7.3 Results and Discussions…….…..…………...………………………………...……..107
7.3.1 Surface Tension Measurements.…...……………………………………...…..107
7.3.2 Multiphase Permeability Evolution……...……………………………………108
7.3.3 Effect of Surfactant on Slickwater…...……… ………………….…........……109
7.3.4 Effect of Surfactant on Linear and Crosslinked Gels…..……...…………...…112
7.3.5 Analysis of Spontaneous Imbibition Experiments…………………….…...…118
7.4 Conclusions…………..…….…..…………...………………………………...………120
Chapter 8 Conclusions and Future Work ................................................................................ ….122
REFERENCES………………………………………………………………………………….128
Appendix A Results of Multiphase Permeability Evolution with Fracturing Fluids .............. …133
Appendix B Results of Multiphase Permeability Evolution with Methanol Additive ............ …151
Appendix C Results of Multiphase Permeability Evolution with Surfactant Additive ........... …161
viii
LIST OF FIGURES
Figure 2-1: Three main types of pore geometry in tight gas sandstones ................................. 7
Figure 2-2:Cappilary pressure and relative permeability relationships in traditional and
Low permeability Reservoir Rocks......................................................................................... 11
Figure 2-3: Core data from Lewis sandstone taken from two different samples selected
Similar porosity and permeability (Kg) showing highly variable relative permeability at
same free-water level. .............................................................................................................. 13
Figure 2-4: Flowchart of Fracturing Fluid Selection. .............................................................. 15
Figure 2-5: Conditions for Aqueous Phase Trapping ............................................................. 18
Figure 4-1: Schematic of pulse test transient system ............................................................... 33
Figure 4-2: High Pressure High Temperature Filter Press ....................................................... 39
Figure 4-3: Core Holder Arrangement for Adsorption Flow Tests .......................................... 40
Figure 4-4: Set-up for Spontaneous Imbibition Experiments .................................................. 42
Figure 5-1: Sample A1 showing intergranular porosity and authigenic cementation. ............ 45
Figure 5-2: Sample A1 Grain supported pore structure with authigenic cements. .................. 45
Figure 5-3: Sample A1 Pore walls and throats lined with authigenic clays. ........................... 46
Figure 5-4: Sample B1 showing fine grain sandstone with extensive cementation………….47
Figure 5-5: Sample B2 showing interconnecting slot pores in highly cemented rock
fabric ...................................................................................................................... 47
Figure 5-6: Sample B2 showing solution pores formed by mineral dissolution. ..................... 48
Figure 5-7: Sample B2 showing slot pores that connect to solution pores ............................. 48
Figure 5-8: Filtration curves for slickwater (Fluid 1) through Sample A1. ............................. 49
Figure 5-9: Filtration curves for slickwater (Fluid 1) through Sample B1 ............................. 50
ix
Figure 5-10: Liquid Relative Permeability for 1st Imbibition with Slickwater with Sample
A2…………………..……………………………………………………….……51
Figure 5-11: Liquid Relative Permeability for 1st Imbibition with Slickwater with Sample
B2…………………..……………………………………………………….……52
Figure 5-12: Relative Permeability to Brine (after flooding with Slickwater) Sample A2 ...... ..53
Figure 5-13: Relative Permeability to Brine (after flooding with Slickwater) Sample B2 ...... ..54
Figure 5-14: Gas Relative Permeability with Slickwater for Sample A2. .............................. ..55
Figure 5-14: Gas Relative Permeability with Slickwater for Sample B2 ............................. ..56
Figure 5-16: Brekthrough curves for succesive injections of Fluid 1 through Sample A3 ..... ..57
Figure 5-17: Breakthrough curves for succesive injections of Fluid 2 through Sample B3 ... ..57
Figure 5-18: Schematic of permeability reduction caused by adsorption. .............................. ..58
Figure 5-19: Brine Imbibition for core sample A4 ( k∞ = 0.1854 md) ................................... ..60
Figure 5-20: Brine Imbibition curves for core sample B4 ( k∞ = 0.0005md) .......................... ..60
Figure 5-21: Contact angles for core Sample 1 (Top) and Sample 3 (bottom) ....................... ..61
Figure 5-22: Filtration volumes for for Sample A1 with linear gel. ....................................... ..62
Figure 5-23: Filtration volumes for for Sample B1 with linear gel (20lbm/1000 gal ). .......... ..64
Figure 5-24: Filtration volumes for for Sample B2 with linear gel (40lbm/1000 gal ). .......... ..64
Figure 5-25: Liquid Relative Permeability with Linear Gel for Sample A1 .......................... ..65
Figure 5-26: Liquid Relative Permeability with Linear Gel for Sample B1 .......................... ..66
Figure 5-27: Gas Relative Permeability with Linear Gel for Sample A1 ............................... ..67
Figure 5-28: Gas Relative Permeability with Linear Gel for Sample B1 ............................... ..67
Figure 5-29: Filtration volumes for for sample A1 with linear gel ......................................... ..68
Figure 5-30: Filtration volumes for for sample B1 with linear gel ......................................... ..69

x
Figure 5-31: Filtration volumes for for samples A1 and B1 with 40 lb/1000 gal borate
crosslinked gel …………………………………………………………….....70
Figure 5-32: Liquid relative permeability with linear gel for sample A1 ............................... ...71
Figure 5-33: Liquid relative permeability with linear gel for sample B1 ……..……………..72
Figure 5-34: Gas relative permeability with linear gel for sample A1 ................................... ...73
Figure 5-35: Gas relative permeability with linear gel for sample A1 ……..……………..73
Figure 6-1: Schematic of coreflood apparatus…………………………………..……………...83
Figure 6-2: Surface tension of fluid filtrate as a function of methanol concentration ………...85
Figure 6-3: Normalized gas flowrate as function of pore volumes of gas for slickwater saturated
core…………………………………………………….…..…………………..…...86
Figure 6-4: Displaced liquid as function of pore volumes of gas for slickwater saturated
core………..………………………………………………………………………..88
Figure 6-5: Relative permeability to gas as function of pore volumes of gas for slickwater
saturated core………………………………………………………………………..88
Figure 6-6: Normalized gas flowrate as function of pore volumes of gas for linear gel
saturated core………………………………………………………………………..89
Figure 6-7: Normalized gas flowrate as function of pore volumes of gas for crosslinked gel
saturated core………………………………………………………………………..90
Figure 6-8: Displaced liquid as function of pore volumes of gas for linear gel saturated gel
saturated core………………………………………………………………………..91
Figure 6-9: Displaced liquid as function of pore volumes of gas for crosslinked gel saturated gel
saturated core………………………………………………………………………..92
Figure 6-10: Relative permeability to gas as a function of gas saturation for linear gel
saturated core………………………………………………………………………..93
Figure 6-11: Relative permeability to gas as a function of gas saturation for crosslinked gel
saturated core………………………………………………………………………..94
Figure 7-1: Chemical structure of Triton X-100 and structure of Novec FC-4430 ……...….....100
Figure 7-2: Surface tension of fluid brine as a function of surfactant concentration………......108

xi
Figure 7-3: Normalized gas flowrate as function of pore volumes of gas for slickwater
treated with surfactant.………………………………………………………..…..110
Figure 7-4: Displaced liquid as function of pore volumes of gas for slickwater treated with
surfactant…………………………………………………….………………..……111
Figure 7-5: Gas relative permeability as a function of gas saturation for slickwater treated with
various surfactants…………………………….…………….………………..…….112
Figure 7-6: Normalized gas flowrate as function of pore volumes of gas for linear gel treated
treated with various surfactant.………….……………………………………..…..113
Figure 7-7: Normalized gas flowrate as function of pore volumes of gas for crosslinked gel
treated with surfactant………..………….……………………………………..…..114
Figure 7-8: Displaced liquid as function of pore volumes of gas for linear gel treated with
surfactant…………………………………………………….………………..……115
Figure 7-9: Displaced liquid as function of pore volumes of gas for crosslinked gel treated with
surfactant…………………………………………………….………………..……115
Figure 7-10: Gas relative permeability as a function of gas saturation for linear gel filtrate
treated with surfactants……..……………….…………….………………..…….116
Figure 7-11: Gas relative permeability as a function of gas saturation for crosslinked gel filtrate
treated with surfactants……..……………….…………….………………..…….117
Figure 7-12: Imbibition curves for core before and after treatment with Novec FC-4430…......118
Figure 7-13: Imbibition curves for core before and after treatment with Triton X-100……......119

xii
LIST OF TABLES
Table 4-1: Physical characteristics of samples used in this study ............................................ ….27
Table 4-2: Slickwater fluid systems used in this study ........................................................... .....29
Table 4-3: Linear Gels (hydropropylguar) fluid systems used in this study. ........................... ..…29
Table 4-4: Borate Crosslinked Gels (hydropropylguar) fluid systems used in this study……......30
Table 5-1: Petrophysical properties of samples used in this study. ........................................ ….43
Table 6-1: Slickwater fluid systems with Methanol. .............................................................. ….78
Table 6-2: Linear Gel fluid systems with Methanol. .............................................................. ….79
Table 6-3: Crosslinked gel fluid systems with Methanol........................................................ ….80
Table 7-1: Composition of Novec FC4430 surfactant solution .............................................. …101
Table 7-2: Slickwater fluid systems tested with surfactants ................................................... …102
Table 7-3: Linear gel fluid systems tested with surfactants .................................................... …103
Table 7-3: Crosslinked gel fluid systems tested with surfactants ........................................... …104
Table A1-1: Relative Permeability to Gas Phase for Sample A2. ........................................... ....136
Table A1-2: Relative Permeability to Liquid Phase for Sample A2…..………………………...137
Table A1-3: Relative Permeability to Gas Phase for Sample B2.…..…………………………..138
Table A1-4: Relative Permeability to Liquid Phase for Sample B2.…..………………………..138
Table A2-1: Filtration Volume versus Time for Slickwater……..………….……………….....140
Table A2-2: Relative Permeability to Gas Sample A2……………………….…………..….....141
Table A2-3: Effective Permeability to Brine (Drainage) for Sample A2….………………...….141
Table A2-4: Gas Relative Permeability for Sample B2…………………………………….......142
Table A2-5: Effective Permeability to Brine (Drainage) Sample B2….…..……………………142
Table A2-6: Amount Adsorbed as Function of Polyacrylamide Solution Concentration..……..143
Table A2-7: Mass of Sample A4 before and after flooding………….…..………………….......144

xiii
Table A2-8: Mass of Sample B4 before and after flooding………….…..……………...…........144
Table A3-1: Filtration Volume versus Time for Sample A1 ……………………..……..…..…145
Table A3-2: Filtration Volume versus Time for Sample B1 ……………………………..……146
Table A3-3: Relative Permeability to Gas for Sample A1………………..……………..….......147
Table A3-4: Relative Permeability to Brine for Sample A1……………………………….…...148
Table A3-5: Relative Permeability to Gas for Sample B1…………….…..………………….....148
Table A3-6: Relative Permeability to Brine for Sample B1…………………..………………...149
Table A4-1: Filtration Volume vs Time for 20 lb/1000gal borate crosslinked gel ……...……...150
Table A4-2: Filtration Volume vs Time for 40 lb/1000gal borate crosslinked gel ……...……...151
Table A4-3: Relative permeability to brine for sample A1……………………………...……...152
Table A4-4: Relative permeability to gas for sample A1……...…………………………...…...152
Table A4-5: Relative permeability to brine for sample B1……………………….……...……...153
Table A4-6: Relative permeability to gas for sample B1 ……...……..........................................153
Table B1-1: Surface tension as a function of methanol concentration………………………….155
Table B2.1: Pore volumes of gas injected vs outlet gas flowrate ………………………….…..156
Table B2.2: Pore volumes of gas injected vs pore volumes of liquid expelled………………...157
Table B2.3: Gas saturation vs gas relative permeability………………………………………..158
Table B2.4: Gas flowrate vs pore volumes of injected gas for 2.5% methanol concentration…159
Table B2.5: Gas flowrate vs pore volumes of injected gas for 5% methanol concentration…...160
Table B2.6: Gas flowrate vs pore volumes of injected gas for 10% methanol concentration.....161
Table B2.7: Pore volumes injected gas vs pore volumes of expelled liquid…………………...162
Table B2.8: Gas saturation vs gas relative permeability………………………………………..163
Table C1-1: Surface tension as a function of surfactant concentration…………………………165
Table C2.1: Gas flowrate vs pore volumes of injected gas…………………………………….166
Table C2.2: Pore volumes injected gas vs pore volumes of expelled liquid…………………...167

xiv
Table C2.3: Gas saturation vs gas relative permeability………………………………………..168
Table C2.4: Gas saturation vs gas relative permeability for core pretreated with
Novec FC-4430…………………………………………………………………...169
Table C2.5: Gas flowrate vs pore volumes of injected gas……………………………………..170
Table C2.6: Pore volumes injected gas vs pore volumes of expelled liquid…………………...171
Table C2.7: Gas saturation vs gas relative permeability for linear gel treated
with Novec FC-4430……………………………………………………………….172
Table C2.8: Gas saturation vs gas relative permeability for linear gel treated with
Triton X-100………………………………………………………………………173
Table C2.9: Gas saturation vs gas relative permeability for core pretreated with
Novec FC-4430……………………………………………………………………174
.

xv
NOMENCLATURE
cc cubic centimeter
cm centimeter
cp centipoise
ft feet
F Fahrenheit
FR Friction Reducer
g grams
gal gallon
gptg gallon per thousand gallon
in inches
krg relative permeability to gas
krw relative permeability to water
Kg Effective permeability to gas
Kabs Absolute permeability
lb pound
L Liter
m meter
mm millimeter
mol Moles
mD milliDarcy
MeOH Methanol
MMSCFD million cubic feet
MPa MegaPascals
xvi
psi pounds per square inch
psia pounds per square inch atmosphere
pptg pounds per thousand gallons
ppm parts per million
PV Pores Volumes
q flowrate
Sw Water Saturation
Sg Gas Saturation
SW Slickwater
Tcf Trillion cubic feet
vol volume
ø porosity
% percent

xvii
ACKNOWLEDGEMENTS
I would like to express my gratitude to my academic advisors Drs. John Wang and Mku
Ityokumbul for their invaluable guidance and support throughout this process. I especially want to
thank Dr. Derek Elsworth for his advice and support in my experimental setup and for providing
access to the Rock Mechanics Laboratory to perform the experiments. I would also like to thank
Drs. Demian Saffer and Kwadwo Osseo-Asare for their interest and time in serving as a
committee members.
I am extremely grateful to Drs. Luis Ayala and Turgay Ertekin for their support and
guidance throughout my PhD studies. I also like to acknowledge Steve Swavely and Ozgur
Yilidrim for their help with the experimental setup and the experiments. Their guidance and help
was instrumental to the successful completion of this research study.
Finally, I am very grateful to my father, Solomon Abaa, my mother, Grace Abaa and my
siblings for their constant support and love throughout my PhD studies.

Chapter 1
Introduction
Natural gas from tight gas sandstones produce about 6 Tcf of gas per year in the United
States and contribute to about 25% of total gas produced (Holditch ,2006). Estimates from the
Energy Information Administration (EIA) put the recoverable amount of gas from tight gas sands
in the US at about 309 Tcf. These tight gas sands are characterized by low permeabilities, low to
moderate porosities and cannot be recovered at economic production rates with conventional
production strategies.
Successful exploitation of this gas resource requires massive reservoir contact areas in
order to achieve economic production rates. This is accomplished with the use of hydraulic
fracture stimulation and horizontal well configurations which increase gas productivity.
Hydraulic fracture stimulation is a process that involves pumping huge volumes of water,
chemicals and proppant at a rate and corresponding pressure that is greater than that needed for
breakdown of the formation to create conductive pathways for gas to flow from the reservoir to
the wellbore.
A key part of hydraulic fracture design is in the selection of the appropriate fracturing
fluid. Fracturing fluids serve to create the fluid pressure necessary to open and propagate the
hydraulic fracture and create the required fracture geometry and transport the proppant deep into
the created fracture. A wide range of fluid systems are currently employed as fracturing fluids.
The range of conventional fracturing fluids include water-based and polymer containing fluids
(both linear and cross-linked gels); hydrocarbon-based fluids and energized fluids and foams.
Unconventional/ novel fluid systems include viscoelastic surfactants fluids; viscoelastic
2
surfactant foams; liquid CO2 based fluids; aqueous methanol based fluids and gelled liquefied
petroleum based fluids.
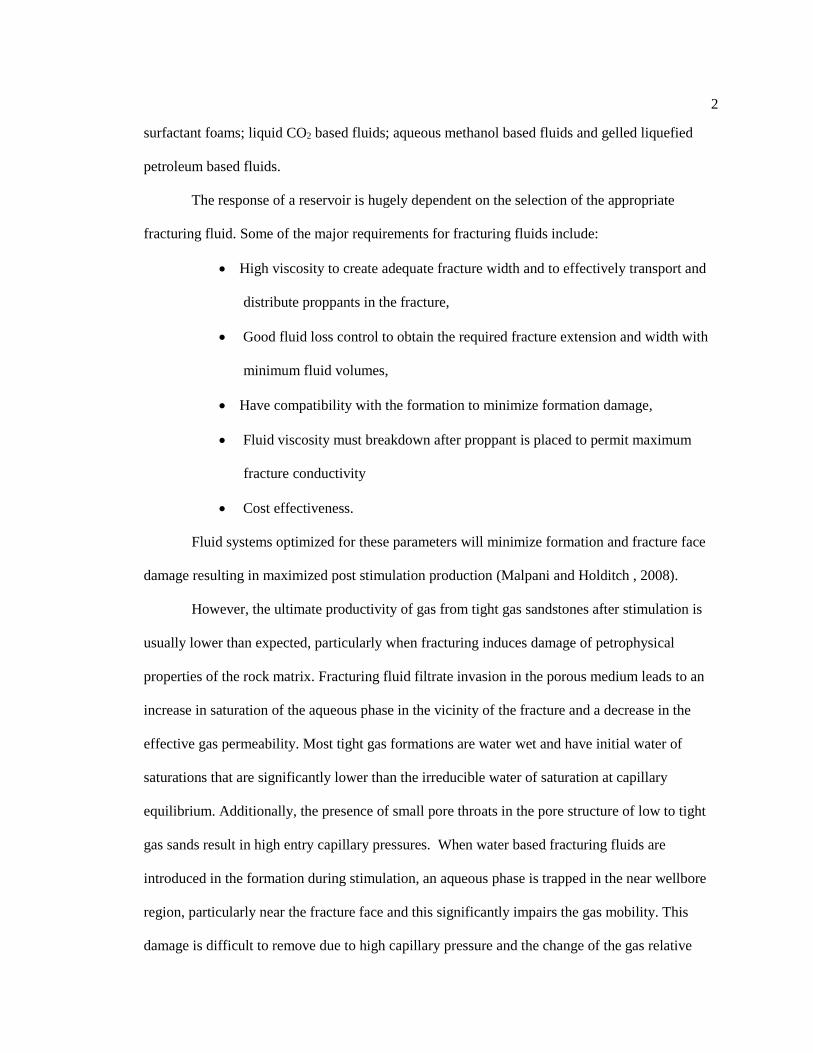
The response of a reservoir is hugely dependent on the selection of the appropriate
fracturing fluid. Some of the major requirements for fracturing fluids include:
High viscosity to create adequate fracture width and to effectively transport and
distribute proppants in the fracture,
Good fluid loss control to obtain the required fracture extension and width with
minimum fluid volumes,
Have compatibility with the formation to minimize formation damage,
Fluid viscosity must breakdown after proppant is placed to permit maximum
fracture conductivity
Cost effectiveness.
Fluid systems optimized for these parameters will minimize formation and fracture face
damage resulting in maximized post stimulation production (Malpani and Holditch , 2008).
However, the ultimate productivity of gas from tight gas sandstones after stimulation is
usually lower than expected, particularly when fracturing induces damage of petrophysical
properties of the rock matrix. Fracturing fluid filtrate invasion in the porous medium leads to an
increase in saturation of the aqueous phase in the vicinity of the fracture and a decrease in the
effective gas permeability. Most tight gas formations are water wet and have initial water of
saturations that are significantly lower than the irreducible water of saturation at capillary
equilibrium. Additionally, the presence of small pore throats in the pore structure of low to tight
gas sands result in high entry capillary pressures. When water based fracturing fluids are
introduced in the formation during stimulation, an aqueous phase is trapped in the near wellbore
region, particularly near the fracture face and this significantly impairs the gas mobility. This
damage is difficult to remove due to high capillary pressure and the change of the gas relative

3
permeability in the invaded zone. Unfortunately, majority of the fracturing fluids currently
employed in the industry are water-based and polymer containing fluids. These fluids are used
because they are cost effective and easy to formulate. However, because of the presence of an
aqueous phase, there is a huge potential for aqueous phase trapping and subsequent reduced gas
productivity after stimulation. As such, the benefit of a cost effective treatment is lost.
Investigations of relative permeability in low permeability reservoirs have shown that gas
permeability decreases sharply at water saturations above 40-50% and there exists a range of
water saturations above which both gas and water are virtually immobile. Therefore in low
permeability reservoirs the critical and irreducible water of saturation occur at very different
water saturations resulting in a ‘permeability jail’ coined to describe the saturation region where
there is negligible effective permeability to either water or gas. The relative permeability
relationships also suggest that the steepness of the relative permeability curve is such that small
changes in brine saturation or introduction of liquid phase with dissimilar fluid properties can
result in significant changes in relative permeability.
Previous experimental work on tight gas sandstone focused on relative permeability
measurements with the aqueous phase as brine. However, simplifying the fracturing fluid filtrate
as a reservoir fluid phase may be wrong since the properties can vary greatly with time,
temperature changes and fluid composition as a result of additives that constitute the make-up of
each fracturing fluid employed. Therefore a more realistic hypothesis to understanding and
modelling phase damage in low permeability sandstones requires solution of three-phase flow
(with one phase being a fracture fluid) with time dependent relative permeabilities, capillary
pressure and viscosity. Thus a key purpose of this work is to derive a set of petrophysical
parameters that adequately captures multiphase flow by measurements of gas relative
permeability with fracturing fluid filtrate as the wetting phase.

4
The importance and benefits of rigorous analyses of fluid flow and multiphase
permeability changes in the vicinity of the fracture in a fractured low permeability reservoir with
the aim of improving post fracture performance have long been recognized. Furthermore,
production performance from tight gas wells using conventional simulation models fall way
below predictions. Some of the inadequacies of these tools and their applicability in tight gas
reservoirs are attributed to improper representation and coupling of multiphase permeability
evolution in the vicinity of the fracture from leakoff of fracture fluid filtrate during stimulation.
Therefore, an appropriate simulation tool that effectively captures the physics of multiphase flow
damage caused by fracturing fluid damage unique to each fluid system backed up with actual
experimental data is necessary for accurate modeling and prediction of fractured tight gas
production and improved cleanup analyses.
In this work, the role of fracturing fluid filtrate leakoff on evolution of multiphase gas
permeability in low permeability sandstones will be investigated experimentally using commonly
employed fracturing fluids. Additionally, the relevant petrophysical data obtained from the
experimental analysis will be coupled with the goal of building a numerical simulator that
effectively models the multiphase permeability changes in the vicinity of the fracture face during
stimulation injection and gas flowback. The goal of this work is to increase the quality of post
fracture performance prediction in tight gas reservoirs by accounting for complex multiphase
phenomena unique to each fracture fluid/reservoir interaction.

Chapter 2
LITERATURE REVIEW
Tight gas is a generic term for reservoirs with an average permeability of less than 0.1mD
that produce dry natural gas. Holditch (2006) defined tight gas as reservoirs that cannot produce
gas at economic flowrates or give recovery at economic volumes without stimulation with
hydraulic fracture treatment and/or completion with horizontal wells. This means that the term
“tight gas” applies to all types of formations that fit the aforementioned definition including
sandstone, carbonate, and coalbed methane and shale gas reservoirs. In this work, we will focus
on tight or low permeability sandstones based in the United States.
In this chapter, we carry out a review of previous work done to characterize tight gas
sandstones, investigate the factors controlling gas production and the numerical modeling and
prediction of post-fractured performance in tight gas sandstones. All relevant research in the
literature fall into three categories; laboratory experiments, mathematical modeling and field
studies. The outline for this chapter is as follows:
Petrophysical attributes of tight gas reservoirs
Aqueous phase trapping mechanism
Fracturing fluids and stimulation of tight gas reservoirs
Interaction of fracturing fluids with tight gas matrix
Modeling and simulation of post fractured performance in tight gas sandstones.

6
2.1 Petrophysical Attributes of Tight Gas Sandstones
Previous work over the last 30 years, characterized tight gas sandstones as basin-centered
gas accumulations. Law (2000) defined basin centered gas accumulations as reservoirs with low
porosity and permeability lacking a down –dip water contact. He suggests that since water
production from these accumulations are non-existent, vast portions of these accumulations are at
irreducible water of saturations and widely distributed through the reservoir bearing interval and
have no discrete gas –water contact. This description led most industry experts to rule out the
phenomenon of gas buoyancy observed in traditional reservoirs as non-existent in basin- centered
gas accumulations and as such suggested that they should be treated as a unique reservoir system.
Low-permeability sandstones in the United States have unique petrophysical attributes
which make them distinct from other tight reservoir rocks. Dutton et al. (1993, 1995) and Brynes
(1997) claimed that low permeability sandstones consist of clean sandstone deposits in high
energy depositional areas. These clean sandstones consist of intergranular pores that have been
filled and mineralized by diagenetic processes. Soeder and Randolph (1987) and Dutton et al.,
(1995) proposed that low permeability sandstones can be grouped into three major types. The first
sandstone type consists of open intergranular pores with their pore throats plugged by authigenic
clays. Rocks of this type are commonly thought to have permeability between 10 to 100 µDarcy.
The second sandstone type consists of primary pores plugged with authigenic mineral i.e. clay
and calcite and their pore throats reduced to narrow slots. These narrow slots connect the
secondary pores which are mostly created by dissolution. Pores spaces in these secondary pores
are thought to hold most of the pore volumes while the narrow pore slots contribute to most of the
flowpaths and permeability. Rocks of this type are commonly thought to have permeability
between 1 to 10 µDarcy and dominate most of the low permeability reservoir systems. The third
low permeability sandstone type is comprised of muddy sandstones and have their intergranular
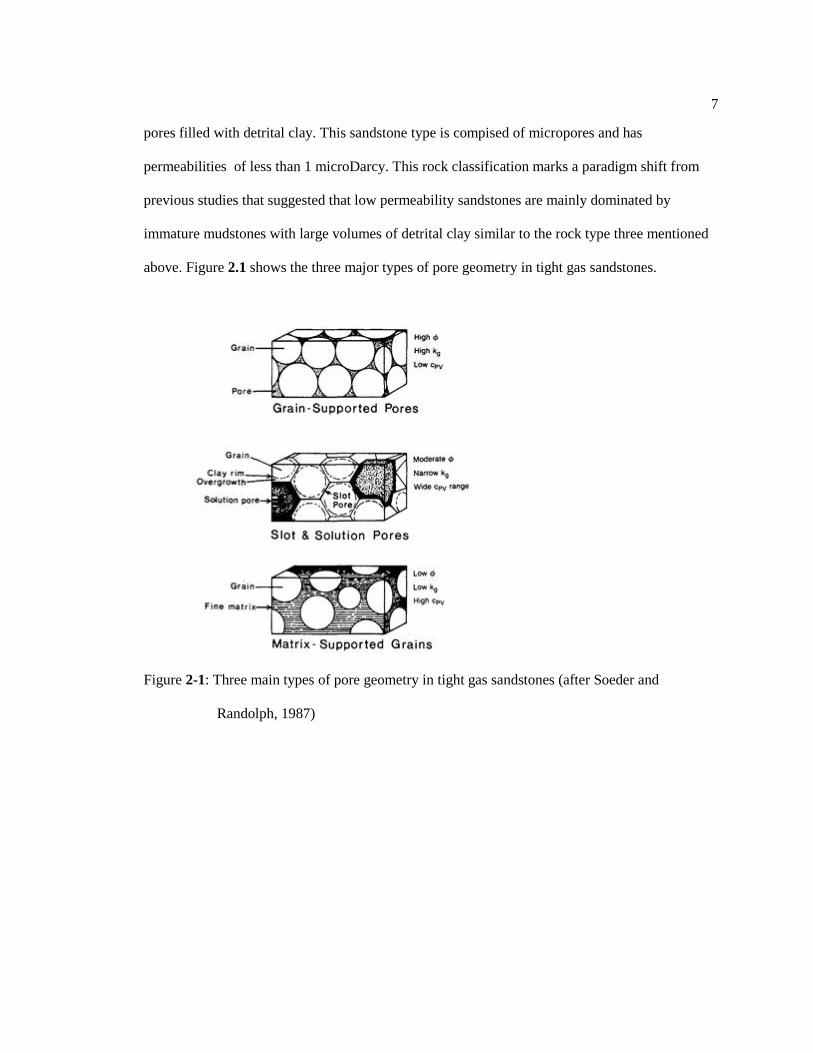
7
pores filled with detrital clay. This sandstone type is compised of micropores and has
permeabilities of less than 1 microDarcy. This rock classification marks a paradigm shift from
previous studies that suggested that low permeability sandstones are mainly dominated by
immature mudstones with large volumes of detrital clay similar to the rock type three mentioned
above. Figure 2.1 shows the three major types of pore geometry in tight gas sandstones.
Figure 2-1: Three main types of pore geometry in tight gas sandstones (after Soeder and
Randolph, 1987)

8
2.2 Porosity, Permeability and Overburden Stress
Increase in overburden stress in tight gas sands has very little effect on the porosity as
demonstrated by Brynes (1997). Laboratory studies on effect of change in stress on Helium
porosity conducted by Brynes showed a 5% difference in porosity values at in-situ conditions
compared with measurements at ambient conditions. These results suggest that low permeability
sandstones have a well cemented structure and the slot pores common in these formations
contribute little to overall porosity (Stanley et al., 2004).
Permeability on the other hand has been shown to experience considerable decrease with
increase in overburden stress in tight gas sandstones. Previous work by Brynes et al., (1979);
Jones and Owens., (1980); Dutton et al., (1993) showed that there is a drastic reduction in
permeability with increase in overburden stress which is more pronounced in reservoirs with a
gas permeability Kg (at ambient conditions) of 0.5 mD or less. In another study by Davies and
Davies (1999), permeability reduction with overburden stress was investigated for unconsolidated
high-permeability and low permeability sandstones. Results from the study indicated that in
unconsolidated formations, permeability reduction with increasing stress is more pronounced in
sands with highest initial porosity and permeability values. On the other hand, in low
permeability sandstones, sands dominated by slot pores show the greatest sensitivity to increase
in overburden stress. Brynes and Keghin (1997) noted that permeability could decrease by as
much as 50-70% with increasing overburden in low permeability sandstones. The observed
relationship between stress and permeability suggests an improved permeability values in over -
pressurized reservoirs compared to normally or sub-normally pressured ones. Jones and Owen
(1980) also investigated the response of permeability to increased confining stress and claimed
that the presence of thin, sheet-like tabular pores similar to the slot pore configuration mentioned
earlier is responsible for the observed permeability decrease with increased confining stress.

9
A vast majority of permeability data are obtained from routine core analysis with
permeability measurements at ambient conditions. Typical ambient conditions are at relatively
low pressures (0-300 psia), room temperatures and under single phase flow conditions i.e. 100%
gas saturation and 0% brine saturation. Permeability data obtained are referred to as gas
permeability (Kg) or absolute permeability (Kabs). Permeability measurements can also be
conducted at stressed conditions i.e. high overburden stress in the laboratory by means of core
holders. Shanley et al. (2004) noted that permeability measurements at in-situ stressed conditions
range from 10 to 10000 times less than routine gas permeabilities and are due to the combined
effects of confining stress, partial brine saturation and gas slippage effects. Gas slippage or
Klinkernberg effect accounts for the difference in permeability measurements at low pressures
such as at ambient conditions compared to high pressures at in-situ conditions. Klinkernberg
corrections are typically applied to permeability measurements to account for slippage.
Klinkerberg corrected permeability is typically referred to as equivalent liquid permeability.
2.3 Relative Permeability and Capillary Pressure
Fluid flow and reservoir performance is not governed by permeability measurements at
ambient conditions but by effective permeability at reservoir conditions. Partial brine saturation
in pore spaces at reservoir conditions imply that effective permeability to gas as a function of
brine saturation is the determining factor that governs fluid flow, therefore understanding relative
permeability behavior in tight gas sandstones is important.
Conventional reservoirs have critical water of saturation and irreducible water of
saturation at similar values of saturation, therefore a lack of produced water suggests that the
reservoir has approached connate or irreducible water of saturation. In low permeability
reservoirs, the critical water saturation and irreducible water of saturation occur at very different

10
values, this means that there is a wide range of saturations where both water and gas will not
flow, in fact in some very tight gas reservoirs there is almost no mobile water phase at high water
saturation values. Work done by numerous investigators including Thomas and Ward (1972);
Brynes et al., (1979); Jones and Owen, (1980), claimed that effective gas permeability decreases
rapidly at water saturations above 40-50%. Figure 2.2 shows relative permeability curves for both
conventional and low permeability reservoirs. It shows the positions of critical water saturation,
critical gas saturation and irreducible water of saturation; it also shows there is a drastic reduction
to gas permeability at about 40-50% water of saturation. If a relative permeability cutoff value of
2 % is used as operational fluid production criterion, then in low permeability reservoirs, there is
a wide range of saturation where there is less than 2% relative permeability to both gas and water
phase. Therefore, in low permeability reservoirs lack of water production indicates that water of
saturation is below critical water saturation and not at irreducible saturation. It implies that there
is a large water of saturation that is held up by capillary forces in the rock above its irreducible
saturation value. The term ‘permeability jail’ was first employed by Brynes (2003) in 1994 to
describe the region of saturation on the relative permeability curve where there is no flow to
either water or gas. This relative permeability in low permeability sandstones led Shanley et al.,
(2004) to propose that low permeability reservoirs should not be classified as Basin centered gas
accumulations with unique rock/fluid properties but rather as a rock system with complex,
effective permeability to gas relationships and should be evaluated using the same approach as
traditional reservoirs. Classifying low permeability rocks using the Basin gas accumulation
concepts lead to search of sweet spots in the reservoir but because these low perm rocks have
little to no effective gas permeability at high water of saturations, resource and reserve estimation
may be erroneous.

11
Figure 2-2: Capillary pressure and relative permeability relationships in traditional and
low-permeability reservoirs rocks (Shanley et al.,2004).
Capillary pressure behavior in tight gas sandstones is also different compared to conventional
reservoirs and is characterized by high to very high capillary pressures at moderate saturations of
12
the wetting phase. Shanley et al.(2004) claimed that wetting phase saturations of about 50% in
low permeability sands have capillary pressure well above 1000 psia, indicating that majority of
the pore throats in the rock structure have a diameter of less than 0.1 micron. Because of the
presence of a permeability jail in low permeability sands, irreducible water of saturation is not an
important factor governing multiphase flow. A more useful approach to understanding fluid flow
involves converting capillary pressure to gas column height above contact versus wetting phase
saturation to determine height required to achieve reasonable effective gas permeability. Previous
work done by various researchers including Brynes, (1997) and Cluff, (2002) reported gas
column heights ranging from 300 to over 1000 feet to achieve effective gas permeability or
irreducible water of saturation.
It has been established that understanding pore throat geometry and structure in low permeability
sandstones is key to characterizing multiphase fluid flow in the rock matrix. This observation led
to development of the rock catalog approach, a reservoir description strategy that combines
petrographic information from core analysis with capillary pressure measurements and
petrophysical data from wireline to characterize pore size distribution and pores structure. The
rock catalog approach also uses the classical bundle of capillary tube theory to relate pore
geometry to permeability and to gain useful information on flow capacity. Previous studies
conducted by Shanley et al. (2004) on low permeability sandstones using the rock catalog
approach reported substantial differences in effective gas permeability for rocks with the same
pore structure and capillary pressure values suggesting that additional factors have an effect on
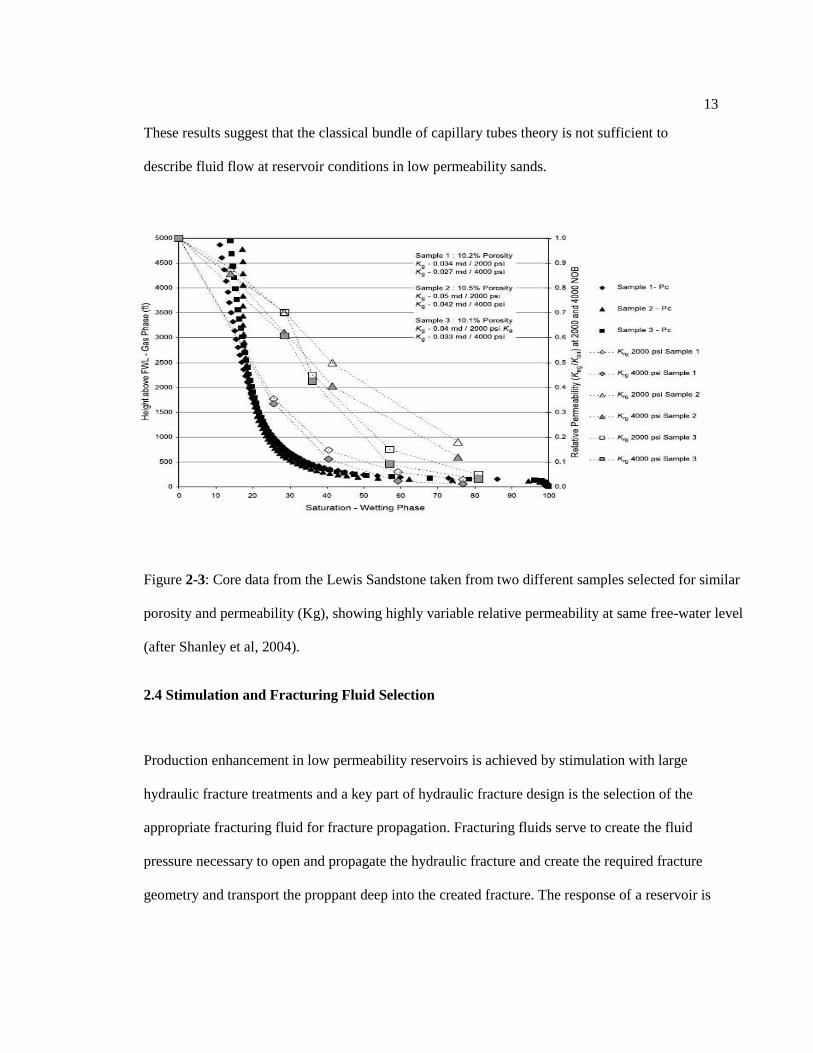
multiphase flow in these low permeability sandstones. Figure 2.3 show the reported data obtained
by Shanley et al. (2004) for effective gas permeability data for two separate cores taken from the
Lewis sandstone in the Greater Green River basin. This data shows significant variation in
effective gas permeability for rocks with the same pore geometry on the capillary pressure curve.
13
These results suggest that the classical bundle of capillary tubes theory is not sufficient to
describe fluid flow at reservoir conditions in low permeability sands.
2.4 Stimulation and Fracturing Fluid Selection
Production enhancement in low permeability reservoirs is achieved by stimulation with large
hydraulic fracture treatments and a key part of hydraulic fracture design is the selection of the
appropriate fracturing fluid for fracture propagation. Fracturing fluids serve to create the fluid
pressure necessary to open and propagate the hydraulic fracture and create the required fracture
geometry and transport the proppant deep into the created fracture. The response of a reservoir is
Figure 2-3: Core data from the Lewis Sandstone taken from two different samples selected for similar
porosity and permeability (Kg), showing highly variable relative permeability at same free-water level
(after Shanley et al, 2004).
14
largely dependent on the selection of the appropriate fracturing fluid. Abaa et al. (2011) presented
the major features a qualifying fracturing fluid must possess. Some of the major features include:
High viscosity to create adequate fracture width and to effectively transport and distribute
proppants in the fracture.
Good fluid loss control to obtain the required fracture extension and width with
minimum fluid volumes.
Have compatibility with the formation to minimize formation damage
Fluid viscosity must breakdown after proppant is placed to permit maximum fracture
conductivity.
Cost effectiveness.
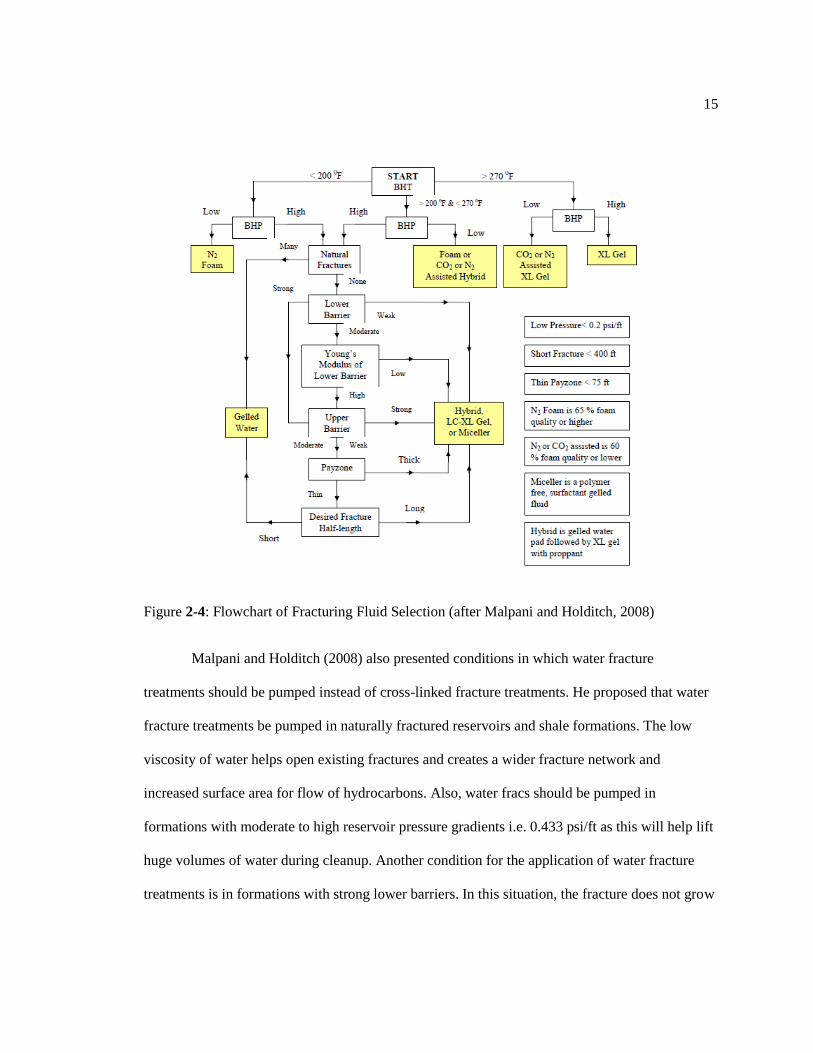
Malpani and Holditch (2008) presented eight key parameters that serve as a guide for selecting
fracturing fluids in tight gas reservoirs for a particular set of conditions. These parameters include
bottomhole temperature and pressure, presence of natural fractures, type of lower and upper
barrier, modulus of the formation, height of the payzone, and desired fracture half-length. Figure
2.4 shows a decision chart presented by Malpani and Holditch for use in fracturing fluid
selection.
15
Figure 2-4: Flowchart of Fracturing Fluid Selection (after Malpani and Holditch, 2008)
Malpani and Holditch (2008) also presented conditions in which water fracture
treatments should be pumped instead of cross-linked fracture treatments. He proposed that water
fracture treatments be pumped in naturally fractured reservoirs and shale formations. The low
viscosity of water helps open existing fractures and creates a wider fracture network and
increased surface area for flow of hydrocarbons. Also, water fracs should be pumped in
formations with moderate to high reservoir pressure gradients i.e. 0.433 psi/ft as this will help lift
huge volumes of water during cleanup. Another condition for the application of water fracture
treatments is in formations with strong lower barriers. In this situation, the fracture does not grow

16
down, but up and out, making it suitable for creation of a “sand bank” with the proppants in the
pay zone. Other fluid selection guidelines include:
Use of crosslinked gel fracture treatments in reservoirs with bottomhole temperatures of
270o F to give adequate fluid viscosity and stability required to withstand the high
temperature during pump time and closure time for the fracture.
Use foam fracture fluids in shallow, low pressure gradient (0.2 psi/ft) reservoirs to assist
fluid clean up.
Use surfactants, low concentration crosslinked gel and hybrid fluids (fluids with
slickwater in early stages followed by gelled fluids in later part of the treatment), in
formations with weak upper and lower barriers. This is necessary to create height
contained fractures in the payzone.
While stimulation via hydraulic fracturing can result in improved recovery or increased
gas rates, the invasion of the fracturing fluid in the rock matrix can reduce the relative
permeability to gas and cause a water block.
2.5 Formation Damage and Aqueous Phase Damage
Gas production from tight gas reservoirs can be problematic and often lower than expected due to
various damage mechanisms during stimulation and production that contribute to pressure losses,
total skin and productivity impairment. The major damage mechanisms include mechanical
damage to rock matrix, aqueous phase trapping, multiphase permeability reduction due to filtrate
invasion during drilling, completion and fracturing, migration of fines and swelling of clay.
It has been established previously that majority of tight gas matrix is comprised of slot pores with
an average pore throat diameter of less than 1 micron (Dutton et al., 1995). A combination of this
pore throat geometry and water vaporization into gas phase during deposition causes the initial
17
water of saturation (Swi) to be significantly less that the critical water of saturation (Swc). In fact,
it is this saturation condition that allows for gas storage and mobility in low permeability and
low porosity in tight gas sands. The conditions of subnormal water of saturation and slot pore
geometry also create a huge amount of capillary pressure suction and imbibition potential for any
introduced aqueous phase. Figure 2.5 shows typical capillary pressure and relative permeability
curves for tight gas reservoirs (after Bennion et al, 1993). It shows the low initial water
saturations that provide effective gas permeability compared to higher values at critical gas
saturations.
Filtrate invasion during drilling and fracturing operations have been identified as one of the main
damage mechanisms in tight gas sand and contributes significantly to increased total skin and
reduced gas production. In one example of a field case documented by Shaoul et al (2009), over
2000 barrels of water was injected into the formation during fracturing and only 700 barrels of
water was recovered suggesting that about 1300 barrels of water was trapped in the invaded zone.
During the same period, gas rate decreased from 3.5 MMSCFD to 1.5 MMSCFD. Work done by
Bahrami et al., (2011) suggest that filtrate invasion occurs mainly in the vicinity of the wellbore,
in permeable zones around hydraulically created fractures or in preexisting natural fractures.
Introduction of fracturing fluid during hydraulic fracturing results in imbibition of the filtrate into
the pore structure of the tight matrix due the high capillary pressure. This results in reduction of
pore throat area available for gas and reduction in gas phase relative permeability and establishes
a region of high water of saturation in the vicinity of the wellbore and fracture. This phenomenon
is commonly referred to as water block. Subsequent drawdown during gas flowback restores the
water of saturation to values that correspond to critical gas saturation because of the high
capillary pressure that holds the water phase virtually immobile in the pores of the rock matrix.

18
Figure 2-5: Conditions for Aqueous Phase Trapping (after Bennion et al,1993)
2.6 Laboratory and Field Assessment of Aqueous Phase Damage
Field tests are regularly carried out on the well site to detect and monitor formation
damage problems. These field tests are very important as they elucidate the reasons for premature
production decline. Most measurements of formation damage in the field depend on well tests,
well logging, reservoir history matching, downhole imaging of the wellbore and analysis of
produced fluids (Civan, 2000).
Numerous field studies have been conducted to asses formation damage caused by liquid
trapping over the last 30 years are available in the literature. Previous field studies by Holditch
(1979) identified water block from filtrate invasion as a major damage mechanism due to drilling
and completion operations. Further studies using numerical analysis of formation damage in tight
19
gas sandstones by Holditch (1979) alleged that water block is not significant if the drawdown
pressure is greater than the capillary entry pressure. Other field studies conducted by Bennion et
al (1993) and Cimolai et al (1993) claimed that water blocking occurs when in situ water of
saturation is less than capillary irreducible water of saturation. In another field example, Shaoul et
al (2009) noted significant production impairment during hydraulic fracturing from leak off of
fracturing fluid filtrate. During the operation, 2000 barrels of water was injected into the
formation while only about 700 barrels was recovered after a cleanup period of 35 days, during
the same period, gas rate decreased from 3.5 MMSCFD to 1.5 MMSCFD.
Experimental studies also play a crucial role in understanding formation damage
problems. Tests are typically carried out on actual core samples over a range of test conditions
representative of the in situ state. Results from these tests give significant insight to the reaction
of core samples to fluid and operating conditions while the data can be used to assist modeling,
simulation and analysis of formation damage processes.
Several experimental studies have also been conducted to analyze aqueous phase trapping
in low permeability sandstones. Abrams and Vingar (1985) investigated phase trapping
remediation in the laboratory using alcohols and surfactant and claimed that the presence of
alcohols in fluid filtrate does not significantly improve gas productivity unless drawdown
pressures are greater than capillary pressures. However, in other experimental studies, Kamath
and Laroche (2001) and Macleod and Coulter (1966) claimed significant improvements in gas
productivity in water sensitive sandstone formations upon stimulation with aqueous stimulation
fluids containing alcohol. This conclusion was further bolstered by field studies conducted by
Laroche et al (2001) and Mahadevan and Sharma ( 2003) who concluded that the addition of
alcohols definitely contributes to better gas flow by decreasing the interfacial tension and
capillary pressure and by evaporation of water phase due to the volatility of the alcohols present
in the formation. Clean up using alcohols and surfactants occurs in two stages: displacement of
20
the leak off fluid from formation during drawdown followed by vaporization of water molecules
by the flowing gas.
Bazin et al (2008) experimentally investigated two phase flow mechanisms during
cleanup of water blocks in low permeability cores by methods used in Special Core Analysis
Laboratory. Gas permeability damage was monitored after fracturing fluid filtration in two phase
flow with a linear gel (Hydropropyl Guar) and a crosslinked gel (Borate Crosslinked
Hydropropyl Guar) at 60 lb/1000gal . Results from these tests showed that water displacement
during cleanup is hindered by changes in relative permeability during imbibition of the fracturing
fluid and gas removal is very difficult even at high drawdown because of very low water
permeability. In other experiments designed to study cleanup efficiency upon addition of
alcohols, Bazin et al (2008) claimed that the improvement in gas permeabilities occurs due to two
possible reasons: 1) a decrease of interfacial tension and 2) the higher volatility of alcohol, with
the first mechanism being predominant in the two phase flow regime while the second
mechanism occurs as a result of evaporation of water after the multiphase flow displacement
regime.
These experimental studies which are available in the literature have several limitations.
Firstly, the mechanisms that induce relative permeability hysteresis and alter the rock-fluid
interactions were not identified and their potential for damage was not quantified. Secondly, only
a limited number of fracturing fluids were examined as the fluids tested are limited to modified
linear gels of Hydropropyl Guar (HPG) and Carboxy Methyl Hydroxy Propyl Guar (CMHPG)
and their borate crosslinked counterparts. Various fracturing fluids with distinct compositions and
characteristics are currently employed in the industry including slickwater, linear gels, delayed
and un-delayed crosslinked fluids with borate or metallic crosslinkers (titanium and zirconate),
viscoelastic surfactant fluid and various foamed fluids. Finally, the effect of filtrate compositions
on multiphase flow due to special additives in the fracturing fluids was not considered.

21
2.7 Numerical Modeling and Simulation of Aqueous Phase Damage
Numerical modeling and simulation has been a pillar of effort to understand formation
damage mechanisms in porous media. A formation damage model is a mathematical equation of
the permeability of a formation undergoing alteration (Civan , 2000). This model is usually
coupled with the fluid flow model to dynamically predict combined effects of formation damage
and fluid flow in oil and gas reservoirs. The basic components of a formation damage model
include:
flow model for porous media,
a formation damage model,
fluid and species transport model,
numerical solution,
parameter estimation , and
model validation and application modeling of effort (Civan,2000).
The objective of the modeling effort is an accurate prediction of permeability variation or
“skin effect” resulting from changes in flow characteristics during production. The benefits of a
proper representation and prediction of skin effect in models is to identify, diagnose and
remediate formation damage issues that reduce ultimate productivity.
Significant work has been done to evaluate water block in tight gas sandstones using
numerical models and several of such studies are well documented in the literature. The earliest
numerical studies on liquid block in tight gas sandstone were conducted by Holditch (1979) and
Abrams and Vingar (1985). Their work showed that water blocks can be remediated if drawdown
pressure is greater than the capillary entry pressure. This high drawdown pressure requirement is
applicable to reservoirs in overpressurized settings and is difficult to achieve in moderate or low
pressurized low permeability reservoirs. Simulation studies by Parekh and Sharma (2004) showed

22
that the ratios of pressure drawdown to capillary pressure as well as the relative permeability
exponents have a significant impact on cleanup of water blocks.
Formation damage due to filtrate invasion during hydraulic fracturing is particularly most
severe in the region near the wellbore and fracture face in the rock matrix. Gidanski et al. (2006)
used a two phase flow model to predict the impact of aqueous phase damage in fracture –face
matrix damage on fracture –face skin evolution and during clean up and production. The study
demonstrated that fracture face skin evolution during gas flow can be modeled and calculated
throughout the simulation of clean up and production process. Results from the study showed that
with lower matrix permeability and subsequent higher capillary pressures, the impact of water
saturation in the damaged zone becomes important. The fracture face skin relative to gas flow can
be several times higher than expected on the basis of single phase flow while the time required to
achieve a reasonable fracture face skin can take up significant production time in the order of
about 7 weeks for moderate damage factors.
Capillary driven liquid films have been identified as a mechanism that influences liquid
displacement and evaporation rates during cleanup of water blocks in tight gas reservoirs
Mahadevan et al (2007).The capillary gradients developed across the invaded zone help transport
liquid films from low drying rate regions to regions where evaporation is higher, thereby
improving water removal and cleanup. Numerical studies by Le et al. (2012) included the
mechanism of capillary driven formation damage models resulting in improved prediction of gas
deliverability during cleanup. However, numerical studies conducted by Conway et al. (2007)
have shown that damage mechanisms from fluid invasion in low permeability rocks are numerous
and complex. Multiphase gas relative permeability obtained from rocks with similar
porosity/permeability distribution during cleanup show significant variation suggesting that the
bundle of capillary tubes theory is not sufficient to characterize fluid flow. The observed relative
permeability hysteresis of the aqueous phase from fluid leak off during injection and cleanup

23
suggest that fracturing fluid composition may play a role in the alteration of rock –fluid and fluid-
fluid interactions especially as the rock becomes tighter.
Most research work with numerical studies of gas flow after fracture fluid invasion are in
tight gas reservoirs and are based on empirical analysis which are not supported by data obtained
from experimental studies. As a result existing simulation tools that do not consider mechanisms
of rock-fluid and fluid-fluid interactions specific to the fracturing fluid filtrate hamper proper
representation of formation damage due to trapping of filtrate and reduce the predictive and
diagnostic capability of the model.
In this research study, formation damage mechanisms of wettability alteration and
multiphase gas relative permeability from fracturing fluid filtrate invasion will be investigated
experimentally. Data obtained from the study will be used to assist support models that
dynamically simulate the fracture face skin evolution and fractured well performance during
cleanup. The benefits of this work will be improved ability to diagnose, predict and evaluate
formation damage from different fracturing fluids in tight gas sandstones.
.

Chapter 3
Problem Statement
Hydraulic fracturing involves the injection of fluids to breakdown the formation,
propagate and prop open the created fracture required for production enhancement. These
fracturing fluids contain several chemicals and additives uniquely formulated for the reservoir to
be stimulated. The components of the fracturing fluids are classified into two main groups:
the base fluid which is primarily composed of the gelling agent or polymer
required to create and prop the fracture and
additives that modify base fluid behavior for viscosity control and reservoir
compatibility.
The base fluid and additives of these fracturing fluids result in a fracturing fluid filtrate
with highly variable physical and chemical properties that eventually leak off into the formation.
Aqueous phase trapping in the rock matrix around the fracture face and near wellbore region
happens as a result of leak-off and capillary imbibition of the fracturing fluid filtrate in the slot
pores of these low permeability rocks. Previous work by several authors have shown that
capillary imbibition of the filtrate results in relative permeability hysteresis of aqueous phase and
filtrate influences gas phase relative permeability. Additionally, the aqueous phase from the
filtrate influences interfacial tension and subsequently the gas phase relative permeability during
the displacement and evaporation phases of the cleanup process.
The primary objective of this study is to experimentally investigate the role fracturing
filtrate has on the multiphase permeability evolution during imbibition and drainage of the
aqueous phase in low permeability sandstones. Additionally, the alteration of rock-fluid

25
interactions during capillary imbibition of fracturing fluid filtrate for a range of commonly
employed fracture fluids will be investigated by means of laboratory experiments.
Effective control and removal of from aqueous phase trapping are critical to restoring gas
permeability and achieving production enhancement in low permeability sandstones after
hydraulic fracture treatment. Remedial treatments designed to remove aqueous phase traps are
centered on increasing the drawdown pressure, reducing the interfacial tension, altering the
wettability and direct removal or replacement of the trapped fluid. Chemical additives used
include mutual solvents, alcohols, blends of alcohols and mutual solvents, blends of solvents and
surfactants and surfactants alone. While proper fluid selection is crucial to the success of the
treatment, the remedial treatment may be unsuccessful if the additive is incompatible, not
properly designed or poorly implemented. The key to effective damage control or remedial
treatment is to understand the effect, compatibility and behavior of the rock-fluid-
additive/fracturing fluid system during treatment process under varying in situ conditions via core
analysis and laboratory testing.
In this study, the performance of alcohols and surfactants as additives in the removal of
trapped liquid from different fracturing fluid systems will be examined. Special core analysis and
laboratory testing will be conducted to determine, understand and quantify the mechanisms that
govern multiphase permeability evolution using alcohols and surfactants to remediate aqueous
phase trapping. Experimental data that captures the relative contributions of mechanisms that
affect rock-fluid and fluid-fluid interactions will be obtained from carefully designed laboratory
experiments and fluid tests. The data will be used to develop methodologies and optimal
strategies for damage removal from fracturing fluid filtrate in low permeability sandstones. The
data will also be useful in developing empirical correlations and model-assisted analysis of
permeability evolution during fluid invasion and post fracture cleanup.
Part I- Multiphase Permeability Evolution for Fracturing Fluid Systems
Chapter 4
Experimental Methodology
Laboratory experiments and techniques in this research study were designed to
characterize and quantify the following petrophysical attributes and properties for low
permeability sandstone samples:
1. Pore structure, mineral distribution and composition using combined Energy
Dispersive Spectroscopy (EDS) and Scanning Electron Microscopy (SEM) imaging.
2. Porosity, absolute Klinkernberg permeability and specific permeability to water.
3. Gas phase and liquid relative permeability with selected fracturing fluid systems as
liquid phase.
4. Filtration/fluid loss for each fluid system in the porous media.
4.1 Samples
Samples used in this study are cores cut from sandstones blocks obtained from Oriskany
sandstone formation outcrop in Scioto County Ohio and blocks from the Almond formation
(Mesaverde group) outcrop in Sweet Water County Wyoming. The cut blocks were sealed at the
field site in thermoplastic barrier material to prevent water loss and preserve in situ conditions.
Two horizontal plugs 1 inch (2.5 cm) in diameter and 2 inches (5cm) long were cut from
each sandstone blocks for a total of four plugs. Table 4-1 shows the physical characteristics of the
core plugs used for petrographic analysis, porosity, Klinkernberg and specific permeability and
for multiphase relative permeability measurement with fracturing fluids in this study.

27
Table 4-1. Physical characteristics of samples used in this study
Sample Description Dimensions
Diameter (inch)
Length (inch)
A1,A2,A3,A4 Ohio Scioto 1 2
B1,B2,B3,B4 Wyoming Almond 1 2
4.2 Petrographic Analysis
The petrophysical properties of sedimentary rocks are strongly dependent on the
geometrical and topography of the rock matrix. Therefore petrographic analysis is crucial as it
can provide important information about pore structure, improve rock characterization and help in
understanding formation damage mechanisms. Petrographic analysis uses images
photographs/electron images of selected cores to infer for important rock properties including
textural parameters, grain size & distribution, topography, pore body and pore throat sizes.
Petrographic analysis was conducted with the Energy Dispersive Spectroscopy (EDS)
coupled with the Scanning Electron Microscope (SEM) imaging tool. The SEM images a sample
by focusing a beam of electrons on the surface of the material. Three types of signals are
generated from the impact of the electron beam. They include secondary electrons, backscattered
electrons and X-rays. Secondary electrons are emitted from atoms at the surface of the sample
and produce a readily interpretable image of the topography of the surface. Backscattered
electrons are emitted from atoms within the solid. It also displays an image of the sample with

28
contrast corresponding to the atomic number of the constituent elements in the sample. X-rays
will also be emitted because on interactions of the electron beam with electrons in the inner shell
of the atoms. The emitted x-rays have energy characteristic to the parent elements and are picked
up by detectors mounted on the EDS tool. The EDS technique provides elemental composition of
the scanned area and mapping of elements in the sample. .
In this study, the petrographic study was targeted towards observing the pore structure,
pore throats and the mineralogy of the rock grains and pore spaces. Core and image analysis with
the EDS/SEM tool was performed on 1-inch diameter discs obtained from the two sandstone
blocks.
4.3 Test Fluid Systems
Synthetic brine used to saturate the core and represent formation water was prepared in
the laboratory to match composition found in the Oriskany reservoir. The brine had a total
dissolved solids (TDS) content of 35500 ppm which contains 32 g/L of NaCl,1.2 g/L of CaCl2,
0.78 g/l of MgCl2, 0.31 g/L of KCl and 1.1 g/L of NaHCO3. Helium gas at room temperature was
used in permeability experiments to imitate hydrocarbon gas.
Several commonly used fracturing fluids in the oil industry were screened and selected
based on commonly employed fluid selection criteria for stimulation of low permeability
sandstones. These fluid systems were used to conduct gas and liquid phase relative permeability
experiments for this research study. The selected fluid systems are listed in Table 4-2 to 4-4
below.
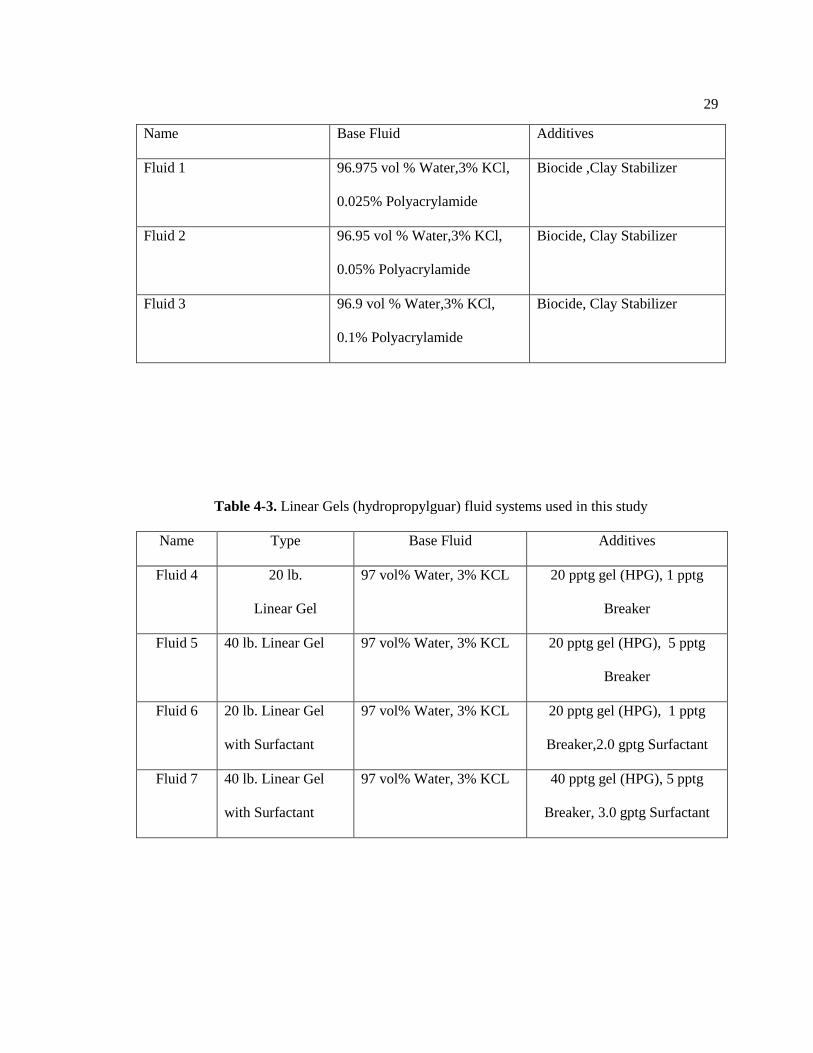
Table 4-2. Slickwater fluid systems used in this study
29
Name Base Fluid Additives
Fluid 1 96.975 vol % Water,3% KCl,
0.025% Polyacrylamide
Biocide ,Clay Stabilizer
Fluid 2 96.95 vol % Water,3% KCl,
0.05% Polyacrylamide
Biocide, Clay Stabilizer
Fluid 3 96.9 vol % Water,3% KCl,
0.1% Polyacrylamide
Biocide, Clay Stabilizer
Table 4-3. Linear Gels (hydropropylguar) fluid systems used in this study
Name Type Base Fluid Additives
Fluid 4 20 lb.
Linear Gel
97 vol% Water, 3% KCL 20 pptg gel (HPG), 1 pptg
Breaker
Fluid 5 40 lb. Linear Gel 97 vol% Water, 3% KCL 20 pptg gel (HPG), 5 pptg
Breaker
Fluid 6 20 lb. Linear Gel
with Surfactant
97 vol% Water, 3% KCL 20 pptg gel (HPG), 1 pptg
Breaker,2.0 gptg Surfactant
Fluid 7 40 lb. Linear Gel
with Surfactant
97 vol% Water, 3% KCL 40 pptg gel (HPG), 5 pptg
Breaker, 3.0 gptg Surfactant

30
Table 4-4. Borate-Crosslinked Gel (hydropropylguar) fluid systems used in this study
Name Type Base Fluid Additives
Fluid 8 20 lb.
Crosslinked Gel
97 vol% Water, 3% KCL 20 pptg gel (HPG), 2.5 gptg
Crosslinker ,1 pptg Breaker
Fluid 9 40 lb.
Crosslinked Gel
97 vol% Water, 3% KCL 40 pptg gel (HPG), 4.0 gptg
Crosslinker, 5 pptg Breaker
Fluid 10 20 lb.
Crosslinked Gel with
Surfactant
97 vol% Water, 3% KCL 40 pptg gel (HPG), 2.5 gptg
Crosslinker, 1 pptg
Breaker,2.0 gptg Surfactant
Fluid 11 40 lb.
Crosslinked Gel with
Surfactant
97 vol% Water, 3% KCL 40 pptg gel (HPG), 4.0 gptg
Crosslinker, 5 pptg Breaker,
3.0 gptg Surfactant
4.4 Petrophysical Properties and Measurement Techniques
The desired rock properties and methods used in this research are presented. These methods were
selected based on technical and practical suitability to objectives of the experimental
investigation.
4.4.1 Porosity
Porosity for each core sample was determined from a combination of helium Boyle’s law test and
the liquid saturation (Gravimetric) technique.
4.4.2 Permeability
In tight gas reservoirs, majority of permeability measurements are obtained from routine core
analysis. The core samples are dried and tested for absolute slip free permeability to gas at
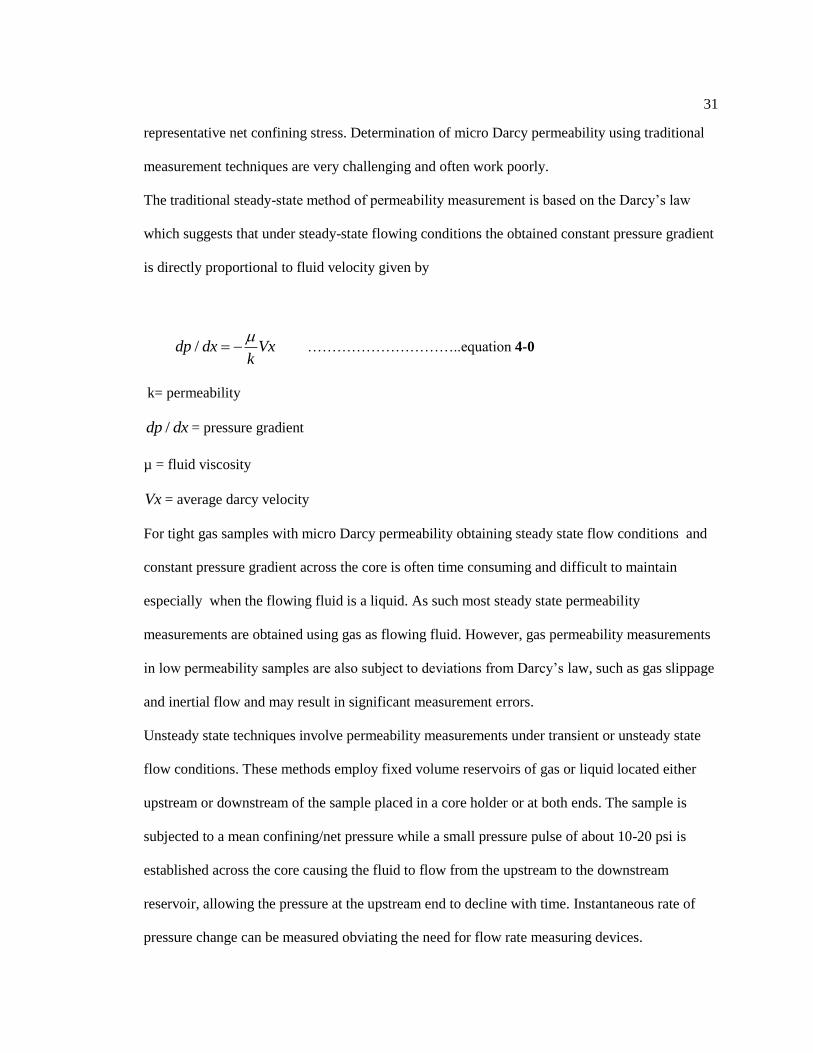
31
representative net confining stress. Determination of micro Darcy permeability using traditional
measurement techniques are very challenging and often work poorly.
The traditional steady-state method of permeability measurement is based on the Darcy’s law
which suggests that under steady-state flowing conditions the obtained constant pressure gradient
is directly proportional to fluid velocity given by
/dp dx Vxk
…………………………..equation 4-0
k= permeability
/dp dx = pressure gradient
µ = fluid viscosity
Vx = average darcy velocity
For tight gas samples with micro Darcy permeability obtaining steady state flow conditions and
constant pressure gradient across the core is often time consuming and difficult to maintain
especially when the flowing fluid is a liquid. As such most steady state permeability
measurements are obtained using gas as flowing fluid. However, gas permeability measurements
in low permeability samples are also subject to deviations from Darcy’s law, such as gas slippage
and inertial flow and may result in significant measurement errors.
Unsteady state techniques involve permeability measurements under transient or unsteady state
flow conditions. These methods employ fixed volume reservoirs of gas or liquid located either
upstream or downstream of the sample placed in a core holder or at both ends. The sample is
subjected to a mean confining/net pressure while a small pressure pulse of about 10-20 psi is
established across the core causing the fluid to flow from the upstream to the downstream
reservoir, allowing the pressure at the upstream end to decline with time. Instantaneous rate of
pressure change can be measured obviating the need for flow rate measuring devices.

32
Applying a mean pore pressure of about 1000 psi across the core is enough to produce a slip free
condition. Pressure fall-off unsteady state method involves operating the downstream reservoir at
atmospheric conditions while the pulse decay method requires operation of downstream reservoir
at pressures significantly above atmospheric conditions. Liquid and gas variations of both
methods can be designed to obtain measurements of specific end-point permeability to both gas
and water.
The unsteady-state pulse decay technique was used to determine the Klinkernberg permeability
for each of the selected sample plugs. This method has been proven to give results consistent
with multiple point steady-state and unsteady state pulse decay methods (Jones, 1997). In the
study, pulse decay measurements were conducted with helium gas at room temperature.
Additionally, applying a standard mean operating pressure of 1000 psi across the core ensures
that permeability is measured under slip-free conditions. A pressure pulse of about 10-20 psi is
established and monitored till it stabilizes. This technique is more rapid than the steady state
technique with test times varying from one to four hours. It also achieves stable results as it
eliminates stress gradients created in steady state methods (Dacy, 2010). Liquid pulse decay
measurements were conducted using synthetic brine prepared to simulate formation fluids.
4.4.3 Pulse Decay Permeametry-Apparatus, Procedure and Analysis
The experiment was performed using a simple tri-axial apparatus capable of applying defined
confining stresses of about 5000 psia in the axial and radial direction and concurrently measuring
the gas effective permeability. The apparatus consists of a Temco tri-axial core holder to confine
the core plug at the prescribed stresses. Confining pressure was obtained by means of ISCO
syringe pumps with stresses applied in the axial and radial direction (35 MPa with resolution of ±
1KPa). Pressure transducers were used to monitor the upstream and downstream reservoir
pressures (PDCR 610 & Omega PX302-5KGO) to a resolution of 0.03 MPa and a data
acquisition system (DAS) used to obtain data collected as voltage measurements. The volumes of

33
the upstream and downstream reservoirs were 17.36 and 3.1 cm3 respectively. The pumps,
transducers and reservoir volumes were all calibrated prior to the start of the experiments. All
measurements were conducted at room temperature.
Figure 4-1: Schematic of pulse test transient system (after, Wang et al. 2011)
In a standard pulse decay test, a plug sample is placed in a tri-axial core holder and the defined
net hydrostatic pressure is applied in the radial and axial directions. As shown in Figure 4-1., pore
pressure is applied at both ends of the core before a pressure pulse is generated at the upstream
end. The created pulse is allowed to flow through the core from the upstream end to the
downstream end while the pressure decay at upstream and pressure gain at the downstream end is
recorded by means of pressure transducers until an equilibrium pressure is achieved. A very small
pressure pulse of about 10 psi is used to minimize adsorption of gas or displacement of the liquid
pulse in the core.
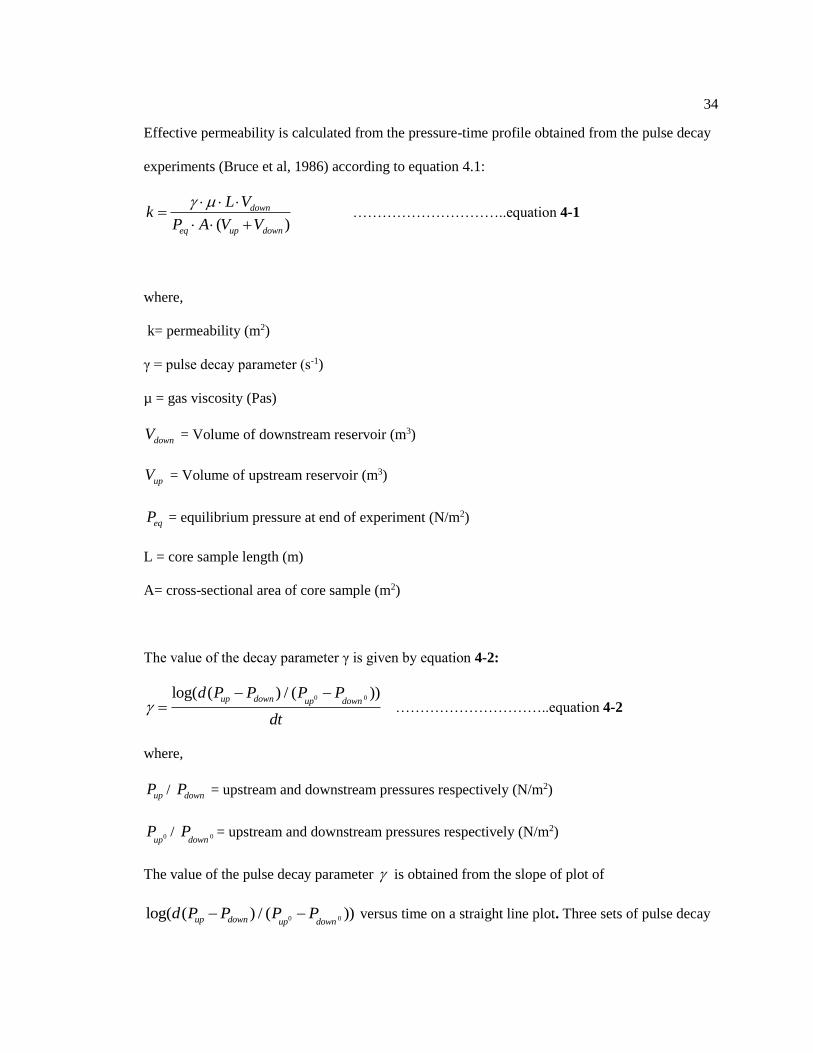
34
Effective permeability is calculated from the pressure-time profile obtained from the pulse decay
experiments (Bruce et al, 1986) according to equation 4.1:
( )
down
eq up down
L Vk
P A V V
…………………………..equation 4-1
where,
k= permeability (m2)
γ = pulse decay parameter (s-1)
µ = gas viscosity (Pas)
downV = Volume of downstream reservoir (m3)
upV = Volume of upstream reservoir (m3)
eqP = equilibrium pressure at end of experiment (N/m2)
L = core sample length (m)
A= cross-sectional area of core sample (m2)
The value of the decay parameter γ is given by equation 4-2:
0 0log( ( ) / ( ))up down up downd P P P P
dt
…………………………..equation 4-2
where,
upP / downP = upstream and downstream pressures respectively (N/m2)
0upP / 0down
P = upstream and downstream pressures respectively (N/m2)
The value of the pulse decay parameter is obtained from the slope of plot of
0 0log( ( ) / ( ))up down up downd P P P P versus time on a straight line plot. Three sets of pulse decay

35
observations were used to calculate the uncertainty in permeability calculations. Uncertainty in
pressure readings from transducers, volume of reservoir and length of the core are ±4.5 psi, 0.02
mm3, ±0.01mm respectively. Based on equation 4-1, this would suggest that our permeability
calculations are accurate within 8%.
Klinkenberg permeability (kabs ) was measured on a weighed dry plug. For measurement of gas
permeability, the core was initially vacuum saturated in prepared fracturing fluid filtrate system
with a saturator. The core was allowed to stand for two days fully immersed in the filtrate. After
saturation, the pore volume was determined from Archimedes principle.
During permeability measurements, the saturation in the core was allowed to evaporate to
achieve target saturation (Sw). The core was subsequently enclosed in a glass bottle for fluid
redistribution and thermal equilibrium. The core was then weighed, loaded in the core holder and
pressure decay permeability measurements were performed on the core to obtain gas effective
permeability (keg) at Sw. After the measurement was obtained, the core is unloaded and re-
weighed to obtain the average saturation after gas flow. The process was repeated for subsequent
target saturations for the drainage cycle. Gas effective permeability (keg) at Sw was normalized to
absolute permeability (kabs) to obtain relative permeability krg: krg= (keg)/kabs . Absolute
permeability, specific permeability and multi-phase flow permeability was evaluated with the
transient pulse decay method. The gas and liquid variations of this technique was used to
determine the effective permeability to gas and water during multiphase flow.

36
4.5 Multiphase Permeability Experiments with Fracturing Fluids
Major damage mechanisms in tight gas reservoirs such as phase trapping can be captured
in relative permeability curves. In this study the effect of phase trapping /permeability alteration
from invasion of fracturing fluids was determined by investigating multiphase flow behavior of
the low permeability sandstone induced by the fluid during invasion and clean-up. Relative
permeability to gas and brine were measured at different saturations of the liquid phase i.e.
fracturing fluid filtrate to capture multiphase flow behavior during leak-off and imbibition of
fracturing fluid during the injection part of the fracturing treatment and drainage of liquid phase
during clean-up. For the purpose of this study, two sets of experiments are conducted on core
samples from the two different sandstone rock types. The first set consists of measurements of
effective liquid permeability to slickwater at different brine saturations. This is done to reproduce
flow conditions during fluid invasion and is termed the imbibition cycle. The second set of
experiments consists of measurements of effective gas permeability with helium at different
saturations of slickwater to simulate cleanup/displacement of the fracturing fluid and is termed
the drainage cycle.
The preferred method for relative permeability measurement for low permeability rocks
is the unsteady state pulse decay method .This technique greatly reduces measurement duration
and overcomes capillary end effects associated with high capillary pressures in low permeability
cores. A method of combining sample evaporation and unsteady state pulse decay is used in this
experimental work to measure liquid and gas phase effective permeability at different fluid
saturations achieved by saturation and evaporation of core samples to the target saturations which
is then used to generate the relative permeability curves for the sample.
The experimental procedure for multiphase permeability measurements consist of the
following steps:
1-Initial saturation of core with brine and displacement with gas to connate water of saturation.

37
2-Measurement of Klinkernberg permeability at connate water of saturation
3-Injection /saturation of core with fracturing fluid and evaporation to target liquid saturation.
4-Enclosing core in air tight bottle to achieve fluid redistribution.
5-Weighing of the core to calculate target saturation using mass balance.
6-Liquid pulse decay permeability measurement is performed to obtain effective permeability to
liquid (slickwater) phase.
7-Unloading and re-weighing of core to obtain average liquid saturation. Repeating steps 3-6 for
different target saturations until 100% saturation of core is achieved.
8-At 100% liquid saturation, helium gas is injected into core to achieve target liquid saturation for
the drainage cycle.
9-Core is allowed to evaporate, left to stand in a bottle and weighed to obtained average fluid
saturation.
10-Effective permeability to gas is measured using gas pulse decay method.
11-Steps 8 and 9 repeated for varying liquid saturations until connate saturation is achieved.
Measured effective permeability to liquid and gas were normalized to endpoint
permeabilities to generate relative permeability curves. Relative permeability curves were
obtained for the different slickwater fluid systems during imbibition and drainage cycles on core
samples from the two sandstone rock types.
Fracturing fluid filtrate is used to imitate the wetting phase in the invaded zone while
helium gas is used to simulate the gas phase. The gas effective permeability is measured at
different target saturations and is used to calculate gas relative permeability. Compared to the
displacement/flow technique, this approach reduces time to reach target saturation thus greatly
reducing the experiment turnaround time and minimizes contact of fracturing fluid filtrate and the
core holder apparatus and piping system.

38
4.6 Leakoff Test/Filtration Test
Leakoff/Filtration tests were conducted on each core/fluid system to determine the fluid loss and
mechanisms that control fluid loss during injection of fracturing fluid across the face of the
fracture. Fluid loss during injection of fracturing fluid depends on three separate linear
mechanisms: 1) fracturing fluid viscosity relative permeability effects 2) reservoir fluid viscosity
–compressibility effects 3) wall building effects. In any hydraulic fracturing treatment, each of
these mechanisms will act simultaneously to varying extents.
The goal of the filtration experiments in this research is to identify the presence or absence of
wall building effects, which would confirm the filtration of polymeric molecules into the porous
media and provide insight to possible rock-fluid/fluid-fluid alterations caused by polymeric
molecules during imbibition and drainage of the fracturing fluid filtrate in the rock similar to
process during injection and clean-up of a fracture treatment.
Measurement of fluid loss
The wall building mechanism for fluid loss can be determined experimentally in the laboratory
using the standard fluid loss test. Figure 4-2 shows the experimental set up for a fluid loss test.
The test is conducted in a high pressure –high temperature Baroid Filter Press containing wafers
of the cored sample. The pressure differential, ∆P (psi) used in the test corresponds to pressure
differences at the fracture face during treatment. The pressure differential is the difference
between bottomhole treating pressure (i.e. ∆P = BHPCN +PN –PR) and reservoir pressure, where
BHPCN is bottomhole treating pressure, PN is Net pressure and PR is reservoir pressure.
A pressure differential of 1000 psi at a temperature of 180 deg F is used to measure fluid loss for
the selected core samples and fluid systems. The fluid loss in cubic centimeters is measured with
time and is plotted and analyzed to determine if fluid loss is controlled by Darcy’s law or by the
formation of a filter cake.

39
Figure 4-2: High Pressure High Temperature Filter Press
4.7 Adsorption Flow Experiments
In this study, adsorption flow experiments are conducted to investigate, verify and determine the
extent of adsorption of molecules of the fracturing fluid filtrate system during and after flow in
the porous media. Adsorption of polymeric molecules of the fracturing fluid system can alter the
rock-fluid interactions during flow resulting in a change in the shape of the relative permeability
curves.
Experimental procedure
A picture of the flow system used to conduct adsorption experiments is shown in Figure 4-3.
Clean core samples were mounted horizontally in a core holder apparatus after 100% saturation in
brine. The test fluid system is colored with dye and injected into the core until the effluent
concentration is equal to the initial concentration. The effluent dye concentration at different pore
volumes of injected fluid is determined and used to construct the initial breakthrough curve. The

40
initial fluid is then displaced completely with brine to flush out the fluid from the core. Another
slug of the same fracturing fluid is injected and effluent concentration measurements are used to
generate a second breakthrough curve. Adsorption of the polymeric molecules of the fluid is
determined from the difference in the two breakthrough curves.
Figure 4-3: Core Holder Arrangement for Adsorption Flow Tests
4.8 Spontaneous Imbibition and Contact Angle Experiments
Spontaneous imbibition experiments were conducted at room temperature to identify wettability
alteration of the rock samples after flooding with the fracturing fluid to be investigated.
Imbibition tests are conducted by partially immersing the cores in 2% KCl brine fluid and
suspended from a digital balance and measuring the weight increase of the sample at different
times. Figure 4-4 shows a picture of the apparatus and setup used in this study. The core is
brought to connate water of saturation after cleaning and drying in an oven. The core is partially

41
wrapped with a rubber jacket allowing one side of the core to be partially exposed. This is done to
avoid errors due to evaporation. The sample is connected to the digital balance with the exposed
end placed about 2 mm deep into the beaker containing brine. The liquid (brine) will
spontaneously imbibe resulting in a weight increase of the core which is recorded by the digital
balance. Measurements of weight increase are taken every minute until a fairly constant value is
obtained indicating that suggesting maximum imbibition has been reached. The amount of water
imbibed is calculated from the weight increase. This procedure is repeated on the core this time
after flooding with the fracturing fluid and drying. The difference is imbibed fluid saturation is
used as a qualitative indication of wettability alteration.
Change in contact angles of a droplet of water placed on the surface of a core before and after
flooding with the fracturing fluids is used as a visual indicator of wettability change of a rock
sample. In this study, pictures of contact angles of a droplet of water placed on the rock surface
will be used to visually observe wettability changes of the rock surface after flooding with the
fracturing fluid and aging in an oven for about three hours. Spreading or beading of the water
droplet on the surface of the rock sample will be used as a visual indication of wettability
alteration of the core.
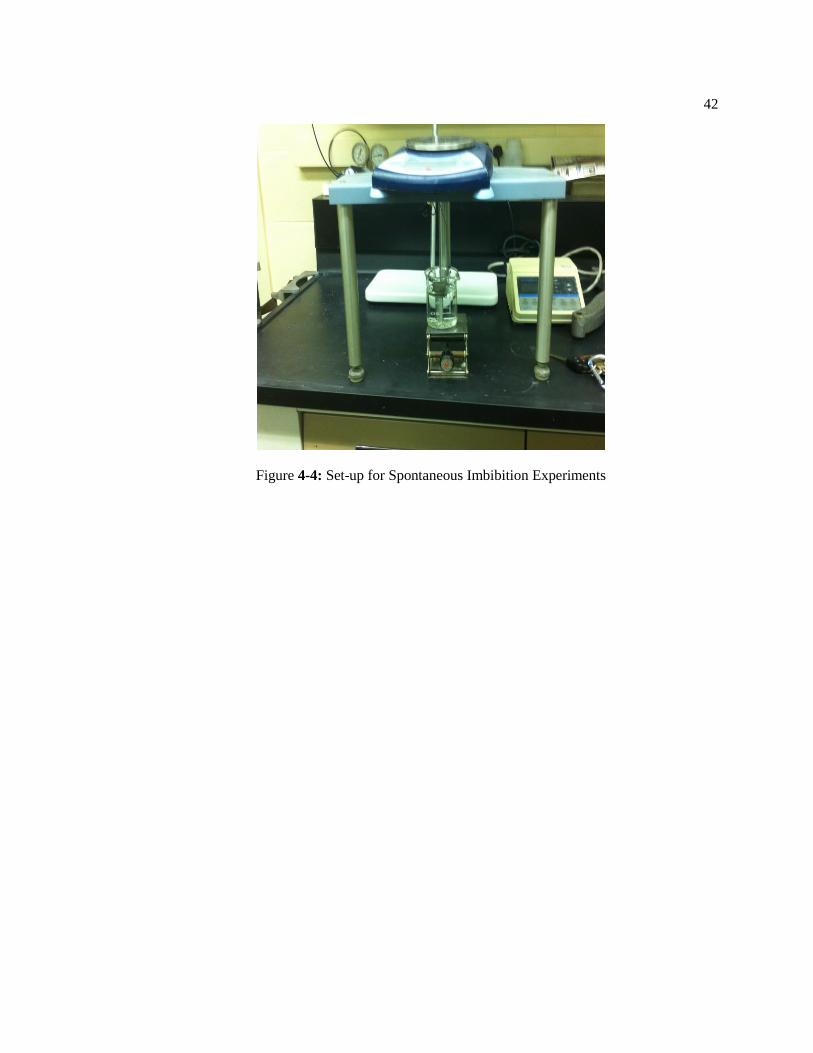
42
Figure 4-4: Set-up for Spontaneous Imbibition Experiments
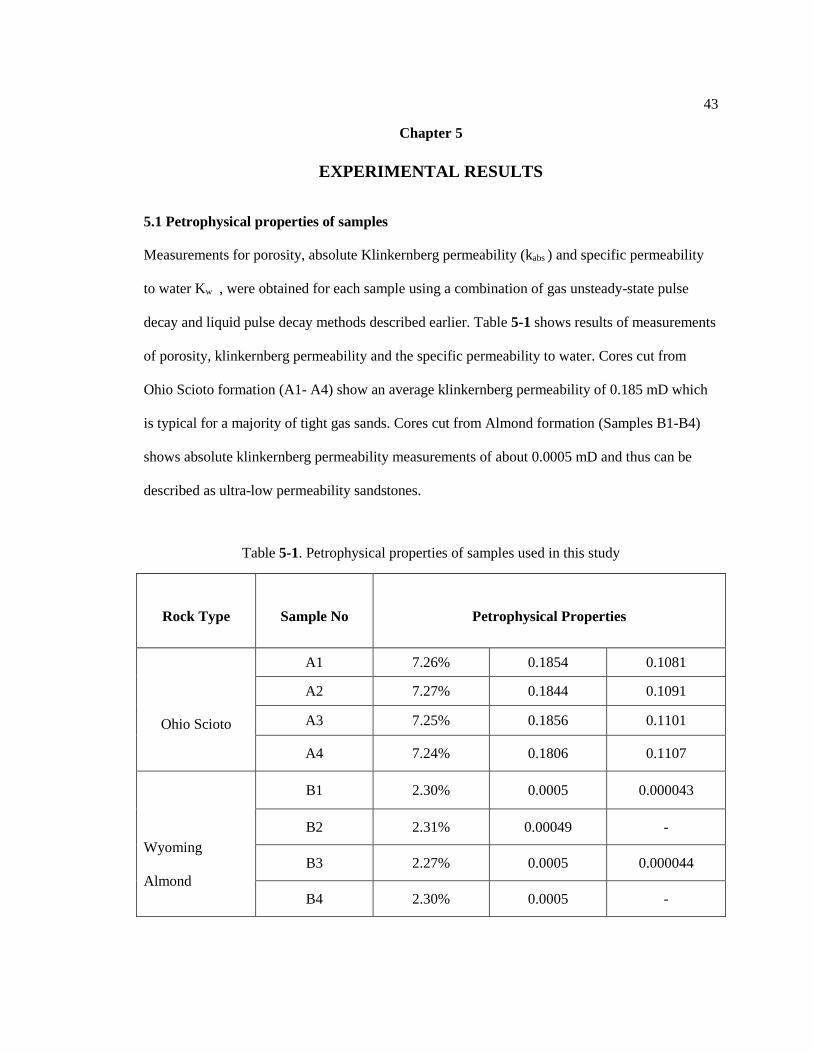
43
Chapter 5
EXPERIMENTAL RESULTS
5.1 Petrophysical properties of samples
Measurements for porosity, absolute Klinkernberg permeability (kabs ) and specific permeability
to water Kw , were obtained for each sample using a combination of gas unsteady-state pulse
decay and liquid pulse decay methods described earlier. Table 5-1 shows results of measurements
of porosity, klinkernberg permeability and the specific permeability to water. Cores cut from
Ohio Scioto formation (A1- A4) show an average klinkernberg permeability of 0.185 mD which
is typical for a majority of tight gas sands. Cores cut from Almond formation (Samples B1-B4)
shows absolute klinkernberg permeability measurements of about 0.0005 mD and thus can be
described as ultra-low permeability sandstones.
Table 5-1. Petrophysical properties of samples used in this study
Rock Type
Sample No
Petrophysical Properties
Ohio Scioto
A1 7.26% 0.1854 0.1081
A2 7.27% 0.1844 0.1091
A3 7.25% 0.1856 0.1101
A4 7.24% 0.1806 0.1107
Wyoming
Almond
B1 2.30% 0.0005 0.000043
B2 2.31% 0.00049 -
B3 2.27% 0.0005 0.000044
B4 2.30% 0.0005 -
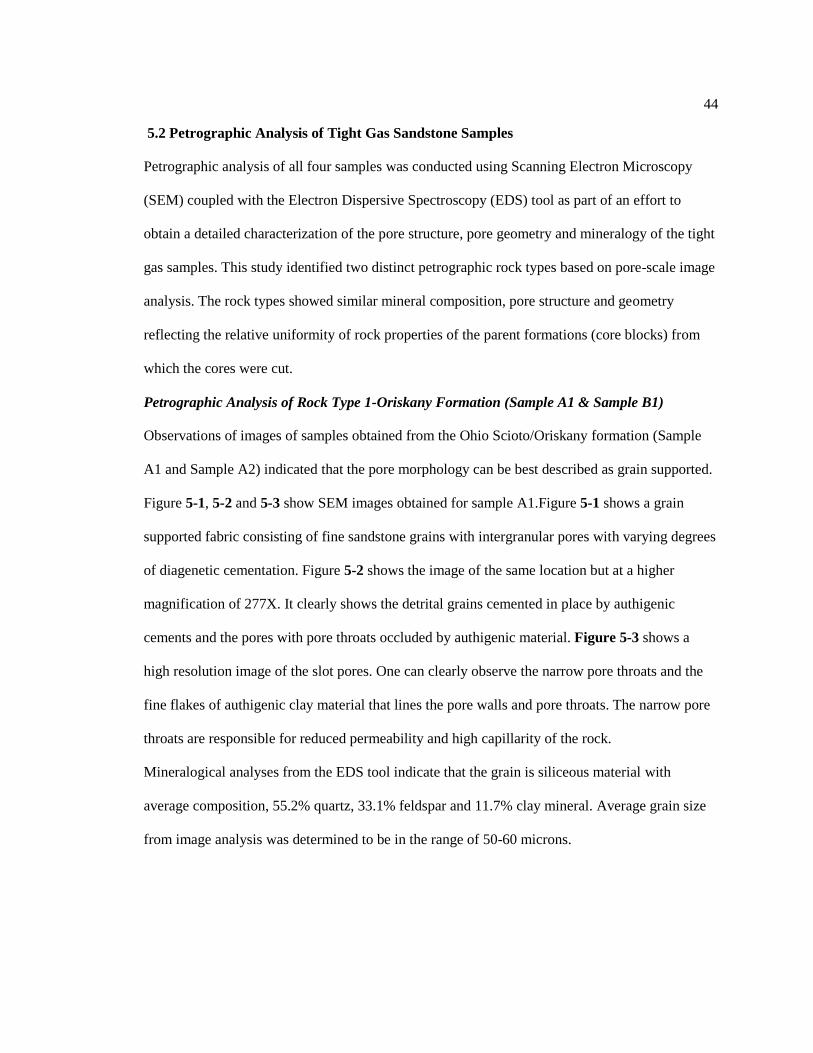
44
5.2 Petrographic Analysis of Tight Gas Sandstone Samples
Petrographic analysis of all four samples was conducted using Scanning Electron Microscopy
(SEM) coupled with the Electron Dispersive Spectroscopy (EDS) tool as part of an effort to
obtain a detailed characterization of the pore structure, pore geometry and mineralogy of the tight
gas samples. This study identified two distinct petrographic rock types based on pore-scale image
analysis. The rock types showed similar mineral composition, pore structure and geometry
reflecting the relative uniformity of rock properties of the parent formations (core blocks) from
which the cores were cut.
Petrographic Analysis of Rock Type 1-Oriskany Formation (Sample A1 & Sample B1)
Observations of images of samples obtained from the Ohio Scioto/Oriskany formation (Sample
A1 and Sample A2) indicated that the pore morphology can be best described as grain supported.
Figure 5-1, 5-2 and 5-3 show SEM images obtained for sample A1.Figure 5-1 shows a grain
supported fabric consisting of fine sandstone grains with intergranular pores with varying degrees
of diagenetic cementation. Figure 5-2 shows the image of the same location but at a higher
magnification of 277X. It clearly shows the detrital grains cemented in place by authigenic
cements and the pores with pore throats occluded by authigenic material. Figure 5-3 shows a
high resolution image of the slot pores. One can clearly observe the narrow pore throats and the
fine flakes of authigenic clay material that lines the pore walls and pore throats. The narrow pore
throats are responsible for reduced permeability and high capillarity of the rock.
Mineralogical analyses from the EDS tool indicate that the grain is siliceous material with
average composition, 55.2% quartz, 33.1% feldspar and 11.7% clay mineral. Average grain size
from image analysis was determined to be in the range of 50-60 microns.

45
Figure 5-1: Sample A1 showing intergranular porosity and authigenic cementation
Figure 5-2: Sample A1 Grain supported pore structure with authigenic cements
46
Figure 5-3: Sample A1 Pore walls and throats lined with authigenic clays
Petrographic Analysis of Rock Type 2-Almond Formation (Sample B1 & Sample B2)
SEM and EDS-mineralogical analysis of cores cut from the Almond formation (Sample B1 and
Sample B2) indicate a rock pore structure that has been subjected to severe compaction and
cementation resulting in ultra-low permeability. Figure 5-4 and 5-5 show electron images of
Sample B1 and Sample B2. Both images clearly show a highly cemented grain fabric, slot pores
and randomly dispersed secondary pores. Authigenic mineral precipitation and compaction have
combined to drastically reduce the intergranular porosity to narrow slots. Mineralogical analysis
by the EDS tool indicates that the authigenic cements are comprised of quartz, clay and iron
sulphide. Average grain size was determined to be about 20 microns.
In Figure 5-6, random secondary pores can be observed at a higher image magnification. These
secondary pores are as a result of mineral dissolution of detrital grains after deposition.
Secondary pores contribute to effective porosity while the interconnecting slot pores contribute to
permeability. Figure 5-7 shows a high magnification image of the solution pore. The pore spaces,
interconnecting slot pores and authigenic cements can clearly be seen. The solution and slot pores
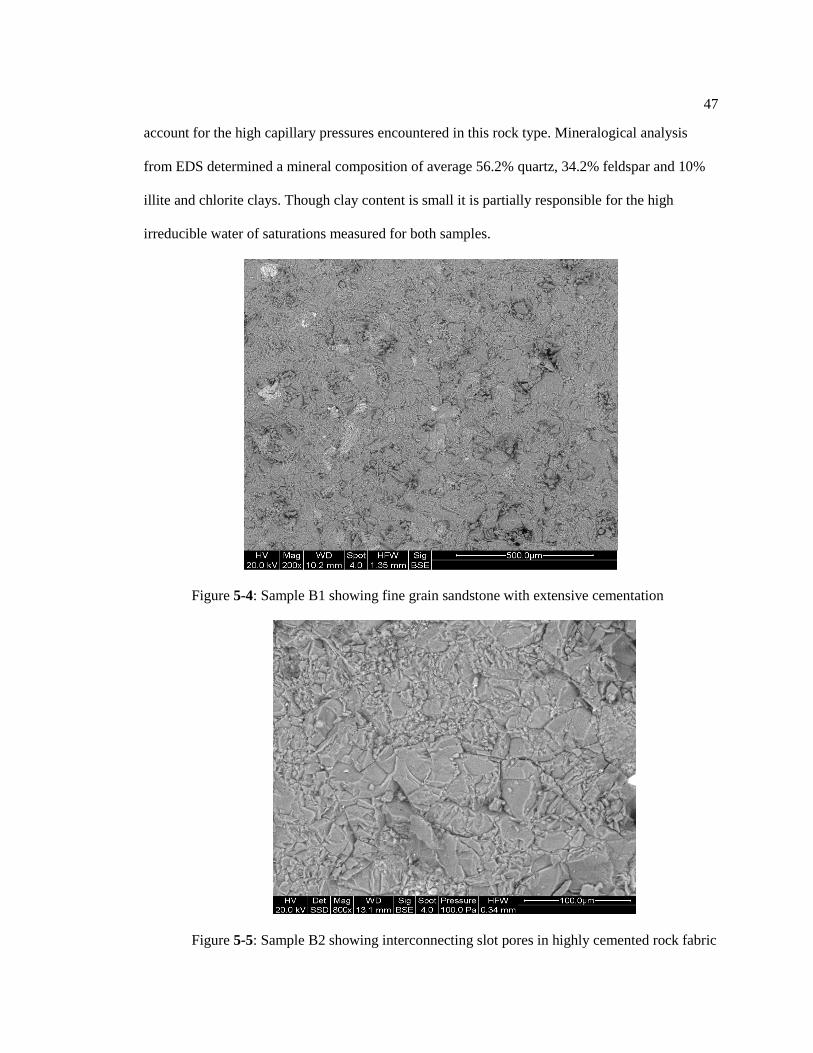
47
account for the high capillary pressures encountered in this rock type. Mineralogical analysis
from EDS determined a mineral composition of average 56.2% quartz, 34.2% feldspar and 10%
illite and chlorite clays. Though clay content is small it is partially responsible for the high
irreducible water of saturations measured for both samples.
Figure 5-4: Sample B1 showing fine grain sandstone with extensive cementation
Figure 5-5: Sample B2 showing interconnecting slot pores in highly cemented rock fabric

48
Figure 5-6: Sample B2 showing solution pore formed by mineral dissolution
Figure 5-7: Sample B2 showing slot pores that connect to solution pores

49
5.3 Analysis of Flow Experiments: Effect of Slickwater
5.3.1 Analysis of Leak-off Tests
Filtration curves obtained from plot of filtration volume versus time indicate that flow of filtrate
from linear gels through tight gas rocks is not controlled by polymer cake formation but by
permeability of the rock itself. Figure 5-8 and Figure 5-9 shows the filtration curves for
slickwater at 0.5 pptg friction reducer (Fluid 2) for Sample A1 and Sample B1 respectively. In
both figures we can clearly observe the lack of curvature at the early part of the filtration test.
This suggests that filtration or leak-off of slickwater is dominated by Darcian flow and more
importantly all polymeric molecules of the friction reducer present in the fluid invaded the pore
spaces of the porous media for both core samples.
0 20 40 60 80 100 120 1400
2
4
6
8
10
12
14
16
18
Filtration time- (seconds)
Filt
ration V
olu
me-
(cm
3/s
)
Filtration Curves for Sample 1 K=0.1584 mD
Figure 5-8: Filtration curves for slickwater (Fluid 1) through Sample A1

50
0 20 40 60 80 100 120 140-0.01
0
0.01
0.02
0.03
0.04
0.05
Filtration time- (seconds)
Filt
ration V
olu
me-
(cm
3/s
)
Filtration Curves for Sample 3 K=0.0005 mD
Figure 5-9: Filtration curves for slickwater (Fluid 1) through Sample B1
5.3.2 Analysis of Two-phase Flow Relative Permeability with Slickwater
Figure 5-10 shows relative permeability curves for sample A2 (k∞ = 0.1854 md) for 1st imbibition
and drainage cycles with slickwater as liquid phase for different concentrations of friction reducer
(polyacrylamide). Measurements of relative permeability were taken starting with sample at
connate water of saturation followed by a gradual increase of slickwater phase by vacuum
saturation. This cycle corresponds to imbibition of fracturing fluid filtrate by porous medium
during the injection part of the treatment. The draiange cycle consist of relative permeabilty
measuremnts with brine as the displacing phase after 100% saturation with slickwater.

51
0.5 0.55 0.6 0.65 0.7 0.75 0.8 0.85 0.90
0.1
0.2
0.3
0.4
0.5
0.6
x Saturation of Fluid (Wetting) Phase
y R
ela
tive P
erm
eabili
ty o
f F
luid
Phase
Brine-Fluid Relative Permeability for Imbibition/Drainage Cycle in Sample 1
Insitu Brine
0.25 gptg (Imbibition)
0.5 gptg (Imbibition)
1.0 gptg (Imbibition)
Insitu Brine
0.25 gptg (Drainage)
0.5 gptg (Drainage)
1.0 gptg (Drainage)
Figure 5-10: Liquid Relative Permeability for 1st Imbibition with Slickwater with Sample A2
Figure 5-10, clearly shows a modification of the relative permeability curves with different
concentrations of polyacrylamide for Sample A1.The relative permeability curves shift towards
the right as concentration of friction reducer increases.This suggest a selective increase in
wettability to the slickwater phase as the fluid relative permeability decreases. The figure also
shows reduction of endpoint relative permeability with increase in friction reducer
concentration.The end point relative permeability of the drainage phase is lower than the end
point permeability for the imbibition phase,suggesting a change in wetting characteristics of the
rock after contact with slickwater solution. The change in wettability is suspected to be caused by
adsorption of polyacrylamide molecules to the pore walls of porous medium. Additionally an
increase in connate water of saturation was observed after the drainage cycle . The connate water
of saturation showed a consistent increase with friction reducer concentration for the drianage
phase.This is a clear indicator of increased interaction of rock substrate with polyacrlyamide
molecules present in the slickwater fluid after core saturation during the imbibition cycle .

52
0.8 0.82 0.84 0.86 0.88 0.9 0.920
0.1
0.2
0.3
0.4
0.5
0.6
0.7
0.8
0.9
x Saturation of Fluid (Wetting) Phase
y R
ela
tive P
erm
eabili
ty o
f F
luid
Phase
Brine-Fluid Relative Permeability for Imbibition/Drainage in Sample 3
Insitu Brine
0.25 gptg (Imbibition)
0.5 gptg (Imbibition) Critical Flow
0.25 gptg (Drainage)
0.5 gptg (Drainage) Critical flow
Figure 5-11: Liquid Relative Permeability for 1st Imbibition with Slickwater with Sample B2
Figure 5-11 shows relative permeability curves imbibition and draiange permeability
measurements with slickwater as the wetting phase for Sample B2 (k∞ = 0.0005md). A similar
trend of shift of relative permeability curves is observed for Sample B2. It also shows a decrease
in end-point relative permeability as concentration of friction reducer increases. Sample B2 is
impermeable to flow after a concentration higher than 0.5 gptg of friction reducer solution and no
permeability measurements were obtained at those concentrations. The shape of the curves
suggest an improvement in wettability as concentration of the friction reducer increases,while the
absence of liquid flow at concentrations greater than 0.5 gptg could be attributed to the size of
pore throats being comparable to size of polymeric molecules of the friction reducer at higher
concentartion of polyacrylamide. Additionaly no flow was observed in the sample after
concentration of friction reducer is above 0.5 gptg. This lack of flow is likely to be caused by a

53
significant decrease in pore size available for flow at higher concentration of polyacrylamide
molecules in the friction reducer .
Relative permeability measurements to brine were conducted after complete driange of
the slickwater from the samples. Figure 5-12, shows relative permeability curves to brine after
flooding with slickwater of different concentrations of friction reducer in sample A2. It shows
permanent alteration of the relative permeability curves after contact with the slickwater fluid.
The relative permeability to brine follows a different path compared to the path followed with the
path in-situ brine condition .The end point relative permeability to brine also reduces for cores
previously flooded with higher concentration of friction reducer, while the connate water of
saturation shows a slight increase.This suggests a permanent alteration in the flow characteristics
of the rock caused by interactions of polyacrylamide molecules and the rock substrate.The
increase in connate water after each flood indicates that there is a decrease in pore size resulting
from either particle deposition or adsorption of the polymeric molecules of the friction reducer on
the rock substrate.
0 0.1 0.2 0.3 0.4 0.5 0.6 0.7 0.8 0.90
0.1
0.2
0.3
0.4
0.5
0.6
0.7
x Saturation of Brine Phase
y R
ela
tive P
erm
eabili
ty t
o B
rine P
hase
Relative Permeability to Brine (after flooding with Slickwater) Sample 1
Insitu Brine
0.25 gptg
0.5 gptg
1.0 gptg
Figure 5-12: Relative Permeability to Brine (after flooding with Slickwater) Sample A2

54
0.8 0.82 0.84 0.86 0.88 0.9 0.920
0.1
0.2
0.3
0.4
0.5
0.6
0.7
0.8
0.9
x Saturation of Brine Phase
y R
ela
tive P
erm
eabili
ty t
o B
rine P
hase
Relative Permeability to Brine(after flooding with Slickwater) Sample 3
Insitu Brine
0.25 gptg
0.5 gptg
Figure 5-13: Relative Permeability to Brine (after flooding with Slickwater) Sample B2
In Figure 5-13, for Sample B2 (k∞ =0.0005mD) one can see the same trend of a reduction in end
point relative permeability and even greater increase in connate water of saturation with
polyacrylamide concentration compared to the imbibition cycle. Additionally no flow was
observed in the sample after concentration of friction reducer is above 0.5 gptg.
Figure 5-14 and 5-15 show gas phase relative permeability vs gas saturation for both Sample A1
and Sample B2. First imbibition with brine corresponds to gas permeability measurements
obtained with cores initally at connate water of saturation. Second drainage corresponds to
measurements obtained while displacing brine with heluim from the core that is initially 100%
saturated with brine. Drainage experiments were also conducted with the core saturated with the
different slickwater systems.Analysis of the data shown in Figure 5-14 and Figure 5-15 indicate
that the relative permeability curve for the first imbibition is different from the curve obtained
from the second drainage with both brine and slickwater fluids. Additionally the higher values of
residual gas saturations were obtained for the second drainage for both brine and the slickwater

55
fluid systems.This suggest that gas phase relative permeability hysterisis is as a result of trapped
gas and not by changes in interfacial tension or wettability of the rock from the slickwater
system.The difference in saturations between the relative permeability curves for first imbibition
and second drainge is indicative of the trapped gas saturation.With this in mind,the trapped gas
saturation is observed to be higher at lower saturations than at higher saturations.This implies that
regions closest to fracture where filtrate invasion is significant will have gas mobility severely
impeded compared to regions where invasion is minimal. Modification of the gas relative
permeability curves was not significant as only slight reductions in end point relative
permeability were observed .
0 0.1 0.2 0.3 0.4 0.5 0.6 0.7 0.80
0.1
0.2
0.3
0.4
0.5
0.6
0.7
0.8
x Saturation of Gas Phase
y R
ela
tive P
erm
eabili
ty o
f G
as P
hase
Sample 1 Gas Phase Relative Perm Drainage of Slickwater
1st Brine Imbibition
2nd Brine Driange
0.25 gptg
0.5 gptg
1.0 gptg
Figure 5-14: Gas Relative Permeability with Slickwater for Sample A2
Gas relative permeability for Sample B2 ( k∞ = 0.0005md) in Figure 5-15 showed similar trends
observed in Sample 1 with smaller decrease in end-point relative permeability with increase in
friction reducer concentration.Gas relative permeability curves are consistent with those obtained

56
by Bazin et al. (2008). Gas phase relative permeability measurements were not obtained at
friction reducer concentration greater than 0.5 gptg since there no liquid flow at that
concentration.
0.1 0.2 0.3 0.4 0.5 0.6 0.7 0.8 0.9 10
0.1
0.2
0.3
0.4
0.5
0.6
0.7
0.8
0.9
1
x Saturation of Gas Phase
y R
ela
tive P
erm
eabili
ty o
f G
as P
hase
Sample 3 Gas Phase Relative Perm Drainage of Linear Gel Filtrate
1st Brine Imbibition
2nd Brine Drainage
0.25 gptg
0.5 gptg with no flow above 1.0 gptg
Figure 5-15: Gas Relative Permeability with Slickwater for Sample B2
5.3.3 Analysis of Adsorption Experiments
Figure 5-16 and Figure 5-17 show breakthrough curves obtained for adsorption experiments
conducted on Sample A3 and Sample B3. Results of the adsorption experiments were reported
earlier (Chapter 4) for different concentrations of friction reducer (polyacrylamaide solution).

57
Figure 5-16: Brekthrough curves for succesive injections of Fluid 1 through Sample A3
Figure 5-17: Breakthrough curves for succesive injections of Fluid 2 through Sample B3.
In Figure 5-16 ,the differences in the breakthrough curves confirm the adsorption of
friction reducer polymeric molecules to the pore walls after flow of slickwater through sample
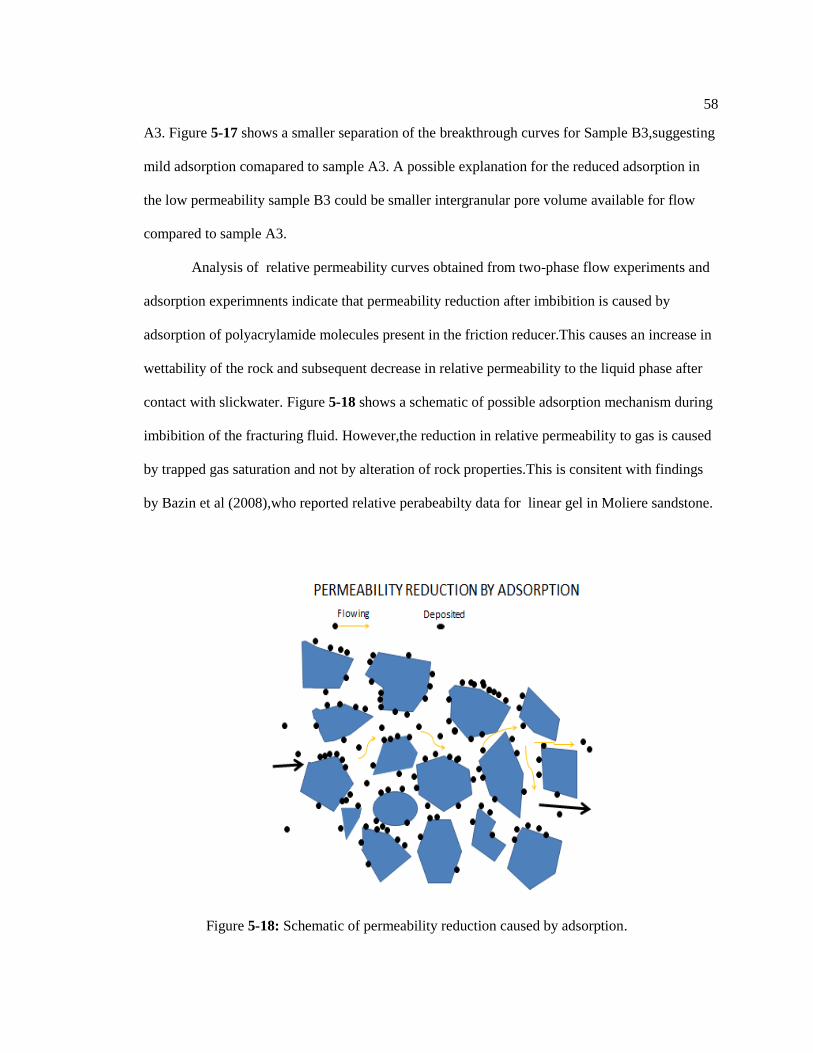
58
A3. Figure 5-17 shows a smaller separation of the breakthrough curves for Sample B3,suggesting
mild adsorption comapared to sample A3. A possible explanation for the reduced adsorption in
the low permeability sample B3 could be smaller intergranular pore volume available for flow
compared to sample A3.
Analysis of relative permeability curves obtained from two-phase flow experiments and
adsorption experimnents indicate that permeability reduction after imbibition is caused by
adsorption of polyacrylamide molecules present in the friction reducer.This causes an increase in
wettability of the rock and subsequent decrease in relative permeability to the liquid phase after
contact with slickwater. Figure 5-18 shows a schematic of possible adsorption mechanism during
imbibition of the fracturing fluid. However,the reduction in relative permeability to gas is caused
by trapped gas saturation and not by alteration of rock properties.This is consitent with findings
by Bazin et al (2008),who reported relative perabeabilty data for linear gel in Moliere sandstone.
Figure 5-18: Schematic of permeability reduction caused by adsorption.
59
5.3.4 Analysis of Imbibition and Contact Angle Experiments
Spontaneous imbibition experiments were conducted at room temperature on core sample A4 and
sample B4 at room temperature with brine (3% KCl) . Figure 5-18 and 5-19 shows imbibition
curves for samples A4 and B4 before and after flooding with slickwater (0.1% friction reducer)
/Fluid system 2. In Figure 5-18 we clearly observe the greatest increase in weight occurs at the
first five minutes after which imbibition rate becomes slow or almost constant. Imbibition curves
for core sample B4 shown in Figure 5-19 exhibit the same trend of rapid imbibition in the first
five minutes and increased imbibition after flooding with slickwater. Comparison of spontaneous
imbibition curves for sample A4 and sample B4 shows that smaller amount of water is imbibed
which is expected as the pore volume of sample B4 is smaller than sample A4.
The experiments clearly show an increase in imbibition rate of the core after flooding with
slickwater suggesting an increase in wettability of the cores. The increase in wettability of the
core samples is consistent with results from adsorption flow test presented earlier. The increase in
wettability can be attributed to the decrease in pore throat radius from adsorption of
polyacrylamide molecules present in friction reducer solution to the pore walls of the rock
sample. Capillary pressure is inversely proportional to the average pore throat radius; therefore a
decrease in pore throat radius of the rock from adsorption would result in an increase in capillary
pressure and imbibition affinity of the rock sample.

60
0 2 4 6 8 10 12 14 16 18 200
0.05
0.1
0.15
0.2
0.25
0.3
0.35
0.4
0.45
0.5
Time (min)
Mass g
ain
(gra
ms)
Brine Imbibition Test for Core 1
Before Flooding
After Flooding
Figure 5-19: Brine Imbibition for core sample A4 ( k∞ = 0.1854 md)
0 2 4 6 8 10 12 14 16 18 200
0.05
0.1
0.15
0.2
0.25
0.3
0.35
Time (min)
Mass g
ain
(gra
ms)
Brine Imbibition Test for Core 3
Before Flooding
After Flooding
Figure 5-20: Brine Imbibition curves for core sample B4 ( k∞ = 0.0005md)

61
Contact angles of droplets of brine fluid (3% KCl) placed on the surface of the rock samples
before and after flooding were observed visually to demonstrate wettability alteration
qualitatively. Figure 5-21a and 5-21b shows images of water droplets placed on surface of
sample A4 and sample B4 respectively before and after flooding with slickwater observed at
room temperature. In both cases we clearly see a decrease in contact angle and pronounced
spreading of the water droplet after the core has been flooded with slickwater.
Figure 5-21: Contact angles for core sample A4 (Top) and sample B4 (bottom) before flooding
(right) and after flooding (left) with Slickwater (0.1% friction reducer)

62
5.4 Analysis of Flow Experiments: Effect of Linear Gel
5.4.1 Analysis of Leak-off Tests
Figure 5.22 shows the total filtration volumes versus square root of time for leakoff tests
conducted with sample A1 (k∞ = 0.1854 md). Fracturing fluid used was linear gel at two polymer
concentrations of 20 lbm/1000 gal and 40 lbm/1000 gal to examine the effect of gel loading on
filtrate invasion and cake invasion.
0 5 10 150
10
20
30
40
50
60
70
80
90
Square root of time (min 1/2)
Filt
ratio
n V
olu
me-
(cm
3)
Leakoff for Linear Gels K=0.1584 mD
20 lbm/Mgal
40 lbm/Mgal
Figure 5-22: Filtration volumes for for sample A1 with linear gel.
The time to formation of filter cake is shown by the change in curvature of the filtration volume
curve indicating a change from permeability controlled filtration to filtercake dominated
filtration.At a higher gel loading of 40lb/1000 gal,we can see relatively early formation of filter
cake compared to 20 lb/1000 gal fluid.The relatively long time for spurt loss for the 20 lb/1000
63
gal loading suggests the fluid has more mobility and invades deep into the core before forming a
filter cake while the 40 lb/100 gal fluid quickly forms a filter cake due to decreased mobility.
Increasing gel loading increases the fluid viscosity and thus reduces fluid mobility.The filtrate
collected at the core outlet for the 20 lb/100 gal fluid had a milky color, a viscosity of about 2.2
cp and contained small amounts of polymer.This suggest some degree of polymer invasion into
the core.The filtrate for the 40lb/1000 gal fluid was more transparent with less amount of polymer
suggesting limited invasion of polymer-laden fluid into the core as indicated by the early cake
formation times in Figure 5.22.
Figure 5.23 and 5.24 shows the cumulative leakoff volumes for 20 and 40 lb/1000 gal fluids
conducted with Sample B1 ( k∞ = 0.0005mD).The time to filter cake fomation is clearly shown
by sudden change in filtration curves.The effect of core permeability is shown by the relatively
longer filtration times before filter cake formation for sample B1 compared to sample A1.As
permeability decreases, permeability controlled filtration is slow leading to a late formation of
filter cake and limited fluid invasion.Spurt loss for the 20 lbm/1000 gal fluid fluid is much higher
than for the 40 lb/1000 gal fluid. As mentioned previously, as fluid viscosity decreases, fluid
mobility increases leading to an increase in spurt volume.The effluent from the core outlet for
both fluids was transparent and polymer free with a viscsoity of 1.14 cp. It is suspected that
polymer invasion into the core is limited.These results are consistent with results of leakoff tests
conducted by Bazin et al (2008) using Hydroxy Propyl Guar (HPG) and Moliere sandstone
samples.

64
0 5 10 15 20 25 30 35 40 45 500
1
2
3
4
5
6
7
8
9
Square root of time (min 1/2)
Filt
ration V
olu
me-
(cm
3)
Leakoff for Linear Gels K=0.0005 mD
20 lbm/Mgal
Figure 5-23: Filtration volumes for for Sample B1 with linear gel (20lbm/1000 gal ).
0 5 10 15 20 25 30 35 40 450
0.5
1
1.5
2
2.5
3
3.5
4
4.5
Square root of time (min 1/2)
Filt
ration V
olu
me-
(cm
3)
Leakoff for Linear Gels K=0.0005 mD
40 lbm/Mgal
Figure 5-24: Filtration volumes for for Sample B2 with linear gel (40lbm/1000 gal ).

65
5.4.3 Analysis of Two-phase Flow Relative Permeability with Linear Gels
Figure 5-25 shows brine relative permeability curves for sample A1 (k∞ = 0.1854 md) for 1st
imbibition and drainage cycles after complete saturation with linear gel filtrate at 20 and 40
lbm/1000 gal gel loading . It shows formation damage is not significant with end-point
permeabilities almost 90% of initial brine permeability for both gel loading.
0 0.1 0.2 0.3 0.4 0.5 0.6 0.7 0.8 0.90
0.1
0.2
0.3
0.4
0.5
0.6
0.7
x Saturation of Liquid Phase
y R
ela
tive P
erm
eabili
ty o
f Liq
uid
Phase
Drainage Liquid Phase Relative Perm with Linear Gel
Insitu Brine
40 lbm/1000 gal
20 lbm/1000gal
Figure 5-25: Liquid Relative Permeability with linear gel for sample A1
The same trend is observed in ultra-low permeability sample B1 (k∞ = 0.0005 md) in figure 5-26
with no signifcant reduction in end-point permeability with gel loading
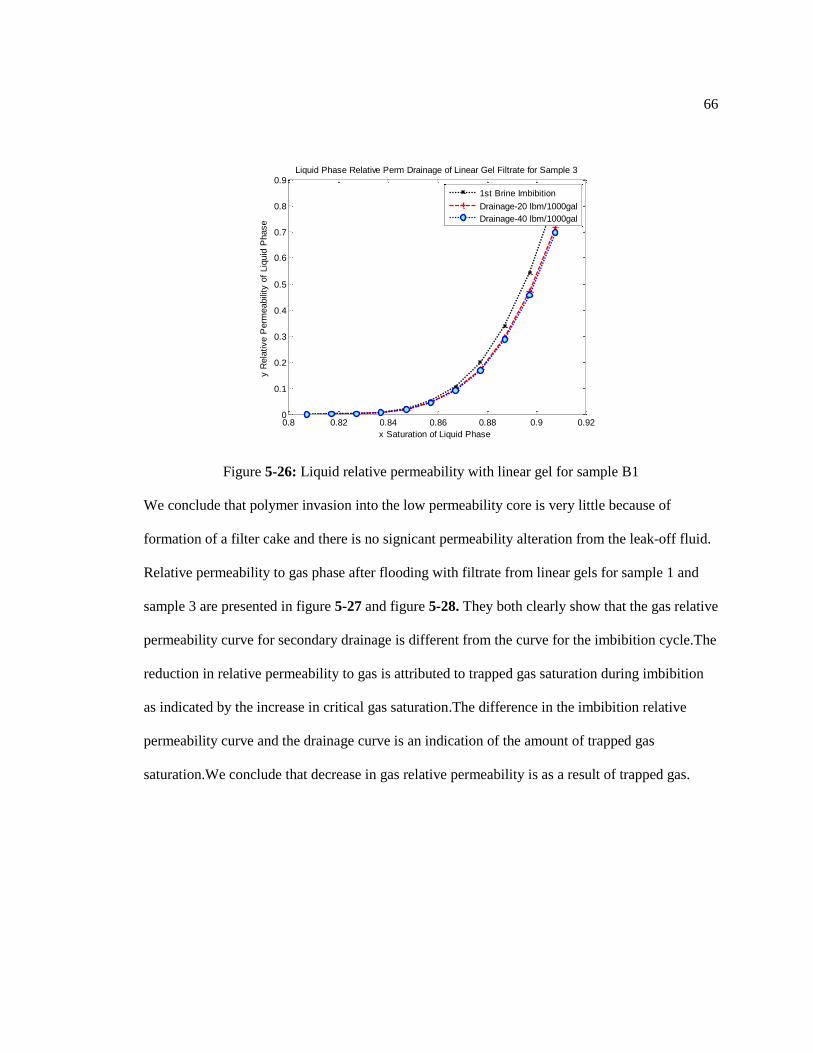
66
0.8 0.82 0.84 0.86 0.88 0.9 0.920
0.1
0.2
0.3
0.4
0.5
0.6
0.7
0.8
0.9
x Saturation of Liquid Phase
y R
ela
tive P
erm
eabili
ty o
f Liq
uid
Phase
Liquid Phase Relative Perm Drainage of Linear Gel Filtrate for Sample 3
1st Brine Imbibition
Drainage-20 lbm/1000gal
Drainage-40 lbm/1000gal
Figure 5-26: Liquid relative permeability with linear gel for sample B1
We conclude that polymer invasion into the low permeability core is very little because of
formation of a filter cake and there is no signicant permeability alteration from the leak-off fluid.
Relative permeability to gas phase after flooding with filtrate from linear gels for sample 1 and
sample 3 are presented in figure 5-27 and figure 5-28. They both clearly show that the gas relative
permeability curve for secondary drainage is different from the curve for the imbibition cycle.The
reduction in relative permeability to gas is attributed to trapped gas saturation during imbibition
as indicated by the increase in critical gas saturation.The difference in the imbibition relative
permeability curve and the drainage curve is an indication of the amount of trapped gas
saturation.We conclude that decrease in gas relative permeability is as a result of trapped gas.

67
0 0.1 0.2 0.3 0.4 0.5 0.6 0.7 0.80
0.1
0.2
0.3
0.4
0.5
0.6
0.7
0.8
x Saturation of Gas Phase
y R
ela
tive P
erm
eabili
ty o
f G
as P
hase
Sample 1 Gas Phase Relative Perm Drainage of Linear Gel Filtrate
1st Brine Imbibition
Gas Drainage
20 lbm/1000 gal
40 lbm/1000gal
Figure 5-27: Gas relative permeability with linear gel for Sample A1
0.1 0.2 0.3 0.4 0.5 0.6 0.7 0.8 0.9 10
0.1
0.2
0.3
0.4
0.5
0.6
0.7
0.8
0.9
1
x Saturation of Gas Phase
y R
ela
tive P
erm
eabili
ty o
f G
as P
hase
Gas Phase Relative Perm Drainage of Linear Gel Filtrate for Sample 3
1st Brine Imbibition
2nd Brine Drainage
20 lbm/1000 gal
40 lbm/1000 gal
Figure 5-28: Gas relative permeability with linear gel for Sample B1

68
5.5 Analysis of Flow Experiments: Effect of Borate Crosslinked Gel
5.5.1 Analysis of Leak-off Tests
Figure 5.29 shows the total filtration volumes versus square root of time for leakoff tests
conducted using 20 lb/1000 gal borate crosslinked gel (fluid 8) with sample A1 (k∞ = 0.1854 md)
. The time to formation of filter cake is depicted by the change in curvature of the filtration
volume curve indicating a change from permeability controlled filtration to filtercake dominated
filtration. Early formation of filter cake indicates that polymer invasion in the core sample is
limted. The filtrate collected at the core outlet for the 20 lb/1000 gal crosslinked fluid had a
slightly milky color and a viscosity of about 1.5 cp containing slight amounts of polymer.
Figure 5-29: Filtration volumes for for sample A1 with linear gel.

69
Filtration volume vs square root of time for sample B1 with 20 lb /1000 gal fluid is depicted in
Figure 5.30.The effect of permeability fluid loss is shown by the delayed formation of filter cake
and small filtration volumes. Fluid filtrate collected at the outlet was also transparent and a
viscosity of about 1.7 cp containing very little polymer.
Figure 5-30: Filtration volumes for for sample B1 with linear gel.
Fluid loss experiments were also conducted using 40 lb/1000 gal borate crosslinked gel (fluid 9)
with both core wafers from sample A1 and B1. Filtration volumes vs square root of time is
presented in Figure 5-31.At a higher gel loading of 40lb/1000 gal no formation of filtercake was
observed for both core samples.The high viscosity and increased polymer loading allows for very
little leakoff or formation of a recognizable filter cake. The effluent from the core outlet for both
fluids was transparent and polymer free with a viscsoity of 1.14 cp. It is suspected that polymer
invasion into the core is limited.

70
Figure 5-31: Filtration volumes for for samples A1 and B1 with 40 lb/1000 gal borate crosslinked
gel.
5.5.2 Analysis of Two-phase Flow Relative Permeability with Crosslinked Gels
Figure 5-32 shows brine relative permeability curves for sample A1 (k∞ = 0.1854 mD) for 1st
imbibition and drainage cycles after complete saturation with borate crosslinked gel filtrate at 20
and 40 lbm/1000 gal gel loading. It shows that end point relative permeability of 0.8 regardless of
the fluid used to saturate the sample. This indicates that the filtrate composition does not have a
significant effect on liquid relative permeability during fluid invasion and that the flow behavior
comparable to water.Additionally one can observe the irreducible water of saturation from the
curves is about 0.5 and is independent of the saturating fluid in the core sample. This
demonstrates that flow behavior of filtrate from cross-linked gel is comparable to brine. The same
trend is observed in ultra-low permeability sample B1 (k∞ = 0.0005 mD) in Figure 5-33 with no
significant reduction in end-point permeability with gel loading. This indicates that polymer

71
invasion into the low permeability core is very little because of formation of a filter cake and
there is no signicant permeability alteration from the leak-off fluid.
Figure 5-32: Liquid relative permeability with linear gel for sample A1
.
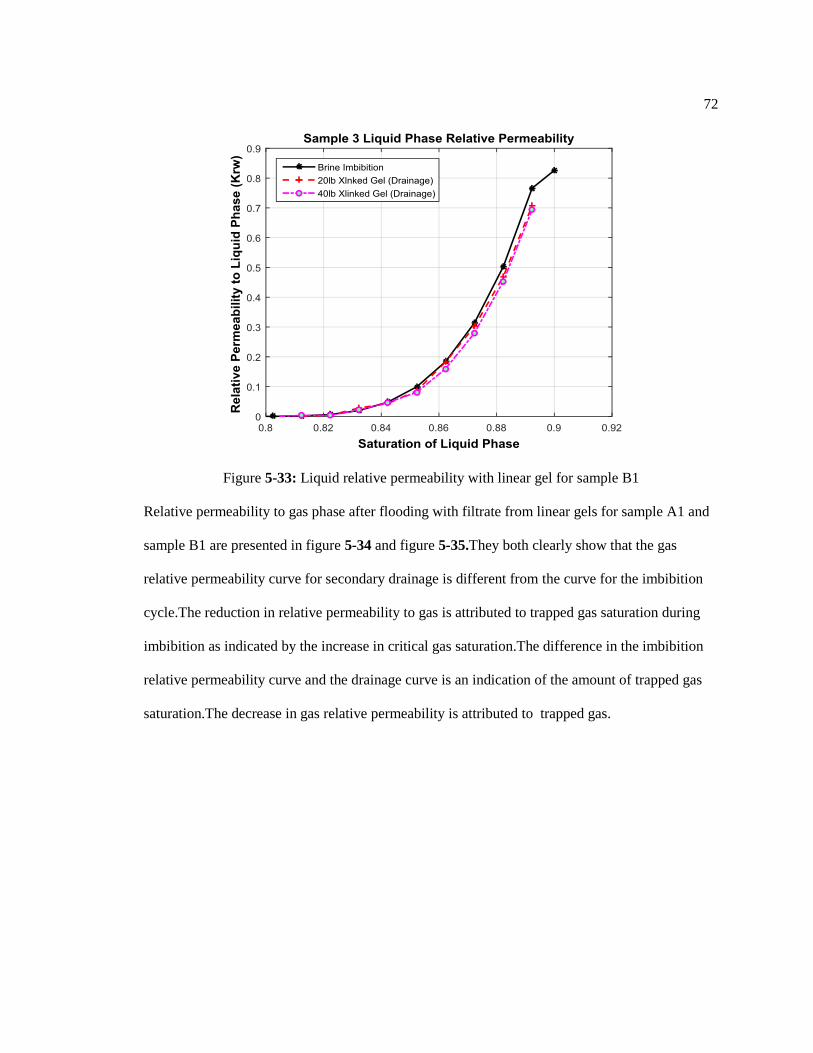
72
Figure 5-33: Liquid relative permeability with linear gel for sample B1
Relative permeability to gas phase after flooding with filtrate from linear gels for sample A1 and
sample B1 are presented in figure 5-34 and figure 5-35.They both clearly show that the gas
relative permeability curve for secondary drainage is different from the curve for the imbibition
cycle.The reduction in relative permeability to gas is attributed to trapped gas saturation during
imbibition as indicated by the increase in critical gas saturation.The difference in the imbibition
relative permeability curve and the drainage curve is an indication of the amount of trapped gas
saturation.The decrease in gas relative permeability is attributed to trapped gas.

73
Figure 5-34: Gas relative permeability with linear gel for sample A1
Figure 5-35: Gas relative permeability with linear gel for sample A1

74
Part II- Multiphase Permeability Evolution with Remediation Additives
Chapter 6
Multiphase Permeability Evolution with Methanol Based Treatment
Solutions
6.0 Abstract
Alcohols have been widely used to improve gas production during completion of
damaged wells in water sensitive formations. However, the mechanisms those govern multiphase
permeability evolution using alcohols in conjunction with the variable composition of filtrate
from different fracturing fluids are not fully understood. This study investigates the effect of
methanol on multiphase permeability evolution in the presence of filtrate from fracturing fluids in
low permeability sandstones by means of specialized core testing techniques.
The experimental methodology employed in this study consists of three sets of
experiments. The first set consists of measurements of surface tension of selected fracturing fluids
at varying concentrations of methanol. The second set consists of gas displacement experiments
conducted on sandstone cores initially saturated with fracturing fluid treated with methanol. Data
obtained from this step include gas flow rate and pore volumes of liquid expelled from the core as
a function of pore volumes of injected gas. The third set consists of effective gas permeability
measurements from pulse decay techniques to obtain gas relative permeability curves.
Results show that for all fracturing fluids, the addition of methanol to fracturing fluid
improves gas displacement flow rate and permeability recovery by two means; increasing the
mobility of the liquid during liquid displacement by gas and increasing the evaporation of the
trapped liquid after the displacement process. Additionally, it is shown that the presence of
friction reducer decreases the amount of liquid expelled and suppresses the recovery of gas
permeability during the evaporation of the trapped liquid in slickwater fluids. Reduction in

75
interfacial tension upon methanol addition did not contribute significantly to improvement in gas
relative permeability for all fracturing fluids tested.
This study quantifies the effect of methanol addition on rock-fluid and fluid-fluid
interactions for the different fracturing fluids and determines the mechanisms that govern
multiphase permeability in sandstone rocks. The obtained data is useful for model assisted
analysis of post-fractured performance and to optimize fracturing fluid-additive selection to
mitigate damage to aqueous phase trapping in low permeability sandstones.
6.1 Introduction
Control and remediation of aqueous phase trapping are one of the most important issues
that need to be addressed for efficient stimulation of low permeability sands. Maximizing
ultimate gas recovery from tight sands depends on effective selection of fracturing fluid additives
and design of fracture treatment prior to a stimulation operation. Wrong selection of the
fracturing fluid and/or additives can end up contributing to permeability impairment. A review of
literature returns numerous studies with different fluid additives and recommended practices that
have been proposed to mitigate and correct damage from phase trapping. Most commonly used
additives include light alcohols (methanol), surfactants and mutual solvents. Other types of
treatments include viscoelastic surfactants and foamed fracturing fluids with nitrogen and carbon
dioxide gas. However their effectiveness is limited to specific rock types at various in- situ
reservoir conditions. This indicates that there is no clear cut, ideal fluid system for all formations
in mitigating phase trapping and effective remediation fluids should be validated with core
analysis and laboratory tests.
For successful remediation of formation damage from aqueous phase trapping , it is
imperative to understand the response of the formation to the treating fluids by conducting core
analysis and laboratory testing with the remediating fluid additives prior to application in the
field. Laboratory tests help provide information about mechanisms that influence permeability

76
improvement in the rock sample using the treatment additives. One important mechanism that has
not been examined in previous studies is multiphase permeability evolution upon addition of
remediation fluid additives.
Alcohols have been widely used to improve gas productivity during completion of wells
in water sensitive formations. Mccleod and Coulter (1966) proposed the use of alcohol contained
in aqueous stimulation fluids to stimulate problem wells in sandstone formations. They concluded
that alcohols increase water recovery during cleanup and gas rate. Experimental studies by
Abrams and Vingar (1983) claimed that the addition of alcohols to brine does not significantly
improve gas flowrate when final drawdown in greater than existing capillary pressure gradient in
the formation. However, Mahadevan and Sharma ( 2003) concluded that the addition of alcohols
to stimulation treatment definitely contributes to gas productivity by reduction in interfacial
tension and evaporation of the trapped water. They suggested that water removal upon addition of
methanol occurs in two stages; a displacement phase where water is expelled by viscous forces
and an evaporation phase that follows the displacement phase and lasts a long time.
One significant drawback associated with treatment using alcohols is that the cleanup is
temporary and the well has to be retreated to improve gas flowrate. Al-Anazi, et al (2005) used a
combination of field tests and laboratory experiments to show that gas productivity can be
improved by a factor of two after treatment with methanol for the first four months and by 50%
thereafter. Another major drawback associated with the use of solvent is brine precipitation
associated with evaporation of water. Zuluaga and Monsalve (2003) demonstrated that increased
evaporation upon methanol addition results in brine precipitation. This precipitation results in
reduction in absolute permeability and can reduce gas productivity. A review of the published
literature reveals that no work has been done to investigate multiphase permeability evolution
using methanol additive with the fracturing fluid filtrate that leaks off into the rock matrix during
stimulation.

77
In this chapter, research is focused on laboratory tests designed to determine and quantify
the effect of alcohols as remediation fluid additives on multiphase permeability evolution in low
permeability sandstones with the fracturing fluid filtrate. Methanol, a commonly used alcohol will
be used to treat selected fracturing fluids. The impact of treated fracturing fluid filtrate on
multiphase permeability during fluid invasion and cleanup will be investigated by means of
specially designed laboratory experiments.
6.2 Experimental Methodology
Laboratory experiments in this part of the research study were focused on determining
and quantifying the processes that govern multiphase permeability evolution of fracturing fluids
treated with methanol to mitigate phase retention. Experimental methodology used to investigate
the remediation fluids consists of two steps:
1. Measuring the surface tension of the selected mixtures of treated polymers solutions
with fluid additives at varying concentrations.
2. Gas displacement experiments with sandstone cores initially saturated with the treated
fracturing fluids. Data obtained from these experiments will be used to characterize gas
permeability evolution during cleanup. Experiments are repeated for varying concentrations of
the fluid additive.
6.2.1 Porous Media
Samples used in this study consist of six cylindrical cores cut from homogenous blocks of
the Scioto sandstone, native to the Oriskany sandstone formation in Ohio. All cores have the
following properties: L= 2.5 in., ø = 7.26%, k∞ = 0.1854 md, PV = 3.79 cm3.

78
6.2.2 Test Fluid Systems
Three different polymer fluid systems were used to investigate the effect of methanol on
multiphase relative permeability during filtrate invasion and gas flowback in sandstone cores. The
fluids investigated were slick water, linear gel and borate crosslinked fluid systems. Each fluid
system consists of fluid mixtures with varying concentrations of methanol. Tables 5-1 to 5-3
presents the selected fluids used for this study. The synthetic brine is used to represent formation
water is similar to that obtained in the Oriskany reservoir. The prepared brine had a total
dissolved solids (TDS) content of 35500 ppm which contains 32 g/L of NaCl,1.2 g/L of
CaCl2,0.78 g/l of MgCl2,0.31 g/L of KCl and 1.1 g/L of NaHCO3. Helium gas at room
temperature was used in these experiments .
Table 6-1. Slickwater fluid systems with Methanol
Name Base Fluid Additives
Fluid 1 95.9 vol % Water,3% KCl,
0.1% Polyacrylamide
1% MeOH
Fluid 2 94.4 vol % Water,3% KCl,
0.1% Polyacrylamide
2.5% MeOH
Fluid 3 91.9 vol% Water, 3% KCL
0.1% Polyacrylamide
5% MeOH
Fluid 4 86.9 vol% Water, 3% KCL
0.1% Polyacrylamide
10% MeOH

79
Table 6-2. Linear Gel fluid systems with Methanol
Name Type Base
Fluid
Additives
Fluid 5 20 lb. Linear Gel 94.5 vol%Water,
3%KCL
2.5% MeOH
Fluid 6 20 lb. Linear Gel 92 vol% Water,
3% KCL
5 % MeOH
Fluid 7 20 lb. Linear Gel 87 vol% Water,
3% KCL
10% MeOH
Table 6-3. Crosslinked gel fluid systems with Methanol
Name Type Base Fluid Additives
Fluid 8 20 lb. Linear Gel, 1.5 gptg
crosslinker
94.5 vol% Water,
3% KCL
2.5% MeOH
Fluid 9 20 lb. Linear Gel, 1.5 gptg
crosslinker
92 vol% Water,
3% KCL
5 % MeOH
Fluid 10 20 lb. Linear Gel, 1.5 gptg
crosslinker
87 vol% Water,
3% KCL
10% MeOH

80
6.2.3 Surface Tension Measurement Procedure
In this study, surface tension is obtained using a combination of capillary rise method and sessile
drop method. Using the capillary rise method, a glass capillary tube placed in the test fluid will
cause the fluid to rise until the weight is balanced the vertical component of the surface tension
between the fluid and the glass surface .The relationship between the height of the fluid and
surface tension is given by Eq. 6.1
………………………………………..Eq. 6.1
where,
τla = interfacial tension (dynes/cm)
ϴ = contact angle (dynes/cm)
ρ = contact angle (dynes/cm)
g = gravity (980 cm/s2 )
r = radius of tube (cm)
ht = height of the liquid rise in capillary tube (cm)
Eq. 6.1 requires contact angle which can be obtained indirectly. Using the sessile drop
method, the maximum height of a droplet of the same fluid that can be maintained on a glass
surface using Eq. 6.2
……………………………..........Eq. 6.2

81
where,
hd = height of the droplet (cm)
Substituting Eq. 6.1 into Eq. 6.2 few obtain:
…………………………………………....Eq. 6.3
The surface tension is expressed using equation 6.4
) ………………………………………………..Eq. 6.4
Surface tension measurements were obtained for the selected fluid mixtures at room
temperature and atmospheric pressure. The inner diameter of the capillary tube is 0.0475cm.
Measurements of the height of liquid rise in the capillary tube and height of liquid drop on a
similar gas surface were obtained and used to calculate surface tension using Eq. 6.4.Three
measurements were taken for each fluid solution and the average was reported.
6.2.4 Multiphase Permeability Flow Test
Multiphase permeability flow test consists of gas displacement experiments conducted to
displace liquid from cores originally saturated with the fracturing fluid filtrate from the selected
test fluid systems. The saturated core represents potential saturation conditions in invaded zone
during hydraulic stimulation. The experiments were conducted in two steps. In the first step, gas
displacement experiments are conducted with a specified pressure gradient over the core sample.
Gas flow rate, pore volumes of gas injected and expelled liquid data are obtained in this step. In
the second step, gas relative permeability measurements are obtained using pulse decay
techniques at different liquid saturations of the core sample. Pulse decay permeametry is used to
measure gas relative permeability .This approach minimizes capillary end effects predominant in
steady state flow experiments with low permeability samples.
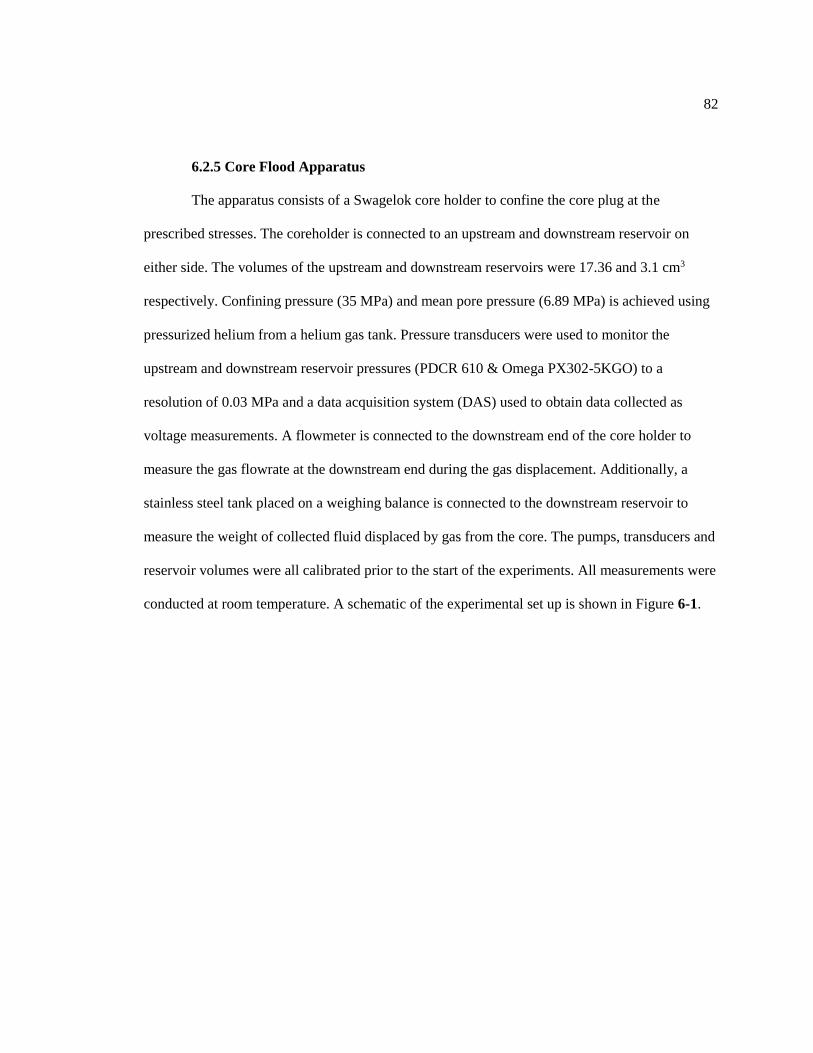
82
6.2.5 Core Flood Apparatus
The apparatus consists of a Swagelok core holder to confine the core plug at the
prescribed stresses. The coreholder is connected to an upstream and downstream reservoir on
either side. The volumes of the upstream and downstream reservoirs were 17.36 and 3.1 cm3
respectively. Confining pressure (35 MPa) and mean pore pressure (6.89 MPa) is achieved using
pressurized helium from a helium gas tank. Pressure transducers were used to monitor the
upstream and downstream reservoir pressures (PDCR 610 & Omega PX302-5KGO) to a
resolution of 0.03 MPa and a data acquisition system (DAS) used to obtain data collected as
voltage measurements. A flowmeter is connected to the downstream end of the core holder to
measure the gas flowrate at the downstream end during the gas displacement. Additionally, a
stainless steel tank placed on a weighing balance is connected to the downstream reservoir to
measure the weight of collected fluid displaced by gas from the core. The pumps, transducers and
reservoir volumes were all calibrated prior to the start of the experiments. All measurements were
conducted at room temperature. A schematic of the experimental set up is shown in Figure 6-1.

83
Figure 6-1: Schematic of coreflood apparatus
6.2.6 Core Flood Procedure
The first stage of multiphase permeability experiments involves determining the
effectiveness of cleanup of the core sample by measuring the rate of increase of gas flow rate and
liquid produced from a core saturated with fracturing fluid. The experimental procedure for the
first stage consists of the following steps:
1- Initial saturation of core with brine and displacement with gas to connate water of
saturation.
2-Measurement of Klinkernberg permeability at connate water of saturation
3- Injection and saturation of core with fracturing fluid to 100% liquid saturation.
4-Placing the core in sleeve of core holder and applying confining pressure of 35 Mpa .
5- The gas flow rate at a preset pressure drop is measured using a downstream flowmeter
while the amount of liquid expelled is weighed using a collection vessel placed on a weighing
balance.
The second stage of the multiphase flow tests involves measuring gas relative
permeability using pulse decay methods. Pulse decay technique minimizes capillary end effects

84
predominant in permeability measurements with low permeability rocks. The experimental
procedures for the second stage of measurements consist of the following steps:
1- Injection /saturation of core with fracturing fluid and evaporation to target liquid
saturation.
2- Enclosing the core in air tight bottle to achieve fluid redistribution.
3-Core is allowed to evaporate, left to stand in a bottle and weighed to obtained average
fluid saturation.
4- Weighing of the core to calculate target saturation using mass balance.
5-Effective permeability to gas is measured using gas pulse decay method.
6-Steps 3, 4 and 5 are repeated for varying liquid saturations until connate saturation is
achieved.
The measured effective permeability to gas is normalized to endpoint permeabilities to
generate relative permeability curves. Relative permeability measurements using this approach
gives relatively accurate estimates of water saturation with gas permeability compared to the
steady state method.
6.3 Results and Discussions
Surface tension measurements and multiphase permeability flow tests were conducted
with slickwater at various concentrations of methanol. These tests were conducted using filtrate
from fracture fluid solutions using methanol as remediation additive to mitigate water block in
low permeability sandstones.
6.3.1 Surface Tension Measurements
Surface tension for slickwater, linear gel and cross-linked gel fluids were measured over
range of methanol concentrations. The curves of surface tension of each fluid as a function of
methanol concentration are plotted in Figure 6.3 with brine as base case. It also shows higher
surface tension for slickwater compared to brine. High surface tension values for slickwater is

85
attributed to polar nature of friction reducer (polyacrylamide molecules) present in the fluid
which increases the adhesion tension and wettability to the solid surface. On the other hand,
values of surface tension for filtrate from linear and crosslinked gel fluids are comparable to
brine. The formation of polymer cake during the leakoff of process in low permeability cores
yields a clear filtrate with similar properties to brine. In general the surface tension decreases with
increasing methanol concentration, thus adsorption at the gas-liquid interface..
Figure 6-2: Surface tension of fluid filtrate as a function of methanol concentration
6.3.2 Multiphase Permeability Evolution
Multiphase permeability evolution was investigated with two methods; steady state gas
displacements and gas pulse decay permeability measurements. Measured data from steady state
gas displacements include outlet gas flowrate, pore volumes of gas injected and pore volumes of
liquid expelled. Gas relative permeability curves for various concentrations of methanol for each
fluid system were obtained from pulse decay experiments.

86
6.3.3 Effect of Methanol on Slickwater
Figure 6-4 presents normalized gas flowrate at the outlet end of core as a function the
number of pore volumes of gas injected with varying concentrations of methanol for a slickwater
saturated core.
Figure 6-3: Normalized gas flowrate as function of pore volumes of gas for slickwater
saturated core.
Gas flowrate shows a steady and rapid increase for the first 200 pore volumes of gas
injected. This is followed by a period of slow continuous increase in gas flowrate which
progresses to about 50,000 pore volumes of injected gas before leveling out. The first period
corresponds to the removal of liquid from the core by gas displacement while the second period
corresponds to removal of liquid by evaporation with gas. The observed trends are consistent with
the results Kamath and Laroche (2000) obtained using brine and methanol. The effect of
methanol on gas flowrate becomes noticeable at about 1000 pore volumes of gas injected.
Improvement in gas flowrate for 10% vol methanol is by a factor of 1.73 while moderate increase

87
was observed for 5% methanol by a factor of 1.2. There is no noticeable difference in gas
flowrate with fluid with 2.5 % methanol compared to pure slickwater fluid.
Figure 6-4 shows expelled liquid by gas displacement as a function of pore volumes of
gas injected in a slickwater saturated core at different methanol concentrations. The liquid
displacement regime is indicated by the leveling of the displaced liquid curve which corresponds
to about 300 pore volumes of injected gas. This is agrees with the displacement regime trend
observed in the gas flowrate plot. The effect of methanol on displaced liquid is also noticeable, as
the amount of liquid displaced increases with increasing methanol concentration. For pure
slickwater, the maximum amount of liquid displaced is about 30% of the core pore volume. 5%
volume methanol barely increases the amount of liquid displaced slightly while 45% pore volume
is recovered for methanol concentration of 10%.This clearly indicates that methanol improves the
mobility of the slickwater fluid which aids the displacement process.
Figure 6-5 presents the gas relative permeability as a function of gas saturation obtained
from gas pulse decay experiments for the different methanol concentrations. There is no
significant difference in gas relative permeability curves until about 30% gas saturation which
corresponds to the displacement phase. This suggests that methanol does not contribute to
improvement in gas relative permeability during the displacement phase. The effect of methanol
becomes apparent after 30% gas saturation where there is a separation of the relative permeability
curves with the 10% methanol curve showing a notable increase. This increase in gas relative
permeability is attributed to the increased mobility of the liquid phase at the end of the
displacement process and agrees with earlier observations from the displaced liquid curves in
Figure 6-4. As the evaporation period progresses, there gas relative permeability eventually peaks
at 90% gas saturation which corresponds to about 50,000 pore volumes of gas injected. This
indicates that the increased volatility of the trapped liquid due to methanol is driving the
improvement in gas relative permeability.

88
Figure 6-4: Displaced liquid as function of pore volumes of gas for slickwater saturated core.
Figure 6-5: Relative permeability to gas as a function of gas saturation for slickwater
saturated core
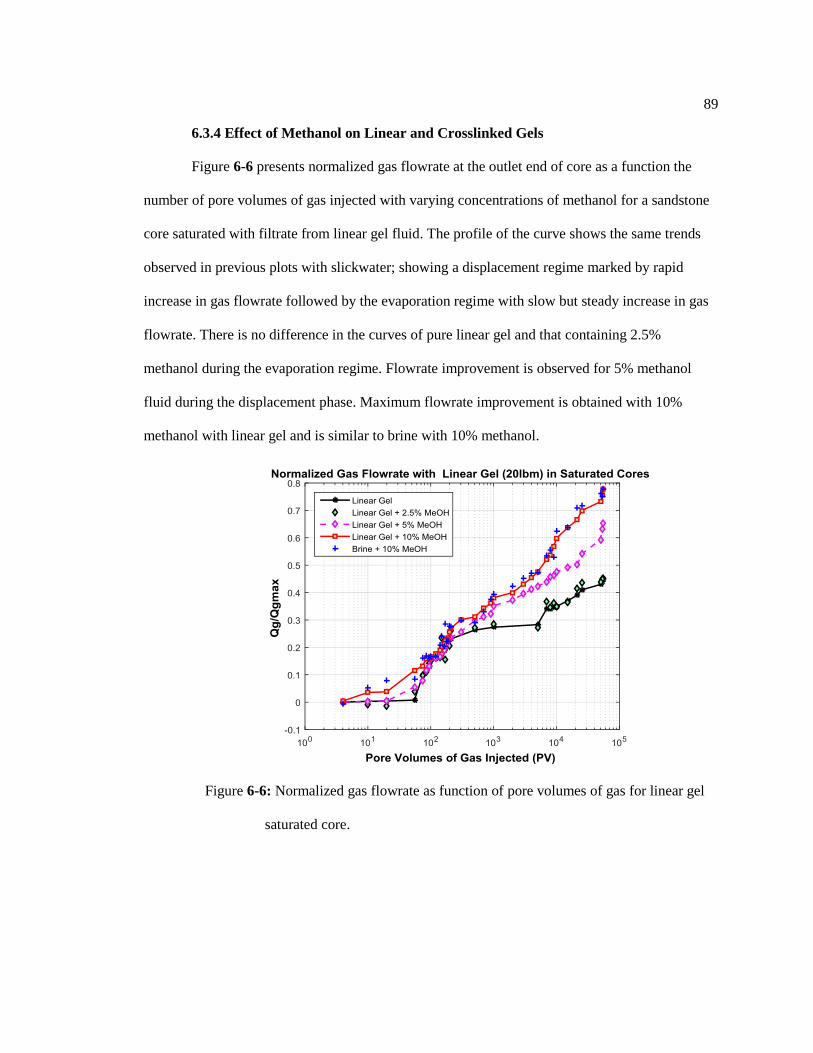
89
6.3.4 Effect of Methanol on Linear and Crosslinked Gels
Figure 6-6 presents normalized gas flowrate at the outlet end of core as a function the
number of pore volumes of gas injected with varying concentrations of methanol for a sandstone
core saturated with filtrate from linear gel fluid. The profile of the curve shows the same trends
observed in previous plots with slickwater; showing a displacement regime marked by rapid
increase in gas flowrate followed by the evaporation regime with slow but steady increase in gas
flowrate. There is no difference in the curves of pure linear gel and that containing 2.5%
methanol during the evaporation regime. Flowrate improvement is observed for 5% methanol
fluid during the displacement phase. Maximum flowrate improvement is obtained with 10%
methanol with linear gel and is similar to brine with 10% methanol.
Figure 6-6: Normalized gas flowrate as function of pore volumes of gas for linear gel
saturated core.
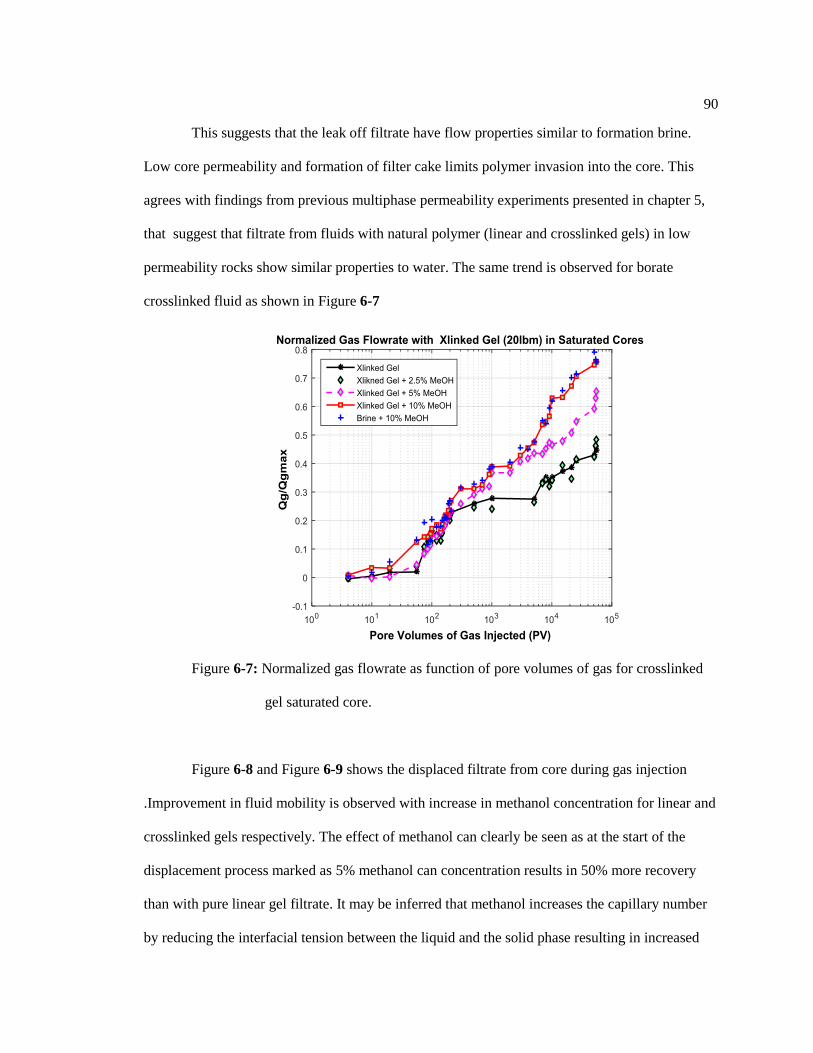
90
This suggests that the leak off filtrate have flow properties similar to formation brine.
Low core permeability and formation of filter cake limits polymer invasion into the core. This
agrees with findings from previous multiphase permeability experiments presented in chapter 5,
that suggest that filtrate from fluids with natural polymer (linear and crosslinked gels) in low
permeability rocks show similar properties to water. The same trend is observed for borate
crosslinked fluid as shown in Figure 6-7
Figure 6-7: Normalized gas flowrate as function of pore volumes of gas for crosslinked
gel saturated core.
Figure 6-8 and Figure 6-9 shows the displaced filtrate from core during gas injection
.Improvement in fluid mobility is observed with increase in methanol concentration for linear and
crosslinked gels respectively. The effect of methanol can clearly be seen as at the start of the
displacement process marked as 5% methanol can concentration results in 50% more recovery
than with pure linear gel filtrate. It may be inferred that methanol increases the capillary number
by reducing the interfacial tension between the liquid and the solid phase resulting in increased

91
liquid mobility.10% methanol concentration results in 45% pore volume of liquid expelled at the
end of displacement compared to about 32 % pore volume for linear gel filtrate without
methanol.
Gas relative permeability curves for linear gel saturated core as a function of gas
saturation is presented in Figure 6-10.Measured relative permeability data is obtained from pulse
decay experiments for linear gel.
Figure 6-8: Displaced liquid as function of pore volumes of gas for linear gel saturated
core.

92
Figure 6-9: Displaced liquid as function of pore volumes of gas for crosslinked gel
saturated core.
Figure 6-10: Relative permeability to gas as a function of gas saturation for linear gel
saturated core
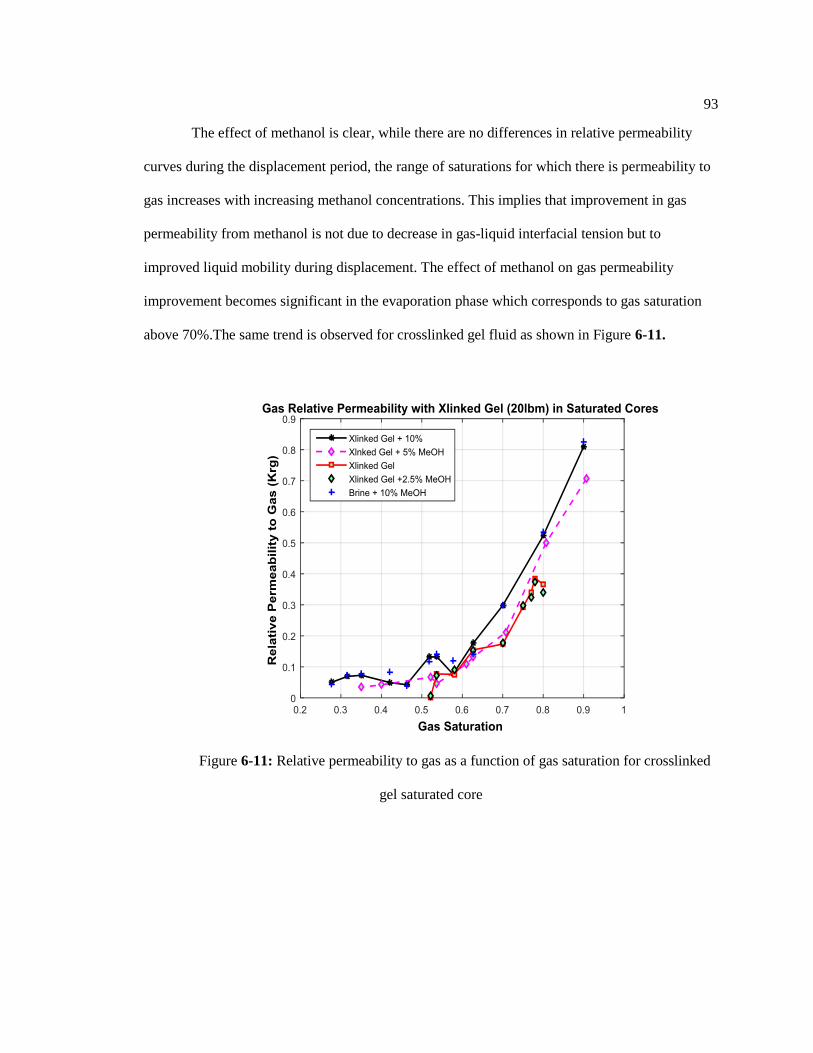
93
The effect of methanol is clear, while there are no differences in relative permeability
curves during the displacement period, the range of saturations for which there is permeability to
gas increases with increasing methanol concentrations. This implies that improvement in gas
permeability from methanol is not due to decrease in gas-liquid interfacial tension but to
improved liquid mobility during displacement. The effect of methanol on gas permeability
improvement becomes significant in the evaporation phase which corresponds to gas saturation
above 70%.The same trend is observed for crosslinked gel fluid as shown in Figure 6-11.
Figure 6-11: Relative permeability to gas as a function of gas saturation for crosslinked
gel saturated core

94
6.4 Conclusions
This study investigates the effect of alcohol on multiphase permeability evolution in sandstone
core samples flooded with filtrate from selected fracturing fluids. The fracturing fluid systems
used to flood the core sample include slickwater, linear gels and borate crosslinked gel fluids.
Methanol was used a remediation additive to mitigate damage from aqueous phase trapping.
Multiphase permeability flow tests were conducted using steady state gas displacement methods
and gas pulse decay permeametry. Experimental data include normalized gas flowrate, pore
volumes of gas injected and pores volumes of liquid expelled which were obtained from steady
state gas displacement tests. Relative permeability curves were generated with data obtained from
gas pulse decay experiments.
The major conclusions of this chapter are:
1) For slickwater fluids, our results show that with 5% and 10 % methanol
concentration, the filtrate recovery increased from 33% to 45% and gas flowrate
increased by a factor of 1.25 and 1.73. Gas endpoint permeability increased from
0.45 to 0.52 and 0.78 for 5% and 10 % methanol concentrations respectively
2) For linear and borate crosslinked gels , results show that with 5% and 10 % methanol
concentrations the pore volumes of liquid recovered increased from 38% to 44% and
gas flowrate increased by a factor of 1.44 and 1.71. Gas endpoint permeability
increased from 0.45 to 0.7 and 0.89 for 5% and 10 % methanol concentrations
respectively
3) The presence of the friction reducer in fracturing fluid filtrate depresses the endpoint
permeability in slickwater fluids and reduced amount of liquid recovered compared
to linear gel and brine.
4) Multiphase permeability evolution is upon addition of methanol is controlled by
increased mobility of the liquid during the displacement phase and increased

95
volatility of connate liquid during the evaporation phase. Interfacial tension does not
contribute significantly to gas permeability recovery.

96
Chapter 7
Impact of Surfactant on Multiphase Permeability Evolution with Surfactant
Treatment of Fracturing Fluids in Low Permeability Sandstones
7.0 Abstract
Improper selection and design of surfactant treatments intended to remove damage
aqueous phase trapping often ends up causing other types of formation damage. This is due to our
limited understanding of the processes that govern rock-fluid and fluid-fluid interactions between
surfactants, fracturing fluid and the formation during invasion and flowback of the injected fluids
in the rock matrix. This study focuses on the laboratory investigation of the processes governing
multiphase permeability evolution during invasion of fracturing fluids treated with surfactants in
low permeability sandstones.
Two surfactant chemicals, Triton X-100, a hydrocarbon surfactant and Novec FC-4430, a
fluorosurfactant, were used to treat filtrate from slickwater, linear gel and borate crosslinked gel
fluids. Multiphase experiments were conducted on sandstones cores flooded with the treated
fluids. The experiments consist of steady state gas displacements and pulse decay permeability
measurements. The obtained data include gas flow rate, pore volumes of liquid expelled and gas
relative permeability curves.
Experimental results indicate that treatments with fluorosurfactant improved liquid and
gas permeability recovery for all fracturing fluids. Additionally, maximum liquid and gas
permeability recovery was achieved when the core was pretreated with fluorosurfactant.
Treatment with Triton X-100 did not improve gas permeability and resulted in decreased liquid
recovery. Our results show that multiphase permeability evolution with surfactant treatment is
driven by wettability alterations rather than reduction in interfacial tension.

97
Multiphase permeability data could be used in modeling of post fracture well
performance and formation damage assessment in low permeability sandstones. The new findings
will serve as a guide for optimizing fracturing fluid/surfactant treatments and completion
strategies in tight gas reservoirs.
7.1 Introduction
Surfactants are widely used to mitigate formation damage caused by completion fluids
associated with drilling, completion, stimulation and workover operations in conventional
reservoirs. In low permeability reservoirs, formation damage from aqueous phase trapping is
related to the high capillary pressure gradients that exist due to small pore sizes in the porous
media. In order to remove trapped liquid phase in low permeability rocks, one of the key
objective is to reduce the interfacial tension between the water and gas phase or the oil and water
phase. This reduces the capillary pressure and allows removal of the aqueous phase to a lower
irreducible water of saturation during cleanup. Lower interfacial tension also improves the
relative permeability of the oil or gas phase. A variety of surfactants have been utilized to obtain
minimal interfacial tension between water and oil in oil reservoirs. This helps mobilize the
trapped phase and improve the relative permeability of oil. Significant presence of clay in a
formation may reduce effectiveness of a surfactant treatment due to adsorption of the surfactant to
clay surface. This may result in reduced contact area for the surfactant to reach the damaged zone
and require large volumes of surfactants. In gas reservoirs, the ability of chemical surfactants to
reduce interfacial tension is uncertain due to molecular disparity between water and gas phases.
Another way to reduce capillary pressure is to change the wettability of the rock to a non-
wetting state. From Young-Laplace equation, increasing the contact angle between water and
rock surface results in the lowering of the capillary pressure. Therefore, changing the wettability
of the rock to a non-wetting state allows the trapped water to flow through the middle of the pores

98
during cleanup, leading to increased water recovery and improved gas permeability. This
approach is currently the subject of intense research by numerous investigators in the literature.
Laboratory and field studies conducted by Penny et al (1983) demonstrated that non-
wetting water agents can increase water recovery of injected fracturing fluids. Field application of
the non-wetting agents during hydraulic fracture treatment showed an increase in gas productivity
by a factor of 3 compared to offset wells. In laboratory experiments conducted by Li and
Firoozabadi (2000), fluorochemicals were used to alter the wettability of the formation from
water wet to intermediate wetting state. They suggested that improvement in gas relative
permeability in condensate wells can be achieved by altering the wettability from water wet to
gas wet near the wellbore. Tang and Firoozabadi (2002) used fluoro chemicals in water to alter
the wettability from water-wet to intermediate –wet using Berea sandstone cores. The
effectiveness of these fluorochemicals was limited to a maximum temperature of 90oC.
Kumar et al (2006) demonstrated that fluorosurfactants can be used to improve both gas
and condensate relative permeability at reservoir conditions for Berea and reservoir sandstone
cores. Additional laboratory experiments conducted by Panga et al (2006), evaluated 5 different
chemicals for their ability to alter wettability and prevent water block. Experimental studies
conducted by Fahes and Firoozabadi (2007) showed that certain fluorochemicals exhibit good
wettability alteration characteristics at higher temperatures (140oC). Bang et al (2008) used
fluorinated surfactants in solvent mixtures with isopropanol and 2-propylene glycol to remove
damage caused by water blocks and condensate in propped fractures. Feng et al (2012) using
fluorine containing acrylate polymer emulsion demonstrated that wettability of porous media can
be altered from strongly liquid-wet to gas wet.
While significant research has been devoted to investigating wettability alteration using
surfactant in water or solvent mixtures, very little work has been conducted to investigate
wettability alteration using surfactant with the fracturing fluid filtrate that leaks off into damaged

99
zone in low permeability sandstones. The objective of this study is to investigate the role that
interfacial tension, wettability and relative permeability have on removal of trapped liquid and
improving gas permeability using surfactants and fracturing fluid filtrate in low permeability
sandstones.
7.2 Experimental Methodology
Laboratory experiments in this part of the research study were focused on determining
and quantifying the processes that govern multiphase permeability evolution of fracturing fluids
treated with surfactant fluid additives to mitigate phase retention. Experimental methodology
employed in this study consists of the following steps:
1. Measuring the surface tension of the selected mixtures of treated polymers solutions
with surfactant solutions at varying concentrations.
2. Gas displacement and relative permeability measurements in cores initially saturated
with the treated fracturing fluids treated with selected surfactants. Data obtained from these
experiments will be used to characterize gas permeability evolution during cleanup for fracturing
fluids treated with surfactant solutions. Experiments are repeated for varying concentrations of
the surfactant additive.
3. Pretreating dry sandstone cores with surfactant solution and measuring gas relative
permeability shortly after the treatment. The data will be used to characterize gas permeability
evolution during cleanup for cores pre-treated with surfactant solutions before invasion of
fracturing fluid filtrate.

100
7.2.1 Porous Media
Samples used in this study consist of two cylindrical cores cut from homogenous blocks
of the Scioto sandstone, native to the Oriskany sandstone formation in Ohio. The cores have the
following petrophysical properties: L= 2.5 in., ø = 7.2%, k∞ = 0.18 mD, PV = 3.8 cm3.
7.2.2 Surfactant Chemicals
In this experimental research two surfactants chemicals including a nonionic hydrocarbon
surfactant (Triton X-100 ) and nonionic fluorinated polymer surfactant (Novec FC4430) were
used as remediation treatment additives to improve gas permeability during cleanup. Triton X-
100 is non-ionic ocyl phenol-ethylene oxide (C14H22O(C2H4O)10) liquid with molecular weight of
646,85 g/mol. It is a transparent, pale, amber and viscous liquid that is soluble in water. Triton X-
100 chemical was obtained from Dow chemical company. Novec FC 4430 is a non-ionic
polymeric flourinated surfactant that contains a fluoroalkyl tail (Rf) that is hyrophophobic tail and
alylene oxide hydrophilic head.The liquid is slightly hazy in appearance and viscous with a
density of 1.14 g/cm3 .The fluoroalky tail gives the surfactant both water-repelling characteristics
and provides low surface tension and excellent wetting characteristics. Due to its polymeric
structure,multiple points of attachmentss when placed in contact with a solid substrate allows the
surfactant to be durable.Figure 7-1 a and Figure 7-1b show the structure of the hydrocarbon
surfactant (Triton-X 100) and fluorosurfactant( Novec FC4430) respectively.
Figure 7-1: Chemical structure of Triton X-100 (left) and structure of Novec FC4430 (right)

101
7.2.3 Surfactant Treatment Solutions
The solubility of nonionic surfactants tends to decrease with increasing water
concentration and temperature until it reaches a cloud point. Delivering surfactant treatment with
water could end up causing precipitates at downhole conditions and leading to more permeability
impairment. In this study methanol was used as solvent to deliver the surfactant treatment. This
ensures that the mixture is completely miscible and soluble with any connate water of saturation
in the core during the flooding process. Table 7-1 presents the composition of the treatment
solution used in this study.
Table 7-1: Composition of Novec FC4430 surfactant solution
Component Weight (%)
FC4430 2
D.I Water 10
Methanol 88
7.2.4 Fracturing Fluid Test Mixtures
The polymer systems investigated were slick water; linear gel and borate crosslinked
fluid systems. Core flooding experiments were conducted on cores with fracturing fluid treated
with the surfactant solutions and for cores pretreated with surfactant solution before flooding with
fracturing fluid. Tables 7-2 -7.4 present the composition of the treated fracturing fluid mixtures.
Synthetic brine was used to represent formation water similar to that obtained in the Oriskany
reservoir. The prepared brine had a total dissolved solids (TDS) content of 35500 ppm which
contains 32 g/L of NaCl,1.2 g/L of CaCl2,0.78 g/l of MgCl2,0.31 g/L of KCl and 1.1 g/L
of NaHCO3.Concentrations of Novec FC-4430 used in this study were 1.5% and 2.5% by
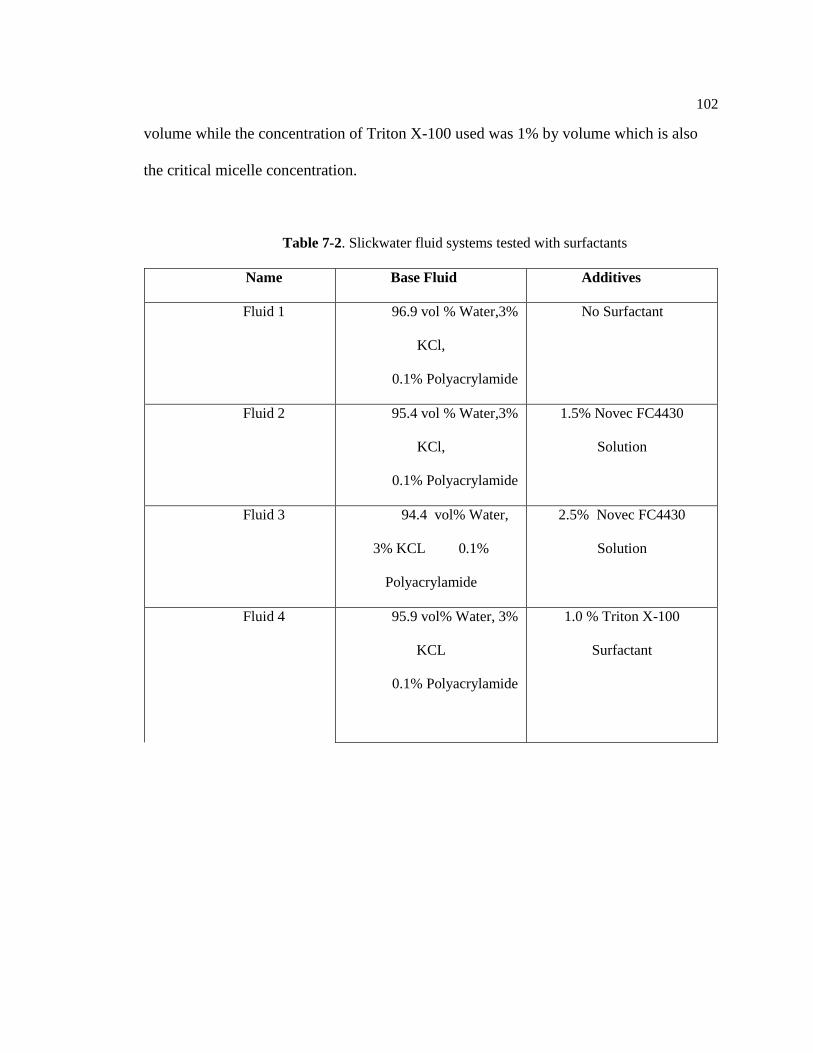
102
volume while the concentration of Triton X-100 used was 1% by volume which is also
the critical micelle concentration.
Table 7-2. Slickwater fluid systems tested with surfactants
Name Base Fluid Additives
Fluid 1 96.9 vol % Water,3%
KCl,
0.1% Polyacrylamide
No Surfactant
Fluid 2 95.4 vol % Water,3%
KCl,
0.1% Polyacrylamide
1.5% Novec FC4430
Solution
Fluid 3 94.4 vol% Water,
3% KCL 0.1%
Polyacrylamide
2.5% Novec FC4430
Solution
Fluid 4 95.9 vol% Water, 3%
KCL
0.1% Polyacrylamide
1.0 % Triton X-100
Surfactant

103
Table 7-3. Linear gel fluid systems tested with surfactants
Name Type Base
Fluid
Additives
Fluid 5 20 lb.
Linear Gel
97 vol% Water,
3%KCL
No Surfactant
Fluid 6 20 lb.
Linear Gel
95.5 vol% Water,
3% KCL
1.5% Novec FC-4430
Solution
Fluid 7 20 lb.
Linear Gel
94.5 vol% Water,
3% KCL
2.5% Novec FC-4430
Solution
Fluid 8 20 lb.
Linear Gel
96 vol% Water,
3% KCL
1.0 % Triton X-100
Surfactant

104
Table 7-4. Crosslinked gel fluid systems tested with surfactants
Name Type Base Fluid Additives
Fluid 8 20 lb. Linear Gel,
1.5 gptg crosslinker
97 vol% Water,
3% KCL
No Surfactant
Fluid 9 20 lb. Linear Gel,
1.5 gptg crosslinker
95.5 vol% Water,
3% KCL
1.5% Novec FC-
4430 solution
Fluid
10
20 lb. Linear Gel,
1.5 gptg crosslinker
94.5 vol% Water,
3% KCL
2.5% Novec FC-
4430 solution
Fluid
11
20 lb. Linear Gel,
1.5 gptg crosslinker
96 vol% Water,
3% KCL
1.0 % Triton X-
100 Surfactant
7.2.5 Surface Tension Measurement Procedure
Measurements of surface tension were obtained for two surfactant solutions as a function
of surfactant concentration in brine. The brine solution was prepared using 3.2% sodium chloride
which is similar to composition obtained in formation fluid. Surface tension was measured using
the capillary rise method at room temperature and atmospheric pressure. Three measurements
were taken for each surfactant concentration and the average was reported.

105
7.2.6 Multiphase Permeability Flow Tests
Multiphase permeability flow tests consist of two sets of experiments conducted in two
steps. The first set of experiments consist multiphase flow tests conducted cores originally
saturated with the fracturing fluid filtrate treated with Triton X-100 and Novec FC4430 solutions.
The composition of the filtrate used to saturate the core is presented in Table 7-2, 7-3 and 7-4.In
the first step, multiphase flow tests are conducted using steady state gas displacement methods
while gas relative permeability measurements are conducted in the second step using gas pulse
decay techniques. Measured data from steady state gas displacements consists of gas flow rate,
injected pore volumes of gas injected and expelled liquid data while gas relative permeability is
obtained from pulse decay technique.
In the second set of experiments, the core sample is pretreated with the Novec FC-4430
solutions before saturation with fracturing fluid filtrate. The dry core sample is first flooded with
Novec FC-4430 solution before saturation with fracturing fluid filtrate without any surfactant.
Steady state gas displacement is conducted in the first step to obtain gas flow rate, injected pore
volumes of gas injected and expelled liquid data .The second step, pulse decay measurements are
conducted to obtain gas relative permeability at different saturations. The whole procedure is
repeated for Novec FC-4430 surfactant solution.
7.2.7 Coreflood Procedures
In the first set of experiments, the fracturing fluid used to saturate the core is treated with
the two surfactant solutions. Multiphase flow test are then conducted in two stages. The first stage
consists of steady sate gas displacements experiments to determine the effectiveness of cleanup of
the core sample by measuring the rate of increase of gas flow rate and liquid produced in a core
saturated with the treated fracturing fluid. The experimental procedure for the first stage consists
of the following steps:

106
1- Initial saturation of core with brine and displacement with gas to connate water of
saturation.
2-Measurement of Klinkernberg permeability at connate water of saturation
3- Injection and saturation of core with fracturing fluid to 100% liquid saturation.
4-Placing the core in sleeve of core holder and applying confining pressure of 35 MPa.
5- The gas flow rate at a preset pressure drop (1.6 MPa) is measured using a downstream
flowmeter while the amount of liquid expelled is weighed using a collection vessel
placed on a weighing balance.
The second stage of the multiphase flow tests involves measuring gas relative
permeability using pulse decay methods. The pulse decay technique is selected to minimize the
capillary end effect that is predominant in steady state experiments in low permeability rocks.
The experimental procedures for the second stage of measurements consist of the following steps:
1- Injection /saturation of core with fracturing fluid and evaporation to target liquid
saturation.
2- Enclosing the core in air tight bottle to achieve fluid redistribution.
3-Core is allowed to evaporate, left to stand in a bottle and weighed to obtained average
fluid saturation.
4- Weighing of the core to calculate target saturation using mass balance.
5-Effective permeability to gas is measured using gas pulse decay method.
6-Steps 3,4 and 5 are repeated for varying liquid saturations until connate saturation is
achieved.
Measured effective permeability to gas is normalized to endpoint permeability to
generate relative permeability curves. Relative permeability measurements using this approach
gives relatively accurate estimates of water saturation with gas permeability compared to the
steady state method.
107
In the second step, the fresh dry core placed in a Swagelok core holder is treated by
flowing the surfactant solution through the core at a preset pressure drop (1.6 MPa) for two hours
before displacing with helium gas till liquid is no longer produced. The core is the saturated with
fracturing fluid filtrate and multiphase phase flow measurements are repeated using steady state
gas displacement and gas pulse techniques in two stages described earlier.
7.2.8 Spontaneous Imbibition Experiments
Spontaneous imbibition experiments were conducted at room temperature to identify wettability
alteration of the rock samples after flooding with the two surfactant solutions; Novec FC-4430
and Triton X-100. Imbibition tests are conducted by partially immersing the cores in 2% KCl
brine fluid and suspended from a digital balance and measuring the weight increase of the sample
at different times (see Figure 4-4 for picture of the apparatus and setup used in this study). The
core is brought to connate water of saturation after cleaning and drying in an oven. The core is
partially wrapped with a rubber jacket allowing one side of the core to be partially exposed. This
is done to avoid errors due to evaporation. The sample is connected to the digital balance with the
exposed end placed about 2 mm deep into the beaker containing brine. The liquid (brine) will
spontaneously imbibe resulting in a weight increase of the core which is recorded by the digital
balance. Measurements of weight increase are taken every minute until a fairly constant value is
obtained indicating that suggesting maximum imbibition has been reached. The amount of water
imbibed is calculated from the weight increase. This procedure is repeated on the core this time
after flooding with the fracturing fluid and drying. The difference is imbibed fluid saturation is
used as a qualitative indication of wettability alteration.
7.3 Results and Discussions
7.3.1 Surface Tension Measurements
Measurements of surface tension were obtained for the two surfactant solutions as a
function of surfactant concentration in brine. Figure 7-2 illustrates the effect of surfactant
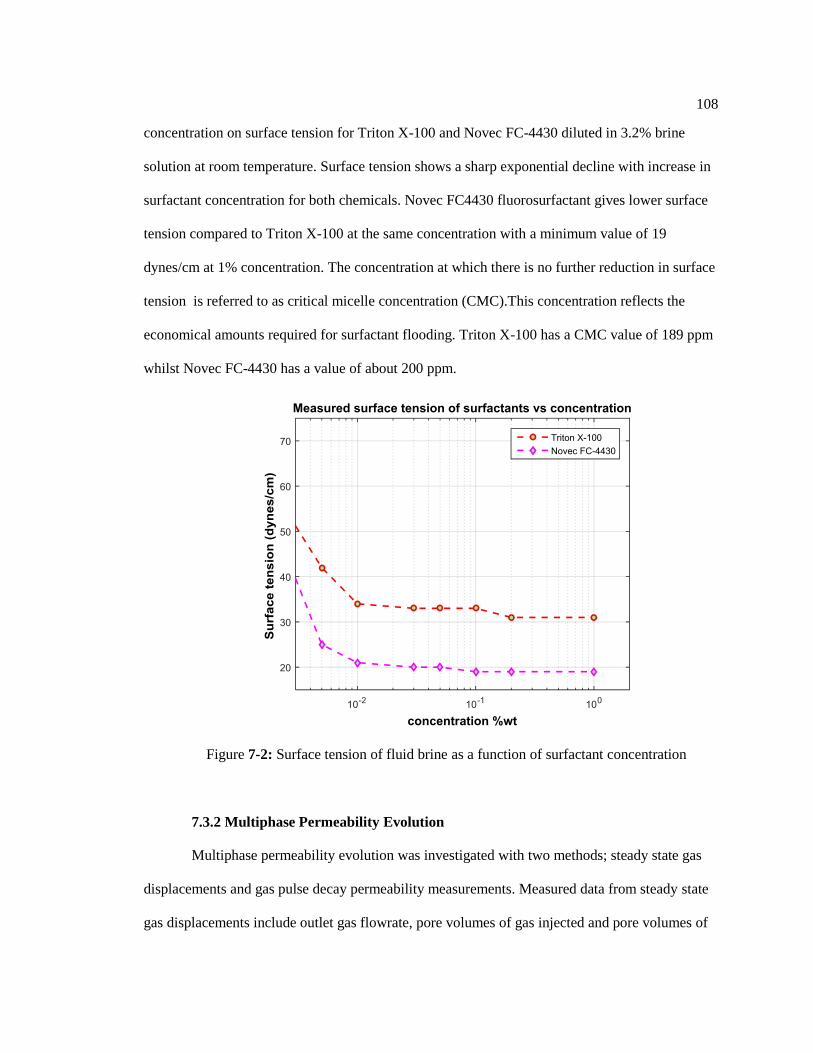
108
concentration on surface tension for Triton X-100 and Novec FC-4430 diluted in 3.2% brine
solution at room temperature. Surface tension shows a sharp exponential decline with increase in
surfactant concentration for both chemicals. Novec FC4430 fluorosurfactant gives lower surface
tension compared to Triton X-100 at the same concentration with a minimum value of 19
dynes/cm at 1% concentration. The concentration at which there is no further reduction in surface
tension is referred to as critical micelle concentration (CMC).This concentration reflects the
economical amounts required for surfactant flooding. Triton X-100 has a CMC value of 189 ppm
whilst Novec FC-4430 has a value of about 200 ppm.
Figure 7-2: Surface tension of fluid brine as a function of surfactant concentration
7.3.2 Multiphase Permeability Evolution
Multiphase permeability evolution was investigated with two methods; steady state gas
displacements and gas pulse decay permeability measurements. Measured data from steady state
gas displacements include outlet gas flowrate, pore volumes of gas injected and pore volumes of

109
liquid expelled. Gas relative permeability curves for various concentrations of surfactant for each
fluid system were obtained from pulse decay experiments.
7.3.3 Effect of Surfactant on Slickwater
Steady state gas displacements experiments were conducted on cores saturated with
slickwater fracturing fluids treated with Novec FC-4430 and Triton X-100 in two separate two
cases. The first case involves gas displacement with slickwater treated at different concentrations
of the surfactant solutions. The concentrations of surfactant solutions used were at 1.5% vol,
Novec FC-4430, 2.5% vol FC-4430 and 1.0% Triton X-100.
In the second case, gas displacement experiments were conducted after treating core with
Novec FC-4430 surfactant by injection at a preset pressure drop of (1.6 MPa). Data obtained for
both cases includes outlet gas flow rate, pore volumes of gas injected and pore volumes of liquid
expelled. Gas relative permeability curves for both cases were obtained from pulse decay
experiments.
Figure 7-3 shows normalized flow rate at the outlet end of the core as a function of pore
volumes of gas injected. Flow rate data is obtained for 1.5% vol, 2.5% vol Novec FC-4430 and
for core sample pretreated with 1.5% Novec FC-4430. Gas flow rate for slickwater treated with
surfactant solutions at 1.5% vol and 2.5% vol of flurosurfactant is increased by a factor of 1.3
Improvement in gas flow rate is attributed to wettability alteration from water wet to intermediate
wet state of the rock sample due to dilution with the surfactant solution. No significant
improvement in gas flow rate is observed using fluids treated with Triton X-100.

110
Figure 7-3: Normalized gas flowrate as function of pore volumes of gas for slickwater
treated with surfactant
The best gas flow rate improvement is obtained for cores pretreated with the
fluorosurfactant solution before saturating the core with fracturing fluid with final gas flow rate
increasing by a factor of 1.88. Novec FC-4430 is a fluorosurfactant and a typical property of
fluorosurfactant is that it alters the wettability of a rock surface from water wet to intermediate
wet. Pretreating the rock by flooding with fluorosurfactant allows for strong interaction between
the surfactant molecules and minerals on the rock surface. This imparts increased wetting and
spreading of the solvent thereby improving the durability of the treatment and altering the
wettability of the rock from water wet to intermediate wet. Subsequent introduction of the
fracturing fluid and displacement with gas allows for more mobility of the liquid phase and
improvement in the gas flow rate. Pore volumes of displaced liquid from the core as a function of
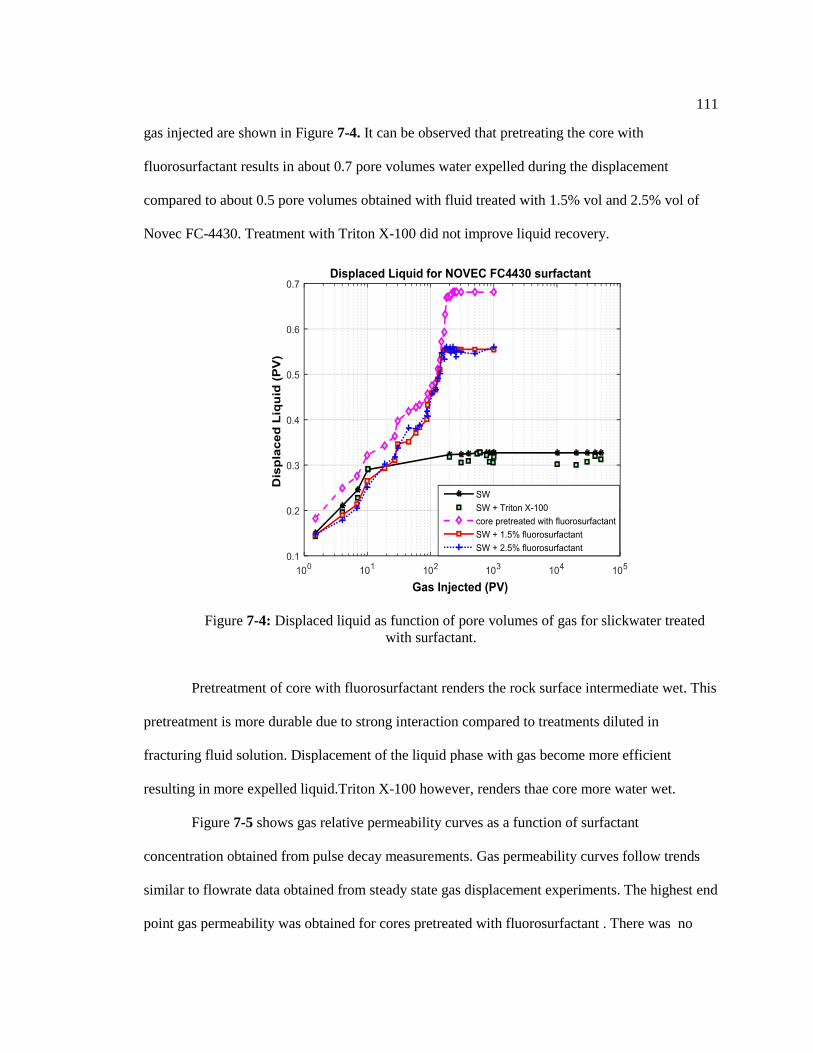
111
gas injected are shown in Figure 7-4. It can be observed that pretreating the core with
fluorosurfactant results in about 0.7 pore volumes water expelled during the displacement
compared to about 0.5 pore volumes obtained with fluid treated with 1.5% vol and 2.5% vol of
Novec FC-4430. Treatment with Triton X-100 did not improve liquid recovery.
Figure 7-4: Displaced liquid as function of pore volumes of gas for slickwater treated
with surfactant.
Pretreatment of core with fluorosurfactant renders the rock surface intermediate wet. This
pretreatment is more durable due to strong interaction compared to treatments diluted in
fracturing fluid solution. Displacement of the liquid phase with gas become more efficient
resulting in more expelled liquid.Triton X-100 however, renders thae core more water wet.
Figure 7-5 shows gas relative permeability curves as a function of surfactant
concentration obtained from pulse decay measurements. Gas permeability curves follow trends
similar to flowrate data obtained from steady state gas displacement experiments. The highest end
point gas permeability was obtained for cores pretreated with fluorosurfactant . There was no

112
difference in the gas relative permeability curves for fluid treated with 1.5 % and 2.5% vol of
fluirosurfacatant. This is a clear indicator that core samples pretreated with fluorosurfactant gives
more water recovery and gas permeability compared to slickwater treated with flurosurfactant.
This is attributed to strong interaction and spreading of surfactant on rock surface before invasion
with fracturing fluid filtrate. Treatment with Triton X-100 did not improve gas permeability.
Figure 7-5: Gas relative permeability as a function of gas saturation for slickwater treated
with various surfactants
7.3.4 Effect of Surfactant on Linear and Crosslinked Gel
Steady state gas displacement experiments were conducted on cores with linear gel and
borate crosslinked gel treated with Novec FC-4430, Triton X-100 and for core samples pretreated
with Novec FC-4430. Figure 7-6 and Figure 7-7 plots normalized gas flow rate at outlet end
versus pore volumes of gas injected for the different treatments. Treating the gel with

113
fluorosurfactant before flooding the core sample results in increased gas flow rate by a factor of
about 1.89. Gas flow rate improvement for core pretreated with fluorosurfactant was 2.13. This
clearly shows that there is little difference in gas flow rates for linear gel treated with
fluorosurfactant and cores pretreated with fluorosurfactant before saturation with fracturing fluid.
It appears from Figure 7-6 that filtrate composition from linear gel has little effect on interaction
of surfactant solution and rock surfaces. It may be inferred that there is a minimal amount of
polymer molecules contained in the filtrate due to quick formation of filter cake during the
leakoff process in the low permeability core sample.
Figure 7-6: Normalized gas flowrate as function of pore volumes of gas for linear gel treated with
various surfactants
The same trend is repeated in Figure 7-7 for gas displacement experiments with borate
crosslinked gel treated with Novec FC4430. Treatments with Triton X-100 for both linear and
crosslinked gels does not give any improvement in gas flowrate.

114
Figure 7-7: Normalized gas flowrate as function of pore volumes of gas for crosslinked
gel treated with surfactant
Displaced liquid from the core as a function of injected gas is presented in Figure 7-8 for
linear gel and Figure 7-9 for crosslinked gel. In both figures, it can be seen that slightly more
liquid is expelled for displacements where the core is pretreated with fluorosurfactant than for
displacements with treated linear gels fluids. This agrees with the earlier hypothesis that
negligible polymer content in the filtrate allows for strong interaction of surfactant solution with
the rock surface to the same extent as the pretreated core sample. Gas displacement with Triton
X-100 results in expelled liquid slightly less than those obtained from displacements with
untreated linear gel filtrate. This agrees with the previous observation that Triton-X increases the
wettability of the rock and traps more liquid during filtrate invasion into the core.

115
Figure 7-8: Displaced liquid as function of pore volumes of gas for linear gel treated with
surfactant.
Figure 7-9: Displaced liquid as function of pore volumes of gas for crosslinked gel treated with
surfactant.

116
Gas relative permeability curves obtained from pulse decay experiments as a function of
gas saturation for are presented in Figure 7-10.For each curves, the liquid phase is linear gel
filtrate treated with either Triton X -100 or Novec FC-4430 at 1.5% and 2.5% vol. Gas relative
permeability trends are similar to the normalized gas flow rate curves obtained from steady state
displacement methods. Treatment with fluorosurfactant increases the range of gas saturations for
which the gas phase is mobile and the relative permeability. The end point gas relative
permeability after treatment is increased by a factor of about 1.86 to 0.7 for both 1.5% vol and
2.5% vol Novec FC-4430. Cores pretreated with Novec FC-4430 gave the highest endpoint
relative permeability of 0.8. Treatment with Triton X-100 did not significantly alter the original
relative permeability curved with untreated linear gel. It can be concluded that while pretreating
the core with fluorosurfactant results in best improvement of gas relative permeability, treatment
by diluting the fracturing fluid with fluorosufactant yields comparable results.
Figure 7-10: Gas relative permeability as a function of gas saturation for linear gel filtrate
treated with surfactant

117
Figure 7-11 shows gas relative permeability as a function of gas saturation obtained using
crosslinked gel filtrate treated with surfactant as liquid phase. The same trend previously
observed in gas relative permeability curves with linear gel (Figure 7-10) is repeated with curves
obtained for crosslinked gels. Core samples pretreated with fluorosurfactant before saturation
with crosslinked gels showed highest end point relative permeability to gas compared to those
where the filtrate itself was treated with the surfactant. Gas relative permeability did not improve
for crosslinked gel filtrate treated with Triton X-100.This implies that the wetting characteristics
of the surfactant rather than reduction in interfacial tension controls gas relative permeability in
low permeability sandstones. The similarity of relative permeability curves for linear gel and
crosslinked gel suggests that the physical properties of the filtrate from both fluids are similar.
Figure 7-11: Gas relative permeability as a function of gas saturation for crosslinked gel
filtrate treated with surfactant

118
7.3.5 Analysis of Spontaneous Imbibition Experiments
The effect of surfactant treatment on the wettability of sandstone cores was investigated
for the two surfactant chemicals; Triton X-100 and Novec FC-4430. Spontaneous imbibition
experiments were conducted at room temperature on the core sample at room temperature with
brine (3% KCl) before and after flooding with the two surfactant solutions. Figure 7-12 shows
imbibition curves for core sample before and after flooding with Novec FC-4430 while Figure 7-
13 shows imbibition curves for core sample before and after flooding with Triton X-100. Figure
7-12 clearly shows reduction in weight of the core sample after treatment with the Novec FC-
4430 compared to untreated core. This clearly demonstrates that rock sample has been altered
from a water wet state to an intermediate wetting state and it is this wettability alteration that is
responsible for the increased liquid recovery observed in steady state gas displacements
experiments with Novec FC-4430.
Figure 7-12: Imbibition curves for core before and after treatment with Novec FC-4430

119
Imbibition curves for treatments with Triton X-100 are shown in Figure 7-13.The
imbibition curve after treatment with Triton X-100 shows significant increase in the weight of the
core sample after treatment with brine indicating increased wetting of the core sample. It is
evident that Triton X-100 improves the wettability of the rock surface. This increased wetting
after treatment with hydrocarbon surfactant is consistent with observations of liquid recovery
from gas displacements experiments. The reduced liquid recovery after treatment with Triton X-
100 is attributed to increased wetting of the rock surface after treatment.
Figure 7-13: Imbibition curves for core before and after treatment with Triton X-100
120
7.4 Conclusions
This study investigated multiphase permeability evolution in sandstone core samples
flooded with filtrate from selected fracturing fluids treated with two surfactant chemicals. The
fracturing fluid systems used to flood the core sample includes slickwater, linear gels and borate
crosslinked gel fluids. The surfactant chemicals tested were Triton X-100, a hydrocarbon
surfactant and Novec FC-4430, a non-ionic fluorosurfactant. Multiphase permeability flowtests
were conducted using steady state gas displacement methods and gas pulse decay permeametry.
Experimental data include normalized gas flowrate, pore volumes of gas injected and pores
volumes of liquid expelled which were obtained from steady state gas displacement tests while
relative permeability curves were generated with data obtained from gas pulse decay experiments.
The major conclusions of this chapter are:
5) For slickwater fluids, our results show that with 1.5 and 2.5 wt % Novec FC-4430
concentrations, the pore volumes of liquid recovered increased by 150% and gas
flowrate increased by a factor of 1.26 and 1.9 respectively. Gas endpoint permeability
increased from 0.45 to 0.59 and 0.61 for 1.5% and 2.5 % Novec FC-4430
concentrations respectively.
6) Pretreatment of the core with Novec FC-4430 before saturation with slickwater gave
maximum liquid recovery of 200% and gas flowrate by a factor of 1.9.The endpoint
gas permeability obtained from pulse decay was 0.89.
7) For linear and borate crosslinked gels , results show that with 1.5 and 2.5 wt %
Novec FC-4430 concentrations, the pore volumes of liquid recovered increased by
161% and gas flowrate increased by a factor of 1.82 and 1.89 respectively. Gas
endpoint permeability increased from 0.45 to 0.71 and 0.73 for 1.5% and 2.5 %
Novec FC-4430 concentrations respectively.

121
8) Treatments with Triton X-100 decreased liquid recovery and did not improve gas
permeability for all fracturing fluid systems.
9) Multiphase permeability evolution with surfactant treatments are controlled by
wettability alterations of the core sample. Decrease in interfacial tension from
surfactant addition does not contribute significantly to gas permeability recovery.

122
Chapter 8
Conclusions and Future Work
The first part of this study investigated the role that filtrate from fracturing fluid has on
rock-fluid and fluid-fluid interactions and to quantified the effect of these mechanisms on
multiphase permeability evolution during imbibition and drainage of the filtrate by means of
specialized core testing techniques. Three fluid systems were investigated; slickwater, linear gels
and borate crosslinked gels. The major conclusions from this study are:
1. Reduction in end-point and liquid phase relative permeability was observed following
imbibition of slickwater into the core sample. The decrease in liquid phase relative
permeability increases with concentration of friction reducer (Polyacrylamide solution)
present in the fluid system.
2. Liquid phase relative permeability reduction is slightly smaller for imbibition cycle with
slickwater than it is for the drainage cycle with brine
3. Reduction in gas phase relative permeability was also observed for the drainage cycle
with helium gas. However, the decrease in effective permeability to gas is not sensitive to
concentration of friction reducer present in the fluid filtrate.
4. Adsorption flow experiments confirm the adsorption of polyacrylamide molecules to the
pore walls of the rock sample.
5. Adsorption of polyacrylamide present in friction reducer induces wettability increase of
rock sample, an increase imbibition potential and an irreversible modification of two
phase flow behavior in both the imbibition and drainage cycles.
6. Invasion of slickwater into rock matrix severely increases the potential for trapping of
more fluid after contact with rock surface.
123
7. Filtrate composition from linear and borate crosslinked gels does not have a significant
effect on liquid relative permeability during fluid invasion due to limited polymer
invasion into the core. Flow properties of filtrate from linear and cross-linked gels are
comparable to brine.
The second part of this study investigated the mechanisms that govern multiphase permeability
evolution using methanol and surfactant as remediation fluid additive in fracturing fluids. Major
conclusions from this study include:
1. The volume of liquid removed by displacement increases with methanol concentrations
for all fracturing fluids.
2. Increased liquid mobility from addition of methanol is the dominant mechanism that
drives liquid removal and multiphase permeability evolution in the displacement phase.
Changes in interfacial tension do not contribute to multiphase permeability during the
displacement phase.
3. Majority of the improvement in gas permeability from methanol addition is by
evaporation of the trapped liquid phase and is caused by increased volatility of the
fracturing fluid.
4. End-point gas permeability increases with methanol concentration for all fracturing fluids
5. Friction reducer alters the flow properties of the trapped liquid as indicated by increased
surface tension, lower volumes of liquid removed and lower gas endpoint permeability at
the same methanol concentration for cores saturated with slickwater.
6. Gas relative permeability and expelled liquid volume is independent of fluid composition
for linear and borate crosslinked fluids
7. For all tested fracturing fluids treated with methanol, maximum gas permeability is
achieved after long periods of gas injection indicating a slow cleanup.

124
The second part of this study also investigated the effect of surfactants on multiphase
permeability evolution during cleanup of trapped fracturing fluid and the preponderant
mechanisms involved. Two surfactant chemicals; Novec FC-4430 , a fluorinated surfactant and
Triton X-10, a hydrocarbon surfactant were used to treat selected fracturing fluid systems before
flooding the core sample. In another variation of the experiment, the core sample was pretreated
with the fluorosurfactant before saturating the core with the fracturing fluid to be tested. The
major conclusions from this study are:
1. Multiphase permeability evolution upon addition of surfactant to fracturing fluids is
primarily governed by wettability alteration of the rock surface during cleanup.
Contribution from reduction in interfacial tension is doubtful due to molecular
dissimilarity between the liquid phase containing the surfactant and the gas phase.
2. Pretreatment of the core sample with the fluorosurfactant solution before saturating the
core with fracturing fluid resulted in best gas flowrate improvement and volume of liquid
expelled for all fracturing fluids tested.
3. For linear and crosslinked gel fluids, addition of 2.5% fluorosurfactant solution to the gel
resulted in increased gas flowrate by a factor of 1.89 and an increase in the volume of
liquid recovered by a factor of 1.61 . Pretreatment of core with flurosurfactant resulted in
increment of gas flowrate by a factor of 2.2 and expelled liquid volume by 1.9.
4. Addition of 2.5% fluorosurfactant to slickwater resulted in gas flowrate improvement by
a factor of 1.26 and an increase in expelled liquid volume by a factor of 1.5. Pretreatment
of the core boosts increments in gas flowrate by a factor of 1.95 and expelled liquid
volumes by factors of 2.1.
5. Addition of Triton X-100 does not improve gas flowrate or expelled liquid volumes for
all fracturing fluids. Reduced interfacial tension by addition of Triton X-100 does not
contribute to permeability evolution during cleanup.
125
Future Work
Several possible future works that can be done to extend experimental research in this
area include:
For a comprehensive study of the effect of alcohols on permeability evolution in
in presence of different fracturing fluids, experimental research should be
extended to other alcohols such as isopropanol, ethanol and to mutual solvents
like xylene.
Experimental work can be conducted to investigate the effect of brine
precipitation on absolute permeability upon addition of methanol to the fracturing
fluid filtrate.
Core flood tests with different salinity brines can be conducted to evaluate
sensitivity permeability impairment to brine salinity.
For experiments with surfactants, measurement of surfactant desorption rate can
provide useful insight on the durability of the surfactant treatment.
Data from this experimental research provides a valuable tool for review and optimizing
field application to minimize formation damage during cleanup of fractured tight gas wells.
Possible recommendations from this study in extension to field application include:
Concentration of friction reducer used in slickwater treatments can be optimized
by considering the absolute permeability of the formation. For ultralow
permeability sandstones (< 10-3 md), friction reducer concentration greater than
0.5 gptg will not invade the rock matrix, reducing the potential for damage by
retention of polyacrylamide molecules. For moderate permeability sandstones,
fluid invasion of the matrix is possible at concentration as high as 1.0 gptg, and

126
therefore should be optimized to achieve a balance of minimal fluid invasion and
maximum friction pressure reduction in the tubulars.
For treatments with surfactant, pretreatment of the sample before fluid invasion
results in the best cleanup. Pretreatment in the field can be achieved by pumping
a prescribed volume of flurosurfactant in the pre-pad stage of the fracture
treatment before pumping the main fracturing fluid in the pad. This allows for
prolonged contact and spreading of the fluorosurfactant on the rock matrix before
invasion of the filtrate from the pad stage into the rock matrix. Wettability
alteration is more effective resulting in more liquid recovery during cleanup.
Numerical modeling and simulation plays a vital role in understanding various formation
damage mechanisms that alter permeability in static and dynamic flow conditions in petroleum
reservoirs. The massive exploration and developmental costs of tight gas reservoirs suggest that
accurate production forecast is crucial. However, in prediction of post fractured well performance
using conventional models remains poor as gas productivity is usually below production
forecasts. Inaccuracies in predictions can be attributed to the fact that there are non-linear and
complex damage mechanisms that influence fluid flow in physical porous media and hamper
proper representation of post-fractured performance in these reservoir simulation models.
Therefore modeling formation damage based on carefully designed laboratory experiments can
capture and integrate these empirical mechanisms and provide a sound scientific basis for
modeling and simulation of post-fractured gas productivity in tight gas reservoirs.
Recommendations for future work in this area include:
Petrophysical data obtained from this experimental study be scaled-up and
integrated into a coupled formation damage/fluid flow numerical model to
effectively capture the wettability and multiphase permeability evolution during

127
fracturing fluid filtrate invasion, trapping and subsequent displacement during clean
up.
Development of a streamline simulator to visually observe the impact of multiphase
permeability evolution on the velocity flow field and saturation front during the
injection of the fracturing fluid. This can help capture the effect of permeability
alteration from the invasion profile due to fluid composition and capillary effects in
low permeability sandstones.
Sensitivity analysis should be conducted to investigate the effect of drawdown,
capillary pressure, relative permeability curves for different fracturing fluid/additive
combinations and wettability on production performance in post fractured low
permeability sandstones.

128
REFERENCES
1. Abaa, K.N., Ityokumbul, M.T.,Wang,Y.J. 2012. Parametric Study of Fracture Treatment
Parameters for Ultratight Gas Reservoirs. Paper SPE 152877 presented at the SPE
Unconventional Gas Conference, Pittsburgh, Pennsylvania, USA, 5-7 June.
2. Abrams, A. and Vinegar, H.J.1985. Impairment Mechanisms in Vicksburg Tight Gas
Sands. paper SPE/DOE 13883 presented at the SPE/DOE Joint Low Permeability Gas
Resources Symposium, Denver, 19–22 May
3. Al-Anazi, H. A., Walker, J. G., Pope, G. A., Sharma, M. M., & Hackney, D. F. 2005. A
Successful Methanol Treatment in a Gas/condensate Reservoir: Field Application. Paper
SPE 80901-PA, Society of Petroleum Engineers. February 1.
4. Bang, V. S. S., Yuan, C., Pope, G. A., Sharma, M. M., Baran Jr, J. R., Skildum, J.,
Linnemeyer, H. C., others, 2008. Improving productivity of hydraulically fractured gas
condensate wells by chemical treatment, in: Offshore Technology Conference, OTC-
19599
5. Bahrami, H., Rezaee, M. R., Ostojic, J., Nazhat, D. H., & Clennell, M. B.2011.
Evaluation of Damage Mechanisms and Skin Factor in Tight Gas Reservoirs. Paper SPE
142284-MS, Society of Petroleum Engineers. January 1.
6. Bazin, B., Bekri, S., Vizika,O.,Herzhaft, B., Aubry, E. 2008. Fracturing in Tight-Gas
Reservoirs: Application of SCAL Methods to Investigate Formation-Damage
Mechanisms. Paper SPE 112460 presented at the SPE International Symposium and
Exhibition on Formation Damage Control, 13-15 February, Lafayette, Louisiana, USA
7. Bennion, D.B., Bietz, R.F., Thomas, F.B. 1993 .Reductions in the Productivity of Oil and
Gas Reservoirs due to Aqueous Phase Trapping. Paper CIM93-24 presented at the CIM
Annual Technical Conference, Calgary, 9–12 May.
8. Brace, W.F., Walsh, J.B., Frangos, W.T., 1968. Permeability of granite under high
pressure. Journal of Geophysics Research 73, 2225–2236.
9. Byrnes, A. P., K. Sampath, and P. L. Randolph. 1979. Effect of pressure and water
saturation on permeability of western tight sandstones: Fifth Annual Department of
Energy Symposium on Enhanced Oil and Gas Recovery and Improved Drilling
Technology, Tulsa, Oklahoma, August 22 – 24, p. 1 –15.
10. Byrnes, A. P., and C. W. Keighin, 1993. Effect of confining stress on pore throats and
capillary pressure measurements, selected sandstone reservoir rocks (abs.): AAPG
Annual Meeting Program, v. 2, p. 82.

129
11. Byrnes, A. P.1997.Reservoir characteristics of low-permeability sandstones in the Rocky
Mountains: Mountain Geologist, v. 34, p. 39 – 51.
12. Byrnes, A. P.2003,.Aspects of permeability, capillary pressure, and relative permeability
properties and distribution in low permeability rocks important to evaluation, damage,
and simulation: Rocky Mountain Association of Geologists and Rocky Mountain Region
of Petroleum Technology Transfer Council — Petroleum Systems and Reservoirs of
Southwest Wyoming Symposium, September 19,
13. Cimolai, M.P. , Gies, R.M., Bennion, D.B., Myers, D.L. 1993.Mitigating Horizontal Well
Formation Damage in a Low-Permeability Conglomerate Gas Reservoir. Paper SPE
26166 presented at the 1993 SPE Gas Technology Symposium, Calgary, 28–30 June.
14. Civan, Faruk. 2000. Reservoir Formation Damage, Gulf Publishing Company, Texas,
USA, 2000.
15. Cluff, R. M.2002. Reservoir properties of low-permeability gas sands, in Low
permeability gas sands: Rocky Mountain Section AAPG Meeting Short Course 4. Co-
sponsored by Petroleum Technology Transfer Council (PTTC) and the Wyoming
Geological Association. Volume available through PTTC.
16. Conway, M. W., Lindeman, S. W., & Barree, R. D. 2007. Selection of Stimulation Fluids
and Treatment Design for Low Permeability Reservoirs. Paper SPE 106085-MS, Society
of Petroleum Engineers. January 1, doi:10.2118/
17. Dacy, J. M. 2010,. Core Tests for Relative Permeability of Unconventional Gas
Reservoirs. Society of Petroleum Engineers. January 1. doi:10.2118/135427-MS
18. Davies, J. P., and D. K. Davies. 1999. Stress-dependent permeability: characterization
and modeling. Paper SPE 56813 Society of Petroleum Engineers Annual Technical
Conference, Houston, Texas.
19. Dutton, S. P., S. J. Clift, D. S. Hamilton, H. S. Hamlin, T. F. Hentz, W. E. Howard, M. S.
Akhter, and S. E. Laubach. 1993. Major low-permeability sandstone gas reservoirs in the
United States: Texas Bureau of Economic Geology Report of Investigations No. 211, 221
p.
20. Dutton, S. P., H. S. Hamlin, and S. E. Laubach. 1995. Geologic controls on reservoir
properties of low-permeability sandstone Frontier Formation, Moxa arch, southwestern
Wyoming: Texas Bureau of Economic Geology Report of Investigations No. 234, 89 p.
130
21. Fahes, M. and Firoozabadi, Abbas.2005. Wettability Alteration to Intermediate Gas-
Wetting in Gas-Condensate Reservoirs at High Temperatures. Paper SPE 96184, SPE
Annual Technical Conference and Exhibition, Conference: Proceedings 2005 SPE
Annual Technical Conference and Exhibition, Dallas, TX, Oct 9-12.
22. Feng C Y,Kong Y, Jiang G,Pu C, Zhang Y.2012 .Wettability alteration of rock cores by
fluorinated copolymer emulsion for the enhancement of gas and oil recovery. Applied
Surface Science. 2012. 258(18): 7075- 7081
23. Gidanski, R., Fulton, D., Shen, C.2006.Fracture-Face-Skin Evolution During Clean Up.
Paper presented at the SPE Annual Technical Conference and Exhibition, San Antonio,
Texas, USA 24-27 September.
24. Gupta, D.V.S.2009.Unconventional Fracturing Fluids for Tight Gas Reservoirs. Paper
SPE 119424 presented at SPE Hydraulic Fracturing Technology Conference, The
Woodlands, Texas, 19-21 January.
25. Holditch, S.A.1979.Factors Affecting Water Blocking and Gas Flow from Hydraulically
Fractured Gas Wells. JPT .December. 1515
26. Holditch, S. A. 2006. Tight Gas Sands. Society of Petroleum Engineers. June 1.
doi:10.2118/103356-JPT
27. Jones, F. O., and W. W. Owens.1980. A laboratory study of low- permeability gas sands.
Paper SPE Paper 7551, Journal of Petroleum Technology, v. 32, p. 1631 – 1640.
28. Jones, S. C. 1997, A Technique for Faster Pulse-Decay Permeability Measurements in
Tight Rocks. Society of Petroleum Engineers. March 1. doi:10.2118/28450-PA
29. Shaoul, J. R., de Koning, J., Chapuis, C., & Rochon, J. P. 2009, January 1. Successful
Modeling of Post-Fracture Cleanup in a Layered Tight Gas Reservoir. Paper SPE
122021-MS, Society of Petroleum Engineers. doi:10.2118/
30. Kamath, J. and Laroche, C.2000.Laboratory-Based Evaluation of Gas Well Deliverability
Loss Caused by Water Blocking. Paper SPE 26166 presented at the SPE Annual
Technical Conference and Exhibition, Dallas, Texas, 1-4 October.
31. Kumar, V.2006.Chemical Stimulation of Gas Condensate Reservoirs: An Experimental
and Simulation Study, PhD Dissertation, The University of Texas at Austin, May 2006

131
32. Kumar, V., Bang, V., Pope, G.A., Sharma, M.M., Ayyalasomayajula, P.S., Kamath,
J.2006. Chemical Stimulation of Gas-Condensate Reservoirs. Paper SPE 102669
presented at the SPE Annual Technical Conference and Exhibition, San Antonio, TX, 24-
27 September
33. Laroche, C., Kamath, J., Min, C., Yanis, C. Y.2001.Determining Relative Permeability
Exponents near the Residual Saturation. Paper SPE 71489 presented at the 2001 SPE
Annual Technical Conference and Exhibition, New Orleans, 30 September–3 October.
34. Law, B.E. 20002.Basin-centered gas systems. AAPG Bulletin v. 86 no. 11 p. 1891-1919
doi: 10.1306/61EEDDB4-173E-11D7-8645000102C1865D
35. Le, D. H., Hoang, H. N., & Mahadevan, J. 2012. Gas Recovery from Tight Sands: Impact
of Capillarity. Paper SPE 119585-PA, Society of Petroleum Engineers. December 1.
doi:10.2118/
36. Mahadevan, J. and Sharma, M.2003.Clean-up of Water Blocks in Low Permeability
Formations. Paper SPE-84216 presented at the SPE Annual Technical Conference and
Exhibition, Denver, Colorado, 5-8 October.
37. Mahadevan, J., Sharma, M. M., & Yortsos, Y. C. 2007, June 1. Evaporative Cleanup of
Water Blocks in Gas Wells. Society of Petroleum Engineers. doi:10.2118/94215-PA
38. Le, D., Hoang, H., and Mahadevan, J. 2009. Impact of Capillary-Driven Liquid Films on
Salt Crystallization. Transport in Porous Media 80(2): 229-252. doi:10.1007/s11242-
009-9353-x.
39. Li, K. and Firoozabadi, A.2000.Experimental study of wettability alteration to
preferential gas-wetting in porous media and its effects, SPE Reservoir Evaluation
Engineering, 3(2).
40. Malpani, R and Holditch, S.2008. Selection of Fracturing Fluid for Stimulating Tight Gas
Reservoirs. World Oil Journal, July, Vol. 229 No. 7.
41. Metheven, N.B.1971.Effects of Drilling Fluids on Gas Well Productivity. paper SPE
3504 presented at the 1971 SPE Annual Fall Meeting, New Orleans, 3–6 October
132
42. McLeod, H.O. and Coulter, A.W. 1966.The Use of Alcohol in Gas Well Stimulation.
Paper SPE 1663 presented at the 1966 SPE Eastern Regional Meeting, Columbus, Ohio,
10–11 November.
43. Panga, M. K. R., Ooi, Y. S., Koh, P. L., Chan, K. S., Enkababian, P. G., Cheneviere, P.,
& Samuel, M. M.2006. Wettability Alteration for Water Block Prevention in High
Temperature Gas Wells. Paper SPE 100182-MS, Society of Petroleum Engineers.
January 1, doi:10.2118/.
44. Parekh, B. and Sharma, M.M. 2004. Cleanup of Water Blocks in Depleted Low-
Permeability Reservoirs. Paper SPE 89837 presented at the SPE Annual Technical
Conference and Exhibition, Houston, 26-29 September. http://dx.doi.org/10.2118/89837-
MS.
45. Penny, G. S., Conway, M. W., & Briscoe, J. E. 1983. Enhanced Load Water-Recovery
Technique Improves Stimulation Results. Paper 12149-MS SPE Society of Petroleum
Engineers, January 1. doi:10.2118/
46. Soeder, D. J., and P. L. Randolph, 1987, Porosity, permeability, and pore structure of the
tight Mesaverde Sandstone, Piceance basin, Colorado. SPE Paper 13134, Society of
Petroleum Engineers Formation Evaluation, June 1987, p. 129 – 136.
47. Shanley, Keith, W., Robert, M. Cluff, John, W. Robinson. 2004. Factors controlling
prolific gas production from low-permeability sandstone reservoirs: Implications for
resource assessment, prospect development, and risk analysis. AAPG Bulletin,
V.88, No.8, p.1083-1122.
48. Tang, G.Q. and Firoozabadi, A.2003.Wettability Alteration to Intermediate Gas-Wetting
in Porous Media at Elevated Temperatures. Transport in Porous Media, 52(2), August.
49. Thomas, R. D., and D. C. Ward,.1972. Effect of overburden pressure and water
saturation on gas permeability of tight sandstone cores: Paper SPE 3634, Journal of
Petroleum Technology, v. 24, p. 120 – 124.
50. Wang, S., Elsworth, D., Liu, J., 2011. Permeability evolution in fractured coal: the roles
of fracture geometry and water content. International Journal of Coal Geology 87, 13–25.
51. Zuluaga, E., and Monsalve, J. C. 2003. Water Vaporization in Gas Reservoirs. Paper SPE
84829-MS, Society of Petroleum Engineers. January 1, doi:10.2118/
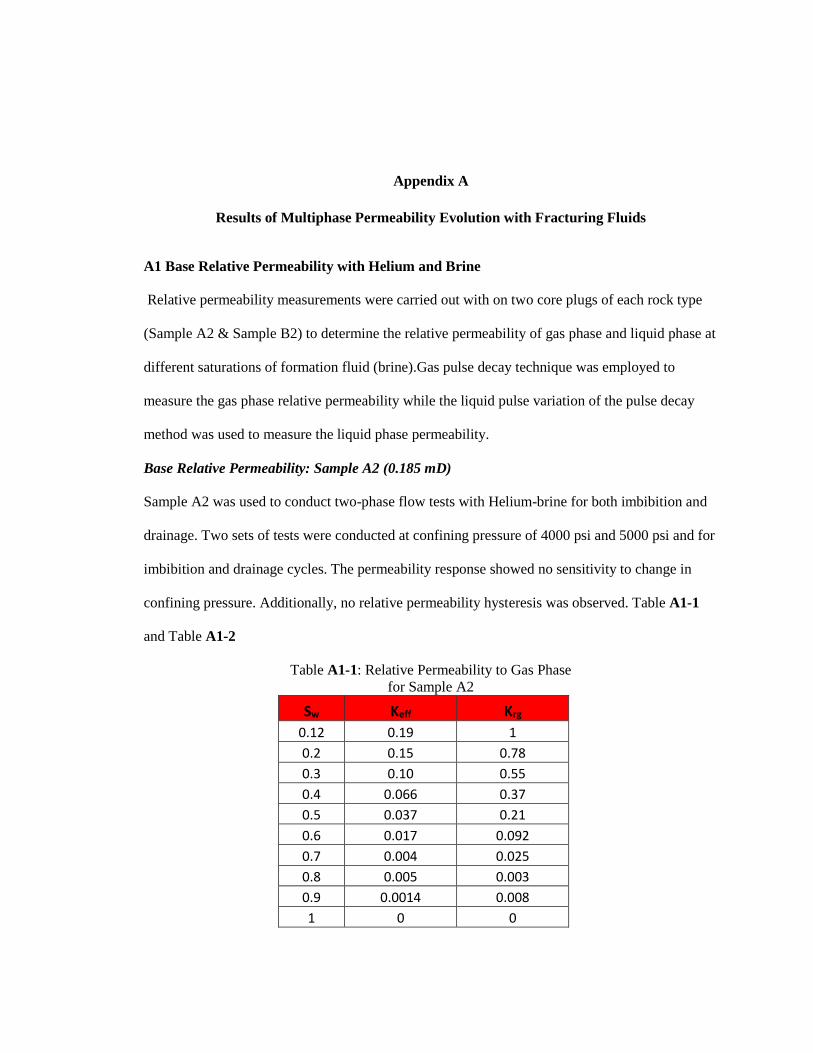
Appendix A
Results of Multiphase Permeability Evolution with Fracturing Fluids
A1 Base Relative Permeability with Helium and Brine
Relative permeability measurements were carried out with on two core plugs of each rock type
(Sample A2 & Sample B2) to determine the relative permeability of gas phase and liquid phase at
different saturations of formation fluid (brine).Gas pulse decay technique was employed to
measure the gas phase relative permeability while the liquid pulse variation of the pulse decay
method was used to measure the liquid phase permeability.
Base Relative Permeability: Sample A2 (0.185 mD)
Sample A2 was used to conduct two-phase flow tests with Helium-brine for both imbibition and
drainage. Two sets of tests were conducted at confining pressure of 4000 psi and 5000 psi and for
imbibition and drainage cycles. The permeability response showed no sensitivity to change in
confining pressure. Additionally, no relative permeability hysteresis was observed. Table A1-1
and Table A1-2
Table A1-1: Relative Permeability to Gas Phase
for Sample A2
Sw Keff Krg 0.12 0.19 1 0.2 0.15 0.78 0.3 0.10 0.55 0.4 0.066 0.37 0.5 0.037 0.21 0.6 0.017 0.092 0.7 0.004 0.025 0.8 0.005 0.003 0.9 0.0014 0.008 1 0 0

134
Table A1-2: Relative Permeability to Liquid Phase for
Sample A2
Sw Krw Kw 0 0 0 0.1 0 0 0.2 0 0 0.3 0 0 0.4 0 0 0.5 0 0 0.6 0.001 0.0001 0.7 0.033 0.0004 0.8 0.19 0.021 0.9 0.67 0.072 1 1 0.108
Base Relative Permeability: Sample B2 (0.0005 mD)
Sample 3 was used to conduct two-phase flow tests with Helium-brine for both imbibition and
drainage. Two sets of tests were also conducted at confining pressure of 4000 psi and 5000 psi
and for imbibition and drainage cycles. The permeability response also showed no sensitivity to
change in confining pressure and no relative permeability hysteresis. Results are given in Table
A1-3 and Table A1-4.

135
Table A1-3: Relative Permeability to Gas Phase for
Sample B2
Sw Keff Krg 0 0.000473 0.96 0.1 0.000345 0.69 0.2 0.000237 0.48 0.3 0.000149 0.30 0.4 8.14E-05 0.16 0.5 3.38E-05 0.07 0.6 6.88E-06 0.013 0.7 2.07E-07 0.0004 0.8 2.07E-07 0.0004 0.9 2.06E-07 0.0004 1 2.04E-07 0.0004
Table A1-5: Relative Permeability to Liquid Phase for
Sample B2
Sw Kw Krw 0.1 0 0 0.521 0 0 0.80 0 0 0.82 4.33E-09 0.0001 0.83 5.62E-08 0.0013 0.84 2.9E-07 0.0067 0.85 9.17E-07 0.021 0.86 2.24E-06 0.052 0.867 4.65E-06 0.11 0.87 8.61E-06 0.19 0.88 1.47E-05 0.33 0.89 2.35E-05 0.54 0.91 3.58E-05 0.83

136
A2.0 Experiments with Slickwater
Flow experiments were conducted with each of the selected fracturing fluid systems listed in
‘chapter 4’.For each fluid system, three types of experiments were conducted using core samples
from the two rock types. They include;
1-Leak-off/Filtration Tests to determine the filtration control mechanisms.
2-Two-phase relative permeability measurements with fracturing fluid as wetting phase for both
drainage and imbibition cycles
3-Adsorption experiments to investigate for possible adsorption processes during flow of filtrate
in the porous media.
Slickwater fluids systems investigated are listed in Table 4-2.Three different types of
experiments were conducted for the two samples, to determine the multiphase flow characteristics
of the sample in the presence of fracturing fluid filtrate (slickwater). The first was leak off
experiment to determine filtration mechanisms of the core and verify invasion of polymeric
molecules of polyacrylamide. The second set of tests conducted were permeability measurements
with gas and liquid pulse decay techniques to determine the effective permeability to the gas and
liquid phase for various saturations of slickwater. Finally, adsorption experiments were conducted
to investigate the effect of adsorption of polymeric molecules of slickwater solution to pore walls
of the core samples.
A2.1Results of Leak-off/Filtration Test
Leak-off/filtration experiments were conducted on cores (Sample A1 & Sample B1) saturated
with 100% brine to determine whether filtration is controlled by core permeability and if any
polymeric molecules of the filtrate invades the pore spaces of the porous sample. Leak-off test for
both samples were conducted with slickwater (0.1% Polyacrylamide ) in a high pressure-high
temperature Baroid filter press with a differential pressure of 1000 psia and temperature of 180
deg F. Table A2-1 shows the filtration volumes obtained from tests for both core samples.
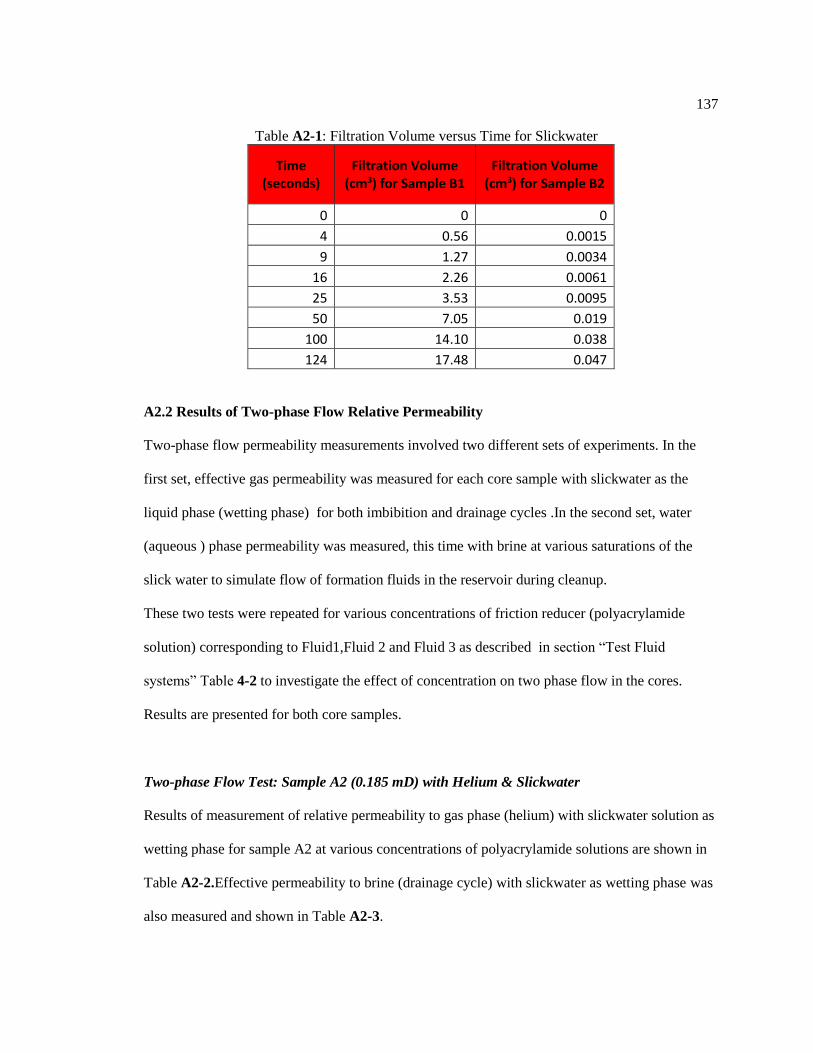
137
Table A2-1: Filtration Volume versus Time for Slickwater
Time (seconds)
Filtration Volume (cm3) for Sample B1
Filtration Volume (cm3) for Sample B2
0 0 0
4 0.56 0.0015
9 1.27 0.0034
16 2.26 0.0061
25 3.53 0.0095
50 7.05 0.019
100 14.10 0.038
124 17.48 0.047
A2.2 Results of Two-phase Flow Relative Permeability
Two-phase flow permeability measurements involved two different sets of experiments. In the
first set, effective gas permeability was measured for each core sample with slickwater as the
liquid phase (wetting phase) for both imbibition and drainage cycles .In the second set, water
(aqueous ) phase permeability was measured, this time with brine at various saturations of the
slick water to simulate flow of formation fluids in the reservoir during cleanup.
These two tests were repeated for various concentrations of friction reducer (polyacrylamide
solution) corresponding to Fluid1,Fluid 2 and Fluid 3 as described in section “Test Fluid
systems” Table 4-2 to investigate the effect of concentration on two phase flow in the cores.
Results are presented for both core samples.
Two-phase Flow Test: Sample A2 (0.185 mD) with Helium & Slickwater
Results of measurement of relative permeability to gas phase (helium) with slickwater solution as
wetting phase for sample A2 at various concentrations of polyacrylamide solutions are shown in
Table A2-2.Effective permeability to brine (drainage cycle) with slickwater as wetting phase was
also measured and shown in Table A2-3.

138
Table A2-2: Relative Permeability to Gas for Sample A2
Sw Krg @ 0.25 gptg Krg @ 0.5 gptg Krg @ 1.0 gptg
0.2 0.72 0.71 0.71
0.3 0.48 0.47 0.47
0.4 0.24 0.23 0.23
0.5 0.093 0.092 0.091
0.6 0.0003 0.0003 0.00028
0.7 0 0 0
0.8 0 0 0
0.9 0 0 0
1 0 0 0
Table A2-3: Effective Permeability to Brine (Drainage)
for Sample A2
Sw Kg @ 0.25 gptg Kg @ 0.5 gptg Kg @ 1.0 gptg
0.1 0 0 0
0.53 0 0 0
0.61 0.00015 0.00011 9.5E-05
0.65 0.00079 0.00058 0.00051
0.72 0.0052 0.0038 0.0034
0.76 0.011 0.0082 0.0073
0.89 0.072 0.053 0.047

139
Two-phase Flow Test: Sample B2 (0.0005 mD) with Helium & Slickwater
Gas relative permeability and liquid phase (brine) permeability were conducted on the second
ultra-low permeability core (Sample B2) and results tabulated in Table A2-4 and Table A2-5.
Table A2-4: Gas Relative Permeability for
Sample B2
Sw Krg @ 0.25 pptg Krg @0.5 pptg
0 0.95 0.91
0.1 0.69 0.66
0.2 0.47 0.47
0.3 0.29 0.29
0.4 0.16 0.17
0.5 0.067 0.065
0.6 0.014 0.013
0.7 0.00042 0.00039
0.8 0.00041 0.00039
0.9 0.00041 0.00039
1 0.00041 0.00039
Table A2-5: Effective Permeability to Brine
(Drainage) Sample B2
Sw Krg @ 0.25 pptg Krg @ 0.5 pptg
0.82 0.0008 -
0.83 0.004 -
0.84 0.014 -
0.85 0.033 0.024
0.86 0.069 0.051
0.87 0.13 0.093
0.88 0.22 0.16
0.89 0.35 0.26
0.90 0.53 0.39

140
A2.3 Results of Adsorption Flow Experiments
Adsorption tests were conducted with samples A3 (0.185mD) and sample B3 (0.005 mD) with
slickwater at various concentrations of friction reducer .The amount of adsorbed polyacrylamide
is reported in micrograms (µg) per gram of core sample. The results of adsorption experiments
also are listed in Table A2-6
Table A2-6:Amount Adsorbed as Function of Polyacrylamide Solution Concentration
Concentration (ppm) Sample A3 Concentration (µg/g) Sample B3 Concentration (µg/g)
0 0 0
250 0.164 0.023
500 0.34 0.153
750 0.373 -
1000 0.375 -
A2.4 Results of Imbibition and Contact Angle Experiments
Spontaneous imbibition experiments were conducted at room temperature on core sample A4 and
sample B4 at room temperature with brine (3% KCl). Table A2-6 and Table A2-7 shows
imbibition curves for sample A4 and B4 before and after flooding with slickwater (0.025%
friction reducer) /Fluid system 1

141
Table A2-7: Mass of Sample A4 Before and After Flooding
Time (min) Mass of Core Before Flood (g)
Mass of Core after Flood (g)
1 0.01 0.02
2 0.16 0.19
3 0.21 0.3
4 0.22 0.35
5 0.24 0.37
6 0.24 0.37
7 0.25 0.37
8 0.25 0.37
9 0.25 0.37
10 0.25 0.37
15 0.25 0.37
20 0.25 0.37
Table A2-8: Mass of Sample B4 Before and After Flooding
Time (min) Mass of Core
Before Flood (g) Mass of Core
after Flood (g)
1 0.01 0.01
2 0.02 0.08
3 0.04 0.2
4 0.09 0.26
5 0.12 0.27
6 0.13 0.27
7 0.14 0.27
8 0.14 0.27
9 0.14 0.27
10 0.14 0.27
11 0.14 0.27
12 0.14 0.27
15 0.14 0.27
20 0.14 0.27
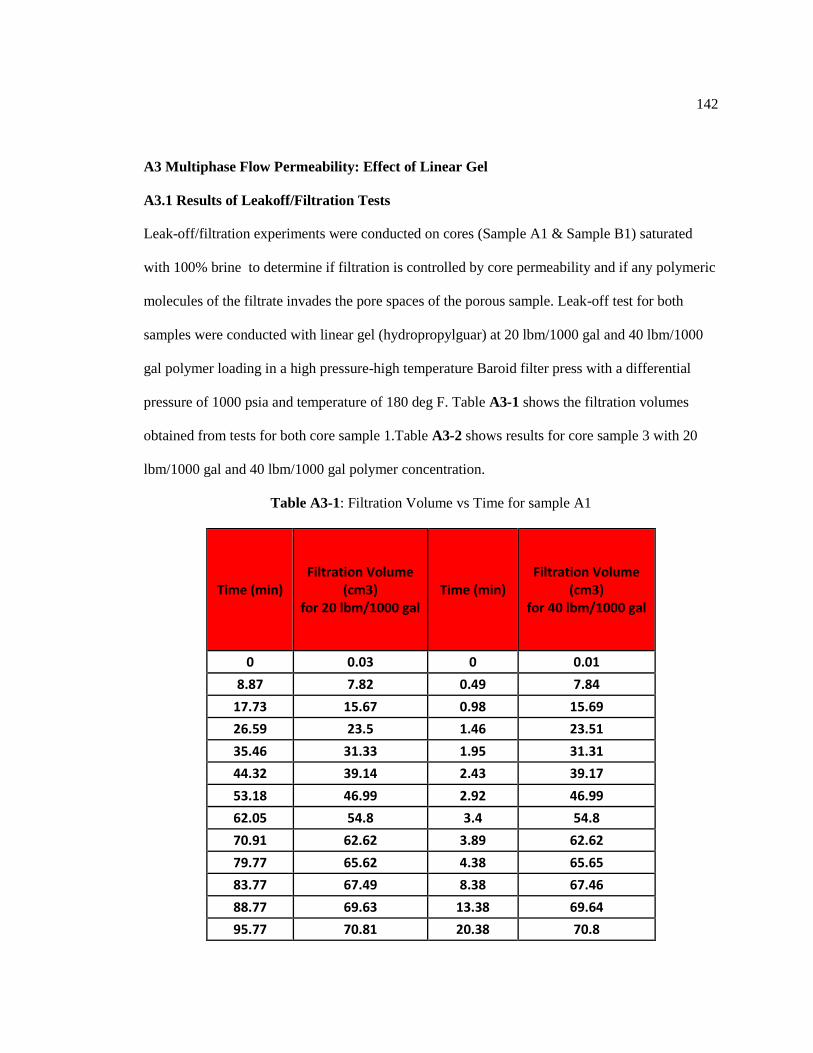
142
A3 Multiphase Flow Permeability: Effect of Linear Gel
A3.1 Results of Leakoff/Filtration Tests
Leak-off/filtration experiments were conducted on cores (Sample A1 & Sample B1) saturated
with 100% brine to determine if filtration is controlled by core permeability and if any polymeric
molecules of the filtrate invades the pore spaces of the porous sample. Leak-off test for both
samples were conducted with linear gel (hydropropylguar) at 20 lbm/1000 gal and 40 lbm/1000
gal polymer loading in a high pressure-high temperature Baroid filter press with a differential
pressure of 1000 psia and temperature of 180 deg F. Table A3-1 shows the filtration volumes
obtained from tests for both core sample 1.Table A3-2 shows results for core sample 3 with 20
lbm/1000 gal and 40 lbm/1000 gal polymer concentration.
Table A3-1: Filtration Volume vs Time for sample A1
Time (min) Filtration Volume
(cm3) for 20 lbm/1000 gal
Time (min) Filtration Volume
(cm3) for 40 lbm/1000 gal
0 0.03 0 0.01
8.87 7.82 0.49 7.84
17.73 15.67 0.98 15.69
26.59 23.5 1.46 23.51
35.46 31.33 1.95 31.31
44.32 39.14 2.43 39.17
53.18 46.99 2.92 46.99
62.05 54.8 3.4 54.8
70.91 62.62 3.89 62.62
79.77 65.62 4.38 65.65
83.77 67.49 8.38 67.46
88.77 69.63 13.38 69.64
95.77 70.81 20.38 70.8

143
Table A3-2: Filtration Volume vs Time for sample B1
Time (min)
Filtration Volume (cm3) for
Time (min)
Filtration Volume (cm3) for
20 lbm/1000 gal 40 lbm/1000 gal
0 0 0 0.02
2.38 3.69 180.15 0.46
4.76 7.42 360.29 0.85
7.14 11.12 540.44 1.27
9.52 14.88 720.58 1.7
11.9 18.54 900.72 2.16
14.28 22.25 1080.87 2.63
16.66 25.93 1261.01 3.02
19.04 29.67 1441.15 3.42
21.42 33.36 1621.3 3.88
28.56 44.52 1625.3 3.93
30.93 48.2 1630.3 3.97
33.31 51.89 1637.3 4.05
35.69 55.66 1646.3 4.07
38.07 59.39 1671.3 4.18
40.45 63.06 1721.3 4.33

144
A3.2 Results of Two-phase Flow Relative Permeability
Two-phase flow permeability measurements involved two different sets of experiments. In the
first set, effective gas permeability was measured for each core sample with linear gel filtrate as
the liquid phase (wetting phase) for both imbibition and drainage cycles .In the second set, water
(aqueous) phase permeability was measured, this time with brine at various saturations of the
linear gel to simulate flow of formation fluids in the reservoir during imbibition and cleanup.
Two-phase Flow Test: Sample A1 (0.185 mD) with Helium & Linear Gel (hydropropyl guar)
Results of measurement of relative permeability to gas phase (helium) with linear gel solution as
wetting phase at 20 lbm/1000 gal and 40 lbm/1000 gal are shown in Table A3-3.Effective
permeability to brine (drainage cycle) with linear gel as wetting phase was also measured and
shown in Table A3-4.
Table A3-3: Relative Permeability to Gas for Sample A1
Sw Krg @ 20 pptg Sw
Krg @ 40 pptg
0.8 0.73 0.8 0.73
0.71 0.48 0.71 0.46
0.57 0.24 0.57 0.25
0.47 0.094 0.47 0.075
0.34 0.0002 0.34 0.0013
0.33 0 0.32 0.0103
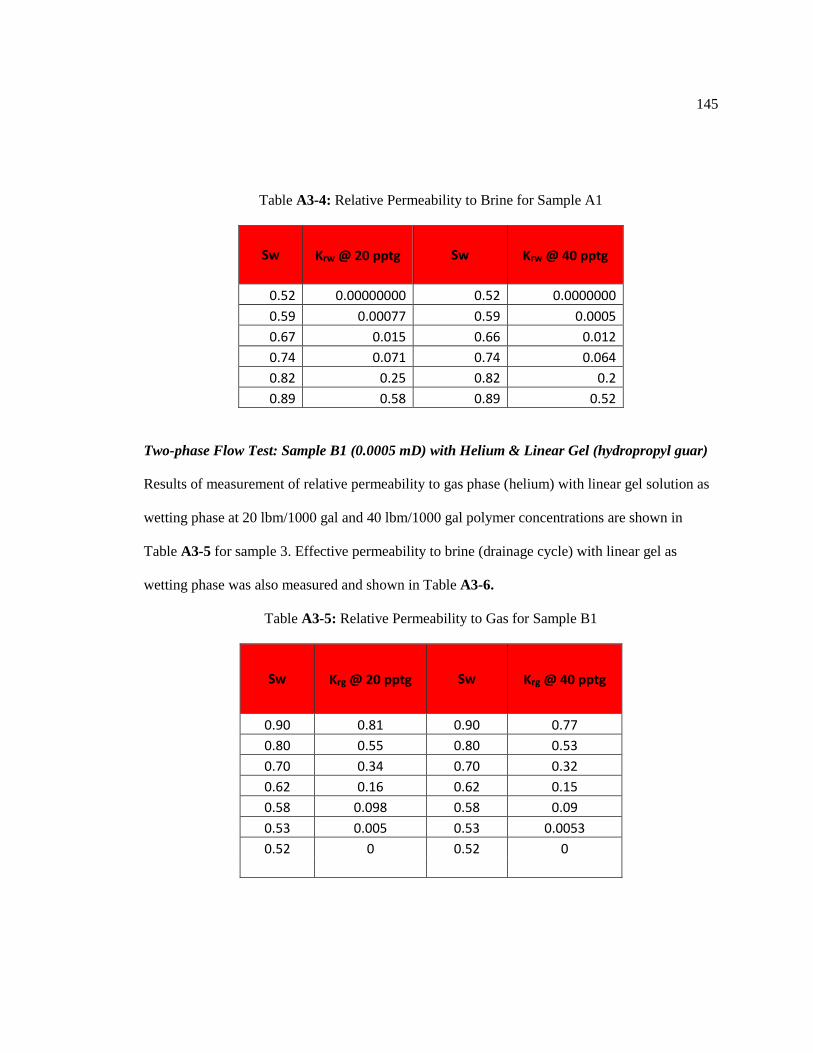
145
Table A3-4: Relative Permeability to Brine for Sample A1
Sw Krw @ 20 pptg Sw Krw @ 40 pptg
0.52 0.00000000 0.52 0.0000000
0.59 0.00077 0.59 0.0005
0.67 0.015 0.66 0.012
0.74 0.071 0.74 0.064
0.82 0.25 0.82 0.2
0.89 0.58 0.89 0.52
Two-phase Flow Test: Sample B1 (0.0005 mD) with Helium & Linear Gel (hydropropyl guar)
Results of measurement of relative permeability to gas phase (helium) with linear gel solution as
wetting phase at 20 lbm/1000 gal and 40 lbm/1000 gal polymer concentrations are shown in
Table A3-5 for sample 3. Effective permeability to brine (drainage cycle) with linear gel as
wetting phase was also measured and shown in Table A3-6.
Table A3-5: Relative Permeability to Gas for Sample B1
Sw Krg @ 20 pptg Sw Krg @ 40 pptg
0.90 0.81 0.90 0.77
0.80 0.55 0.80 0.53
0.70 0.34 0.70 0.32
0.62 0.16 0.62 0.15
0.58 0.098 0.58 0.09
0.53 0.005 0.53 0.0053
0.52 0 0.52 0
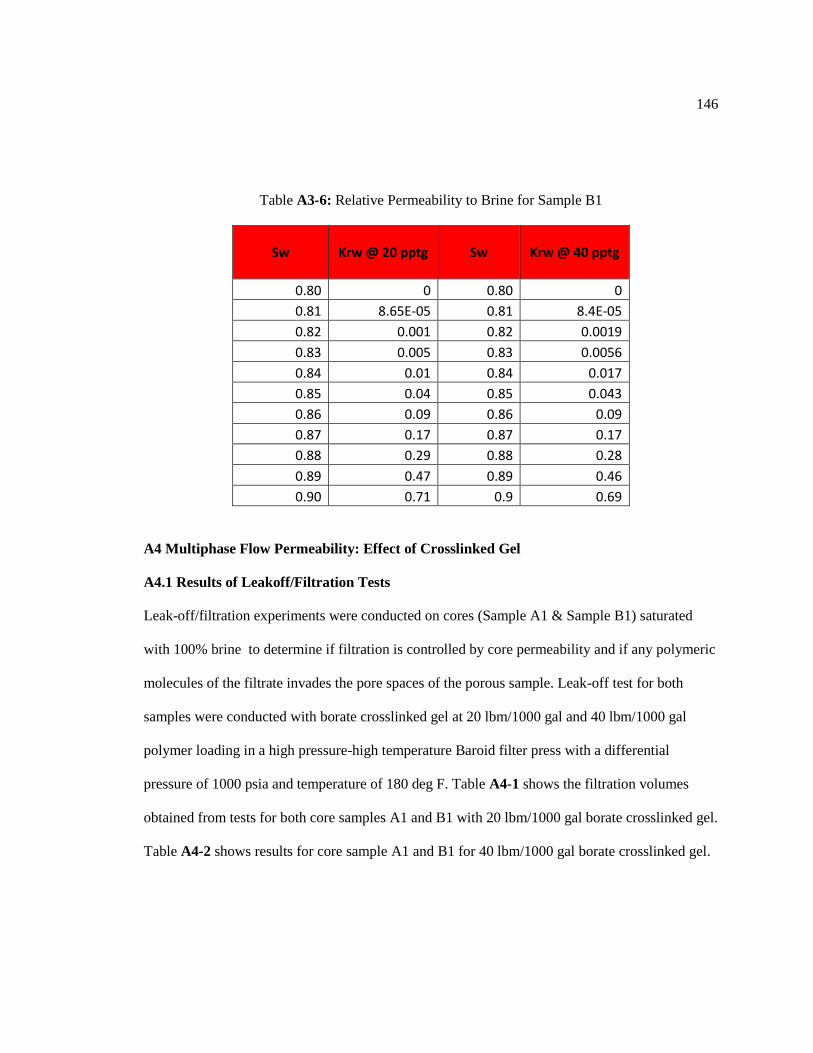
146
Table A3-6: Relative Permeability to Brine for Sample B1
Sw Krw @ 20 pptg Sw Krw @ 40 pptg
0.80 0 0.80 0
0.81 8.65E-05 0.81 8.4E-05
0.82 0.001 0.82 0.0019
0.83 0.005 0.83 0.0056
0.84 0.01 0.84 0.017
0.85 0.04 0.85 0.043
0.86 0.09 0.86 0.09
0.87 0.17 0.87 0.17
0.88 0.29 0.88 0.28
0.89 0.47 0.89 0.46
0.90 0.71 0.9 0.69
A4 Multiphase Flow Permeability: Effect of Crosslinked Gel
A4.1 Results of Leakoff/Filtration Tests
Leak-off/filtration experiments were conducted on cores (Sample A1 & Sample B1) saturated
with 100% brine to determine if filtration is controlled by core permeability and if any polymeric
molecules of the filtrate invades the pore spaces of the porous sample. Leak-off test for both
samples were conducted with borate crosslinked gel at 20 lbm/1000 gal and 40 lbm/1000 gal
polymer loading in a high pressure-high temperature Baroid filter press with a differential
pressure of 1000 psia and temperature of 180 deg F. Table A4-1 shows the filtration volumes
obtained from tests for both core samples A1 and B1 with 20 lbm/1000 gal borate crosslinked gel.
Table A4-2 shows results for core sample A1 and B1 for 40 lbm/1000 gal borate crosslinked gel.

147
Table A4-1: Filtration Volume vs Time for 20 lb/1000gal borate crosslinked gel
Time (Min)
Filtration Volume (cm3)
Sample A1
Time (Min)
Filtration Volume (cm3)
Sample B1
1.03 0.001 4.29 0.003
4.11 0.002 8.58 0.005
9.24 0.003 12.86 0.007
16.42 0.006 17.15 0.009
16.42 0.006 21.43 0.011
25.53 0.018 25.72 0.013
29.88 0.026 30 0.016
33.46 0.032 34.29 0.018
36.63 0.038 38.58 0.02
39.54 0.044 42.86 0.022
42.27 0.05 47.15 0.024
44.86 0.055 51.43 0.026
47.34 0.06 55.72 0.028
49.73 0.066 60 0.031
52.05 0.071 64.29 0.033
54.3 0.076 68.58 0.035
56.5 0.081 72.86 0.037
58.64 0.086 77.15 0.039
60.74 0.091 81.43 0.041
62.81 0.096 85.72 0.055
64.84 0.1 90 0.06
66.84 0.105 94.29 0.065
68.8 0.11 98.58 0.069
70.75 0.115 102.86 0.074
72.66 0.119 107.15 0.078

148
Table A4-2: Filtration Volume vs Time for 40 lb/1000gal borate crosslinked gel
Time (Min)
Filtration Volume (cm3)
Sample 1
Time (Min)
Filtration Volume (cm3)
Sample 1
Time (Min)
Filtration Volume
(cm3) Sample 3
Time (Min)
Filtration Volume (cm3)
Sample 3
1 0.025 21 0.114 1 0.006 21 0.026
2 0.035 22 0.116 2 0.008 22 0.026
3 0.043 23 0.119 3 0.01 23 0.027
4 0.05 24 0.121 4 0.011 24 0.027
5 0.056 25 0.124 5 0.013 25 0.028
6 0.061 26 0.126 6 0.014 26 0.028
7 0.066 27 0.129 7 0.015 27 0.029
8 0.07 28 0.131 8 0.016 28 0.03
9 0.075 29 0.133 9 0.017 29 0.03
10 0.079 30 0.136 10 0.018 30 0.031
11 0.082 31 0.138 11 0.019 31 0.031
12 0.086 32 0.14 12 0.02 32 0.032
13 0.09 33 0.142 13 0.02 33 0.032
14 0.093 34 0.144 14 0.021 34 0.032
15 0.096 35 0.147 15 0.022 35 0.033
16 0.099 36 0.149 16 0.022 36 0.033
17 0.102 37 0.151 17 0.023 37 0.034
18 0.105 38 0.153 18 0.024 38 0.034
19 0.108 39 0.155 19 0.024 39 0.035
20 0.111 40 0.157 20 0.025 40 0.035
A4.2 Results of Two-phase Flow Relative Permeability
Two-phase flow permeability measurements involved two different sets of experiments. In the
first set, effective gas permeability was measured for each core sample with borate crosslinked
gel filtrate as the liquid phase (wetting phase) for both imbibition and drainage cycles .In the
second set, water (aqueous) phase permeability was measured, this time with brine at various

149
saturations of the linear gel to simulate flow of formation fluids in the reservoir during imbibition
and cleanup.
Two-phase Flow Test: Sample A1 (0.185 mD) with Helium & Crosslinked Gel
Results of measurement of relative permeability to gas phase (helium) with crosslinked gel
solution as wetting phase at 20 lbm/1000 gal and 40 lbm/1000 gal are shown in Table A4-3.Gas
relative permeability is presented in Table A4-4.
Table A4-3: Relative permeability to brine for sample A1
Sw Krw @ 20
pptg Sw Krw @ 40 pptg
0.9 0.8 0.9 0.79
0.8 0.55 0.8 0.56
0.7 0.32 0.7 0.29
0.62 0.17 0.62 0.16
0.57 0.09 0.57 0.09
0.53 0.01 0.53 0.01
0.51 0 0.51 0.01
Table A4-4: Relative permeability to gas for sample A1
Sw Krg @ 20
pptg Sw Krg @ 40 pptg
0.95 0.81 0.91 0.78
0.81 0.55 0.81 0.53
0.7 0.34 0.71 0.32
0.6 0.16 0.63 0.15
0.57 0.1 0.58 0.1
0.53 0.01 0.54 0.01
0.5 0 0.52 0

150
Two-phase Flow Test: Sample B1 (0.0005 mD) with Helium & Crosslinked Gel
Results of measurement of relative permeability to liquid phase (brine) with borate crosslinked
gel solution as wetting phase at 20 lbm/1000 gal and 40 lbm/1000 gal polymer concentrations are
shown in Table A4-5 for sample 3. Relative permeability to gas with (drainage cycle) with
crosslinked gel as wetting phase was also measured and shown in Table A4-6
Table A4-5: Relative permeability to brine for sample B1
Sw Krw @ 20 pptg Sw Krw @ 40 pptg
0.81 0 0.81 0
0.82 0.00E+00 0.82 0.00E+00
0.83 0 0.83 0
0.84 0.02 0.84 0
0.85 0.02 0.85 0.03
0.86 0.05 0.86 0.04
0.87 0.1 0.87 0.08
0.88 0.17 0.88 0.16
0.89 0.29 0.89 0.29
0.9 0.49 0.9 0.46
0.91 0.73 0.91 0.7
Table A4-6: Relative permeability to gas for sample B1
Sw Krg @ 20
pptg Sw
Krg @ 40 pptg
0.95 0.74 0.91 0.74
0.81 0.49 0.81 0.46
0.7 0.25 0.71 0.25
0.6 0.1 0.63 0.09
0.57 0.01 0.59 0.01
0.53 0 0.54 0
0.5 0 0.53 0
151
Appendix B
Results of Multiphase Permeability Evolution with Methanol Additive
This appendix presents tabulated data from all the experiments from the Part II of this
study. The experiments were designed to investigate the effect of methanol on multiphase
permeability evolution in low permeability sandstone cores with slickwater, linear gel and borate
crosslinked gel fluid systems. Section B1 describes and summarizes measurements of surface
tension fracturing fluids with methanol. Section B2 presents a description and results of
multiphase permeability experiments conducted with the selected fracturing fluid systems.
B1 Measurements of Surface Tension as Function of Methanol Concentration
Measurements of surface tension for slickwater, linear gel and cross-linked gel fluids
were measured over range of methanol concentrations .Compositions of the fracturing fluid
systems is presented in Tables 5.1, 5.2 and 5.3 for slickwater, linear gels and crosslinked gels
respectively. Methanol concentration used where 2.5% vol, 5% vol and 10% vol. Surface tension
is obtained using a combination of capillary rise method and sessile drop method. Details of
calculations used are presented in section 6.2.3.Measurement of surface tension was conducted at
room temperature. Results of surface tension measurements are presented in Table B1

152
Table B1-1: Surface tension as a function of methanol concentration
Methanol
Concentration
(vol %)
Surface Tension (dynes/cm)
Slickwater
(0.1% FR)
Linear Gel
(20 lb/1000gal)
Borate Crosslinked
Gel
(20 lb/1000gal)
0 70.1 71 71.15
2.5 63 65 63
5 61 63 61
10 59 60 58
B2 Multiphase permeability flowtests
Multiphase permeability flow test consists of gas displacement experiments conducted to
displace liquid from core that is originally saturated with the fracturing fluid filtrate from the
selected test fluid systems. The saturated core represents s\potential saturation conditions in
invaded zone during hydraulic stimulation. Experiment conducted in two steps. In the first step,
gas displacement experiments are conducted with a specified pressure gradient over the core
sample. Gas flow rate, injected pore volumes of gas injected and expelled liquid data are obtained
in this step .In the second step, gas relative permeability measurements are obtained using pulse
decay techniques at different liquid saturations of the core sample. Pulse decay is selected to
measure gas relative permeability to minimize capillary end effects predominant in steady state
flow experiments with low permeability samples. Section B2.1 presents a description and results
of experiments conducted with slickwater. Sections B2.1 and B2.3 present experiments
conducted with linear gels and borate crosslinked gels fluids respectively.

153
B2.1 Multiphase Permeability Flowtests with Methanol and Slickwater
This section presents tabulated data of multiphase permeability flowtests conducted with
slickwater. Table B2.1 presents gas flowrate at outlet end of the core as a function of pore
volumes of injected gas in slickwater saturated core for different methanol concentrations.
Table B2.1: Pore volumes of gas injected vs outlet gas flowrate
PV q (cc/s)
SW+1%MeOH q (cc/s)
(SW+5% MEOH) q (cc/s)
(Brine+5% MEOH) q (cc/s)
(SW+5% MEOH)
4.46 0.06 0.06 0.06 0.06
15.59 0.06 0.06 0.06 0.06
26.71 0.18 0.11 0.06 0.04
44.52 0.15 0.22 0.12 0.2
55.65 0.29 0.28 0.18 0.2
75.68 0.27 0.2 0.27 0.2
145.8 0.43 0.28 0.39 0.44
210.02 0.57 0.59 0.48 0.4
862.97 0.53 0.54 0.6 0.68
1576.98 0.5 0.6 0.78 0.73
3278.18 0.51 0.64 0.81 0.71
5555.44 0.55 0.67 0.88 0.74
10503.2 0.61 0.69 0.99 0.87
15204.79 0.66 0.73 1.05 0.93
21707.68 0.6 0.81 1.08 0.92
27633.9 0.67 0.84 1.15 1
28748.17 0.73 0.85 1.23 1.08
29862.44 0.72 0.87 1.46 1.31
30976.71 0.73 0.88 1.61 1.46
32648.11 0.77 1.08 1.76 1.53
43178.52 0.9 1.21 1.92 1.69
49816.45 1.11 1.42 2.57 1.84
50769.31 1.19 1.92 3.06 2.38
53181.96 1.76 2.07 3.37 2.99
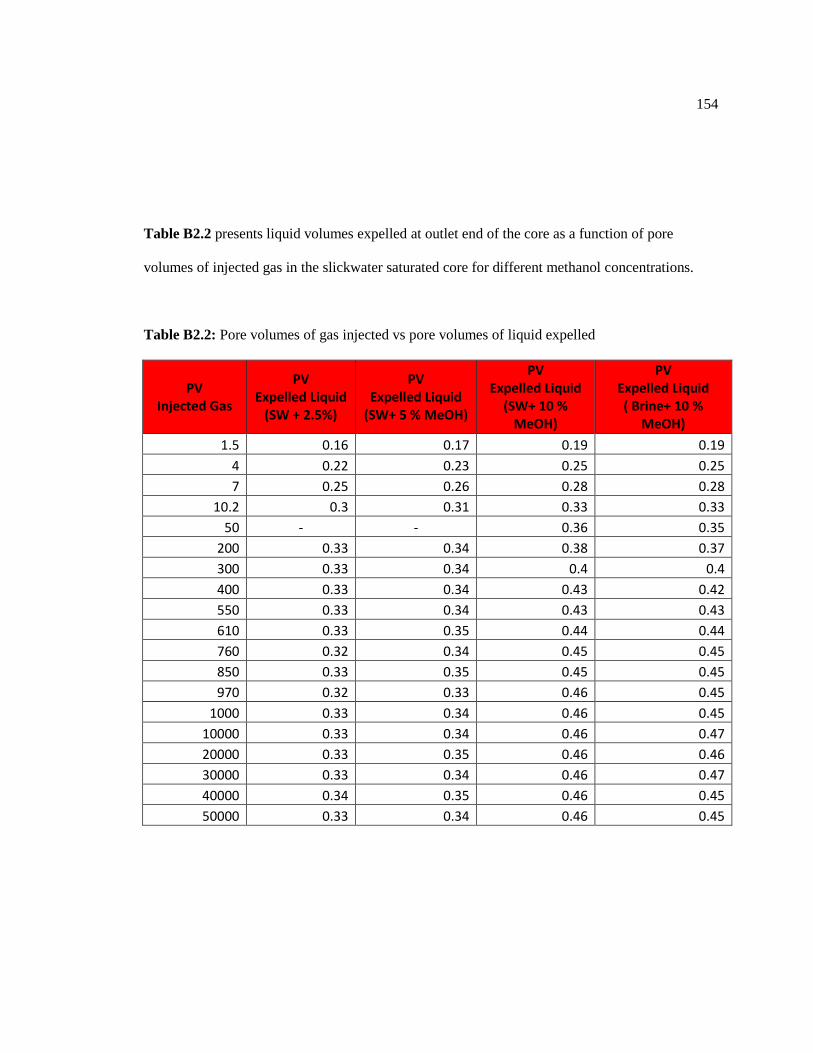
154
Table B2.2 presents liquid volumes expelled at outlet end of the core as a function of pore
volumes of injected gas in the slickwater saturated core for different methanol concentrations.
Table B2.2: Pore volumes of gas injected vs pore volumes of liquid expelled
PV Injected Gas
PV Expelled Liquid
(SW + 2.5%)
PV Expelled Liquid
(SW+ 5 % MeOH)
PV Expelled Liquid
(SW+ 10 % MeOH)
PV Expelled Liquid ( Brine+ 10 %
MeOH)
1.5 0.16 0.17 0.19 0.19
4 0.22 0.23 0.25 0.25
7 0.25 0.26 0.28 0.28
10.2 0.3 0.31 0.33 0.33
50 - - 0.36 0.35
200 0.33 0.34 0.38 0.37
300 0.33 0.34 0.4 0.4
400 0.33 0.34 0.43 0.42
550 0.33 0.34 0.43 0.43
610 0.33 0.35 0.44 0.44
760 0.32 0.34 0.45 0.45
850 0.33 0.35 0.45 0.45
970 0.32 0.33 0.46 0.45
1000 0.33 0.34 0.46 0.45
10000 0.33 0.34 0.46 0.47
20000 0.33 0.35 0.46 0.46
30000 0.33 0.34 0.46 0.47
40000 0.34 0.35 0.46 0.45
50000 0.33 0.34 0.46 0.45

155
Table B2.3 presents gas relative permeability data obtained from pulse decay experiments as a
function of gas saturation in slickwater saturated cores at different methanol concentrations
Table B2.3: Gas saturation vs gas relative permeability
Sg Krg
SW + 2.5% MeOH Krg
SW + 5% MeOH Krg
SW + 10% MeOH Krg
Brine + 10% MeOH
0.02 0.02 0.02 0.02 0.02
0.06 0.02 0.02 0.02 0.02
0.1 0.05 0.03 0.01 0.02
0.16 0.04 0.06 0.06 0.04
0.2 0.08 0.08 0.06 0.05
0.27 0.07 0.06 0.06 0.08
0.3 0.12 0.08 0.12 0.11
0.36 0.15 0.16 0.11 0.13
0.38 0.14 0.15 0.18 0.16
0.4 0.13 0.16 0.2 0.21
0.41 0.14 0.17 0.19 0.21
0.45 0.15 0.18 0.2 0.23
0.53 0.16 0.18 0.23 0.26
0.58 0.18 0.19 0.25 0.28
0.63 0.16 0.21 0.24 0.28
0.64 0.18 0.22 0.26 0.3
0.67 0.19 0.22 0.28 0.32
0.69 0.19 0.23 0.34 0.38
0.72 0.19 0.23 0.38 0.42
0.76 0.2 0.28 0.4 0.46
0.78 0.24 0.32 0.44 0.5
0.79 0.29 0.37 0.48 0.67
0.82 0.31 0.5 0.62 0.8
0.88 0.46 0.54 0.78 0.88

156
B2.3 Multiphase Permeability Flowtests with Methanol and Linear Gel
This section presents tabulated data of multiphase permeability flowtests conducted with
slickwater. Table B2.3 presents gas flowrate at outlet end of the core as a function of pore
volumes of injected gas in slickwater saturated core for 2.5% methanol concentrations. Table
B2.4 and B2.5 presents gas flowrate at outlet end of the core as a function of pore volumes of
injected gas in slickwater saturated core for 5% and 10 % methanol concentrations respectively.
Table B2.4: Gas flowrate vs pore volumes of injected gas for 2.5% methanol concentration
PV q (cc/s)
Linear Gel+ 2.5% MeOH PV
q (cc/s) Linear Gel+ 2.5% MeOH
4 0 210 0.89
10 0.02 500 1.01
20 0.02 1000 1.05
55 0.03 5000 1.09
75 0.38 7000 1.31
84 0.45 8000 1.31
95 0.51 9000 1.32
100 0.61 10000 1.34
120 0.62 15000 1.42
140 0.64 21278 1.5
150 0.68 25204 1.57
164 0.73 50769.31 1.65
170 0.77 53181 1.69
180 0.82 53181.96 1.75
190 0.86 55100 1.73
200 0.89 - -
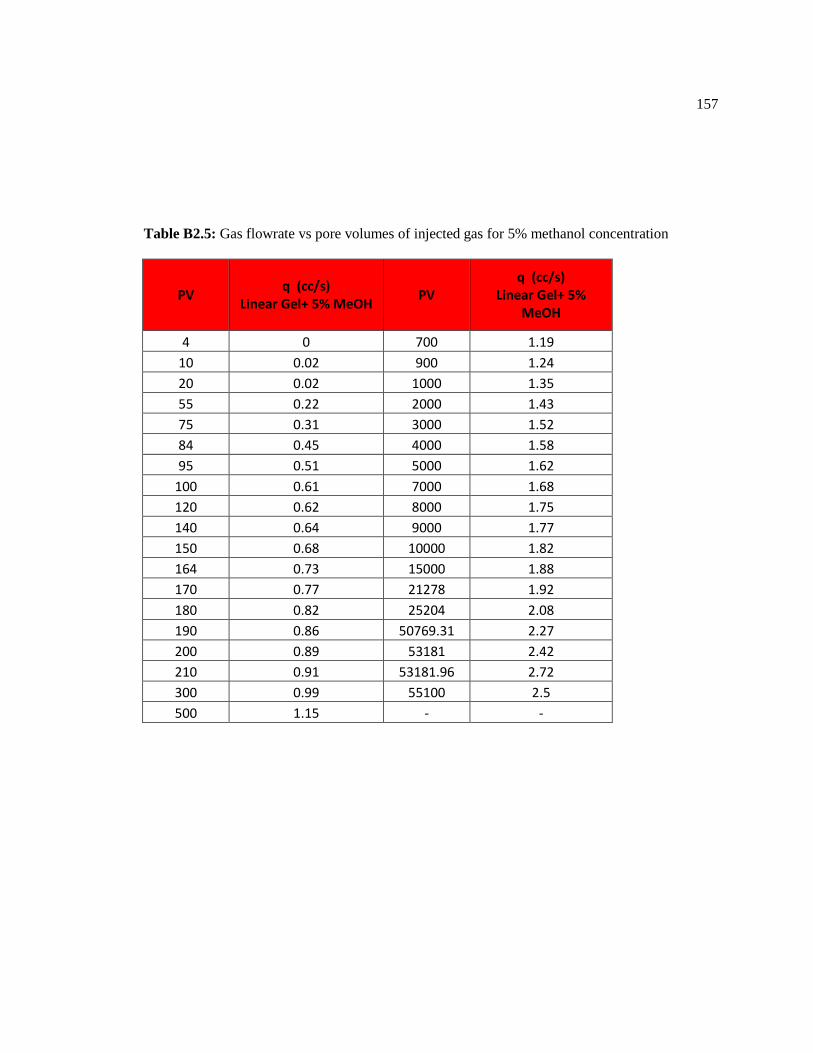
157
Table B2.5: Gas flowrate vs pore volumes of injected gas for 5% methanol concentration
PV q (cc/s)
Linear Gel+ 5% MeOH PV
q (cc/s) Linear Gel+ 5%
MeOH
4 0 700 1.19
10 0.02 900 1.24
20 0.02 1000 1.35
55 0.22 2000 1.43
75 0.31 3000 1.52
84 0.45 4000 1.58
95 0.51 5000 1.62
100 0.61 7000 1.68
120 0.62 8000 1.75
140 0.64 9000 1.77
150 0.68 10000 1.82
164 0.73 15000 1.88
170 0.77 21278 1.92
180 0.82 25204 2.08
190 0.86 50769.31 2.27
200 0.89 53181 2.42
210 0.91 53181.96 2.72
300 0.99 55100 2.5
500 1.15 - -

158
Table B2.6: Gas flowrate vs pore volumes of injected gas for 10 % methanol concentration
PV q (cc/s)
Linear Gel+ 10% MeOH PV
q (cc/s) Linear Gel+ 10% MeOH
4 0.02 700 1.31
10 0.14 900 1.39
20 0.15 1000 1.46
55 0.45 2000 1.54
75 0.51 3000 1.65
84 0.61 4000 1.74
95 0.62 5000 1.82
100 0.64 7000 2
120 0.68 8000 2.06
140 0.73 9000 2.17
150 0.77 10000 2.29
164 0.82 15000 2.44
170 0.86 21278 2.55
180 0.89 25204 2.68
190 0.91 50769.31 2.81
200 0.99 53181 2.9
210 1.04 53181.96 3.1
300 1.16 55100 2.98
500 1.19 - -

159
Tabulated data of pore volumes of liquid expelled from cores saturated with linear gel as
a function of pore volumes of gas injected are presented in Table B2.6.Gas relative permeability
data from pulse decay measurements are presented in Table B2.7.
Table B2.7: Pore volumes injected gas vs pore volumes of expelled liquid
PV Injected Gas
PV Expelled Liquid
(LG + 2.5%MeoH)
PV Expelled Liquid
(LG+ 5 % MeOH)
PV Expelled Liquid
(LG+ 10 % MeOH)
PV Expelled Liquid
( Brine+ 2.5 % MeOH)
1.5 0.16 0.18 0.19 0.19
4 0.22 0.22 0.25 0.25
7 0.25 0.25 0.28 0.28
10.2 0.26 0.27 0.33 0.33
50 0.27 0.28 0.35 0.35
200 0.28 0.3 0.37 0.37
300 0.29 0.32 0.4 0.4
400 0.3 0.32 0.42 0.42
550 0.32 0.33 0.44 0.44
610 0.33 0.34 0.44 0.44
760 0.33 0.35 0.45 0.45
850 0.33 0.35 0.45 0.45
970 0.33 0.39 0.45 0.45
1000 0.33 0.39 0.45 0.45
10000 0.33 0.39 0.45 0.45
20000 0.33 0.39 0.45 0.45
30000 0.33 0.39 0.45 0.45
40000 0.33 0.39 0.45 0.45
50000 0.33 0.39 0.45 0.45

160
Table B2.8: Gas saturation vs gas relative permeability
Sg Krg
LG + 2.5% MeOH Sg
Krg LG + 5% MeOH
Sg Krg
LG + 10% MeOH
0.8 0.35 0.91 0.71 0.9 0.81
0.78 0.33 0.81 0.46 0.8 0.54
0.77 0.31 0.71 0.24 0.7 0.31
0.75 0.29 0.63 0.13 0.63 0.16
0.7 0.24 0.62 0.1 0.58 0.1
0.63 0.16 0.54 0.08 0.54 0.09
0.59 0.1 0.53 0.07 0.52 0.08
0.54 0.01 0.4 0.05 0.47 0.07
0.53 0 0.35 0.01 0.43 0.06
- - - - 0.36 0.06
- - - - 0.32 0.06
- - - - 0.28 0.01

161
Appendix C
Results of Multiphase Permeability Evolution with Surfactant Additive
This appendix presents tabulated data from all the experiments from the Part II of this
study. The experiments were designed to investigate the effect of surfacatnts on multiphase
permeability evolution in low permeability sandstone cores with slickwater, linear gel and borate
crosslinked gel fluid systems. Two surfactants, Novec FC-4430, a nonionic fluorosurfactant and
Triton X-100, a hydrocarbon surfactant were used as remediation additives. Section C1 presents
results of surface tension measurements with the two surfactants with brine. Section C2 presents
results of multiphase permeability experiments conducted with the selected fracturing fluid
systems and the two surfactants.
C1 Measurements of Surface Tension with Surfactant
Measurements of surface tension of the two surfactants in brine at various surfactant
concentrations were obtained using a combination of capillary rise and sessile drop techniques.
Results of surface tension measurements are presented in Table C1.
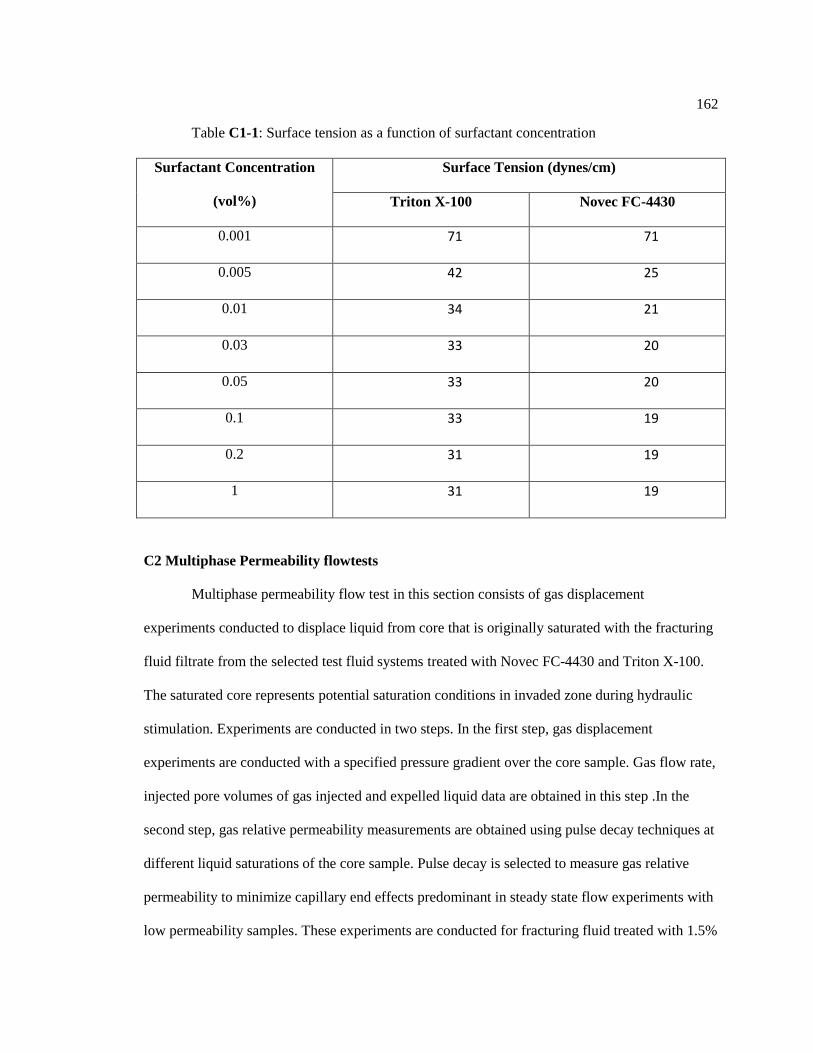
162
Table C1-1: Surface tension as a function of surfactant concentration
Surfactant Concentration
(vol%)
Surface Tension (dynes/cm)
Triton X-100 Novec FC-4430
0.001 71 71
0.005 42 25
0.01 34 21
0.03 33 20
0.05 33 20
0.1 33 19
0.2 31 19
1 31 19
C2 Multiphase Permeability flowtests
Multiphase permeability flow test in this section consists of gas displacement
experiments conducted to displace liquid from core that is originally saturated with the fracturing
fluid filtrate from the selected test fluid systems treated with Novec FC-4430 and Triton X-100.
The saturated core represents potential saturation conditions in invaded zone during hydraulic
stimulation. Experiments are conducted in two steps. In the first step, gas displacement
experiments are conducted with a specified pressure gradient over the core sample. Gas flow rate,
injected pore volumes of gas injected and expelled liquid data are obtained in this step .In the
second step, gas relative permeability measurements are obtained using pulse decay techniques at
different liquid saturations of the core sample. Pulse decay is selected to measure gas relative
permeability to minimize capillary end effects predominant in steady state flow experiments with
low permeability samples. These experiments are conducted for fracturing fluid treated with 1.5%
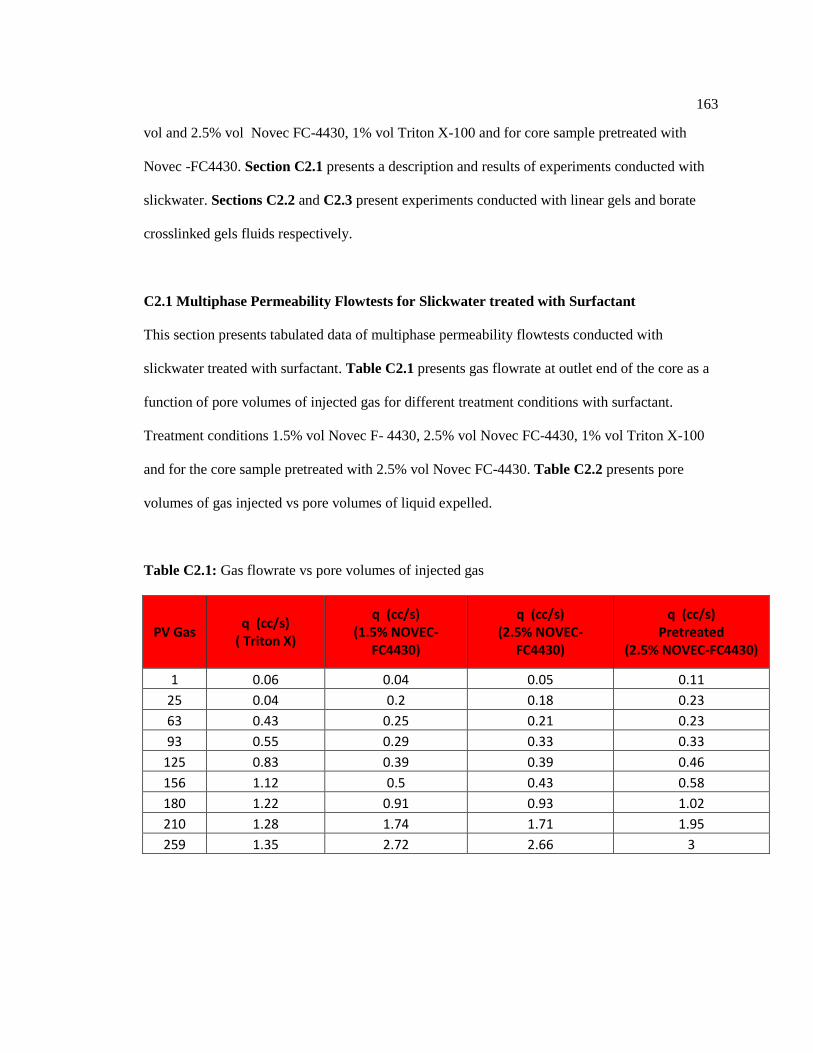
163
vol and 2.5% vol Novec FC-4430, 1% vol Triton X-100 and for core sample pretreated with
Novec -FC4430. Section C2.1 presents a description and results of experiments conducted with
slickwater. Sections C2.2 and C2.3 present experiments conducted with linear gels and borate
crosslinked gels fluids respectively.
C2.1 Multiphase Permeability Flowtests for Slickwater treated with Surfactant
This section presents tabulated data of multiphase permeability flowtests conducted with
slickwater treated with surfactant. Table C2.1 presents gas flowrate at outlet end of the core as a
function of pore volumes of injected gas for different treatment conditions with surfactant.
Treatment conditions 1.5% vol Novec F- 4430, 2.5% vol Novec FC-4430, 1% vol Triton X-100
and for the core sample pretreated with 2.5% vol Novec FC-4430. Table C2.2 presents pore
volumes of gas injected vs pore volumes of liquid expelled.
Table C2.1: Gas flowrate vs pore volumes of injected gas
PV Gas q (cc/s)
( Triton X)
q (cc/s) (1.5% NOVEC-
FC4430)
q (cc/s) (2.5% NOVEC-
FC4430)
q (cc/s) Pretreated
(2.5% NOVEC-FC4430)
1 0.06 0.04 0.05 0.11
25 0.04 0.2 0.18 0.23
63 0.43 0.25 0.21 0.23
93 0.55 0.29 0.33 0.33
125 0.83 0.39 0.39 0.46
156 1.12 0.5 0.43 0.58
180 1.22 0.91 0.93 1.02
210 1.28 1.74 1.71 1.95
259 1.35 2.72 2.66 3

164
Table C2.2: Pore volumes injected gas vs pore volumes of expelled liquid
PV Injected
Gas
PV Expelled Liquid
(Triton X)
PV Expelled Liquid (1.5% NOVEC-
FC4430)
PV Expelled Liquid (2.5% NOVEC-
FC4430)
PV Expelled Liquid
Pretreated (2.5% Novec FC-4430)
1.5 0.16 0.15 0.14 0.17
4 0.21 0.19 0.18 0.25
6.9 0.24 0.22 0.22 0.29
10 0.24 0.27 0.27 0.33
19 0.25 0.3 0.31 0.34
27 0.26 0.32 0.32 0.35
30 0.28 0.35 0.36 0.42
45 0.27 0.36 0.35 0.44
58 0.3 0.38 0.37 0.43
67 0.32 0.39 0.38 0.43
88 0.31 0.4 0.41 0.46
90 0.32 0.44 0.46 0.46
105 0.32 0.46 0.47 0.48
120 0.31 0.47 0.46 0.5
130 0.32 0.49 0.5 0.5
140 0.32 0.52 0.5 0.52
150 0.31 0.55 0.53 0.58
165 0.31 0.56 0.57 0.6
170 0.31 0.56 0.55 0.64
180 0.31 0.56 0.56 0.68
190 0.31 0.56 0.57 0.69
205 0.31 0.56 0.56 0.69
210 0.31 0.56 0.57 0.68
225 0.31 0.56 0.54 0.69
240 0.31 0.56 0.57 0.69
250 0.31 0.56 0.58 0.68
260 0.31 0.56 0.57 0.67
300 0.31 0.56 0.54 0.69
500 0.31 0.56 0.56 0.68
1000 0.31 0.56 0.56 0.69

165
Gas relative permeability as a function of gas saturation is presented in Table C2.3 for slickwater
with 1% vol Triton X,1.5%Novec-FC4430 and 2.5% vol Novec FC-4430.Table C2.4 presents
gas relative permeability data for core pretreated with 2.5% vol Novec FC-4430.
Table C2.3: Gas saturation vs gas relative permeability
Sg Krg
(1% Triton X) Sg
Krg (1.5% NOVEC-FC4430)
Sg Krg
(2.5% NOVEC-FC4430)
0.91 0.35 0.91 0.71 0.91 0.71
0.81 0.33 0.81 0.46 0.81 0.47
0.71 0.31 0.71 0.24 0.71 0.26
0.63 0.29 0.63 0.13 0.63 0.11
0.62 0.24 0.62 0.1 0.62 0.11
0.54 0.16 0.54 0.08 0.54 0.11
0.53 0.1 0.53 0.07 0.53 0.08
0.4 0.01 0.4 0.05 0.4 0.07
0.35 0 0.35 0.01 0.35 0.02
0 0 0 0 0 0
0 0 0 0 0 0
0 0 0 0 0 0
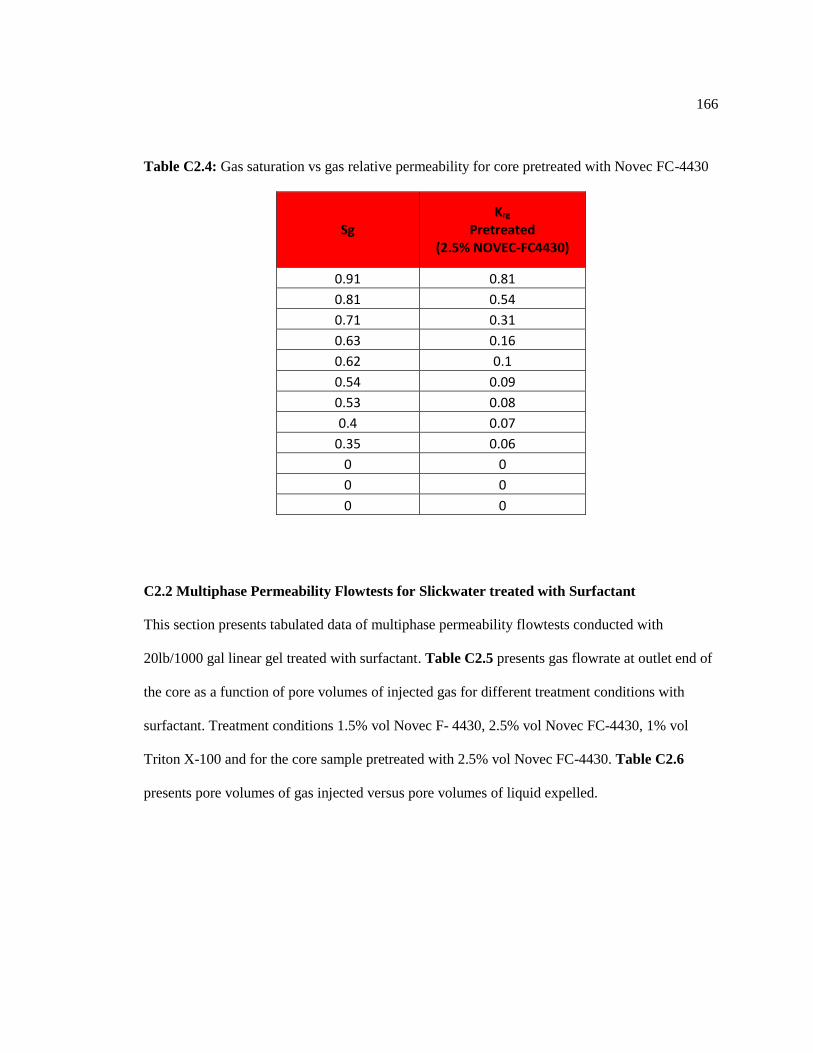
166
Table C2.4: Gas saturation vs gas relative permeability for core pretreated with Novec FC-4430
Sg Krg
Pretreated (2.5% NOVEC-FC4430)
0.91 0.81
0.81 0.54
0.71 0.31
0.63 0.16
0.62 0.1
0.54 0.09
0.53 0.08
0.4 0.07
0.35 0.06
0 0
0 0
0 0
C2.2 Multiphase Permeability Flowtests for Slickwater treated with Surfactant
This section presents tabulated data of multiphase permeability flowtests conducted with
20lb/1000 gal linear gel treated with surfactant. Table C2.5 presents gas flowrate at outlet end of
the core as a function of pore volumes of injected gas for different treatment conditions with
surfactant. Treatment conditions 1.5% vol Novec F- 4430, 2.5% vol Novec FC-4430, 1% vol
Triton X-100 and for the core sample pretreated with 2.5% vol Novec FC-4430. Table C2.6
presents pore volumes of gas injected versus pore volumes of liquid expelled.

167
Table C2.5: Gas flowrate vs pore volumes of injected gas
PV Gas q (cc/s)
( Triton X) q (cc/s)
(1.5% NOVEC-FC4430)
q (cc/s) (2.5% NOVEC-
FC4430)
q (cc/s) Pretreated
(2.5% NOVEC-FC4430)
1 0.05 0.1 0.11 0.15
4 0.02 0.1 0.11 0.15
8 0.18 0.22 0.24 0.32
10 0.22 0.19 0.21 0.28
20 0.32 0.34 0.37 0.47
34 0.22 0.32 0.34 0.52
43 0.38 0.53 0.57 0.8
55 0.39 0.61 0.79 0.88
61 0.49 0.65 0.7 0.98
77 0.48 0.62 0.66 1.01
80 0.58 0.61 0.65 1.05
95 0.48 0.66 0.71 1.09
109 0.55 0.75 0.81 1.15
123 0.7 0.86 0.91 1.17
134 0.72 0.77 0.83 1.16
175 0.66 0.85 0.92 1.28
198 0.68 0.9 0.97 1.36
211 0.71 0.91 0.95 1.33
221 0.68 0.92 0.99 1.38
261 0.8 0.97 1.06 1.48
275 0.96 1.15 1.24 1.73
283 1.09 1.34 1.44 2.01
291 1.13 1.47 1.6 2.23
310 1.74 2.18 2.35 3.27

168
Table C2.6: Pore volumes injected gas vs pore volumes of expelled liquid
PV Injected Gas
PV Expelled Liquid
(Triton X)
PV Expelled Liquid (1.5% NOVEC-
FC4430)
PV Expelled Liquid (2.5% NOVEC-
FC4430)
PV Expelled Liquid
Pretreated (Novec FC-4430)
1.5 0.15 0.15 0.15 0.19
4 0.19 0.19 0.19 0.25
6.9 0.22 0.22 0.22 0.28
10 0.29 0.27 0.27 0.33
19 0.3 0.3 0.31 0.35
27 0.33 0.32 0.32 0.37
30 0.29 0.35 0.36 0.4
45 0.32 0.36 0.36 0.42
58 0.32 0.38 0.37 0.43
67 0.31 0.39 0.39 0.44
88 0.32 0.4 0.41 0.45
90 0.31 0.44 0.42 0.46
105 0.32 0.46 0.47 0.48
120 0.32 0.47 0.48 0.49
130 0.3 0.49 0.49 0.52
140 0.29 0.52 0.53 0.54
150 0.31 0.55 0.55 0.58
165 0.33 0.56 0.56 0.6
170 0.33 0.56 0.56 0.64
180 0.33 0.56 0.56 0.67
190 0.33 0.56 0.56 0.68
205 0.33 0.56 0.57 0.68
210 0.33 0.56 0.56 0.68
225 0.33 0.56 0.56 0.69
240 0.33 0.56 0.58 0.69
250 0.33 0.56 0.57 0.69
260 0.33 0.56 0.57 0.69
300 0.33 0.56 0.55 0.69
500 0.33 0.56 0.55 0.69
1000 0.33 0.56 0.56 0.69

169
Gas relative permeability as a function of gas saturation is presented in Table C2.7 for linear gel
with 1.5%Novec-FC4430 and 2.5% vol Novec FC-4430. Table C2.8 presents with gas relative
permeability data for linear gel treated with 1% vol Triton X. Table C2.9 presents gas relative
permeability data for core pretreated with 2.5% vol Novec FC-4430.
Table C2.7:Gas saturation vs gas relative permeability for linear gel treated with Novec FC-4430
Sg Krg
(1.5% NOVEC-FC4430)
Sg Krg
Pretreated (2.5% NOVEC-FC4430)
0.02 0.03 0.02 0.04
0.06 0.04 0.1 0.07
0.29 0.08 0.2 0.15
0.35 0.19 0.3 0.21
0.36 0.2 0.36 0.29
0.42 0.16 0.45 0.3
0.49 0.21 0.49 0.31
0.63 0.22 0.55 0.33
0.71 0.25 0.67 0.36
0.78 0.3 0.76 0.39
0.85 0.39 0.79 0.54
0.9 0.59 0.88 0.88

170
Table C2.8: Gas saturation vs gas relative permeability for linear gel treated with Triton X-100
Sg Krg
( Triton X)
0.27 0.08
0.3 0.11
0.36 0.14
0.38 0.16
0.39 0.14
0.43 0.13
0.45 0.16
0.49 0.19
0.55 0.19
0.63 0.14
0.64 0.19
0.67 0.18
0.69 0.2
0.72 0.21
0.76 0.22
0.78 0.24
0.79 0.31
0.86 0.32
0.88 0.48

171
Table C2.9: Gas saturation vs gas relative permeability for core pretreated with Novec FC-4430
Sg Krg
Pretreated (2.5% NOVEC-FC4430)
0.02 0.04
0.1 0.07
0.2 0.15
0.3 0.21
0.36 0.29
0.45 0.3
0.49 0.31
0.55 0.33
0.67 0.36
0.76 0.39
0.79 0.54
0.88 0.88

VITA
Kelvin Nder Abaa
Kelvin Nder Abaa hails from the Benue State in Nigeria. After he graduated from Air
Force Military School in Jos, he obtained his Bachelors of Science degree in Chemical
Engineering in 2008 from the Federal University of Technology Minna, Nigeria. He worked
briefly as a production engineer for Total Elf Nigeria Limited in Port Harcourt, Nigeria. He
enrolled for graduate studies in Petroleum and Natural Gas Engineering at the Pennsylvania State
University in the fall of 2009 and obtained his M.S degree in 2011. Kelvin joined Schlumberger
Technology Corporation in 2011 and worked as a production stimulation engineer in Midland,
Texas. In August 2013, Kelvin resumed his graduate studies at the Department of Energy and
Mineral Engineering at Pennsylvania State University to pursue a PhD degree. In February 2016,
he earned his PhD in Energy and Mineral Engineering with Petroleum and Natural Gas
Engineering option.
While at Penn State University, Kelvin was an active member of the Society of
Petroleum Engineers. He served as a teaching assistant for a number of undergraduate courses
including the Drilling Laboratory, Reservoir Engineering Design and Formation Evaluation. He
was recognized as the Outstanding Teaching Assistant of the year in 2014. He also served as a
technical reviewer for the Journal of Petroleum Exploration and Production Technology
(JPEPT).He can be reached at [email protected]