laboratory skills for treatment plant …... laboratory skills for treatment plant ... examination...
TRANSCRIPT

LABORATORY SKILLS
FOR
TREATMENT PLANT OPERATORS
Solids
BOD
pH
Ammonia
Chlorine Residual
Fecal Coliform
Prepared and Presented by the IWEA Laboratory Committee Members for the 08/08/2013workshop.
1

LABORATORY SKILLS WASTEWATER PLANT OPERATORS
CONTENTS
Topic Page
Acknowledgement 3
Lab Language 4
Recognizing the "Standard" in Standard Methods 5
Quality Control 6
Sampling Techniques 7-8
Table 1: Containers, Preservatives and Hold Times 9
Suspended Matter – Total Non-filterable Residue 10-11
Fixed and Volatile Residue in Wastewater 12
Total Solids, Volatile Solids and Fixed Solids in Sludge 13-14
Biochemical Oxygen Demand (BOD5) 15
BOD Analysis – Std Methods 5210 16-20
BOD Troubleshooting Guide 21-23
pH 24
pH Laboratory Procedure 25
Ammonia Nitrogen by Electrode 26
Ammonia Laboratory Procedure 27-30
Ammonia Troubleshooting Guide 31-32
Total Chlorine Procedure 33-34
Fecal Coliform Laboratory Procedure 35-37
2

ACKNOWLEDGEMENT
This manual, Laboratory Skills for Treatment Plant Operators , was written by members of the laboratory committee of Illinois Water Environment Association.
The authors have attempted to site references for all procedures and information found in this manual.
The contents of this manual are intended for operating personnel only and are not intended to be a standard of the Water Environment Federation. Users of this manual who need further background should refer to Standard Methods for the Examination of Water and Wastewater.
The authors make no representation or warranty of any kind, whether expressed or implied, concerning the accuracy, completeness, suitability, or utility of any information, apparatus, product, or process discussed in this manual, nor do they assume any liability.
3

LAB LANGUAGE
It sometimes seems as if laboratory professionals use a complex language full of acronyms and technical jargon. Below are definitions for some commonly used terms.
Accuracy A measure of the agreement between the observed value and the true value.
Analyte The element or compound for which you are measuring.
Analytical Batch One to twenty samples of the same matrix that are prepared together with the same process and personnel and using the same lot of reagents and analyzed on the same day.
Calibration Curve A method for determining the concentration of a substance in an unknown sample by comparing the unknown to a set of standard samples of known concentration.
Calibration Curve Verification, CCV
A solution of known concentration containing the analyte(s) of interest. This solution is used to verify the calibration curve accuracy.
Chain of Custody An unbroken trail of accountability that ensures the physical security of samples, data, and records.
Laboratory Control Sample, LCS
A solution containing a known quantity of the analyte(s) of interest. The LCS is a measure of accuracy.
Matrix The main material of which a sample is composed.
Matrix Spike Duplicate, MSD
Samples to which a known amount of the analyte(s) of interest have been added.The MSD is a measure of precision.
Method Blank, MB A sample which does not contain the analyte of interest and which is carried through all sample preparation and analysis steps.
Precision A measure of the agreement between replicate analyses.
Standard Methods A comprehensive reference covers all aspects of water and wastewater analysis techniques. Standard Methods is a joint publication of the American Public Health Association (APHA), the American Water Works Association (AWWA),and the Water Environment Federation (WEF).
Standard Operating Procedure, SOP
Written laboratory specific document which details the method of an operation or analysis with procedures thoroughly described. The SOP is the accepted method for performing certain routine and repetitive tasks.
4

RECOGNIZING THE "STANDARD" IN STANDARD METHODS
It is important to be consistent when performing tests as prescribed in Standard Methods. The use ofspecific materials, conditions, and equipment are important to maintain uniformity between analystsand laboratories. By doing tests in the same manner, a technician in Yakima, Washington, caninterpret and relate to a test performed in Savannah, Georgia.
The wastewater plant operator or technician needs to be aware of conditions, equipment, andprocedures which make "standard" in Standard Methods. Below is a brief listing of common thingsto watch and some examples which can be applied to any test:
1. Specific materials: glass micro-fiber filters, distilled water
2. Specific apparatus: analytical balance, drying oven, muffle furnace, steam table, desiccator,suction apparatus
3. Specific chemicals and reagents in specified concentrations, normalities, or molarities.
4. Specific time: 45 minutes, 1 hour, etc.
5. Specific Temperature: 103-105oC, 180oC or 550oC
6. Technique and procedure: cycle of drying, cooling, desiccating and weighing to obtainconstant weight, filtering, supernating, settling, mixing, timing, rinsing, distilling,evaporating, washing, and measuring, as well as proper sequence of steps.
7. Calculations: proper use of units of volume and weight with proper conversions from litersto milliliters or grams to milligrams.
5

QUALITY CONTROL
"How do I know that my results are valid?"
Performing analyses according to EPA approved procedures, such as those found in StandardMethods, is a good way to produce reliable results. However, a simple “I performed the analysiscorrectly” may not convince someone to trust your analytical results.
A strong quality assurance program is the best way to assure and document analysis validity. Qualityassurance programs include all elements that can affect analyses. Some of these elements are:housekeeping, safety, appropriate standard operating procedures, training, reagent quality,instrument monitoring, and control charts.
The EPA approves methods for measuring pollutants in wastewater. You can find a list of theapproved methods in 40 CFR 136. In April 2012, the EPA issued a Methods Update Rule. This ruleincludes quality control requirements for laboratory analyses. These requirements specify whatquality control solutions need to be run with each analysis batch. When an analyst runs qc samplesalong with the analytical batch, and achieves acceptable results for those qc samples, it indicates thatthe sample results are also acceptable. If quality control solutions do not have acceptable results, it isan indication the analyst may need to trouble shoot an instrument or procedure before continuing touse it to analyze samples.
Some commonly used quality control solutions are:
MB, Method Blanks – Method blanks are used to determine if the preparation and analysisprocedures contaminate samples. Typically method blanks are deionized water. The methodblank must go through sample preparation steps. If you run deionized water on aninstrument without going through preparation steps, it is considered an instrument blank, nota method blank.
LCS, Laboratory Control Samples – Laboratory Control Samples measure analysis accuracy.You can purchase the LCS from a laboratory supply vendor. Many labs use a certifiedreference solution as a LCS. Certified reference standards should come with a certificate ofanalysis that lists the analytes present in the solution and the acceptable recovery range.
MSD, Matrix Spike Duplicates – Matrix Spike Duplicates measure analysis precision. TheMSD can indicate whether the sample matrix interferes with the analysis. The MSD must gothrough all the sample preparation and analysis steps.
When thinking about quality control, the key question to ask is: "WHY?" Why is this analysis resultaccurate? Or, why is an analysis result erroneous or not representative? It serves as a way toexamine technique, procedure, equipment, and ultimately, yourself.
-- 6 --

SAMPLING TECHNIQUES
Before laboratory analysts do any testing, they must be confident of the integrity of their sample.
Samples are taken for many reasons. Inside the treatment plant, these reasons include such things ascalculating plant loadings, monitoring treatment processes, determining compliance with NPDESpermit limits, providing test data for future design work, and identifying shock loads and possibleillegal discharges.
Samples can also be taken from the public sewer system or from discharge pipes from privateindustry. Many POTWs sample industry to monitor the discharge of non-compatible pollutantssuch as heavy metals, cyanide, FOG, etc.
There are several modes of sampling. These include grab, composite and split samples.
1. Grab samples are much as their name implies. Samples are taken to give an "instant in time"view of a discharge stream's characteristics. Grab samples are best for monitoring shockloads or sudden unusual changes (such as color or pH) in the waste stream.
2. Composite samples give a truer picture of a waste stream's overall (or average)characteristics. Composites samples are good for providing data to fulfill permitrequirements. Many NPDES permits require that analyses be made on flow proportionalcomposite samples in all cases except pH, chlorine residual, fecal coliform, and volatileorganics.
Composite samples can be either flow or time proportional. In flow proportional sampling,a measured amount of the stream is drawn into the sampling vessel for specified units offlow; for example, 100 mLs of sample may be drawn into the vessel for every 1000 gallonsof flow.
In time proportional sampling, a measured amount of the stream is drawn into the samplevessel for specified units of time; for example, 100 mLs of sample may be drawn into thevessel every hour. Time proportional composite sampling is most effective for discharges ofpredictable, continuous flow.
3. Split samples can be either grabs or composites. Split samples consist of a well mixedsample distributed into two containers. The two "splits" can then be sent to the laboratoryfor duplicate analysis or sent to different laboratories to compare their results.
-- 7 --
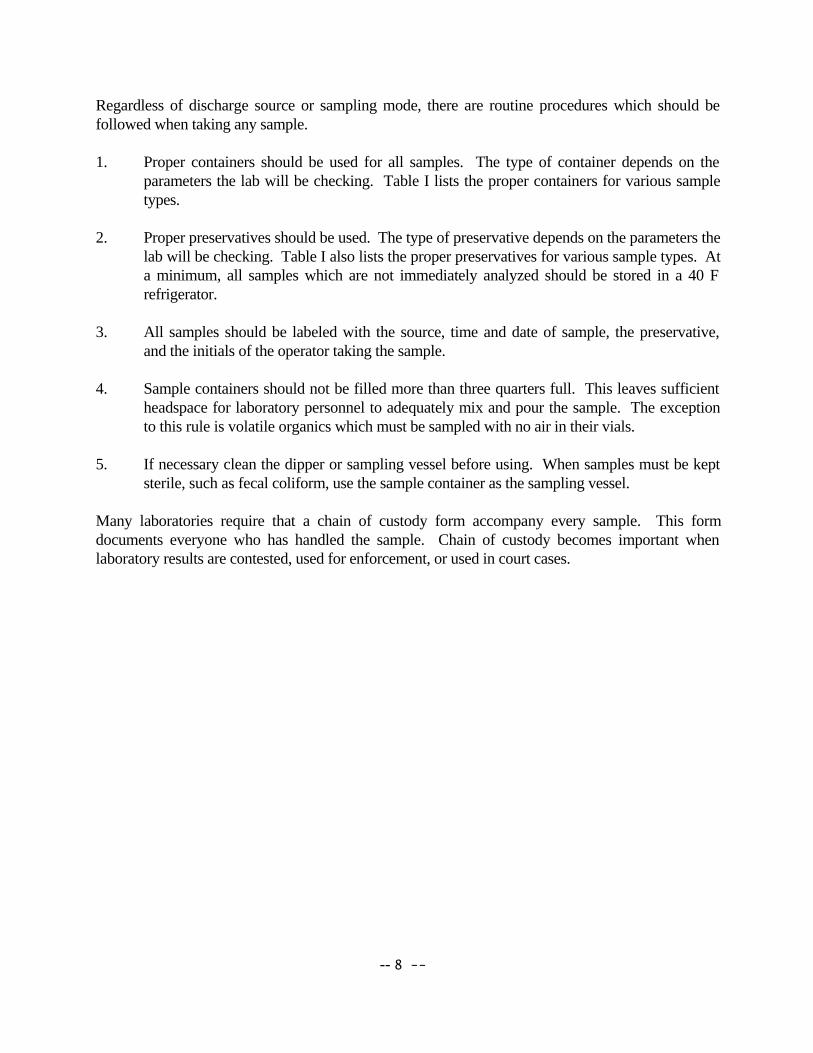
Regardless of discharge source or sampling mode, there are routine procedures which should befollowed when taking any sample.
1. Proper containers should be used for all samples. The type of container depends on theparameters the lab will be checking. Table I lists the proper containers for various sampletypes.
2. Proper preservatives should be used. The type of preservative depends on the parameters the
lab will be checking. Table I also lists the proper preservatives for various sample types. Ata minimum, all samples which are not immediately analyzed should be stored in a 40 Frefrigerator.
3. All samples should be labeled with the source, time and date of sample, the preservative,and the initials of the operator taking the sample.
4. Sample containers should not be filled more than three quarters full. This leaves sufficientheadspace for laboratory personnel to adequately mix and pour the sample. The exceptionto this rule is volatile organics which must be sampled with no air in their vials.
5. If necessary clean the dipper or sampling vessel before using. When samples must be keptsterile, such as fecal coliform, use the sample container as the sampling vessel.
Many laboratories require that a chain of custody form accompany every sample. This formdocuments everyone who has handled the sample. Chain of custody becomes important whenlaboratory results are contested, used for enforcement, or used in court cases.
-- 8 --

TABLE 1Containers, Preservatives, and Hold Times
PARAMETER CONTAINER PRESERVATIVE HOLD TIME
Ammonia Plastic, glass Cool, 4o CH2SO4 to pH 2
28 days
BOD & CBOD Plastic, glass Cool, 4o C 48 hours
COD Plastic, glass Cool, 4o CH2SO4 to pH 2
28 days
Cyanide Plastic, glass Cool, 4o CNaOH to pH 12
14 days
Fecal Coliform Plastic, glass Cool, 4o C 6 hours
Heavy Metals(except Hg)
Plastic, glass HNO3 to pH 2 6 months
Kjeldahl Nitrogen Plastic, glass Cool, 4o CH2SO4 to pH 2
28 days
Mercury Plastic, glass HNO3 to pH 2 28 days
Nitrate Plastic, glass Cool, 4o C 48 hours
Oil and Grease Glass Cool, 4o CH2SO4 to pH 2
28 days
Phenols Glass Cool, 4o CH2SO4 to pH 2
28 days
Solids:TSS, %TS, %TVS
Plastic, glass Cool, 4o C 7 days
Solids:Settleable
Plastic, glass Cool, 4o C 48 hours
Sulfate Plastic, glass Cool, 4o C 7 days
VOC 40 mL vial with teflonseptum
Cool, 4o C 14 days
BNA &Pesticides
Glass with teflon lined cap
Cool, 4o C 7 days before extraction;40 days after extraction
-- 9 --

Total Suspended Solids Dried at 103-105°C Standard Methods, 22nd Ed., 2540D
General Total suspended solids, TSS, is determined by filtering a well mixed sample through a glass fiberfilter disk. Suspended solids are the portion of total solids retained by filter paper after filtration. Either a filter holder apparatus or a Gooch crucible may be used. Total suspended solids may be used to measure solids balance in unit processes that involve solids capture.
Apparatus Membrane filter apparatus or Gooch crucible; Vacuum pump or water aspirator; Vacuum flask, approximately 500-mL; Drying oven, 103°C ± 4°C; Muffle furnace, controlled at 550°C, ± 50°C Analytical balance Glass fiber filter disks, without organic binder, such as Whatman 934AH, Gelman type
A/E, Milliport type AP40, or equivalent, to fit membrane filter apparatus or Gooch cru-cible.
Desiccator Graduated cylinder(s)
Reagents No reagents are required.
Procedure1. Place a glass fiber filter disk rough side up in the filter holder apparatus or Gooch cru-
cible.
2. Apply vacuum and wash the disk with three successive 20-mL portions of distilled water. Remove the filter disks from the filter holder apparatus and transfer to an aluminum or stainless steel container; or alternatively, remove the Gooch crucible and filter disk com-bination. Note: If volatile solids are to be determined, an aluminum container cannot be used to hold the filter disks, as aluminum containers cannot be heated to 550°C.
3. Dry the container and disk (or the crucible and filter disk combination if a Gooch crucibleis used) at 103-105°C for 1 hour or until constant weight is attained, or until the weight loss is less than 4% of the previous weight or 0.5 mg, whichever is less. If volatile solids are to be determined, ignite containers and disk (or Gooch crucible and disk) at 550°C for15 minutes. Allow the crucible to partially cool in air until most of the heat has dissi-pated; then cool in a desiccator to room temperature. Weigh the container and disk (or Gooch crucible and disk) immediately before use. Record this weight as W1, in grams.
-- 10 --

4. Shake the sample vigorously and transfer the desired volume to a graduated cylinder. Fil-ter the measured volume of a sample through the filter disk with a vacuum pump or wateraspirator, until all traces of water have passed through. With the suction on, rinse the graduated cylinder, filter funnel, wall and filter with three successive portions of distilled water, until all the water has passed through. Carefully remove the filter from the filter apparatus and transfer to the container. Alternatively remove the Gooch crucible and fil-ter; dry at 103° to 105°C for at least 1 hour or until constant weight is attained; cool in a desiccator to room temperature; weigh and record weight as W2, in grams.
Calculation
mg/L Total Suspended Solids= (W2 – W1) X 1000 mL/L X 1000 mg/g (1) mL of sample filtered
WhereW2 and W1 are measured in gramsW1 = weight of the prepared crucible or filterW2 = weight of the crucible or filter after the filtration step
-- 11 --

Fixed and Volatile Solids Ignited at 550°CStandard Methods, 22nd Ed., 2540E
GeneralThe fixed and volatile components in the total suspended solids may be determined by igniting the sample at 550° ± 50°C. The determination approximates roughly the amount of organic matter in the solid fraction of wastewater, activated sludge, industrial waste, or bottom sediments.
InterferenceThe glass fiber disk will fuse at slightly above 550°C, therefore, it is important not to exceed this temperature when the crucible or filter is ignited.
ReagentsNo reagents are required.
ProcedurePlace the previously dried and weighed sample residue from Step 4, Total Suspended Solids, in amuffle furnace at 550°C for 30 minutes. Allow the dish to partially cool in air until most of the heat has been dissipated, then cool in a desiccator to room temperature and weigh and record as W3, in grams. If an aluminum dish was used to hold the filter pad in the TSS determination, the pad must be transferred to another container before ignition. Aluminum disks cannot be fired at 550°C.
Calculationsmg/L Volatile Solids = (W2 – W3) (1000) mL/L (1000) mg/g (1)
mL sample
mg/L Fixed Solids = (W3 – W 1) (1000) mL/L (1000) mg/g (2)mL sample
WhereW1, W2, and W3 are expressed in gramsW1 = weight of the prepared crucible or filter padW2 = weight of crucible or filter pad after the sample filtration step, andW3 = weight of the crucible or filter pad after the ignition step
-- 12 --

Total Solids, Volatile Solids,And Fixed Solids in Sludge
Standard Methods 22nd Ed., 2540 G
General Volatile and fixed solids in sludge are determined by drying a weighed sample in an oven. Unlike total suspended solids in wastewater, which is expressed in milligrams per liter (ppm), solids in sludge are expressed in terms of percent by mass of the total amount of solids; this procedure makes the numbers more manageable.
Apparatus Drying oven Steam bath Evaporating dish Muffle furnace Desiccator Electronic balance (reading to 1 mg) or an analytical balance
Procedure1. After cleaning an adequate size evaporating dish, place it in a muffle furnace at 550°C for
15 to 20 minutes. Allow the dish to partially cool in air until most of the heat has dissi-pated, then cool in a desiccator to room temperature. Weigh dish and record as W1, in grams.
2. Pour a portion of the well-mixed sample (25 to 35 mL) into the dish, then weigh sample and dish together. Record as W2, in grams.
3. Place dish on steam bath and evaporate to dryness. Then put dish in drying oven for 1 hour at 103°C. Cool in a desiccator, and weigh. Record the weight as W3, in grams. Re-peat drying and cooling step, then re-weigh sample until constant weight is achieved (<4% difference). Note: Alternately, perform all drying operations in oven, skipping the steam bath. Determine drying time necessary for largest sample “wet” weight to achieve constant weight. Dry all samples to this minimum time. Four hours to overnight might be required.
4. After weighing the dish and dry solids, compute the percent to total solids (Equation 1).
5. Place dish from previous step in muffle furnace at 550°C until sample is burned com-pletely. Length of time complete burning depends on size of sample. If unsure that con-stant weight has been obtained, record mass from fist heating, then reheat and weigh again in the same manner until a constant mass reading is obtained.
Allow the crucible to partially cool in air until most of the heat has dissipated; then cool in a desiccator to room temperature. Weigh the dish and record as W4, in grams. The loss of weight (W3 –W4) is the volatile matter. The percent volatile matter may then be
-- 13 --

computed (Equation 2).
CalculationsPercent Total Solids = mass of dry solids (W3 – W1) X 100 (1)
Mass of wet sludge (W2 – W1)
Percent Volatile Solids= mass of volatile solids (W3 – W1) X 100 (2)
Mass of dry solids (W3 – W1)
Percent Fixed Solids = mass of ash (W4 – W1) X 100 (3) Mass of dry solids (W3-W1)
Where All weights are expressed in gramsW1 = mass of the prepared evaporating dishW2 = mass of the prepared dish and wet sampleW3 = mass of the dish and sample after the drying step, andW4 = mass of the dish and sample after the ignition step
ReferenceWater Pollution Control Federation, Simplified Laboratory Procedures for Wastewater Examination, Washington DC: Water Pollution Control Federation, 1985
-- 14 --

BIOCHEMICAL OXYGEN DEMAND (BOD5)
Biochemical oxygen demand, more commonly referred to as BOD5, is a laboratory test which has its widest application in measuring waste loadings to treatment plants, and in evaluating the efficiency of waste removal. BOD is used to determine, or quantify, the relative oxygen requirements of wastewater, effluents, and polluted waters. The test measures the biochemical degradation of organic materials and, to some extent, the oxidation of some inorganic materials. This is accomplished indirectly by measuring the oxygen used by a sample during a specified incubation period. The 5-Day BOD test (BOD5) is standard in nearly all laboratories and is specified in EPA permits for basic reporting.
The oxygen demand that the BOD test measures is the sum of carbonaceous and nitrogenous demands. Both types of demand are caused by the activity of bacteria present in a sample. The number and class of bacteria present influence the amount of each type of demand at work in a sample. Carbonaceous demand measures the oxygen demand of organic materials in the wastewater. Nitrogenous demand measures the oxygen demand of nitrogen containing materials such as ammonia in the wastewater.
A nitrification inhibiting chemical can be added to the BOD test so that only carbonaceous demandis measured. The chemical inhibition of nitrogenous demand provides a more direct and more reliable measure of BOD. Carbonaceous BOD (CBOD) is now commonly performed in wastewater treatment plants because it yields more accurate information on loadings and effluent quality.
The BOD method consists of filling an airtight bottle to overflowing with a sample and incubating at 20o C for 5 days. Dissolved oxygen (DO) is measured initially and after the incubation period. The BOD is calculated from the difference between the initial and final DO.
The BOD concentration in most wastewaters exceeds the working range of the test due to oxygen saturation limits. It is necessary to dilute many samples to bring them into an acceptable concentration range. Dilutions are made with specially prepared dilution water, which contains nutrients and buffer. The dilution water contains additives because bacterial growth, essential to the test, requires nutrients and a stable pH environment. Seed is sometimes also added to the sample as a source of additional bacteria. This is necessary when a sample, such as an industrial waste or a chlorinated effluent, does not have a sufficient population of bacteria to make the BOD test work.
-- 15 --

BOD ANALYSIS Standard Methods 5210 Biochemical Oxygen Demand
Hach Method 10360 Luminescence Measurement of Dissolved Oxygen
Sample Preservative: Refrigerate at 40C.Holding Time: 48 hrs at the time collection (for composite samples: time starts at the last time of the sample is collected)Storage of Samples: If analysis is begun within two hours of collection, cold storage is unnecessary. If analysis is not started within two hours, keep at or below 4ºC from time of collection.
EquipmentDissolved Oxygen Meter DO Probe 1- Membrane Electrode probe
2- LDO - Lumicescent probeBOD Bottles-300 ml and Stoppers BOD Bottle CapsIncubator (capable of maintaining 20+0.50C) Thermometer for IncubatorGraduated Cylinders Serological Pipets, Wide Tip: 2, 5, 10, 25 mlPipet filler or Pipet Bulb Aspirator Bottle w/Hose OutletC-Flex tubing Keck tubing ClamppH Meter
ReagentsDilution Water: - (Nutrients) Phosphate Butter SolutionMagnesium Sulfate Solution, 2.25% (w/v) Calcium Chloride Solution, 2.75% (w/v)Ferric Chloride Solution, 0.025% (w/v)Note: Vendors offer BOD dilution water reagents in pre-mixed, pre-measured amounts that can be added to specificwater volumes.
pH AdjustingSodium Hydroxide, 0.1N Hydrochloric Acid, 0.1N
De-chlorinatingSodium Sulfite Solution, 1.575 g/L Orthotolidine Solution (OT) purchase from a lab supply vendor
StandardGlucose/Glutamic Acid Standard (GGA)Weigh exactly 0.150 g each of glucose and glutamic acid which have been previously dried in the oven for one hour. Dilute to 1 L in a volumetric flask with DI water. This solution is good for three months.
*Note: Any of these reagents can be purchased commercially or be prepared as per the Standard Methods instructions.
Nitrification Inhibitor for C-BODNitrification Inhibitor: Purchase from Hach Company, catalog number 2533-35.
-- 16 --

10% Hydrochloric Acid (HCl) This solution can be used to clean the BOD glassware, especially the BOD Dilution bottle (carboy) and rinse the glassware at least 3 times. This solution can be used for the tubing also which is used for the siphoning of the water for the BOD test.
Preparation of Dilution Water – IMPORTANT STEP1. Source water may be distilled water or de-ionized water. It must be free of chlorine and
any organic containment.
2. Determine volume of dilution water needed to run all samples and Quality Control. Thisis usually best determined by multiplying the number of bottles to be set up by 300ml andadding 500ml.
3. Add the calculated amount of source water to an aspirator bottle with tubing hose outlet, tubing attached and tubing clamped off.
4. Add 1 ml of each of the Dilution Water Reagents per liter of water.
5. Aerate the water for at least one hour. Age the water for a minimum of three days,preferably 5 days if possible. It is important to keep the dilution water out of directsunlight. Before use, aerate the water again for at least one hour.
6. This water should be at 20+30C when ready to set up BOD.
7. DO of aerated dilution water should be 7.5-9.3mg/L. Water containing >9.3mgDO/L is supersaturated and must be allowed to reduce DO by allowing the bottle to stand un-shaken and un-aerated.
Do not underestimate the high quality of water and care the BOD test requires.
Seed Source Settled Primary Effluent: Mix primary effluent well, pour into Imhoff cone, allow 1 hour
settling. Pour supernatant off into a beaker to be used as seed. Commercially prepared seed is available. An example is Polyseed. Be sure to follow
manufacturer’s instructions for preparation.
Sample Pretreatment Avoid samples containing residual chlorine, if possible, usually by sampling ahead of the
chlorination process. However, if you think a sample is chlorinated you can test as follows:
Pour a small amount of sample into a beaker. Add a few drops of OT solution. If solution turns yellow, chlorine is present and must be reduced with sodium sulfite solution before BOD is set up.
-- 17 --

Check pH of sample. If pH is > 10, adjust to 7 with 1+1 hydrochloric acid. If pH is < 4, adjust to 7 with 1N sodium hydroxide.
Only if necessary, mix sample in blender until homogenized.
Remember the 2:1 Rule: for an acceptable DO depletion; the sample is to deplete > 2.0mg/l and have at least 1.0 mg/l of O2 remaining.
For high strength wastewater, especially industrial sources, plant re-cycle streams and landfill leachates, pre-dilution of the sample may be necessary in order for the BOD to be in the acceptable range and not completely depleted. Preparation of Equipment
Suggested Sample Bottles: 2 Blanks + 2GGA + 3 seed +3 x (samples) i.e. 1 sample = 10 bottles, 2 samples = 13 bottles Tubing used to siphon and deliver the dilution water must be clean and free of algae. Set-up and calibrate DO meter for reading Initial DO’s. Refer to manufacturer’s
instructions in regards to calibration of the DO meter.
Calibrate the DO Meter Daily You may use either air or Winkler method to calibrate the meter for the traditional
membrane probe. If doing the air calibration, follow the manufacturer’s instruction. If the DO meter readings drift or become erratic, it is time to replace the membrane.
When the DO probe is not in use, store the DO probe in a BOD bottle containing approximately one inch of water. This is important to maintain the probe in a humid environment.
Regarding the LDO probe calibration, it is slightly different from the membrane calibration – be sure to refer to manufacturer’s manual.
Setting Up Samples1. A minimum of 3 dilutions are suggested for each sample. The final DO reading must pro-
duce a 02 uptake 2.0mg/L and a residual DO 1.0 mg/L after 5 day incubation (2:1 Rule). Fivedilutions are recommended if sample BOD is unknown as 3 bottles may not be sufficient to produce a minimum of 2 bottles with final DO within the acceptable range.
2. Fill each BOD bottle to 1/3 to 1/2 full with the buffered dilution water.
3. Then transfer a known amount of sample into each sample bottle. If necessary prepare sampledilutions with pipets or graduated cylinders and then transfer to BOD bottles. It is important to record the dilutions of the samples. Add samples according to determined wastewater strength (usually based on COD).
Usually wastewater plant samples (influent and effluent strength do not vary widely) so the sample amounts will be similar from day to day.
4. Mix the sample well immediately before pipetting to avoid loss of solids by settling
-- 18 --

5. Add a range of seed to the “SEED” bottles. Add 2-4mls seed (depending on concentration ofseed being used) to the bottles requiring seed.
6. Add 6ml GGA Standard to each of the Standard BOD bottles. GGA requires seed addition.7. If doing a C-BOD, add nitrification inhibitor (2 shots) to the BOD bottle. Do this before you
add the final portion of the buffered dilution water.
8. Fill all bottles 1/3 of the way up the neck of the bottle with dilution water and stopper immediately. Deliver dilution water below the surface so no air is added to the sample. Important – DO NOT OVERFILL the BOD bottle with buffered water.
9. Read and record initial Dissolved Oxygen (DO) of each BOD bottle.
10. Insert stopper into BOD bottle. Make sure there is no air bubbles trapped under the stop-per. It is important to have water surrounding the stopper forming a water seal that prevents oxygen from entering or escaping the BOD bottle.
11. Cover the BOD bottle with the BOD bottle “over cap”. This helps prevent water from evapo-rating and helps maintain the water seal.
12. Incubate bottles in an incubator that maintains 20+0.50C for 5 days.
13. After 5 days remove bottles from incubator and read Final DO on calibrated DO meter and perform the calculations to determine the BOD.
14. Record the necessary QA data in the Quality Control logs. For example the pH and tempera-ture of the Buffered dilution water, the result of the Glucose- Glutamic Acid Std and any other standard performed.
-- 19 --

BOD Calculations
Unseeded Samplesmg/L BOD = D1 ‐ D2
PD1 = initial D.O.D2 = final D.O.P = sample percent (decimal form)
Seeded Samplesmg/L BOD = D1 ‐ D2 ‐ S
PD1 = initial D.O.D2 = final D.O.P = sample percent (decimal form)S = seed correction
Seed CorrectionS = D1 ‐ D2 x ml seed added to samples
P 300D1 = initial D.O.D2 = final D.O.P = percent seed in SEED sample bottle (decimal form)For example, when a 5% (15 mL) “SEED” is used and 2 mL seed is added to
samples
S = D1 ‐ D2 x 2 7.5 300
ReferenceStandard Methods, 18th Edition, Method 5210, pages 5-1 to 5-5.
-- 20 --

BOD TROUBLESHOOTING
Dilution Water – Unseeded BlankSYMPTOM POSSIBLE CAUSE REMEDY
Depletion in Blanks bottles is more than .0.2 mg/l after incubation
Contaminated distilled water Clean distilled water storage containersReduce the stills’ cooling water flow to increase removal of volatilesIf deionizer is used, change resin cylinders and micro‐filters
Contaminated buffers Buffers should be clear and show no visible precipitate. Phosphate buffers can become moldy or grow bacteria.
D.O. meter improperly calibrated or malfunctioning
Check membrane, calibration technique and re‐standardize sodium thiosulfate with bi‐iodate
Dirty Glassware (if only one bottle shows .0.2 mg depletion, dirty glassware is the likely cause)
Clean bottles, aerator tubing and equipment and develop astandard operating procedure(S.O.P.) for cleaning all equipment
Dilution water is supersaturated
Allow the water to sit withoutaeration at room temperaturefor one hour before use. Insure that no bubbles are trapped in the bottles and thebottle has a water seal.
-- 21 --

BOD TROUBLESHOOTING, CONTINUED
SYMPTOM POSSIBLE CAUSE REMEDY
Samples depletion is less than0.1 mg/l
Insufficient seed
Soap Contamination
Increase amount of seed
Re‐wash using 10% HCl, rinse and re‐rinse the glassware and tubing eliminate any soapresidue
Weak seed Collect seed from a different source or a source of greater strength such as primary effluent. Buy a commercial seed.
Seed contains a toxic material Change seed source
Distilled water contains a toxic material
Double distill or deionize water. Purchase a quantity ofbottled water to eliminate this possibility
Incubator temperature was too low
Check incubator temperature daily and insure constant operation
DO meter improperly calibrated
Check membrane calibration technique and restandardize sodium thiosulfate with bi‐iodate
D.O. of seeded blank after 5 days is >2.0 mg/l
Too much seed Reduce amount of seed
Incubator temperature too high
Check temperature and operation of the incubator
D.O. meter improperly calibrated
See above
-- 22 --
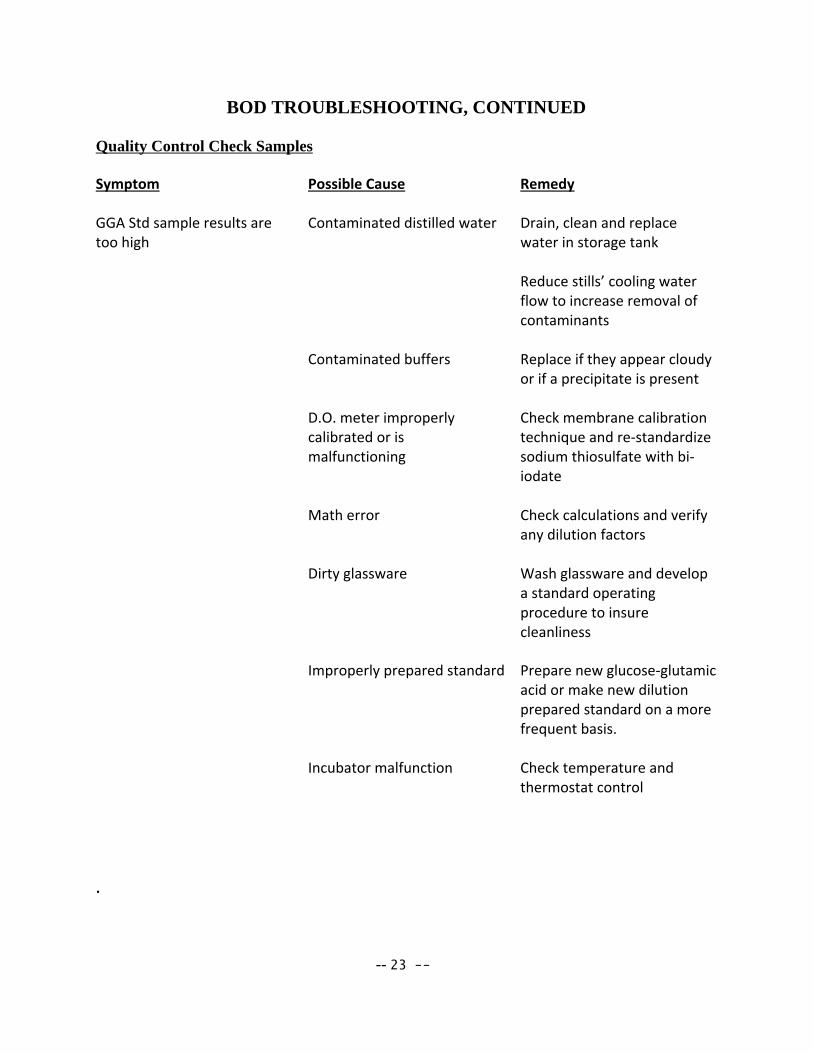
BOD TROUBLESHOOTING, CONTINUED
Quality Control Check Samples
Symptom Possible Cause Remedy
GGA Std sample results are too high
Contaminated distilled water Drain, clean and replace water in storage tank
Reduce stills’ cooling water flow to increase removal of contaminants
Contaminated buffers Replace if they appear cloudy or if a precipitate is present
D.O. meter improperly calibrated or is malfunctioning
Check membrane calibration technique and re‐standardize sodium thiosulfate with bi‐iodate
Math error Check calculations and verify any dilution factors
Dirty glassware Wash glassware and develop a standard operating procedure to insure cleanliness
Improperly prepared standard Prepare new glucose‐glutamicacid or make new dilution prepared standard on a more frequent basis.
Incubator malfunction Check temperature and thermostat control
.
-- 23 --

pH
pH is a term used to express the intensity of the acid or alkaline condition of a solution. It is important in wastewater treatment because the biological processes taking place only occur in a pH range favorable to the organisms involved. Also chemical processes used to coagulate wastewaters, dewater sludges, or oxidize certain substances, such as cyanide ions, require that pH be controlled within rather narrow limits. Further, the 503 sludge regulations which became effective in June 1993 have pH controls for the various sludge disposal options.
Definitions pH - an indication of the intensity of the acidic or basic character of a solution at a given temperature. pH can range in value from 0 - 14. Official definition is pH = -log [H+]
pH meter - an instrument for measuring pH, essentially a voltmeter specially manufactured to measure the potential created when a glass electrode is dipped into solution and to convert that potential to pH units
pH electrode - a closed end glass tube containing a solution of constant pH and silver wire or foil (for electrical contact). When a pH electrode is attached to a voltmeter the potential created is directly proportional to the hydrogen concentration of the solution.
Nernst equation - the voltage across a cell varies with the temperature, pressure, and ion concentration. In the case of pH, usually we need only be concerned with temperature.
-- 24 --

LABORATORY PROCEDUREpH
Collection of Sample Glass or plastic
PreservativeNone
Hold timeNone -Analyze samples immediately upon collection
InstrumentspH meter or ion selective meter with appropriate pH probe
ReagentspH buffers, two are recommended for precise measurement, with a check in the middle.
pH buffer 4.00, color coded red/pink, purchase from a laboratory vendorpH buffer 7.00, color coded yellow, purchase from a laboratory vendorpH buffer 10.00, color coded blue, purchase from a laboratory vendor
Test ProcedureBuffers and samples should be at the same temperature. If not, consult the Meter Instruction manual for temperature compensation.
Calibrate the meter as instructed by the manual.
Always use fresh buffers for calibration. Be sure to watch expiration date of buffers.
Rinse the probe between buffers and samples with deionized or distilled water.
Store probes in appropriate buffer or standard solution when not in use.
ReferencesStandard Methods, 21st Edition, Method 4500-H+
-- 25 --

AMMONIA NITROGEN BY SPECIFIC ION ELECTRODE
Nitrogen compounds exist in the atmosphere and in the life processes of all plants and animals.Nitrogen chemistry is complex because nitrogen can assume several oxidation states and changesin its oxidation state are brought about by living organisms.
The relationship between the various nitrogen oxidation states is called the Nitrogen Cycle.Learning about the Nitrogen Cycle aids in understanding the reactions taking place in treatmentprocesses.
Animal and human wastes contain appreciable amounts of protein and urea. When bacteria act onthese proteins and urea, they convert it to ammonia and other nitrogen containing compounds.This is why ammonia usually increases as wastewater flows through a treatment plant. Underaerobic conditions, nitrosomonas bacteria act on ammonia to produce nitrites. These nitrites, inturn, can be acted on by nitrobacter bacteria to form nitrates.
Under anaerobic conditions, both nitrates and nitrites can be reduced by a process calleddenitrification. First nitrates are reduced to nitrites. Then the nitrites are further reduced toproduce nitrogen gas which escapes to the atmosphere.
Many NPDES permits include ammonia monitoring requirements. A common way to test forammonia is to use a specific ion electrode. This analysis is similar to using a pH meter. Theanalyst calibrates a specific ion meter by measuring the millivolts of known concentrations ofammonia standards and plotting them on a graph. When the analyst reads the millivolts of anunknown sample, he can use the graph to determine the ammonia concentration.
Modern specific ion meters do the graphing for you. When the analyst calibrates the meter withknown standards, he enters their concentrations into the meter’s software. The meter uses itsinternal microprocessor to make the graph. Then, when the analyst measures a sample, the meterdisplays its ammonia concentration.
-- 26 --

AMMONIA LABORATORY PROCEDURE
Standard Methods 4500-NH3 D - 1998
Two major factors that influence ammonia method selection are concentration and presence ofinterferences. In general, direct manual determination of ammonia using an ISE electrode isconfined to drinking waters, clean surface or ground water, and good-quality nitrified wastewatereffluent. The procedure is listed in manufacturers’ instruction manuals and Standard Methods.
This method is applicable to the measurement of 0.03 to 1400 mg NH3-N/L.
Interferences
Grease, oil, and solvents can interfere with ammonia specific ion electrode measurement. Mostinterference can be eliminated through use of a preliminary distillation step. You can findinformation on how to distill samples prior to ammonia analysis in Standard Methods.’
Residual chlorine reacts with ammonia. If a sample is likely to contain residual chlorine, treatwith a decholorinating agent – such as sodium thiosulfate – prior to analysis.
Equipment
1. pH/Specific ion meter 2. Ammonia selective ion electrode3. Magnetic stir plate and stir bars4. Volumetric flasks, class A5. Volumetric pipettes or pipetters6. Graduated cylinders7. Beakers, 150 mL
Reagents
1. Ammonia free water – Most labs use DI water as their source for ammonia free water.
2. pH Indicating Ionic Strength Adjuster (ISA) – This is a 10N sodium hydroxide solutionwith a blue indicator. You can purchase pH indicating ISA from a laboratory supplyvendor.
3. 1000 mg/L stock ammonia solution – You can purchase stock ammonia solution from alaboratory supply vendor.
-- 27 --

-- 28 --

ISE Probe Preparation
Follow the manufacturer’s directions on filling the probe with electrolyte and installing themembrane. This step must be done the day before analysis if the probe is stored dry. Place theprepared ISE probe in DI water.
Standards
Prepare two or three standards that bracket the range you want to analyze. The instructions beloware for 0.2 mg/L, 2 mg/L and 20 mg/L calibration standards:
1. 20 mg/L calibration standard: Pipet 10 mL of the 1000 ppm standard into a 500 mL volumetric flask. Dilute to volume with ammonia free water. Mix well.
2. 2 mg/L calibration standard: Pipet 10 mL of the 20 mg/L calibration standard into a 100mL volumetric flask. Dilute to volume with ammonia free water. Mix well.
3. 0.2 mg/L calibration standard: Pipet 1.0 mL of the 20 mg/L calibration standard into a100 mL volumetric flask. Dilute to volume with ammonia free water. Mix well.
Calibration
Follow your specific ion meter’s calibration instructions. General procedure is below.
1. Calibrate meter with low level standard (0.2 mg/L standard) Pour the contents of the 0.2 mg/L standard into a beaker. Put a stir bar in the
beaker. Place beaker on magnetic stirrer and stir gently. Immerse the ammonia electrode in sample. Add 2 mL of the ISA. Be sure blue color persists. If not, add more ISA in 1 mL
increments. Wait for the mV reading to stabilize. This may take several minutes. Enter the
calibration standard’s concentration.
2. Calibrate the meter with increasingly higher concentration standards (2 mg/L) Repeat step 1 above for calibrating with the 2 mg/L standard.
3. Calibrate the meter with the highest concentration standard (20 mg/L) Repeat step 1 above for calibrating with the 20 mg/L standard
The meter’s reading of the standards should change about 59 mV with each standard.
-- 29 --
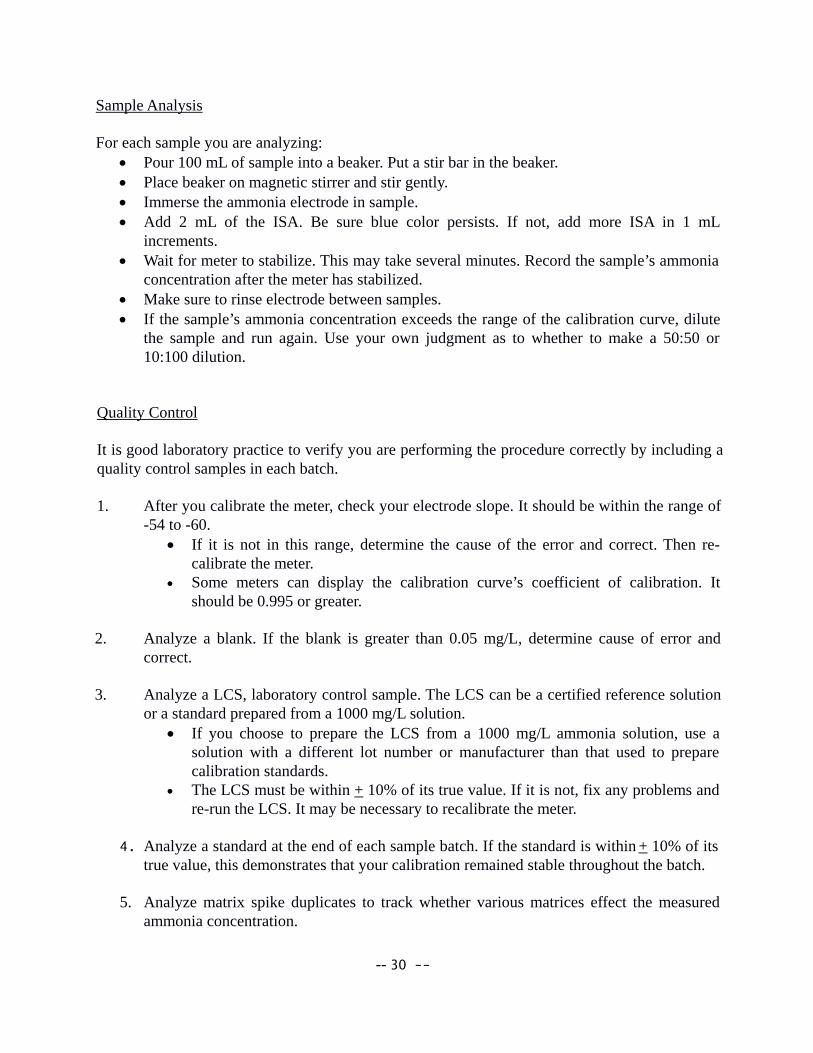
Sample Analysis
For each sample you are analyzing: Pour 100 mL of sample into a beaker. Put a stir bar in the beaker. Place beaker on magnetic stirrer and stir gently. Immerse the ammonia electrode in sample. Add 2 mL of the ISA. Be sure blue color persists. If not, add more ISA in 1 mL
increments. Wait for meter to stabilize. This may take several minutes. Record the sample’s ammonia
concentration after the meter has stabilized. Make sure to rinse electrode between samples. If the sample’s ammonia concentration exceeds the range of the calibration curve, dilute
the sample and run again. Use your own judgment as to whether to make a 50:50 or10:100 dilution.
Quality Control
It is good laboratory practice to verify you are performing the procedure correctly by including aquality control samples in each batch.
1. After you calibrate the meter, check your electrode slope. It should be within the range of-54 to -60.
If it is not in this range, determine the cause of the error and correct. Then re-calibrate the meter.
Some meters can display the calibration curve’s coefficient of calibration. Itshould be 0.995 or greater.
2. Analyze a blank. If the blank is greater than 0.05 mg/L, determine cause of error andcorrect.
3. Analyze a LCS, laboratory control sample. The LCS can be a certified reference solutionor a standard prepared from a 1000 mg/L solution.
If you choose to prepare the LCS from a 1000 mg/L ammonia solution, use asolution with a different lot number or manufacturer than that used to preparecalibration standards.
The LCS must be within + 10% of its true value. If it is not, fix any problems andre-run the LCS. It may be necessary to recalibrate the meter.
4. Analyze a standard at the end of each sample batch. If the standard is within + 10% of itstrue value, this demonstrates that your calibration remained stable throughout the batch.
5. Analyze matrix spike duplicates to track whether various matrices effect the measuredammonia concentration.
-- 30 --

Tips
Make sure all samples and standards are at room temperature before beginning analysis. After immersing electrode, make sure there are no air bubbles present on the electrode. It takes time for an ammonia electrode to stabilize, especially when measuring low
concentrations. Make sure to wait until the meter is stable before taking measurements. If samples have a particularly difficult matrix, you may want to use a preliminary
distillation step. You can find the distillation procedure in Standard Methods, Method4500-NH3-B.
If a sample’s ammonia concentration is greater than the highest calibration standard,dilute the sample and re-run. Make sure to multiply the result displayed on the meter bythe appropriate dilution factor.
-- 31 --

AMMONIA NITROGEN TROUBLESHOOTING
Symptom Possible Cause Remedy
Slow response time Ion electrode has fouled membrane
Change membrane
Low ammonia concentration in sample
Wait at least 5 minutes for a stable reading. The electrode response time is slower for low concentrations
Quality control check is unacceptable
Calibration failed Recalibrate with fresh standards. Check mV readings of both standards. The difference should be between 54and 60mV. If this slope is outside the acceptance range, change membrane.
QC check made incorrectly Try a fresh QC. Remake if necessary.
QC solution is a different temperature than standards
Some magnetic stirrers generate enough heat to change temperature. Place a piece of styrofoam beneath beaker.
Calibration curve no longer valid
Verify calibration every two hours by reading the 1 mg/l standard. If value had changed, recalibrate.
Ammonia lost to atmosphere Do not add NaOH until immediately prior to sample analysis. Ammonia is lost at high pH.
Air bubbles on probe After immersing electrodes insolution, check for any bubbles on membrane surfaceand remove by shaking.
-- 32 --

-- 33 --

AMMONIA NITROGEN TROUBLESHOOTING, CONTINUED
Symptom
Low ammonia recovery in sample
Possible Cause
Sample pH low
Remedy
Verify the pH of the sample isgreater than 11. Additional NaOH may be necessary, especially for preserved samples.
Calibration curve has shifted Verify calibration every two hours by reading the calibration check standard. If the value has changed, recalibrate.
Ammonia has been lost to atmosphere
Do not add NaOH until just prior to analysis. Ammonia islost at high pH.
Sample result is above the calibration range.
Ammonia concentration of sample is high.
Dilute sample to bring the reading within range. Remember to take dilution into account when reporting the ammonia result by multiplying by a volume factor.
-- 34 --

Analytical Method: Total Chlorine
IntroductionChlorine can be present in water as free chlorine and as combined chlorine. Both forms can coex-ist in the same solution and can be determined together as total chlorine. Free chlorine is present as hypochlorous acid or hypochlorite ion. Combined chlorine represents a combination of chlo-rine-containing compounds including but not limited to monochloramine, dichloramine, nitrogentrichloride,and other chloro derivatives. The combined chlorine oxidizes triiodide ion (I3–) to io-dine (I2). The iodine and free chlorine reacts with DPD (N,N-diethyl-p-phenylenediamine) to form a red solution. The color intensity is proportional to the total chlorine concentration. To de-termine the concentration of combined chlorine, run a free chlorine test and a total chlorine test. Subtract the results of the free chlorine test from the total chlorine test to obtain the combined chlorine concentration. EquipmentHach Pocket Colorimeter II10 mL samples cells with caps - catalog # 24276-0650 mL beakers
ReagentsDPD total chlorine reagent AccuVac ampoules - catalog # 25030-25
Sample Collection, Preservation and StorageTotal chlorine analysis is performed on grab samples and must be run within 15 minutes after collection. Samples may be collected in either polyethylene or equivalent plastic or glass con-tainers.
Quality ControlStandards may be purchased to verify accuracy. 20% of samples should be run in duplicate to verify precision.
Procedure1. Fill a 10 mL sample cell with sample (this is a sample blank). Collect at least 40 mL
of sample in a 50 mL beaker.
2. Press the power key to turn on the meter. The arrow in the display should indicate thelow range channel (LR).
3. Remove the instrument cap. Place the blank in the cell holder, with the diamond mark facing the keypad. Cover the cell with the instrument cap.
4. Press ZERO/SCROOL. The display will show “----“then “0.00”. Remove the blank.
-- 35 --

5. Fill a DPD total chlorine reagent AccuVac ampoule with sample. Note: Keep the tip immersed until the ampoule fills completely.
6. Quickly invert the ampoule several times to mix. Wipe off any liquid or fingerprints.
Note: A pink color will form if chlorine is present. Accuracy is not affected by undis-solved powder.
7. Insert the ampoule into the cell holder, and then cover with the instrument cap. Wait three to six minutes after filling the AccuVac ampoule.
8. Press READ/ENTER. The instrument will show ---- followed by the results in mg/L chlorine.
9. Record result.
References Standard Methods for the Analysis of Water and Wastewater, 20th Edition
Code of Federal Regulations (CFR) 40 Part 136, Guidelines establishing test procedures for the analysis of pollutants.
Hach Pocket Colorimeter II Instruction Manual, 4th Edition
Safety – Reference Laboratory Chemical Hygiene Plan for safety procedures.
Use of personal protective equipment (PPE) such as gloves, safety glasses is recommended.
Definitions – Laboratory Glossary of Definitions and Purposes
-- 36 --

Analytical Method: Fecal Coliform
IntroductionAnalysis is performed to determine the amount of fecal coliform bacteria present in effluent. Fe-cal coliform bacteria are present in warm-blooded mammals and can be associated with disease. There can be high densities of fecal coliform in the influent wastewater, therefore the effluent is disinfected prior to discharge.
EquipmentSterile Filter Funnel Assembly Vacuum source44.5o C Water Bath ForcepsBunsen burner - gas source Petri dishes - 47 mmMembrane filters - 0.45 micron pore size Igniter150 mm sterile petri dish Sterile Whirl Pak Bags
Reagentsm-FC agar Sterile rinse waterEthyl alcohol
Sample Collection, Preservation and StorageFecal coliform analysis is performed on grab samples and must be run within two hours, (max 6hrs) after collection. Samples should be kept at <8o C until analysis. Chain of Custody forms must be kept for samples and completed by sampler and receiving party.
Quality ControlThere are several measures of quality control performed with the analysis. Controls for the me-dia, rinse water and technique are set-up with each series of samples.
ProcedureDisinfect lab bench with ethyl alcohol to disinfect area where analysis is performed.
1. Arrange the required amount of m-FC agar plates on bench for number of samples to be run plus controls. Label plates with sample information and volume.
Note: Set-up two control plates with the samples, one is a sterile water control at the be-ginning of samples and a rinse control at the end.
2. Open up sterile 150 mm petri dish. Unwrap sterile filter assembly and place filter funnel on open petri dish. Place filter base in vacuum flask.
Note: Handle filter assembly aseptically, not touching surfaces that come into contact with samples.
-- 37 --
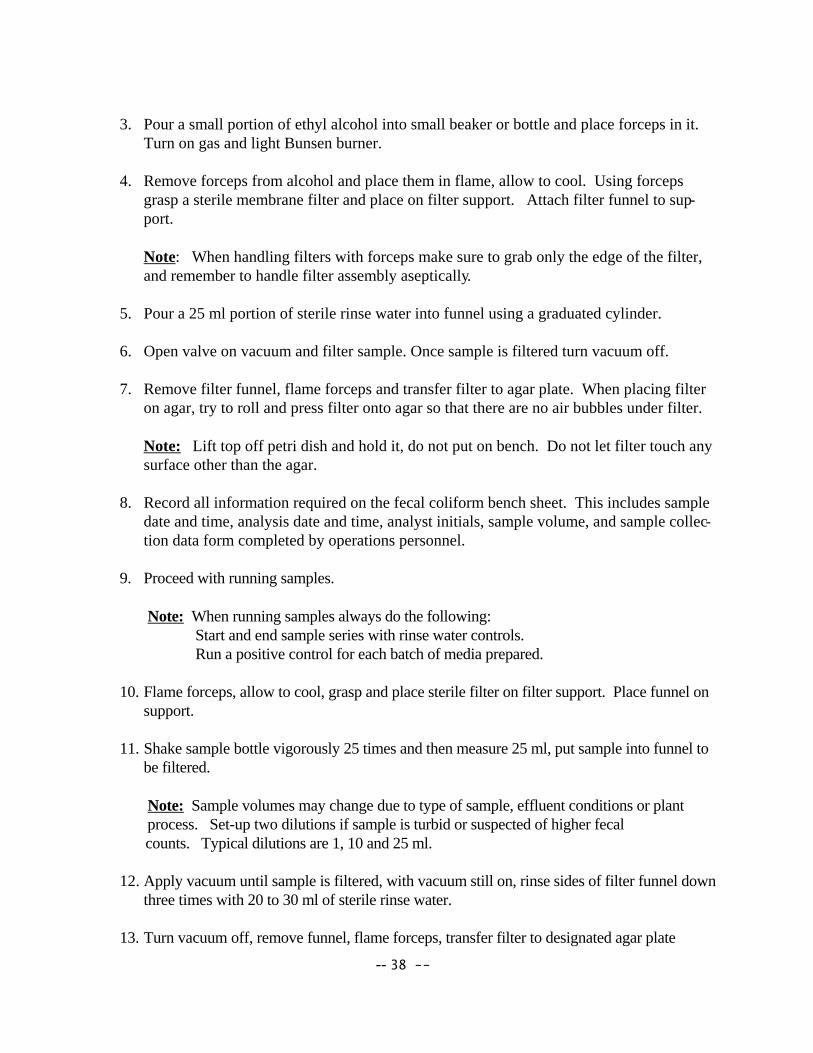
3. Pour a small portion of ethyl alcohol into small beaker or bottle and place forceps in it. Turn on gas and light Bunsen burner.
4. Remove forceps from alcohol and place them in flame, allow to cool. Using forceps grasp a sterile membrane filter and place on filter support. Attach filter funnel to sup-port.
Note: When handling filters with forceps make sure to grab only the edge of the filter, and remember to handle filter assembly aseptically.
5. Pour a 25 ml portion of sterile rinse water into funnel using a graduated cylinder.
6. Open valve on vacuum and filter sample. Once sample is filtered turn vacuum off.
7. Remove filter funnel, flame forceps and transfer filter to agar plate. When placing filter on agar, try to roll and press filter onto agar so that there are no air bubbles under filter.
Note: Lift top off petri dish and hold it, do not put on bench. Do not let filter touch any surface other than the agar.
8. Record all information required on the fecal coliform bench sheet. This includes sample date and time, analysis date and time, analyst initials, sample volume, and sample collec-tion data form completed by operations personnel.
9. Proceed with running samples.
Note: When running samples always do the following: Start and end sample series with rinse water controls. Run a positive control for each batch of media prepared.
10. Flame forceps, allow to cool, grasp and place sterile filter on filter support. Place funnel on support.
11. Shake sample bottle vigorously 25 times and then measure 25 ml, put sample into funnel to be filtered.
Note: Sample volumes may change due to type of sample, effluent conditions or plant process. Set-up two dilutions if sample is turbid or suspected of higher fecal
counts. Typical dilutions are 1, 10 and 25 ml.
12. Apply vacuum until sample is filtered, with vacuum still on, rinse sides of filter funnel downthree times with 20 to 30 ml of sterile rinse water.
13. Turn vacuum off, remove funnel, flame forceps, transfer filter to designated agar plate
-- 38 --

14. Repeat steps 11 - 14 for each sample or dilution.
15. After sample or dilution series is done, run a second 25 ml of sterile water.
16. Invert agar plates, put in Whirl Pak bag and place in 44.5o water bath for 24 + 2 hrs.
17. After the 24 + 2 hrs incubation time, remove plates from water bath and read using amicroscope. Record the number of fecal colonies (typical) and non-fecal colonies (atypical)in the respective columns on the Fecal Coliform Report, along with date and time read. Cal-culate the count per 100 ml using the correct volume factor.
Note: All plates are to be examined under the microscope with the lids off. Place plate under microscope with 10 to 40x magnification, illuminate with fluorescent light. Each colony is considered to have grown from one organism. Colonies are usually round to oval shaped and can be the size of a pinhead to larger. There are two types of colonies, typical and atypical. The differences for fecal coliform are as follows: colonies that have a blue color to them are considered fecal coliform or typical. Any blue tinge from light to dark blue signifies a fecal colony. Colonies that are yellow, green or clear are considered atypicalcolonies and not counted as fecal colonies.
18. Confirmation and calculation of fecal coliform counts.
Note: If the fecal coliform count exceeds the limit then colonies need to go through a confirmation process.
References Standard Methods for the Analysis of Water and Wastewater, 22nd Edition
Code of Federal Regulations (CFR) 40 Part 136, Guidelines establishing test procedures for the analysis of pollutants.
-- 39 --