lakshmi vilas bank - · pdf file 4 founded over 8 decades ago in 1926 under leadership of...
TRANSCRIPT
www.lvbank.comwww.lvbank.com
Lakshmi Vilas Bank
MARCH 2015

www.lvbank.comwww.lvbank.comwww.lvbank.comwww.lvbank.com
Agenda
2
Operating Overview
Bank Overview1
2
3
Financial Statements 5
Key Investment Highlights
Financial Analysis 4

www.lvbank.comwww.lvbank.com
BANK OVERVIEW
33
www.lvbank.comwww.lvbank.com 4
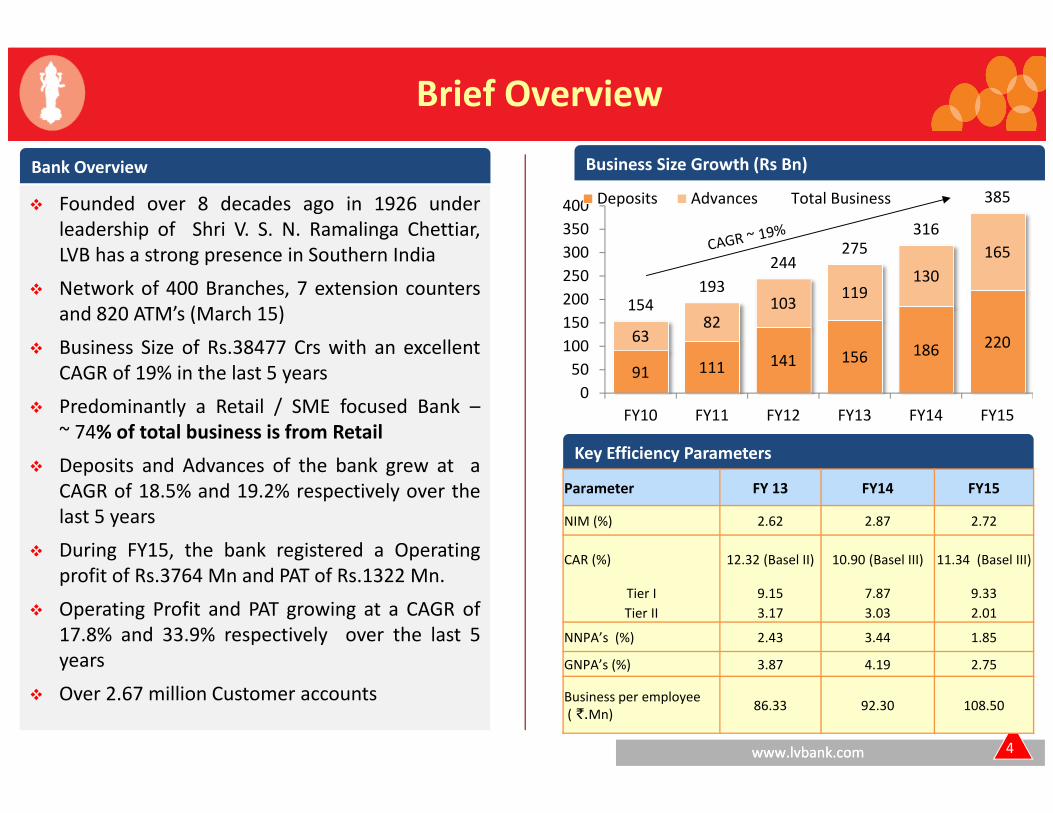
Founded over 8 decades ago in 1926 underleadership of Shri V. S. N. Ramalinga Chettiar,LVB has a strong presence in Southern India
Network of 400 Branches, 7 extension countersand 820 ATM’s (March 15)
Business Size of Rs.38477 Crs with an excellentCAGR of 19% in the last 5 years
Predominantly a Retail / SME focused Bank –~ 74% of total business is from Retail
Deposits and Advances of the bank grew at aCAGR of 18.5% and 19.2% respectively over thelast 5 years
During FY15, the bank registered a Operatingprofit of Rs.3764 Mn and PAT of Rs.1322 Mn.
Operating Profit and PAT growing at a CAGR of17.8% and 33.9% respectively over the last 5years
Over 2.67 million Customer accounts
Bank Overview Business Size Growth (Rs Bn)
Brief Overview
4
Key Efficiency Parameters
91 111 141 156 186 2206382
103 119130
165
154193
244275
316
385
050
100150200250300350400
FY10 FY11 FY12 FY13 FY14 FY15
Deposits Advances Total Business
Parameter FY 13 FY14 FY15
NIM (%) 2.62 2.87 2.72
CAR (%) 12.32 (Basel II) 10.90 (Basel III) 11.34 (Basel III)
Tier I 9.15 7.87 9.33Tier II 3.17 3.03 2.01
NNPA’s (%) 2.43 3.44 1.85
GNPA’s (%) 3.87 4.19 2.75
Business per employee ( `.Mn) 86.33 92.30 108.50

www.lvbank.comwww.lvbank.com 55As on 31st March, 2015
PAN Indian Network with Strong Presence in South India
Geographic Presence in India – # Branches Geographic Presence in India – Business Size [ FY15]
Split of Branches & Customers [FY15]
Branches Customers
Current network of 400 branches and
820 ATMS spread over 16 states
Tamilnadu48.4%
Karnataka15.0%
Maharashtra13.8%
Andhra Pradesh5.7%
Telangana5.3%
Gujarat1.8%
Kerala2.1%
Delhi3.3% Others
4.7%
Metro17%
Rural22%
Semi Urban34%
Urban27%
Metro14%
Urban28%
Semi Urban41%
Rural17%
Puduchery
Includes Andhra/Telangana

www.lvbank.comwww.lvbank.com
KEY INVESTMENT HIGHLIGHTS
66

www.lvbank.comwww.lvbank.com 7
Key Investment Highlights
Proven Business & Growth Track‐RecordOver 8 decades of operating experienceBusiness Size of Rs.38477 Crs with a CAGR of 19% in the last 5 yearsDeposits and Advances of the bank grew at a CAGR of 18.5% and 19.2% respectively over the last 5 years– Strong CD ratio of over 75%Consistently rising Net interest income with a CAGR of 16% during the last 5 years
Strong customer relations provide huge cross‐selling opportunities
Strong network of Customers Over 2.67 Million customer accounts– 41% from Semi‐Urban, 28% from Urban, 17% from Rural and 14% from Metropolitan region88 years of operating history has resulted in large number of loyal customers providing huge cross‐selling opportunities across various products
A strong South India focused franchise
Network of 400 branches, 7 extension counters and 820 ATMs across India (March 2015)~ 87% branches in Southern states of Tamilnadu, Andhra Pradesh, Telangana, Karnataka and KeralaDeep penetration in Tamilnadu, one of the most progressive Indian stateSlowly diversifying presence in other states
www.lvbank.comwww.lvbank.com 8
Key Investment Highlights
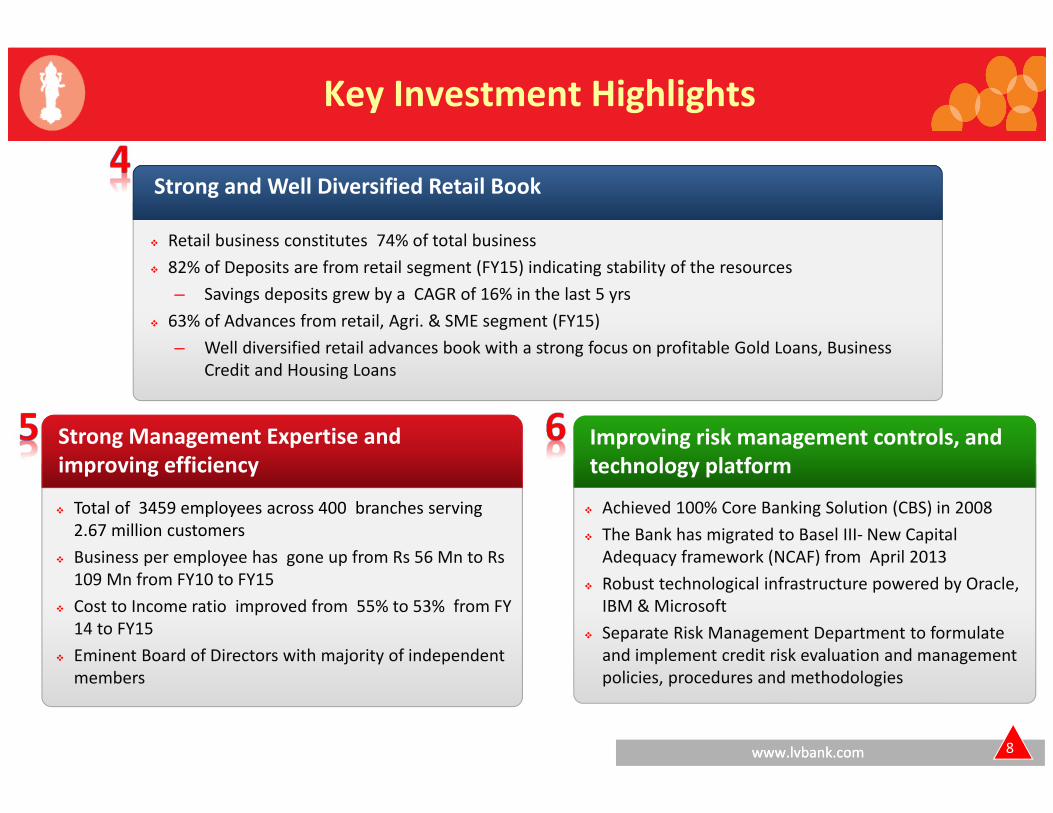
Strong and Well Diversified Retail Book
Retail business constitutes 74% of total business82% of Deposits are from retail segment (FY15) indicating stability of the resources – Savings deposits grew by a CAGR of 16% in the last 5 yrs63% of Advances from retail, Agri. & SME segment (FY15) – Well diversified retail advances book with a strong focus on profitable Gold Loans, Business
Credit and Housing Loans
Strong Management Expertise and improving efficiency
Total of 3459 employees across 400 branches serving 2.67 million customers Business per employee has gone up from Rs 56 Mn to Rs 109 Mn from FY10 to FY15Cost to Income ratio improved from 55% to 53% from FY 14 to FY15Eminent Board of Directors with majority of independent members
Improving risk management controls, and technology platform
Achieved 100% Core Banking Solution (CBS) in 2008The Bank has migrated to Basel III‐ New Capital Adequacy framework (NCAF) from April 2013Robust technological infrastructure powered by Oracle, IBM & MicrosoftSeparate Risk Management Department to formulate and implement credit risk evaluation and management policies, procedures and methodologies
www.lvbank.comwww.lvbank.com
OPERATING OVERVIEW
99

www.lvbank.comwww.lvbank.com 1010
Growing Deposit Base
CASA & Cost of Deposits (%)
Credit – Deposit Ratio (%)
111,495141,141 156,190
185,729219,642
FY11 FY12 FY13 FY14 FY15
18.8%14.9% 14.5% 14.2%
16.7%
7.1% 8.6% 9.0% 8.7% 8.6%
FY11 FY12 FY13 FY14 FY15
CASA Cost of Deposits
73.4% 73.2%
76.1%
70.2%
75.2%
FY11 FY12 FY13 FY14 FY15
Geographical break‐up of Deposits [FY15]
Fast Growing Deposits (Rs. Mn)
TAMIL NADU49.4%
MAHARASHTRA10.7%
KARNATAKA16.5%
ANDHRA PRADESH5.1%
TELANGANA4.6%
NEW DELHI2.3%
KERALA2.8%
GUJARAT1.8%
MADHYA PRADESH0.6%
OTHERS6.1%

www.lvbank.comwww.lvbank.com 11
Strong Retail Liabilities Franchise
Current Account Deposits (Rs. Mn)Growing Savings Deposits (Rs. Mn)
Strong Retail Term Deposits (Rs. Mn) Deposits Mix (Rs. Mn) [FY15]
12,621 13,827 15,24117,297
21,525
FY11 FY12 FY13 FY14 FY15
8,3547,221 7,385
9,125
15,099
FY11 FY12 FY13 FY14 FY15
24,250 20,983 20,904 23,444 38,716
66,27099,110 112,661
135,863144,302
FY11 FY12 FY13 FY14 FY15
Bulk Term Deposits Retail Term Deposits
Current Deposits6.87%
Savings Deposits9.80%
Bulk Term Deposits17.63%
Retail Term Deposits65.70%

www.lvbank.comwww.lvbank.com 1212
Fast Growing Loan Book
Yield on Advances (%)
Fast Growing Advances (Rs. Mn ) – 95% are Secured Advances
Balanced Advances Mix (Rs Mn) [FY15]
12.5%
13.6%
13.0%13.2%
12.8%
FY11 FY12 FY13 FY14 FY15
Geographical break‐up of Advances [FY15]
81,877103,283
118,923 130,377
165,128
FY11 FY12 FY13 FY14 FY15
TAMIL NADU47.14%
MAHARASHTRA17.84%
KARNATAKA12.95%
ANDHRA PRADESH6.51%
TELANGANA6.19%
NEW DELHI4.53%
KERALA1.19%
GUJARAT1.71%
OTHERS1.08%
WEST BENGAL0.87%
24,171 15%
31,172 19%
61,741 37%
48,044 29%
Agriculture
SME
Wholesale
Retail

www.lvbank.comwww.lvbank.com 13
Well Diversified Advances Portfolio
Industry‐wise Total Advances Distribution [FY15]Over 66% of Advances is through Working Cap. Loans
Strong Asset Quality [FY15]
32,004 39,930 34,794 38,511 55,79648,940
61,957 82,234 90,381107,724
FY11 FY12 FY13 FY14 FY15
Term Loans Working Capital
Standard Assets97.22%
Sub Standard Assets0.79%
Doubtful Assets 10.92%
Doubtful Assets 20.59%
Doubtful Assets 30.09%Loss Assets
0.39%
Rs. Mn S. No Industry wise % outstanding (March ‐2015) Fund Based1 Retail Trade 17.732 Textiles 11.573 Basic Metal and Metal Products 10.564 Infrastructure 13.15
Of Which : i) Roads, Ports Construction 6.68ii) Education 3.14iii) Power - construction/erection 0.77iv) Others 2.56
5 Food Processing 7.406 Electricity, Hydro Electric, Co 3.757 Chemical and Chemical Products 3.728 Mining and Quarrying 2.769 Engineering 2.5410 Cement and Cement Products 1.9911 Beverages 1.6612 Hotels-Motels-Resorts 1.5613 Paper and Paper Products 1.5314 Transport Agencies 1.3715 Gems and Jewellery 1.3316 Wood and Wood Products 1.2217 Distrib Solar, Wind Energy 0.9418 Extraction of Crude Petroleum 0.9019 NBFCs-General purpose loan 0.5020 Others 13.82
Total 100.00

www.lvbank.comwww.lvbank.com 14
Robust Retail & SME Advances Portfolio
Retail Advances Portfolio (FY15)FY14)
Retail Advances (Rs. Mn)
SME Advances (Rs. Mn)
29,95937,672 39,352
48,044
FY12 FY13 FY14 FY15
16,259
25,422 27,10031,172
FY12 FY13 FY14 FY15
Housing6.56%
Auto Loan0.96%
Education Loans2.03%
Gold loans 6.97%
Other Personal loans9.14%
Staff Loans0.86%
LAP2.34%
Lakshmi Business Credit
38.64%
Loans collateralised by Deposits32.49%

www.lvbank.comwww.lvbank.com 15
Wholesale & Agriculture Advances Portfolio
Wholesale Advances Portfolio (FY15)Whole Sale Advances (Rs. Mn)
36,07232,965
39,729
61,741
FY12 FY13 FY14 FY15
Agriculture Advances (Rs. Mn)
20,994
22,864
24,196 24,171
FY12 FY13 FY14 FY15
S. No Industry wise % outstanding Fund Based Non Fund Based
1 Infrastructure 30.41 25.64
2 Basic Metal and Metal Products 15.75 20.98
3 Textiles 12.57 9.18
4 Food Processing 5.50 9.99
5 Chemical and Chemical Products 5.46 20.46
6 Mining and Quarrying 3.85 0.07
7 Cement and Cement Products 2.89 0.00
8 Hotels‐Motels‐Resorts 2.39 0.00
9 Beverages 2.32 0.00
10 Engineering 1.81 11.36
11 Extraction of Crude Petroleum 1.45 0.00
12 Transport Agencies 1.24 0.00
13Vehicles, Vehicle Parts and Transport Equipments 1.11 0.00
14 Gems and Jewellery 1.03 0.00
15 Paper and Paper Products 1.01 0.11
16 NBFCs‐General Purposes Loans 0.89 0.00
17 Others 10.32 2.21
TOTAL 100.00 100.00
www.lvbank.comwww.lvbank.com 16
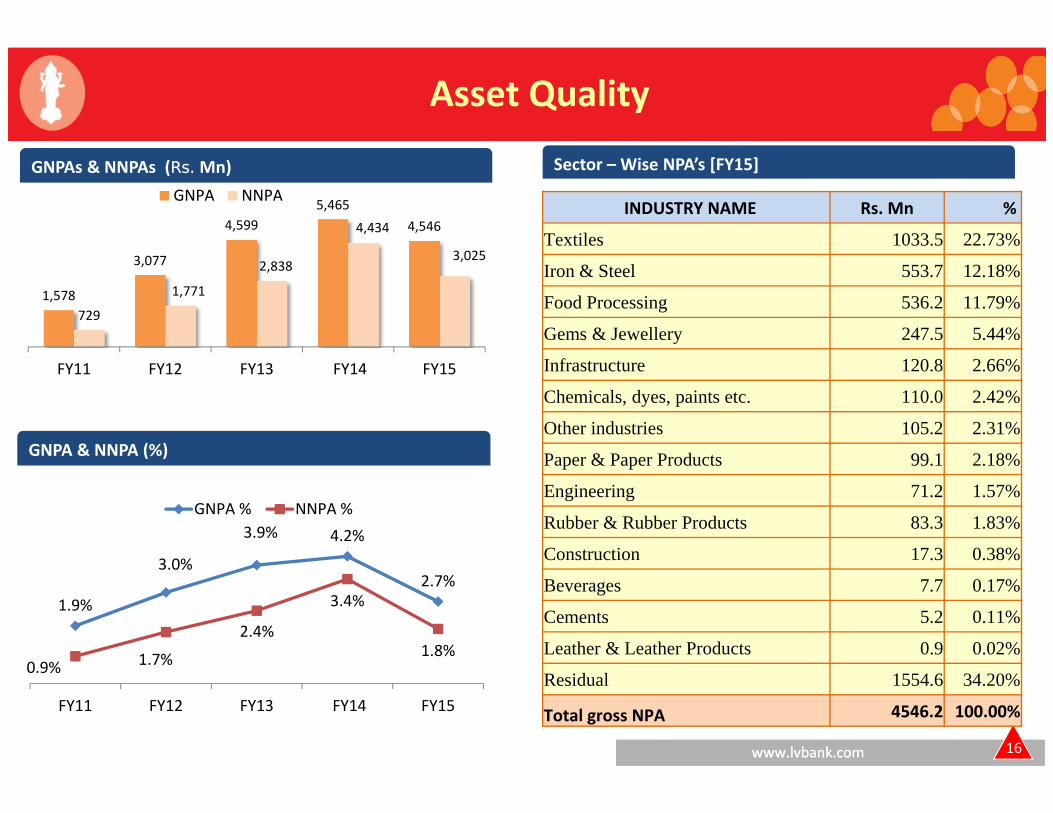
GNPAs & NNPAs (Rs. Mn)
GNPA & NNPA (%)
Sector – Wise NPA’s [FY15]
Asset Quality
1,578
3,077
4,5995,465
4,546
729
1,771
2,838
4,434
3,025
FY11 FY12 FY13 FY14 FY15
GNPA NNPA
1.9%
3.0%
3.9% 4.2%
2.7%
0.9% 1.7%
2.4%
3.4%
1.8%
FY11 FY12 FY13 FY14 FY15
GNPA % NNPA %
INDUSTRY NAME Rs. Mn %
Textiles 1033.5 22.73%
Iron & Steel 553.7 12.18%
Food Processing 536.2 11.79%
Gems & Jewellery 247.5 5.44%
Infrastructure 120.8 2.66%
Chemicals, dyes, paints etc. 110.0 2.42%
Other industries 105.2 2.31%
Paper & Paper Products 99.1 2.18%
Engineering 71.2 1.57%
Rubber & Rubber Products 83.3 1.83%
Construction 17.3 0.38%
Beverages 7.7 0.17%
Cements 5.2 0.11%
Leather & Leather Products 0.9 0.02%
Residual 1554.6 34.20%
Total gross NPA 4546.2 100.00%

www.lvbank.comwww.lvbank.com 17
Gross NPA Movement ( Rs. Mn)
Restructured Assets ( Rs. Mn)
Sector‐Wise Restructured Assets [FY15]
Asset Quality
Movement of Net NPAs FY11 FY12 FY13 FY14 FY15
Opening balance 2,578 729 1,771 2,838 4,434
Additions during the year 1,237 2,291 2,775 3,224 2,300
Reductions during the year 3,086 1,249 1,708 1,628 3,709
Closing balance 729 1,771 2,838 4,434 3,025
Net NPA Movement ( Rs. Mn)`
163 5121,712 2,137 1,814
3,165 2,798
5,522
6,711
11,333
3.91%
2.75%
4.72% 5.21%
6.86%
0.00%
1.00%
2.00%
3.00%
4.00%
5.00%
6.00%
7.00%
8.00%
0.00
2000.00
4000.00
6000.00
8000.00
10000.00
12000.00
14000.00
FY11 FY12 FY13 FY14 FY15
NPA Std %Std. to Net Advances
Movement of NPAs (Gross) FY11 FY12 FY13 FY14 FY15
Opening balance 3,252 1,578 3,077 4,599 5,465
Additions during the year 1,375 2,830 4,002 6,687 2,563
Reductions during the year 3,049 1,330 2,480 5,821 3,482
Closing balance 1,578 3,077 4,599 5,465 4,546 S. No Name of the Industry % outstanding
1 Infrastructure 14.05%2 Iron 17.54%3 Metals & Minerals 8.26%4 Others 10.47%5 Hotel 6.96%6 Engineering & Contractor 6.02%7 Food processing 4.30%8 Communication 3.74%9 Road project 4.04%10 Aluminium 3.23%11 Gems & Gold 3.16%12 Shipyard 2.98%13 Glass 1.88%14 TV rely 1.42%15 Textiles 9.66%16 Pharma 2.28%
Total 100.00%

www.lvbank.comwww.lvbank.com 18
4.1% 3.8%
1.4%1.6%
0.9%
FY11 FY12 FY13 FY14 FY15
Wholesale Advances GNPA (%) SME Advances GNPA (%)
Agricultural Advances GNPA (%)Retail Advances GNPA (%)
Asset Quality Break‐up
0.6%
2.7%
6.2%
8.4%
5.6%
FY11 FY12 FY13 FY14 FY15
3.0%
5.4%
5.6% 4.1%
2.3%
FY11 FY12 FY13 FY14 FY15
1.4%0.8%
0.6%0.5%
0.5%
FY11 FY12 FY13 FY14 FY15

www.lvbank.comwww.lvbank.com
FINANCIAL ANALYSIS
1919
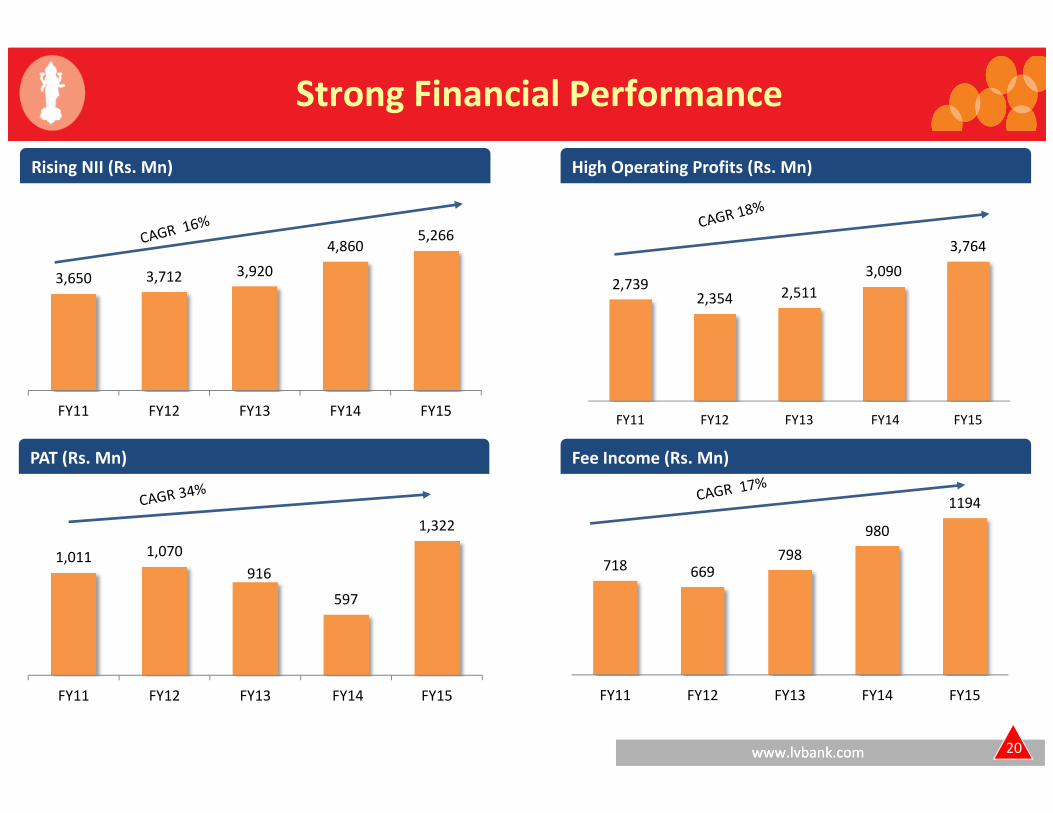
www.lvbank.comwww.lvbank.com 20
2,7392,354 2,511
3,090
3,764
FY11 FY12 FY13 FY14 FY15
20
Strong Financial Performance
High Operating Profits (Rs. Mn)
Fee Income (Rs. Mn)PAT (Rs. Mn)
Rising NII (Rs. Mn)
3,650 3,712 3,920
4,8605,266
FY11 FY12 FY13 FY14 FY15
1,011 1,070916
597
1,322
FY11 FY12 FY13 FY14 FY15
718 669798
980
1194
FY11 FY12 FY13 FY14 FY15

www.lvbank.comwww.lvbank.com 2121
Strong Balance sheet and Return ratios
CRAR (Basel‐ III)
NIM (%) Total Networth (Rs.Mn) & Return on Equity (%)
Total Assets (Rs. Mn) & Return on Average Assets (%)
3.8%
2.9%2.6% 2.9% 2.7%
FY11 FY12 FY13 FY14 FY15
133,012 161,629 176,667 206,531 247,054
0.91%
0.91%0.54%
0.32%
0.61%
FY11 FY12 FY13 FY14 FY15
Total Assets (Rs Mn) Return on Average Assets (%)
8,117 8,792 9,366 9,772 14,777
13%13%
10%
6%
11%
FY11 FY12 FY13 FY14 FY15
Total Networth (Rs. Mn) Return on Equity (%)
7.87% 9.33%
3.03% 2.01%
10.90% 11.34%
FY14 FY15
CRAR (Basel III)
Tier II
Tier I

www.lvbank.comwww.lvbank.com 2222
Operating Efficiency & Investment Details
Cost to Income Ratio Operating Profit/ Average Working Funds (%)
45.5%
55.5%57.4%
55.2%53.6%
FY11 FY12 FY13 FY14 FY15
35,189 43,951 43,245 56,887 61,037
7.55%
8.10%8.03%
7.89% 8.09%
FY11 FY12 FY13 FY14 FY15
Total Investments (Rs Mn) Yield on Investments (%)
Net Investments (Rs. Mn), Yield on Investments (%) Gross Investments –HTM & (AFS +HFT ) Breakup (Rs. Mn)
2.5
1.6 1.5 1.6 1.7
FY11 FY12 FY13 FY14 FY15
1358432,549 33,437 40,758 38,539
531311,556 10,043
16,562 22,916
FY11 FY12 FY13 FY14 FY15
HTM AFS & HFT

www.lvbank.comwww.lvbank.com
FINANCIAL STATEMENTS
2323

www.lvbank.comwww.lvbank.com 24
Financial Snapshot – P&L
Y/E March (Rs. Mn) FY11 FY12 FY13 FY14 FY15
Interest earned 10,648 15,193 17,605 19,839 22,145
Interest expended 6,998 11,480 13,686 14,979 16,879
Net interest income 3,650 3,712 3,920 4,860 5,266
Non interest income 1,370 1,579 1,971 2,036 2,840
Total Net income 5,020 5,291 5,891 6,896 8,106
Operating expenses 2,281 2,937 3,379 3,806 4,342
‐ of Which Staff expenses 1,163 1,412 1,576 1,879 2,303
Operating profit 2,739 2,354 2,511 3,090 3,764
Provisions & contingencies (excl. tax) 1,497 1,094 1,134 2,686 1,882
Pre‐tax profit 1,241 1,260 1,378 404 1,882
Net Profit 1,011 1,070 916 597 1,322

www.lvbank.comwww.lvbank.com 25
Financial Snapshot ‐ Balance Sheet
Y/E March (Rs. Mn) FY11 FY12 FY13 FY14 FY15
Total Assets 133,012 161,629 176,667 206,531 247,054
Total Liabilities 124,895 152,837 167,301 196,759 232,277
Cash & Balances with RBI 9,436 8,100 7,282 11,921 11,434
Net Investments 35,189 43,951 43,245 56,887 61,038
Net Advances 80,944 101,887 117,028 128,892 163,520
Deposits 111,495 141,141 156,190 185,729 219,642
Equity capital 975 975 975 976 1,792
Reserves & surplus 7,949 8,608 9,168 9,560 13,770
Net Worth 8,117 8,792 9,366 9,772 14,777
Borrowings 7,251 5,800 4,800 4,581 4,581
www.lvbank.comwww.lvbank.com
THANK YOU
2626