laminated wooden arches reinforced with glass fiber …
TRANSCRIPT

The Pennsylvania State University
The Graduate School
College of Engineering
LAMINATED WOODEN ARCHES REINFORCED WITH GLASS FIBER
RODS
A Thesis in
Civil Engineering
by
Robert A. Blass
© 2011 Robert A Blass
Submitted in Partial Fulfillment
of the Requirements
for the Degree of
Master of Science
May 2011

ii
The thesis of Robert A. Blass was reviewed and approved* by the following:
Andrew Scanlon
Hankin Chair in Residential Building Construction
Professor of Civil and Environmental Engineering
Thesis Advisor
Maria Lopez de Murphy
Associate Professor of Civil Engineering
Christopher Muhlstein
Associate Professor of Materials Science and Engineering
Peggy Johnson
Department Head, Civil and Environmental Engineering
Professor of Civil Engineering
*Signatures are on file in the Graduate School.

iii
ABSTRACT
The following research deals with the laboratory testing of laminated wooden arches unreinforced and
reinforced with glass-fiber rods. An artificial crack was placed between laminations, and behavior of the
arch and rods were monitored as the crack grew upon loading (rod strains, crack length, displacement,
etc.). The intent was to develop a deterministic analytical model using experimental data from the tested
arches to investigate the effects of composite reinforcements. The model utilized an interface element
scheme to simulate fracture in the arches, and the element behavior was governed by the fracture
properties of the laminated wood. The model behavior was compared to that of the laboratory tests to
determine the models accuracy. Comparisons between the model and laboratory data include crack
growth in the arches with respect to time, load versus deflection, strain in the reinforcing rods, and the
effectiveness of the rods as reinforcement versus unreinforced arches. Crack propagation and crack
detection gages were used to track the cracks growth during increased loading, and strain gages were used
to monitor the strain in the rods. Compact fracture tests, as well as tensile tests were done on samples of
the tested arches to provide necessary inputs into the analytical model. The reinforcing rods were also
tested in tension along the fibers to obtain the modulus, as this orientation would receive the largest
strains during testing (that is, a perpendicular modulus was of negligible importance). The gages were
tested to determine if they failed upon the crack reaching them, and the crack itself was measured using
radiographic imaging as well as a high speed camera.

iv
TABLE OF CONTENTS
LIST OF FIGURES..................................................................................................................................... vi
ACKNOWLEDGEMENTS ........................................................................................................................ ix
1. INTRODUCTION ................................................................................................................................ 1
1.1 BACKGROUND ..................................................................................................................... 1
1.2 RESEARCH OBJECTIVE & SCOPE ..................................................................................... 2
1.3 EXPECTED RESULTS .......................................................................................................... 3
1.4 THESIS OUTLINE ................................................................................................................. 4
2. LITERATURE REVIEW ..................................................................................................................... 5
2.1 OVERVIEW ............................................................................................................................ 5
2.2 BASIC FRACTURE THEORY AND FRACTURE IN WOOD ............................................. 5
2.3 ANALYTICAL MODELING AND MODELING OF FRACTURE IN WOOD .................... 8
2.4 INTERFACE MODELING ................................................................................................... 10
2.5 PREVIOUS REINFORCEMENT INVESTIGATIONS ........................................................ 12
2.6 SUMMARY .......................................................................................................................... 15
3. MATERIALS AND METHODS ....................................................................................................... 16
3.1 OVERVIEW .......................................................................................................................... 16
3.2 RESEARCH LABORATORIES ........................................................................................... 16
3.3 ARCHES AND REINFORCING MATERIALS ................................................................... 17
3.4 CRACK DETECTION AND PROPAGATION GAGES ...................................................... 19
3.5 HIGH SPEED CAMERA ...................................................................................................... 21
3.6 AUTOMATION PROCESS .................................................................................................. 22
3.7 X-RAY EQUIPMENT .......................................................................................................... 24
4. MOCKUP TESTING ............................................................................................................................ 26
4.1 MOCKUP TEST ................................................................................................................... 26
5. LABORATORY TESTING ............................................................................................................... 28

v
5.1 OVERVIEW .......................................................................................................................... 28
5.2 ARCH TESTING .................................................................................................................. 28
5.3 ARCH TESTING RESULTS ................................................................................................. 31
5.4 FRACTURE TESTING ......................................................................................................... 37
5.5 GLASS-FIBER ROD TESTING ........................................................................................... 40
5.6 LAMINATE TENSILE STRENGTH AND MODULUS OF ELASTICITY TESTING ....... 41
6. FINITE ELEMENT MODEL ............................................................................................................. 43
6.1 OVERVIEW .......................................................................................................................... 43
6.2 SOLID MODELING ............................................................................................................. 43
6.3 INTERFACE MODELING ................................................................................................... 47
6.4 RESULTS.............................................................................................................................. 49
6.5 COMPLIANCE ..................................................................................................................... 51
7. EXPERIMENTAL AND ANALYTICAL COMPARISONS............................................................. 53
7.2 ROD STRAIN ....................................................................................................................... 53
7.3 CRACK GROWTH ............................................................................................................... 55
7.4 LOAD VERSUS DISPLACEMENT ..................................................................................... 58
8. SUMMARY, CONCLUSIONS, AND RECOMMENDATIONS ...................................................... 62
8.1 SUMMARY .......................................................................................................................... 62
8.2 CONCLUSIONS ................................................................................................................... 62
8.3 RECOMMENDATIONS ....................................................................................................... 63
REFERENCES ......................................................................................................................................... 66
APPENDIX A: SELECTED CHARTS .................................................................................................... 68
APPENDIX B: DOUBLY REINFORCED ARCH ANSYS INPUT CODE ............................................. 74
APPENDIX C: SINGLY REINFORCED ARCH ANSYS INPUT CODE ............................................. 105
APPENDIX D: UNREINFORCED ARCH ANSYS INPUT CODE ...................................................... 136

vi
LIST OF FIGURES
Figure 1: Specific strengths of selected materials [1] .................................................................................. 1
Figure 2: Energy loss during crack extension in a body [6] ........................................................................ 6
Figure 3: Fracture orientations and loading in wood [7] ............................................................................. 7
Figure 4: The three modes of fracture ......................................................................................................... 8
Figure 5: Schmidt and Kaliske interface element [12] .............................................................................. 10
Figure 6: Xu and Needleman multiphase solid [15] .................................................................................. 11
Figure 7: Interface element showing displacements during decohesion [17] ............................................ 12
Figure 8: Glulam beams showing self-tapping screw arrangement [20] ................................................... 13
Figure 9: Research Laboratories. Top left: Architectural Engineering Unit A, top right: Material Science
Laboratory, bottom left: CITEL, bottom right: NCSU laboratory. ............................................................ 17
Figure 10: Arch dimensioning with two rod reinforcement ..................................................................... 18
Figure 11: Arch dimensioning with single rod reinforcement .................................................................. 18
Figure 12: Crack Propagation gages (left) and detection gages (right) with relevant dimensioning (in mm).
.................................................................................................................................................................. 19
Figure 13: 350.5 ohm completion circuit (top) and as shown attached to strain amplifier and crack gage
(bottom). ................................................................................................................................................... 20
Figure 14: Typical strand broken vs. strain increase chart for propagation (left) and detection (right) gages
.................................................................................................................................................................. 21
Figure 15: Arch gages as they would appear on the doubly reinforced arch with respective process ....... 23
Figure 16: Arch gages as they would appear on the singly reinforced arch with respective process ......... 23
Figure 17: Unreinforced arch x-ray with crack circled.............................................................................. 25
Figure 18: Singly reinforced arch x-ray with crack circled ....................................................................... 25
Figure 19: Fracture mock-up showing crack detection gages ................................................................... 26
Figure 20: High speed camera images showing crack (outlined in yellow). ............................................. 27
Figure 21: Strain readings from detection gages and time taken between two gages. ............................... 27
Figure 22: Arch test setup ......................................................................................................................... 29
Figure 23: Wooden blocks allowing for relative left and right translation. ............................................... 30
Figure 24: Brackets used to prevent unwanted beam rotations and translations. ....................................... 30
Figure 25: Arch load versus displacement data ......................................................................................... 32
Figure 26: Arch load versus time data ...................................................................................................... 32
Figure 27: Arch crack extension right ....................................................................................................... 34
Figure 28: Arch crack extension left ......................................................................................................... 34
Figure 29: U2 image showing multiple cracks forming above and below original crack .......................... 35

vii
Figure 30: U2 image showing significant fracture in lower laminations and left end gage ultimately never
breaking .................................................................................................................................................... 35
Figure 31: Rod strain in 2R2 ..................................................................................................................... 36
Figure 32: Rod strains in R1 and R2 ......................................................................................................... 36
Figure 33: Compact specimen dimensioning and experimental setup ....................................................... 37
Figure 34: Mockup sample showing separation along lamination interface (outlined) ............................. 38
Figure 35: Load versus crosshead displacement and resulting fracture toughness values obtained from
three tests .................................................................................................................................................. 39
Figure 36: Load vs. CMOD for two fracture samples .............................................................................. 39
Figure 37: GF rod shown in testing grips and location of clip gage extensometers................................... 40
Figure 38: Rod tensile testing stress vs. strain .......................................................................................... 40
Figure 39: Tensile test setups showing glued prismatic specimen (left) and modified specimen in steel
grips (right) ............................................................................................................................................... 41
Figure 40: Strain versus stress data for tensile test sample ........................................................................ 42
Figure 41: View of all larger sections that make up the arch. They are the sections that make up the wood
(left), the sections that make the cylindrical section in contact with the rods (upper right), and the GF rods
(lower right). ............................................................................................................................................. 44
Figure 42: Isometric, elevation and plane view of volumes that compose each lamination above and below
the crack.................................................................................................................................................... 45
Figure 43: Isometric, elevation, and plan view of volume meshing, A total of twenty element rows were
used including the four rows used for the central laminations. ................................................................. 45
Figure 44: GF rods showing volumes (top left), element meshing (bottom left), and close up of top mesh
pattern. ...................................................................................................................................................... 46
Figure 45: Tetrahedral meshing around the crack tip ................................................................................ 47
Figure 46: Interface element scheme showing loading and support points and crack position. Interface
elements were not placed directly under load points or up to support points ............................................ 49
Figure 47: Isometric, elevation, and plan view of interface elements above and below central crack
(compare to Figure 43) ............................................................................................................................. 49
Figure 48: Load versus time data for reinforced and unreinforced computer models ............................... 50
Figure 49: FEM crack time versus crack length ........................................................................................ 50
Figure 50: Analytical model rod stresses .................................................................................................. 51
Figure 51: Compliance versus crack area for analytical models containing interface elements (yellow) and
not containing interface elements (black) ................................................................................................. 52
Figure 52: Experimental rod strains versus analytical model rod strains for 2R2 and FEMR2 ................. 53
viii
Figure 53: Experimental rod strains versus analytical model rod strains for R1, R2 and FEMR1 ............ 54
Figure 54: Rod positioning of experimental arch prior to (left) and during testing. Rods went from being
flush with the arch surface to being slightly displaced. ............................................................................. 55
Figure 55: crack development in U2 and FEMUR (top left and right) and 2R2 and FEMR2 (bottom left
and right). ................................................................................................................................................. 56
Figure 56: Time versus crack extension for 2R2 and FEMR2 .................................................................. 56
Figure 57: Time versus crack extension for R1, R2, and FEMR1 ............................................................. 57
Figure 58: Time versus crack extension for U1, U2, and FEMUR............................................................ 58
Figure 59: Displacement versus loading graph comparing 2R2 and FEMR2 ............................................ 59
Figure 60: Displacement versus loading graph comparing R1, R2 and FEMR1 ....................................... 60
Figure 61: Displacement versus loading graph comparing U1, U2 and FEMUR ...................................... 60
Figure 62: High speed camera images showing relatively no crack growth over a 5500 frame interval
(2.75 sec). ................................................................................................................................................. 61
Figure A1: R1 crack extension .................................................................................................................. 68
Figure A2: R2 Crack extension ................................................................................................................. 68
Figure A3: U1 Crack extension................................................................................................................. 69
Figure A4: U2 Crack extension................................................................................................................. 69
Figure A5: 2R2 Crack extension ............................................................................................................... 70
Figure A6: R1 displacement versus load ................................................................................................... 71
Figure A7: R2 displacement versus load ................................................................................................... 71
Figure A8: U1 displacement versus load .................................................................................................. 72
Figure A9: U2 displacement versus load .................................................................................................. 72
Figure A10: 2R2 displacement versus load ............................................................................................... 73

ix
ACKNOWLEDGEMENTS
The author would like to thank Dr. Bo Kasal, for his supervision of this research and his role as the
primary adviser. Further thanks to Dr. Andrew Scanlon, Dr. Maria Lopez de Murphy , and Dr.
Christopher Muhlstein for their advising in all aspects of this research.
Very special thanks to Paul Kremer for his laboratory assistance and continuous dedication to this
research, of which none of this would be possible.
The author would like to thank Dr. Zoltan Rado and Robin Tallon for their assistance and providing a
high-speed camera to aid in research. Further thanks to Dr. Charles Bakis and Stan Sollenberger for their
assistance in material testing as well as Dr. Kostya LaPasha for conducting material tests at the North
Carolina State University. Thanks also to Bob White for his assistance with any and all computer related
issues.
Furthermore, the author would like to thank Andrew Adams and Brian Wolfgang for their laboratory
assistance as well as Tanya Myers, Maral Amini, Kyle Karschner, Chad DeVinney and Emma Leitner.
Thanks also to the Pennsylvania Housing Research Center’s Staff, including Rhonda Decker and Tracy
Dorman.
Finally, the author would like to thank Louis, Barbara, Michael, and Lou Blass for their help and support
with this project, as well as other family and friends.

1
1. INTRODUCTION
1.1 BACKGROUND
The use of wood as an engineering material provides many distinct advantages when compared to that of
other engineering materials. It has a much greater specific strength when compared to that of some steels
and concretes as can be seen in Figure 1, and is readily available as a renewable resource.
Figure 1: Specific strengths of selected materials [1]
An existing disadvantage however, is its weakness in strength when loaded in tension perpendicular to the
grain (as low as 1/25 to 1/60 that of the longitudinal strength [2]). It is because of this that loading
perpendicular to the grain should be avoided. However, these loading conditions are sometimes
unavoidable, as could be seen in moment connections, curved structures, or even notched structures, and
reinforcement must be considered. The use of different composite materials, usually in the form of a
fibrous material and matrix, is being researched both experimentally and through computer modeling.
Reasons to investigate improved reinforcement in wooden structures can be justified by their performance
during earthquakes. According to the Canadian Wood Council [3], the 1964 earthquake in Prince
William Sound was one of the most powerful earthquakes in North America measuring 8.4 on the Richter
Scale. Only 131 lives were lost however in part to the large accompanying tidal waves. The Geophysical
0 50 100 150
Concrete (compression)
Mild Steel
Pine
Specific strength ((KN/m2)/(Kg/m3))

2
Institute of the University of Alaska attributes the low deaths in part to “…the type of material used to
construct many buildings (wood)”.
According to an EQE summary [4], The Northridge earthquake in California was reported to have
damaged 330,000 residential houses, 65,000 of which were severely damaged, and 19,400 were vacated.
The resulting damage cost an estimated $20 billion. However, half of the Los Angeles public schools
were undamaged and did for the most part “very well”. This could be attributed to the fact that much of
the school construction “… is of low-rise wood-frame design, which is very resistant to damage
regardless of the date of construction.” The damage to concrete and steel structures was described as
“tremendous” however, and “structurally significant”.
Reasoning for wooden structures’ generally favorable performance in earthquakes is due largely to their
ability to dissipate energy [3]. With proper reinforcing, wood may be able to rival that of other building
materials (concrete, steel, masonry), which generally have a poor performance record during earthquakes,
in terms of use in larger structures.
1.2 RESEARCH OBJECTIVE & SCOPE
The objective of this research was to develop a deterministic model based on experimental data taken
from laminated wooden arches tested in a laboratory setting. The model would then be verified with the
results of the tested arches based on strain reading in the reinforcing rods, crack position in the arch
during testing, load versus displacement, and overall behavior or the reinforced versus unreinforced
arches. Because the testing procedure itself can be considered innovative, the analytical model will also
serve as a means of verifying the effectiveness of the experimental procedure for use in further research.
The model provides a useful tool in further simulating the behavior of wooden structures during the onset
of cracking, as well as determining the efficiency of various reinforcements with varying properties (in
this case, the efficiency of glass-fiber rods). The important benefit is reduction of the cost in performing
laboratory testing.
The following tasks were the more critical tasks performed in the completion of this research:
Laboratory testing on five wooden arches both reinforced and unreinforced. Reinforcement in the
arches varied but was limited to two configurations. Arches were instrumented with crack
detection and propagation gages to measure crack growth, and reinforcing rods were

3
instrumented with strain gages to acquire strain readings. Load and displacement at the load
points were also recorded.
An analytical model was constructed for the arches (reinforced and unreinforced). The model
utilizes interface elements at the arch laminations to simulate crack growth.
Tensile testing of the arch material was conducted to obtain a modulus perpendicular to the wood
fibers, and an ultimate tensile strength perpendicular to the fibers. This was necessary for the
analytical models interface properties as well as the perpendicular modulus for the wood.
Tensile testing was conducted on the reinforcing rods for input into the analytical model. This
was necessary to compare experimental and analytical strain readings.
Mockup testing was performed on the crack gages to determine if they would fail upon initial
crack growth in wood. A high speed camera synchronized with a data acquisition system was
used to visually and numerically determine the performance of the gages.
Fracture testing was performed on the arch material to obtain the wood/adhesive fracture
toughness. Tests were performed on compact specimens according to ASTM standards. This
was necessary for input into the analytical model.
350 ohm completion circuits were built for the one ohm crack gages.
1.3 EXPECTED RESULTS
Because wood is highly variable, even within its own species, complications arise in trying to input
material properties in an analytical model. Exact duplication of laboratory results is therefore highly
unlikely. The cohesive zones themselves are also highly variable in that the bond strength is not constant.
However, by testing representative samples of a test specimen (in this case the arch), the range of
variability could be greatly reduced.
Because the material properties for the analytical model were taken directly from the tested arch, it is
expected that the model will closely represent the data. Samples were taken from as close to the crown
(where most cracking will occur) without being too close or too far to the damaged zone to further limit
variability. In terms of overall performance, the reinforced arches were expected to display more ductility
then the unreinforced, and also limit cracking throughout the crown. It was expected that the failure of
the reinforced arch would also be more controlled i.e. crack growth would be more predictable.
Because the arch is designed to fail predominantly in tension perpendicular to the grain, the crack was
expected to propagate within laminations. This can also be attributed to the fact that loading was radial to
the gain and crack growth was longitudinal to the grain, or, an RL fracture. Also, because it was

4
confirmed that the difference between isotropic and orthotropic solutions in RL wood fracture are
negligible, the fracture toughness, modulus, and maximum tensile stress values input in the model would
be acceptable.
1.4 THESIS OUTLINE
In the following sections, a literature review will discuss previous findings and research related to fracture
in wood and basic fracture in general. The literature review will also discuss the use of fibrous
composites as reinforcement, and it will also discuss various finite element models used to simulate
delamination. Subsequent chapters will discuss the materials and methods used in laboratory testing, and
later go on to explain how testing was carried out. Discussion will also focus on an analytical model used
to simulate testing and comparisons will be made between the model and laboratory tests. Finally,
possible improvements and future testing will be discussed.

5
2. LITERATURE REVIEW
2.1 OVERVIEW
The following literature review discusses readings that were done prior to and during analytical modeling
and experimentation. It discusses very basic fracture theory and its origins, and also fracture in wood.
The discussion of fracture in wood explains how the primary fracture state was chosen, and what
assumptions were made that govern testing and modeling.
Further discussions will include analytical modeling, and why the finite element method (FEM) was
chosen for modeling means. This will also include a discussion of attempts at modeling wood fracture,
and what controlling parameters went into creating these models. Because interface modeling was found
to be commonly used, a review of an existing interface model will be explained.
Finally, previous and current methods of reinforcing wooden structures will be discussed. This will
discuss experimental testing that is being conducted to test various reinforcements, as well as methods of
reinforcement that are being researched. Discussion will focus on fibrous reinforcement, and types of
adhesives being used with said reinforcement.
2.2 BASIC FRACTURE THEORY AND FRACTURE IN WOOD
The development of fracture mechanics could largely be attributed to the increased use of metal in
structures over the years, and unexpected failures in structures. In the nineteenth century, accidents and
casualties reached significant levels from structural failure, specifically in railway accidents. Between the
years of 1860 and 1870, railway accidents in Great Britain were on the order of 200 per year, mainly due
to wheel, axle, and rail fractures. It was gradually discovered that the failures were in large part due to
built-in deficiencies (cracks for example). During World War II, out of 2,500 liberty ships, almost 700
experienced serious failures and 145 broke in two. The fact that many of the failures occurred under low
stress conditions made the failures almost inexplicable. As a result, extensive investigations in many
countries, including the United States began. The occurrence of low stress fractures in high strength
materials lead to the development of fracture mechanics [5].
Fracture could typically be described as ductile or brittle. In ductile fractures, discrete holes immediately
in front of the crack tip successively join together in a process called void coalescence. In brittle
fractures, separation of bonds between atoms or molecules results in brittle “cleavage” fracture. This is
due to high strains at the crack tip. Cleavage fractures can also be characterized by relatively low

6
amounts of energy for each increment of crack extension. It is because of this that fracture is described as
the amount of energy dissipated for crack extension [6].
The concept of energy release during progressive fracture can be used to describe a material’s resistance
to fracture using a compliance approach. Considering Figure 2, if a linear elastic body with a crack of
area, A, is subjected to an increasing load, the load-displacement behavior will follow line OB.
Supposing the crack extends increasing the area to A+ΔA, the load will drop to point C, and linearly
return to point O when unloaded. Assuming “system isolated” conditions, the total energy lost during the
process is the area inside the triangle OBC.
Figure 2: Energy loss during crack extension in a body [6]
Using the strain energy release rate, , defined by George Irwin [6], the change in energy can defined as:
(eqn-1)
And the strain energy, U, can be defined as:
(eqn-2)
The negative sign is to denote that energy is not being extracted from the system. From eqn-1 ad eqn-2,
the strain energy release rate can be defined as:
(eqn-3)

7
Where , C, is the material compliance. Because the body used in this formulation was dimensionless, it
could be applied to any geometric shape [6].
Because timber is an anisotropic material, six different fracture orientations relative to the growth axis can
be defined as shown in Figure 3. Because of this, the fracture and fracture properties are dramatically
different depending on how the wood is loaded relative to the growth axis. Crack orientations in wood
can be identified by a two letter notation where the first represents the direction perpendicular to the crack
plane, and the second being the direction of crack extension. Directionally speaking, L, R, and T
represent longitudinal, radial, and tangential orientations.
Figure 3: Fracture orientations and loading in wood [7]
Theoretically, the six fracture orientations can all be subjected to three modes of fracture as well (see
Figure 4). Fracture towards and away from the direction of the pith should be considered as well. In
practice, however, crack propagation along the grain is usually the primary means of fracture because of
the natural cleavage planes over which cracks can easily propagate. Also, for most materials, mode I
fracture tends to be the controlling fracture state. As mentioned before because the strength of timber
perpendicular and radial to the grain is significantly lower than longitudinal to the grain, Mode I tension
perpendicular to the grain is the most critical fracture state. Therefore, Mode I fracture receives the most
attention when considering connections, as well as tapered and curved members [7].

8
Figure 4: The three modes of fracture
When testing specimens in mode I fracture, specimen geometries were developed for isotropic materials.
Wood is of course anisotropic or simplified to orthotropic. However, it has been shown both
experimentally and analytically that in RL fracture, deviations between orthotropic and isotropic solutions
are negligible [7].
2.3 ANALYTICAL MODELING AND MODELING OF FRACTURE IN WOOD
Although many methods exist in creating analytical models, the finite element analysis (FEA) method
holds many advantages over most other numerical analysis methods including versatility and physical
appeal. FEA is a method of obtaining numerical solutions for field problems, and can be applicable to any
field problem including stress analysis, and heat flow. There are also no restrictions to the body’s
geometry, or boundary conditions applied to the body. Material properties are also not limited to isotropy
(particularly important to this research), and approximations can be improved by refining element meshes
where field gradients have large variations, for example, crack tips). Mathematically, field problems can
be described by differential equations or an integral expression [8].
Basic ideas of the finite element method originated from advances in aircraft structural analysis. In 1943,
Courant’s paper used piecewise polynomial interpolation over triangular subregions to model torsion, and
in 1956 Turner et al. derived stiffness matrices for truss, beam, and other elements. The first book on
finite elements by Zienkiewicz and Cheung was published in 1967, and in the 1970’s mathematical
foundations and elements were developed. Because of the advent of mainframe computers and
microprocessors, FEA is readily available for use in engineering [9].

9
Modeling of fracture in wood (FEA or otherwise) has always been difficult in, particularly due to the
materials heterogeneity. Landis and Navi [10] looked at various modeling schemes used to simulate crack
growth. In FE applications, it is often convenient to introduce a crack interface element to represent the
closing stresses induced by bridging or other toughening mechanisms. A linear elastic relationship can be
used to represent cohesion in fracture planes, and the important properties of the cohesive zone are the
tensile strength, and the fracture energy. The aforementioned model was able to match laboratory
measurements in a variety of ways.
In 1998, Davalos, Qiao [11] modeled the use of glass fiber-reinforced FRPs in railroad crossties. Studies
have shown that in the United States, wood will continue to be the material of choice for crossties as it is
cost effective in comparison to steel or concrete, and has had a reasonably acceptable performance rate.
Because of the damaging effects of bearing plates and ballast, and other related issues causes high
replacement of crossties results in a cost of $500 million annually. Through the use of a 3-D finite
element model, the performance of FRP crossties was investigated. The cross was modeled as a beam on
an elastic foundation with the assumptions that the beam would show linear response, the foundation
would have constant stiffness, and small deflections would occur. Beams were modeled using 8-node
orthotropic brick elements, and the FRP was applied as a wrap assuming perfect bonding. The foundation
utilized spring elements. The model was compared to laboratory testing of similar crossties (reinforced
and unreinforced) that were scaled down in size, and loaded in four-point bending. Results showed that
compared to wood alone, FRP-wood beams have better performance. Deflection was 23.8% lower, and
the beams were also less affected by moisture. Ultimate loads were 28% and 70% higher for the FRP-
wood beams as well (28% for beams at 12% moisture content and 70 % for saturation moisture content
respectively). The model was also shown to accurately predict the linear response of the composite
crossties.
Schmidt and Kaliske [12] discussed a three dimensional anisotropic wood model, applicable in
combination with interface elements, that was capable of simulating timber structures loaded in shear and
tension. The model was also capable of determining stresses derived from a three dimensional state of
deformation. The interface elements (see Figure 5), have eight nodes and start as two coincident faces,
and can be used to simulate different modes of fracture based on the materials energy release rates. The
model was also compared to that of simple laboratory testing of a cantilever beam. Differences between
the experiments and the model could be attributed to knots and other inconsistencies in the wood
properties. However, the model provides a good means of simulating wood behavior.

10
Figure 5: Schmidt and Kaliske interface element [12]
2.4 INTERFACE MODELING
As was mentioned before, separation along an interface plays a key role in defining fracture in a number
of solids. To better understand this phenomenon, a theoretical model to analyze initial separation to
complete separation was developed by Xu and Needleman [13,14, 15]. The constitutive law used to
govern the model was that of a phenomenological mechanical relationship between the traction and
displacement jump across the interface. As the surface separates, the traction approaches a maximum and
then approaches zero upon full separation. Void coalescence, void growth, and atomic plane separation
all give rise to this behavior. In the calculations, the normal response is to have an exponential form
based on a fit to atomistic calculations.
The traction across an interface surface can be given as the rate of change of surface potential with respect
to displacement across a surface [16]. Limiting separation to two dimensions; tangential and normal, the
traction can be expressed as:
(eqn-3)
Where, Φ, is the surface potential. Δ, is the cohesive jump across the cohesive interface, and T
represents a restoring traction based on Δ on the surface of interest. Figure 16 represents a multiphase
solid that illistrates the traction.

11
Figure 6: Xu and Needleman multiphase solid [15]
Here, Sext represents the exterior surface of the solid, S+ and S
- represent the outer and inner surfaces of
the interface, Vint is an interior volume, and h is the thickness of the interface., all of which do not appear
directly in the equation defining the restoring traction.
The specific form of the surface potential in two dimensions can be taken as:
(eqn-4)
Using (eqn-3) and (eqn-4), normal and shear tractions respectively could be defined as:
(eqn-5)
(eqn-6)
Where, n and t, represent normal and tangential respectively. The normal work of separation, Φn, and
shear work of separation, Φt, can be written as:
(eqn-7)
Where e=exp(1), is the maximum tensile stress,and , is the maximum shear stress. δn and δt, are
corresponding characteristic lengths. These values represent the point when normal or shear seperation
occur,(see Figure 7). Also, q and r can be written as:
(eqn-8)

12
Figure 7: Interface element showing displacements during decohesion [17]
Where Δ is the value of Δn after complete shear separation (because complete shear represents the
absence of normal seperation, Δ ). Also, when Δt≡0, the maximum value of Tn= max and
occurs when Δn= δn. When Δn≡0, the maximum value of, Tt= max and occurs when Δ δ
. It is
important to note that in terms of fracture, under plane strain conditions, JIC (critical J-Integral under
Mode I fracture), is equivalent to the normal work of separation[18], that is:
(eqn-9)
Using this to determine critical interface parameters will be discussed in later sections.
2.5 PREVIOUS REINFORCEMENT INVESTIGATIONS
Current methods for reinforcing timber members that are subject to tensile forces perpendicular to grain
include using steel plates, glue-in threaded rods, and plywood plates. Blass and Bejtka [2] and Blass and
Schmid [19] investigated the use of self-tapping screws in typical situations where high stresses in timber
occur perpendicular to grain (connections, notched members etc.). Testing revealed that although
cracking may occur immediately in the area of connecting dowel pins, it arrests in the vicinity of the
reinforcing screws. Results also showed that self-tapping screws increase member stiffness
perpendicular to the grain and minimize the elastic displacement.
Although the members in the previously mentioned investigations showed increased strength and ductility
perpendicular to the grain, their investigations were in less denser wood species and limited to 11mm x
600mm screws. Greater densities may require pre-drilling, and results for deeper members which would
require longer screws have not been examined. Also, in larger timber members, larger screws may
present difficulties when moving them into place.
Jönsson [20] investigated the load carrying capacity of glulam beams reinforced with self-tapping screws
(see Figure 8). In conjunction with reinforcing the beams, they investigated the effects of climate induced

13
internal stresses. The beams showed an increase in capacity when reinforced before testing, and even
with reinforcing after the beams were failed and retested. Reinforcing prior to testing also increased the
beams deformation capacity as much as two times. Testing of beams with varied moisture gradients
yielded more varied results, showing that perpendicular strength was affected by moisture. The
perpendicular capacity in some cases was half that experienced to the mean strength value of seasoned
specimens.
Figure 8: Glulam beams showing self-tapping screw arrangement [20]
Windorski et al [21] tested singly bolted spruce-pine-fir boards reinforced with layers of fiber-glass and
epoxy. Tension tests were conducted both perpendicular and parallel to the wood grain until one of three
events occurred, steady load drop off, specimen split by the bolt, or the bolt reaches a predetermined
displacement. The results of the investigation showed that the strength and ductility increased as the
number of layers of reinforcement increased (nearly 100 percent for perpendicular loading), and
catastrophic failure was avoided with specimens reinforced with two or more layers.
Klinger et al [22], investigated the use of carbon fiber reinforced polymers and steel in glulam beams in
an attempt to increase overall long and short term member stiffness. Various arrangements were placed
in the tension and compression sides of the members and each member was tested in four-point bending.
The results showed that the strength of the members increased by up to 90% and stiffness up to 100%
when compared to unreinforced members. It should also be noted that the reinforcement arrangements
could be used to determine failure modes. However, no statistical significance could be proven due to the
low number of tests conducted.
Rowlands et al. [23] investigated using various fiber reinforcement such as unidirectional and cross-
woven glass, graphite, and Kevlar, with various types of adhesives such as epoxies, resorcinol
formaldehydes, phenol resorcinol formaldehydes, isocyanates, and a phenol-formaldehyde in Douglas-fir

14
and maple laminates. It should be noted that at the time, epoxies were not commonly used as wood
adhesives, but they were used extensively with fiber reinforcements. Also, the unidirectional
reinforcement used with either of the epoxies, resorcinol formaldehydes, or phenol resorcinol
formaldehyde provided an interface shear strength at least equal to that of Douglas-fir. Testing revealed
that the epoxies performed very well with all reinforcements mentioned while the other adhesives
performed marginally with the cross woven Kevlar. The isocyanates and phenol-formaldehyde also
proved unsuitable. It should also be noted that the epoxies deteriorated under severe moisture cycles,
while the phenol-formaldehyde showed no deterioration. Further investigation of fiber reinforced wood
was thusly justified.
The use of FRPs was investigated by Tingley and Gai [24] as a means of reinforcement in glulam wooden
bridges. Using a precision automated level, The Lighthouse Bridge in Clallam Washington was measured
for elevation at four locations. Initial measurements took place on September 1995, and subsequent
measurements took place on January 1996 and April 1998. The centerline deflection was recorded as
1.016 mm. This confirmed similar results measured in reinforced glulam beams of the same size and
weight, which creeped 80% less than unreinforced beams of the same size and design loads. The 80%
reduction was witnessed within the first 24 hours of testing. Also, the midspan deflections of the
reinforced and unreinforced arches were compared in the experimental testing. It was also noted that
deflection increases in the girders could be attributed to temperature affects as the equipment was heavily
influenced by environmental conditions.
In 1996, Haller et al. [25] investigated the use of glass fiber reinforcement in truss joints, as well as the
use of thermomechanical densification of wood species. Densification was justified by the fact that,
although the fiber reinforcement does prevent splitting and brittleness, embedding strength is hardly
affected. Reinforcement consisted of up to four plates of glass fiber fabrics glued on both sides of the
diagonals and chord by means of epoxy resin. It was shown after the testing of 45 joints that the
conventional joints failed in tension perpendicular to the grain, and under relatively low loads. The load
bearing capacity of the reinforced joints was about 80 % higher than unreinforced, and also had an 80%
greater deformation. The conclusion was that this form of reinforcement significantly increases ductility
of wooden joints. It was also concluded that the strength of wood perpendicular to the grain can also be
significantly increased.
Kasal and Heiduschke [26] investigated the use of composite rods in radial wooden reinforcement. They
performed testing on wooden laminated arches that were designed to fail predominantly in tension
perpendicular to the grain. They also compared the withdrawal capacity of glued-in steel rods to that of

15
glued-in composite rods. In the arch testing, the arches were loaded in four-point bending. Surface
strains of the unreinforced and reinforced arches were compared to that of similar finite element models.
Withdrawal testing revealed that the composite rods had a nearly equivalent withdrawal capacity to that
of the steel rods. The composite reinforced arches also exhibited greater midspan deflections at failure
then those of the unreinforced arches. Surface strains in the reinforced arches were also less than those in
the unreinforced arches. Although the same trends were exhibited in the analytical model, the model did
not allow for crack extension. An improved fracture model is required.
2.6 SUMMARY
The following research succeeds that of Kasal and Heiduschke [26]. It focuses on the use of glass-fiber
rods as reinforcement in laminated wooden arches designed to fail in tension perpendicular to the grain. A
model using interface elements similar to those of the Schmidt and Kaliske [12] model will be used to
simulate fracture, and fracture parameters will be determined using the surface traction equations
developed by Xu and Needleman [13,14, 15,16]. The main focus will be to develop a deterministic
model using these methods to assess the effectiveness of composites as reinforcement in wooden
structures.

16
3. MATERIALS AND METHODS
3.1 OVERVIEW
The following chapter discusses in detail the materials used in the experimental testing as well as the
methods used in performing the tests. Beginning discussions will focus on the laboratories that testing
was conducted in, as well as some of the methods that were used in testing.
As was mentioned before, the main focus of experimental testing was on laminated wooden arches
reinforced with glass fiber (GF) rods, as well as unreinforced arches. Dimensioning of the arches as well
as experimental setup will be discussed. The design and manufacturing of the arches will be discussed
along with the material properties of the arches and rods.
Instrumentation of the arch and methods in which the instrumentation is used will also be discussed
(detection gages, propagation gages etc.). Also, optical equipment will be discussed (x-rays and high
speed camera), and how they will be used in the testing process.
3.2 RESEARCH LABORATORIES
Testing on the arch beams was conducted in The Pennsylvania State University Architectural Engineering
Laboratory. Loading to the arch and mockup specimens was done through the use of an Instron testing
load frame with approximately 20 kip (111KN) load cell. All data was collected with a National
Instruments data acquisition system with LabView software. Testing of the reinforcing rods was
conducted in the Pennsylvania State University Material Science Department which offered equipment
conducive to testing. Fracture testing was conducted in the Penn State Civil Infrastructure Testing and
Evaluation Laboratory (CITEL), where a clip-gage for measuring crack opening was available. Tensile
testing on arch samples was conducted at the North Carolina State University Laboratory.

17
Figure 9: Research Laboratories. Top left: Architectural Engineering Unit A, top right: Material Science Laboratory, bottom left: CITEL, bottom right: NCSU laboratory.
3.3 ARCHES AND REINFORCING MATERIALS
As was mentioned before, the main focus of testing was on wooden arches both reinforced and
unreinforced with GF rods. The arches themselves were fabricated at The North Carolina State
University (NCSU), where the necessary equipment was readily available. The arch dimensions were all
determined beforehand in previous research to cause the crown to fail in tension perpendicularly to the
grain [26]. The arches are composed of 18 laminated layers of yellow poplar with each layer being
roughly 3mm thick and 25mm deep, producing an overall cross section of 54 by 25mm. The arches span
780mm, have a central height of 110mm, and radius of curvature of 300 mm. The layers are adhered with
polyurethane due to polyurethane’s hygroscopic nature and the naturally occurring presence of moisture
in wood. All arches were designed with a flaw in the form of a through crack (Teflon paper placed
between two laminations), in the crown.
18
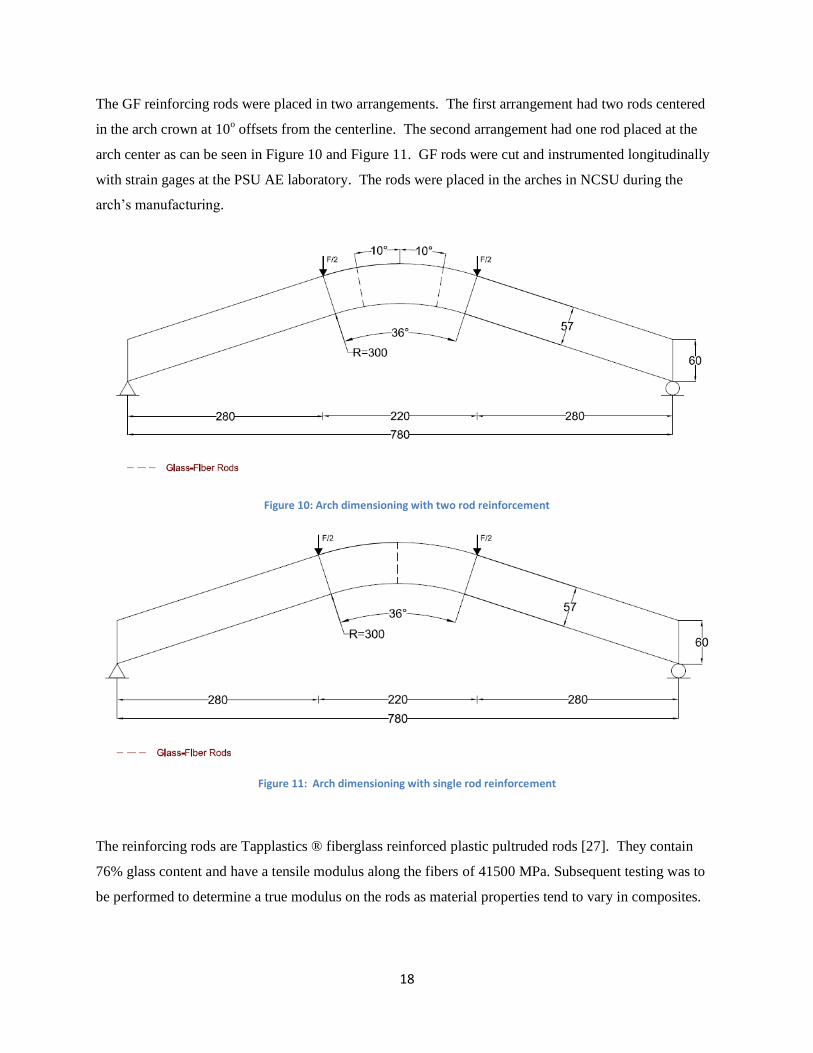
The GF reinforcing rods were placed in two arrangements. The first arrangement had two rods centered
in the arch crown at 10o offsets from the centerline. The second arrangement had one rod placed at the
arch center as can be seen in Figure 10 and Figure 11. GF rods were cut and instrumented longitudinally
with strain gages at the PSU AE laboratory. The rods were placed in the arches in NCSU during the
arch’s manufacturing.
Figure 10: Arch dimensioning with two rod reinforcement
Figure 11: Arch dimensioning with single rod reinforcement
The reinforcing rods are Tapplastics ® fiberglass reinforced plastic pultruded rods [27]. They contain
76% glass content and have a tensile modulus along the fibers of 41500 MPa. Subsequent testing was to
be performed to determine a true modulus on the rods as material properties tend to vary in composites.

19
3.4 CRACK DETECTION AND PROPAGATION GAGES
As was mentioned before, one of the means of verifying the deterministic model is by the crack growth in
the experimental arches. The position of the crack was recorded using crack detection and propagation
gages. The main notable difference between the two types of gages was the detection gages had one
strand and the propagation gages had 25 strands (see Figure 12). Both gages behave similarly to that of
strain gages, however, having a one ohm resistance, completion circuits had to be made to convert the
gages to a more common nominal resistance (typical values are 120 ohm, 350 ohm, and 1000 ohm). In
this case, the resistance used was 350 ohm with the crack gage attached. If no crack gage is attached, the
resistance is 350.5 ohms. The choice of resistors was based on availability at the time of order, and the
circuit design can be seen in Figure 13.
Figure 12: Crack Propagation gages (left) and detection gages (right) with relevant dimensioning (in mm).

20
Figure 13: 350.5 ohm completion circuit (top) and as shown attached to strain amplifier and crack gage (bottom).
The principle behind the crack gages was that as strands in the circuit are broken by the advancing crack,
a resulting change in strain will occur. By knowing the position of the strands, the position of the crack
can be determined. It should be noted that the strand lengths of the propagation gages were all of
different length to allow for consistent strain increases as each strand breaks (approximately 30
microstrain per strand). If the strands were of equal length, the result would be a change in resistance and
therefore, conversions would need to be made. Because the detection gages only had one strand, the
strain increase would be experienced instantly, where as the multiple stranded propagation gages
witnessed a gradual strain increase as each strand failed. Both circuits peaked at about a 750 microstrain
increase upon total gage failure. Figure 14 shows a typical chart comparing strands broken versus strain
increase.

21
Figure 14: Typical strand broken vs. strain increase chart for propagation (left) and detection (right) gages
Because the output strain from the detection gages will either be 0 microstrain or 750 microstrain (one
stranded), they were used as ON/OFF switches for the automation process. This was because they
allowed for a greater margin of error associated with strain from outlying sources (heat fluctuations for
example). This will be explained in greater detail in sections to come.
3.5 HIGH SPEED CAMERA
To further determine the start of crack growth in the experimental testing, a high speed camera was used.
The camera was a PHOTRON ultima 512 fastcam that offered recording speeds between 60 and 32,000
fps (frames per second). Recording times varied based on resolution and frame rate but were generally
limited to 2 seconds. Specifications can be seen in Table 1.
0
100
200
300
400
500
600
700
800
0 5 10 15 20 25
Mic
rost
rain
Strands Broken
0
100
200
300
400
500
600
700
800
0 1 2
Mic
rost
rain
Strands Broken

22
Table 1: High speed camera specifications [28]
One of the features of the camera is its ability to capture data in various ways including a start trigger, an
end trigger, and a middle trigger. That is, a start trigger begins saving data when a signal is sent to the
camera. An end trigger will save data before the event the signal is sent, and a middle trigger saves
before and after the signal is sent.
3.6 AUTOMATION PROCESS
Because of the relatively high rate of speed of the DAQ system (see section 4.1), data acquisition had to
be structured so as to minimize unnecessary data collection, specifically with the crack gages as buffer
issues in the system could result in acquisition errors. That is, the system is unable to maintain the
specified rate of acquisition and the aforementioned errors occur. Therefore, data acquired for the crack
gages would begin when the crack reaches any of the two start triggers (detection gages) and continue
until the crack reaches both of the end triggers. This is to ensure that acquisition does not prematurely
end which would occur if the crack grew non-uniformly and reach one end trigger. A diagram of the gage
system can be seen in Figure 15 for the doubly reinforced arch. The gage position is essentially the same
for the singly reinforced arch except for the rod being in the center of the crown as can be seen in Figure
16. The difference in placement angle will be explained in later sections.
Frame Rate
(fps) HorizontalVertical 670Mb 2.00Gb 670Mb 2.00Gb
60 512 512 34.1 102.4 2,048 6,144
125 512 512 16.25 48.76 2,048 6,144
250 512 512 8.2 24.58 2,048 6,144
500 512 512 4.1 12.3 2,048 6,144
1,000 512 512 2.05 6.16 2,048 6,144
1,000 256 256 8.2 24.5 8,192 24,576
2,000 512 512 1.02 3.07 2,048 6,144
2,000 256 256 4.08 12.24 8,192 24,576
4,000 512 256 1.02 3.07 4,096 12,288
4,000 256 256 2.04 6.14 8,192 24,576
8,000 512 128 1.02 3.07 8,192 24,576
8,000 128 128 4.08 12.2 32,768 98,304
16,000 512 64 1.02 3.07 16,384 49,152
32,000 512 32 1.02 3.07 32,768 98,304
Resolution Record Time (s) Record Time (frames)

23
Figure 15: Arch gages as they would appear on the doubly reinforced arch with respective process
Figure 16: Arch gages as they would appear on the singly reinforced arch with respective process

24
Because the high speed camera operates for a limited time, the first gage was used as a trigger for the
camera as well. This was to ensure that the camera would record the instant the crack was in motion.
After the detection gage breaks (750 microstrain in the circuit), a TTL signal (High/Low signal) triggers
the camera to record.
Because the strain gages record at a relatively low frequency (10 hertz), they would continuously acquire
data throughout testing. However, data acquisition including loading of the specimens, stops immediately
after the last trigger gage is broken.
3.7 X-RAY EQUIPMENT
The original means of monitoring the cracks growth involved using x-ray fluoroscopy. This was later
changed to using the crack detection and propagation gages. However, x-ray imaging was still used to
locate the original crack in the arches. The x-ray source was an ICM CP120B battery powered generator .
The voltage range is between 40kV and 120kV and the current range is from 0.1-1.5mA. Settings were
placed at 40kV and 1mA and typical exposure times were between 5 and 6 seconds. The source was
initiated with a remote trigger. Data is collected on photo-stimulable phosphor (PSP) plates which are
read by a scanner, based on trapped radiation, and converted into a digital image. Emitter and scanner
details, as well as detailed information can be found in Adams [29]. Images of an unreinforced and
reinforced arch can be seen in Figure 17 and Figure 18.

25
Figure 17: Unreinforced arch x-ray with crack circled
Figure 18: Singly reinforced arch x-ray with crack circled

26
4. MOCKUP TESTING
4.1 MOCKUP TEST
Because crack detection and propagation gages are not typically used on wood, mockup testing was
conducted to determine if the gages failed upon initial crack tip extension. The concern was that the
crack may have passed the gage strands due to the lower energy release at the crack tip compared to that
of other materials (steel or concrete in example), without actually breaking them. The mock up testing
also served as a means to debug the automation process. It should be noted that the test did not follow a
particular standard as it was merely a mock up.
Because the failure strain in the detection gages was equal to that of the propagation gages (0.1 percent),
testing was conducted on the detection gages as they were less expensive. A block of the arch specimen
was testing in tension perpendicular to the grain, and instrumented with three detection gages. The first
gage served to trigger the DAQ system, and the last gage triggered the high speed camera on a back
trigger. The fracture specimen can be seen in Figure 19.
Figure 19: Fracture mock-up showing crack detection gages
Because it was unknown as to what speed the crack would propagate, a Rayleigh wave speed equation
was used as an approximation, as these are the fastest theoretical speeds that a crack could travel (often
however, not even half these values tend to be reached experimentally[16]). The importance of knowing
the crack speed was so that an appropriate data acquisition speed could be used to gather sample points,
and the high speed camera could be set at a fast enough setting. The value of the crack speed was
determined to be 1000m/s, or 25,000 fps based on detection gage spacing of 40 mm/ gage. However,

27
since it is again uncommon for half these values to be reached, the gages were spaced at 20 mm making 3
gages over the 40 mm length.
Images from the high speed camera revealed that the crack (highlighted in yellow) traversed the two end
gages in roughly 34 frames, for a total crack speed of 18.8 m/s (see Figure 20). From the DAQ system,
the time between gage break points was roughly 920 μs for a total of 21.7 m/s (see Figure 21). Because
the speeds had slight variance (roughly 10 percent error), it was concluded that the gages failed
immediately upon crack growth.
Figure 20: High speed camera images showing crack (outlined in yellow).
Figure 21: Strain readings from detection gages and time taken between two gages.
0
0.0005
0.001
0.0015
0 1000 2000 3000 4000 5000
Stra
in
Time (microseconds)
Trigger GageFirst GageSecond Gage
920μs

28
5. LABORATORY TESTING
5.1 OVERVIEW
The following section discusses laboratory testing performed on the five wooden arches. Focuses will be
on experimental setup and testing conditions (loading, restraints, etc.). Materials that were used to design
the setup will be explained in detail as well. Results discussed will be load versus displacement data,
crack positions, and rod strains. It is important to note that the crack position being reported is
based on gage readings.
Discussion will also focus on material testing that was performed to obtain the material properties used in
the analytical model. This includes fracture testing and tensile testing on the laminated wood, and tensile
testing on the GF rods.
5.2 ARCH TESTING
As was mentioned in the methodology section, all arches had the same dimensioning (span, depth,
number of laminations, etc.). The only differences were reinforcement positioning and the number of
reinforcing rods. Prior to testing, it was unknown what length the artificial crack was until radiographic
images were taken. It was revealed that the cracks were essentially the same length.
The arches were supported on an Aluminum I-beam and loaded in four-point bending by two rollers
suspended by another steel I-beam. Left and right translations were uninhibited and out of plane
translations were restricted through the use of wooden blocks bolted to the aluminum I-beam. The
Aluminum I-beam was lifted to the rollers by the actuator and the Steel I-beam was bolted into a load cell.
Lock washers were used to keep the steel I-beam from rotating. Lighting for the high-speed camera, as
well as other camera equipment was placed on the aluminum I-beam. This was to assure lighting would
remain consistent even as the arch was lifted to the rollers. The overall setup can be seen in Figure 22.

29
Figure 22: Arch test setup
To prevent out of plane translations, the wooden blocks were pressed relatively firmly against the arch.
However, to avoid high contact friction, low friction plastic strips were attached to the blocks. The blocks
were bolted in place, and, to allow for the blocks to slide against the arch, the holes were slightly
oversized to loosen or tighten the contact on the blocks as needed. The above mentioned plastic strips
were also adhered to the points of the arch in contact with Aluminum I-beam. This was again to reduce
contact friction. The blocks and plastic strips can be seen in Figure 24 in greater detail.

30
Figure 23: Wooden blocks allowing for relative left and right translation.
Because the Aluminum I-beam was not connected on the actuator, steel brackets were used to prevent the
beam from unwanted translations or rotations (See Figure 24). The brackets were in contact with the
Aluminum I-beam; however they allowed the beam to lift up and down with the actuator as needed. The
brackets were then bolted to a fixed steel I-beam.
Figure 24: Brackets used to prevent unwanted beam rotations and translations.
Prior to testing, all lights were placed on the Aluminum I-Beam to provide lighting on the arches, (even as
they were lifted to the rollers). Because the lighting was provided by incandescent bulbs, heating of the
gages was an issue. Before the gage strain was balanced to zero, adequate time was allowed before the
BRACKET BOLTED
TO STEEL I-BEAM
BRACKETS IN
CONTACT WITH
ALUMINUM I-BEAM

31
gages would no longer see a temperature increase. The main purpose for the amount of lighting was for
the high speed and video cameras.
Before loading, all beams were centered under the loading rollers using a laser level to prevent
unnecessary loading due to eccentricities. The rollers were placed on the Steel I-beam according to
Figures 10 and 11 (F/2 representing the load points). All beams were loaded at a rate of 5 mm/min (0.2
in/min). Loading was applied until the final end trigger on the beams was cut, or in one instance, when
significant failure was witnessed. Data collected was load, displacement, time, relative time (that is, the
time the gages started recording), strain on the rods, and crack position based on strand failure on the
crack gages.
As was mentioned before, the arches were either reinforced or unreinforced. Table 2 summarizes the
arches based on their reinforcement patterns, crack dimensions, and names associated with each arch. All
arches had the same crack length centered at the crown and reinforcement feel into one of two patterns.
Table 2: Arch naming and characteristics
Arch1 Arch2 Arch3 Arch4 Arch5
Name 2R2 R1 R2 U1 U2
Reinforcement
Pattern
Two rods as
per Figure 10
One rod as per
Figure 11
One rod as per
Figure 11
No rods No rods
Crack length 54mm 54mm 54mm 54mm 54mm
5.3 ARCH TESTING RESULTS
Results of displacement versus load data can be seen in Figure 25. Upon inspection, the reinforced arches
exhibited more ductility than the unreinforced arches as can be seen by comparing R1 and R2 to U1 and
U2. The reinforced arches also showed a greater resistance to the initial crack’s growth. As was
mentioned before, testing ended when the end gage was broken, and all testing was displacement
controlled at 5mm/min. Because the reinforced arches withstood higher displacements, it can be
interpreted that it took a longer time for the end gages to break. The exception was with U2 where one of
the arches bottom laminations fractured, rather than the laminations containing the crack, and because this
lamination was below the end gage, data continued to be acquired. Because of this, data is plotted until
this fracture event occurred. The reinforced arches also reached higher loads then those of the
unreinforced. Figure 26 shows time versus loading of the experimental arches.

32
Figure 25: Arch load versus displacement data
Figure 26: Arch load versus time data
0
500
1000
1500
2000
2500
3000
3500
4000
4500
0 2 4 6 8 10 12 14
Loa
d (
N)
Displacement (mm)
2R2
R1
R2
U1
U2
0
500
1000
1500
2000
2500
3000
3500
4000
4500
0 20 40 60 80 100 120 140 160 180 200
Load
(N)
Time(s)
2R2R1R2U1U2

33
Prior to testing, it was assumed that the crack would grow relatively uniformly in both directions.
Because of this assumption, only one set of start and end trigger gages was used on 2R2. This was not the
case however, as the crack extended in one direction causing a propagation gage to fail before moving
toward the start trigger and beginning data acquisition. Therefore, the position of the crack was only
available in one direction.
For comparison reasons, 2R2’s crack growth was compared to both left and right crack growth of the
other four arches. Left and right crack growth for all arches can be seen in Figure 27 and Figure 28
respectively. By making comparisons between Figures 25, 26, and 27, it can be seen that R1 and U2
reached higher loadings before the crack began to grow (about 3000N and2500N respectively), while the
other arches’ cracks began to propagate in the same lower load range (about 1750N to 2250N). Based on
this, not much can be concluded as to which arches resisted initial crack growth the best. However, the
singly reinforced arches (R1 and R2) generally took longer before the crack reached the end trigger gage
when compared to that of the unreinforced arches (U1 and U2). Again recall that during testing, crack
extension to the left on U2 never actually broke the left end trigger as the gage debonded from the arch
during testing toward the top and a crack in the lower laminations began to propagate and ultimately
began to control with regards to crack growth (see Figure 29 and Figure 30). Therefore, the time when
the crack reached the gage could only be approximated. This also presents the concern that fracture, and
all changes in the arches behavior, specifically compliance, were not solely governed by the growth of the
initial crack. That is, the formation of other cracks in the arch contributed to the aforementioned changes.
Finally, because the crack in 2R2 had to traverse a shorter distance to reach the end trigger, the time it
took for the crack to equal the lengths of the other four arches is unknown (with respect to the end trigger
of the other arches that is).
As was mentioned before crack gage positioning on the singly reinforced arches differed from that of the
doubly reinforced arches as could be seen in Figure 15 and Figure 16. It was originally hypothesized that
the strains in the reinforcing rods would increase substantially the instant the crack reached them. .
Because of this assumption, the end trigger gages were placed a relatively short distance from the
reinforcing rods. However, strains in the rods did not reflect this hypothesis. It was decided because of
this that the gages would be placed a greater distance from the rods for all subsequent testing.

34
Figure 27: Arch crack extension right
Figure 28: Arch crack extension left

35
Figure 29: U2 image showing multiple cracks forming above and below original crack
Figure 30: U2 image showing significant fracture in lower laminations and left end gage ultimately never breaking
Strain behavior in the GF rods was very erratic (See Figure 31 and Figure 32). For 2R2, it was expected
that the rod strains would coincide, however the right rod showed an immediate increase in strain, while
the second rod decreased in strain. Also, strains were relatively low compared to strains that were
expected [26]. Strain in R1 and R2 both exhibited an increase in strain as was expected, however an
instantaneous decrease in strain was experienced in the reinforcing rod in R2 around the time the crack
had extended. Strains again were relatively low but higher than those experienced in 2R2.

36
Figure 31: Rod strain in 2R2
Figure 32: Rod strains in R1 and R2
-0.00015
-5E-05
5E-05
0.00015
0.00025
0 10 20 30 40 50 60 70 80
Stra
in
Time (s)
2R2 Left Rod
2R2 Right Rod
-0.0001
0
0.0001
0.0002
0.0003
0.0004
0.0005
0.0006
0.0007
0.0008
0 15 30 45 60 75 90 105 120 135 150 165
Stra
in
Time (s)
R1 Rod
R2 Rod

37
5.4 FRACTURE TESTING
Since a value for the arches Mode I fracture toughness must be determined for the analytical model, a
compact fracture specimen was tested in accordance with ASTM guidelines [30]. Dimensioning and
instrumentation of the compact specimen can be seen in Figure 33 where, W=46mm, and a=20mm, and
the specimen thickness, B, was 11 mm to assure plane strain conditions.
Figure 33: Compact specimen dimensioning and experimental setup
To avoid any energy loss in the system, ideally the grips should be perfectly rigid. To achieve this, steel
pipe hangers were used.
The fracture specimen was cut from a section of a tested arch. A sharp crack was notched into the
specimen with a razor, and to assure the crack did not extend past the desired length while being notched,
the specimen was compressed at the desired initial crack length. The crack was notched between two of
the specimen laminations where previous testing showed failure had occurred. An example of interface
separation can be seen in Figure 34.

38
Figure 34: Mockup sample showing separation along lamination interface (outlined)
The specimens were loaded in tension at a constant rate of 10mm per minute. Load and displacement at
the loading points was acquired during testing. The fracture toughness can then be computed from :
(eqn-13)
Where;
(eqn-14)
Typical load data from the fracture toughness testing can be seen in Figure 35. The average fracture
toughness along the interface was determined to be 315kN-m-3/2
. The previously mentioned equations
were mentioned by Kundu [31]. The results are equivalent to those found using ASTM standard E 399.

39
Figure 35: Load versus crosshead displacement and resulting fracture toughness values obtained from three tests
The previously conducted tests used samples cut close to the arch crown. Follow up tests were conducted
on samples taken further down the arch base and with the aid of a clip gage to measure crack mouth
opening displacement (CMOD). However, measured fracture toughness values greatly exceed typical
values of 510kN-m-3/2
[7]. Load versus CMOD can be seen in Figure 36. Although it is recognized that
the materials variability can result in the CMOD test values, they were not used in determining the
fracture toughness. This was to provide a lower bound set of values for the analytical model.
Figure 36: Load vs. CMOD for two fracture samples
0
25
50
75
100
125
150
0 0.5 1 1.5 2 2.5 3
Load
(N
)
Crosshead Displacement (mm)
Fracture Toughness = 295 kN-m^-3/2
Fracture Toughness = 275 kN-m^-3/2
Fracture Toughness = 375 kN-m^-3/2
0
100
200
300
400
500
0 1 2 3 4 5 6 7
LOA
D (
N)
CMOD (mm)
Fracture Toughness = 1325kN-m^-3/2
Fracture Toughness = 840kN-m^-3/2

40
5.5 GLASS-FIBER ROD TESTING
Although certain values for the reinforcing rods are available from the manufacturer, variability may exist
between rods as they are orthotropic composites. Tensile tests were performed to determine the modulus
of elasticity (MOE) for input into the finite element model. Transverse isotropy was assumed for the
rods, and the rods were instrumented with back-to-back extensometers to obtain these values (see Figure
37).
Figure 37: GF rod shown in testing grips and location of clip gage extensometers.
The rods were placed into plastic blocks with epoxy, and loaded in tension using locking steel blocks
placed in the testing frame. The extensometers recorded a change in voltage that was converted into
strain values and therefore used to determine E. Data for stress versus strain can be found in Figure 38.
The modulus from testing was determined to be 47,000MPa.
Figure 38: Rod tensile testing stress vs. strain
0
20
40
60
80
100
120
140
0 0.0005 0.001 0.0015 0.002 0.0025 0.003 0.0035
Stre
ss (
MP
a)
Strain

41
5.6 LAMINATE TENSILE STRENGTH AND MODULUS OF ELASTICITY TESTING
Because many of the previous analytical models utilized interface elements whose behavior is partially
controlled by the materials ultimate tensile strength, tensile testing had to be conducted on a
representative sample of the arch. Samples were again sent to NCSU for testing. The tensile strength and
modulus were measured perpendicularly to the laminations which controlled fracture in the arch. Two
methods were used in loading the specimens in tension. The first was a prismatically cut specimen that
was adhered to steel blocks. The second was a specimen cut to fit steel grips. It was because of the
specimen failing at the glue line that the second method had to be used to confirm the testing results. The
specimen setups can be seen in Figure 39.
Figure 39: Tensile test setups showing glued prismatic specimen (left) and modified specimen in steel grips (right)
The cross sections of the samples were 2.54cm x 2.54cm (1in x 1in), and the gage length was 5.08 cm (2
in). Displacement across the sample was measured with a laser, and the load rate of the specimens was
.508cm/min (0.2 in/min). Typical strain versus stress data can be seen in Figure 40. It is important to note
that once again samples had to be taken relatively close to the base. As was mentioned before, the
samples should have ideally been taken as close to the crown as possible to lower the variability but
materials were limited.

42
Figure 40: Strain versus stress data for tensile test sample
0
0.5
1
1.5
-0.001 0 0.001 0.002 0.003 0.004 0.005
Stre
ss(M
Pa)
Strain

43
6. FINITE ELEMENT MODEL
6.1 OVERVIEW
The following chapter describes the deterministic FEMs used to simulate laboratory results. ANSYS 11.0
software was used for model development. It is important to note that the model was designed to allow
the user to vary aspects based on certain input parameters. That is, features such as the rod angle of
orientation, mesh shape, arch dimensions, crack dimensions, etc., could be changed (within reason) to
allow for different model designs. Model considerations are discussed including the elements used to
simulate delamination at the arch interfaces as the crack grows. Critical parameters are also discussed,
specifically those that were determined in a laboratory and used to control the interface behavior. Also,
considerations such as meshing around the crack tip and meshing of the arch and GF rods in general will
be discussed. Results included will be load versus displacement on the arch, rod strains, and crack growth
over time. Three models were used to simulate the arches tested in the laboratory. They were doubly
reinforced (FEMR2), singly reinforced (FEMR1), and unreinforced (FEMUR). It is important to note that
because material properties for all the arches were not tested (only for 2R2), data for FEMR1 and
FEMUR were taken from the test data of 2R2. Although these values need to be individually tested,
comparisons based on reinforcement placement can be made.
6.2 SOLID MODELING
Although the experimental arch was tested in such a way that loading conditions are in-plane, and out-of-
plane reactions were restricted, a two-dimensional model would seem to work initially. However,
because the rods were centered in the arch, there existed the possibility that the crack would extend past
them while being arrested locally in the middle. Future testing which may induce out-of-plane forces or
twisting may cause the crack to propagate erratically and therefore the need for a three-dimensional
model is justified.
The elements that were used in modeling the wooden arch and GF rods are hexahedral elements having
three degrees of freedom at each node (x, y, z translations). The initial crack was modeled as a gap of
finite length separating volumes that represent the arch layers. Although the hexahedral elements being
used for the arch can take on a tetrahedral form, the model was designed predominantly with hexahedral
elements (specifically along the crack path), as this offers higher accuracy. Other justification for using
predominantly hexahedral elements is in the fact that interface elements are a silhouette of sorts of the

44
solid element mesh pattern. This was to reduce the risk of violating aspect ratios which could hinder
convergence during the solution process particularly as the crack propagates. However, tetrahedral
elements were strategically used around the crack tip to improve accuracy.
The arch crown was essentially divided into thirty-two larger hexahedral sections (see Figure 41). These
sections made up the wood, a cylindrical section of wood in contact with the rods, and the rods. The
crown was divided into volumes above and below the crack (thus the two volumes in each section).
These sections are symmetric about the arch centerline. The choice of sections was to allow for
hexahedral meshing, and greater control over the element mesh size. Each section was then further
refined to produce individual volumes for each lamination (see Figure 42). Again, the concern was to
produce all hexahedral volumes for meshing purposes. The base of the arch consisted of four volumes.
These were two larger hexahedral volumes (see Figure 41) which could be manually meshed and two
tetrahedral volumes at the ends which were meshed using ANSYS’s smart meshing. Precise meshing of
the base was not necessary, as fracture was predominantly limited to the crown.
Figure 41: View of all larger sections that make up the arch. They are the sections that make up the wood (left), the sections that make the cylindrical section in contact with the rods (upper right), and the GF rods (lower right).
1
2
3
4 5
6
7
8
9
10
11
12
13-16

45
Figure 42: Isometric, elevation and plane view of volumes that compose each lamination above and below the crack
Each lamination volume was meshed with a single row of elements (see Figure 43) that was divided
based on known experimental locations. For example, because the location of the crack gage strands was
known, the mesh was divided to assure a node would be at the strand locations. This would make it
possible to determine when the crack reached the strands according to the model. The two laminations
that contained the crack however had two rows each to allow for meshing of the crack tip,
Figure 43: Isometric, elevation, and plan view of volume meshing, A total of twenty element rows were used including the four rows used for the central laminations.
Crack

46
The GF rods were meshed vertically according to the number of lamination divisions (see Figure 44), and
they controlled the number of elements throughout the arches thickness. That is, because the arch had
eighteen laminations and the center laminations had two rows of elements each, the rods had twenty rows
of elements. Also, because each quarter of the rods had four element sets (see Figure 44), the arch was
meshed with four element sets per thickness.
Figure 44: GF rods showing volumes (top left), element meshing (bottom left), and close up of top mesh pattern.
As was mentioned before, tetrahedral elements were used around the crack tip to improve accuracy based
on recommended meshing patterns [17]. The number of elements arranged around the crack tip was
dependent on the number of rows of elements the central laminations were divided by. In example, if
there were two element rows per lamination, eight elements would encircle the crack tip (see Figure 45).
If three rows were used, twelve elements would surround the tip, and so on.
4

47
Figure 45: Tetrahedral meshing around the crack tip
Because fracture would be limited to the crown, it was assumed that relatively small displacements would
be applied to the arch. This, combined with the accounts of previous performances of unidirectional
reinforcements used in wood [23] led to the assumption that a perfect bond would be suitable in the
model. That is, the rods would not slip, and relatively large stresses would result.
6.3 INTERFACE MODELING
As was mentioned before, fracture would be governed by interface elements placed at the arch
laminations. However, certain properties must be determined and/or tested. From Xu and Needleman
[16], the fracture toughness of a brittle solid can be defined as:
(eqn-10)
From (eqn-9) and (eqn-10) fracture toughness can be further defined as:
(eqn-11)
From (eqn-11) and (eqn-7), for Mode I fracture:
(eqn-12)
From the above, it can be determined that critical values for tensile fracture are the fracture toughness,KIC,
the modulus of elasticity,E, and the maximum tensile stress, max. The shear stress, max, is also required in
Crack tip
Lamination
Lamination

48
determining the shear work of seperation and/or the tangential characteristic length, however, because
tension controls failure, experimental shear properties are not necessary. Table 3 identifies all parameters
and their importance in Mode I fracture (or lack there of).
Table 3: Interface element parameters
Parameter Discription Units
n Normal characteristic length calculated from KIC, E, and max m
t Tangential characteristic length (experimental value not necessary for Mode I
considerations)
m
KIC Mode I fracture toughness N-m-3/2
max max Maximum tensile and shear stress respectively (experimental max [32]value
not necessary for Mode I fracture).
N/m2
Φn,Φt,JIC Normal and tangential work of seperation, and critical J-integral respectively.
Φn= JIC for Mode I fracture).
J/m2
E Modulus perpendicular to wood fibers N/m2
ν Poissons ratio
In chapter 5, tests conducted to determine the aforementioned critical parameters were described. Using
eqn-12, n can be calculated. Again, an experimental value for t is not required but a value must be
input into ANSYS. Therefore, n was used for this value.
Because of the nature of the interface elements, certain considerations went into generating the interface
mesh. That is, in the sections of the arch near the four points of contact, interface elements were not
generated due to high stress concentrations that would hinder convergence (see Figure 46). To include
elements in these regions, significant mesh refinement as well as much smaller load increments would be
required to reach convergence. Naturally, much longer solution times would be needed and the solution
files would also be much larger. Again because cracking was limited to the crown, extending interface
elements to the supports would mean significant failure would have to result. As was mentioned before,
interface elements are a silhouette of solid elements. There appearance can be seen in Figure 47.

49
Figure 46: Interface element scheme showing loading and support points and crack position. Interface elements were not placed directly under load points or up to support points
Figure 47: Isometric, elevation, and plan view of interface elements above and below central crack (compare to Figure 43)
6.4 RESULTS
Results of displacement versus load data can be seen in Figure 48. Upon inspection, FEMR1 and FEMR2
exhibited more ductility than the unreinforced arches up to a certain loading. However, FEMR1
experienced dramatic compliance changes comparable to that of FEMUR at higher loads (about 2000N).
FEMR1 and FEMR2 also reached higher loads at displacements equivalent to that of FEMUR.
Ultimately, FEMR2 reached the highest loading; however, equivalent displacements for all models could
not be achieved without significantly refining the element meshing to allow for convergence.
Crack
Support Contact Point Support Contact Point
Load Point Load Point
Crack

50
Figure 48: Load versus time data for reinforced and unreinforced computer models
When compared to FEMUR and FEMR2, FEMR1 displayed a much greater crack resistance, as higher
displacements were required to drive the crack to hypothetical gage locations (in conjunction to where
they would have been located experimentally). This can be seen in Figure 49. However, crack growth in
FEMR2 was much more gradual then FEMR1 and FEMUR which essentially resisted crack growth up to
a certain loading before the crack extended to where the experimental end gages would have been located.
Figure 49: FEM crack time versus crack length
0
500
1000
1500
2000
2500
0 10 20 30 40 50 60 70 80 90 100
Loa
d (
N)
Time (s)
FEMR2FEMR1FEMUR
0
10
20
30
40
50
60
0 20 40 60 80 100 120 140 160
Cra
ck e
xte
nsi
on
(m
m)
Time (s)
FEMR2
FEMUR
FEMR1

51
Rod stresses for the analytical models can be seen in Figure 50. Stress increases in FEMR2 were much
more gradual and relative to FEMR1, did not significantly increase upon the onset of crack growth.
FEMR1 in comparison had a relatively linear increase in stress until the crack began to grow at which
point the stress significantly increased. It should also be noted that increases in FEMR2’s rod stresses
were largely nonlinear after crack growth began whereas FEMR1’s rod stress increases were mainly
linear.
Figure 50: Analytical model rod stresses
6.5 COMPLIANCE
As was mentioned in Section 2.2, the strain energy release in a material is dependent on the rate of change
of the materials compliance with increasing crack area. Introducing interface elements into the model
was shown to greatly increase the arches compliance when compared to that of not having interface
elements. The change in compliances can be seen in Figure 51. As was mentioned before, strain energy
can be characterized by the rate of change of compliance of a body based on crack extension. However,
as can be seen in Figure 51, other damage processes are contributing to a greater material compliance in
the model that uses interface elements. A common trend for both models however is the rapid increase of
the compliance when the crack area reaches 1600 mm2.
0
100
200
300
400
500
600
700
800
900
0 20 40 60 80 100
Ro
d S
tres
s (M
Pa)
Time (s)
FEMR2FEMR1

52
Figure 51: Compliance versus crack area for analytical models containing interface elements (light) and not containing interface elements (dark)
y = 5E-10x2 + 2E-07x + 0.0018
y = 4E-10x2 + 9E-08x + 0.0013
0.001
0.0015
0.002
0.0025
0.003
0.0035
0.004
0.0045
0.005
0 500 1000 1500 2000 2500 3000 3500 4000
Co
mp
lian
ce (
mm
/N)
Crack Area (mm2)
Laminations
No Laminations

53
7. EXPERIMENTAL AND ANALYTICAL COMPARISONS
7.1 OVERVIEW
In the following chapter, experimental and analytical results are compared. Such comparisons
include the strains in the reinforcing rods, load versus deflection data, and the position of the
initial crack. Visual comparisons will also be made based on images taken from the high-speed
camera and other media.
7.2 ROD STRAIN
Strains in the GF rods varied greatly between the analytical model and the experimental data. Although
the left and right rods of 2R2 showed the same positive strain trends (initially linear increase then
nonlinear increase at approximately the same time), the strains in the analytical model differed by an
approximate factor of twenty-five. Also, after a certain time, the strains in the 2R2’s rods dramatically
decreased whereas the strains in the analytical, model continued to increase. Rod strain comparisons
between the experimental and analytical model can be seen in Figure 52.
Figure 52: Experimental rod strains versus analytical model rod strains for 2R2 and FEMR2
-0.005
0
0.005
0.01
0.015
0.02
0.025
-0.0002
0
0.0002
0.0004
0.0006
0.0008
0.001
0 20 40 60 80 100
An
alyt
ica
l Str
ain
(m
m/m
m)
Exp
erim
enat
al S
trai
n (
mm
/mm
)
Time (s)
2R2 Left Rod2R2 Right RodFEMR2

54
Similar differences can be seen when comparing the singly reinforced experimental and analytical rod
strains. However, the increase of strain in FEMR1 was continuous whereas the increase of strain in R1
and R2’s rods alternated between linearly increasing and decreasing. Strains in R1 and R2’s rods also
decreased at around the same time of fifty seconds, though R1’s was much more gradual. The difference
between the increase of strains between the analytical model and experimental rods was approximately a
magnitude of twenty. However, direct comparisons should not be drawn as again material properties of
the singly reinforced arches need to be tested. Comparisons between R1 R2 and FEMR1 can be seen in
Figure 53.
Figure 53: Experimental rod strains versus analytical model rod strains for R1, R2 and FEMR1
The significant difference in rod strains may be attributed to the assumption of perfect bond in the
analytical model. During experimental testing, it was noticed that the GF rods went from being flush with
the top of the arch to having been slightly displaced. This is an indication that the rods slipped during
testing. Figure 54 illustrates the rod positions prior to and during testing. A general observation of the
rods was there relative smoothness which may have hindered their adherence. Because the rods were 3.2
mm in diameter, they intuitively had a small surface area which is an important property of adhesives.
The strain in R1 dramatically decreases around 50 seconds. Also, the strain gage attached to the rod
continuously records strain indicating the gage wasn’t damaged or broken. The strain in 2R2’s rods also
-0.008
0
0.008
0.016
0.024
0.032
0.04
-0.0004
0
0.0004
0.0008
0.0012
0.0016
0.002
0 25 50 75 100 125 150 175 200
An
alyt
ica
l Str
ain
(m
m/m
m)
Exp
erim
enta
l Str
ain
(m
m/m
m)
Time (s)
R1 RodR2 RodFEMR1

55
shows a drop off in both rods around seventy seconds, however, because DAQ stopped here, later trends
in the rods cannot be fully ascertained.
Figure 54: Rod positioning of experimental arch prior to (left) and during testing. Rods went from being flush with the arch surface to being slightly displaced.
7.3 CRACK GROWTH
As was mentioned before, crack growth in the reinforced experimental arches was largely controlled by
the original central crack. This was not always the case with unreinforced arches as secondary cracks
developed and in some cases began to control crack growth. Although the original central crack
controlled in all models, other secondary cracks began to form in locations similar to those in the
unreinforced arches (see Figure 55). The presence of secondary cracks in the analytical models can be
seen toward the bottom four laminations in FEMUR as per indicated by the high stress levels (indicated in
red). In FEMR2 versus 2R2 however, it can be seen that only a slight increase of stress occurred in the
lower laminations and the primary central crack controlled. This was also the case with the singly
reinforced R1 and R2 compared to FEMR1 (not pictured).

56
Figure 55: crack development in U2 and FEMUR (top left and right) and 2R2 and FEMR2 (bottom left and right).
Crack extension data for 2R2 versus FEMR2 typically showed the same trends. That is, the sudden onset
of crack extension followed by slower crack growth. However, the time at which the model reached the
hypothetical location of the trigger gage was sooner than that of the experimental arch (about a nine
second difference). Settling in the system during experimental testing could explain this as the system
was displacement controlled, and displacement was set at relatively small 5mm/min. Crack growth in
2R2 was also much more rapid initially when compared to that of FEMR2. Data can be seen in Figure 56.
Figure 56: Time versus crack extension for 2R2 and FEMR2
Primary crack
Primary crack
Secondary crack

57
Comparisons between crack growth in R1 and R2 and FEMR1 were mixed (see Figure 57). That is,
although FEMR1 and R2 had the same initial crack growth at the same time, crack growth in R1
happened nearly fifteen seconds later. Also, where crack growth in R2 and FEMR1 was relatively
instantaneous, R1’s crack growth was much slower and more gradual. It is important to note that the rod
in R2 experienced a dramatic decrease in strain at around the same time the crack had initially began to
grow (55sec as can be seen in Figure 53). The decrease in strain for R1’s rods was more gradual. The
times for the crack to fully extend from start to finish were also varied as R1 and R2 took around eighty
seconds in some cases were as the FEMR1 happened in less than ten seconds (though crack extension to
the left in R1also occurred in around fifty seconds).
Figure 57: Time versus crack extension for R1, R2, and FEMR1
Crack extension results for U1, U2 and FEMUR were significantly different (see Figure 58). Although
crack growth was initially rapid in all cases, the end gage for U1 and U2 was not reached until around
fifty and twenty-five seconds respectively had elapsed. Crack growth in FEMUR had fully occurred in
approximately five seconds. Material properties again were not tested for U1 or U2, and 2R2’s properties
were used as an estimate.

58
Figure 58: Time versus crack extension for U1, U2, and FEMUR
7.4 LOAD VERSUS DISPLACEMENT
Load versus displacement data for the experimental and analytical models can be seen in Figure 59-61.
2R2 and FEMR2 showed very similar trends including a linear relationship up until 4mm before both
changing nonlinearly. However, 2R2 experienced a slight drop in loading around 1750N before again
matching the compliance of FEMR2. Further trends could not be determined after roughly 6mm because
DAQ had stopped at this point. It should also be noted that there were slight changes in 2R2’s initial
slope which were not experienced in FEMR2.

59
Figure 59: Displacement versus loading graph comparing 2R2 and FEMR2
Figure 60 compares displacement versus loading of the singly reinforced arches and the singly reinforced
model. Trends between FEMR1 and R2 and R1 were not as strong as the doubly reinforced arches. For
example, R1 begins linear, but experiences gentle changes in compliance around the 6mm mark. A
similar trend is experienced in R2; however slight drop-offs in load occur at various points throughout
(i.e. at around 8mm and 9mm displacements). The model experiences one drop-off in loading around the
5mm mark before continuing nonlinearly. It should also be noted that this occurs at a much lower loading
then that of the other two; that is, approximately 2000N in the model versus 3000N in R1. It should again
be noted that the material properties were not fully tested in R1 or R2. This would also explain
discrepancies between U1, U2, and FEMUR, as could be seen in Figure 61. Multiple drop-offs in
loading and subsequently compliance changes occurred in the load displacement curve for U1, which
differs from FEMUR. The load versus displacement data for FEMUR contained on large drop-off
followed by slight variances in compliance similar to that of U2. However, the loads at which these
events differed once again as the drop in load for FEMUR was at 1250N and U2 was 2500N. Further
trends in FEMUR could not be obtained as this would involve significant refinement to the model mesh
pattern.
0
500
1000
1500
2000
2500
0 1 2 3 4 5 6 7 8
Loa
d (
N)
Displacement (mm)
2R2
FEMR2

60
Figure 60: Displacement versus loading graph comparing R1, R2 and FEMR1
Figure 61: Displacement versus loading graph comparing U1, U2 and FEMUR
0 2 4 6 8 10 12
0
375
750
1125
1500
1875
2250
2625
3000
0
500
1000
1500
2000
2500
3000
3500
4000
0 2 4 6 8 10 12 14
Analytical Model Displacement (mm)
An
alyt
icl L
oa
d (
N)
Exp
erim
enta
l Lo
ad
(N
)
Experimental Displacement (mm)
R1
R2
FEMR1
0 1 2 3 4 5 6 7 8
0
200
400
600
800
1000
1200
1400
1600
1800
0
400
800
1200
1600
2000
2400
2800
3200
3600
0 2 4 6 8 10 12 14 16
Analytical Model Displacement (mm)
An
alyt
ica
l Mo
del
Lo
ad
(N
)
Exp
erim
enta
l Lo
ad
(N
)
Experimental Displacement (mm)
U1
U2
FEMUR

61
Visual data from the high speed camera was inconclusive. The original assumption was that crack growth
would be very rapid requiring the camera to record at approximately 25,000fps. However, as testing went
on, the speed had to be reduced significantly to 2000fps as no visual changes in crack length could be
seen. However, even at the reduction, minimal changes in crack length were witnessed. As was stated
before, the camera has a limited memory, and the resolution required for adequate imagery limited
recording times to approximately two seconds. Figure 62 shows crack growth in U1 over a 2.75 second
interval.
Figure 62: High speed camera images showing relatively no crack growth over a 5500 frame interval (2.75 sec).

62
8. SUMMARY, CONCLUSIONS, AND RECOMMENDATIONS
8.1 SUMMARY
The following chapter presents conclusions reached from the experimental testing and analytical
modeling. Comparison between the two will be discussed along with recommendations that can be made
to improve future testing and modeling.
8.2 CONCLUSIONS
Experimental testing was conducted on five laminated wooden arches designed to fail in tension
perpendicular to the grain. Three arches were reinforced with glass-fiber composite rods, and all arches
had an artificial crack placed between the middle laminations. Material tests were performed on samples
taken from one arch from which a deterministic model was designed using interface elements to simulate
fracture. The following conclusions can be made:
1. Testing results showed that the double reinforcement pattern (2R2) provided the most ductility with
some added strength. However, because data acquisition ended prematurely due to the gage
placement, later trends could not be ascertained. Load versus deflection as well as overall ductility
was consistent with the analytical model.
2. Because of the formation of secondary cracks, the use of crack gages as a means of measuring crack
growth is compromised. As was mentioned in section 3.4, the crack gages determine the position of
the crack based on changes in strains. This is accomplishes ultimately by the strands of the gages
being broken (though at high enough acquisition speeds, strains can be determined without breaking
the strands as the crack is in motion). However, should other cracks form in the structure, false crack
positions will be given. Tunneling effects, that is, the crack moving under the gages also presents an
issue specifically in this case were DAQ began when a detection gage was severed. If the crack were
to tunnel under a gage, the exact position of the crack and when it began to propagate will not be
exactly known. This issue arose in U2.
3. Although the model can provide an understanding of overall behavior in the arches, it cannot be used
to determine fracture properties. As was earlier defined, the strain energy release, G, is dependent on
the rate of change of compliance with respect to changing crack area. Intuitively, this change is

63
dependent on only the change in crack area. By introducing interface elements at each of the
laminations, other cracks are forming in the model which was shown in Figure 54. Again, this shows
the arches overall behavior, but fracture properties cannot be determined in this fashion.
4. The process of using the high speed camera to measure the crack needs modifications. The use of
detection gages as a trigger for the camera may be compromised based on the tunneling effect
explained above. Also, because of the crack speed was significantly different from the values being
calculated, it becomes difficult to determine the proper recording speed. Complicating things even
more is the limited memory of the camera used. Lighting is also an issue as significant amounts of
light are necessary when the camera is used indoors.
5. Using radiographic imaging provides a very useful tool in measuring crack lengths and positions.
6. Changes in the experimental arch’s compliance due to crack growth could not be determined. This
was because the arch was continuously loaded, rather than loading and unloading cycles, and
therefore it could not be distinguished if changes in compliance were due to the primary crack’s
extension or due to other damage processes.
8.3 RECOMMENDATIONS
Following are recommendations that may be considered for future improvements to the model and the
experimental setup. These changes are opinions based on what was witnessed during testing and from
results of the model and experimental data.
1. Because the GF rods may have slipped during testing , adding a slip mechanism between the rods
and wood in the analytical model may account for discrepancies between the data. Particular
examples include the large differences between the experimental and analytical rod strains, and also
the differences in crack behavior. Interface elements may be a consideration if a finite element model
is used.
2. Material tests on the remaining arches should also be conducted. As was mentioned throughout,
certain data cannot be fully compared as material properties were used universally from one tested
arch. Therefore, these tests should be completed to fully draw conclusions.

64
3. Possible improvements to the experimental setup include making a more permanent setup for both the
fracture testing and the arch testing. Pipe hangers were used for fracture testing, however, more rigid
steel grips may be considered in the future (design outlined in [29]). Steel blocks may also be
considered for the arch supports, as well as a rigid support for the arch versus an Aluminum I-beam.
4. Using a breadboard, a reusable device for electronic circuitry, to place the completion circuits in
would be a significant improvement over directly connecting them to the arch leaving them
suspended. This would allow them to be easily manipulated. Completion circuits are commercially
available; however they are much more expensive then building the circuits as was done in this
research.
5. Another means of monitoring crack growth may be through a fluoroscopy system; similar to the
means used for determining the crack lengths. This may eliminate the need for the high speed camera
and/or the crack gages pending a high enough frame rate.
6. Because cracking in the arches was rapid, it is questionable if the propagation gages were
experimentally and economically feasible. The gages were capable of taking twenty-five crack
position readings, however, even at the high DAQ speed this was not the case. Therefore, it may be
more feasible to use all detection gages which served multiple purposes including triggering, reading
crack position, had the ability to be placed manually at any spacing, and were a fraction of the cost of
the propagation gages.
7. Because of the memory and lighting issues with the high-speed camera, a low-light camera may be
considered. Such cameras are commercially available however they come at a significantly high
price.
8. Developing a K-R curve could be used to determine the arches resistance to crack growth, as well as
determine when instability may occur
9. Because only one arch had the double reinforcement pattern, more arches with that pattern should be
tested. This is largely in part to data acquisition ending prematurely.

65
10. Further investigating the wood/adhesive interaction at the laminations is advised as well. This will
allow to properly determine where exactly failure occurs (was it in the adhesive layer, in the wood, or
in a combination of both?).

66
REFERENCES
1. University of Cambridge Department of Engineering, Specific strength- specific stiffness, Web 2006,
<http://www-materials.eng.cam.ac.uk/mpsite/interactive_charts/spec-pec/NS6Chart.html>
2. Blass, Bejtka,: Reinforcements Perpendicular to the Grain Using Self-tapping Screws, WCTE 2004,
pp 1001-1006
3. Canadian Wood Council: Wood Frame Construction- Meeting the Challenges of Earthquakes,
Ottawa, 2003
4. The January 17, 1994 Northridge, CA Earthquake, EQE Summary Report, March 1994,
<http://www.lafire.com/famous_fires/940117_northridgeearthquake/quake/03_EQE_commerical.htm
>
5. Broek: Elementary Engineering Fracture Mechanics, Kluwer Academic Publishers, 1982 pp 1-5
6. Sanford: Principles of fracture mechanics, Pearson Education. Inc., 2003
7. Smith, Landis, Gong, Fracture and Fatigue in Wood, John Wiley & Sons Ltd, the Atrium, Southern
Gate, Chichester, West Sussex PO19 8SQ, England, 2003
8. Cook, Malkus, Plesha, Witt, : Concepts and Applications of Finite Element Analysis Fourth Edition,
John Wiley and Sons, Inc.,2002
9. Chandrupatla, Belegundu, : Introduction to finite elemens in Engineering Third Edition,Prentice
Hall, Upper Saddle River, NewJersey 07458, 2002
10. Landis, Navi,: Modeling crack propagation in wood and wood composites. A review, Walter de
Gruyter • Berlin • New York, Holzforschung, Vol. 63, 2009, pp 150–156
11. Davalos, Qiao, Development of a Prototype Composite-Reinforced Timber Railroad Crosstie, 5th
World Conference on Timber Engineering, Volume 1, August 1998, pp. 494-501
12. Schmidt, Kaliske,: Simulation of Cracks in wood Using a coupled Material Model for Interface
Elements, Walter de Gruyter • Berlin • New York., Holzforschung, Vol. 61, 2007, pp. 382–389
13. Needleman,: Micromechanical modelling of interfacial decohesion, Ultramicroscopy, Vol. 40, 1992,
pp. 203-214
14. Xu, Needleman,: Void nucleation by inclusion debonding in a crystal matrix, Modelling Simul.
Mater. Sci. Eng. 1, 1993, pp. 111-132
15. Xu, Needleman,: Continuum modeling of interfacial decohesion, Solid State Phenomena, Vol. 35-36,
1993, pp. 287-302
16. Xu, Needleman, : Numerical simulation of fast crack growth in brittle solids, J. Mech, Phys. Solids,
Vol. 42, No. 9, 1994, pp. 1397-1434
17. ANSYS, ANSYS User’s Manual Revision 11.0, ANSYS, Inc., Canonsburg, Pennsylvania, 2005.

67
18. Rice: A path independent integral and the approxtmate analysts of strain conccntration by notches
and cracks. J. Appl.. Mech. 35, 1968, 378- 386.
19. Blass, Schmid,: Self-tapping Screws as Reinforcement Perpendicular to the Grain in Timber
Connections, Lehrstuhl für Ingenieurholzbau und Baukonstruktionen, University of Karlsruhe (TH),
Germany
20. Jönsson,: Load carrying capacity of curved glulam beams reinforced with self-tapping screws,
Springer-Verlag, July 2005, pp. 342-346
21. Windorski, Soltis, Ross,: Feasibility of fiberglass-reinforced bolted wood connections. Res. Pap.
FPL–RP–562. Madison, WI: U.S. Department of Agriculture, Forest Service, Forest Products
Laboratory. 9 p.
22. Klinger, Johansson, Crocetti,; Strengthening timber with CFRP or steel plates - short and long-term
performance, WCTE 2008
23. Rowlands, Van Deweghe, Laufenberg, T.L., Krueger, G.P.; Fiber-Reinforced Wood Composites,
Wood and Fiber Science, 18(1), 1986, pp. 39-57
24. Tingley, Gai, FRP Reinforced Glulam Performance: A Case Study, 5th World Conference on Timber
Engineering, Volume 2, 1998, pp. 177-181
25. Haller, Chen, Natterer, Experimental Study on Glass fiber Reinforced and Densified Timber Joints,
International Wood Engineering Conference, Volume 1, October 1996, pp. 308-314
26. Kasal, Heiduschke, Radial reinforcement of curved glue laminated wood beams with composite
materials, Forest Products Journal, 54(1), 2004, pp. 74-79.
27. Tapplastics,: Fiberglass Reinforced Plastic Pultruded Rod and Bar, tapplastics.com
28. Photron, High Speed Video Camera for Slow Motion Analysis. Web. 17 Mar. 2011.
<http://www.photron.com/datasheet/ultima_512.pdf>
29. Adams, Andrew R., Quantitative Radiographic Investigation of Mechanical Fasteners in Wood
Connections, The Pennsylvania State University College of Engineering, 2009
30. ASTM Standard E 2472 – 06, 2006,: Standard Test Method for Determination of Resistance to Stable
Crack Extension under Low-Constraint Conditions, ASTM International, West Conshohocken, PA
31. Kundu: Fundamentals of fracture mechanics, Taylor & Francis group, 2008
32. WoodBin - Woodworking Software, Strength Properties of Commercially Important Woods
Articles, Plans, and Reference Info. Web. 17 Mar. 2011.
<http://www.woodbin.com/ref/wood/strength_table.htm>.

68
APPENDIX A: SELECTED CHARTS
The following appendix contains data taken from the five arch tests. Data included is load displacement,
and crack position based on the gage readings.
Figure A1: R1 crack extension
Figure A2: R2 Crack extension

69
Figure A3: U1 Crack extension
Figure A4: U2 Crack extension

70
Figure A5: 2R2 Crack extension

71
Figure A6: R1 displacement versus load
Figure A7: R2 displacement versus load
0
500
1000
1500
2000
2500
3000
3500
4000
4500
0 2 4 6 8 10 12 14
Loa
d (
N)
Displacement (mm)
R1
0
500
1000
1500
2000
2500
3000
3500
4000
0 2 4 6 8 10 12
Loa
d (
N)
Displacement (mm)
R2

72
Figure A8: U1 displacement versus load
Figure A9: U2 displacement versus load
0
500
1000
1500
2000
2500
3000
0 1 2 3 4 5 6 7 8 9 10
Loa
d (
N)
Displacement (mm)
U1
0
500
1000
1500
2000
2500
3000
3500
0 2 4 6 8 10 12 14 16
Loa
d (
N)
Displacement (mm)
U2

73
Figure A10: 2R2 displacement versus load
0
500
1000
1500
2000
2500
0 1 2 3 4 5 6 7
Loa
d (
N)
Displacement (mm)
2R2

74
APPENDIX B: DOUBLY REINFORCED ARCH ANSYS INPUT CODE
The following appendix contains the input code to generate the doubly reinforced arch using ANSYS 11.0
software.
FINI
/CLEAR
/PREP7
/TITLE, THREE DIMENSIONAL REINFORCED ARCH USING DELAMINATION
*ASK,N,NUMBER OF LAMINATIONS,18
*ASK,P,WHAT LAMINATION IS CRACK AT[NUMBER] (DEFAULTS TO MIDDLE LAM),9
*ASK,L,LENGTH OF HALF ARCH [MM],390
*ASK,HL,HEIGHT AT CENTER OF BEAM [MM],54
*ASK,R,RADIUS [MM],300
*ASK,A1,BOTTOM OF BEAM TO HORIZONTAL [DEGREES],18
*ASK,B,LENGTH OF CONTACT SURFACE [MM],15
*ASK,D,ROD DIAMETER [MM],3.175
*ASK,A2,ROD ANGLE OF ORIENTATION TO VERTICAL [DEGREES],10
*ASK,C1,INITIAL CRACK LENGTH LEFT [MM],27
*ASK,C2,INITIAL CRACK LENGTH RIGHT [MM],27
*ASK,C3,INITIAL CRACK THICKNESS [MM],0.25
*ASK,DISP,DISPLACEMENT APPLIED [MM],7.4
*ASK,THKNSS, HALF THICKNESS OF ARCH,12.5
*ASK,V,ENTER NUMBER OF LAYER DIVISIONS,1
!***************************WOOD MATERIAL PROPERTIES************************
EX=390
EY=32000
EZ=700
GXY=950
GYZ=900
GXZ=100
NUXY=0.32
NUYZ=0.02
NUXZ=0.39

75
MP,EX,4,EX !MATERIAL 4 WOOD
MP,EY,4,EY
MP,EZ,4,EZ
MP,GXY,4,GXY
MP,GYZ,4,GYZ
MP,GXZ,4,GXZ
MP,NUXY,4,NUXY
MP,NUYZ,4,NUYZ
MP,NUXZ,4,NUXZ
MP,DENS,4,470E-12
!****************************GF ROD PROPERTIES PROPERTIES*********************
MP,EX,6,46000 !LONGITUDINAL (TESTED)
MP,EZ,6,7000
MP,EY,6,7000
MP,GXY,6,5000
MP,GXZ,6,5000
MP,GYZ,6,5000
MP,NUXY,6,0.20
MP,NUXZ,6,0.20
MP,NUYZ,6,0.20
!*****************************ELEMENTS************************************
ET,1,185 !SOLID ELEMENTS
ET,3,205 !INTERFACE ELEMENTS
!******************************DEFINED CONSTANTS*********************************
PI=3.14159265358979
A1=A1/180*PI !BOTTOM OF BEAM TO HORIZONTAL
A2=A2/180*PI !ROD ANGLE OF ORIENTATION
X1=(R+HL)*SIN(A1) !DISTANCE TO END OF CROWN CURVATURE AND LOAD APP
(TOP)

76
X2=X1-HL*SIN(A1) !DISTANCE TO END OF CROWN CURVATURE (BOTTOM)
X3=L-B !DISTANCE TO FRONT OF ARCH CONTACT SURFACE
X4=L !ARCH SPAN DISTANCE
L1=R+HL !HEIGHT TO APEX OF CROWN
L2=R !HEIGHT TO BOTTOM OF CROWN
L3=(R+HL)*COS(A1) !HEIGHT TO END OF CROWN CURVATURE (BOTTOM)
L4=L3-HL*COS(A1) !HEIGHT TO END OF CROWN CURVATURE AND LOAD APP
(TOP)
L5=(X4-X1)*TAN(A1) !HEIGHT FROM BASE TO END OF CROWN CURVATURE
(BOTTOM)
L6=L4-L5 !HEIGHT FROM ORIGIN TO BOTTOM OR ARCH
L7=L6+HL !HEIGHT TO TOP OF BACK OF ARCH
L8=L2+P*HL/N !HEIGHT TO START OF CRACK CENTER
L9=L8*COS(A1) !HEIGHT TO END OF CRACK
X5=L8*SIN(A1) !DISTANCE TO END OF CRACK
!************ START MAKING KEYPOINTS. NUMBERING BASED ON 'N' LAMINATIONS
*********
/PNUM,KP,1
K,,0,L1 !1
K,N+1,0,L2 !N+1
KFILL,1,N+1,N-1,2,1 !PREVIOUS THREE COMMANDS DO CENTER ARCH
KEYPOINTS
CSYS,1
K,N+2,L1,(90-(C2*180/(L8*PI))) !N+2
K,2*N+2,L2,(90-(C2*180/(L8*PI))) !2N+2
KFILL,N+2,2*N+2,N-1,N+3,1 !PREVIOUS THREE COMMANDS DO KEYPOINTS AT
RIGHT
!CRACK TIP
CSYS,0
K,,X1,L3 !2N+3

77
K,3*N+3,X2,L4 !3N+3
KFILL,2*N+3,3*N+3,N-1,2*N+4,1 !PREVIOUS THREE COMMANDS DO END OF CROWN
KEYPOINTS
CSYS,1
K,3*N+4,L1,(90+(C1*180/(L8*PI))) !3N+4
K,3*N+4+N,L2,(90+(C1*180/(L8*PI))) !4N+4
KFILL,3*N+4,4*N+4,N-1,3*N+5,1 !PREVIOUS THREE COMMANDS DO KEYPOINTS
AT LEFT
!CRACK TIP
CSYS,0
K,,-X1,L3 !4N+5
K,5*N+5,-X2,L4 !5N+5
KFILL,4*N+5,5*N+5,N-1,4*N+6,1 !PREVIOUS THREE COMMANDS DO LEFT END OF
CROWN KPS
CSYS,1
*IF,P,GE,N,THEN !DETERMINES POSITION OF CRACK KP. QUALITY
CHECK TO
!ASSURE CRACK DOES NOT APPEAR OUTSIDE
LAMINATIONS
P=N-1
*ELSE
P=P
*ENDIF
CSYS,0
!***************************LOCAL COORDINATE
SYSTEMS********************************
LOCAL,11,1,0,((D/2)/SIN(A2)) !FOR MAKING TOP OF RODS (UNUSED)
LOCAL,12,0,,,,-A1*180/PI+90 !BOTTOM ARCH ELEM ORIENTATION (RIGHT)
LOCAL,13,0,,,,+A1*180/PI+90 !BOTTOM ARCH ELEM ORIENTATION (LEFT)

78
LOCAL,14,1
LOCAL,15,0,,,,90-A2*PI/180 !ROD ELEM ORIENTATION RIGHT
LOCAL,16,0,,,,90+A2*PI/180 !ROD ELEM ORIENTATION LEFT
LOCAL,19,1,L8*SIN(C2/L8),L8*COS(C2/L8),,90-(C2*180)/(L8*PI) !CYLINDRICAL SYSTEM AT
!RIGHT CRACK TIP
LOCAL,20,0,L8*SIN(C2/L8),L8*COS(C2/L8),,90-(C2*180)/(L8*PI) !CARTESIAN SYSTEM AT
!RIGHT CRACK TIP
!*****************************START MAKING
LINES**************************************
CSYS,1
/PNUM,LINE,1
*DO,I,1,N+1,1
L,I,N+1+I
*ENDDO !N+1 !CROWN CENTER TO RIGHT
CRACK TIP
*DO,I,1,N+1,1
L,N+1+I,2*(N+1)+I
*ENDDO !2(N+1) !RIGHT CRACK TIP TO RIGHT END
OF CROWN
*DO,I,1,N+1,1
L,I,3*(N+1)+I
*ENDDO !3(N+1) !CROWN CENTER TO LEFT CRACK
TIP
*DO,I,1,N,1
L,I,I+1
*ENDDO !4N+3 !CENTER ARCH VERTICAL LINES
*DO,I,1,N,1
L,N+1+I,N+2+I

79
*ENDDO !5N+3 !VERTICAL LINES AT RIGHT
CRACK TIP
*DO,I,1,N,1
L,2*N+2+I,2*N+3+I
*ENDDO !6N+3 !RIGHT END OF CROWN VERTIAL
LINES
*DO,I,1,N,1
L,3*N+3+I,3*N+4+I
*ENDDO !7N+3 !VERTICAL LINES AT LEFT CRACK
TIP
*DO,I,1,N+1,1
L,3*N+3+I,4*N+4+I
*ENDDO !8N+4 !CROWN LONGITUDINAL LINES
LEFT
*DO,I,1,N,1
L,4*N+4+I,4*N+5+I
*ENDDO !9N+4 !LEFT END OF CROWN VERTICAL
LINES
!***************************DEFINE CRACK POINTS AT ARCH
CENTER***********************
K,,L2+(HL/N)*P+C3/2,90 !5N+6 (CRACK POINTS)
K,,L2+(HL/N)*P-C3/2,90 !5N+7 (CRACK POINTS)
!*******************************MAKE ARCH CROWN
AREA*********************************
CSYS,1
SELTOL,1E-3
LSEL,S,LOC,X,L1

80
LSEL,A,LOC,X,0,L2
LSEL,A,LOC,Y,0,90-180*A1/PI
LSEL,A,LOC,Y,90+180*A1/PI,180
AL,ALL
ALLS
SELTOL,0
!*******************************MAKE CRACK KPS AND
LINES******************************
CSYS,1
!WE DO NOT KNOW THE # OF KPS THAT DEFINE CRACK TIPS. WE MUST REDEFINE THEM
!BASED ON KNOWN COORDINATES
KSEL,S,,,5*N+6
KSEL,A,,,5*N+7
K,5*N+8,((L2+(HL/N)*P+C3/2)+(L2+(HL/N)*P-C3/2))/2,(90+(C1*180/(L8*PI))) !5N+8
K,5*N+9,((L2+(HL/N)*P+C3/2)+(L2+(HL/N)*P-C3/2))/2,(90-(C2*180/(L8*PI))) !5N+9
L,5*N+6,5*N+8 !9N+5
L,5*N+8,5*N+7 !9N+6
L,5*N+7,5*N+9 !9N+7
L,5*N+9,5*N+6 !9N+8 !PREVIOUS FOUR COMMANDS
MAKE CRACK
!******************************MAKE CRACK
AREAS**************************************
LSLK,S !LINES ASSOCIATED WITH CRACK
KEYPOINTS
AL,ALL
ALLS
!******************************ARCH
VOLUME*******************************************
K,5*N+11,L1,90-A1*180/PI,THKNSS !5N+11
L,2*N+3,5*N+11 !9N+9 !FROMS KP AND LINE AT THICKNESS TO
!EXTRUDE ARCH VOLUME

81
LSEL,U,,,ALL
!******************************CRACK TIP MESH
AREAS**********************************
CSYS,19
BTOL,1E-9
*DO,I,1,V,1
CIRCLE,5*N+9,I*HL/(V*N)
LGEN,1,ALL,,,,90-(C2*180)/(L8*PI),,,,1
LSEL,R,LOC,Y,0,180
LCOMB,ALL
LSEL,S,LOC,Y,180,360
LSEL,R,LOC,X,I*HL/(V*N)
LSEL,U,LOC,Y,0
LSEL,U,LOC,Y,180
LCOMB,ALL
LSEL,S,LOC,X,I*HL/(V*N)
LSEL,U,LOC,Y,0
LSEL,U,LOC,Y,180
AL,ALL
LSEL,U,,,ALL
ASEL,U,,,ALL
*ENDDO !DO LOOP FOR AREARS FOR CRACKTIP
MESHING
CSYS,1
LSEL,ALL
lsel,u,,,9*n+9
ASEL,ALL
ASBA,ALL,2
AOVLAP,ALL !FORMS CRACK AND CRACK TIP MESH AREA
!******************GENERATE ALL LAMINATION
AREAS**************************************

82
ASBL,ALL,ALL
ALLS
!******************GENERATE ALL LAMINATION
VOLUMES************************************
VDRAG,ALL,,,,,,9*N+9 !GENERATES ALL LAMINATIONS
!******************GENERATE RIGHT REINFORCING
ROD*************************************
BTOL,0
CSYS,0
WPROTA,,-90 !CHANGES THE Y AXIS TO THE Z AXIS FOR FORMING
RODS
WPROTA,,,A2*180/PI !ROTATE Y (NOW Z) TO PROPER ROD ANGLE
ORIENTATION
CYLIND,D/4,D/2,200,450,-180,0 !MAKES RIGHT ROD
CYLIND,THKNSS,D/4,200,450,-180,0 !WILL HELP IN MESH REFINEMENT
WPROTA,,,-A2*180/PI
WPROTA,,90 !RESTORES AXES TO GLOBALS
CSYS,1
VSEL,S,LOC,Y,0,(90-(C2*180/(L8*PI)))
VOVLAP,ALL
NUMMRG,ALL
ALLS
LSEL,S,LOC,X,L2,L1
LSEL,INVE
ASLL,S
VSLA,S
VDELE,ALL !REMOVES CANTILEVER ROD COMPONENTS
ALLS
CSYS,1
ASEL,S,LOC,X,L1,1000

83
ASEL,A,LOC,X,0,L2
ASEL,U,LOC,X,L1
ASEL,U,LOC,X,L2
LSLA,ALL
LSEL,U,LOC,X,L2
LSEL,U,LOC,X,L1
KSLL,S
KSEL,U,LOC,X,L1
KSEL,U,LOC,X,L2
ADELE,ALL
LDELE,ALL
KDELE,ALL !PREVIOUS THIRTEEN COMMANDS DELETE
UNNECESSARY
!ASPECTS
ALLS
!*************************DIVIDE ROD TO ALLOW FOR HEX.
MESHING*********************
CSYS,1
K,10000,L2,90-A2*180/PI
K,10001,L1,90-A2*180/PI
K,10002,L2,90-A2*180/PI,THKNSS
K,10003,L1,90-A2*180/PI,THKNSS
LSEL,U,,,ALL
L,10000,10001
L,10001,10003
L,10002,10003
L,10002,10000
AL,ALL
ALLS
ASLL,S
VSLA,S
VSBA,ALL,ALL !PREVIOUS 15 COMMANDS ARE NECESSARY TO
DIVIDE

84
ALLS !RODS FOR HEXAHEDRAL MESHING
!****************************MIRROR RIGHT
ROD**************************************
LSEL,S,LOC,Z,THKNSS
ASLL,S
VSLA,S
VSEL,INVER
ASLV,S
LSLA,S
ASLL,S
VSLA,S
CSYS,0
VSYMM,X,ALL !MIRROR ROD
NUMMRG,ALL
ALLS
!*********************COMPLETE RIGHT ARCH
GEOMETRY*****************************************
K,100000,X4,L7
K,100000+N+1,X4,L6
K,100000+N,X3,L6
KFILL,100000,100000+N,N-1,100001,1
ASEL,U,,,ALL
LSEL,U,,,ALL
L,2*N+3,100000
L,100000,100000+N
L,100000+N,3*N+3
L,2*N+3,3*N+3
AL,ALL
LSEL,U,,,ALL !PREVIOUS 12 COMMANDS FORM RIGHT BASE KPS,LINES,AND
AREAS

85
*DO,I,1,N-1,1
L,2*N+3+I,100000+I
*ENDDO !BASE LAMINATION LINES
ASBL,ALL,ALL !BASE LAMINATIOPN AREAS
VDRAG,ALL,,,,,,9*N+9 !BASE LAMINATION VOLUMES
VSEL,U,,,ALL
ASEL,U,,,ALL
LSEL,U,,,ALL
KSEL,S,,,100000
KSEL,A,,,100000+N
KSEL,A,,,100000+N+1
A,100000,100000+N,100000+N+1
VDRAG,ALL,,,,,,9*N+9 !FORMS TRIANGLE AT BASE OF ARCH
!****************COMPLETE LEFT ARCH
GEOMETRY************************************
CSYS,1
VSEL,S,LOC,Y,0,90-A1*180/PI
BTOL,1E-5
CSYS,0
VSYMM,X,ALL !MIRRORS BOTTOM OF ARCH COMPLETING
GEOMETRY
ALLS
CSYS,1
VSEL,S,LOC,Y,90-A1*180/PI,90+A1*180/PI
VOVLAP,ALL
ALLS
NUMMRG,ALL
!**********************BEGIN ROD MESHING****************************************
LSEL,S,LOC,Z,D/4 !SELECT VERTICAL ROD LINES
LSEL,U,LOC,X,L8+HL/N,L8-HL/N !REMOVE COMPONENTS IN PATH OF ROD
LESIZE,ALL,,,V !<===LINE MESH POINT (ARBITRARAY)

86
ALLS
!BEGIN ROD MESHING
LSEL,S,LOC,Z,D/4 !SELECT VERTICAL ROD LINES IN CRACK PATH
LSEL,R,LOC,X,L8-HL/N,L8+HL/N
LESIZE,ALL,,,2 !<===LINE MESH POINT MUST EQUAL (***)
ALLS
LSEL,S,LOC,Z,0,D/2
LSEL,U,LOC,Z,0
LSEL,U,LOC,Z,D/2
LSEL,U,LOC,Z,D/4 !LEAVES CURVED ASPECTS OF RODS
LESIZE,ALL,,,4 !<===LINE MESH POINT (MUST BE EVEN > THAN 2)
!MUST = (**)
VSEL,S,LOC,Z,0,D/2
MAT,6
TYPE,1
VMESH,ALL
!*********************MESH WOOD CONTACTING
RODS**********************************
ASEL,S,LOC,Z,THKNSS
VSLA,A
VSEL,INVE
MAT,4
TYPE,1
VMESH,ALL !MESH WOOD CONTACTING RODS
!********************SIZE LINES PAST CRACK TIPS**********************************
*DO,I,0,N,1 !SELECT LAMINATION LINES PAST CRACK TIP
VSEL,S,LOC,Z,0,D/2
ASLV,S
VSLA,S

87
ASLV,S
LSLA,S
LSEL,INVE
LSEL,U,LOC,Y,0,90-A1*180/PI
LSEL,U,LOC,Y,90+A1*180/PI,180
LSEL,U,LOC,Y,90
LSEL,U,LOC,Y,(90-(C2*180/(L8*PI))),90
LSEL,U,LOC,Y,90,(90+(C1*180/(L8*PI)))
SELTOL,1E-4
LSEL,R,LOC,X,L2+I*HL/N
CSYS,19
LSEL,U,LOC,X,0,HL/N
CSYS,1
LESIZE,ALL,,,40 !<==== LINE MESH POINT (ARBITRARY)
ALLS
*ENDDO
!********************SIZE LINES ABOVE AND BELOW CRACK
***************************
*DO,I,0,N,1 !SELECT LAMINATION ABOVE AND BEFORE CRACK
VSEL,S,LOC,Z,0,D/2
ASLV,S
VSLA,S
ASLV,S
LSLA,S
LSEL,INVE
LSEL,U,LOC,Y,0,90-A1*180/PI
LSEL,U,LOC,Y,90+A1*180/PI,180
LSEL,U,LOC,Y,90
LSEL,U,LOC,Y,90-A1*180/PI,(90-(C2*180/(L8*PI)))
LSEL,U,LOC,Y,(90+(C1*180/(L8*PI))),(90+A1*180/PI)
SELTOL,1E-4
LSEL,R,LOC,X,L2+I*HL/N

88
CSYS,19
LSEL,U,LOC,X,0,HL/N
LPLOT
CSYS,1
LESIZE,ALL,,,5 !<==== LINE MESH POINT (ARBITRARY)
ALLS
*ENDDO
!***********************MESH ARCH CROWN***************************************
CSYS,1
MAT,4
TYPE,1
ASEL,S,LOC,Z,THKNSS
VSLA,S
VSEL,U,LOC,Y,0,90-A1*180/PI
VSEL,U,LOC,Y,90+A1*180/PI,180
CSYS,19
VSEL,U,LOC,X,0,HL/N
VMESH,ALL !MESH CROWN OF ARCH
!*********************RIGHT CRACKTIP MESHING**********************************
CSYS,19
VSEL,S,LOC,X,0,HL/N
ASLV,S
LSLA,S
*DO,I,1,V,1
LSEL,S,LOC,X,0,I*HL/(V*N)
LSEL,R,LOC,Z,0
LESIZE,ALL,,,2 !(***)LINE MESH POINT. BECAUSE OF MESHING
!AROUND CRACK TIP, THIS VALUE
!MUST BE EVEN > OR = 2
LPLOT
*ENDDO

89
LSLA,S
*DO,I,0,3,1
LSEL,S,LOC,X,HL/(N),HL/N
LSEL,R,LOC,Z,0
LSEL,R,LOC,Y,I*90
LESIZE,ALL,,,1
LSEL,S,LOC,X,HL/(N),HL/N
LSEL,R,LOC,Z,THKNSS
LSEL,R,LOC,Y,I*90
LESIZE,ALL,,,1
*ENDDO
LSLA,S
LSEL,U,LOC,Z,0
LSEL,U,LOC,Z,THKNSS
LESIZE,ALL,,,4 !SIZES CRACK TIP ELEMENT THICKNESS (MUST =(**))
VMESH,ALL !MESHES CRACK TIP ELEMENTS HOWEVER...
VSEL,S,LOC,X,0,HL/N
VCLEAR,ALL !...NEED TO CREATE TETRAHEDRAL ELEMENTS IN
!FRONT OF CRACK TIP
!*******TETRAHEDRAL ELEMENTS AT CRACK TIP (MORE
PRECISION)*******************************
CSYS,19
SELTOL,.1
N,,,0
N,,,,THKNSS/4
N,,,,THKNSS/2
N,,,,3*THKNSS/4
N,,,,THKNSS
SELTOL,1

90
NSEL,S,LOC,X,HL/(N*V) $ NSEL,R,LOC,Z,0 $ NSEL,R,LOC,Y,270 $ *GET,N1,NODE,0,NUM,MAX
NSEL,S,LOC,X,HL/(N*V) $ NSEL,R,LOC,Z,0 $ NSEL,R,LOC,Y,315 $ *GET,N2,NODE,0,NUM,MAX
NSEL,S,LOC,X,HL/(N*V) $ NSEL,R,LOC,Z,0 $ NSEL,R,LOC,Y,360 $
*GET,N3,NODE,0,NUM,MAX
NSEL,S,LOC,X,HL/(N*V) $ NSEL,R,LOC,Z,0 $ NSEL,R,LOC,Y,405 $
*GET,N4,NODE,0,NUM,MAX
NSEL,S,LOC,X,HL/(N*V) $ NSEL,R,LOC,Z,0 $ NSEL,R,LOC,Y,450 $ *GET,N5,NODE,0,NUM,MIN
NSEL,S,LOC,X,HL/(N*V) $ NSEL,R,LOC,Z,0 $ NSEL,R,LOC,Y,450 $
*GET,N6,NODE,0,NUM,MAX
NSEL,S,LOC,X,HL/(N*V) $ NSEL,R,LOC,Z,0 $ NSEL,R,LOC,Y,495 $ *GET,N7,NODE,0,NUM,MAX
NSEL,S,LOC,X,HL/(N*V) $ NSEL,R,LOC,Z,0 $ NSEL,R,LOC,Y,540 $ *GET,N8,NODE,0,NUM,MAX
NSEL,S,LOC,X,HL/(N*V) $ NSEL,R,LOC,Z,0 $ NSEL,R,LOC,Y,225 $ *GET,N9,NODE,0,NUM,MAX
NSEL,S,LOC,X,0 $ NSEL,R,LOC,Z,0 $ $ *GET,N10,NODE,0,NUM,MAX
NSEL,S,LOC,X,HL/(N*V) $ NSEL,R,LOC,Z,THKNSS/4 $ NSEL,R,LOC,Y,270 $
*GET,N11,NODE,0,NUM,MAX
NSEL,S,LOC,X,HL/(N*V) $ NSEL,R,LOC,Z,THKNSS/4 $ NSEL,R,LOC,Y,315 $
*GET,N12,NODE,0,NUM,MAX
NSEL,S,LOC,X,HL/(N*V) $ NSEL,R,LOC,Z,THKNSS/4 $ NSEL,R,LOC,Y,360 $
*GET,N13,NODE,0,NUM,MAX
NSEL,S,LOC,X,HL/(N*V) $ NSEL,R,LOC,Z,THKNSS/4 $ NSEL,R,LOC,Y,405 $
*GET,N14,NODE,0,NUM,MAX
NSEL,S,LOC,X,HL/(N*V) $ NSEL,R,LOC,Z,THKNSS/4 $ NSEL,R,LOC,Y,450 $
*GET,N15,NODE,0,NUM,MIN
NSEL,S,LOC,X,HL/(N*V) $ NSEL,R,LOC,Z,THKNSS/4 $ NSEL,R,LOC,Y,450 $
*GET,N16,NODE,0,NUM,MAX
NSEL,S,LOC,X,HL/(N*V) $ NSEL,R,LOC,Z,THKNSS/4 $ NSEL,R,LOC,Y,495 $
*GET,N17,NODE,0,NUM,MAX
NSEL,S,LOC,X,HL/(N*V) $ NSEL,R,LOC,Z,THKNSS/4 $ NSEL,R,LOC,Y,540 $
*GET,N18,NODE,0,NUM,MAX
NSEL,S,LOC,X,HL/(N*V) $ NSEL,R,LOC,Z,THKNSS/4 $ NSEL,R,LOC,Y,225 $
*GET,N19,NODE,0,NUM,MAX
NSEL,S,LOC,X,0 $ NSEL,R,LOC,Z,THKNSS/4 $ $
*GET,N20,NODE,0,NUM,MAX

91
NSEL,S,LOC,X,HL/(N*V) $ NSEL,R,LOC,Z,THKNSS/2 $ NSEL,R,LOC,Y,270 $
*GET,N21,NODE,0,NUM,MAX
NSEL,S,LOC,X,HL/(N*V) $ NSEL,R,LOC,Z,THKNSS/2 $ NSEL,R,LOC,Y,315 $
*GET,N22,NODE,0,NUM,MAX
NSEL,S,LOC,X,HL/(N*V) $ NSEL,R,LOC,Z,THKNSS/2 $ NSEL,R,LOC,Y,360 $
*GET,N23,NODE,0,NUM,MAX
NSEL,S,LOC,X,HL/(N*V) $ NSEL,R,LOC,Z,THKNSS/2 $ NSEL,R,LOC,Y,405 $
*GET,N24,NODE,0,NUM,MAX
NSEL,S,LOC,X,HL/(N*V) $ NSEL,R,LOC,Z,THKNSS/2 $ NSEL,R,LOC,Y,450 $
*GET,N25,NODE,0,NUM,MIN
NSEL,S,LOC,X,HL/(N*V) $ NSEL,R,LOC,Z,THKNSS/2 $ NSEL,R,LOC,Y,450 $
*GET,N26,NODE,0,NUM,MAX
NSEL,S,LOC,X,HL/(N*V) $ NSEL,R,LOC,Z,THKNSS/2 $ NSEL,R,LOC,Y,495 $
*GET,N27,NODE,0,NUM,MAX
NSEL,S,LOC,X,HL/(N*V) $ NSEL,R,LOC,Z,THKNSS/2 $ NSEL,R,LOC,Y,540 $
*GET,N28,NODE,0,NUM,MAX
NSEL,S,LOC,X,HL/(N*V) $ NSEL,R,LOC,Z,THKNSS/2 $ NSEL,R,LOC,Y,225 $
*GET,N29,NODE,0,NUM,MAX
NSEL,S,LOC,X,0 $ NSEL,R,LOC,Z,THKNSS/2 $ $
*GET,N30,NODE,0,NUM,MAX
NSEL,S,LOC,X,HL/(N*V) $ NSEL,R,LOC,Z,3*THKNSS/4 $ NSEL,R,LOC,Y,270 $
*GET,N31,NODE,0,NUM,MAX
NSEL,S,LOC,X,HL/(N*V) $ NSEL,R,LOC,Z,3*THKNSS/4 $ NSEL,R,LOC,Y,315 $
*GET,N32,NODE,0,NUM,MAX
NSEL,S,LOC,X,HL/(N*V) $ NSEL,R,LOC,Z,3*THKNSS/4 $ NSEL,R,LOC,Y,360 $
*GET,N33,NODE,0,NUM,MAX
NSEL,S,LOC,X,HL/(N*V) $ NSEL,R,LOC,Z,3*THKNSS/4 $ NSEL,R,LOC,Y,405 $
*GET,N34,NODE,0,NUM,MAX
NSEL,S,LOC,X,HL/(N*V) $ NSEL,R,LOC,Z,3*THKNSS/4 $ NSEL,R,LOC,Y,450 $
*GET,N35,NODE,0,NUM,MIN
NSEL,S,LOC,X,HL/(N*V) $ NSEL,R,LOC,Z,3*THKNSS/4 $ NSEL,R,LOC,Y,450 $
*GET,N36,NODE,0,NUM,MAX

92
NSEL,S,LOC,X,HL/(N*V) $ NSEL,R,LOC,Z,3*THKNSS/4 $ NSEL,R,LOC,Y,495 $
*GET,N37,NODE,0,NUM,MAX
NSEL,S,LOC,X,HL/(N*V) $ NSEL,R,LOC,Z,3*THKNSS/4 $ NSEL,R,LOC,Y,540 $
*GET,N38,NODE,0,NUM,MAX
NSEL,S,LOC,X,HL/(N*V) $ NSEL,R,LOC,Z,3*THKNSS/4 $ NSEL,R,LOC,Y,225 $
*GET,N39,NODE,0,NUM,MAX
NSEL,S,LOC,X,0 $ NSEL,R,LOC,Z,3*THKNSS/4 $ $
*GET,N40,NODE,0,NUM,MAX
NSEL,S,LOC,X,HL/(N*V) $ NSEL,R,LOC,Z,THKNSS $ NSEL,R,LOC,Y,270 $
*GET,N41,NODE,0,NUM,MAX
NSEL,S,LOC,X,HL/(N*V) $ NSEL,R,LOC,Z,THKNSS $ NSEL,R,LOC,Y,315 $
*GET,N42,NODE,0,NUM,MAX
NSEL,S,LOC,X,HL/(N*V) $ NSEL,R,LOC,Z,THKNSS $ NSEL,R,LOC,Y,360 $
*GET,N43,NODE,0,NUM,MAX
NSEL,S,LOC,X,HL/(N*V) $ NSEL,R,LOC,Z,THKNSS $ NSEL,R,LOC,Y,405 $
*GET,N44,NODE,0,NUM,MAX
NSEL,S,LOC,X,HL/(N*V) $ NSEL,R,LOC,Z,THKNSS $ NSEL,R,LOC,Y,450 $
*GET,N45,NODE,0,NUM,MIN
NSEL,S,LOC,X,HL/(N*V) $ NSEL,R,LOC,Z,THKNSS $ NSEL,R,LOC,Y,450 $
*GET,N46,NODE,0,NUM,MAX
NSEL,S,LOC,X,HL/(N*V) $ NSEL,R,LOC,Z,THKNSS $ NSEL,R,LOC,Y,495 $
*GET,N47,NODE,0,NUM,MAX
NSEL,S,LOC,X,HL/(N*V) $ NSEL,R,LOC,Z,THKNSS $ NSEL,R,LOC,Y,540 $
*GET,N48,NODE,0,NUM,MAX
NSEL,S,LOC,X,HL/(N*V) $ NSEL,R,LOC,Z,THKNSS $ NSEL,R,LOC,Y,225 $
*GET,N49,NODE,0,NUM,MAX
NSEL,S,LOC,X,0 $ NSEL,R,LOC,Z,THKNSS $ $ *GET,N50,NODE,0,NUM,MAX
E,N10,N1,N2,N20,N11,N12
E,N10,N2,N3,N20,N12,N13
E,N10,N3,N4,N20,N13,N14
E,N10,N4,N5,N20,N14,N15

93
E,N10,N6,N7,N20,N16,N17
E,N10,N7,N8,N20,N17,N18
E,N10,N8,N9,N20,N18,N19
E,N10,N9,N1,N20,N19,N11
E,N20,N11,N12,N30,N21,N22
E,N20,N12,N13,N30,N22,N23
E,N20,N13,N14,N30,N23,N24
E,N20,N14,N15,N30,N24,N25
E,N20,N16,N17,N30,N26,N27
E,N20,N17,N18,N30,N27,N28
E,N20,N18,N19,N30,N28,N29
E,N20,N19,N11,N30,N29,N21
E,N30,N21,N22,N40,N31,N32
E,N30,N22,N23,N40,N32,N33
E,N30,N23,N24,N40,N33,N34
E,N30,N24,N25,N40,N34,N35
E,N30,N26,N27,N40,N36,N37
E,N30,N27,N28,N40,N37,N38
E,N30,N28,N29,N40,N38,N39
E,N30,N29,N21,N40,N39,N31
E,N40,N31,N32,N50,N41,N42
E,N40,N32,N33,N50,N42,N43
E,N40,N33,N34,N50,N43,N44
E,N40,N34,N35,N50,N44,N45
E,N40,N36,N37,N50,N46,N47
E,N40,N37,N38,N50,N47,N48
E,N40,N38,N39,N50,N48,N49
E,N40,N39,N31,N50,N49,N41

94
NUMMRG,ALL
!*******MESH BASE OF ARCH**************************************************
CSYS,1
VSEL,S,LOC,Y,90-A1*180/PI,90+A1*180/PI
VSEL,INVE
CSYS,12
SELTOL,1E-2
LSEL,S,LOC,Y,-0.8*(X4-X1)/COS(A1),0
SELTOL,1
LSEL,U,LOC,Y,-0.8*(X4-X1)/COS(A1)
LSEL,U,LOC,Y,0
LESIZE,ALL,,,50
CSYS,13
SELTOL,1E-2
LSEL,S,LOC,Y,.8*(X4-X1)/COS(A1),0
SELTOL,1
LSEL,U,LOC,Y,.8*(X4-X1)/COS(A1)
LSEL,U,LOC,Y,0
LESIZE,ALL,,,50
SELTOL,0
CSYS,1
VSEL,S,LOC,Y,90-A1*180/PI,90+A1*180/PI
VSEL,INVE
CSYS,0
MSHAPE,0
VMESH,ALL
!*************MODIFY SECTIONS TO APPROPIATE COORDINATE SYSTEM*************
ALLS
CSYS,1

95
NSEL,S,LOC,Y,90-A1*180/PI,90+A1*180/PI
ESLN,S
EMOD,ALL,ESYS,14 !MODIFY CROWN ELEM TO CYLIND SYS
NSEL,S,LOC,Y,0,90-A1*180/PI
ESLN,S
EMOD,ALL,ESYS,12 !MODIFY BOTTOM RIGHT TO SYSTEM 12
NSEL,S,LOC,Y,90+A1*180/PI,180
ESLN,S
EMOD,ALL,ESYS,13 !MODIFY BOTTOM LEFT TO SYSTEM 13
!*************BEGIN COHESIVE ZONES (CROWN)****************************
ALLS
DELTAN = 0.0553 !NORMAL RELATIVE DISPLACEMENT
DELTAT = 0.0241 !TANGENTIAL RELATIVE DISPLACEMENT
TNMAX = 1.53 !MAXIMUM TENSILE STRENGTH
TB,CZM,5,,,EXPO
TBDATA,1,TNMAX,DELTAN,DELTAT
MAT,5
TYPE,3
SELTOL,1E-1
NSEL,S,LOC,Y,90-A1*180/PI,90+A1*180/PI
NSEL,U,LOC,Y,90-A1*180/PI
NSEL,U,LOC,Y,90+A1*180/PI
ESLN
ESEL,U,MAT,,6
*DO,I,1,N-1,1 !COHESIVE ELEMENTS BELOW CRACK LAMINATION
CZMESH,,,1,X,L2+I*HL/N
EPLOT
ESEL,U,TYPE,,3
*ENDDO
!*******************DEFINE CRACKTIP NODE*******************************

96
CSYS,1
SELTOL,1E-5
NSEL,S,LOC,X,L8
NSEL,R,LOC,Y,(90-(C2*180/(L8*PI)))
NSEL,R,LOC,Z,0
*GET,CRACKNODE,NODE,0,NUM,MAX
SELTOL,1E-1
NSEL,S,LOC,X,L8
NSEL,R,LOC,Y,(90-(C2*180/(L8*PI)))
NSEL,R,LOC,Z,0,THKNSS/4
CM,CRACKTIP,NODE ! DEFINE CRACK TIP NODE COMPONENT
!*******BOTTOM RIGHT COHESIVE ZONE (UNDER ROLLER LOADING)*************
CSYS,12
NSEL,S,LOC,Y,-0.2*(X4-X1)/COS(A1),0 !0.2 DEFINES ARBITRARY DISTANCE
!PAST ROLLERS TO END COHESIVE
!ELEMENTS
SELTOL,1
NSEL,U,LOC,Y,0
NSEL,U,LOC,Y,-0.2*(X4-X1)/COS(A1)
ESLN,S
SELTOL,1E-2
ESEL,U,TYPE,,3
TYPE,3
*DO,I,1,N-4,1 !N-4 PREVENTS COHESIVE ELEMENTS
!FROM EXTENDING TOO CLOSE TO
!LOAD POINTS. HELPS CONVERGENCE
CZMESH,,,12,X,L2+I*HL/N
EPLOT
ESEL,U,TYPE,,3
*ENDDO
!********BOTTOM RIGHT COHESIVE ZONE (PAST ROLLERS)*********************

97
NSEL,S,LOC,Y,-0.80*(X4-X1)/COS(A1),-0.2*(X4-X1)/COS(A1)
NSEL,U,LOC,Y,-0.80*(X4-X1)/COS(A1)
NSEL,U,LOC,Y,-0.2*(X4-X1)/COS(A1)
SELTOL,1E-2
ESLN,S
ESEL,U,TYPE,,3
*DO,I,1,N-1,1
CZMESH,,,12,X,L2+I*HL/N
EPLOT
ESEL,U,TYPE,,3
*ENDDO
!*******BOTTOM LEFT COHESIVE ZONE (UNDER ROLLER LOADING)*************
CSYS,13
TYPE,3
NSEL,S,LOC,Y,0,0.2*(X4-X1)/COS(A1)
SELTOL,1
NSEL,U,LOC,Y,0
NSEL,U,LOC,Y,0.2*(X4-X1)/COS(A1)
ESLN,S
SELTOL,1E-1
ESEL,U,TYPE,,3
*DO,I,1,N-4,1 !COHESIVE ELEMENTS BELOW CRACK LAMINATION
CZMESH,,,13,X,L2+I*HL/N
EPLOT
ESEL,U,TYPE,,3
*ENDDO
ALLS
!********BOTTOM LEFT COHESIVE ZONE (PAST ROLLERS)*********************
CSYS,13

98
MAT,5
TYPE,3
NSEL,S,LOC,Y,0.2*(X4-X1)/COS(A1),0.80*(X4-X1)/COS(A1)
NSEL,U,LOC,Y,0.2*(X4-X1)/COS(A1)
NSEL,U,LOC,Y,0.80*(X4-X1)/COS(A1)
SELTOL,1
ESLN,S
SELTOL,1E-1
ESEL,U,TYPE,,3
*DO,I,1,N-1,1 !COHESIVE ELEMENTS BELOW CRACK LAMINATION
CZMESH,,,13,X,L2+I*HL/N
EPLOT
ESEL,U,TYPE,,3
*ENDDO
ALLS
!**************SOLUTION**************************************************
/SOLU
CSYS,1
ALLS
CSYS,0
NSEL,S,LOC,X,0
ALLS
NSEL,S,LOC,Y,L6
NSEL,R,LOC,X,-X3,X3
D,ALL,UY !RESTRICT Y TRANSLATION
D,ALL,UZ !RESTRICT Z TRANSLATION
ALLS
NSEL,S,LOC,X,-X4
NSEL,R,LOC,Y,L6
D,ALL,UX !CREATES PINNED SUPPORT

99
ALLS
NSEL,S,LOC,Z,0
DSYM,SYMM,Z !RESTRICTS OUT OF PLANE TRANSLATION
ALLS
!**************************FRACTURE DATA*************************************
ALLS
!CINT,NEW,9 ! DEFINE CRACK ID
!CINT,CTNC,CRACKTIP ! DEFINE CRACK TIP NODE COMPONENT
!CINT,SYMM,OFF ! SYMMETRY OFF
!CINT,NCON,6 ! NUMBER OF COUNTOURS
!CINT,NORM,1,1 ! DEFINE CRACK PLANE NORMAL
!CINT,LIST
ALLS
!*************************LOADING********************************************
CSYS,1
NSEL,S,LOC,X,L1
NSEL,R,LOC,Y,90-A1*180/PI
D,ALL,UY,-DISP !APPLY UNIFORM DISPLACEMENT AT CROWN
NSEL,S,LOC,X,L1
NSEL,R,LOC,Y,90+A1*180/PI
D,ALL,UY,-DISP !APPLY UNIFORM DISPLACEMENT AT CROWN
ALLS
CSYS,0
NSEL,S,LOC,X,0
ALLS
NSEL,S,LOC,Y,L6
NSEL,R,LOC,X,-X3,X3
D,ALL,UY !RESTRICT Y TRANSLATION
D,ALL,UZ !RESTRICT Z TRANSLATION
ALLS

100
NSEL,S,LOC,X,-X4
NSEL,R,LOC,Y,L6
D,ALL,UX !CREATES PINNED SUPPORT
ALLS
NSEL,S,LOC,Z,0
D,ALL,UZ !RESTRICTS OUT OF PLANE TRANSLATION
ALLS
ESEL,ALL
!***************************SOLVER*****************************************
NLGEOM,ON
AUTOTS,ON
TIME,88.375
NEQIT,200
NSUBST,40,40,40
OUTRES,ALL,ALL
EPLOT
CSYS,1
SELTOL,1E-5
ALLS
SOLVE
/POST1
PRCINT,1! !PRINT THE J INTEGRAL VALUES
!FOR ALL PATHS
*GET,J,CINT,9,,CRACKNODE,,6 !GET THE J INTEGRAL VALUE FOR CRACK
!TIP NODE CRACKNODE, COUNTOUR NUMBER 6
*STATUS,J
CON1=EX/(1-(NUXY*NUXY))
K =(CON1*ABS(J))**0.5
*STATUS,K
RSYS,11
PLNSTRESS,S,X
!****************POST26******************************************
/POST26
SELTOL,1E-4

101
CSYS,1
NSEL,S,LOC,X,L8
NSEL,R,LOC,Z,D/2
NSEL,R,LOC,Y,0,90-A2*180/PI
ESLN,S
ESEL,R,MAT,,6
*GET,RODSTRESS,NODE,0,NUM,MIN !PREVIOUS 4 SELECT NODE WHERE
!CRACK REACHES ROD
ANSOL,2,RODSTRESS,S,X,RODSTRESS
NSEL,S,LOC,Y,90-A1*180/PI
NSEL,R,LOC,X,L1
NSEL,R,LOC,Z,0
*GET,NREACTION,NODE,0,NUM,MAX
CSYS,0
RFORCE,3,NREACTION,F,Y,FY
PROD,4,3,,,TOTALLOAD,,,-18,
/TITLE,REACTION AT TOP NODE VERSES MAX ROD STRESS
/AXLAB,X,APPLIED LOAD(N)
/AXLAB,Y,MAXIMUM ROD STRESS (MPA)
/YRANGE,0,500
/XRANGE,0,3000
XVAR,4
PLVAR,2
CSYS,20
NSEL,S,LOC,X,0
NSEL,R,LOC,Y,0
NSEL,R,LOC,Z,0
ESLN
ESEL,U,MAT,,4
*GET,NCRACKTIP,NODE,0,NUM,MIN
*GET,ECRACKTIP,ELEMENT,0,NUM,MIN
ESOL,5,ECRACKTIP,NCRACKTIP,SD,X,CRACKOPENING
/TITLE,CRACK TIP OPENING
/AXLAB,X,APPLIED LOAD(N)

102
/AXLAB,Y,CRACKTIP SEPERATION (MM)
/YRANGE,0,1
/XRANGE,0,3000
XVAR,4
PLVAR,5
CSYS,1
NSEL,S,LOC,Y,90-A1*180/PI
NSEL,R,LOC,X,L1
NSEL,R,LOC,Z,0
*GET,DISPLACEMENT,NODE,0,NUM,MAX
NSOL,6,DISPLACEMENT,U,Y,UY,
PROD,7,6,,,DISP,,,-1,
SELTOL,1E-4
SELTOL,0.25
NSEL,S,LOC,X,L1
NSEL,R,LOC,Y,90
NSEL,R,LOC,Z,0
ESLN,S
*GET,TOPSTRESS,NODE,0,NUM,MAX
ANSOL,8,TOPSTRESS,EPEL,Y,TOPSTRESS
/OUT,TWORODS
PRVAR,2,4,5,7,8
/OUT,
!***********CRACK TIP LOCATION BASED ON KNOWN GAGE LOACTIONS*************
SELTOL,1E-1
NSEL,S,LOC,X,L8
NSEL,R,LOC,Y,90-7
NSEL,R,LOC,Z,THKNSS
ESLN,S
*GET,STARTGAGE,NODE,0,NUM,MAX !TRIGGER GAGE
ANSOL,2,STARTGAGE,S,X,STARTGAGE
NSEL,S,LOC,X,L8

103
NSEL,R,LOC,Y,90-7.5
NSEL,R,LOC,Z,THKNSS
ESLN,S
*GET,STARTPROPGAGE,NODE,0,NUM,MAX !START PROP GAGE
ANSOL,3,STARTPROPGAGE,S,X,STARTPROPGAGE
SELTOL,1E-1
NSEL,S,LOC,X,L8
NSEL,R,LOC,Y,90-8.7,90-8.75
NSEL,R,LOC,Z,THKNSS
ESLN,S
*GET,QTRPROPGAGE,NODE,0,NUM,MAX !FIRST QTR OF PROP GAGE
ANSOL,4,QTRPROPGAGE,S,X,QTRPROPGAGE
NSEL,S,LOC,X,L8
NSEL,R,LOC,Y,90-10
NSEL,R,LOC,Z,THKNSS
ESLN,S
*GET,MIDPROPGAGE,NODE,0,NUM,MAX !MID PROP GAGE
ANSOL,5,MIDPROPGAGE,S,X,MIDPROPGAGE
NSEL,S,LOC,X,L8
NSEL,R,LOC,Y,90-10.625
NSEL,R,LOC,Z,THKNSS
ESLN,S
*GET,ENDQTRPROPGAGE,NODE,0,NUM,MAX !END QTR PROP GAGE
ANSOL,6,ENDQTRPROPGAGE,S,X,ENDQTRPROPGAGE
NSEL,S,LOC,X,L8
NSEL,R,LOC,Y,90-11.25
NSEL,R,LOC,Z,THKNSS
ESLN,S
*GET,ENDPROPGAGE,NODE,0,NUM,MAX !END PROP GAGE
ANSOL,7,ENDPROPGAGE,S,X,ENDPROPGAGE
NSEL,S,LOC,X,L8
NSEL,R,LOC,Y,90-13
NSEL,R,LOC,Z,THKNSS
ESLN,S

104
*GET,ENDGAGE,NODE,0,NUM,MAX !END TRIGGER
ANSOL,8,ENDGAGE,S,X,ENDGAGE
/OUT,TWORODCRACKPOSIT
PRVAR,2,3,4,5,6,7
/OUT,TWORODCRACKPOSIT2
PRVAR,8
/OUT

105
APPENDIX C: SINGLY REINFORCED ARCH ANSYS INPUT CODE
The following appendix contains the input code to generate the singly reinforced arch using ANSYS 11.0
software.
FINI
/CLEAR
/PREP7
/TITLE, THREE DIMENSIONAL REINFORCED ARCH USING DELAMINATION
*ASK,N,NUMBER OF LAMINATIONS,18
*ASK,P,WHAT LAMINATION IS CRACK AT[NUMBER] (DEFAULTS TO MIDDLE LAM),9
*ASK,L,LENGTH OF HALF ARCH [MM],390
*ASK,HL,HEIGHT AT CENTER OF BEAM [MM],54
*ASK,R,RADIUS [MM],300
*ASK,A1,BOTTOM OF BEAM TO HORIZONTAL [DEGREES],18
*ASK,B,LENGTH OF CONTACT SURFACE [MM],15
*ASK,D,ROD DIAMETER [MM],3.175
*ASK,A2,ROD ANGLE OF ORIENTATION TO VERTICAL [DEGREES],10
*ASK,C1,INITIAL CRACK LENGTH LEFT [MM],27
*ASK,C2,INITIAL CRACK LENGTH RIGHT [MM],27
*ASK,C3,INITIAL CRACK THICKNESS [MM],0.25
*ASK,DISP,DISPLACEMENT APPLIED [MM],6
*ASK,THKNSS, HALF THICKNESS OF ARCH,12.5
*ASK,V,ENTER NUMBER OF LAYER DIVISIONS,1
!***************************WOOD MATERIAL PROPERTIES************************
EX=390
EY=32000
EZ=700
GXY=950
GYZ=900
GXZ=100
NUXY=0.32
NUYZ=0.02
NUXZ=0.39

106
MP,EX,4,EX !MATERIAL 4 WOOD
MP,EY,4,EY
MP,EZ,4,EZ
MP,GXY,4,GXY
MP,GYZ,4,GYZ
MP,GXZ,4,GXZ
MP,NUXY,4,NUXY
MP,NUYZ,4,NUYZ
MP,NUXZ,4,NUXZ
MP,DENS,4,470E-12
!****************************GF ROD PROPERTIES PROPERTIES*********************
MP,EX,6,46000 !LONGITUDINAL (TESTED)
MP,EZ,6,7000
MP,EY,6,7000
MP,GXY,6,5000
MP,GXZ,6,5000
MP,GYZ,6,5000
MP,NUXY,6,0.20
MP,NUXZ,6,0.20
MP,NUYZ,6,0.20
!*****************************ELEMENTS************************************
ET,1,185 !SOLID ELEMENTS
ET,3,205 !INTERFACE ELEMENTS
!******************************DEFINED CONSTANTS*********************************
PI=3.14159265358979
A1=A1/180*PI !BOTTOM OF BEAM TO HORIZONTAL
A2=A2/180*PI !ROD ANGLE OF ORIENTATION
X1=(R+HL)*SIN(A1) !DISTANCE TO END OF CROWN CURVATURE AND LOAD APP
(TOP)
X2=X1-HL*SIN(A1) !DISTANCE TO END OF CROWN CURVATURE (BOTTOM)

107
X3=L-B !DISTANCE TO FRONT OF ARCH CONTACT SURFACE
X4=L !ARCH SPAN DISTANCE
L1=R+HL !HEIGHT TO APEX OF CROWN
L2=R !HEIGHT TO BOTTOM OF CROWN
L3=(R+HL)*COS(A1) !HEIGHT TO END OF CROWN CURVATURE (BOTTOM)
L4=L3-HL*COS(A1) !HEIGHT TO END OF CROWN CURVATURE AND LOAD APP
(TOP)
L5=(X4-X1)*TAN(A1) !HEIGHT FROM BASE TO END OF CROWN CURVATURE
(BOTTOM)
L6=L4-L5 !HEIGHT FROM ORIGIN TO BOTTOM OR ARCH
L7=L6+HL !HEIGHT TO TOP OF BACK OF ARCH
L8=L2+P*HL/N !HEIGHT TO START OF CRACK CENTER
L9=L8*COS(A1) !HEIGHT TO END OF CRACK
X5=L8*SIN(A1) !DISTANCE TO END OF CRACK
!************ START MAKING KEYPOINTS. NUMBERING BASED ON 'N' LAMINATIONS
*********
/PNUM,KP,1
K,,0,L1 !1
K,N+1,0,L2 !N+1
KFILL,1,N+1,N-1,2,1 !PREVIOUS THREE COMMANDS DO CENTER ARCH
KEYPOINTS
CSYS,1
K,N+2,L1,(90-(C2*180/(L8*PI))) !N+2
K,2*N+2,L2,(90-(C2*180/(L8*PI))) !2N+2
KFILL,N+2,2*N+2,N-1,N+3,1 !PREVIOUS THREE COMMANDS DO KEYPOINTS AT
RIGHT
!CRACK TIP
CSYS,0
K,,X1,L3 !2N+3
K,3*N+3,X2,L4 !3N+3

108
KFILL,2*N+3,3*N+3,N-1,2*N+4,1 !PREVIOUS THREE COMMANDS DO END OF CROWN
KEYPOINTS
CSYS,1
K,3*N+4,L1,(90+(C1*180/(L8*PI))) !3N+4
K,3*N+4+N,L2,(90+(C1*180/(L8*PI))) !4N+4
KFILL,3*N+4,4*N+4,N-1,3*N+5,1 !PREVIOUS THREE COMMANDS DO KEYPOINTS
AT LEFT
!CRACK TIP
CSYS,0
K,,-X1,L3 !4N+5
K,5*N+5,-X2,L4 !5N+5
KFILL,4*N+5,5*N+5,N-1,4*N+6,1 !PREVIOUS THREE COMMANDS DO LEFT END OF
CROWN KPS
CSYS,1
*IF,P,GE,N,THEN !DETERMINES POSITION OF CRACK KP. QUALITY
CHECK TO
!ASSURE CRACK DOES NOT APPEAR OUTSIDE
LAMINATIONS
P=N-1
*ELSE
P=P
*ENDIF
CSYS,0
!***************************LOCAL COORDINATE
SYSTEMS********************************
LOCAL,11,1,0,((D/2)/SIN(A2)) !FOR MAKING TOP OF RODS (UNUSED)
LOCAL,12,0,,,,-A1*180/PI+90 !BOTTOM ARCH ELEM ORIENTATION (RIGHT)
LOCAL,13,0,,,,+A1*180/PI+90 !BOTTOM ARCH ELEM ORIENTATION (LEFT)
LOCAL,14,1

109
LOCAL,15,0,,,,90-A2*PI/180 !ROD ELEM ORIENTATION RIGHT
LOCAL,16,0,,,,90+A2*PI/180 !ROD ELEM ORIENTATION LEFT
LOCAL,19,1,L8*SIN(C2/L8),L8*COS(C2/L8),,90-(C2*180)/(L8*PI) !CYLINDRICAL SYSTEM AT
!RIGHT CRACK TIP
LOCAL,20,0,L8*SIN(C2/L8),L8*COS(C2/L8),,90-(C2*180)/(L8*PI) !CARTESIAN SYSTEM AT
!RIGHT CRACK TIP
!*****************************START MAKING
LINES**************************************
CSYS,1
/PNUM,LINE,1
*DO,I,1,N+1,1
L,I,N+1+I
*ENDDO !N+1 !CROWN CENTER TO RIGHT
CRACK TIP
*DO,I,1,N+1,1
L,N+1+I,2*(N+1)+I
*ENDDO !2(N+1) !RIGHT CRACK TIP TO RIGHT END
OF CROWN
*DO,I,1,N+1,1
L,I,3*(N+1)+I
*ENDDO !3(N+1) !CROWN CENTER TO LEFT CRACK
TIP
*DO,I,1,N,1
L,I,I+1
*ENDDO !4N+3 !CENTER ARCH VERTICAL LINES
*DO,I,1,N,1
L,N+1+I,N+2+I
*ENDDO !5N+3 !VERTICAL LINES AT RIGHT
CRACK TIP

110
*DO,I,1,N,1
L,2*N+2+I,2*N+3+I
*ENDDO !6N+3 !RIGHT END OF CROWN VERTIAL
LINES
*DO,I,1,N,1
L,3*N+3+I,3*N+4+I
*ENDDO !7N+3 !VERTICAL LINES AT LEFT CRACK
TIP
*DO,I,1,N+1,1
L,3*N+3+I,4*N+4+I
*ENDDO !8N+4 !CROWN LONGITUDINAL LINES
LEFT
*DO,I,1,N,1
L,4*N+4+I,4*N+5+I
*ENDDO !9N+4 !LEFT END OF CROWN VERTICAL
LINES
!***************************DEFINE CRACK POINTS AT ARCH
CENTER***********************
K,,L2+(HL/N)*P+C3/2,90 !5N+6 (CRACK POINTS)
K,,L2+(HL/N)*P-C3/2,90 !5N+7 (CRACK POINTS)
!*******************************MAKE ARCH CROWN
AREA*********************************
CSYS,1
SELTOL,1E-3
LSEL,S,LOC,X,L1
LSEL,A,LOC,X,0,L2
LSEL,A,LOC,Y,0,90-180*A1/PI

111
LSEL,A,LOC,Y,90+180*A1/PI,180
AL,ALL
ALLS
SELTOL,0
!*******************************MAKE CRACK KPS AND
LINES******************************
CSYS,1
!WE DO NOT KNOW THE # OF KPS THAT DEFINE CRACK TIPS. WE MUST REDEFINE THEM
!BASED ON KNOWN COORDINATES
KSEL,S,,,5*N+6
KSEL,A,,,5*N+7
K,5*N+8,((L2+(HL/N)*P+C3/2)+(L2+(HL/N)*P-C3/2))/2,(90+(C1*180/(L8*PI))) !5N+8
K,5*N+9,((L2+(HL/N)*P+C3/2)+(L2+(HL/N)*P-C3/2))/2,(90-(C2*180/(L8*PI))) !5N+9
L,5*N+6,5*N+8 !9N+5
L,5*N+8,5*N+7 !9N+6
L,5*N+7,5*N+9 !9N+7
L,5*N+9,5*N+6 !9N+8 !PREVIOUS FOUR COMMANDS
MAKE CRACK
!******************************MAKE CRACK
AREAS**************************************
LSLK,S !LINES ASSOCIATED WITH CRACK
KEYPOINTS
AL,ALL
ALLS
!******************************ARCH
VOLUME*******************************************
K,5*N+11,L1,90-A1*180/PI,THKNSS !5N+11
L,2*N+3,5*N+11 !9N+9 !FROMS KP AND LINE AT THICKNESS TO
!EXTRUDE ARCH VOLUME
LSEL,U,,,ALL

112
!******************************CRACK TIP MESH
AREAS**********************************
CSYS,19
BTOL,1E-9
*DO,I,1,V,1
CIRCLE,5*N+9,I*HL/(V*N)
LGEN,1,ALL,,,,90-(C2*180)/(L8*PI),,,,1
LSEL,R,LOC,Y,0,180
LCOMB,ALL
LSEL,S,LOC,Y,180,360
LSEL,R,LOC,X,I*HL/(V*N)
LSEL,U,LOC,Y,0
LSEL,U,LOC,Y,180
LCOMB,ALL
LSEL,S,LOC,X,I*HL/(V*N)
LSEL,U,LOC,Y,0
LSEL,U,LOC,Y,180
AL,ALL
LSEL,U,,,ALL
ASEL,U,,,ALL
*ENDDO !DO LOOP FOR AREARS FOR CRACKTIP
MESHING
CSYS,1
LSEL,ALL
lsel,u,,,9*n+9
ASEL,ALL
ASBA,ALL,2
AOVLAP,ALL !FORMS CRACK AND CRACK TIP MESH AREA
!******************GENERATE ALL LAMINATION
AREAS**************************************
ASBL,ALL,ALL
ALLS

113
!******************GENERATE ALL LAMINATION
VOLUMES************************************
VDRAG,ALL,,,,,,9*N+9 !GENERATES ALL LAMINATIONS
!******************GENERATE CENTRAL REINFORCING
ROD*************************************
BTOL,1E-1
CSYS,0
WPROTA,,-90 !CHANGES THE Y AXIS TO THE Z AXIS FOR FORMING
RODS
CYLIND,THKNSS,D/4,200,450,-180,0 !WILL HELP IN MESH REFINEMENT
WPROTA,,90 !RESTORES AXES TO GLOBALS
CSYS,1
VOVLAP,ALL
NUMMRG,ALL
ALLS
LSEL,S,LOC,X,L2,L1
LSEL,INVE
ASLL,S
VSLA,S
VDELE,ALL
!REMOVES CANTILEVER COMPONENTS OF LARGE CYLINDER
ALLS
VSEL,S,LOC,X,L8-C3,L8+C3
VSEL,R,LOC,Y,90
VDELE,ALL
ALLS
WPROTA,,-90
CYLIND,0,D/2,200,450,-180,0 !MAKES CENTRAL ROD
WPROTA,,90
VOVLAP,ALL
NUMMRG,ALL
LSEL,S,LOC,X,L2,L1

114
LSEL,INVE
ASLL,S
VSLA,S
VDELE,ALL !REMOVES CANTILEVER ROD COMPONENTS
ALLS
CSYS,1
ASEL,S,LOC,X,L1,1000
ASEL,A,LOC,X,0,L2
ASEL,U,LOC,X,L1
ASEL,U,LOC,X,L2
LSLA,ALL
LSEL,U,LOC,X,L2
LSEL,U,LOC,X,L1
KSLL,S
KSEL,U,LOC,X,L1
KSEL,U,LOC,X,L2
ADELE,ALL
LDELE,ALL
KDELE,ALL !PREVIOUS THIRTEEN COMMANDS DELETE
UNNECESSARY
!ASPECTS
ALLS
!*************************DIVIDE ROD TO ALLOW FOR HEX.
MESHING*********************
CSYS,1
K,10000,L2,90
K,10001,L1,90
K,10002,L2,90,THKNSS
K,10003,L1,90,THKNSS
LSEL,U,,,ALL
L,10000,10001
L,10001,10003

115
L,10002,10003
L,10002,10000
AL,ALL
ALLS
ASLL,S
VSLA,S
VSBA,ALL,ALL !PREVIOUS 15 COMMANDS ARE NECESSARY TO
DIVIDE RODS FOR
ALLS
CSYS,0
!*********************COMPLETE RIGHT ARCH
GEOMETRY*****************************************
K,100000,X4,L7
K,100000+N+1,X4,L6
K,100000+N,X3,L6
KFILL,100000,100000+N,N-1,100001,1
ASEL,U,,,ALL
LSEL,U,,,ALL
L,2*N+3,100000
L,100000,100000+N
L,100000+N,3*N+3
L,2*N+3,3*N+3
AL,ALL
LSEL,U,,,ALL !PREVIOUS 12 COMMANDS FORM RIGHT BASE KPS,LINES,AND
AREAS
*DO,I,1,N-1,1
L,2*N+3+I,100000+I
*ENDDO !BASE LAMINATION LINES
ASBL,ALL,ALL !BASE LAMINATIOPN AREAS
VDRAG,ALL,,,,,,9*N+9 !BASE LAMINATION VOLUMES
VSEL,U,,,ALL
ASEL,U,,,ALL

116
LSEL,U,,,ALL
KSEL,S,,,100000
KSEL,A,,,100000+N
KSEL,A,,,100000+N+1
A,100000,100000+N,100000+N+1
VDRAG,ALL,,,,,,9*N+9 !FORMS TRIANGLE AT BASE OF ARCH
!****************COMPLETE LEFT ARCH
GEOMETRY************************************
CSYS,1
VSEL,S,LOC,Y,0,90-A1*180/PI
BTOL,1E-5
CSYS,0
VSYMM,X,ALL !MIRRORS BOTTOM OF ARCH COMPLETING
GEOMETRY
ALLS
CSYS,1
VSEL,S,LOC,Y,90-A1*180/PI,90+A1*180/PI
ALLS
NUMMRG,ALL
!**********************BEGIN ROD MESHING****************************************
LSEL,S,LOC,Z,D/4 !SELECT VERTICAL ROD LINES
LSEL,U,LOC,X,L8+HL/N,L8-HL/N !REMOVE COMPONENTS IN PATH OF ROD
LESIZE,ALL,,,V !<===LINE MESH POINT (ARBITRARAY)
ALLS
!BEGIN ROD MESHING
LSEL,S,LOC,Z,D/4 !SELECT VERTICAL ROD LINES IN CRACK PATH
LSEL,R,LOC,X,L8-HL/N,L8+HL/N
LESIZE,ALL,,,2 !<===LINE MESH POINT MUST EQUAL (***)
ALLS
LSEL,S,LOC,Z,0,D/2

117
LSEL,U,LOC,Z,0
LSEL,U,LOC,Z,D/2
LSEL,U,LOC,Z,D/4 !LEAVES CURVED ASPECTS OF RODS
LESIZE,ALL,,,4 !<===LINE MESH POINT (MUST BE EVEN > THAN 2)
!MUST = (**)
VSEL,S,LOC,Z,0,D/2
MAT,6
TYPE,1
VMESH,ALL
!*********************MESH WOOD CONTACTING
RODS**********************************
ASEL,S,LOC,Z,THKNSS
VSLA,A
VSEL,INVE
MAT,4
TYPE,1
VMESH,ALL !MESH WOOD CONTACTING RODS
!********************SIZE LINES PAST CRACK TIPS**********************************
*DO,I,0,N,1 !SELECT LAMINATION LINES PAST CRACK TIP
VSEL,S,LOC,Z,0,D/2
ASLV,S
VSLA,S
ASLV,S
LSLA,S
LSEL,INVE
LSEL,U,LOC,Y,0,90-A1*180/PI
LSEL,U,LOC,Y,90+A1*180/PI,180
LSEL,U,LOC,Y,90
LSEL,U,LOC,Y,(90-(C2*180/(L8*PI))),90
LSEL,U,LOC,Y,90,(90+(C1*180/(L8*PI)))
SELTOL,1E-4

118
LSEL,R,LOC,X,L2+I*HL/N
CSYS,19
LSEL,U,LOC,X,0,HL/N
CSYS,1
LESIZE,ALL,,,65 !<==== LINE MESH POINT (ARBITRARY)
ALLS
*ENDDO
!********************SIZE LINES ABOVE AND BELOW CRACK
***************************
*DO,I,0,N,1 !SELECT LAMINATION ABOVE AND BEFORE CRACK
VSEL,S,LOC,Z,0,D/2
ASLV,S
VSLA,S
ASLV,S
LSLA,S
LSEL,INVE
LSEL,U,LOC,Y,0,90-A1*180/PI
LSEL,U,LOC,Y,90+A1*180/PI,180
LSEL,U,LOC,Y,90
LSEL,U,LOC,Y,90-A1*180/PI,(90-(C2*180/(L8*PI)))
LSEL,U,LOC,Y,(90+(C1*180/(L8*PI))),(90+A1*180/PI)
SELTOL,1E-4
LSEL,R,LOC,X,L2+I*HL/N
CSYS,19
LSEL,U,LOC,X,0,HL/N
LPLOT
CSYS,1
LESIZE,ALL,,,8 !<==== LINE MESH POINT (ARBITRARY)
ALLS
*ENDDO
!*********************RIGHT CRACKTIP MESHING**********************************

119
CSYS,19
VSEL,S,LOC,X,0,HL/N
ASLV,S
LSLA,S
*DO,I,1,V,1
LSEL,S,LOC,X,0,I*HL/(V*N)
LSEL,R,LOC,Z,0
LESIZE,ALL,,,2 !(***)LINE MESH POINT. BECAUSE OF MESHING
!AROUND CRACK TIP, THIS VALUE
!MUST BE EVEN > OR = 2
LPLOT
*ENDDO
LSLA,S
*DO,I,0,3,1
LSEL,S,LOC,X,HL/(N),HL/N
LSEL,R,LOC,Z,0
LSEL,R,LOC,Y,I*90
LESIZE,ALL,,,1
LSEL,S,LOC,X,HL/(N),HL/N
LSEL,R,LOC,Z,THKNSS
LSEL,R,LOC,Y,I*90
LESIZE,ALL,,,1
*ENDDO
LSLA,S
LSEL,U,LOC,Z,0
LSEL,U,LOC,Z,THKNSS
LESIZE,ALL,,,4
ALLS
CSYS,1
VSEL,U,LOC,Y,0,90-A1*180/PI
VSEL,U,LOC,Y,90+A1*180/PI,180

120
VMESH,ALL !MESH CROWN OF ARCH
CSYS,19
VSEL,S,LOC,X,0,HL/N
VCLEAR,ALL
ASLV,S
LSLA,S
*DO,I,1,V,1
LSEL,S,LOC,X,0,I*HL/(V*N)
LSEL,R,LOC,Z,0
LESIZE,ALL,,,2 !LINE MESH POINT ***
LPLOT
*ENDDO
LSLA,S
*DO,I,0,3,1
LSEL,S,LOC,X,HL/(N),HL/N
LSEL,R,LOC,Z,0
LSEL,R,LOC,Y,I*90
LESIZE,ALL,,,1
LSEL,S,LOC,X,HL/(N),HL/N
LSEL,R,LOC,Z,THKNSS
LSEL,R,LOC,Y,I*90
LESIZE,ALL,,,1
*ENDDO
LSLA,S
LSEL,U,LOC,Z,0
LSEL,U,LOC,Z,THKNSS
LESIZE,ALL,,,4
VMESH,ALL
VSEL,S,LOC,X,0,HL/N
VCLEAR,ALL

121
!*******TETRAHEDRAL ELEMENTS AT CRACK TIP (MORE
PRECISION)*******************************
CSYS,19
SELTOL,.1
N,,,0
N,,,,THKNSS/4
N,,,,THKNSS/2
N,,,,3*THKNSS/4
N,,,,THKNSS
SELTOL,1
NSEL,S,LOC,X,HL/(N*V) $ NSEL,R,LOC,Z,0 $ NSEL,R,LOC,Y,270 $ *GET,N1,NODE,0,NUM,MAX
NSEL,S,LOC,X,HL/(N*V) $ NSEL,R,LOC,Z,0 $ NSEL,R,LOC,Y,315 $ *GET,N2,NODE,0,NUM,MAX
NSEL,S,LOC,X,HL/(N*V) $ NSEL,R,LOC,Z,0 $ NSEL,R,LOC,Y,360 $
*GET,N3,NODE,0,NUM,MAX
NSEL,S,LOC,X,HL/(N*V) $ NSEL,R,LOC,Z,0 $ NSEL,R,LOC,Y,405 $
*GET,N4,NODE,0,NUM,MAX
NSEL,S,LOC,X,HL/(N*V) $ NSEL,R,LOC,Z,0 $ NSEL,R,LOC,Y,450 $ *GET,N5,NODE,0,NUM,MIN
NSEL,S,LOC,X,HL/(N*V) $ NSEL,R,LOC,Z,0 $ NSEL,R,LOC,Y,450 $
*GET,N6,NODE,0,NUM,MAX
NSEL,S,LOC,X,HL/(N*V) $ NSEL,R,LOC,Z,0 $ NSEL,R,LOC,Y,495 $ *GET,N7,NODE,0,NUM,MAX
NSEL,S,LOC,X,HL/(N*V) $ NSEL,R,LOC,Z,0 $ NSEL,R,LOC,Y,540 $ *GET,N8,NODE,0,NUM,MAX
NSEL,S,LOC,X,HL/(N*V) $ NSEL,R,LOC,Z,0 $ NSEL,R,LOC,Y,225 $ *GET,N9,NODE,0,NUM,MAX
NSEL,S,LOC,X,0 $ NSEL,R,LOC,Z,0 $ $ *GET,N10,NODE,0,NUM,MAX
NSEL,S,LOC,X,HL/(N*V) $ NSEL,R,LOC,Z,THKNSS/4 $ NSEL,R,LOC,Y,270 $
*GET,N11,NODE,0,NUM,MAX
NSEL,S,LOC,X,HL/(N*V) $ NSEL,R,LOC,Z,THKNSS/4 $ NSEL,R,LOC,Y,315 $
*GET,N12,NODE,0,NUM,MAX
NSEL,S,LOC,X,HL/(N*V) $ NSEL,R,LOC,Z,THKNSS/4 $ NSEL,R,LOC,Y,360 $
*GET,N13,NODE,0,NUM,MAX
NSEL,S,LOC,X,HL/(N*V) $ NSEL,R,LOC,Z,THKNSS/4 $ NSEL,R,LOC,Y,405 $
*GET,N14,NODE,0,NUM,MAX

122
NSEL,S,LOC,X,HL/(N*V) $ NSEL,R,LOC,Z,THKNSS/4 $ NSEL,R,LOC,Y,450 $
*GET,N15,NODE,0,NUM,MIN
NSEL,S,LOC,X,HL/(N*V) $ NSEL,R,LOC,Z,THKNSS/4 $ NSEL,R,LOC,Y,450 $
*GET,N16,NODE,0,NUM,MAX
NSEL,S,LOC,X,HL/(N*V) $ NSEL,R,LOC,Z,THKNSS/4 $ NSEL,R,LOC,Y,495 $
*GET,N17,NODE,0,NUM,MAX
NSEL,S,LOC,X,HL/(N*V) $ NSEL,R,LOC,Z,THKNSS/4 $ NSEL,R,LOC,Y,540 $
*GET,N18,NODE,0,NUM,MAX
NSEL,S,LOC,X,HL/(N*V) $ NSEL,R,LOC,Z,THKNSS/4 $ NSEL,R,LOC,Y,225 $
*GET,N19,NODE,0,NUM,MAX
NSEL,S,LOC,X,0 $ NSEL,R,LOC,Z,THKNSS/4 $ $
*GET,N20,NODE,0,NUM,MAX
NSEL,S,LOC,X,HL/(N*V) $ NSEL,R,LOC,Z,THKNSS/2 $ NSEL,R,LOC,Y,270 $
*GET,N21,NODE,0,NUM,MAX
NSEL,S,LOC,X,HL/(N*V) $ NSEL,R,LOC,Z,THKNSS/2 $ NSEL,R,LOC,Y,315 $
*GET,N22,NODE,0,NUM,MAX
NSEL,S,LOC,X,HL/(N*V) $ NSEL,R,LOC,Z,THKNSS/2 $ NSEL,R,LOC,Y,360 $
*GET,N23,NODE,0,NUM,MAX
NSEL,S,LOC,X,HL/(N*V) $ NSEL,R,LOC,Z,THKNSS/2 $ NSEL,R,LOC,Y,405 $
*GET,N24,NODE,0,NUM,MAX
NSEL,S,LOC,X,HL/(N*V) $ NSEL,R,LOC,Z,THKNSS/2 $ NSEL,R,LOC,Y,450 $
*GET,N25,NODE,0,NUM,MIN
NSEL,S,LOC,X,HL/(N*V) $ NSEL,R,LOC,Z,THKNSS/2 $ NSEL,R,LOC,Y,450 $
*GET,N26,NODE,0,NUM,MAX
NSEL,S,LOC,X,HL/(N*V) $ NSEL,R,LOC,Z,THKNSS/2 $ NSEL,R,LOC,Y,495 $
*GET,N27,NODE,0,NUM,MAX
NSEL,S,LOC,X,HL/(N*V) $ NSEL,R,LOC,Z,THKNSS/2 $ NSEL,R,LOC,Y,540 $
*GET,N28,NODE,0,NUM,MAX
NSEL,S,LOC,X,HL/(N*V) $ NSEL,R,LOC,Z,THKNSS/2 $ NSEL,R,LOC,Y,225 $
*GET,N29,NODE,0,NUM,MAX
NSEL,S,LOC,X,0 $ NSEL,R,LOC,Z,THKNSS/2 $ $
*GET,N30,NODE,0,NUM,MAX

123
NSEL,S,LOC,X,HL/(N*V) $ NSEL,R,LOC,Z,3*THKNSS/4 $ NSEL,R,LOC,Y,270 $
*GET,N31,NODE,0,NUM,MAX
NSEL,S,LOC,X,HL/(N*V) $ NSEL,R,LOC,Z,3*THKNSS/4 $ NSEL,R,LOC,Y,315 $
*GET,N32,NODE,0,NUM,MAX
NSEL,S,LOC,X,HL/(N*V) $ NSEL,R,LOC,Z,3*THKNSS/4 $ NSEL,R,LOC,Y,360 $
*GET,N33,NODE,0,NUM,MAX
NSEL,S,LOC,X,HL/(N*V) $ NSEL,R,LOC,Z,3*THKNSS/4 $ NSEL,R,LOC,Y,405 $
*GET,N34,NODE,0,NUM,MAX
NSEL,S,LOC,X,HL/(N*V) $ NSEL,R,LOC,Z,3*THKNSS/4 $ NSEL,R,LOC,Y,450 $
*GET,N35,NODE,0,NUM,MIN
NSEL,S,LOC,X,HL/(N*V) $ NSEL,R,LOC,Z,3*THKNSS/4 $ NSEL,R,LOC,Y,450 $
*GET,N36,NODE,0,NUM,MAX
NSEL,S,LOC,X,HL/(N*V) $ NSEL,R,LOC,Z,3*THKNSS/4 $ NSEL,R,LOC,Y,495 $
*GET,N37,NODE,0,NUM,MAX
NSEL,S,LOC,X,HL/(N*V) $ NSEL,R,LOC,Z,3*THKNSS/4 $ NSEL,R,LOC,Y,540 $
*GET,N38,NODE,0,NUM,MAX
NSEL,S,LOC,X,HL/(N*V) $ NSEL,R,LOC,Z,3*THKNSS/4 $ NSEL,R,LOC,Y,225 $
*GET,N39,NODE,0,NUM,MAX
NSEL,S,LOC,X,0 $ NSEL,R,LOC,Z,3*THKNSS/4 $ $
*GET,N40,NODE,0,NUM,MAX
NSEL,S,LOC,X,HL/(N*V) $ NSEL,R,LOC,Z,THKNSS $ NSEL,R,LOC,Y,270 $
*GET,N41,NODE,0,NUM,MAX
NSEL,S,LOC,X,HL/(N*V) $ NSEL,R,LOC,Z,THKNSS $ NSEL,R,LOC,Y,315 $
*GET,N42,NODE,0,NUM,MAX
NSEL,S,LOC,X,HL/(N*V) $ NSEL,R,LOC,Z,THKNSS $ NSEL,R,LOC,Y,360 $
*GET,N43,NODE,0,NUM,MAX
NSEL,S,LOC,X,HL/(N*V) $ NSEL,R,LOC,Z,THKNSS $ NSEL,R,LOC,Y,405 $
*GET,N44,NODE,0,NUM,MAX
NSEL,S,LOC,X,HL/(N*V) $ NSEL,R,LOC,Z,THKNSS $ NSEL,R,LOC,Y,450 $
*GET,N45,NODE,0,NUM,MIN
NSEL,S,LOC,X,HL/(N*V) $ NSEL,R,LOC,Z,THKNSS $ NSEL,R,LOC,Y,450 $
*GET,N46,NODE,0,NUM,MAX

124
NSEL,S,LOC,X,HL/(N*V) $ NSEL,R,LOC,Z,THKNSS $ NSEL,R,LOC,Y,495 $
*GET,N47,NODE,0,NUM,MAX
NSEL,S,LOC,X,HL/(N*V) $ NSEL,R,LOC,Z,THKNSS $ NSEL,R,LOC,Y,540 $
*GET,N48,NODE,0,NUM,MAX
NSEL,S,LOC,X,HL/(N*V) $ NSEL,R,LOC,Z,THKNSS $ NSEL,R,LOC,Y,225 $
*GET,N49,NODE,0,NUM,MAX
NSEL,S,LOC,X,0 $ NSEL,R,LOC,Z,THKNSS $ $ *GET,N50,NODE,0,NUM,MAX
E,N10,N1,N2,N20,N11,N12
E,N10,N2,N3,N20,N12,N13
E,N10,N3,N4,N20,N13,N14
E,N10,N4,N5,N20,N14,N15
E,N10,N6,N7,N20,N16,N17
E,N10,N7,N8,N20,N17,N18
E,N10,N8,N9,N20,N18,N19
E,N10,N9,N1,N20,N19,N11
E,N20,N11,N12,N30,N21,N22
E,N20,N12,N13,N30,N22,N23
E,N20,N13,N14,N30,N23,N24
E,N20,N14,N15,N30,N24,N25
E,N20,N16,N17,N30,N26,N27
E,N20,N17,N18,N30,N27,N28
E,N20,N18,N19,N30,N28,N29
E,N20,N19,N11,N30,N29,N21
E,N30,N21,N22,N40,N31,N32
E,N30,N22,N23,N40,N32,N33
E,N30,N23,N24,N40,N33,N34
E,N30,N24,N25,N40,N34,N35
E,N30,N26,N27,N40,N36,N37

125
E,N30,N27,N28,N40,N37,N38
E,N30,N28,N29,N40,N38,N39
E,N30,N29,N21,N40,N39,N31
E,N40,N31,N32,N50,N41,N42
E,N40,N32,N33,N50,N42,N43
E,N40,N33,N34,N50,N43,N44
E,N40,N34,N35,N50,N44,N45
E,N40,N36,N37,N50,N46,N47
E,N40,N37,N38,N50,N47,N48
E,N40,N38,N39,N50,N48,N49
E,N40,N39,N31,N50,N49,N41
NUMMRG,ALL
!*******MESH BASE OF ARCH**************************************************
CSYS,1
VSEL,S,LOC,Y,90-A1*180/PI,90+A1*180/PI
VSEL,INVE
CSYS,12
SELTOL,1E-2
LSEL,S,LOC,Y,-(X4-X1)/COS(A1),0
SELTOL,1
LSEL,U,LOC,Y,-(X4-X1)/COS(A1)
LSEL,U,LOC,Y,0
LESIZE,ALL,,,150
CSYS,13
SELTOL,1E-2
LSEL,S,LOC,Y,.8*(X4-X1)/COS(A1),0
SELTOL,1
LSEL,U,LOC,Y,.8*(X4-X1)/COS(A1)
LSEL,U,LOC,Y,0
LESIZE,ALL,,,150

126
SELTOL,0
CSYS,1
VSEL,S,LOC,Y,90-A1*180/PI,90+A1*180/PI
VSEL,INVE
CSYS,0
MSHAPE,0
VMESH,ALL
!*************MODIFY SECTIONS TO APPROPIATE COORDINATE SYSTEM*************
ALLS
CSYS,1
NSEL,S,LOC,Y,90-A1*180/PI,90+A1*180/PI
ESLN,S
EMOD,ALL,ESYS,14 !MODIFY CROWN ELEM TO CYLIND SYS
NSEL,S,LOC,Y,0,90-A1*180/PI
ESLN,S
EMOD,ALL,ESYS,12 !MODIFY BOTTOM RIGHT TO SYSTEM 12
NSEL,S,LOC,Y,90+A1*180/PI,180
ESLN,S
EMOD,ALL,ESYS,13 !MODIFY BOTTOM LEFT TO SYSTEM 13
!*************BEGIN COHESIVE ZONES (CROWN)****************************
ALLS
DELTAN = 0.0553 !NORMAL RELATIVE DISPLACEMENT
DELTAT = 0.0241 !TANGENTIAL RELATIVE DISPLACEMENT
TNMAX = 1.53 !MAXIMUM TENSILE STRENGTH
TB,CZM,5,,,EXPO
TBDATA,1,TNMAX,DELTAN,DELTAT
MAT,5
TYPE,3

127
SELTOL,1E-1
NSEL,S,LOC,Y,90-A1*180/PI,90+A1*180/PI
NSEL,U,LOC,Y,90-A1*180/PI
NSEL,U,LOC,Y,90+A1*180/PI
ESLN
ESEL,U,MAT,,6
*DO,I,1,N-1,1 !COHESIVE ELEMENTS BELOW CRACK LAMINATION
CZMESH,,,1,X,L2+I*HL/N
EPLOT
ESEL,U,TYPE,,3
*ENDDO
!*******************DEFINE CRACKTIP NODE*******************************
CSYS,1
SELTOL,1E-5
NSEL,S,LOC,X,L8
NSEL,R,LOC,Y,(90-(C2*180/(L8*PI)))
NSEL,R,LOC,Z,0
*GET,CRACKNODE,NODE,0,NUM,MAX
SELTOL,1E-1
NSEL,S,LOC,X,L8
NSEL,R,LOC,Y,(90-(C2*180/(L8*PI)))
NSEL,R,LOC,Z,0,THKNSS/4
CM,CRACKTIP,NODE ! DEFINE CRACK TIP NODE COMPONENT
!*******BOTTOM RIGHT COHESIVE ZONE (UNDER ROLLER LOADING)*************
CSYS,12
NSEL,S,LOC,Y,-0.2*(X4-X1)/COS(A1),0 !0.2 DEFINES ARBITRARY DISTANCE
!PAST ROLLERS TO END COHESIVE
!ELEMENTS
SELTOL,1
NSEL,U,LOC,Y,0
NSEL,U,LOC,Y,-0.2*(X4-X1)/COS(A1)

128
ESLN,S
SELTOL,1E-2
ESEL,U,TYPE,,3
TYPE,3
*DO,I,1,N-4,1 !N-4 PREVENTS COHESIVE ELEMENTS
!FROM EXTENDING TOO CLOSE TO
!LOAD POINTS. HELPS CONVERGENCE
CZMESH,,,12,X,L2+I*HL/N
EPLOT
ESEL,U,TYPE,,3
*ENDDO
!********BOTTOM RIGHT COHESIVE ZONE (PAST ROLLERS)*********************
NSEL,S,LOC,Y,-0.80*(X4-X1)/COS(A1),-0.2*(X4-X1)/COS(A1)
NSEL,U,LOC,Y,-0.80*(X4-X1)/COS(A1)
NSEL,U,LOC,Y,-0.2*(X4-X1)/COS(A1)
SELTOL,1E-2
ESLN,S
ESEL,U,TYPE,,3
*DO,I,1,N-1,1
CZMESH,,,12,X,L2+I*HL/N
EPLOT
ESEL,U,TYPE,,3
*ENDDO
!*******BOTTOM LEFT COHESIVE ZONE (UNDER ROLLER LOADING)*************
CSYS,13
TYPE,3
NSEL,S,LOC,Y,0,0.2*(X4-X1)/COS(A1)
SELTOL,1
NSEL,U,LOC,Y,0
NSEL,U,LOC,Y,0.2*(X4-X1)/COS(A1)

129
ESLN,S
SELTOL,1E-1
ESEL,U,TYPE,,3
*DO,I,1,N-4,1 !COHESIVE ELEMENTS BELOW CRACK LAMINATION
CZMESH,,,13,X,L2+I*HL/N
EPLOT
ESEL,U,TYPE,,3
*ENDDO
ALLS
!********BOTTOM LEFT COHESIVE ZONE (PAST ROLLERS)*********************
CSYS,13
MAT,5
TYPE,3
NSEL,S,LOC,Y,0.2*(X4-X1)/COS(A1),0.80*(X4-X1)/COS(A1)
NSEL,U,LOC,Y,0.2*(X4-X1)/COS(A1)
NSEL,U,LOC,Y,0.80*(X4-X1)/COS(A1)
SELTOL,1
ESLN,S
SELTOL,1E-1
ESEL,U,TYPE,,3
*DO,I,1,N-1,1 !COHESIVE ELEMENTS BELOW CRACK LAMINATION
CZMESH,,,13,X,L2+I*HL/N
EPLOT
ESEL,U,TYPE,,3
*ENDDO
ALLS
!**************SOLUTION**************************************************
/SOLU
CSYS,1
ALLS

130
CSYS,0
NSEL,S,LOC,X,0
ALLS
NSEL,S,LOC,Y,L6
NSEL,R,LOC,X,-X3,X3
D,ALL,UY !RESTRICT Y TRANSLATION
D,ALL,UZ !RESTRICT Z TRANSLATION
ALLS
NSEL,S,LOC,X,-X4
NSEL,R,LOC,Y,L6
D,ALL,UX !CREATES PINNED SUPPORT
ALLS
NSEL,S,LOC,Z,0
DSYM,SYMM,Z !RESTRICTS OUT OF PLANE TRANSLATION
ALLS
!**************************FRACTURE DATA*************************************
ALLS
!CINT,NEW,9 ! DEFINE CRACK ID
!CINT,CTNC,CRACKTIP ! DEFINE CRACK TIP NODE COMPONENT
!CINT,SYMM,OFF ! SYMMETRY OFF
!CINT,NCON,6 ! NUMBER OF COUNTOURS
!CINT,NORM,1,1 ! DEFINE CRACK PLANE NORMAL
!CINT,LIST
ALLS
!*************************LOADING********************************************
CSYS,1
NSEL,S,LOC,X,L1
NSEL,R,LOC,Y,90-A1*180/PI
D,ALL,UY,-DISP !APPLY UNIFORM DISPLACEMENT AT CROWN
NSEL,S,LOC,X,L1

131
NSEL,R,LOC,Y,90+A1*180/PI
D,ALL,UY,-DISP !APPLY UNIFORM DISPLACEMENT AT CROWN
ALLS
CSYS,0
NSEL,S,LOC,X,0
ALLS
NSEL,S,LOC,Y,L6
NSEL,R,LOC,X,-X3,X3
D,ALL,UY !RESTRICT Y TRANSLATION
D,ALL,UZ !RESTRICT Z TRANSLATION
ALLS
NSEL,S,LOC,X,-X4
NSEL,R,LOC,Y,L6
D,ALL,UX !CREATES PINNED SUPPORT
ALLS
NSEL,S,LOC,Z,0
D,ALL,UZ !RESTRICTS OUT OF PLANE TRANSLATION
ALLS
ESEL,ALL
!***************************SOLVER*****************************************
NLGEOM,ON
AUTOTS,ON
TIME,71.4
NEQIT,200
NSUBST,15,15,15
OUTRES,ALL,ALL
EPLOT
CSYS,1
SELTOL,1E-5
ALLS
SOLVE
/POST1
PRCINT,1! !PRINT THE J INTEGRAL VALUES

132
!FOR ALL PATHS
*GET,J,CINT,9,,CRACKNODE,,6 !GET THE J INTEGRAL VALUE FOR CRACK
!TIP NODE CRACKNODE, COUNTOUR NUMBER 6
*STATUS,J
CON1=EX/(1-(NUXY*NUXY))
K =(CON1*ABS(J))**0.5
*STATUS,K
RSYS,11
PLNSTRESS,S,X
!****************POST26******************************************
/POST26
SELTOL,1E-4
CSYS,1
NSEL,S,LOC,X,L8
NSEL,R,LOC,Z,D/2
NSEL,R,LOC,Y,0,90
ESLN,S
ESEL,R,MAT,,6
*GET,RODSTRESS,NODE,0,NUM,MIN !PREVIOUS 4 SELECT NODE WHERE
!CRACK REACHES ROD
ANSOL,2,RODSTRESS,S,X,RODSTRESS
NSEL,S,LOC,Y,90-A1*180/PI
NSEL,R,LOC,X,L1
NSEL,R,LOC,Z,0
*GET,NREACTION,NODE,0,NUM,MAX
CSYS,0
RFORCE,3,NREACTION,F,Y,FY
PROD,4,3,,,TOTALLOAD,,,-18,
/TITLE,REACTION AT TOP NODE VERSES MAX ROD STRESS
/AXLAB,X,APPLIED LOAD(N)
/AXLAB,Y,MAXIMUM ROD STRESS (MPA)
/YRANGE,0,500
/XRANGE,0,3000
XVAR,4

133
PLVAR,2
CSYS,20
NSEL,S,LOC,X,0
NSEL,R,LOC,Y,0
NSEL,R,LOC,Z,0
ESLN
ESEL,U,MAT,,4
*GET,NCRACKTIP,NODE,0,NUM,MIN
*GET,ECRACKTIP,ELEMENT,0,NUM,MIN
ESOL,5,ECRACKTIP,NCRACKTIP,SD,X,CRACKOPENING
/TITLE,CRACK TIP OPENING
/AXLAB,X,APPLIED LOAD(N)
/AXLAB,Y,CRACKTIP SEPERATION (MM)
/YRANGE,0,1
/XRANGE,0,3000
XVAR,4
PLVAR,5
CSYS,1
NSEL,S,LOC,Y,90-A1*180/PI
NSEL,R,LOC,X,L1
NSEL,R,LOC,Z,0
*GET,DISPLACEMENT,NODE,0,NUM,MAX
NSOL,6,DISPLACEMENT,U,Y,UY,
PROD,7,6,,,DISP,,,-1,
SELTOL,1E-4
SELTOL,0.25
NSEL,S,LOC,X,L1
NSEL,R,LOC,Y,90
NSEL,R,LOC,Z,0
ESLN,S
*GET,TOPSTRESS,NODE,0,NUM,MAX
ANSOL,8,TOPSTRESS,EPEL,Y,TOPSTRESS
/OUT,ONERODS

134
PRVAR,2,4,5,7,8
/OUT,
!***********CRACK TIP LOCATION BASED ON KNOWN GAGE LOACTIONS*************
SELTOL,1E-1
NSEL,S,LOC,X,L8
NSEL,R,LOC,Y,90-6
NSEL,R,LOC,Z,THKNSS
ESLN,S
*GET,STARTGAGE,NODE,0,NUM,MAX !TRIGGER GAGE
ANSOL,2,STARTGAGE,S,X,STARTGAGE
NSEL,S,LOC,X,L8
NSEL,R,LOC,Y,90-7.5
NSEL,R,LOC,Z,THKNSS
ESLN,S
*GET,STARTPROPGAGE,NODE,0,NUM,MAX !START PROP GAGE
ANSOL,3,STARTPROPGAGE,S,X,STARTPROPGAGE
SELTOL,1E-1
NSEL,S,LOC,X,L8
NSEL,R,LOC,Y,90-8.7,90-8.75
NSEL,R,LOC,Z,THKNSS
ESLN,S
*GET,QTRPROPGAGE,NODE,0,NUM,MAX !FIRST QTR OF PROP GAGE
ANSOL,4,QTRPROPGAGE,S,X,QTRPROPGAGE
NSEL,S,LOC,X,L8
NSEL,R,LOC,Y,90-10
NSEL,R,LOC,Z,THKNSS
ESLN,S
*GET,MIDPROPGAGE,NODE,0,NUM,MAX !MID PROP GAGE
ANSOL,5,MIDPROPGAGE,S,X,MIDPROPGAGE
NSEL,S,LOC,X,L8
NSEL,R,LOC,Y,90-10.625
NSEL,R,LOC,Z,THKNSS
ESLN,S

135
*GET,ENDQTRPROPGAGE,NODE,0,NUM,MAX !END QTR PROP GAGE
ANSOL,6,ENDQTRPROPGAGE,S,X,ENDQTRPROPGAGE
NSEL,S,LOC,X,L8
NSEL,R,LOC,Y,90-11.25
NSEL,R,LOC,Z,THKNSS
ESLN,S
*GET,ENDPROPGAGE,NODE,0,NUM,MAX !END PROP GAGE
ANSOL,7,ENDPROPGAGE,S,X,ENDPROPGAGE
NSEL,S,LOC,X,L8
NSEL,R,LOC,Y,90-14
NSEL,R,LOC,Z,THKNSS
ESLN,S
*GET,ENDGAGE,NODE,0,NUM,MAX !END TRIGGER
ANSOL,8,ENDGAGE,S,X,ENDGAGE
/OUT,ONERODCRACKPOSIT
PRVAR,2,3,4,5,6,7
/OUT,ONERODCRACKPOSIT2
PRVAR,8
/OUT

136
APPENDIX D: UNREINFORCED ARCH ANSYS INPUT CODE
The following appendix contains the input code to generate the unreinforced arch using ANSYS 11.0
software.
FINI
/CLEAR
/PREP7
/TITLE, THREE DIMENSIONAL REINFORCED ARCH USING DELAMINATION
*ASK,N,NUMBER OF LAMINATIONS,18
*ASK,P,WHAT LAMINATION IS CRACK AT[NUMBER] (DEFAULTS TO MIDDLE LAM),9
*ASK,L,LENGTH OF HALF ARCH [MM],390
*ASK,HL,HEIGHT AT CENTER OF BEAM [MM],54
*ASK,R,RADIUS [MM],300
*ASK,A1,BOTTOM OF BEAM TO HORIZONTAL [DEGREES],18
*ASK,B,LENGTH OF CONTACT SURFACE [MM],15
*ASK,D,ROD DIAMETER [MM],3.175
*ASK,A2,ROD ANGLE OF ORIENTATION TO VERTICAL [DEGREES],10
*ASK,C1,INITIAL CRACK LENGTH LEFT [MM],27
*ASK,C2,INITIAL CRACK LENGTH RIGHT [MM],27
*ASK,C3,INITIAL CRACK THICKNESS [MM],0.25
*ASK,DISP,DISPLACEMENT APPLIED [MM],6
*ASK,THKNSS, HALF THICKNESS OF ARCH,12.5
*ASK,V,ENTER NUMBER OF LAYER DIVISIONS,1
!***************************WOOD MATERIAL PROPERTIES************************
EX=390
EY=32000
EZ=700
GXY=950
GYZ=900
GXZ=100
NUXY=0.32
NUYZ=0.02
NUXZ=0.39

137
MP,EX,4,EX !MATERIAL 4 WOOD
MP,EY,4,EY
MP,EZ,4,EZ
MP,GXY,4,GXY
MP,GYZ,4,GYZ
MP,GXZ,4,GXZ
MP,NUXY,4,NUXY
MP,NUYZ,4,NUYZ
MP,NUXZ,4,NUXZ
MP,DENS,4,470E-12
MP,EX,6,EX
MP,EZ,6,EY
MP,EY,6,EZ
MP,GXY,6,GXY
MP,GXZ,6,GYZ
MP,GYZ,6,GXZ
MP,NUXY,6,NUXY
MP,NUXZ,6,NUYZ
MP,NUYZ,6,NUXZ
MP,DENS,4,470E-12
!*****************************ELEMENTS************************************
ET,1,185 !SOLID ELEMENTS
ET,3,205 !INTERFACE ELEMENTS
!******************************DEFINED CONSTANTS*********************************
PI=3.14159265358979
A1=A1/180*PI !BOTTOM OF BEAM TO HORIZONTAL
A2=A2/180*PI !ROD ANGLE OF ORIENTATION
X1=(R+HL)*SIN(A1) !DISTANCE TO END OF CROWN CURVATURE AND LOAD APP
(TOP)

138
X2=X1-HL*SIN(A1) !DISTANCE TO END OF CROWN CURVATURE (BOTTOM)
X3=L-B !DISTANCE TO FRONT OF ARCH CONTACT SURFACE
X4=L !ARCH SPAN DISTANCE
L1=R+HL !HEIGHT TO APEX OF CROWN
L2=R !HEIGHT TO BOTTOM OF CROWN
L3=(R+HL)*COS(A1) !HEIGHT TO END OF CROWN CURVATURE (BOTTOM)
L4=L3-HL*COS(A1) !HEIGHT TO END OF CROWN CURVATURE AND LOAD APP
(TOP)
L5=(X4-X1)*TAN(A1) !HEIGHT FROM BASE TO END OF CROWN CURVATURE
(BOTTOM)
L6=L4-L5 !HEIGHT FROM ORIGIN TO BOTTOM OR ARCH
L7=L6+HL !HEIGHT TO TOP OF BACK OF ARCH
L8=L2+P*HL/N !HEIGHT TO START OF CRACK CENTER
L9=L8*COS(A1) !HEIGHT TO END OF CRACK
X5=L8*SIN(A1) !DISTANCE TO END OF CRACK
!************ START MAKING KEYPOINTS. NUMBERING BASED ON 'N' LAMINATIONS
*********
/PNUM,KP,1
K,,0,L1 !1
K,N+1,0,L2 !N+1
KFILL,1,N+1,N-1,2,1 !PREVIOUS THREE COMMANDS DO CENTER ARCH
KEYPOINTS
CSYS,1
K,N+2,L1,(90-(C2*180/(L8*PI))) !N+2
K,2*N+2,L2,(90-(C2*180/(L8*PI))) !2N+2
KFILL,N+2,2*N+2,N-1,N+3,1 !PREVIOUS THREE COMMANDS DO KEYPOINTS AT
RIGHT
!CRACK TIP
CSYS,0
K,,X1,L3 !2N+3

139
K,3*N+3,X2,L4 !3N+3
KFILL,2*N+3,3*N+3,N-1,2*N+4,1 !PREVIOUS THREE COMMANDS DO END OF CROWN
KEYPOINTS
CSYS,1
K,3*N+4,L1,(90+(C1*180/(L8*PI))) !3N+4
K,3*N+4+N,L2,(90+(C1*180/(L8*PI))) !4N+4
KFILL,3*N+4,4*N+4,N-1,3*N+5,1 !PREVIOUS THREE COMMANDS DO KEYPOINTS
AT LEFT
!CRACK TIP
CSYS,0
K,,-X1,L3 !4N+5
K,5*N+5,-X2,L4 !5N+5
KFILL,4*N+5,5*N+5,N-1,4*N+6,1 !PREVIOUS THREE COMMANDS DO LEFT END OF
CROWN KPS
CSYS,1
*IF,P,GE,N,THEN !DETERMINES POSITION OF CRACK KP. QUALITY
CHECK TO
!ASSURE CRACK DOES NOT APPEAR OUTSIDE
LAMINATIONS
P=N-1
*ELSE
P=P
*ENDIF
CSYS,0
!***************************LOCAL COORDINATE
SYSTEMS********************************
LOCAL,11,1,0,((D/2)/SIN(A2)) !FOR MAKING TOP OF RODS (UNUSED)
LOCAL,12,0,,,,-A1*180/PI+90 !BOTTOM ARCH ELEM ORIENTATION (RIGHT)
LOCAL,13,0,,,,+A1*180/PI+90 !BOTTOM ARCH ELEM ORIENTATION (LEFT)

140
LOCAL,14,1
LOCAL,15,0,,,,90-A2*PI/180 !ROD ELEM ORIENTATION RIGHT
LOCAL,16,0,,,,90+A2*PI/180 !ROD ELEM ORIENTATION LEFT
LOCAL,19,1,L8*SIN(C2/L8),L8*COS(C2/L8),,90-(C2*180)/(L8*PI) !CYLINDRICAL SYSTEM AT
!RIGHT CRACK TIP
LOCAL,20,0,L8*SIN(C2/L8),L8*COS(C2/L8),,90-(C2*180)/(L8*PI) !CARTESIAN SYSTEM AT
!RIGHT CRACK TIP
!*****************************START MAKING
LINES**************************************
CSYS,1
/PNUM,LINE,1
*DO,I,1,N+1,1
L,I,N+1+I
*ENDDO !N+1 !CROWN CENTER TO RIGHT
CRACK TIP
*DO,I,1,N+1,1
L,N+1+I,2*(N+1)+I
*ENDDO !2(N+1) !RIGHT CRACK TIP TO RIGHT END
OF CROWN
*DO,I,1,N+1,1
L,I,3*(N+1)+I
*ENDDO !3(N+1) !CROWN CENTER TO LEFT CRACK
TIP
*DO,I,1,N,1
L,I,I+1
*ENDDO !4N+3 !CENTER ARCH VERTICAL LINES
*DO,I,1,N,1
L,N+1+I,N+2+I

141
*ENDDO !5N+3 !VERTICAL LINES AT RIGHT
CRACK TIP
*DO,I,1,N,1
L,2*N+2+I,2*N+3+I
*ENDDO !6N+3 !RIGHT END OF CROWN VERTIAL
LINES
*DO,I,1,N,1
L,3*N+3+I,3*N+4+I
*ENDDO !7N+3 !VERTICAL LINES AT LEFT CRACK
TIP
*DO,I,1,N+1,1
L,3*N+3+I,4*N+4+I
*ENDDO !8N+4 !CROWN LONGITUDINAL LINES
LEFT
*DO,I,1,N,1
L,4*N+4+I,4*N+5+I
*ENDDO !9N+4 !LEFT END OF CROWN VERTICAL
LINES
!***************************DEFINE CRACK POINTS AT ARCH
CENTER***********************
K,,L2+(HL/N)*P+C3/2,90 !5N+6 (CRACK POINTS)
K,,L2+(HL/N)*P-C3/2,90 !5N+7 (CRACK POINTS)
!*******************************MAKE ARCH CROWN
AREA*********************************
CSYS,1
SELTOL,1E-3
LSEL,S,LOC,X,L1

142
LSEL,A,LOC,X,0,L2
LSEL,A,LOC,Y,0,90-180*A1/PI
LSEL,A,LOC,Y,90+180*A1/PI,180
AL,ALL
ALLS
SELTOL,0
!*******************************MAKE CRACK KPS AND
LINES******************************
CSYS,1
!WE DO NOT KNOW THE # OF KPS THAT DEFINE CRACK TIPS. WE MUST REDEFINE THEM
!BASED ON KNOWN COORDINATES
KSEL,S,,,5*N+6
KSEL,A,,,5*N+7
K,5*N+8,((L2+(HL/N)*P+C3/2)+(L2+(HL/N)*P-C3/2))/2,(90+(C1*180/(L8*PI))) !5N+8
K,5*N+9,((L2+(HL/N)*P+C3/2)+(L2+(HL/N)*P-C3/2))/2,(90-(C2*180/(L8*PI))) !5N+9
L,5*N+6,5*N+8 !9N+5
L,5*N+8,5*N+7 !9N+6
L,5*N+7,5*N+9 !9N+7
L,5*N+9,5*N+6 !9N+8 !PREVIOUS FOUR COMMANDS
MAKE CRACK
!******************************MAKE CRACK
AREAS**************************************
LSLK,S !LINES ASSOCIATED WITH CRACK
KEYPOINTS
AL,ALL
ALLS
!******************************ARCH
VOLUME*******************************************
K,5*N+11,L1,90-A1*180/PI,THKNSS !5N+11
L,2*N+3,5*N+11 !9N+9 !FROMS KP AND LINE AT THICKNESS TO
!EXTRUDE ARCH VOLUME

143
LSEL,U,,,ALL
!******************************CRACK TIP MESH
AREAS**********************************
CSYS,19
BTOL,1E-9
*DO,I,1,V,1
CIRCLE,5*N+9,I*HL/(V*N)
LGEN,1,ALL,,,,90-(C2*180)/(L8*PI),,,,1
LSEL,R,LOC,Y,0,180
LCOMB,ALL
LSEL,S,LOC,Y,180,360
LSEL,R,LOC,X,I*HL/(V*N)
LSEL,U,LOC,Y,0
LSEL,U,LOC,Y,180
LCOMB,ALL
LSEL,S,LOC,X,I*HL/(V*N)
LSEL,U,LOC,Y,0
LSEL,U,LOC,Y,180
AL,ALL
LSEL,U,,,ALL
ASEL,U,,,ALL
*ENDDO !DO LOOP FOR AREARS FOR CRACKTIP
MESHING
CSYS,1
LSEL,ALL
lsel,u,,,9*n+9
ASEL,ALL
ASBA,ALL,2
AOVLAP,ALL !FORMS CRACK AND CRACK TIP MESH AREA
!******************GENERATE ALL LAMINATION
AREAS**************************************

144
ASBL,ALL,ALL
ALLS
!******************GENERATE ALL LAMINATION
VOLUMES************************************
VDRAG,ALL,,,,,,9*N+9 !GENERATES ALL LAMINATIONS
!******************GENERATE RIGHT REINFORCING
ROD*************************************
BTOL,0
CSYS,0
WPROTA,,-90 !CHANGES THE Y AXIS TO THE Z AXIS FOR FORMING
RODS
WPROTA,,,A2*180/PI !ROTATE Y (NOW Z) TO PROPER ROD ANGLE
ORIENTATION
CYLIND,D/4,D/2,200,450,-180,0 !MAKES RIGHT ROD
CYLIND,THKNSS,D/4,200,450,-180,0 !WILL HELP IN MESH REFINEMENT
WPROTA,,,-A2*180/PI
WPROTA,,90 !RESTORES AXES TO GLOBALS
CSYS,1
VSEL,S,LOC,Y,0,(90-(C2*180/(L8*PI)))
VOVLAP,ALL
NUMMRG,ALL
ALLS
LSEL,S,LOC,X,L2,L1
LSEL,INVE
ASLL,S
VSLA,S
VDELE,ALL !REMOVES CANTILEVER ROD COMPONENTS
ALLS
CSYS,1
ASEL,S,LOC,X,L1,1000

145
ASEL,A,LOC,X,0,L2
ASEL,U,LOC,X,L1
ASEL,U,LOC,X,L2
LSLA,ALL
LSEL,U,LOC,X,L2
LSEL,U,LOC,X,L1
KSLL,S
KSEL,U,LOC,X,L1
KSEL,U,LOC,X,L2
ADELE,ALL
LDELE,ALL
KDELE,ALL !PREVIOUS THIRTEEN COMMANDS DELETE
UNNECESSARY
!ASPECTS
ALLS
!*************************DIVIDE ROD TO ALLOW FOR HEX.
MESHING*********************
CSYS,1
K,10000,L2,90-A2*180/PI
K,10001,L1,90-A2*180/PI
K,10002,L2,90-A2*180/PI,THKNSS
K,10003,L1,90-A2*180/PI,THKNSS
LSEL,U,,,ALL
L,10000,10001
L,10001,10003
L,10002,10003
L,10002,10000
AL,ALL
ALLS
ASLL,S
VSLA,S
VSBA,ALL,ALL !PREVIOUS 15 COMMANDS ARE NECESSARY TO
DIVIDE

146
ALLS !RODS FOR HEXAHEDRAL MESHING
!****************************MIRROR RIGHT
ROD**************************************
LSEL,S,LOC,Z,THKNSS
ASLL,S
VSLA,S
VSEL,INVER
ASLV,S
LSLA,S
ASLL,S
VSLA,S
CSYS,0
VSYMM,X,ALL !MIRROR ROD
NUMMRG,ALL
ALLS
!*********************COMPLETE RIGHT ARCH
GEOMETRY*****************************************
K,100000,X4,L7
K,100000+N+1,X4,L6
K,100000+N,X3,L6
KFILL,100000,100000+N,N-1,100001,1
ASEL,U,,,ALL
LSEL,U,,,ALL
L,2*N+3,100000
L,100000,100000+N
L,100000+N,3*N+3
L,2*N+3,3*N+3
AL,ALL
LSEL,U,,,ALL !PREVIOUS 12 COMMANDS FORM RIGHT BASE KPS,LINES,AND
AREAS

147
*DO,I,1,N-1,1
L,2*N+3+I,100000+I
*ENDDO !BASE LAMINATION LINES
ASBL,ALL,ALL !BASE LAMINATIOPN AREAS
VDRAG,ALL,,,,,,9*N+9 !BASE LAMINATION VOLUMES
VSEL,U,,,ALL
ASEL,U,,,ALL
LSEL,U,,,ALL
KSEL,S,,,100000
KSEL,A,,,100000+N
KSEL,A,,,100000+N+1
A,100000,100000+N,100000+N+1
VDRAG,ALL,,,,,,9*N+9 !FORMS TRIANGLE AT BASE OF ARCH
!****************COMPLETE LEFT ARCH
GEOMETRY************************************
CSYS,1
VSEL,S,LOC,Y,0,90-A1*180/PI
BTOL,1E-5
CSYS,0
VSYMM,X,ALL !MIRRORS BOTTOM OF ARCH COMPLETING
GEOMETRY
ALLS
CSYS,1
VSEL,S,LOC,Y,90-A1*180/PI,90+A1*180/PI
VOVLAP,ALL
ALLS
NUMMRG,ALL
!**********************BEGIN ROD MESHING****************************************
LSEL,S,LOC,Z,D/4 !SELECT VERTICAL ROD LINES
LSEL,U,LOC,X,L8+HL/N,L8-HL/N !REMOVE COMPONENTS IN PATH OF ROD
LESIZE,ALL,,,V !<===LINE MESH POINT (ARBITRARAY)

148
ALLS
!BEGIN ROD MESHING
LSEL,S,LOC,Z,D/4 !SELECT VERTICAL ROD LINES IN CRACK PATH
LSEL,R,LOC,X,L8-HL/N,L8+HL/N
LESIZE,ALL,,,2 !<===LINE MESH POINT MUST EQUAL (***)
ALLS
LSEL,S,LOC,Z,0,D/2
LSEL,U,LOC,Z,0
LSEL,U,LOC,Z,D/2
LSEL,U,LOC,Z,D/4 !LEAVES CURVED ASPECTS OF RODS
LESIZE,ALL,,,4 !<===LINE MESH POINT (MUST BE EVEN > THAN 2)
!MUST = (**)
VSEL,S,LOC,Z,0,D/2
MAT,6
TYPE,1
VMESH,ALL
!*********************MESH WOOD CONTACTING
RODS**********************************
ASEL,S,LOC,Z,THKNSS
VSLA,A
VSEL,INVE
MAT,4
TYPE,1
VMESH,ALL !MESH WOOD CONTACTING RODS
!********************SIZE LINES PAST CRACK TIPS**********************************
*DO,I,0,N,1 !SELECT LAMINATION LINES PAST CRACK TIP
VSEL,S,LOC,Z,0,D/2
ASLV,S
VSLA,S

149
ASLV,S
LSLA,S
LSEL,INVE
LSEL,U,LOC,Y,0,90-A1*180/PI
LSEL,U,LOC,Y,90+A1*180/PI,180
LSEL,U,LOC,Y,90
LSEL,U,LOC,Y,(90-(C2*180/(L8*PI))),90
LSEL,U,LOC,Y,90,(90+(C1*180/(L8*PI)))
SELTOL,1E-4
LSEL,R,LOC,X,L2+I*HL/N
CSYS,19
LSEL,U,LOC,X,0,HL/N
CSYS,1
LESIZE,ALL,,,65 !<==== LINE MESH POINT (ARBITRARY)
ALLS
*ENDDO
!********************SIZE LINES ABOVE AND BELOW CRACK
***************************
*DO,I,0,N,1 !SELECT LAMINATION ABOVE AND BEFORE CRACK
VSEL,S,LOC,Z,0,D/2
ASLV,S
VSLA,S
ASLV,S
LSLA,S
LSEL,INVE
LSEL,U,LOC,Y,0,90-A1*180/PI
LSEL,U,LOC,Y,90+A1*180/PI,180
LSEL,U,LOC,Y,90
LSEL,U,LOC,Y,90-A1*180/PI,(90-(C2*180/(L8*PI)))
LSEL,U,LOC,Y,(90+(C1*180/(L8*PI))),(90+A1*180/PI)
SELTOL,1E-4
LSEL,R,LOC,X,L2+I*HL/N

150
CSYS,19
LSEL,U,LOC,X,0,HL/N
LPLOT
CSYS,1
LESIZE,ALL,,,5 !<==== LINE MESH POINT (ARBITRARY)
ALLS
*ENDDO
!***********************MESH ARCH CROWN***************************************
CSYS,1
MAT,4
TYPE,1
ASEL,S,LOC,Z,THKNSS
VSLA,S
VSEL,U,LOC,Y,0,90-A1*180/PI
VSEL,U,LOC,Y,90+A1*180/PI,180
CSYS,19
VSEL,U,LOC,X,0,HL/N
VMESH,ALL !MESH CROWN OF ARCH
!*********************RIGHT CRACKTIP MESHING**********************************
CSYS,19
VSEL,S,LOC,X,0,HL/N
ASLV,S
LSLA,S
*DO,I,1,V,1
LSEL,S,LOC,X,0,I*HL/(V*N)
LSEL,R,LOC,Z,0
LESIZE,ALL,,,2 !(***)LINE MESH POINT. BECAUSE OF MESHING
!AROUND CRACK TIP, THIS VALUE
!MUST BE EVEN > OR = 2
LPLOT
*ENDDO

151
LSLA,S
*DO,I,0,3,1
LSEL,S,LOC,X,HL/(N),HL/N
LSEL,R,LOC,Z,0
LSEL,R,LOC,Y,I*90
LESIZE,ALL,,,1
LSEL,S,LOC,X,HL/(N),HL/N
LSEL,R,LOC,Z,THKNSS
LSEL,R,LOC,Y,I*90
LESIZE,ALL,,,1
*ENDDO
LSLA,S
LSEL,U,LOC,Z,0
LSEL,U,LOC,Z,THKNSS
LESIZE,ALL,,,4 !SIZES CRACK TIP ELEMENT THICKNESS (MUST =(**))
VMESH,ALL !MESHES CRACK TIP ELEMENTS HOWEVER...
VSEL,S,LOC,X,0,HL/N
VCLEAR,ALL !...NEED TO CREATE TETRAHEDRAL ELEMENTS IN
!FRONT OF CRACK TIP
!*******TETRAHEDRAL ELEMENTS AT CRACK TIP (MORE
PRECISION)*******************************
CSYS,19
SELTOL,.1
N,,,0
N,,,,THKNSS/4
N,,,,THKNSS/2
N,,,,3*THKNSS/4
N,,,,THKNSS
SELTOL,1

152
NSEL,S,LOC,X,HL/(N*V) $ NSEL,R,LOC,Z,0 $ NSEL,R,LOC,Y,270 $ *GET,N1,NODE,0,NUM,MAX
NSEL,S,LOC,X,HL/(N*V) $ NSEL,R,LOC,Z,0 $ NSEL,R,LOC,Y,315 $ *GET,N2,NODE,0,NUM,MAX
NSEL,S,LOC,X,HL/(N*V) $ NSEL,R,LOC,Z,0 $ NSEL,R,LOC,Y,360 $
*GET,N3,NODE,0,NUM,MAX
NSEL,S,LOC,X,HL/(N*V) $ NSEL,R,LOC,Z,0 $ NSEL,R,LOC,Y,405 $
*GET,N4,NODE,0,NUM,MAX
NSEL,S,LOC,X,HL/(N*V) $ NSEL,R,LOC,Z,0 $ NSEL,R,LOC,Y,450 $ *GET,N5,NODE,0,NUM,MIN
NSEL,S,LOC,X,HL/(N*V) $ NSEL,R,LOC,Z,0 $ NSEL,R,LOC,Y,450 $
*GET,N6,NODE,0,NUM,MAX
NSEL,S,LOC,X,HL/(N*V) $ NSEL,R,LOC,Z,0 $ NSEL,R,LOC,Y,495 $ *GET,N7,NODE,0,NUM,MAX
NSEL,S,LOC,X,HL/(N*V) $ NSEL,R,LOC,Z,0 $ NSEL,R,LOC,Y,540 $ *GET,N8,NODE,0,NUM,MAX
NSEL,S,LOC,X,HL/(N*V) $ NSEL,R,LOC,Z,0 $ NSEL,R,LOC,Y,225 $ *GET,N9,NODE,0,NUM,MAX
NSEL,S,LOC,X,0 $ NSEL,R,LOC,Z,0 $ $ *GET,N10,NODE,0,NUM,MAX
NSEL,S,LOC,X,HL/(N*V) $ NSEL,R,LOC,Z,THKNSS/4 $ NSEL,R,LOC,Y,270 $
*GET,N11,NODE,0,NUM,MAX
NSEL,S,LOC,X,HL/(N*V) $ NSEL,R,LOC,Z,THKNSS/4 $ NSEL,R,LOC,Y,315 $
*GET,N12,NODE,0,NUM,MAX
NSEL,S,LOC,X,HL/(N*V) $ NSEL,R,LOC,Z,THKNSS/4 $ NSEL,R,LOC,Y,360 $
*GET,N13,NODE,0,NUM,MAX
NSEL,S,LOC,X,HL/(N*V) $ NSEL,R,LOC,Z,THKNSS/4 $ NSEL,R,LOC,Y,405 $
*GET,N14,NODE,0,NUM,MAX
NSEL,S,LOC,X,HL/(N*V) $ NSEL,R,LOC,Z,THKNSS/4 $ NSEL,R,LOC,Y,450 $
*GET,N15,NODE,0,NUM,MIN
NSEL,S,LOC,X,HL/(N*V) $ NSEL,R,LOC,Z,THKNSS/4 $ NSEL,R,LOC,Y,450 $
*GET,N16,NODE,0,NUM,MAX
NSEL,S,LOC,X,HL/(N*V) $ NSEL,R,LOC,Z,THKNSS/4 $ NSEL,R,LOC,Y,495 $
*GET,N17,NODE,0,NUM,MAX
NSEL,S,LOC,X,HL/(N*V) $ NSEL,R,LOC,Z,THKNSS/4 $ NSEL,R,LOC,Y,540 $
*GET,N18,NODE,0,NUM,MAX
NSEL,S,LOC,X,HL/(N*V) $ NSEL,R,LOC,Z,THKNSS/4 $ NSEL,R,LOC,Y,225 $
*GET,N19,NODE,0,NUM,MAX
NSEL,S,LOC,X,0 $ NSEL,R,LOC,Z,THKNSS/4 $ $
*GET,N20,NODE,0,NUM,MAX

153
NSEL,S,LOC,X,HL/(N*V) $ NSEL,R,LOC,Z,THKNSS/2 $ NSEL,R,LOC,Y,270 $
*GET,N21,NODE,0,NUM,MAX
NSEL,S,LOC,X,HL/(N*V) $ NSEL,R,LOC,Z,THKNSS/2 $ NSEL,R,LOC,Y,315 $
*GET,N22,NODE,0,NUM,MAX
NSEL,S,LOC,X,HL/(N*V) $ NSEL,R,LOC,Z,THKNSS/2 $ NSEL,R,LOC,Y,360 $
*GET,N23,NODE,0,NUM,MAX
NSEL,S,LOC,X,HL/(N*V) $ NSEL,R,LOC,Z,THKNSS/2 $ NSEL,R,LOC,Y,405 $
*GET,N24,NODE,0,NUM,MAX
NSEL,S,LOC,X,HL/(N*V) $ NSEL,R,LOC,Z,THKNSS/2 $ NSEL,R,LOC,Y,450 $
*GET,N25,NODE,0,NUM,MIN
NSEL,S,LOC,X,HL/(N*V) $ NSEL,R,LOC,Z,THKNSS/2 $ NSEL,R,LOC,Y,450 $
*GET,N26,NODE,0,NUM,MAX
NSEL,S,LOC,X,HL/(N*V) $ NSEL,R,LOC,Z,THKNSS/2 $ NSEL,R,LOC,Y,495 $
*GET,N27,NODE,0,NUM,MAX
NSEL,S,LOC,X,HL/(N*V) $ NSEL,R,LOC,Z,THKNSS/2 $ NSEL,R,LOC,Y,540 $
*GET,N28,NODE,0,NUM,MAX
NSEL,S,LOC,X,HL/(N*V) $ NSEL,R,LOC,Z,THKNSS/2 $ NSEL,R,LOC,Y,225 $
*GET,N29,NODE,0,NUM,MAX
NSEL,S,LOC,X,0 $ NSEL,R,LOC,Z,THKNSS/2 $ $
*GET,N30,NODE,0,NUM,MAX
NSEL,S,LOC,X,HL/(N*V) $ NSEL,R,LOC,Z,3*THKNSS/4 $ NSEL,R,LOC,Y,270 $
*GET,N31,NODE,0,NUM,MAX
NSEL,S,LOC,X,HL/(N*V) $ NSEL,R,LOC,Z,3*THKNSS/4 $ NSEL,R,LOC,Y,315 $
*GET,N32,NODE,0,NUM,MAX
NSEL,S,LOC,X,HL/(N*V) $ NSEL,R,LOC,Z,3*THKNSS/4 $ NSEL,R,LOC,Y,360 $
*GET,N33,NODE,0,NUM,MAX
NSEL,S,LOC,X,HL/(N*V) $ NSEL,R,LOC,Z,3*THKNSS/4 $ NSEL,R,LOC,Y,405 $
*GET,N34,NODE,0,NUM,MAX
NSEL,S,LOC,X,HL/(N*V) $ NSEL,R,LOC,Z,3*THKNSS/4 $ NSEL,R,LOC,Y,450 $
*GET,N35,NODE,0,NUM,MIN
NSEL,S,LOC,X,HL/(N*V) $ NSEL,R,LOC,Z,3*THKNSS/4 $ NSEL,R,LOC,Y,450 $
*GET,N36,NODE,0,NUM,MAX

154
NSEL,S,LOC,X,HL/(N*V) $ NSEL,R,LOC,Z,3*THKNSS/4 $ NSEL,R,LOC,Y,495 $
*GET,N37,NODE,0,NUM,MAX
NSEL,S,LOC,X,HL/(N*V) $ NSEL,R,LOC,Z,3*THKNSS/4 $ NSEL,R,LOC,Y,540 $
*GET,N38,NODE,0,NUM,MAX
NSEL,S,LOC,X,HL/(N*V) $ NSEL,R,LOC,Z,3*THKNSS/4 $ NSEL,R,LOC,Y,225 $
*GET,N39,NODE,0,NUM,MAX
NSEL,S,LOC,X,0 $ NSEL,R,LOC,Z,3*THKNSS/4 $ $
*GET,N40,NODE,0,NUM,MAX
NSEL,S,LOC,X,HL/(N*V) $ NSEL,R,LOC,Z,THKNSS $ NSEL,R,LOC,Y,270 $
*GET,N41,NODE,0,NUM,MAX
NSEL,S,LOC,X,HL/(N*V) $ NSEL,R,LOC,Z,THKNSS $ NSEL,R,LOC,Y,315 $
*GET,N42,NODE,0,NUM,MAX
NSEL,S,LOC,X,HL/(N*V) $ NSEL,R,LOC,Z,THKNSS $ NSEL,R,LOC,Y,360 $
*GET,N43,NODE,0,NUM,MAX
NSEL,S,LOC,X,HL/(N*V) $ NSEL,R,LOC,Z,THKNSS $ NSEL,R,LOC,Y,405 $
*GET,N44,NODE,0,NUM,MAX
NSEL,S,LOC,X,HL/(N*V) $ NSEL,R,LOC,Z,THKNSS $ NSEL,R,LOC,Y,450 $
*GET,N45,NODE,0,NUM,MIN
NSEL,S,LOC,X,HL/(N*V) $ NSEL,R,LOC,Z,THKNSS $ NSEL,R,LOC,Y,450 $
*GET,N46,NODE,0,NUM,MAX
NSEL,S,LOC,X,HL/(N*V) $ NSEL,R,LOC,Z,THKNSS $ NSEL,R,LOC,Y,495 $
*GET,N47,NODE,0,NUM,MAX
NSEL,S,LOC,X,HL/(N*V) $ NSEL,R,LOC,Z,THKNSS $ NSEL,R,LOC,Y,540 $
*GET,N48,NODE,0,NUM,MAX
NSEL,S,LOC,X,HL/(N*V) $ NSEL,R,LOC,Z,THKNSS $ NSEL,R,LOC,Y,225 $
*GET,N49,NODE,0,NUM,MAX
NSEL,S,LOC,X,0 $ NSEL,R,LOC,Z,THKNSS $ $ *GET,N50,NODE,0,NUM,MAX
E,N10,N1,N2,N20,N11,N12
E,N10,N2,N3,N20,N12,N13
E,N10,N3,N4,N20,N13,N14
E,N10,N4,N5,N20,N14,N15

155
E,N10,N6,N7,N20,N16,N17
E,N10,N7,N8,N20,N17,N18
E,N10,N8,N9,N20,N18,N19
E,N10,N9,N1,N20,N19,N11
E,N20,N11,N12,N30,N21,N22
E,N20,N12,N13,N30,N22,N23
E,N20,N13,N14,N30,N23,N24
E,N20,N14,N15,N30,N24,N25
E,N20,N16,N17,N30,N26,N27
E,N20,N17,N18,N30,N27,N28
E,N20,N18,N19,N30,N28,N29
E,N20,N19,N11,N30,N29,N21
E,N30,N21,N22,N40,N31,N32
E,N30,N22,N23,N40,N32,N33
E,N30,N23,N24,N40,N33,N34
E,N30,N24,N25,N40,N34,N35
E,N30,N26,N27,N40,N36,N37
E,N30,N27,N28,N40,N37,N38
E,N30,N28,N29,N40,N38,N39
E,N30,N29,N21,N40,N39,N31
E,N40,N31,N32,N50,N41,N42
E,N40,N32,N33,N50,N42,N43
E,N40,N33,N34,N50,N43,N44
E,N40,N34,N35,N50,N44,N45
E,N40,N36,N37,N50,N46,N47
E,N40,N37,N38,N50,N47,N48
E,N40,N38,N39,N50,N48,N49
E,N40,N39,N31,N50,N49,N41

156
NUMMRG,ALL
!*******MESH BASE OF ARCH**************************************************
CSYS,1
VSEL,S,LOC,Y,90-A1*180/PI,90+A1*180/PI
VSEL,INVE
CSYS,12
SELTOL,1E-2
LSEL,S,LOC,Y,-(X4-X1)/COS(A1),0
SELTOL,1
LSEL,U,LOC,Y,-(X4-X1)/COS(A1)
LSEL,U,LOC,Y,0
LESIZE,ALL,,,50
CSYS,13
SELTOL,1E-2
LSEL,S,LOC,Y,.8*(X4-X1)/COS(A1),0
SELTOL,1
LSEL,U,LOC,Y,.8*(X4-X1)/COS(A1)
LSEL,U,LOC,Y,0
LESIZE,ALL,,,50
SELTOL,0
CSYS,1
VSEL,S,LOC,Y,90-A1*180/PI,90+A1*180/PI
VSEL,INVE
CSYS,0
MSHAPE,0
VMESH,ALL
!*************MODIFY SECTIONS TO APPROPIATE COORDINATE SYSTEM*************
ALLS
CSYS,1

157
NSEL,S,LOC,Y,90-A1*180/PI,90+A1*180/PI
ESLN,S
EMOD,ALL,ESYS,14 !MODIFY CROWN ELEM TO CYLIND SYS
NSEL,S,LOC,Y,0,90-A1*180/PI
ESLN,S
EMOD,ALL,ESYS,12 !MODIFY BOTTOM RIGHT TO SYSTEM 12
NSEL,S,LOC,Y,90+A1*180/PI,180
ESLN,S
EMOD,ALL,ESYS,13 !MODIFY BOTTOM LEFT TO SYSTEM 13
!*************BEGIN COHESIVE ZONES (CROWN)****************************
ALLS
DELTAN = 0.0553 !NORMAL RELATIVE DISPLACEMENT
DELTAT = 0.0241 !TANGENTIAL RELATIVE DISPLACEMENT
TNMAX = 1.53 !MAXIMUM TENSILE STRENGTH
TB,CZM,5,,,EXPO
TBDATA,1,TNMAX,DELTAN,DELTAT
MAT,5
TYPE,3
SELTOL,1E-1
NSEL,S,LOC,Y,90-A1*180/PI,90+A1*180/PI
NSEL,U,LOC,Y,90-A1*180/PI
NSEL,U,LOC,Y,90+A1*180/PI
ESLN
*DO,I,1,N-1,1 !COHESIVE ELEMENTS BELOW CRACK LAMINATION
CZMESH,,,1,X,L2+I*HL/N
EPLOT
ESEL,U,TYPE,,3
*ENDDO
!*******************DEFINE CRACKTIP NODE*******************************
CSYS,1

158
SELTOL,1E-5
NSEL,S,LOC,X,L8
NSEL,R,LOC,Y,(90-(C2*180/(L8*PI)))
NSEL,R,LOC,Z,0
*GET,CRACKNODE,NODE,0,NUM,MAX
SELTOL,1E-1
NSEL,S,LOC,X,L8
NSEL,R,LOC,Y,(90-(C2*180/(L8*PI)))
NSEL,R,LOC,Z,0,THKNSS/4
CM,CRACKTIP,NODE ! DEFINE CRACK TIP NODE COMPONENT
!*******BOTTOM RIGHT COHESIVE ZONE (UNDER ROLLER LOADING)*************
CSYS,12
NSEL,S,LOC,Y,-0.2*(X4-X1)/COS(A1),0 !0.2 DEFINES ARBITRARY DISTANCE
!PAST ROLLERS TO END COHESIVE
!ELEMENTS
SELTOL,1
NSEL,U,LOC,Y,0
NSEL,U,LOC,Y,-0.2*(X4-X1)/COS(A1)
ESLN,S
SELTOL,1E-2
ESEL,U,TYPE,,3
TYPE,3
*DO,I,1,N-4,1 !N-4 PREVENTS COHESIVE ELEMENTS
!FROM EXTENDING TOO CLOSE TO
!LOAD POINTS. HELPS CONVERGENCE
CZMESH,,,12,X,L2+I*HL/N
EPLOT
ESEL,U,TYPE,,3
*ENDDO
!********BOTTOM RIGHT COHESIVE ZONE (PAST ROLLERS)*********************

159
NSEL,S,LOC,Y,-0.80*(X4-X1)/COS(A1),-0.2*(X4-X1)/COS(A1)
NSEL,U,LOC,Y,-0.80*(X4-X1)/COS(A1)
NSEL,U,LOC,Y,-0.2*(X4-X1)/COS(A1)
SELTOL,1E-2
ESLN,S
ESEL,U,TYPE,,3
*DO,I,1,N-1,1
CZMESH,,,12,X,L2+I*HL/N
EPLOT
ESEL,U,TYPE,,3
*ENDDO
!*******BOTTOM LEFT COHESIVE ZONE (UNDER ROLLER LOADING)*************
CSYS,13
TYPE,3
NSEL,S,LOC,Y,0,0.2*(X4-X1)/COS(A1)
SELTOL,1
NSEL,U,LOC,Y,0
NSEL,U,LOC,Y,0.2*(X4-X1)/COS(A1)
ESLN,S
SELTOL,1E-1
ESEL,U,TYPE,,3
*DO,I,1,N-4,1 !COHESIVE ELEMENTS BELOW CRACK LAMINATION
CZMESH,,,13,X,L2+I*HL/N
EPLOT
ESEL,U,TYPE,,3
*ENDDO
ALLS
!********BOTTOM LEFT COHESIVE ZONE (PAST ROLLERS)*********************
CSYS,13

160
MAT,5
TYPE,3
NSEL,S,LOC,Y,0.2*(X4-X1)/COS(A1),0.80*(X4-X1)/COS(A1)
NSEL,U,LOC,Y,0.2*(X4-X1)/COS(A1)
NSEL,U,LOC,Y,0.80*(X4-X1)/COS(A1)
SELTOL,1
ESLN,S
SELTOL,1E-1
ESEL,U,TYPE,,3
*DO,I,1,N-1,1 !COHESIVE ELEMENTS BELOW CRACK LAMINATION
CZMESH,,,13,X,L2+I*HL/N
EPLOT
ESEL,U,TYPE,,3
*ENDDO
ALLS
!**************SOLUTION**************************************************
/SOLU
CSYS,1
ALLS
CSYS,0
NSEL,S,LOC,X,0
ALLS
NSEL,S,LOC,Y,L6
NSEL,R,LOC,X,-X3,X3
D,ALL,UY !RESTRICT Y TRANSLATION
D,ALL,UZ !RESTRICT Z TRANSLATION
ALLS
NSEL,S,LOC,X,-X4
NSEL,R,LOC,Y,L6
D,ALL,UX !CREATES PINNED SUPPORT
ALLS

161
NSEL,S,LOC,Z,0
DSYM,SYMM,Z !RESTRICTS OUT OF PLANE TRANSLATION
ALLS
!**************************FRACTURE DATA*************************************
ALLS
!CINT,NEW,9 ! DEFINE CRACK ID
!CINT,CTNC,CRACKTIP ! DEFINE CRACK TIP NODE COMPONENT
!CINT,SYMM,OFF ! SYMMETRY OFF
!CINT,NCON,6 ! NUMBER OF COUNTOURS
!CINT,NORM,1,1 ! DEFINE CRACK PLANE NORMAL
!CINT,LIST
ALLS
!*************************LOADING********************************************
CSYS,1
NSEL,S,LOC,X,L1
NSEL,R,LOC,Y,90-A1*180/PI
D,ALL,UY,-DISP !APPLY UNIFORM DISPLACAENT AT CROWN
NSEL,S,LOC,X,L1
NSEL,R,LOC,Y,90+A1*180/PI
D,ALL,UY,-DISP !APPLY UNIFORM DISPLACEMENT AT CROWN
ALLS
CSYS,0
NSEL,S,LOC,X,0
ALLS
NSEL,S,LOC,Y,L6
NSEL,R,LOC,X,-X3,X3
D,ALL,UY !RESTRICT Y TRANSLATION
D,ALL,UZ !RESTRICT Z TRANSLATION
ALLS

162
NSEL,S,LOC,X,-X4
NSEL,R,LOC,Y,L6
D,ALL,UX !CREATES PINNED SUPPORT
ALLS
NSEL,S,LOC,Z,0
D,ALL,UZ !RESTRICTS OUT OF PLANE TRANSLATION
ALLS
ESEL,ALL
!***************************SOLVER*****************************************
NLGEOM,ON
AUTOTS,ON
TIME,71.4
NEQIT,200
NSUBST,30,30,30
OUTRES,ALL,ALL
EPLOT
CSYS,1
SELTOL,1E-5
ALLS
SOLVE
/POST1
PRCINT,1! !PRINT THE J INTEGRAL VALUES
!FOR ALL PATHS
*GET,J,CINT,9,,CRACKNODE,,6 !GET THE J INTEGRAL VALUE FOR CRACK
!TIP NODE CRACKNODE, COUNTOUR NUMBER 6
*STATUS,J
CON1=EX/(1-(NUXY*NUXY))
K =(CON1*ABS(J))**0.5
*STATUS,K
RSYS,11
PLNSTRESS,S,X
!****************POST26******************************************
/POST26

163
SELTOL,1E-4
CSYS,1
NSEL,S,LOC,X,L8
NSEL,R,LOC,Z,D/2
NSEL,R,LOC,Y,0,90-A2*180/PI
ESLN,S
ESEL,R,MAT,,6
*GET,RODSTRESS,NODE,0,NUM,MIN !PREVIOUS 4 SELECT NODE WHERE
!CRACK REACHES ROD
ANSOL,2,RODSTRESS,S,X,RODSTRESS
NSEL,S,LOC,Y,90-A1*180/PI
NSEL,R,LOC,X,L1
NSEL,R,LOC,Z,0
*GET,NREACTION,NODE,0,NUM,MAX
CSYS,0
RFORCE,3,NREACTION,F,Y,FY
PROD,4,3,,,TOTALLOAD,,,-18,
/TITLE,REACTION AT TOP NODE VERSES MAX ROD STRESS
/AXLAB,X,APPLIED LOAD(N)
/AXLAB,Y,MAXIMUM ROD STRESS (MPA)
/YRANGE,0,500
/XRANGE,0,3000
XVAR,4
PLVAR,2
CSYS,20
NSEL,S,LOC,X,0
NSEL,R,LOC,Y,0
NSEL,R,LOC,Z,0
ESLN
ESEL,U,MAT,,4
*GET,NCRACKTIP,NODE,0,NUM,MIN
*GET,ECRACKTIP,ELEMENT,0,NUM,MIN
ESOL,5,ECRACKTIP,NCRACKTIP,SD,X,CRACKOPENING
/TITLE,CRACK TIP OPENING

164
/AXLAB,X,APPLIED LOAD(N)
/AXLAB,Y,CRACKTIP SEPERATION (MM)
/YRANGE,0,1
/XRANGE,0,3000
XVAR,4
PLVAR,5
CSYS,1
NSEL,S,LOC,Y,90-A1*180/PI
NSEL,R,LOC,X,L1
NSEL,R,LOC,Z,0
*GET,DISPLACEMENT,NODE,0,NUM,MAX
NSOL,6,DISPLACEMENT,U,Y,UY,
PROD,7,6,,,DISP,,,-1,
SELTOL,1E-4
SELTOL,0.25
NSEL,S,LOC,X,L1
NSEL,R,LOC,Y,90
NSEL,R,LOC,Z,0
ESLN,S
*GET,TOPSTRESS,NODE,0,NUM,MAX
ANSOL,8,TOPSTRESS,EPEL,Y,TOPSTRESS
/OUT,NORODS
PRVAR,2,4,5,7,8
/OUT,
!***********CRACK TIP LOCATION BASED ON KNOWN GAGE LOACTIONS*************
SELTOL,1E-1
NSEL,S,LOC,X,L8
NSEL,R,LOC,Y,90-6
NSEL,R,LOC,Z,THKNSS
ESLN,S
*GET,STARTGAGE,NODE,0,NUM,MAX !TRIGGER GAGE
ANSOL,2,STARTGAGE,S,X,STARTGAGE

165
NSEL,S,LOC,X,L8
NSEL,R,LOC,Y,90-7.5
NSEL,R,LOC,Z,THKNSS
ESLN,S
*GET,STARTPROPGAGE,NODE,0,NUM,MAX !START PROP GAGE
ANSOL,3,STARTPROPGAGE,S,X,STARTPROPGAGE
SELTOL,1E-1
NSEL,S,LOC,X,L8
NSEL,R,LOC,Y,90-8.7,90-8.75
NSEL,R,LOC,Z,THKNSS
ESLN,S
*GET,QTRPROPGAGE,NODE,0,NUM,MAX !FIRST QTR OF PROP GAGE
ANSOL,4,QTRPROPGAGE,S,X,QTRPROPGAGE
NSEL,S,LOC,X,L8
NSEL,R,LOC,Y,90-10
NSEL,R,LOC,Z,THKNSS
ESLN,S
*GET,MIDPROPGAGE,NODE,0,NUM,MAX !MID PROP GAGE
ANSOL,5,MIDPROPGAGE,S,X,MIDPROPGAGE
NSEL,S,LOC,X,L8
NSEL,R,LOC,Y,90-10.625
NSEL,R,LOC,Z,THKNSS
ESLN,S
*GET,ENDQTRPROPGAGE,NODE,0,NUM,MAX !END QTR PROP GAGE
ANSOL,6,ENDQTRPROPGAGE,S,X,ENDQTRPROPGAGE
NSEL,S,LOC,X,L8
NSEL,R,LOC,Y,90-11.25
NSEL,R,LOC,Z,THKNSS
ESLN,S
*GET,ENDPROPGAGE,NODE,0,NUM,MAX !END PROP GAGE
ANSOL,7,ENDPROPGAGE,S,X,ENDPROPGAGE
NSEL,S,LOC,X,L8
NSEL,R,LOC,Y,90-14
NSEL,R,LOC,Z,THKNSS

166
ESLN,S
*GET,ENDGAGE,NODE,0,NUM,MAX !END TRIGGER
ANSOL,8,ENDGAGE,S,X,ENDGAGE
/OUT,NORODCRACKPOSIT
PRVAR,2,3,4,5,6,7
/OUT,NORODCRACKPOSIT2
PRVAR,8
/OUT