land restoration / reclamation monitoring of less than 5...
TRANSCRIPT

Land Restoration / Reclamation Monitoring of less than 5 million Cu. M. (Coal+OB) Capacity Opencast Coal Mines of Western Coalfields Limited based on Satellite Data for the Year 2014
ERAI RIVER Coal Stock BHATADI OCP
Bhatadi Village
Submitted to WESTERN COALFIELDS LIMITED

CMPDI
Job No 561410027 i
Land Restoration / Reclamation Monitoring of less than 5 million Cu. M. (Coal+OB) Capacity Opencast Coal Mines of Western Coalfields Limited based on Satellite Data for the Year 2014
March-2015
Remote Sensing Cell Geomatics Division CMPDI, Ranchi

CMPDI
Job No 561410027 ii
CONTENTS
Executive Summary iv-vii 1.0 Background 1
2.0 Objective 2
3.0 Methodology 2
4.0 Land Reclamation in WCL 6
List of Tables
Table-1 Projectwise Land Reclamation Status vii
Table-2 Area Statistics of Land Use Classes in OC Mines 8
List of Plates Plate-1 Land Use Map of of Kolegaon OCP 09
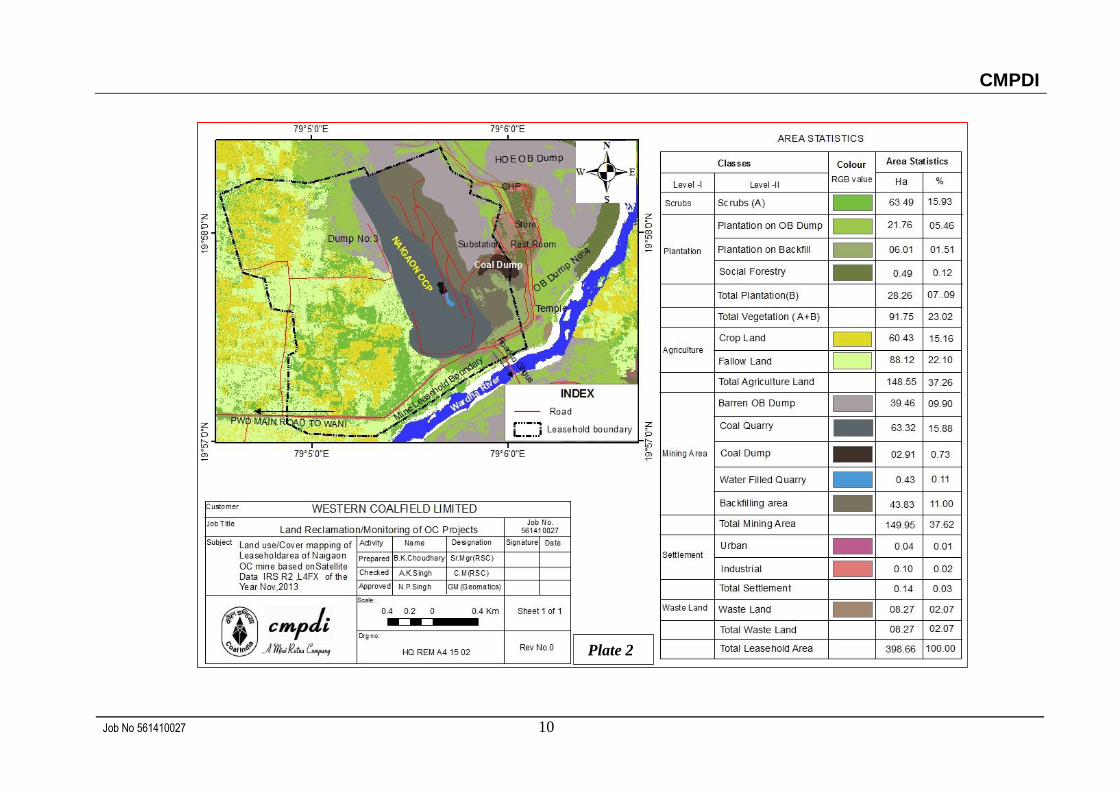
Plate -2 Land Use Map of of Naigaon OCP 10
Plate -3 Land Use Map of of Ghonsa OCP 11
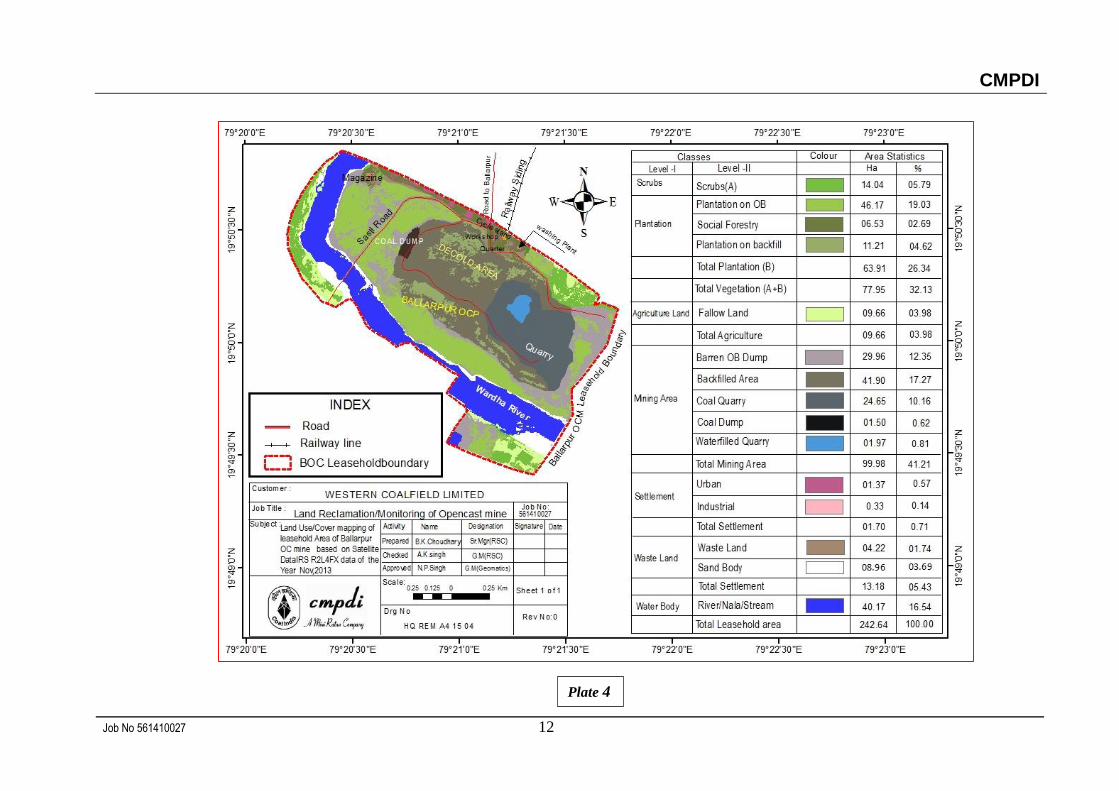
Plate -4 Land Use Map of of Ballarpur OCP 12
Plate-5 Land Use Map of of Junad OCP 13
Plate-6 Land Use Map of of Urdhan OCP 14
Plate-7 Land Use Map of of Telwasa OCP 15
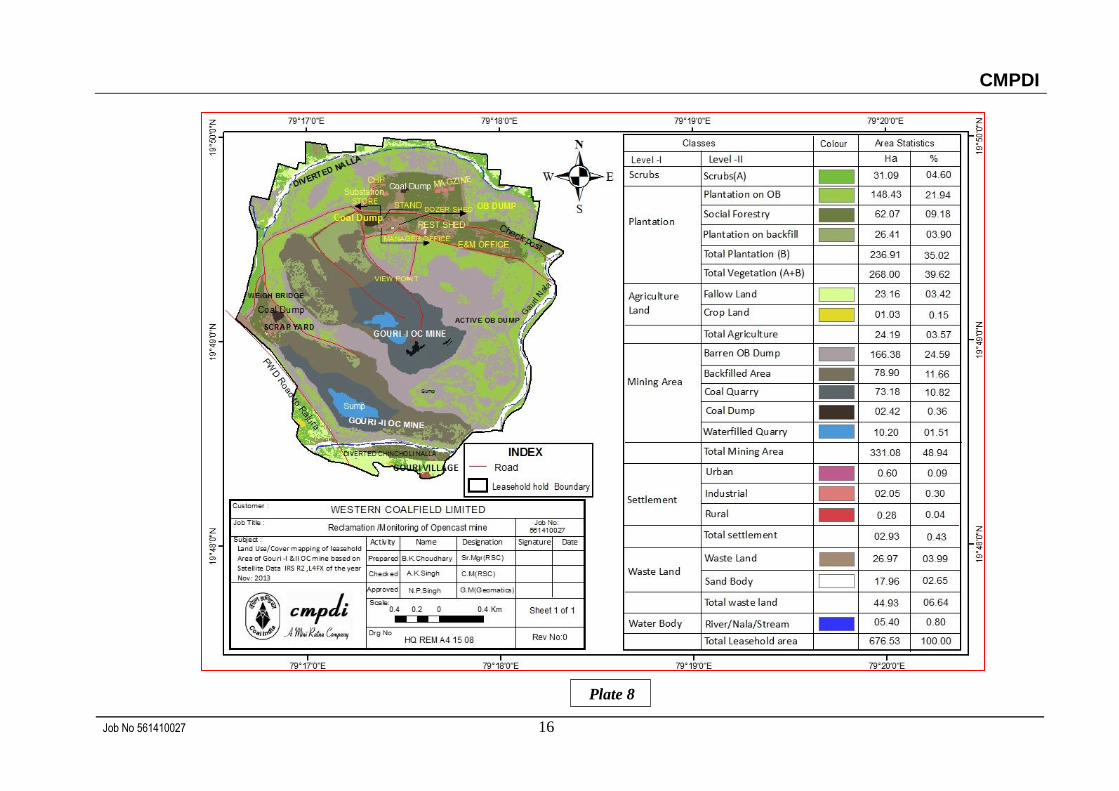
Plate-8 Land Use Map of of Gouri (I&II) OCP 16
Plate-9 Land Use Map of of Bhatadi OCP 17
Plate-10 Land Use Map of of Gondegaon OCP 18
Plate-11 Land Use Map of of Kolar-Pimpri OCP 19
Plate-12 Land Use Map of of ChhindaOCP 20
Plate-13 Land Use Map of of Gouri Deep OCP 21
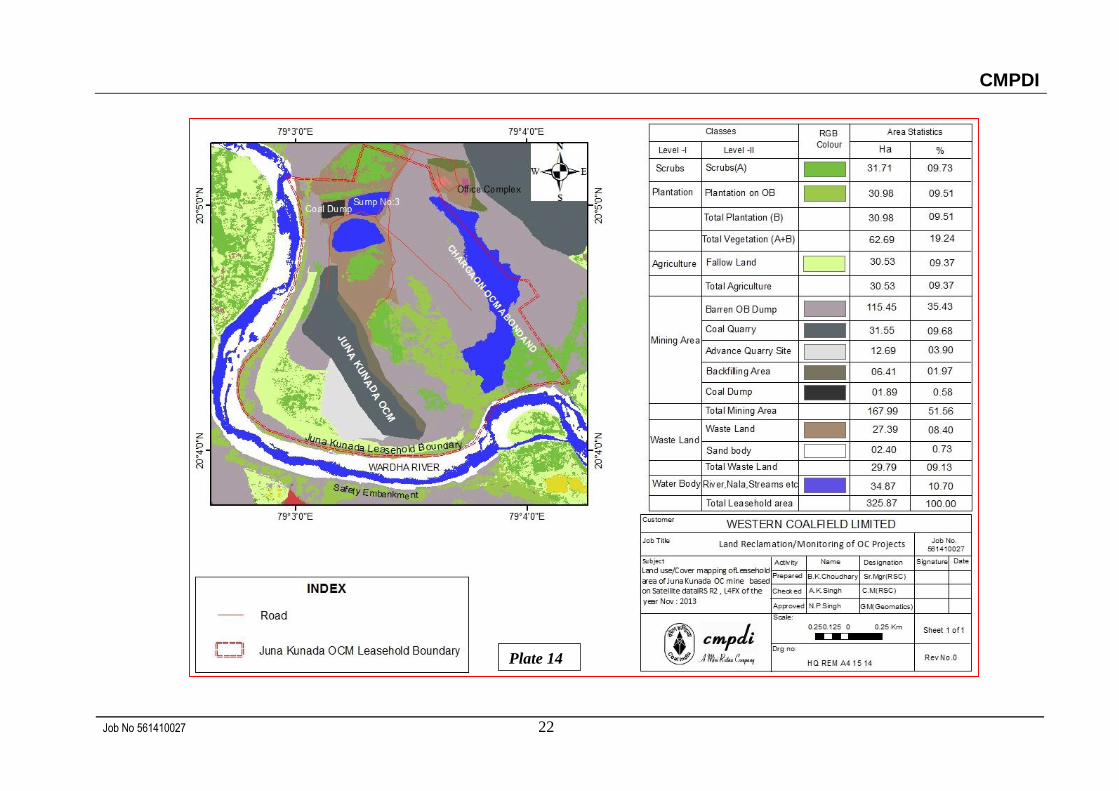
Plate- 14 Land Use Map of of Juna Kunada OCP 22
CMPDI
Job No 561410027 iii
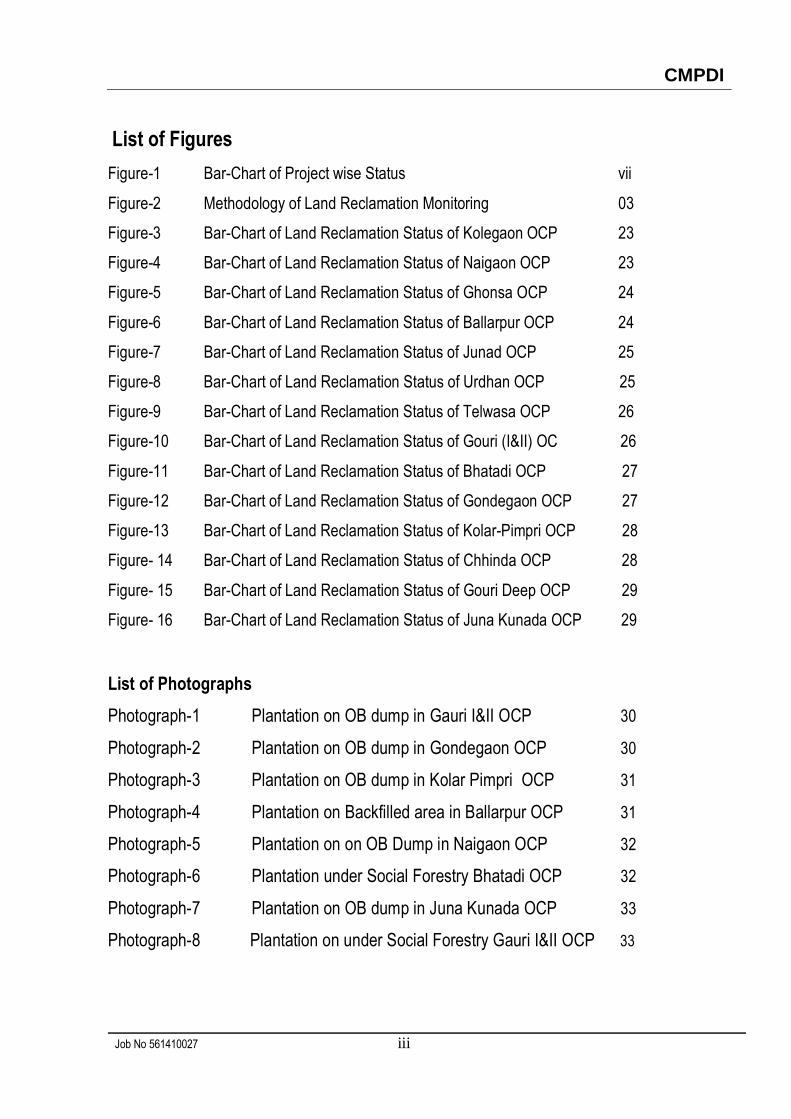
List of Figures
Figure-1 Bar-Chart of Project wise Status vii
Figure-2 Methodology of Land Reclamation Monitoring 03
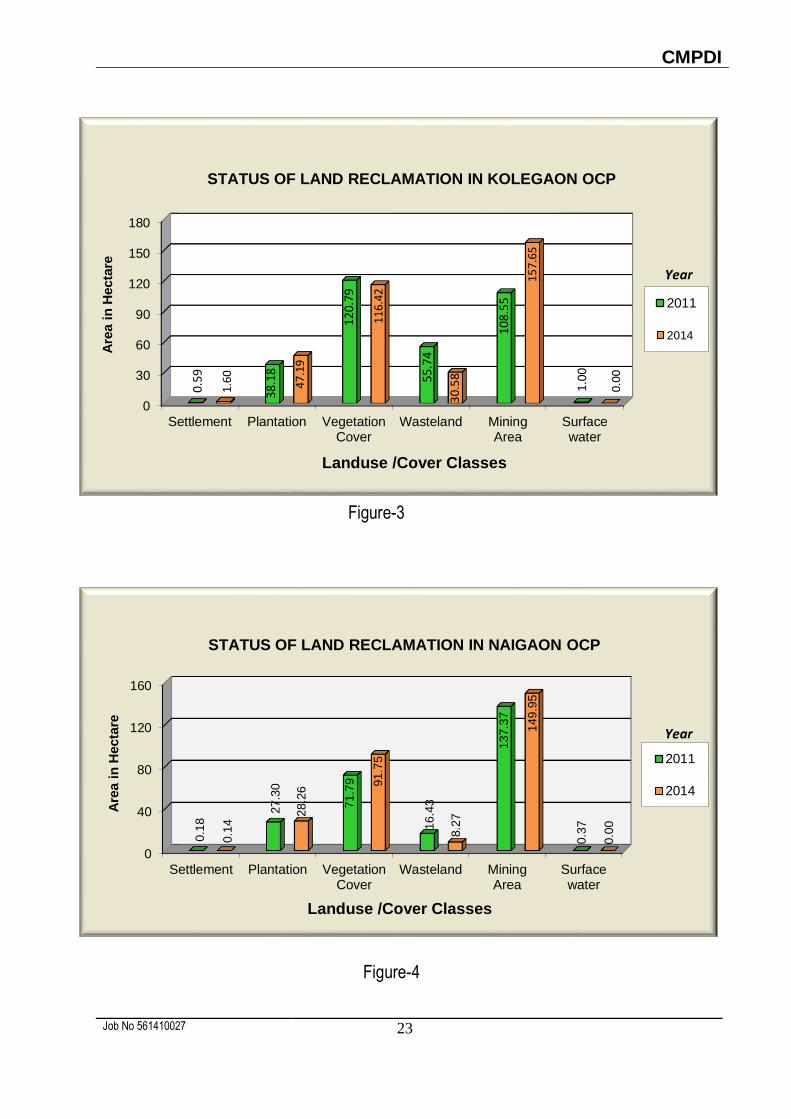
Figure-3 Bar-Chart of Land Reclamation Status of Kolegaon OCP 23
Figure-4 Bar-Chart of Land Reclamation Status of Naigaon OCP 23
Figure-5 Bar-Chart of Land Reclamation Status of Ghonsa OCP 24
Figure-6 Bar-Chart of Land Reclamation Status of Ballarpur OCP 24
Figure-7 Bar-Chart of Land Reclamation Status of Junad OCP 25
Figure-8 Bar-Chart of Land Reclamation Status of Urdhan OCP 25
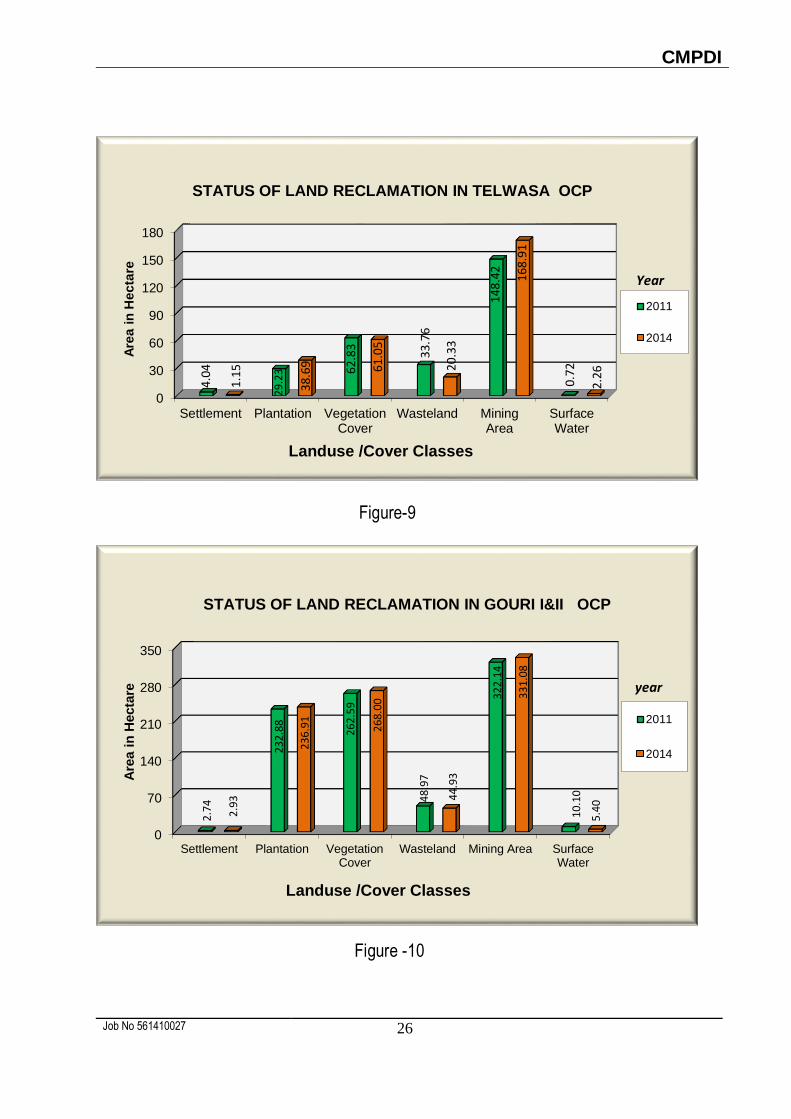
Figure-9 Bar-Chart of Land Reclamation Status of Telwasa OCP 26
Figure-10 Bar-Chart of Land Reclamation Status of Gouri (I&II) OC 26
Figure-11 Bar-Chart of Land Reclamation Status of Bhatadi OCP 27
Figure-12 Bar-Chart of Land Reclamation Status of Gondegaon OCP 27
Figure-13 Bar-Chart of Land Reclamation Status of Kolar-Pimpri OCP 28
Figure- 14 Bar-Chart of Land Reclamation Status of Chhinda OCP 28
Figure- 15 Bar-Chart of Land Reclamation Status of Gouri Deep OCP 29
Figure- 16 Bar-Chart of Land Reclamation Status of Juna Kunada OCP 29 List of Photographs
Photograph-1 Plantation on OB dump in Gauri I&II OCP 30
Photograph-2 Plantation on OB dump in Gondegaon OCP 30
Photograph-3 Plantation on OB dump in Kolar Pimpri OCP 31
Photograph-4 Plantation on Backfilled area in Ballarpur OCP 31
Photograph-5 Plantation on on OB Dump in Naigaon OCP 32
Photograph-6 Plantation under Social Forestry Bhatadi OCP 32
Photograph-7 Plantation on OB dump in Juna Kunada OCP 33
Photograph-8 Plantation on under Social Forestry Gauri I&II OCP 33

CMPDI
Job No 561410027 iv
Executive Summary
1.0 Project Land restoration / reclamation monitoring of 14 opencast coal mines of Western Coalfields Ltd. (WCL) producing less than 5 million cu.m. (Coal+OB) per year based on satellite data, regularly basis at an interval of three years.
2.0 Objective Objective of the land restoration / reclamation monitoring is to assess the area of backfilled, plantation, social forestry, active mining area, water bodies, and distribution of wasteland, agricultural land and forest in the leasehold area of the project. This will help in assessing the progressive status of mined land reclamation and to take up remedial measures, if any, required for environmental protection.
3.0 Salient Findings
Out of the total mine leasehold area of 5323.57 Hectare of the 14 projects Viz. Kolegaon, Naigaon, Ghonsa, Ballarpur, Junad Extn, Urdhan, Telwasa, Gauri I &II , Bhatadi , Gondegaon,Kolarpimpri, Chhinda ,Gauri deep and Juna kunada considered for monitoring during year-2014; total excavated area is only 2974.18 Ha (55.87%) of which 767.15 Ha area (25.79%) has been planted, 1438.73 Ha area (48.37%) is under backfilling and 768.30Ha area (25.83%) is under active mining. It is evident from the analysis that 74.17% area of the above OC projects have already been reclaimed (biologically and technically) and balance 25.83% area is under active mining. Project wise details are given in Table-1 & Fig-1.
On comparing the status of land reclamation for the year 2011 with respect to the year 2014 in different projects, it is evident from the analysis that area under land reclamation has increased from 1721.98 Ha. (Yr. 2011) to 2205.88 Ha (Yr. 2014). Out of 14 projects of WCL, maximum land reclamation has been carried out in Gauri I&II project (84.89%) followed by Ballarpur (82.84%) Urdhan (81.32%)and Kolegaon Opencast Project (78.86%).

CMPDI
Job No 561410027 v
Area under biological reclamation (plantation) has increased from 643.68 Ha (Yr. 2011) to 767.15 (Yr. 2014) where as area of technical reclamation (area under backfilling) has increased from 1078.30 Ha (Yr. 2011) to 1438.73 Ha (Yr.2014) in WCL. This increase of 123.47 Ha
in area of plantation and 360.43 Ha area under backfilling is the result of the efforts of the Western Coalfields Ltd taken up towards environmental protection.

CMPDI
Job No 561410027 vi
Table -1 Projectwise Land Reclamation Status in Opencast Project of WCL Based on Satellite Data of the Year 2014
2011 2014 2011 2014 2011 2014 2011 2014 2011 2014 2011 2014
1 Kolegaon 349.00 349.00 38.18 47.19 66.35 114.35 42.20 43.30 104.53 161.54
26.02 23.04 45.22 55.82 28.76 21.14 71.24 78.862 Naigaon 398.66 398.66 27.30 28.26 80.37 83.29 57.00 66.66 107.67 111.55
16.58 15.86 48.81 46.74 34.61 37.41 65.39 62.593 Ghonsa 293.64 293.64 0.56 3.01 59.50 55.35 45.20 48.42 60.06 58.36
0.53 2.82 56.53 51.84 42.94 45.35 57.06 54.654 Ballarpur 242.64 242.64 58.82 63.91 47.28 71.86 22.79 28.12 106.10 135.77
45.64 39.00 36.68 43.85 17.68 17.16 82.32 82.845 Junad Extn 163.64 163.64 17.98 23.96 71.25 84.13 30.52 30.71 89.23 108.09
15.01 17.26 59.50 60.61 25.49 22.13 74.51 77.876 Urdhan 315.00 315.00 0.00 3.90 55.66 66.66 8.35 16.21 55.66 70.56
0.00 4.49 86.96 76.82 13.04 18.68 86.96 81.327 Telwasa 266.00 271.91 29.23 38.69 77.61 94.98 70.81 73.93 106.84 133.67
16.45 18.64 43.69 45.75 39.86 35.61 60.14 64.398 Gauri I&II 676.53 676.53 232.88 236.91 256.44 245.28 65.70 85.80 489.32 482.19
(Amalgamated) 41.96 41.71 46.20 43.18 11.84 15.11 88.16 84.899 Bhatadi 398.66 398.66 11.74 50.64 98.15 121.68 54.96 57.04 109.89 172.32
7.12 22.08 59.54 53.05 33.34 24.87 66.66 75.1310 Gondegaon 917.00 917.00 105.57 122.47 117.44 158.24 87.61 104.84 223.01 280.71
33.99 31.77 37.81 42.44 28.20 27.19 71.80 72.8111 Kolarpimpri 508.23 508.23 89.02 89.20 125.09 156.21 121.81 122.10 214.11 245.41
26.50 24.27 37.24 42.50 36.26 33.22 63.74 66.7812 Chhinda 106.68 106.68 22.53 22.81 21.76 24.34 16.24 20.07 44.29 47.15
37.22 33.93 35.95 36.21 26.83 29.86 73.17 70.1413 Gauri Deep 356.11 356.11 0.00 5.22 0.00 40.50 0.00 24.97 0.00 45.72
0.00 7.38 0.00 57.29 0.00 35.32 0.00 64.6814 Juna Kunada 184.87 325.87 9.87 30.98 1.40 121.86 0.00 46.13 11.27 152.84
87.58 15.57 12.42 61.25 0.00 23.18 100.00 76.825176.66 5323.57 643.68 767.15 1078.30 1438.73 623.19 768.30 2345.17 2974.18 1721.98 2205.88
27.45 25.79 45.98 48.37 26.57 25.83 45.30 55.87 73.43 74.17
11.27
204.84
178.21
106.78
163.89
138.80
86.77
207.60
567.99
229.36
385.55
367.51
67.22
70.69
198.97
164.85
310.62
335.92
60.53
0.00
128.89
119.75
64.01
177.65
555.02
146.73
164.67
% Calculated in terms of Total Excavated Area in
Total (WCL)
Sl.No
NameII+IIIII+III+IVIVIIIIILeasehold(I) (Ha)
Projects Total Excavated Area Total Reclamed AreaPlantation /Vegetation Under Backfilling Active Mining
105.26

CMPDI
Job No 561410027 vii
Figure-1
0
100
200
300
400
500
600
700
800
900
1000
Kolegaon Naigaon Ghonsa Ballarpur Junad Extn Urdhan Telwasa Gauri I &II Bhatadi Gondegaon Kolarpimpri Chhinda Gauri Deep JunaKunada
349.
00 398.
66
293.
64
242.
64
163.
64
315.
00
271.
91
67
6.5
3
398.
66
91
7.0
0
508.
23
106.
68
356.
11
325.
87
204.
84
178.
21
106.
78
163.
89
138.
80 86.7
7
207.
60
567.
99
229.
36
385.
55
367.
51
67.2
2
70.
69
198.
97
161.
54
111.
55 58.3
6
135.
77
108.
09 70.5
6
133.
67
482.
19
172.
32
280.
71
24
5.4
1
47.
15
45.
72
152.
84
PROJECT WISE STATUS OF LAND RECLAMATION IN WCL FOR THE YEAR 2014
LEASEHOLD
EXCAVATED
UNDERRECLAMATION
OPENCAST PROJECTS
AR
EA IN
HEC
TAR
E
CMPDI
Job No 561410027 1
1.0 Background
1.1 Land is the most important natural resource which embodies soil, water, flora fauna
and total ecosystem. All human activities are based on the land which is the most
scarce natural resource in our country. Mining is a site specific industry and it could
not be shifted anywhere else from the location where mineral occurs. It is a fact that
surface mining activities do effect the land environment due to ground breaking.
Therefore, there is an urgent need to reclaim and restore the mined out land for its
productive use for sustainable development of mining. This will not only mitigate
environmental degradation, but would also help in creating a more congenial
environment for land acquisition by coal companies in future.
1.2 Keeping above in view, Coal India Ltd. (CIL) issued a work order vide letter no.
CIL/WBP/Env/2011/4706 dated 12.10.12 to Central Mine Planning & Design
Institute (CMPDI), Ranchi, for monitoring land reclamation status of all the opencast
coal mines having production of less than 5 million m3 per annum (coal + OB taken
together per annum) regularly on annual basis and less than 5 million m3 per annum
(coal + OB taken together per annum) at interval of three years based on remote
sensing satellite data, for sustainable development of mining. The result of land
reclamation status of all such mines to be put on the website of CIL,
(www.coalindia.in), CMPDI (www.cmpdi.co.in) and the concerned coal companies
in public domain. Detail report to be submitted to Coal India and respective
subsidiaries.
1.3 Land reclamation monitoring of all opencast coal mining projects would also comply
the statutory requirements of Ministry of Environment & Forest (MoEF).Such
monitoring would not only facilitate in taking timely mitigation measures against
environmental degradation, but would also enable coal companies to utilize the
reclaimed land for larger socio-economic benefits in a planned way.

CMPDI
Job No 561410027 2
1.4 Present report is embodying the finding of the study based on satellite data of the
Nov , 2013 and July 2014 carried out for all the OC projects producing less than 5
mcm (Coal+OB) for Western Coalfields Ltd.
2.0 Objective
Objective of the land reclamation/restoration monitoring is to assess the area of
backfilled, plantation, OB dumps, social forestry, active mining area, settlements
and water bodies, distribution of wasteland, agricultural land and forest land in the
leasehold area of the project. This is an important step taken up for assessing the
progressive status of mined land reclamation and for taking up remedial measures,
if any, required for environmental protection.
3.0 Methodology
There are number of steps involved between raw satellite data procurement and
preparation of final map. National Remote Sensing Centre (NRSC) Hyderabad,
being the nodal agency for satellite data supply in India, provides only raw digital
satellite data, which needs further digital image processing for extracting the
information and map preparation before uploading the same in the website.
Methodology for land reclamation monitoring is given in given in figure-2. Following
steps are involved in land reclamation /restoration monitoring:

CMPDI
Job No 561410027 3
Figure :2 Methodology for Land Reclamation Monitoring
3.1 Data Procurement: After browsing the data quality and date of pass on internet,
supply order for data is placed to NRSC. Secondary data like leasehold boundary,
topo sheets are procured for creation of vector database.
3.2 Satellite Data Processing: Satellite data are processed using ERDAS IMAGINE
version 2014digital image processing s/w. Methodology involves the following major
steps:
Rectification & Georeferencing: Inaccuracies in digital imagery may occur due to
‘systematic errors’ attributed to earth curvature and rotation as well as ‘non-
systematic errors’ attributed to satellite receiving station itself. Raw digital images
contain geometric distortions, which make them unusable as maps. Therefore,
georeferencing is required for correction of image data using ground control points
(GCP) to make it compatible to SoI toposheet.
IRS R2 L4 FX

CMPDI
Job No 561410027 4
Image enhancement:
To improve the interpretability of the raw data, image enhancement is necessary.
local operations modify the value of each pixel based on brightness value of
neighbouring pixels using ERDAS IMAGINE 2014 s/w. and enhance the image
quality for interpretation.
Training set selection
Training set requires to be selected, so that software can classify the image data
accurately. The image data are analysed based on the interpretation keys. These
keys are evolved from certain fundamental image-elements such as tone/colour,
size, shape, texture, pattern, location, association and shadow. Based on the
image-elements and other geo-technical elements like land form, drainage pattern
and physiography; training sets were selected/identified for each land use/cover
class. Field survey was carried out by taking selective traverses in order to collect
the ground information (or reference data) so that training sets are selected
accurately in the image. This was intended to serve as an aid for classification.
Classification and Accuracy assessment
Image classification is carried out using the maximum likelihood algorithm. The
classification proceeds through the following steps: (a) calculation of statistics [i.e.
signature generation] for the identified training areas, and (b) the decision boundary
of maximum probability based on the mean vector, variance, covariance and
correlation matrix of the pixels. After evaluating the statistical parameters of the
training sets, reliability test of training sets is conducted by measuring the statistical
separation between the classes that resulted from computing divergence matrix.
The overall accuracy of the classification was finally assessed with reference to
ground truth data.

CMPDI
Job No 561410027 5
Area calculation
The area of each land use class in the leasehold is determined using ERDAS
IMAGINE v. 2014 software.
Overlay of Vector data base
Vector data base created based on secondary data. Vector layer like drainage,
railway line, leasehold boundary, forest boundary etc. are superimposed on the
image as vector layer in the Arc GIS database.
Pre-field map preparation
Pre-field map is prepared for validation of the classification result
3.3 Ground Truthing:
Selective ground verification of the land use classes are carried out in the field and
necessary corrections if required, are incorporated before map finalization.
3.4 Land reclamation database on GIS:
Land reclamation database is created on GIS platform to identify the temporal
changes identified from satellite data of different cut-of dates.

CMPDI
Job No 561410027 6
4.0 Land Reclamation Status in Western Coalfields Ltd.
4.1 Following Fourteen opencast projects producing less than 5 million cubic m. (Coal
+ OB together) of Western Coalfields Ltd. have been taken up for land reclamation
monitoring during the year 2014:
Kolegaon
Naigaon
Ghonsa
Ballarpur
Junad
Urdhan
Telwasa
Gauri I&II (Amalgamated)
Bhatadi
Gondegaon
Kolarpimpri
Chhinda
Gouri Deep
Juna Kunda
4.2 Area statistics of different land use class present in the mine leasehold of the above
projects for the year 2014 are shown in the Table - 2. Land use maps derived from
satellite data are shown in Plate 1 – 14. Land reclamation status of the above
mentioned 14 opencast projects were also prepared for the year 2011and 2014.
Year wise changes in the different land use classes based on satellite data are
depicted in Bar Charts in Fig. 3 - 16
4.3 Study reveals that 74.17% of mining area has already been under reclamation by
WCL out of which 25.79% area has been revegetated and 48.37% area is under
backfilling. There is an increase of 483.90 Hectare area under reclamation in WCL

CMPDI
Job No 561410027 7
with respect to the year 2011, out of which 123.47 Hectare increase in biological
reclamation (plantation) and 360.43 Hectare increase in the technical reclamation
(backfilling). However, overall percentage of plantation / vegetation has decreased
from 27.45 % in 2011 to 25 .79% in 2014 due to increase in mining activity as some
of the mines such as Gouri Deep , Juna Kunada, Urdhan etc., which were not in
operation in the year 2011 .
4.4 After analyzing the satellite data of year 2011 vs. 2014 it is evident that plantation
carried out on backfilled area, OB dumps as well as under social forestry in all the
mines of WCL has increased from 643.68 Hectare to767.15 Hectare in span of last
three year. This increase of 123.47 Hectare area of plantation in three year time is
due to the sincere efforts of WCL towards mine land reclamation.
4.5 Out of 14 projects of WCL, maximum land reclamation has been carried out in Gauri
I&II opencast project (84.89)% followed by Ballarpur(82.84)%, Urdhan
(81.32%) and Kolegaon opencast project (78.86)%.

CMPDI
Job No 561410027 8
Area % Area % Area % Area % Area % Area % Area % Area % Area % Area % Area % Area % Area % Area % Area %
Dense Forest 0.00 0.00 0.00 0.00 0.00 0.00 0.00 0.00 0.00 0.00 0.00 0.00 0.00 0.00 0.00 0.00 0.00 0.00 0.00 0.00 0.00 0.00 0.00 0.00 0.00 0.00 0.00 0.00 0.00 0.00
Open Forest 0.00 0.00 0.00 0.00 9.21 3.14 0.00 0.00 0.00 0.00 21.50 6.83 0.00 0.00 0.00 0.00 0.00 0.00 0.00 0.00 0.00 0.00 0.00 0.00 0.00 0.00 0.00 0.00 30.71 0.58
Total Forest 0.00 0.00 0.00 0.00 9.21 3.14 0.00 0.00 0.00 0.00 21.50 6.83 0.00 0.00 0.00 0.00 0.00 0.00 0.00 0.00 0.00 0.00 0.00 0.00 0.00 0.00 0.00 0.00 30.71 0.58
Scrubs 69.23 19.84 63.49 15.93 54.09 18.42 14.04 5.79 6.44 3.93 89.93 28.55 22.36 8.22 31.09 4.60 38.86 9.74 173.31 18.90 47.55 9.36 8.01 7.51 74.86 21.02 31.71 9.73 724.97 13.62
Social Forestry 10.82 3.10 0.49 0.12 0.54 0.19 6.53 2.69 5.20 3.18 0.40 0.14 5.12 1.88 62.07 9.18 38.78 9.73 82.01 8.94 6.31 1.24 2.80 2.63 0.90 0.25 0.00 0.00 221.97 4.17
Plantation on OB Dump 36.37 10.42 21.76 5.46 2.47 0.84 46.17 19.03 18.41 11.25 3.50 1.11 30.73 11.30 148.43 21.94 11.86 2.98 40.46 4.41 82.89 16.31 20.01 18.75 4.32 1.21 30.98 9.51 498.36 9.36
Plantation on Backfill 0.00 0.00 6.01 1.51 0.00 0.00 11.21 4.62 0.35 0.21 0.00 0.00 2.84 1.04 26.41 3.90 0.00 0.00 0.00 0.00 0.00 0.00 0.00 0.00 0.00 0.00 0.00 0.00 46.82 0.88
Total Plantation (Biological Reclamation) 47.19 13.52 28.26 7.09 3.01 1.03 63.91 26.34 23.96 14.64 3.90 1.25 38.69 14.22 236.91 35.02 50.64 12.71 122.47 13.35 89.20 17.55 22.81 21.38 5.22 1.46 30.98 9.51 767.15 14.41
Total Vegetation 116.42 33.36 91.75 23.02 66.31 22.59 77.95 32.13 30.40 18.57 115.33 36.63 61.05 22.44 268.00 39.62 89.50 22.45 295.78 32.25 136.75 26.91 30.82 28.89 80.08 22.48 62.69 19.24 1522.83 28.61
Coal Quarry 35.93 10.30 63.32 15.88 41.60 14.17 24.65 10.16 29.39 17.96 10.57 3.35 63.64 23.41 73.18 10.82 51.17 12.84 89.47 9.76 71.33 14.03 17.18 16.10 17.15 4.83 31.55 9.68 620.13 11.65
Coal Dump 3.61 1.04 2.91 0.73 1.56 0.53 1.50 0.62 0.98 0.60 4.44 1.41 3.44 1.27 2.42 0.36 2.75 0.69 7.13 0.78 2.38 0.47 0.00 0.00 1.30 0.37 1.89 0.58 36.31 0.68
Advance Quarry Site 3.22 0.92 0.00 0.00 0.00 0.00 0.00 0.00 0.00 0.00 0.00 0.00 0.00 0.00 0.00 0.00 2.13 0.53 6.26 0.68 5.29 1.04 0.00 0.00 6.52 1.83 12.69 3.90 36.11 0.68
Quarry Filled With Water 0.54 0.16 0.43 0.11 5.26 1.79 1.97 0.81 0.34 0.21 1.20 0.38 6.85 2.52 10.20 1.51 0.99 0.25 1.98 0.22 43.10 8.48 2.89 2.71 0.00 0.00 0.00 0.00 75.75 1.42
Total Area under Active Mining 43.30 12.42 66.66 16.72 48.42 16.49 28.12 11.59 30.71 18.77 16.21 5.14 73.93 27.20 85.80 12.69 57.04 14.31 104.84 11.44 122.10 24.02 20.07 18.81 24.97 7.03 46.13 14.16 768.30 14.43
Barren OB Dump 114.35 32.76 39.46 9.90 39.24 13.36 29.96 12.35 80.63 49.28 66.66 21.16 49.40 18.17 166.38 24.59 105.41 26.44 130.78 14.26 140.85 27.71 24.34 22.81 40.50 11.37 115.45 35.43 1143.41 21.48
Barren Backfilled Area 0.00 0.00 43.83 11.00 16.11 5.48 41.90 17.27 3.50 2.14 0.00 0.00 45.58 16.73 78.90 11.66 16.27 4.08 27.46 2.99 15.36 3.02 0.00 0.00 0.00 0.00 6.41 1.97 295.32 5.55
Total Area under Technical Reclamation 114.35 32.76 83.29 20.90 55.35 18.84 71.86 29.62 84.13 51.42 66.66 21.16 94.98 34.90 245.28 36.25 121.68 30.52 158.24 17.25 156.21 30.73 24.34 22.81 40.50 11.37 121.86 37.40 1438.73 27.03
Total Area Under Mine Operation 157.65 45.18 149.95 37.62 103.77 35.33 99.98 41.21 114.84 70.19 82.87 26.30 168.91 62.10 331.08 48.94 178.72 44.83 263.08 28.69 278.31 54.75 44.41 41.62 65.47 18.40 167.99 51.56 2207.03 41.46
Waste Lands 27.97 8.02 8.27 2.07 7.94 2.71 4.22 1.74 10.73 6.56 23.72 7.53 14.94 5.50 26.97 3.99 30.31 7.60 42.61 4.65 10.47 2.06 2.83 2.65 12.88 3.62 27.39 8.40 251.25 4.72
Fly Ash Pond / Sand Body 2.61 0.75 0.00 0.00 0.00 0.00 8.96 3.69 0.00 0.00 0.00 0.00 5.39 1.98 17.96 2.65 0.00 0.00 0.00 0.00 0.00 0.00 0.41 0.38 1.33 0.37 2.40 0.73 39.06 0.73
Total Wasteland 30.58 8.77 8.27 2.07 7.94 2.71 13.18 5.43 10.73 6.56 23.72 7.53 20.33 7.48 44.93 6.64 30.31 7.60 42.61 4.65 10.47 2.06 3.24 3.03 14.21 3.99 29.79 9.13 290.31 5.45
Reservoir, nallah, ponds 0.00 0.00 0.00 0.00 0.00 0.00 40.17 16.54 0.00 0.00 0.00 0.00 2.26 0.86 5.40 0.80 0.00 0.00 1.30 0.14 4.69 0.93 1.46 1.37 2.66 0.75 34.87 10.70 92.81 1.74
Total Waterbodies 0.00 0.00 0.00 0.00 0.00 0.00 40.17 16.54 0.00 0.00 0.00 0.00 2.26 0.86 5.40 0.80 0.00 0.00 1.30 0.14 4.69 0.93 1.46 1.37 2.66 0.75 34.87 10.70 92.81 1.74
Crop Lands 12.90 3.69 60.43 15.16 56.06 19.09 0.00 0.00 0.00 0.00 3.08 0.98 0.00 0.00 1.03 0.15 0.15 0.04 53.46 5.83 13.44 2.64 14.19 13.30 18.78 5.27 0.00 0.00 233.52 4.39
Fallow Lands 29.85 8.55 88.12 22.10 56.35 19.19 9.66 3.98 7.26 4.42 86.45 27.44 18.21 6.70 23.16 3.42 95.86 24.05 250.37 27.30 58.91 11.60 10.51 9.85 173.96 48.85 30.53 9.37 939.20 17.64
Total Agriculture 42.75 12.24 148.55 37.26 112.41 38.28 9.66 3.98 7.26 4.42 89.53 28.42 18.21 6.70 24.19 3.57 96.01 24.09 303.83 33.13 72.35 14.24 24.70 23.15 192.74 54.12 30.53 9.37 1172.72 22.03
Urban Settlement 0.47 0.13 0.04 0.01 1.63 0.55 1.37 0.57 0.09 0.06 0.66 0.21 0.82 0.30 0.60 0.09 2.85 0.71 4.65 0.52 0.81 0.16 1.25 1.17 0.76 0.21 0.00 0.00 16.00 0.30
Rural Settlement 0.00 0.00 0.00 0.00 0.00 0.00 0.00 0.00 0.00 0.00 1.84 0.58 0.00 0.00 0.28 0.04 0.00 0.00 4.98 0.54 3.11 0.61 0.80 0.77 0.00 0.00 0.00 0.00 11.01 0.21
Industrial Settlement 1.13 0.32 0.10 0.02 1.58 0.54 0.33 0.14 0.32 0.20 1.05 0.33 0.33 0.12 2.05 0.30 1.27 0.32 0.77 0.08 1.74 0.34 0.00 0.00 0.19 0.05 0.00 0.00 10.86 0.20
Total Settlement 1.60 0.45 0.14 0.03 3.21 1.09 1.70 0.71 0.41 0.26 3.55 1.12 1.15 0.42 2.93 0.43 4.12 1.03 10.40 1.14 5.66 1.11 2.05 1.94 0.95 0.26 0.00 0.00 37.87 0.71
Grand Total 349.00 100.00 398.66 100.00 293.64 100.00 242.64 100.00 163.64 100.00 315.00 100.00 271.91 100.00 676.53 100.00 398.66 100.00 917.00 100.00 508.23 100.00 106.68 100.00 356.11 100.00 325.87 100.00 5323.57 100.00
TABLE - 2
Bhatadi Gondegaon Kolar-Pimpri Chhinda Gouri DeepKolagaon Naigaon Ghonsa
(Area in Hq.)
Status of Land Use / Reclamation in OC Mines(<5mcu.m) of Western Coalfields Ltd based on Satellite data of the Year 2014
TotalUrdhan Telwasa Gouri -I&II Juna KunadaS
ET
TL
EM
EN
TS
AC
TIV
E M
ININ
GR
EC
LA
IME
DW
AS
TE
LA
ND
SW
AT
ER
BO
DIE
SA
GR
ICU
LT
UR
EF
OR
ES
TS
SC
RU
BS
PL
AN
TA
TIO
NBallarpur Junad Extn

CMPDI
Job No 561410027 9
Plate -1
CMPDI
Job No 561410027 10
Plate 2

CMPDI
Job No 561410027 11
Plate 3
CMPDI
Job No 561410027 12
Plate 4

CMPDI
Job No 561410027 13
Plate 5

CMPDI
Job No 561410027 14
Plate 6

CMPDI
Job No 561410027 15
Plate 7
CMPDI
Job No 561410027 16
Plate 8

CMPDI
Job No 561410027 17
Plate 9

CMPDI
Job No 561410027 18
Plate 10

CMPDI
Job No 561410027 19
Plate 11

CMPDI
Job No 561410027 20
Plate 12

CMPDI
Job No 561410027 21
Plate 13
CMPDI
Job No 561410027 22
Plate 14
CMPDI
Job No 561410027 23
Figure-3
Figure-4
0
30
60
90
120
150
180
Settlement Plantation VegetationCover
Wasteland MiningArea
Surfacewater
0.59
38.1
8
120.
79
55.7
4
108.
55
1.00
1.60 47
.19
116.
42
30
.58
157.
65
0.00
Are
a i
n H
ecta
re
Landuse /Cover Classes
STATUS OF LAND RECLAMATION IN KOLEGAON OCP
2011
2014
Year
0
40
80
120
160
Settlement Plantation VegetationCover
Wasteland MiningArea
Surfacewater
0.1
8
27.3
0
71.7
9
16.4
3
137.3
7
0.3
7
0.1
4
28.2
6
91.7
5
8.2
7
149.9
5
0.0
0
Are
a i
n H
ecta
re
Landuse /Cover Classes
STATUS OF LAND RECLAMATION IN NAIGAON OCP
2011
2014
Year

CMPDI
Job No 561410027 24
Figure-5
Figure-6
0
40
80
120
Settlement Plantation VegetationCover
Wasteland MiningArea
Surfacewater
1.3
0
0.5
6 42.7
0
13.5
4
104.7
0
0.0
0
3.2
1
3.0
1
66.3
1
7.9
4
103.7
7
0.0
0
Are
a i
n H
ecta
re
Landuse /Cover Classes
STATUS OF LAND RECLAMATION IN GHONSA OCP
2011
2014
Year
0
20
40
60
80
100
Plantation VegetationCover
Wasteland Mining Area SurfaceWater
58.8
2
88.9
3
6.3
5
70.0
7
36.5
7
63.9
1 77.9
5
13.1
8
99.9
8
40.1
7
Are
a i
n H
ecta
re
Landuse /Cover Classes
STATUS OF LAND RECLAMATION IN BALLARPUR OCP
2011
2014
Year

CMPDI
Job No 561410027 25
Figure -7
Figure-8
0
20
40
60
80
100
120
Settlement Plantation VegetationCover
Wasteland MiningArea
SurfaceWater
1.4
5
0
116.5
7
34.8
5
64.0
1
0.0
3
3.5
5
3.9
0
115.3
3
23.7
2
82.8
7
0.0
0
Are
a i
n H
ecta
re
Landuse /Cover Classes
STATUS OF LAND RECLAMATION IN URDHAN OCP
2011
2014
Year
0
20
40
60
80
100
120
Settlement Plantation Vegetationcover
Wasteland Mining Area WaterBody
0.5
1
17.9
8
27.4
3
3.2
8
101.7
7
0.1
7
0.4
1
23.9
6
30.4
0
10.7
3
114.8
4
0.0
0
Are
a i
n H
ecta
re
Landuse /Cover Classes
STATUS OF LAND RECLAMATION IN JUNAD OCP
2011
2014
Year
CMPDI
Job No 561410027 26
Figure-9
Figure -10
0
30
60
90
120
150
180
Settlement Plantation VegetationCover
Wasteland MiningArea
SurfaceWater
4.04
29.2
3 62.8
3
33.7
6
148.
42
0.72
1.15
38.6
9 61.0
5
20.3
3
168.
91
2.26
Are
a i
n H
ec
tare
Landuse /Cover Classes
STATUS OF LAND RECLAMATION IN TELWASA OCP
2011
2014
Year
0
70
140
210
280
350
Settlement Plantation VegetationCover
Wasteland Mining Area SurfaceWater
2.74
232.
88 262
.59
48.
97
322.
14
10.1
0
2.9
3
236
.91
268
.00
44.
93
331
.08
5.40
Are
a i
n H
ecta
re
Landuse /Cover Classes
STATUS OF LAND RECLAMATION IN GOURI I&II OCP
2011
2014
year

CMPDI
Job No 561410027 27
Figure -11
Figure -12
0
30
60
90
120
150
180
Settlement Plantation VegetationCover
wasteland Mining Area
4.62 11
.74
52.1
3 30.3
2
153.
11
4.12 50
.64
89.5
0
30.3
1
178.
72
Are
a i
n H
ecta
re
Landuse /Cover Classes
STATUS OF LAND RECLAMATION IN BHATADI OCP
2011
2014
Year
0
50
100
150
200
250
300
Settlement Plantation VegetationCover
Wasteland MiningArea
WaterBody
11.0
7
105
.57
267
.65
46.
26
205
.05
0.0010.
40 122.
47
295
.78
42.
61
263
.08
1.3
0
Are
ain
Hecta
re
Landuse /Cover Classes
STATUS OF LAND RECLAMATION IN GONDEGAON OCP
2011
2014
Year

CMPDI
Job No 561410027 28
Figure -13
Figure -14
0
50
100
150
200
250
300
Settlement Plantation VegetationCover
Wasteland MiningArea
Surfacewater
4.06 89
.02 13
7.09
10.0
5
246.
90
1.21
5.66 89
.20 13
6.75
10.4
7
278.
31
4.69
Are
a i
n H
ecta
re
Landuse /Cover Classes
STATUS OF LAND RECLAMATION IN KOLARPIMPRI OCP
2011
2014
Year
0
15
30
45
60
Settlement Plantation VegetationCover
Wasteland MiningArea
Surfacewater
1.8
6 22.5
3 31.6
4
1.4
4
38.0
0
1.8
2
2.0
5 22.8
1 30.8
2
3.2
4
44.4
1
1.4
6
Are
a i
n H
ecta
re
Landuse /Cover Classes
STATUS OF LAND RECLAMATION IN CHHINDA OCP
2011
2014
Year

CMPDI
Job No 561410027 29
Figure -15
Figure -16
0
20
40
60
80
100
120
Settlement Plantation VegetationCover
Wasteland MiningArea
Surfacewater
0.0
0
0.0
0
96.7
3
10.4
4
0.0
0
0.5
9
0.9
5
5.2
2
80
.88
14
.21
65
.47
2.6
6
Are
a i
n H
ecta
re
Landuse /Cover Classes
STATUS OF LAND RECLAMATION IN GOURI DEEP OCP
2011
2014
Year
0
30
60
90
120
150
180
Settlement Plantation VegetationCover
Wasteland Mining Area
0.0
0 9.8
7 26.7
0
1.7
2
1.4
0
0.0
0
30.9
8
62.6
9
29.7
9
167.9
9
Are
a i
n H
ecta
re
Landuse /Cover Classes
STATUS OF LAND RECLAMATION IN JUNA KUNADA OCP
2011
2014
Year

CMPDI
Job No 561410027 30
Photograph 1- Plantation on OB carried out in Gouri I&II OCP
Photograph 2- Plantation on OB carried out in Gondegaon OCP

CMPDI
Job No 561410027 31
Photograph 3- Plantation on OB carried out in Kolarpimpri OCP
Photograph 4- Plantation on backfilled area in Ballarpur OCP

CMPDI
Job No 561410027 32
Photograph 5- Plantation on OB carried out in Naigaon OCP
Photograph 6- Plantation carried out under Social forestry in Bhatadi OCP

CMPDI
Job No 561410027 33
Photograph 7- Plantation on OB carried out in Juna Kunada OCP
Photograph 8- Plantation carried out under Social Forestry Gauri I&II OCP

Central Mine Planning & Design Institute Ltd.
(A Subsidiary of Coal India Ltd.)
Gondwana Place, Kanke Road, Ranchi 834031, Jharkhand
Phone : (+91) 651 2230001, 2230002, 2230483, FAX (+91)
651 2231447, 2231851
Wesite : www.cmpdi.co.in, Email : [email protected]