lane closure charts chart development and delay damages (district 3) objective to become familiar...
TRANSCRIPT

LANE CLOSURE CHARTS
CHART DEVELOPMENT AND
DELAY DAMAGES (District 3)
OBJECTIVE To become familiar with the lane
closure chart development process and delay calculation

PURPOSE
To minimize traffic delays caused by planned lane closures.
To maximize safety inside and outside the work zone.
To create a level playing field for all Contractors bidding on our projects.

FACTS
Charts are developed using the latest available traffic volumes.
The basic theory in developing the charts is based on actual field operation experience.
Each project is analyzed to balance the needs between the Contractor and the motoring public.

FACTS (CONT.)
We perform field observations and consult with field personnel to determine the length of time required for specific construction or maintenance operations.
We always try to accommodate your request within our limited boundary.

FREEWAY CAPACITY
Typically one lane can handle between 1800 - 2000 vph.
Capacity is affected by geometric alignments, lane width, truck volume, weather, # of lanes open for traffic to use and “GAWKING “ (type of operation ).

2 3 & 4 4
1 2 3
Type of Operation:
1- Median Barrier or MBGR Repair 1500 vph 3200 vph 4800 vph
2- Pavement repair, mudjacking, pavement grooving 1400 vph 3000 vph 4500 vph
3- Striping, resurfacing, slide removal 1200 vph 2400 vph 4000 vph
4- Pavement markers installation 1100 vph 2400 vph 3600 vph
5- Middle lanes --- for any reason ---- 2200 vph 3400 vphInformation derived from Freeway Operations Dept -- Report No. 69-3
Number Of Lanes Open in One Direction
Number Of Lanes in One Direction Of Travel (Normal Operation)
FREEWAY CAPACITY RATES FOR SOME TYPICAL OPERATIONS

Chart is based on “0” delay for construction and permit projects, and 5 -15 minutes Delay for maintenance work.
When demand is less than capacity, the freeway lane is permitted to be closed.
We use an average capacity of 1500 vph per lane for construction and permit projects (can vary 1200-2000 depending on location, conditions, etc.).
Lane closure charts are based on traffic demand, therefore, we specify number of lanes that are required to OPEN for public to use, not the number of lanes that can be closed.
Lane Closure Chart Background

LANE CLOSURE CHART
For a typical 5 lane freeway :
Demand < 1500, 1 lane is required to be open.
1500 <Demand< 3000, 2 lanes are required.
3000 <Demand< 4500, 3 lanes are required.
4500 <Demand< 6000, 4 lanes are required.
Lane Closure hours for the “Working day before designated legal holiday” is the same as a Friday, except no work will be permitted after the morning closure.
“No lane closure permitted”; no work permitted on any designated legal holidays.

ROUTE - 5 DIRECTION: SOUTHBOUNDCount Station 803 (B) : I-5 / JUNCTION ROUTE 805
TIME MON TUES WED THURS FRI SAT SUN8-Jul 9-Jul 10-Jul 11-Jul 12-Jul 13-Jul 14-Jul
0-1 1148 1071 944 1018 1669 1760 17931-2 669 602 554 633 829 1137 11972-3 429 415 386 396 609 764 9503-4 397 359 327 389 476 482 6804-5 914 793 771 857 825 661 4875-6 3120 3128 3020 3136 2807 1494 9946-7 8106 8243 8086 8210 6857 2999 17907-8 11272 10997 11013 11183 9462 4701 27888-9 10713 11574 11470 11498 9799 7268 42429-10 9789 9341 10107 9564 8998 8664 591510-11 7864 9531 9122 8638 9244 9062 757511-12 7571 8417 8550 8563 8789 8714 793912-13 8042 8141 7740 7929 9261 8163 793013-14 7593 8363 8081 9193 9034 8855 789514-15 7859 8000 8197 8309 8679 8986 745915-16 9599 10288 9933 9966 9736 9178 716616-17 8337 9733 9250 9358 9296 8944 762717-18 8150 9440 9117 9115 8046 8633 727418-19 6868 7893 7758 7357 8313 7454 679819-20 4190 5167 5010 5424 6419 6062 557020-21 3180 3869 3648 3960 5166 4650 494021-22 2657 3124 3173 3692 4834 4478 427222-23 1990 2245 2451 2962 4338 4361 322823-24 1256 1514 1676 1768 3217 2861 2143
Total 131713 142248 140384 143118 146703 130331 108652

LANE CLOSURE CHART EXERCISE


Chart No. 1Lane Requirements and Hours of Work
Direction: Southbound SD-5 Location: North of JCT RTE 805
a.m. p.m.
FROM HOUR TO HOUR 12 1 2 3 4 5 6 7 8 9 10 11 12 1 2 3 4 5 6 7 8 9 10 11 12Mondays through Thursdays
Fridays
Saturdays
Sundays
Day before designated legal holiday
Designated legal holidays
Legend:1 Provide at least one through freeway lane open in direction of travel (Demand < 1500 )
2 Provide at least two through freeway lanes open in direction of travel (1500 < Demand < 3000)
3 Provide at least three through freeway lanes open in direction of travel(3000 < Demand < 4500)
4 Provide at least four through freeway lanes open in direction of travel (4500 < Demand < 6000)
No lane closure permitted
REMARKS:
7-107-127-137-14

ROUTE - 5 DIRECTION: SOUTHBOUND5Count Station 803 (B) : I-5 / JUNCTION ROUTE 805
TIME MON TUES WED THURS FRI SAT SUN8-Jul 9-Jul 10-Jul 11-Jul 12-Jul 13-Jul 14-Jul
0-1 1148 1071 944 1018 1669 1760 17931-2 669 602 554 633 829 1137 11972-3 429 415 386 396 609 764 9503-4 397 359 327 389 476 482 6804-5 914 793 771 857 825 661 4875-6 3120 3128 3020 3136 2807 1494 9946-7 8106 8243 8086 8210 6857 2999 17907-8 11272 10997 11013 11183 9462 4701 27888-9 10713 11574 11470 11498 9799 7268 42429-10 9789 9341 10107 9564 8998 8664 591510-11 7864 9531 9122 8638 9244 9062 757511-12 7571 8417 8550 8563 8789 8714 793912-13 8042 8141 7740 7929 9261 8163 793013-14 7593 8363 8081 9193 9034 8855 789514-15 7859 8000 8197 8309 8679 8986 745915-16 9599 10288 9933 9966 9736 9178 716616-17 8337 9733 9250 9358 9296 8944 762717-18 8150 9440 9117 9115 8046 8633 727418-19 6868 7893 7758 7357 8313 7454 679819-20 4190 5167 5010 5424 6419 6062 557020-21 3180 3869 3648 3960 5166 4650 494021-22 2657 3124 3173 3692 4834 4478 427222-23 1990 2245 2451 2962 4338 4361 322823-24 1256 1514 1676 1768 3217 2861 2143
Total 131713 142248 140384 143118 146703 130331 108652

LANE CLOSURE CHART EXERCISE
Develop a lane closure chart based on the traffic demand for 7-12 and 7-13 and 7-14
Use 1500 vph per lane.
15 minutes to complete this exercise.

ANSWER

Chart No. 1Lane Requirements and Hours of Work
Direction: Southbound SD-5 Location: North of JCT RTE 805
a.m. p.m.
FROM HOUR TO HOUR 12 1 2 3 4 5 6 7 8 9 10 11 12 1 2 3 4 5 6 7 8 9 10 11 12Mondays through Thursdays 1 1 1 1 1 2 4 3 2 2 2
Fridays 2 1 1 1 1 2 4 4 3 3
Saturdays 2 1 1 1 1 1 2 4 4 3 3 2
Sundays 2 1 1 1 1 1 2 2 3 4 4 4 3 3 2
Day before designated legal holiday 1 1 1 1 1 2 4 4 3 3
Designated legal holidays
Legend:1 Provide at least one through freeway lane open in direction of travel (Demand < 1500 )
2 Provide at least two through freeway lanes open in direction of travel (1500 < Demand < 3000)
3 Provide at least three through freeway lanes open in direction of travel(3000 < Demand < 4500)
4 Provide at least four through freeway lanes open in direction of travel (4500 < Demand < 6000)
No lane closure permitted
REMARKS:
7-107-127-137-14

Information to Provide When Requesting a Lane Closure Chart and Maintaining Traffic Specifications
Complete set of plans.
Detailed description of proposed work (ALL).
Identify any work that may require a full freeway closure.
The more project information you provide EARLY, the less problem you will have during construction.

The DTM’s Role with the
Lane Closure Chart

DISTRICT TRAFFIC MANAGER
Activities that require Lane Closure Approval:
Construction
Maintenance
Encroachment Permits
Special Events/Filming
Any activities which may impact traffic on the
State Highway System

Requesting UnitsConstruction, Maint.,Permits
DTMLane Closure Requests Via Fax, e-mail or Intranet*
Lane Closure # Assigned
Prepares Updated Closure Report
Lane Closure Approval and Monitoring ProceduresInformation Flow - Relation to TMP Strategies
PIO/CHIN/CHP/Other Stakeholders
Dist./HQ LCRC**
*Will implement with LCS**LCRC: Lane Closure Review Committee
Need more info (contingency/detour plan)
CTMTMP modification
i.e. exceptions to closure charts (for construction projects only)
Review request / Coordinate closuresIf anticipating
significant
delays
Not recommended
If recommended, forward to DTM for review and approval.

Delay Damages
A+B Bidding
Lake Tahoe Basin

DELAY DAMAGES
Standard Special Provision (SSP) 12-220 was introduced in late 1998 and fully adopted by District 3 in mid-1999.
Contractor is required to submit lane closure request ONE week in advance for Caltrans approval.

DELAY DAMAGES (CONTINUED)
Contractor is required to provide a “Contingency Plan” at the request of the Resident Engineer.
Damages for late lane closure pickup provide a “lever” for the RE to charge the Contractor.
Delay damages concept for late opening is agreed to by CALTRANS and the Association of General Contractors. Estimated traffic delay must equal or exceed $6000 per hour for the first two hours beyond the time when all lanes are opened to traffic as specified on the lane closure chart.

DELAY DAMAGES (CONTINUED)
Deputy District Director of Construction’s concurrence is required with the delay damages before we can include as part of the SSP in most Districts. In District 3 the TMP Manager has this authority.
If more than one chart/delay damage, worst case applies.
Delay cost for each truck is based on $0.40 per minute and $0.15 for each car.
SSP 12-220 applies to ALL projects requiring lane closures.

DELAY COST
Chart No. 1Lane Requirements and Hours of Work
Direction: Southbound SD-5 Location: North of JCT RTE 805
a.m. p.m.
FROM HOUR TO HOUR 12 1 2 3 4 5 6 7 8 9 10 11 12 1 2 3 4 5 6 7 8 9 10 11 12Mondays through Thursdays 1 1 1 1 1 2 4 3 2 2 2
Fridays 2 1 1 1 1 2 4 4 3 3
Saturdays 2 1 1 1 1 1 2 4 4 3 3 2
Sundays 2 1 1 1 1 1 2 2 3 4 4 4 3 3 2
Day before designated legal holiday 1 1 1 1 1 2 4 4 3 3
Designated legal holidays
Legend:1 Provide at least one through freeway lane open in direction of travel (Demand < 1500 )
2 Provide at least two through freeway lanes open in direction of travel (1500 < Demand < 3000)
3 Provide at least three through freeway lanes open in direction of travel(3000 < Demand < 4500)
4 Provide at least four through freeway lanes open in direction of travel (4500 < Demand < 6000)
No lane closure permitted
REMARKS:
7-107-127-137-14

demand = 8086 veh ( 6:00 am to 7:00 am)demand = 11013 veh (7:00 am to 8:00 am)
At 7:00 am, 5,086 veh are left behind (8086 veh - 3000 veh = 5086 veh)
At 8:00 am, 13,099 veh are left behind (5086 veh + (11013 veh - 3000 veh) = 13099 veh)
2 lanes open for traffic( with total capacity = 3000 vph)

Percent Passenger Cars: 100.0% Cost per Passenger Car: $9/Veh-HrNumber of Lanes Existing: 5 Lanes Cost for Mixed Flow Traffic: $9/Veh-Hr
Number of Lanes Open: 2 Lanes Single-Lane Capacity: 1500 Veh/HrOpen-Lane Capacity: 3000 Veh/Hr
Time Demand (Veh)Cumulative
Demand (Veh)Cumulative
Capacity (Veh)Difference (Veh)
Area (Veh-Hr)
Queue Length (mile)
6:00 AM 0 0 0 0 0 0.07AM 8086 8086 3000 5086 2543 4.88 AM 11013 19099 6000 13099 9092.5 12.4
Vehicle Delay Hours: 11,636 veh-hrTotal Cost of Delay: $104,720Delay Cost/10min: $8,727
Demand vs. Capacity
0
5000
10000
15000
20000
25000
6:00
AM
7AM
8 A
M
TIME
CU
MU
LA
TIV
E V
EH
ICLES
Demand Capacity
5086 Veh
13099 Veh
5086 VehArea 1
Area 2
Area 1 = (5086 Veh X 1 hr) / 2 = 2543 Veh-hrArea 2 = ((13099 + 5086 ) X 1hr) / 2 = 9092.5 Veh-hrTotal Area for 2 hours = 11,636 Veh-hrDelay Cost for 2 hours = 11,636 X $9/Veh-hr = $104,720
Delay Cost for 10 minutes = 104,720 / 12 = $ 8,727 Veh

SSP 12- 220
8,700.0010

A+B Bidding -- Road User Costs
The Contractor Bids:
Cost of Construction + Number of Days
A + B
A $$$ Value for a “Day” is calculated -
Road User Costs
A+B Bidding -- Road User Costs
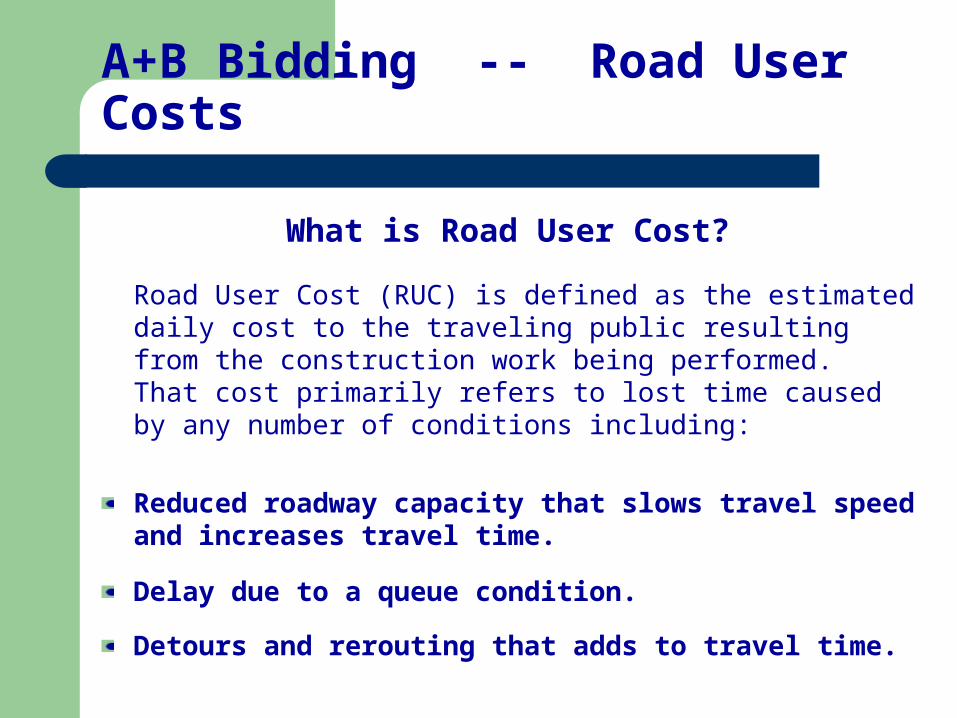
What is Road User Cost?
Road User Cost (RUC) is defined as the estimated daily cost to the traveling public resulting from the construction work being performed. That cost primarily refers to lost time caused by any number of conditions including:
Reduced roadway capacity that slows travel speed and increases travel time.
Delay due to a queue condition.
Detours and rerouting that adds to travel time.

A+B Bidding -- Road User Costs
Project Selection
Project Cost is > $5,000,000
Traffic restrictions, lane closures, or detours result in high road user costs: RUC >$5000.
Safety concerns or impacts to the local community warrant expediting the project
The project is relatively free of third party conflicts.
It is in the public’s interest to complete the project as soon as possible.
No right of way clearance issues.
Lake Tahoe Basin
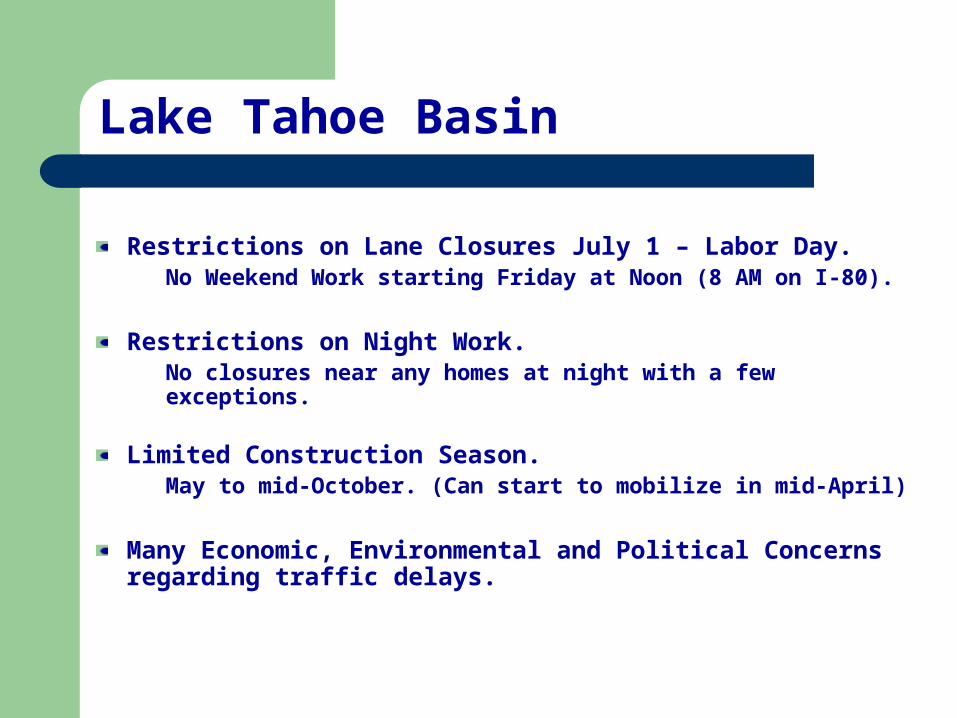
Restrictions on Lane Closures July 1 – Labor Day.No Weekend Work starting Friday at Noon (8 AM on I-80).
Restrictions on Night Work.No closures near any homes at night with a few exceptions.
Limited Construction Season.May to mid-October. (Can start to mobilize in mid-April)
Many Economic, Environmental and Political Concerns regarding traffic delays.

Lake Tahoe Basin

QUESTIONS ???