lane closure policy development, enforcement, and ... · lane closure policy development,...
TRANSCRIPT

Lane Closure Policy Development, Enforcement, and Exceptions:A Survey of Seven State Transportation Agencies
Final Report June 2007
Sponsored by the Smart Work Zone Deployment Initiative a Federal Highway Administration pooled fund study and the Midwest Transportation Consortium the U.S. DOT University Transportation Center for Federal Region 7
Iowa State University’s Center for Transportation Research and Education is the umbrella organization for the following centers and programs: Bridge Engineering Center • Center for Weather Impacts on Mobility
and Safety • Construction Management & Technology • Iowa Local Technical Assistance Program • Iowa Traffic Safety Data Service • Midwest Transportation Consortium • National Concrete Pavement
Technology Center • Partnership for Geotechnical Advancement • Roadway Infrastructure Management and Operations Systems • Statewide Urban Design and Specifications • Traffic Safety and Operations

About the MTC
The mission of the University Transportation Centers (UTC) program is to advance U.S. technology and expertise in the many disciplines comprising transportation through the mechanisms of education, research, and technology transfer at university-based centers of excellence. The Midwest Transportation Consortium (MTC) is the UTC program regional center for Iowa, Kansas, Missouri, and Nebraska. Iowa State University, through its Center for Transportation Research and Education (CTRE), is the MTC’s lead institution.
Disclaimer Notice
The contents of this report reflect the views of the authors, who are responsible for the facts and the accuracy of the information presented herein. The opinions, findings and conclusions expressed in this publication are those of the authors and not necessarily those of the sponsors.
The sponsors assume no liability for the contents or use of the information contained in this document. This report does not constitute a standard, specification, or regulation.
The sponsors do not endorse products or manufacturers. Trademarks or manufacturers’ names appear in this report only because they are considered essential to the objective of the document.
Non-discrimination Statement
Iowa State University does not discriminate on the basis of race, color, age, religion, national origin, sexual orientation, gender identity, sex, marital status, disability, or status as a U.S. veteran. Inquiries can be directed to the Director of Equal Opportunity and Diversity, (515) 294-7612.

Technical Report Documentation Page
1. Report No. 2. Government Accession No. 3. Recipient’s Catalog No.
4. Title and Subtitle 5. Report Date June 2007 6. Performing Organization Code
Lane Closure Policy Development, Enforcement, and Exceptions: A Survey of Seven State Transportation Agencies
7. Author(s) 8. Performing Organization Report No. T.H. Maze and Jon Wiegand 9. Performing Organization Name and Address 10. Work Unit No. (TRAIS)
11. Contract or Grant No.
Center for Transportation Research and Education Iowa State University 2711 South Loop Drive, Suite 4700 Ames, IA 50010-8664
12. Sponsoring Organization Name and Address 13. Type of Report and Period Covered Final Report 14. Sponsoring Agency Code
Federal Highway Administration Midwest Transportation Consortium U.S. Department of Transportation 2711 South Loop Drive, Suite 4700 400 7th Street SW Ames, IA 50010-8664 Washington, DC 20590
15. Supplementary Notes Visit www.ctre.iastate.edu for color PDF files of this and other research reports. 16. Abstract Traffic volume increases and an aging infrastructure create the need for reconstruction, rehabilitation, and maintenance of existing facilities. As more motorists feel that delays should be minimal during highway renewal projects, lane closures that reduce capacity through the work zone should not create unreasonable delays. In order to facilitate the determination of when a lane closure is permitted during the day, some state transportation agencies (STAs) have developed lane closure policies, or strategies, that they use as guidance in determining daily permitted lane closure times. Permitted lane closure times define what times of the day, week, or season a lane closure is allowed on a facility and at a specific location or segment. This research addresses the lane closure policies of several STAs that were reputed to have good lane closures policies or strategies and that were selected by the project advisory committee for further research. These agencies include the following:
• California Department of Transportation (Caltrans) • Colorado Department of Transportation (CDOT), Region 1 and Region 6 • Indiana Department of Transportation (INDOT) • Minnesota Department of Transportation (Mn/DOT), Metropolitan District • Missouri Department of Transportation (MoDOT) • Ohio Department of Transportation (ODOT) • Wisconsin Department of Transportation (WisDOT)
A survey was sent to each STA to help determine its actions with respect to the undocumented mechanics of the policy and to find some common ground for policy comparison.
17. Key Words 18. Distribution Statement lane closure schedules—policy communication strategies—policy development—policy enforcement—policy exceptions
No restrictions.
19. Security Classification (of this report)
20. Security Classification (of this page)
21. No. of Pages 22. Price
Unclassified. Unclassified. 62 NA
Form DOT F 1700.7 (8-72) Reproduction of completed page authorized


LANE CLOSURE POLICY DEVELOPMENT, ENFORCEMENT, AND EXCEPTIONS: A SURVEY OF
SEVEN STATE TRANSPORTATION AGENCIES
Final Report June 2007
Principal Investigator T.H. Maze
Professor, Department of Civil, Construction, and Environmental Engineering Iowa State University
Research Assistant Jon Wiegand
Authors T.H. Maze and Jon Wiegand
Sponsored by the Smart Work Zone Deployment Initiative
a Federal Highway Administration pooled fund study and
the Midwest Transportation Consortium the U.S. DOT University Transportation Center for Federal Region 7
A report from Center for Transportation Research and Education
Iowa State University 2711 South Loop Drive, Suite 4700
Ames, IA 50010-8664 Phone: 515-294-8103 Fax: 515-294-0467
www.ctre.iastate.edu


TABLE OF CONTENTS
ACKNOWLEDGMENTS ............................................................................................................ IX
1. INTRODUCTION .......................................................................................................................1
2. METHODOLOGY ......................................................................................................................2
3. OVERVIEW AND INTRODUCTION TO EACH POLICY OR STRATEGY .........................6 3.1 California Department of Transportation (Caltrans) ...........................................................6 3.2 Colorado Department of Transportation (CDOT) .............................................................10
3.2.1 Colorado Department of Transportation Region 1 ...................................................11 3.2.2 Colorado Department of Transportation Region 6 ...................................................13
3.3 Indiana Department of Transportation (INDOT)...............................................................16 3.4 Minnesota Department of Transportation (Mn/DOT), Metropolitan District ...................18 3.5 Missouri Department of Transportation (MoDOT) ...........................................................20 3.6 Ohio Department of Transportation (ODOT)....................................................................20 3.7 Wisconsin Department of Transportation (WisDOT)........................................................22
4. SURVEY RESULTS .................................................................................................................23 4.1 Lane Closure Policy Development ....................................................................................23
4.1.1 Facility Inclusion in Policy or Strategy ....................................................................24 4.1.2 Expected Outcome of Policy ....................................................................................24 4.1.3 Formal Performance Measures .................................................................................25 4.1.4 Mechanics of Permitted/Refused Lane Closure Determination ...............................26 4.1.5 Frequency of Lane Closure Traffic Condition/Volume Updates..............................33 4.1.6 Communication of Lane Closure Policy...................................................................33 4.1.7 Official Authorization of the Lane Closure Policy...................................................35 4.1.8 Variations to the Policy Due to Local Special Traffic Conditions ...........................35 4.1.9 Exempt Activities .....................................................................................................38
4.2 Exceptions to the Policy ....................................................................................................39 4.2.1 Process for Identifying and Granting Exceptions .....................................................39 4.2.2 Frequency of Policy Exceptions ...............................................................................44 4.2.3 Deviation from Permitted Times for Lane Closure Setup or Removal ....................45
4.3 Enforcement.......................................................................................................................47 4.3.1 Policy Enforcement and Monitoring of Permitted Exceptions.................................47 4.3.2 Penalties or Fines for Non-Compliance....................................................................49
5. CONCLUSIONS........................................................................................................................50
6. REFERENCES ..........................................................................................................................52
v


LIST OF FIGURES
Figure 1. Caltrans Lane Requirements and Hours of Work chart example (3) ...............................7 Figure 2. LCS user roles and permissions chart ..............................................................................8 Figure 3. Graphical representation of the LCS process (6) .............................................................9 Figure 4. Colorado Department of Transportation regions map (7) ..............................................11 Figure 5. Example of a CDOT Region 1 permitted lane closure map...........................................12 Figure 6. Example of a CDOT Region 6 freeway weekday lane closure schedule (7) .................14 Figure 7. Example of a CDOT Region 6 arterial weekday lane closure schedule (7)...................15 Figure 8. Indianapolis and Falls City area permitted lane closure map (8) ...................................17 Figure 9. I-35W Lane closure page index map for the Mn/DOT Metro District (9).....................18 Figure 10. Mn/DOT allowable lane closure chart example (9) .....................................................19 Figure 11. ODOT permitted lane closure chart example (12) .......................................................21 Figure 12. Sample of Caltrans delay calculations spreadsheet (2) ................................................31 Figure 13. Location of Wadsworth Boulevard (SH 121) in Denver metro area (7) ......................37 Figure 14. ODOT contract work exception process (13)...............................................................44
LIST OF TABLES
Table 1. Lane closure capacities used by STAs around the country ...............................................3 Table 2. Formal performance measures summary.........................................................................25 Table 3. Mechanics of permitted/refused lane closure determination summary ...........................27 Table 4. Freeway capacity rates for some typical operations (14) ................................................29 Table 5. MoDOT roadway capacities (12) ....................................................................................30 Table 6. Lane capacity accounting for terrain and truck percentage (14) .....................................30 Table 7. Lane closure policy/strategy update frequency summary ...............................................33 Table 8. Summary of policy/strategy communication to DOT staff and external forces ..............34 Table 9. Lane closure policy/strategy approval .............................................................................35 Table 10. Formal variations described in policy/strategy..............................................................35 Table 11. Exempt construction or maintenance activities .............................................................38 Table 12. Summary of exceptions (identification, criteria, and exception-granting process) .......40 Table 13. Frequency of granted exceptions ...................................................................................45 Table 14. Deviations from permitted lane closure times (removal and setup) ..............................46 Table 15. Policy enforcement and monitoring of permitted exceptions........................................48 Table 16. Penalties for non-compliance with lane closure policy/strategy ...................................49
vii


ACKNOWLEDGMENTS
The authors would like to thank the Smart Work Zone Deployment Initiative for sponsoring this research. The researchers would also like to thank the advisory committee for this project, which included the following members:
• Tom Notbohm, Wisconsin Department of Transportation • Jerry Roche, Iowa Division Office, Federal Highway Administration • Mark Bortle, Iowa Department of Transportation • Dan Sprengleler, Iowa Department of Transportation • Tracy Scriba, Office of Operations, Federal Highway Administration
We also appreciate the contributions received from the state transportation agencies that participated in our survey and patiently answered our many questions. These respondents are identified throughout the text.
ix


1. INTRODUCTION
Traffic volume increases and an aging infrastructure create the need for reconstruction, rehabilitation, and maintenance of existing facilities. As more motorists feel that delays should be minimal during highway renewal projects, lane closures that reduce capacity through the work zone should not create unreasonable delays. In order to facilitate the determination of when a lane closure is permitted during the day, some states have developed lane closure policies, or strategies, that they use as guidance or as a metric to determine permitted lane closure times. Permitted lane closure times define what times of the day, week, or season a lane closure is allowed on a facility and at a specific location or segment.
In our research to determine lane closure capacity policies for state transportation agencies (STAs), we first surveyed all STAs. Not all surveyed STAs reported lane closure capacities and some reported the maximum queue length (in time) that could result during the period when the lane was closed. We went on to research the policies and strategies of a few STAs, reputed to have good lane closures policies or strategies, which were selected by the project advisory committee for further research. These agencies included the following:
• California Department of Transportation (Caltrans) • Colorado Department of Transportation (CDOT) • Indiana Department of Transportation (INDOT) • Minnesota Department of Transportation (Mn/DOT), Metropolitan District • Missouri Department of Transportation (MoDOT) • Ohio Department of Transportation (ODOT) • Wisconsin Department of Transportation (WisDOT)
Many of these agencies have documentation available to the general public that introduces and describes the state’s lane closure policy. Others only provide the documentation, which may be limited in nature, to staff within the agency. Through examination of these available documents, it was discovered that these STAs’ lane closure policies are each unique in their components. Furthermore, the range in available information provided in each document make some STAs appear to have very intricate policies while others have policies that seem very simplistic by comparison.
Many questions were raised after looking into these policies, generally concerning the lane closure and permitted lane closure time development, exceptions to the policy, and enforcement of the policy as well as lane closure times (i.e., mechanics of the development and enforcement of the policy). A survey was sent to each state to help determine each STA’s actions with respect to the undocumented mechanics of the policy—beyond what was stated in each agency’s respective written policy or strategy—and to find some common ground for policy comparison.
1

2. METHODOLOGY
In order to understand the mechanics of each STA’s lane closure policies, an internet-based survey was developed. The purpose of the survey was primarily to determine what strategies STAs have deployed to reduce congestion and improve safety in work zones. Thus, the survey has a more global perspective—looking at all strategies used by STAs in work zones—so the full results of the survey will be reported in future documents. However, for the purpose of this study, the survey did help us determine what values the agencies use for capacity when two-lane highways are reduced to one lane or three-lane highways are reduced to two lanes.
Capacity of a work zone is largely dependent on a number of variables; therefore, we expect capacities used by different agencies to vary greatly from one location to another. Given this variability, we would also expect a wide range of values for the capacity of lane closures. Capacity is the maximum flow rate that can be accommodated by a given traffic facility under prevailing conditions (1). The capacity at a work zone lane closure is dependent on a number of location-specific variables; some can be controlled (e.g., merger point location), while others cannot (e.g., weather). Capacity is also partially dependent on driver behavior which is, to a certain degree, random and uncontrollable.
The following list of variables that influence capacity is described by Maze, et al. (2):
• Work zone lane closure configuration • Intensity and location of work • Percentage of heavy vehicles • Driver characteristics • Entrance ramp locations and volumes • Grade of lane closure • Duration of work • Weather conditions • Work time • Location of merge point and enforcement
The survey was distributed to all fifth state transportation agencies and encompassed a variety of positions within each agency. The following positions at the district and state levels of each agency, as applicable, were identified as possible respondents to the survey:
• Project or Resident Engineers • Traffic Engineers • Operations and Management Engineers • Other engineers with extensive knowledge of work zones
A variety of positions within an agency were targeted in order to obtain opinions from staff involved in different stages of a project regarding the benefits of each strategy that is implemented. Opinions of staff in different positions may vary due to different levels of
2

exposure to the project conditions and characteristics. For example, those that are in the field and observe the congestion first hand may have different opinions from those who are not in the field.
To distribute the survey, email addresses were obtained from multiple sources. The members of the following committees were contacted as potential respondents to the survey:
• American Association of State Highway and Transportation Officials Highway Subcommittee on Systems Operations and Management
• American Association of State Highway and Transportation Officials Highway Subcommittee on Traffic Engineering
• Midwest Work Zone Roundtable
Other email addresses were obtained through a search of STA websites, recommendations from CTRE staff, contacts from STA Engineers that participated in previous projects, and referrals from those in the profession that are familiar with others that have knowledge of work zones.
Forty-two surveys were completed online and respondents were from at least 28 STAs. Two of the 42 surveys were completed anonymously. While the survey response was not as high as originally intended, those that responded provided great insight into what their agency is doing to reduce work zone congestion. Out of the 28 STAs, only 18 provide estimated capacity after lane closure for two to one rural lane and three urban to two lanes (these were not necessarily the same 18 STAs). This is illustrated in table 1.
Table 1. Lane closure capacities used by STAs around the country
In vphpl Rural 1000-1200 5 1201-1400 7 1401-1600 6 Total = 18 Urban 2 open, 1 closed 1000-1200 5 1201-1400 6 1401-1600 5 1601-1800 2 Total = 18
In order to more thoroughly examine agencies with well-designed lane closure policies, lane closure surveys were developed and distributed to the following STAs:
• California Department of Transportation • Colorado Department of Transportation: Region 1 and Region 6 • Indiana Department of Transportation • Minnesota Department of Transportation, Metropolitan District
3

• Ohio Department of Transportation • Missouri Department of Transportation • Wisconsin Department of Transportation
All transportation agencies responded except Region 6 of the Colorado Department of Transportation. However, Colorado Department of Transportation Region 1 and Region 6 lane closure strategies are similar in theory and Region 1 provided extensive documentation covering their strategy. The survey consisted of a series of questions dealing with the following topics:
• Lane closure policy development • Exceptions to the lane closure policy • Lane closure policy enforcement (not physical enforcement of the lane closure with
police; rather, enforcement of the policy so that it is no violated by internal force or contractors)
The surveys were distributed after we (the researchers) tried to answer many of the questions ourselves using the written documents that were available on the STAs’ websites. Based on the available policy documents, we developed written descriptions of each agency’s policies; however, many nuances of these policies could not be determined strictly from the available documentation. The written descriptions that we developed were sent to representatives of each STA to review, make changes, and expand on the answers. Each representative was also asked to provide a description of what the state usually does for each activity that we had questions over.
The survey respondents contacted from each state transportation agency are as follows:
Jacqui Yuke Ghezzi Chief, Traffic Management Branch Division of Traffic Operations California Department of Transportation Sacramento, CA 95814 (916) 651-9050 Email: [email protected]
Clark Roberts Traffic Resident Engineer Colorado Department of Transportation Region 1 18500 East Colfax Avenue Aurora, CO 80011 (303) 757-9648 Email: [email protected]
Carl T. Tuttle Manager, Office of Traffic Engineering Highway Operations Division 100 N. Senate Avenue Indiana Government Center North 925 Indianapolis, IN 46204 (317) 233-4726 Email: [email protected]
Cassandra Isackson Traffic Control Engineer Minnesota Department of Transportation Metropolitan District Roseville, MN 55113 (651) 582-1000 Email: [email protected]
4

Scott Stotlemeyer Technical Support Engineer Temporary Traffic Control Section Traffic Division Missouri Department of Transportation Jefferson City, MO 65109 (573) 526-1759 Email: [email protected]
Mack Braxton Office of Traffic Engineering, Work Zones Ohio Department of Transportation 1980 West Broad Street Columbus, Ohio 43223 (614) 752-8829 Email: [email protected]
Tom Notbohm WisDOT Bureau of Hwy. Operations 4802 Sheboygan Ave., Room 501 P.O. Box 7986 Madison, WI 53707-7986 (608) 266-0982 Email: [email protected]
5

3. OVERVIEW AND INTRODUCTION TO EACH POLICY OR STRATEGY
The survey distributed to the state transportation agencies included questions on the specific components of the policy or lane closure developmental process. To understand how these components fit into the overall process and even the policy, a general overview is needed. Each state’s policy is unique and needs to be differentiated, on both the overall and component levels. It is also important to understand what the final product is and how it is presented to the field personnel wishing to close lanes. Through the survey, it was determined that while some states may perform similar tasks, such as developing the permitted lane closure times, they may not perform that task at the same “step” in their respective lane closure review/developmental process. To understand the motivation for the lane closure policy development, the following sections provide both a general overview of each STA’s policy documentation and a graphical representation of how the permitted lane closure times are presented to the user.
3.1 California Department of Transportation (Caltrans)
The California Department of Transportation documents the use of work zone Transportation Management Plans and the plans’ components in the Deputy Directive 60, Transportation Management Plan Guidelines (1).The major lane closure approval process identified within this policy consists of three major components:
• Threshold criteria for lane closures requiring the approval of the District Lane Closure Review Committee
• Procedures for the review and evaluation of lane closure operations • Contents of the post-closure evaluation statement
The output of a lane closure request is the lane closure chart, shown in Figure 1. The chart shows the lane requirements and work hours for the project for which the request was submitted. In the Figure 1 example scenario, the facility has three through lanes in the northbound direction. The hourly breakdown shows how many lanes need to be open to through freeway travel and when work is permitted. The charts specify the number of lanes that are required to be open and not the number of lanes that can be closed.
6

Figure 1. Caltrans Lane Requirements and Hours of Work chart example (3)
The Lane Requirements and Hours of Work charts are developed within the lane closure reporting and requesting process, which is performed through the Lane Closure System (LCS). The LCS also allows Caltrans to share lane closure information statewide with all 12 districts through the internet. The information is shared with Caltrans personnel, contractors, and public utilities that impact or are impacted by a lane closure. The LCS is designed to facilitate the following lane closure–related actions (4):
• Lane closure requests • Review (Requested lane closure is checked against lane requirement charts.) • Checks for possible conflicts with other closures • Approval or rejection • Status change of a lane closure • Lane closure information dissemination to the public
There are two levels of a lane closure request submittal—the requestor and the inspector. The requestor must have the request reviewed by a Construction, Maintenance, or Permits Supervisor first. The inspector-level personnel or a higher level manager (e.g., Field Supervisor) can submit a request directly to the District Traffic Manager (DTM) for review (5).
The roles and responsibilities of each user level are displayed in the User Role and Permission summary matrix (see Figure 2) and the following sections will further describe the user roles within the process (6). In Figure 2, listed across the top of the matrix are positions within the district, and along the left side of the matrix are tasks associated with a lane closure decision. Where a cell is colored inside the matrix, it means that the individual with that title has the
7

authority to make decisions regarding that task. For example, a DTM can perform all tasks while a Traffic Management Center Operator can only view lane closure reports.
Figure 2. LCS user roles and permissions chart (6)
In Caltrans’s system, those who can create lane closure requests include the following (6):
• Field Supervisors (“RE”-level staff), including Resident Engineers, Maintenance staff, and Permits staff
• Inspectors • Requestors (Construction, Maintenance, Permits) • Contractors, Utility Companies, etc. • District Traffic Manager (DTM) • DTM Reviewer/staff • Transportation Management Center staff (only if a closure is necessary in an
emergency situation) It should be noted that contractors and external partners can create requests only if they are given a User ID by the appropriate Caltrans Field Supervisor and submit the request through that Supervisor.
After the lane closure is requested, it must be approved, modified, or rejected. The LCS provides a single location where all statewide lane closures can be reviewed. Figure 3 displays the general LCS approval process overview. The following points elaborate on the process intricacies (5):
• The system allows the District Traffic Manager (DTM) or DTM Reviewer (authorized by the DTM) to review all lane closures submitted for the purposes of construction, maintenance, permits or traffic control.
• The system allows the DTM to either approve or reject the request electronically.
8

• The system notifies the requestor in the case of rejection—if the requestor has specified that notification is desired.
• The system allows all district users searching for potential conflicts to see which lane closure requests have been approved.
Closure Requested Contractor/ Requestor
1st Line Review Resident Engineer*
1st Line Review Maintenance Supervisor*
1st Line Review Permits Engineer*
Closure Requested Maintenance Staff
Closure Requested Permittee
District Traffic Manager Review
Approve Closure
Modify Closure
Reject Closure
* “RE”-level staff can submit their own requests to the DTM directly.
Figure 3. Graphical representation of the LCS process (6)
Other functions that specified users have within the Lane Closure System include canceling a closure request and changing the status of a closure (6). The LCS allows the Transportation Management Center staff to electronically review the status of a lane closure request and change the status of the request after DTM approval. Field staff members are responsible for calling in to the Traffic Management Centers to provide opening and closing status of the lane closure. Change status actions include
• “10-97”—notification when the first cone is placed to close the lane, • “10-98”—notification when the last cone is picked up to open the lane, and • “10-22”—notification that the closure request has been cancelled.
As shown in Figure 2, only field supervisors, inspectors, and requestor-level staff have the ability to cancel the closure request. The other two status change identifications can be called in
9

by field staff. This allows the Transportation Management Center staff to keep the lane closure status in their database updated in real time.
To complete to LCS process for a lane closure, the following reports are filed and can be accessed through this program (6):
• Daily Planned Lane Closure Detail Report • Delay Category (identifies delay indicated on request form) • Early Recording (a report of all approved planned closures in a district that reported a
date/time that was earlier than the approved time) • Late Recording (a report of all approved planned closures in a district that reports the
date/time of closure that were later than the approved time) • Full Closure Report • Lane Closure Logs • Tracking Reports • Transportation Permits
The Caltrans Lane Closure System is somewhat confusing to the new observer, partially due to the intricate request-and-approval process and all the staff identified in that process. However, due to the size of California’s STA and the size of the state itself, the documents must, and in fact do, describe this process and staff responsibilities in great detail. When compared to other states, the Lane Requirements and Hours of Work charts are slightly different in nature. For instance, the Caltrans charts indicate times when no work can be performed on a roadway in a direction—even work that does not require a lane closure. Overall, the LCS is beneficial to the entire process because of the large number of lane closures within a given district and because it allows for system-wide coordination to avoid conflicting lane closures.
3.2 Colorado Department of Transportation (CDOT)
The Colorado Department of Transportation has developed lane closure strategies by regions within the state (regions in Colorado correspond to districts in other states). Each region is responsible for developing its own policy or strategy due to the difference in motorists’ expectations throughout the state. The regions are shown in Figure 4.
10

Figure 4. Colorado Department of Transportation regions map (7)
3.2.1 Colorado Department of Transportation Region 1
The CDOT Region 1 Lane Closure Strategy was jointly developed by the Region 1 Traffic Section and an outside consultant in May of 2004 (8). The strategy is used to provide “uniform criteria and authoritative guidance for scheduling lane closures” (8).
The strategy provides weekend and weekday permitted lane closure times for two-lane and multi-lane facilities within Region 1. The outputs of the analyses are spreadsheets included in the strategy appendices and a graphical map representing permitted lane closure times for work zones of two typical lengths. A ¼-mile length was selected as the typical length for short work zones and one mile was selected for typical length of long work zones. Thus, ¼ mile and one mile lengths were used to calculate delay at a specific location and—based on the expected resulting delay—a short or long work zone closure would or would not be permitted. The appendices of the lane closure strategy include spreadsheets of the seasonal schedules for Region 1 and regulations for when roadways not impacted by large seasonal differences in traffic could have one or more lanes closed. The appendices include the following spreadsheets:
• Tabulated summer closure schedules • Tabulated spring/fall closure schedules • Tabulated winter closure schedules • E I-70 mountain corridor closure schedules • Two-lane closure schedules • Interstate interchanges within Region 1
A quick overview of the spreadsheets is represented in map form, showing the permitted lane closure times for major roadways in CDOT Region 1 (see Figure 5). The map distinguishes
11
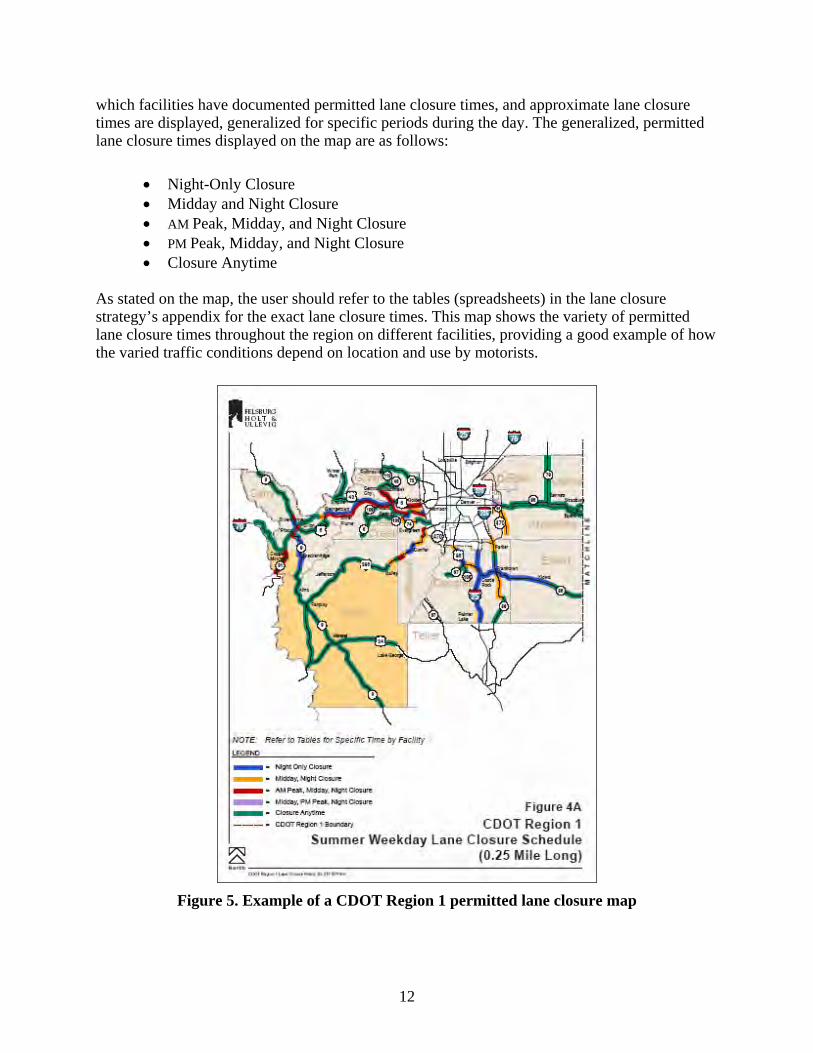
which facilities have documented permitted lane closure times, and approximate lane closure times are displayed, generalized for specific periods during the day. The generalized, permitted lane closure times displayed on the map are as follows:
• Night-Only Closure • Midday and Night Closure • AM Peak, Midday, and Night Closure • PM Peak, Midday, and Night Closure • Closure Anytime
As stated on the map, the user should refer to the tables (spreadsheets) in the lane closure strategy’s appendix for the exact lane closure times. This map shows the variety of permitted lane closure times throughout the region on different facilities, providing a good example of how the varied traffic conditions depend on location and use by motorists.
Figure 5. Example of a CDOT Region 1 permitted lane closure map
12
The other components of the Region 1 Lane Closure Strategy are documented in conjunction with the survey findings in the Survey Results section of this report. These components include data collection methods of traffic volumes, the analysis approach, and discussion of results for both two-lane and multi-lane facilities. Also included are strategies for dealing with the closure implementation process, special events, emergency situations, and updates to the strategy.
3.2.2 Colorado Department of Transportation Region 6
Similar to the Lane Closure Strategy (LCS) developed for Region 1, the CDOT Region 6 LCS (A Congestion Management Initiative) was jointly developed by a consultant and the CDOT Region 6 Traffic and Safety Section (9). The current version of the Region 6 LCS, published in July 2005, is the second edition. The strategy includes permitted lane closure times for both freeways and arterials within the region.
The outputs of the Region 6 strategy include permitted lane closure tables (spreadsheets) and generalized permitted lane closure times displayed graphically for both the two typical work zone lengths (¼- and one-mile closures). The lane closure tables are located in the appendices of the LCS, differentiated into the following categories:
• Single-lane closure schedules • Two-lane closure schedules for freeways • Seasonal lane closure schedules for freeways
The graphical representation of the Region 6 lane closure strategy is similar to that of Region 1 in that it provides generalized permitted lane closure periods. The maps also include permitted lane closure periods for weekday and weekend closures on state freeway (see Figure 6) and arterial (see Figure 7) facilities. Because the lane closure periods are generalized on the maps, the specific lane closure times should be determined from the tables in the strategy’s appendices.
13

Figure 6. Example of a CDOT Region 6 freeway weekday lane closure schedule (7)
14

Figure 7. Example of a CDOT Region 6 arterial weekday lane closure schedule (7)
Region 1 and Region 6 differ in their strategies for freeway permitted lane closure times. In the Region 6 LCS, the lane closure periods were reduced from five periods to three periods only covering freeway facilities—Region 6 does not allow freeway closures during the AM or PM peaks whereas Region 1 does. The difference is graphically shown in the legends of Figure 5 and Figure 6 and a comparison is listed below. The reduction in permitted freeway closure period in the urban area of Region 6 (Metro Denver) is due to CDOT research indicating that (1) crashes and delays were more likely if freeway lane closures were initiated during the weekday AM or PM peak hour and (2) the likely increase of crashes and delays outweighs the benefits of more efficient maintenance and construction activities.
• Region 1 Permitted Lane Closure Times o Night-Only Closure o Midday and Night Closure o AM Peak, Midday, and Night Closure
15

o PM peak, Midday, and Night Closure o Closure Anytime
• Region 6 Permitted Lane Closure Times
osure
he other c ponents of the Region 6 Lane Closure Strategy are documented in conjunction
nd
ategy,
The CDOT Region 1 and Region 6 Lane Closure Strategies are very detailed resources for
d lane
3.3 Indiana Department of Transportation (INDOT)
The Indiana Department of Transportation Interstate Highways Lane-Closure Policy currently in
ed
The existing and future lane closure policy includes a statewide lane closure map and four maps
e
o Night-Only Closure o Midday and Night Clo Closure Anytime
T omwith the survey findings in Section 4 of this report. These components include data collection methods of traffic volumes, the analysis approach, and discussion of results for both freeway aarterial (multi-lane and two-lane) facilities. Also included are strategy use specifications, guidelines for dealing with special events and emergency situations, and updates to the stras well as a lane closure decision tree and example scenarios of the lane closure scheduling process.
determining permitted lane closure times. The clear lane closure maps provide a quick, generalized reference of these times as allowed on various facilities. If specific permitteclosure times are needed, the tables are accessible to users in the same document. Furthermore,the process of developing the permitted lane closure times is documented. One of the benefits ofboth Colorado regional strategies is the accommodation of weekend and seasonal travel, a consideration which will be discussed further in following sections.
use became effective in January 2004 (10). INDOT is currently in the process of changing the existing policy, so the survey results include both the policy effective in 2004 and the policy under development. The policies are similar in nature, but deviations between the two are notin the text.
of urban areas. The maps graphically depict lane closure restrictions on interstate highways in the state. The four metro area maps include Indianapolis, the Calumet area, Fort Wayne, and thFalls City area (the Indiana portion of the Louisville metropolitan area). Two of the metro area maps are shown in Figure 8.
16

Figure 8. Indianapolis and Falls City area permitted lane closure map (8)
On the maps, there are seven time designations:
• Anytime—Lane closures are permitted at any time. • Weekend or Nighttime Only—Unlimited lane closures are permitted between Friday
9:00 PM and Monday 6:00 AM and on weekdays from 9:00 PM to 6:00 AM, along routes with significant commuter traffic.
• Weekday or Nighttime Only—Unlimited lane closures are permitted, except from Friday 6:00 AM to Sunday 9:00 PM. Pertains to routes which experience significant increases in traffic during the weekends.
• Nighttime—Lane closures are permitted any day from 9:00 PM to 6:00 AM. Generally pertains to routes with heavy traffic where queues less than one mile long can be expected during daylight hours.
• Executive Approval—Only the most heavily traveled (Average Annual Daily Traffic (AADT)>50,000 vpd) rural four-lane routes require this approval level. Except for conditions designated as Emergency, an approved request by the Chief Engineer (Design Division–developed projects) or Deputy Chief of Highway Operations (District-developed projects) is required before any lane closure takes place.
• Minimum 2 Lanes/Direction—Roads fitting this designation are generally six-lane urban interstate with AADT<100,000 vpd. A minimum of two lanes per direction shall be open at all times.
• Minimum 3 Lanes/Direction—Urban routes with eight lanes or greater meet this designation. A minimum of three lanes per direction shall be open at all times.
17

Also included in the Interstate Highway Lane-Closure Policy are the policy compliance process, guidelines for using the permitted lane closure map times, and an explanation of what happens when an operation may be non-map compliant. Exceptions to the permitted lane closure times for emergencies and routine district maintenance are also described, along with the allowable circumstances for the respective exceptions. The implementation of Traffic Management Plans (TMP) for construction projects and the queue analysis process are also documented. These components of the policy are further described in the Survey Results section of this report.
The INDOT Highway Lane-Closure Policy has benefits due to the simplicity of the document. The lane closure maps have broken the permitted lane closure times into seven periods that are easily understandable. However, the hourly volumes are not included in the document, so any allowed deviations from the permitted lane closure periods are done blindly by asking for an exception.
3.4 Minnesota Department of Transportation (Mn/DOT), Metropolitan District
The Minnesota Department of Transportation, Metropolitan District, developed a Lane Closure Manual, effective October 2003 (11). The facilities are broken into segments, and analysis is performed on each segment to determine the impacts of a lane closure (see Figure 9). The map in Figure 9 provides an index for locating the appropriate closure tables for a particular facility.
Figure 9. I-35W Lane closure page index map for the Mn/DOT Metro District (9)
18

The manual provides tables indicating the permitted highway lane closure times and the number of allowable lanes that may be closed. Average hourly volumes are provided on the table as well as the times where different levels of lane closures are allowed (indicated by shading). In the example of I-35W SB (shown in Figure 10) the facility is four lanes. Based on hourly volume, the number of lanes permitted to be closed (ranging from zero to three lanes) is indicated on the table for all days of the week and times of the day.
Figure 10. Mn/DOT allowable lane closure chart example (9)
19

The other components of the Lane Closure Manual include a general explanation of the lane closure determination process (using deterministic queuing) and possible exceptions to the permitted lane closure times. These are explained in the respective Survey Results sections of this report. The manual also provides an example of the determination process and explains how to read the tables.
A benefit of the Mn/DOT Metro Lane Closure Manual is the identification of the number of lanes that can be closed throughout the day. Instead of simply stating a period of time that a lane can be closed, specifying the number of lanes closed can help with project scheduling and sequencing by indicating to users when more than one lane closure is allowable (e.g., two lanes closed on a facility with four lanes in each direction). The lane closure determination is a simple process, and an example of the determination of a permitted lane closure analysis is provided in the manual to allow users to understand the process.
3.5 Missouri Department of Transportation (MoDOT)
The Missouri Department of Transportation documents work zone challenges and opportunities to improve work zone performance in their Work Zone Guidelines (12). The document describes strategies to reduce motorists’ delays (such as working during off-peak hours) and speed limits that reflect current work zone conditions. MoDOT has state and district work zone coordinators to coordinate all lane closures throughout the state. The statewide work zone coordinator oversees and coordinates lane closures statewide and across district boundaries and also considers lane closure impacts. The district coordinators handle lane closure issues within their respective districts, including maintenance, commercial utility work, and permit work.
Prior to awarding a project, the Project Core Team determines if MoDOT is taking appropriate actions to reduce work zone impacts on the public, and the project manager conducts a traffic analysis to determine if traffic impacts are minimized. Work Zone Guidelines also describes the theory behind lane capacity analysis and explains when traffic volume–reducing strategies should be applied for freeways, interstates, multi-lane roadways without medians, and two-lane roadways. A roadway capacity table is included that should be used to compare with hourly volume tables (which are acquired from the district work zone coordinator) to determine if lane closures should be allowed and if volume reduction strategies should be applied. This table is shown in the Survey Results section of this report.
3.6 Ohio Department of Transportation (ODOT)
The Ohio Department of Transportation’s Lane Closure policy is described within the Policy for Traffic Management in Work Zones Interstate and Other Freeways (13). The policy, effective July 2000, was developed to promote the continuous movement of traffic through all work zones by eliminating or reducing delays. The policy consists of two sections: (1) Organization and Responsibilities and (2) Policy Compliance Process. The Organization and Responsibilities section outlines the responsibilities of the District Work Zone Traffic Managers, County Managers, Multi-Lane Coordinators, Office of Traffic Engineering, and the Maintenance of Traffic Exception committee. The Policy Compliance Process section outlines the process used
20

to ensure that lane closures follow the policy. This process includes directions for the analysis of queues (required when a lane closure is needed outside of the permitted lane closure policy), the Maintenance of Traffic plan, information on the submittal of a Traffic Management Plan, and an explanation of required implementation and evaluation procedures. Many of these components are further explained in the Survey Results section of this report.
The policy appendices include the list of the capacity thresholds for queuing to begin and their use in the queue (delay) analysis. The method of analysis (the computer program QUEWZ-92) is also described. The methodology of the analysis is explained later in the survey results. Also included is a list of possible strategies to help reduce congestion and increase mobility. This list, in table format, includes the pros and cons of each strategy, suggested times when each strategy should be used, and the cost of applying each strategy. Finally, the appendices include a list of potential project stakeholders, the Maintenance of Traffic in Construction Work Zones checklist for the Project Communications Plan, and the Project Communication Manual (which details the communications plan).
The lane closure component of the policy includes an internet application, the Permitted Lane Closure Map (PLCM), where a user can search for permitted lane closure times on select interstate and freeway segments within a district (12). The user searching for permitted lane closure times inputs the following information: year of the last Average Daily Traffic (ADT) count collected, district number, county, route, and the section of that route. The search yields a table—similar to the screenshot in Figure 11—showing the permitted lane closure times.
Figure 11. ODOT permitted lane closure chart example (12)
21

The times of the day when lane closures are not permitted are indicated by the shaded hours for the different periods of days during the week, for construction and non-construction seasons. The table also includes the lane capacity used when determining if a lane closure is permitted. These capacities vary from facility to facility. This is further explained in the respective Survey Results section of this report.
The PLCM application on the internet is a convenient way to find lane closure times for certain facilities. The lane closure capacities are adjusted based on conditions of the facility, so a better approximation of the lane capacity is applied; hopefully these adjustments can help eliminate unnecessary lane closure restrictions that could otherwise be caused by a statewide blanket lane capacity. The ODOT policy is widely accepted as a model policy dealing with work zones, especially as states attempt to meet the requirements of the national Final Rule of Work Zone Safety Mobility policy.
3.7 Wisconsin Department of Transportation (WisDOT)
The Wisconsin Department of Transportation has only minimal information available on their lane closure policy, because it is still under development. The recommended lane closures are available for only the highest volume freeways, typically in urban areas including the Milwaukee area. Future goals for the lane closure policy include expanding the permitted lane closure times to other regions of the state and implementing a lane closure reporting system similar to that of Caltrans.
22

4. SURVEY RESULTS
In order to understand the intricacies of certain states’ lane closure policies or strategies, a survey was administered to each of the selected STAs (listed previously). The survey consisted of three parts: (1) Policy Development, (2) Exceptions to the Policy, and (3) Policy Enforcement. The responses to each question are discussed in a section below and the responses are organized by question and summarized in a table. Often, STA representatives provided extensive responses to some questions, either through the survey or by referencing their respective lane closure manuals. When the manuals were referenced, the survey respondent typically provided further explanation to clarify the lane closure policy. This section includes results of the survey, combined with material from written documents, to reveal the mechanics of the application of each state’s lane closure policy. While some of these strategies were quite extensive, well-developed, and well-documented, others were in an embryonic state and undergoing development.
4.1 Lane Closure Policy Development
The analysis methods used as a basis for lane closure policies development varies from STA to STA. Each STA begins by identifying the facilities included in their policy or strategy (e.g., only Interstate highways or all Interstates and multi-lane highways) and the expected outcome, or objective, of that policy. Some STAs use performance measures as a method to determine how well the state is achieving satisfactory results based on the expected outcomes of the policy. The survey includes relevant evaluation methods and procedures used by each state. The process of determining permitted or non-permitted lane closure times includes various inputs and the analysis used to support the determination process. STAs differ in the variables used to estimate work zone lane capacities (e.g., some include terrain, lane width, and truck percentage in their capacity analysis) and the methods used to determine these capacities (e.g., values derived from the Highway Capacity Manual or values derived from field collected data).
The analysis methodologies used to make lane closure determinations are generally standard methods used to estimate queue lengths and delays. The analyses are typically based on microscopic simulation models or spreadsheets or traffic operations models such as QUEWZ or Quick Zone that use deterministic queuing models. The inputs to these models usually include the traffic volume approaching a work zone during a certain time of day and day of the week, but the models may also require a calculation of trucks and recreational vehicles to be input, permitting the calculation of passenger-car equivalents. Volume estimates used vary from recent hour-of-the-day and day-of-the-week counts collected from nearby Automatic Traffic Recorder (ATR), to rough hourly estimates derived from applying hourly factors to an estimated AADT. Hourly volumes are used to better distinguish when peak travel periods occur and what those volumes are; thus, lane closure times are usually given in hourly increments. The objective of the first section of the survey is to understand the components that each STA uses in developing its lane closure policy or strategy.
23

4.1.1 Facility Inclusion in Policy or Strategy
The following surveyed STAs have developed lane closure policies, covering the specific facilities listed below:
• Caltrans—State highway system • CDOT Region 1—All state highways and interstate highways within Region 1 • CDOT Region 6—All state highways and interstate highways within Region 6,
excluding those maintained by the cities of Denver and Aurora and portions of I-25 affected by Denver’s Transportation Expansion Project
• INDOT—Interstate highways • Mn/DOT Metro—Interstate and state highways in the Metro District • MoDOT—Interstate and state highways • ODOT—State-maintained interstates and freeways • WisDOT—High-volume urban-area freeways (Statewide lane closure times for
freeways and expressways are currently in development.) 4.1.2 Expected Outcome of Policy
The expected outcomes, or purposes, of the lane closure policies are generally similar for all states questioned. For most STAs, the stated purposes were related to improving safety and mobility through the work zone, as described below:
• Caltrans—To minimize motorist delays, through the use of delay-minimizing strategies, without compromising public or worker safety or the quality of the work being performed (3).
• CDOT Region 1—“To establish uniform criteria and authoritative guidance for scheduling lane closures in Region 1…. The Strategy was formulated in order to strike an appropriate balance between delays to the traveling public in the work zone and the cost of construction and maintenance” (8). Through the survey, Clark Roberts noted that the strategy is a tool to help the Project Engineer in Construction select the allowable hours to set up lane closures that will result in the least amount of delays to the traveling public, with the greatest benefits being improved safety and mobility.
• CDOT Region 6—“To establish uniform criteria and authoritative guidance for scheduling lane closures in Region 6…. Strategy was formulated in order to strike an appropriate balance between delays to the traveling public in the work zone and the cost of construction and maintenance” (9).
• INDOT—“To minimize the impacts on the traveling public resulting from the implementation of the work zone” by eliminating or reducing delays (and road user costs) in order to maintain continuous traffic movement through all work zones (10).
• Mn/DOT Metro District—“To provide information useful for advance planning of lane closures that will minimize traffic impacts and motorist delays while promoting safety for work crews and the traveling public for planned lane closures” (11).
24

• MoDOT—According to the survey response of Scott Stotlemeyer, “Proper application of the guidelines results in less congestion, delay, and driver frustration during peak travel times, thereby providing a safer work and driving environment.”
• ODOT—To provide continuous traffic movement through all work zones by eliminating or reducing traffic delays and by minimizing impacts on the traveling public (11). Survey respondent Mack Braxton added that the department strives to provide the same number of lanes during construction as before construction. If an engineering design cannot reduce the delay, the state will implement strategies to mitigate the length of time the area of construction causing the delays will be in operation.
• WisDOT—To “reduce Congestion and crashes associated with work zone lane closures,” according to survey respondent Tom Notbohm.
Some STAs indicate that their manual or strategy is not a standalone document. Mn/DOT Metro District, CDOT Region 1, and CDOT Region 6 indicated that the manual or strategy should be used only as a reference guide in conjunction with relevant available information or other manuals and policies in place. For example, the Mn/DOT Metropolitan District Lane Closure Manual is intended to be used as a reference guide when making decisions regarding planned lane closures. The purpose of the manual is to help determine when a lane closure is appropriate, while other documents are used to determine the appropriate method and rationale for the closure.
4.1.3 Formal Performance Measures
In order to evaluate the effectiveness of the lane closure policies or to determine whether the expected outcomes of the lane closure policies were met during a given project, some STAs have developed formal performance measures. Table 2 illustrates which STAs have formal performance measures, what the performance measures are, and how agencies evaluate compliance with these performance measures.
Table 2. Formal performance measures summary Agency Yes/No Formal performance measures and evaluation Caltrans Yes Delays or lane closures that extend beyond permitted time (Post-
Closure Evaluation) CDOT Region 1 No* — INDOT No* — Mn/DOT Metro No* — MoDOT Yes Mobility aspects of work zone and overall safety performance
(Reported in quarterly MoDOT’s Tracker) ODOT Yes Queue length (Operational Performance Index reviews) WisDOT Yes 30-minute maximum additional delay *Personnel still monitor work zone traffic conditions to provide feedback and updates
Caltrans has a formal process of measuring the performance of a lane closure when a lane is closed beyond the allowed time or when a lane closure creates delays greater than 30 minutes
25

beyond typical traffic delays (3). When a project exceeds the expected delay or runs outside of the closure window, the policy dictates that a Post-Closure Evaluation statement be submitted to the headquarters’ Traffic Operations Program, Office of System Management Operations. This statement must be submitted by the functional unit performing the lane closure within five days of a lane closure exceeding the threshold criteria. The statement explains
• the cause and impact of delays, • either the actions taken or yet to be taken in order to avoid or mitigate an occurrence
or recurrence, • the reason the expected delay was exceeded and/or why it was necessary to exceed
the closure window, and • insight for avoiding a future recurrence of the situation.
Through the survey, it was found that Caltrans is in the process of developing other performance measures—such as showing the frequency of lane closures removed after the time the lane(s) were supposed to be opened—but, at this time, additional performance measures are yet to be determined.
MoDOT reports measures of performance in their performance measurement tracking system, Tracker (15). The objective of Tracker is to assess how well the agency delivers services and products to the public, its customers. The measured areas include mobility and safety aspects of work zones. Tracker is available on the internet and is published quarterly.
ODOT is another STA that has an extensive performance measuring process called the Operational Performance Index (OPI). In Appendix A of the policy, the allowable queue thresholds are noted. Unacceptable conditions thresholds occur when queues are longer than 0.75 mile for more than two hours or longer than 1.5 miles for any period of time. The project engineer contacts the District Work Zone Traffic Manager if these thresholds are exceeded. The District Work Zone Traffic Manager performs on-site studies to determine what the problem is and why it is occurring.
To calculate the OPI, the ODOT Central office reviews interstate and interstate look-alike projects to evaluate and rate the performance measures for each day of the project. Each work zone is rated and videotaped in every direction. The reviews include a staff member from the Office of Traffic Engineering and the Central Office Construction as well as the District Work Zone Manager of the district under review and a Federal Highway Administration (FHWA) representative. A score from one to six is given to each project being reviewed, with six being exceptional and one being unacceptable. If a project is given a score of three or below on the review, an in-depth project review covering project design and construction is performed to determine what issues are causing the unacceptable situations.
4.1.4 Mechanics of Permitted/Refused Lane Closure Determination
State transportation agencies can use various methods to determine when and where a lane closure is or is not permitted. The procedure generally consists of the following tasks: (1)
26

obtaining current hourly traffic volumes where the work zone will be located, (2) determining a work zone lane capacity, (3) determining the impacts on traffic caused by a work zone, and (4) using these components to determine whether or not a lane closure will be permitted. Commonly used methods include either a computer analysis (using CORSIM, QUEWZ, QuickZone, Synchro/Simtraffic, etc.), static volume thresholds (ADT or hourly), or both. Some policies have very detailed analysis steps and procedures while others simply state a method with little instruction or discussion (see Table 3).
Table 3. Mechanics of permitted/refused lane closure determination summary Agency How traffic
volumes are obtained
Thresholds for allowing or not allowing a lane closure
Method used (and comments)
Caltrans N/A Road user delay time: 30 minutes or delay threshold set by District Traffic Manager, whichever is less Checked against other conflicts
Highway capacity; lane capacity (accounts for truck percentages)
CDOT Region 1
ATR Hourly Counts; AADT & assumed hourly distributions
Lane capacity: 1600 vphpl minus other factors 1100 vphpl for certain mountainous regions
Highway Capacity Manual (accounts for surface grades and truck percentages)
INDOT Recorded volumes within 3 years
Queue length and road user delay time: Queue >1 mile for longer than 2 hours, Queue >1.5 miles for any period of time, or 10 minute road user delay
Traffic simulation programs (Quickzone, Quewz-92, Synchro/ Simtraffic, Corsim, etc.)
Mn/DOT Metro
RTMC* detectors for daily and hourly volumes; tube counts
Lane capacity: 1800 vphpl
Highway Capacity Manual
MoDOT N/A Lane capacity: 1240 vphpl for one of two lanes open 1430 vphpl for tow or three lanes open
Hourly volumes
ODOT ATR Hourly Counts; hourly percentage applied to AADT if no ATR (percentage from nearby ATR or statewide distribution)
Lane capacity and queue length: 1000–1490 vphpl (varies by truck percentage and terrain) Queue > 0.75 miles for longer than 2 hours Queue > 1.5 miles for any period of time
Highway Capacity Manual or Microscopic Models (Quewz; accounts for terrain and truck percentage)
WisDOT N/A Lane capacity: Generally 1500–1600 vphpl Limited to 1200–1300 vphpl in certain regions
Highway Capacity or Simulation (calculations performed in spreadsheet, Corsim, etc.)
*RTMC is the Regional Traffic Management Center 4.1.4.1 Traffic Volumes
The predominant source of hourly traffic counts is through Automatic Traffic Recorders (ATRs). ATRs provide hourly volumes to determine the hours that lane closures should not be permitted.
27

While ATRs can provide timely and continuous data, they are not readily located throughout a system. Therefore, some state transportation agencies have developed methods to estimate daily and hourly volumes from readily available data. CDOT Region 1 uses Average Annual Daily Traffic (AADT) data on these sections and applies assumed hourly distribution factors to find the daily traffic volumes. CDOT Region 6’s strategy uses a general comparison method, relying on hourly data from a nearby segment with similar orientation, direction of travel, and close proximity. Not all state highway segments in CDOT Region 6 have weekend volume counts; CDOT has developed an expression which estimates weekend volumes as a function of the road AADT. Also, Saturday traffic volumes are sometimes used to represent weekend conditions, because Saturday traffic is consistently higher than Sunday traffic in the region.
ODOT has ranked, in order of preference, each method they have available for estimating hourly volumes:
1. When an ATR is located within a roadway segment containing the planned work zone, the hourly ATR volumes are used.
2. When the ATR is located upstream or downstream of the segment on the same route, hourly car and truck percentages are used.
3. On locations that are similar to another route with an ATR, hourly percentages (from the ATR) are applied to segment AADT.
4. Proportions of the AADT are distributed to hours using the statewide hourly distribution developed for planning purposes.
The ATRs used for the Permitted Lane Closure Map must have bi-directional counts for every Thursday, Friday, and Saturday that fall between the first and twentieth days of the month, during the months of August and December.
When hourly percentages are used, such as for method number two, the statewide percentages are composite percentages calculated from ATRs on interstate and freeway facilities. Statewide sample counts are taken for 24 or 48 hours for each facility functional class, and the percentage of car and truck distribution is recorded by hour of the day. These hourly percentages were applied to AADT counts at a specified location to estimate hourly volumes used in the Permitted Lane Closure Map.
4.1.4.2 Threshold Values
Thresholds describe the maximum traffic volume allowed in a lane that will still be able to maintain an acceptable level of queues and delays. If conditions at the work zone exceed this threshold value, then unacceptable delays generally result. STAs vary in their descriptions of threshold values. Some rely solely on lane capacity values, while others use their lane capacity values to estimate a maximum queue length or time of delay a vehicle experiences while traversing the work zone. For the researched states, the lane capacity values ranged from 1,800 vehicles per hour per lane (vphpl) (Mn/DOT Metro) to 1,000 vphpl (ODOT), depending on the reduction factors used. The acceptable timeof delay also varied between the STAs that used maximum delay as a criterion for determining whether a closure would be permitted. Maximum permitted delay varied from 10 minutes in Indiana to 30 minutes California.
28

For example, the freeway capacity rates for some typical operations are documented in the Caltrans Freeway Operations Department Report No. 69-3. Table 4 summarizes these rates.
Table 4. Freeway capacity rates for some typical operations (14) Number of lanes in one direction of travel (normal operation)
2 3 and 4 4
Number of lanes open in one direction 1 2 3 Type of operation Vehicles per hour Median barrier or MBGR* repair 1500 3200 4800 Pavement repair or pavement grooving 1400 3000 4500 Striping or resurfacing 1200 2400 4000 Pavement markers installation 1100 2400 3600 Middle lanes for any reason — 2200 3400 *Metal beam guard rail
Caltrans uses road user delay as the method of determining whether or not a lane closure will be permitted. For construction and permits projects, Caltrans uses an average of 1,500 vehicles per hour per lane (vphpl). Caltrans specifies that a traveler’s trip should not be increased by more than 30 minutes due to a planned work zone (this excludes emergency work). District Traffic Managers (DTMs) may set a lower maximum in their respective districts if they feel that 30 minutes is too long of a delay. Because of the lifestyle diversity between different districts in California, one district may view 20 minutes of delay as completely unacceptable, while another may find 20 minutes of delay acceptable. The lesser of these delay limits is the maximum delay threshold allowed. Only the District Lane Closure Review Committee (DLCRC) can approve a higher delay threshold for a project.
The CDOT Region 6 Strategy states that no freeway lane closures are to be initiated during weekday morning or evening peak travel periods. The hours between 5:30 and 8:30 AM are designated as the morning peak period, while the evening peak period occurs between 3:00 and 6:00 PM (9). Due to traffic volumes and patterns, some freeway lane closure schedules may have restrictions beyond simply avoiding these peak hours; the extended hours are displayed on lane closure charts.
MoDOT includes roadway capacities for work zones in their Work Zone Guidelines (12). These capacities, shown in Table 5, include various lane configurations in terms of open and closed lane possibilities. Lane closures and capacities are provided in terms of the number of lanes remaining open, given 2, 3, 4, or 5 lanes in one direction. MoDOT also identifies lower volumes (below the capacity); caution should be used when closing lanes at these lower volumes, because traffic flow may break down at these volumes, resulting in queuing. These volumes are compared to the hourly volumes to determine if a lane closure is permitted.
29

Table 5. MoDOT roadway capacities (12) Interstate and freeway
lane conditions Capacity restrictions Cautionary zone
Total lanes
Open lanes
Vehicles per hour per lane
Total capacity in open lanes
Vehicles per hour per lane
Total capacity in open lanes
3 1 960 960 750 750 2 1 1240 1240 1000 1000 5 2 1320 2640 1000 2000 4 2 1420 2840 1100 2200 3 2 1430 2860 1100 2200 4 3 1480 4440 1100 3300
In order to determine if a lane closure is allowed, the lane capacity through the work zone needs to be determined. The Ohio Department of Transportation uses the percentage of trucks on the facility and the terrain type to determine the lane capacity, as shown in Table 6 below. The theoretical lane capacity table is based on Highway Capacity Manual (HCM) 2000 Formula 22-1 (17). The equation has been simplified from the formula in the HCM to only include terrain and percentage trucks in total volume (14). Truck percentages are estimated each year using the average from the roadway traffic counts. The adjustment factors for work zone intensity and work zone ramp location are both assumed to be zero vphpl.
Table 6. Lane capacity accounting for terrain and truck percentage (14) Work zone capacity (vphpl) truck percentage Terrain < 15% 15% ≤ x < 30% ≥ 30%
Level 1490 1390 1330 Rolling 1310 1100 1000 Custom Contact PLC administrator for use of custom capabilities.
These should only be used in unique situations. 4.1.4.3 Tools Used to Determine Lane Closure Times
State transportation agencies use various methods when determining the times that lane closures should be permitted for work activities on the facilities specified by the STA’s respective policy/strategy. When determining the times lane closures are permitted, the lane capacity and existing volumes need to be known or determined, as explained in the previous two subsections. After determining theoretical lane capacity and the facility volumes, the analysis outputs typically include delay time or queue lengths. Through the survey results, it was found that the most common method used to determine when lane closures are permitted was deterministic queuing methodology. The Highway Capacity Manual (HCM) uses deterministic queuing methodology when analyzing lane capacity reductions in short- and long-term work zones. Most of the STAs that use the HCM calculations decrease the lane capacity value through reduction factors, such as terrain and the percentage of hourly volume that consists of truck traffic. STAs also use deterministic queuing programs (e.g., Quewz and Quickzone), which are based on similar HCM methodology, to simulate impacts at and impacts caused by a work zone. The other
30

common programs used were microscopic simulation models, including CORSIM, Synchro, and SimTraffic.
Figure 12 shows a sample of the calculations used by Caltrans when determining permitted lane closures (4). Outputs of the delay calculations include the maximum individual delay, total vehicle delay hours, the total cost of delay, and the delay cost per every ten minutes.
Percent Truck: 0.0%
2 Lanes
Cost per Truck: $24/Veh-HrPercent Passenger Cars: 100.0% Cost per Passenger Car: $9/Veh-Hr
Number of Lanes Existing: 4 Lanes Cost for Mixed Flow Traffic: $9/Veh-HrNumber of Lanes Open: Single-Lane Capacity: 1500 Veh/Hr
Open-Lane Capacity: 3000 Veh/Hr
Time Demand (Veh) Cumulative Demand (Veh)
Cumulative Capacity (Veh) Difference (Veh) Area
(Veh-Hr)Queue
Length (mile)
Individual Delay
(minutes)
6 AM 0 0 0 0 0 0.07 AM 5309 5309 3000 2309 1154.5 2.7 468 AM 6945 12254 6000 6254 4281.5 7.4 125
Max. Individual Delay: 125 minutesVehicle Delay Hours: 5,436 veh-hrTotal Cost of Delay: $48,924
Delay Cost/10min: $4,077
Operation: Multilane Closure
Count Date: 5-3-2001
RTE Location:
Demand vs. Capacity
0
2000
4000
6000
8000
10000
12000
14000
6 A
M
7 A
M
8 A
M
TIME
CU
MU
LATI
VE V
EHIC
LES
Demand Capacity
Figure 12. Sample of Caltrans delay calculations spreadsheet (2)
31

ODOT lists the process of determining lane closure times on their permitted lane closures website (14). In order to determine if a lane closure is permissible, the hourly volumes are determined and compared to the work zone capacities. If the hourly volumes exceed the work zone capacity, no closure is permitted. In Ohio, weekday closures for rural locations are defined as Monday through Thursday, and weekday closures for urban locations are defined as Monday through Friday. Weekday permitted closure times for the construction season are determined using the calculated lane capacity, along with the seasonally adjusted Thursday ADT in August (for rural locations) or the seasonally adjusted Friday ADT in August (for urban locations). For the non-construction season, the seasonally adjusted Thursday ADT in December is used for rural locations, the seasonally adjusted Friday ADT in December is used for urban locations, and the calculated lane capacity is used in either location to determine permitted weekday closures. If the segment in question uses an ATR, the maximum Thursday or Friday ADT volume is selected from August or December (excluding Christmas week).
Weekend permitted closure times for the construction season are determined by comparing the calculated lane capacities and the seasonally adjusted Friday ATR volumes in August for rural locations and the seasonally adjusted Saturday ATR volumes in August for urban locations; for the non-construction season, the seasonally adjusted Friday ADT in December is used for rural locations and the seasonally adjusted Saturday ADT in December is used for urban locations. If the segment uses an ATR, the maximum or Friday ADT volume is selected from August or December (excluding Christmas week). Finally, district staff members are asked to provide any additional information they have regarding the highway section in question; for example, special events (e.g., a professional football game) might result in not permitting a lane closure.
For Ohio, Appendix A of the Traffic Management in Work Zones Interstate and Other Freeways Policy describes the queue lengths and durations allowed. The queues are modeled through traffic operations models (with emphasis) or using a microscopic simulation model and the work zone lane capacities displayed in Table 5. The ODOT thresholds for queue lengths are as follows:
• Acceptable work zone impacts o Queues less than 0.75 miles o Queues between 0.75 miles and 1.5 miles, if queue duration is less than two hours o Additional advanced work zone warning signing should be specified for queues
expected to exceed 0.75 miles for any period of time • Unacceptable work zone impacts
o Queues greater than 0.75 miles for more than two hours o Queues greater than 1.5 miles for any period of time o Alternate strategies should be considered
The Indiana Department of Transportation also uses maximum queue length as a threshold for determining whether to permit a lane closure (8). These threshold lengths and resulting actions from the project queue analysis are similar to those of Ohio:
• Acceptable work zone impacts o Queues less than 1 mile
32

o Queues between 1 mile and1.5 miles, if queue duration is less than two hours o Additional advanced work zone warning signing should be specified for queues
expected to exceed 1 mile for any period of time • Unacceptable work zone impacts
o Queues greater than 1 mile for more than two hours o Queues greater than 1.5 miles for any period of time o Alternate strategies should be considered
4.1.5 Frequency of Lane Closure Traffic Condition/Volume Updates
One issue encountered when lane closure times are determined for individual facilities is the potential of changed traffic conditions. Due to changes in traffic, the permitted lane closure times may not reflect actual traffic conditions. For instance, if the delay or travel time is too long on a facility, motorists will find alternate routes to complete a trip in less time. A traffic volume count taken during periods of delay may be lower, reflecting some traffic diversion. Some facilities may have been improved since the last volume counts were taken, yielding higher actual traffic volumes than the last traffic counts suggest. Consequently, volumes may increase on the improved facility while decreasing on a nearby parallel route.
State transportation agencies update their traffic volume counts and/or models to represent actual traffic conditions on a facility as they feel it is necessary. Our survey found that the surveyed STAs updated their counts on varying schedules, as summarized in Table 7.
Table 7. Lane closure policy/strategy update frequency summary STA Frequency of lane closure policy or strategy updates Caltrans Uses most current volumes for each work zone analysis CDOT Region 1 Approximately every 5 years CDOT Region 6 Approximately every 5 years INDOT Volumes used should be within 3 years Mn/DOT Metro Approximately every 2 years MoDOT Every 2 years ODOT Every 3 years (non-ATR counts)
Continuously (ATR counts) Yearly for Permitted Lane Closure Map
WisDOT As needed if congestion occurs at location in question
The Indiana Department of Transportation uses historical volumes, no more than three years old, for queue analysis using simulation models (discussed in previous section) to ensure that the analysis reflects current regional traffic patterns and accounts for seasonal traffic surges that may occur during construction (8). For traffic counts a couple of years old, volumes should be expanded to construction year levels using appropriate growth factors, as determined by INDOT.
4.1.6 Communication of Lane Closure Policy
For a lane closure policy to be applied consistently, offices throughout the transportation agency need to understand the lane closure policy. For example, even though the lane closure policy
33

may have been mainly created for the purpose of regulating closures due to roadway reconstruction, district maintenance managers must take into account lane closure policies when scheduling maintenance-related lane closures. For roadway facilities where local governmental agencies or utilities services may schedule lane closures, the policy needs to be communicated with these external organizations so that they can make plans in compliance with the policy. Thus, the application of the policy requires communications and training across offices within the transportation agency but also with relevant external organizations (see Table 8).
Table 8. Summary of policy/strategy communication to DOT staff and external forces
Other communication techniques of the policy to: STA External access to policy: information available?* Internal forces (STA) External forces**
Caltrans No: Lane closures are reported electronically over statewide LCS
• Distributed department-wide through Transportation Management Plan Guidelines
• District level training of construction, maintenance and permits personnel
• Traffic Operations Lane Closure System
• Constant communication between Project Managers and local agencies
• Permits staff handles utility requests submitted through LCS
CDOT Region 1
Yes: Electronic copy of strategy
Maintenance given hard copies for use during planning stages
• Access/permits office handles all state highway work, which requires a permit
• Traffic control issues handled during permit review
INDOT Yes: Interstate Highways Lane Closure Policy
Maintenance provided hard copies and receives verbal training
Located on website under Contractor and Designer Information
Mn/DOT Metro
Yes: Lane Closure Manual
Located on website Referenced in all permits and contracts for state roads
MoDOT Yes: Work Zone Safety & Mobility Policy
Staff provided with a hardcopy Lane closure times specified through contract specifications
ODOT Yes: PLCM and Traffic Management in Work Zones
• External and internal forces must follow Traffic Engineering Manual
• Note included in plans concerning PLCM
WisDOT No: Located on internal website
• 30-minute delay guideline published in project design manual
• Lane closure restrictions communicated to contractors through project special provisions
Plans to develop an online lane closure permitting system in future
*Refers to external access via the internet. **Contractors, utilities, etc.
34

4.1.7 Official Authorization of the Lane Closure Policy
In order to make the lane closure policy or strategy official, each state needs an official or an official body to authorize the lane closure policy. The authorizing officials for the researched STAs are summarized in Table 9.
Table 9. Lane closure policy/strategy approval STA Authority granting approval Caltrans Chief Deputy Director CDOT Region 1 Regional Transportation Director INDOT Deputy Commissioner, Highway Management* Mn/DOT Metro Metro District Traffic Engineering office MoDOT Chief Engineer ODOT Director of Transportation WisDOT Statewide administrators/bureau managers
*New policy in development will be approved by this official.
4.1.8 Variations to the Policy Due to Local Special Traffic Conditions
Traffic can vary based on unique local conditions. Peaks in traffic can create unreasonable queues and delays. Local conditions that can cause traffic to vary include special events (e.g. concerts, sporting events), weather (e.g., storms, blizzards), seasonal variances where volume can increase in one direction of travel due to tourism (e.g., traffic heading into the mountains on Fridays and returning on Sundays), or holiday traffic. Often, these variations in traffic patterns are unique to a particular area or region but they should be taken into account in the lane closure policies. Table 10 illustrates the methods used by the states in our survey to address these unique traffic volume variations in their lane closure policies or strategies. Detailed accounts of the policy variations follow.
Table 10. Formal variations described in policy/strategy STA Yes/No Types of variations described Caltrans Yes Each lane closure is reviewed individually to account
for variations, specific holidays CDOT Region 1 Yes Special events, seasonal, weekday/weekend,
emergency situations CDOT Region 6 Yes Special events, seasonal, weekday/weekend,
emergency situations INDOT Yes Seasonal, regional patterns Mn/DOT Metro No * MoDOT No ** ODOT Yes Seasonal, holidays WisDOT Yes Holidays, special events, seasonal
*Next edition will account for seasonal variations. **Variations are considered in hourly volume reviews.
35

Due to heavy travel to and from the front range of the Rocky Mountains for recreational activities and special events occurring in and around the Denver area, Region 1 of the CDOT (the Region surrounding Denver on the south, east, and west) has created specific policies to deal with the unique traffic volumes created by local traffic patterns (8). The CDOT Region 1 Strategy states that when a special event is known to create high traffic volumes, lane closures are not allowed from two hours before the event begins to one hour after the event ends. Traffic patterns also vary seasonally due to seasonal mountain recreation activities. High directional traffic volumes occur on I-70 prior to and at the end of the weekend, due to travel to and from the mountains. Therefore, CDOT Region 1 has developed permitted lane closure schedules by seasons and days of the week. They include the following:
• Summer weekday • Spring/fall weekday • Winter weekday • Summer Saturday • Spring/fall Saturday • Winter Saturday • Summer Sunday • Spring/fall Sunday • Winter Sunday
The months are classified by the following seasonal categories:
• Summer—June, July, August • Spring/fall—April, May, September, October, November • Winter—December, January, February, March
CDOT Region 6 (the Denver Metro area) uses seasonal schedules similar to Region 1, but Region 6’s strategy only takes into account seasonal volume variations on road segments in the western part of the region—those roads that are oriented towards the mountain areas west of Denver. An example is shown in Figure 13 (9).
36

Figure 13. Location of Wadsworth Boulevard (SH 121) in Denver metro area (7)
With regard to special events within CDOT Region 6, Appendix E of the Strategy outlines their procedures (9). The appendix has a table of four facility segments and four special event locations (Invesco Field, Pepsi Center, Coors Field, and Downtown Denver). When an event occurs at a venue with attendance greater than 10,000, the table defines whether a lane closure will be allowed during an event (the period of time from two hours before the event to one hour after the event).
In Ohio, ODOT accounts for seasonal variations by differentiating between the construction season and non-construction season, as follows (14):
• Construction season—April 1 through November 30 • Non-construction season—December 1 through March 31
Seasonal Adjustment Factors (SAFs) are used to adjust the ATR short-term traffic volume counts—24 or 48 hours in duration, as described in the ODOT Traffic Volumes subsection—to an average daily traffic volume. The adjustment factors are used to account for tourism and other seasonal traffic patterns throughout the state, accounting for the seasonal traffic volumes during
37

the construction and non-construction seasons. The output includes monthly averages by day of the week by functional class.
4.1.9 Exempt Activities
Some state transportation agencies exempt specific activities from restrictions placed on their lane closure policies (see Table 11). For example, all states surveyed exempted emergency lane closures involving public safety, and some organizations treat maintenance lane closures differently than construction lane closures. While some of the responding STAs specify activities that are exempt or represent special cases, others handle circumstances on a case-by-case basis. In addition to closure for public safety, emergency repairs are most commonly excluded from official lane closure strategies. For example, the Indiana Department of Transportation defines emergency repairs as activities resulting from pavement or bridge deck failures, bridge structure impact damage, damage to roadside appurtenances, or loss of slope stability.
Table 11. Exempt construction or maintenance activities STA Yes/No Activities exempt or differing from lane closure policy Caltrans Yes Construction and maintenance differ CDOT Region 1 Yes Public safety emergencies and certain construction activities (e.g., rock
blasting, temperatures for material placement) CDOT Region 6 Yes Public safety emergencies INDOT Yes Emergency repairs and routine district maintenance Mn/DOT Metro Yes Emergency repairs and “case by case” projects MoDOT Yes Emergency work, permanent lane closures ODOT No * WisDOT Yes Long-term construction with necessary congestion mitigation
strategies *Exception is given reluctantly if no other options are possible.
The survey response indicates that the Caltrans lane closure approval process applies to all work conducted on the state highway system, both for moving and static lane closures. System criteria are slightly different for construction and maintenance activities. Lane closure charts are used to identify days and times that construction work is allowed. These charts are typically developed for construction activities using roadway geometrics and historical traffic volumes, based on zero delay. The lane closure charts are developed for maintenance work based on 5–15 minutes of delay. As stated before, Caltrans sets a maximum delay of 30 minutes, but a DTM may lower that delay maximum as seen necessary in his/her respective district. Unlike construction work, maintenance work is usually done by Caltrans’ own staff members. Thus, the lane closure can be picked up quickly, and maintenance work is not assessed as a violation of lane closure polices if the closure is picked up at the Department’s request.
The Indiana Department of Transportation addresses the routine district maintenance exemptions in the District Maintenance Interstate Lane Closure Policy, which was developed by the districts and the Operation Support Division (8).
38

4.2 Exceptions to the Policy
Exceptions to the lane closure policies are sometimes needed to complete work in a timely and cost-effective manner. Many policies outline the typical exceptions that can potentially be granted—such as emergency repairs or other work deemed necessary that will extend a lane closure—and describe the exception-granting process. This includes identification of an exception, criteria used to determine if a lane closure is permitted beyond a predetermined time, how the lane closure request is submitted, and who has final approval. For example, it may be necessary to determine policy exceptions in the field in instances such as early lane closure removal or initiating a lane closure earlier than scheduled. Sometimes surges of traffic may increase volumes beyond capacity, thus requiring a removal of the lane closure to alleviate the unexpected congestion. Similarly, prior to closing a lane, a period of time that typically experiences volumes exceeding capacity of the facility with a lane closure may not be experiencing typical volumes; an exception may be granted to close the lane earlier than the scheduled date in order to take advantage of an extended work period.
4.2.1 Process for Identifying and Granting Exceptions
While the policies provide rules or guidance regarding when a lane can be closed to perform construction work, there are occurrences when exceptions need to be analyzed and possibly granted. The agencies surveyed first define the situation that may require an exception. Generally, an exception is requested when it becomes too costly to remove the lane closure(s) in terms of construction costs. Some of the agencies surveyed have criteria or a formal process in place to help determine if an exception can be permitted (see Table 12). The final step in the exception process is granting the exception.
39

Table 12. Summary of exceptions (identification, criteria, and exception-granting process) STA When exceptions
are needed Criteria for exception to be permitted
Process for granting exceptions (submittal and approval)
Caltrans When lane closure delays >30 min
If TMP* measures can reduce delay to <30 min. or within threshold
Exceptions sent to DLCRC** to approve higher delay threshold
CDOT Region 1
Project has unique characteristics that require deviation
Unique characteristics of the project require that work must be performed during non-permitted lane closure times
• Requests are submitted. • Interstate: Approval from Region 1
Traffic Engineer or designee. • Other State Highways: Traffic Resident
Engineer INDOT When operation
will restrict or extend lane closure outside of allowable times
Cost of work is less than cost of additional effort of keeping lane(s) open. Facilities that require approval for ANY type of work
• Request submitted by designer/ planner includes quantitative traffic analysis and TMP.
• Deputy Commissioner of Highway Management approves exceptions for contract work. Director, Division of Highway Operations, approves others
Mn/DOT Metro
If activity requires that a lane closure occur outside of allowable ranges
When projects must close more lanes than allowable to perform necessary work
• Metro Traffic Engineering should be notified of exception.
• Metro Traffic Engineering grants exceptions
MoDOT District staff determines if an exception is needed prior to beginning work
No formal criteria. Taken into account: type of work, the needed temporary traffic control, work schedules, and past experience
• Exceptions approved by Senior Management for Broad Undertakings (e.g., Smooth Roads Initiative projects).
• District Staff exempts individual projects.
ODOT When lane closures are planned to occur outside of plan note times (district analyzes proposed lane closures)
Contract Work: • Analyzed queue within
thresholds, exception permitted.
• If queue exceeds threshold, alternatives/ recommendations must be submitted by district.
Maintenance Work: • If queue exceeds
threshold, alternatives/ recommendations must be submitted by district.
• Submitted to Work Zone Traffic Manager and Highway Management Administrator; copy to Roadway Services Manager for maintenance work, Construction Engineer for construction work
• Exceptions granted by Maintenance of Traffic Exception Committee, which includes Assistant Director of Planning and Production, Assistant Director for Highway Management, and Deputy Director of Highway Operations
WisDOT Identified by project engineer
If there is no other way to accomplish the work at a reasonable cost
• Degree & method of evaluation varies • Exception approved by Project
Engineer/Supervisor in consultation with Regional Operations or Project Development Manager
*TMP is Transportation Management Plan **DLCRC is the District Lane Closure Review Committee
40

4.2.1.1. Identifying Exceptions
The exception identification criteria are similar at all the transportation agencies surveyed. The need for an exception is identified when a work activity requires that a lane closure occur during a non-permitted time. There are always ways to avoid reducing highway capacity due to a lane closure; however, the costs of maintaining capacity on the facility may be unacceptably high or might delay the overall project. For example, an alternative to closing lanes (and thus reducing capacity) may be to build temporary lanes or a temporary structure. Although building temporary facilities may be a reasonable solution for a long-term project, it may be cost prohibitive for a short-term project.
4.2.1.2. Criteria for Analyzing Possible Exceptions
While many projects could utilize non-permitted lane closure times to reduce project duration and costs, this would result in unacceptable road user delays; thus, some STAs have established criteria to help determine when an exception should be considered and possibly granted. For example, the CDOT Region 1 Strategy listed unique circumstances that could warrant the closure of lanes during non-permitted times. Many of the possible exceptions that follow involve reasons why work performed at night would be costly or infeasible (8):
• Nighttime temperatures that make it infeasible to perform roadwork at night (such as the cold nighttime mountain temperatures)
• Noise restrictions that make it infeasible to perform roadwork at night (based on adjacent land use or town ordinances)
• Limits on material supplies that would make conducting work during permitted time costly or unfeasible.
• Nature of construction required (e.g., blasting allowed during daylight hours only) • Special events • Seasonal events • Permitted-time lane closure strategies that might involve restrictions for oversize
vehicles Similarly, the Indiana Department of Transportation provided examples in their survey response of when exemption from the lane closure policy might be warranted. Such cases will require approval before closing lanes, but typical exceptions include the following:
• When work being conducted during non-permitted times costs less than the cost of additional effort to keep the lane(s) open o Generally applicable to INDOT forces completing short-duration maintenance
activities and closures that will only violate the lane closure policy at the lowest volume times (i.e., avoiding peak periods)
o Covers locations where it would require a significant or unreasonable degree of effort to avoid non-permitted land closure time
• Activities that cannot be performed without closing a lane (e.g., resurfacing)
41

o For such activities, it is still specified when lane closure can occur with reduced impact (usually nighttime)
o Significant penalties assessed if times are not followed 4.2.1.3. Exception-Granting Process
The exception-granting process varies between the surveyed state transportation agencies. While most agencies have an exception request process, systems for processing and analyzing these requests vary by agency.
The exception submittal process for Caltrans can be reviewed at one or at three levels of review, depending on the severity of the lane closure policy violation:
1. District Traffic Manager 2. District Lane Closure Review Committee 3. Headquarters Lane Closure Review Committee
The survey response expands on the three levels of review and process. For each lane closure application, the District Traffic Manager reviews and makes a recommendation regarding the closure. The District Lane Closure Review Committee reviews and formulates recommendations if a lane closure is expected to result in major delays. On significant projects (such as the San Francisco Oakland Bay Bridge Project) where delays may exceed the allowable limit, the district committee may request a meeting with the Headquarters Lane Closure Review Committee to discuss options and to inform executive management of the selected alternative. Only the District Lane Closure Review Committee can approve a higher delay threshold for a project. The district committee decides whether or not to request review by the agency-wide Lane Closure Review Committee. The district-level committee determines when a lane closure application is sent to the Headquarters Lane Closure Review Committee for approval, and generally requests review by the headquarters committee when requests have impacts that are inter-regional, statewide, environmental, or sensitive in nature. The headquarters committee is comprised of the Program Managers for Construction, Maintenance, Design, and Traffic Operations along with the Headquarters Public Information Officer and a representative from the California Highway Patrol. The headquarters committee may review the closure or defer back to the district committee for reconsideration and review if it is determined that the decision does not require headquarters-level review.
Through the survey, it was found that Colorado Department of Transportation Region 1 builds upon prior experiences to determine if an exception can be granted. When a lane closure occurs outside of the permitted time, CDOT Region 1 records information of the experience which can be used for future projects that may require a deviation from the recommended lane closure times and can also be used for strategy updates. If a lane closure experience was better than anticipated (e.g., queue lengths were shorter than the analysis estimated), then a similar lane closure could be used on other projects requiring similar types of work.
Survey response indicated that the Indiana Department of Transportation policy is in the process of being modified to accommodate a new organizational structure and subsequent employee title
42

changes. In the current policy, a request for an exception is submitted by the designer/planner (10). The request includes a designer/planner–performed quantitative analysis and traffic management plan (TMP) specific to the project. For contract work, the analysis should be completed during the planning process, after the pavement recommendation has been formulated and/or bridge work has been determined. In all cases, the analysis for contract projects occurs before scoping of the final design begins. For design-build projects, the TMP is completed, approved, and reflected in the scope of services. Analysis of work zone impacts is evaluated prior to the implementation of any lane restriction for permit work or work performed by the STA’s own work force.
The INDOT Headquarters Office Engineering Assessment Section, Design Division or District Development office, analyzes the impact on the motoring public of any proposed lane closure not permitted by the lane closure policy. The quantitative analysis is performed to determine the queues (generated by the proposed lane closure) that would occur outside of the allowable times. The following guidelines are used:
• If the projected queue is less than thresholds, which are queues that either exceed 1 mile for more than two hours or exceed 1.5 miles for any length of time, the final development process may continue. Documentation of the analysis must be retained on file. Any chosen work zone strategy that will result in impacts less than the allowable delay thresholds but increases the project cost by 20% (or $1 million) is submitted to the Chief Engineer for approval.
• If the projected queue exceeds thresholds, an exception request is submitted to the Chief Engineer or Deputy Commissioner of Highway Operations. The exception request will identify the alternative selected as the preferred option and the reasoning for the selection. The exception request will also address the impact on the current Indiana Statewide Transportation Improvement Program, if the request is denied.
Many of the named offices in the Indiana Department of Transportation policy are not included in INDOT’s new organization; thus, the names of the offices and titles of individuals performing functions will change. The duties are still being accomplished but under the new office names. Currently, INDOT has two policies—one for construction contracts (let under the construction letting process) and one for all other work on the interstate (INDOT maintenance forces or local contractor work not awarded thru the construction letting process). The new policy will combine the two policies into one. The Deputy Commissioner of Highway Management approves exceptions for contracts (for the construction letting process), and the Division of Highway Operations Director approves all other exceptions. A simplified method that covers everything from analyzing traffic flow to requesting a waiver is being included in the new policy. (For a closure of one out of two lanes, where the volume in passenger car equivalent is less than 1,400 vehicles per hour, the waiver will be automatically approved.)
The Ohio Department of Transportation policy states that the affected district will analyze all lane closures on interstates and freeways that are not permitted by the Permitted Lane Closure Map (PLCM). If the queues are found to be less than the thresholds specified in the PLCM, the District Work Zone Traffic Manager will approve the Maintenance of Traffic (M.O.T.) Plan. However, if the queues are greater than the threshold, alternatives and recommendations to
43

alternatives are prepared at the district level and submitted to the Multi-Lane Coordinator for review. The Multi-Lane Coordinator and other Central Office staff, as required, review the submitted work zone alternatives. If additional information is needed on these alternatives, they are given back to the district, which provides the additional information. If all information is included, a recommendation of the lane closure is made by the Multi-Lane Coordinator to the Maintenance of Traffic Exception Committee. A detailed flowchart of the ODOT exception process for contract work is shown in Figure 14.
District District analyzes lane closures that are not permitted by PLCM.
District District Work Zone Traffic Manager approves M.O.T. Plan.
District District analyzes work zone alternatives and submits alternatives and recommen-dations to Central Office.
Central Office Multi-Lane Coordinator makes recommendation to Maintenance of Traffic Exception Committee.
District District provides additional information.
If resulting queue within allowable thresholds
If resulting queue exceeds allowable thresholds
If additional information is required If all necessary
information is included
Central Office Multi-Lane Coordinator reviews district work zone alternatives.
Figure 14. ODOT contract work exception process (13)
4.2.2 Frequency of Policy Exceptions
The state transportation agencies surveyed were asked how commonly exception requests are granted. One of the respondents provided a quantitative response, while the others did not have a specific, measurable answer but rather provided a qualitative response (see Table 13).
For all states surveyed, a common response was that exceptions are granted fairly infrequently. The only agency that reported frequent granting of exceptions from its lane closure policy was the Missouri Department of Transportation. This is due to their Smooth Roads Initiative, a statewide resurfacing program that requires a large amount of work to be completed in a short
44

period of time and with limited resources available for work zone mitigation. However, Scott Stotlemeyer from MoDOT indicated that “this is in stark contrast to the direction we were heading prior to [the Smooth Roads Initiative], and hope to return to after, returning to a somewhat normal program.” In general, exceptions are infrequently granted, because a lane closure during a non-allowed time is usually the last option considered when planning a project; alternative solutions are exhaustively examined before such an exception is granted. For some projects, however, it is not financially feasible to complete the project during allowed lane closure times, thus necessitating an exception. When violating a lane closure policy, agencies often attempt to reduce the impact on road users. For example, when ODOT approves an exception, the district must provide some strategy that will mitigate the effects of the lane closures, such as innovative contracting to accelerate construction or motorist information dissemination via ITS.
Table 13. Frequency of granted exceptions STA Frequency of granted exceptions Caltrans Infrequent CDOT Region 1 Uncommon, only when required INDOT 11 for construction contracts; 2 for
maintenance crews* Mn/DOT Metro Infrequent MoDOT Frequent for Smooth Roads Initiative;**
exceptions infrequent for other projects ODOT Infrequent WisDOT 6–10 projects per year statewide *This count covers January–August 2006. **The Smooth Roads Initiative is a statewide resurfacing program.
4.2.3 Deviation from Permitted Times for Lane Closure Setup or Removal
As described in previous sections, when determining permitted lane closure times, an analysis is performed to determine if a lane reduction would create a queue at the merging point. The length of queue or time span of delay is analyzed to see if it exceeds the predetermined thresholds. However, unexpected traffic conditions can sometimes create significant queues and unreasonable delays that were not planned through the recorded volume analyses. Often, the recorded traffic volumes may be up to two or three years old and may not account for new development and the resulting higher traffic volumes. On the other hand, volumes experienced during the times that lane closures are disallowed may actually allow for a lane closure. This traffic volume reduction could be due to capacity improvements in a parallel route which reduced travel times and caused a traffic shift from one facility to the improved facility. Recorded traffic volumes that are several years old would not account for this shift in volumes, and field observations may suggest a re-analysis of the work zone lane closures.
Our survey asked the STAs how deviations from the permitted lane closure times were analyzed and handled when unexpected traffic conditions were experienced, both in terms of increased and decreased volumes.
45

As means to be flexible, given the changes in traffic patterns that can occur on a specific days, some agencies (1) have created methods to measure delays and queues in the field and (2) require the opening of a lane when delays or queue lengths become unreasonable (see Table 14), similar to the thresholds determined through lane closure schedule analysis (shown in Table 2). Caltrans, CDOT Region 1, INDOT, MoDOT, and ODOT can require the lane(s) to be reopened if the delays or queues experienced are unacceptable and if it is reasonable or feasible to interrupt the project and re-open the lanes. Certain construction tasks (e.g., concrete placement, lane reconstruction) do not allow for an immediate lane opening. However, as noted in the CDOT Region 1 Strategy, tasks such as striping or guardrail work allow the contractor to pick up the lane closure, clear the queues, and begin work again at a later time as traffic volumes allow. CDOT Region 1 also noted other criteria that can incite the removal of a lane closure, such as intense rain or snow, or a queue that extends beyond the traffic control or around a blind corner (e.g., in canyons). WisDOT stated that unacceptable queues and/or delays are noted and analyzed to determine if the lane closure time periods need to be adjusted. However, a time reduction usually requires additional compensation be paid to the contractor, so the costs of delay and contractor compensation need to be compared when making the allowable lane closure time reductions.
Table 14. Deviations from permitted lane closure times (removal and setup) Removing lane closure Setting up lane closure
STA Criteria for ending closure earlier than scheduled
Criteria and approval for early closure
Criteria for postponing lane
closure setup Caltrans Excessive delay criteria Delay criteria; District
Traffic Manager No criteria defined
CDOT Region 1 Queues; Project Engineer’s discretion
Delay Criteria; Project Engineer
No criteria defined
INDOT Delays, queue lengths No criteria defined No criteria defined Mn/DOT Metro No formal criteria No criteria defined No criteria defined MoDOT Queues are noted; no formal
criteria No formal criteria; at project staff discretion
No formal criteria; project staff’s discretion
ODOT Queue development No formal criteria defined
No criteria defined
WisDOT Queues are noted; no formal criteria
As deemed necessary by Project Engineer
No criteria defined
Another exception to a lane closure policy or strategy can occur when actual traffic volumes are lower than the counted or predicted volumes used in the permitted lane closure time determination. Publicity and traveler information may be effective in reducing traffic volumes, thus alleviating the need to restrict lane closures. Reduced volumes could result in relaxed lane closure restrictions that allow crews to utilize longer continuous lane closures and possibly reduce overall construction duration. Some STAs have a formal (Caltrans and CDOT Region 1 both utilizing delay criteria) or informal (MoDOT and WisDOT both noting queue development and length) criteria for determining when a lane closure restriction can be modified. (Criteria are considered informal when the decision is left up to the Project Manager or other approved project staff based on their observations and/or past experience.) However, traffic volumes may be unusually high when a lane closure is scheduled to be implemented, thus preventing the lane
46

closure implementation because it would create unacceptable queue lengths and/or delay. While all surveyed STAs stated that they did not have any formal criteria for such a scenario, this type of situation could be handled according to the criteria for ending a lane closure earlier than scheduled. If a lane closure causes or is going to cause an unacceptable queue, the lane closure should not be implemented or an existing closure should be removed.
4.3 Enforcement
Enforcement of the policy is important in maintaining consistent lane closures throughout a STA’s highway system. The enforcement aspect of the policies include monitoring the lane closure initiation and removal times, monitoring permitted exceptions, monitoring traffic volumes during a closure by measuring queue lengths or delay, and instituting fines or penalties for noncompliance.
4.3.1 Policy Enforcement and Monitoring of Permitted Exceptions
The methods of enforcement vary from agency to agency. Either the policy is formally stated by contract and enforced by the project manager or the compliance of internal forces (e.g., maintenance crews) is expected and communicated through training on the lane closure policy or strategy. Apart from the general contract language regarding permitted lane closure time enforcement, exceptions may be granted to implement a lane closure during non-permitted times. Table 15 lists the lane closure enforcement mechanism used by each agency.
47

Table 15. Policy enforcement and monitoring of permitted exceptions Enforcement
STA Where language is specified Policy monitor Methods of enforcement or reporting
Monitoring of exceptions
Caltrans Department personnel training No answer regarding who monitors the policy Work with counterparts or bring issue to higher level if necessary
Through Lane Closure System and Field and Transportation Management Center Reports
CDOT Region 1
Construction: Lane closure hours provided in project specifications Monitored by Project Engineer and Resident Engineer No answer regarding methods of reporting and enforcement
Construction: Same as enforcement
Maintenance: No answer regarding where language is specified Monitored by Maintenance Foreman No answer regarding methods of reporting and enforcement
Maintenance: Requires final report*
Access and Permits: No answer regarding where language is specified Monitored by Region 1 personnel on project No answer regarding methods of reporting and enforcement
Access and Permits: No answer
INDOT Lane closure language included in contract Monitored by Project Engineer/Supervisor All interstate projects reviewed twice a year for traffic control
Same as enforcement
Mn/DOT Metro
Lane closure language included in contract No answer regarding who monitors the policy No answer regarding methods of reporting and enforcement
Staff observations
MoDOT Lane closure language included in contract Monitored by district staff for both construction and maintenance No answer regarding methods of reporting and enforcement
Staff observations to report travel times to motorists
ODOT No answer regarding where language is specified Monitored by District Work Zone Traffic Manager Reviewed through Operational Performance Index (OPI) reviews
Office of Traffic Engineering observations and evaluation through OPI reviews
WisDOT Lane closure language included in contract Monitored by Project Engineer/Supervisor No answer regarding methods of reporting and enforcement
Project Engineer assesses field conditions
*Final report includes typical delay times during lane closure and a general evaluation of the likely impacts
Several STAs stated that violations to lane closure policies are not very common. Caltrans noted in the survey response that training of department personnel has fostered improved cooperation between all divisions, which has created a common understanding that the goal of the agency is to reduce delay. If an exception does occur and the policies are not followed, staff will work with their construction counterparts to solve the issue; if this does not work, the issue may be brought to a higher level as a last resort. The Standard Special Provision (SSP) 12-220 includes the process a contractor must follow if a lane closure is not opened to traffic by the specified time. If the work is suspended and the lane is reopened, the contractor must submit a work plan ensuring that future closures will be reopened to public traffic at the specified time. Until the work plan is
48

accepted, the contractor shall not implement any other lane closures. INDOT noted that the public does a good job of encouraging enforcement of the lane closure policy. Often, major deviations are reported by motorists and the media.
With regard to enforcement of exceptions, special provisions or monitoring methods may be required. While most agencies use staff observations or similar methods to monitor the work zone and enforce compliance with exceptions, CDOT Region 1 also requires an exception report that includes the typical delay times that occurred during the lane closure as well as a general description of how the operation functioned. Additionally, MoDOT noted that staff members do not usually monitor “permitted” lane closure exceptions for the adjustment of the lane closure itself; however, the lane closure exceptions are monitored in order to communicate travel times to motorists.
4.3.2 Penalties or Fines for Non-Compliance
Some STAs include monetary penalties or fines in the contract language to keep the contractor mindful of non-compliance issues with the lane closure policy (see Table 16). Contractors could incur penalties by beginning a lane closure too early or removing the closure too late; in either scenario, a lane closure exists outside the permitted lane closure times.
Table 16. Penalties for non-compliance with lane closure policy/strategy STA Early start Late removal Penalty amount determination Caltrans No Yes Based on roadway geometrics, traffic volumes, and
delay time CDOT Region 1 Yes Yes Based on number of incidents and Standard Special
Provisions table INDOT Yes Yes $2,000 per hour lane is blocked (amount in recent
contract) Mn/DOT Metro Yes Yes Depends on contract language MoDOT Yes* Yes* User costs ODOT Yes Yes Liquidated damages as specified in Construction and
Materials Specification WisDOT Yes* Yes* Percentage of the estimated user delay cost per hour
of lane closure *Occurs in limited number of contracts
49

5. CONCLUSIONS
Lane closure policies have beneficial results. They can be a valuable component of a state transportation agency’s overall safety and mobility objectives, reducing work zone-induced congestion by preventing lane closures when traffic demand would exceed the resulting capacity.
The outputs of the lane closure policies are quite extensive in some states. Ohio has an internet-based Permitted Lane Closure Map and Caltrans has an internet-based lane closure reporting system, while other states—such as CDOT Regions 1 and 6, INDOT, and Mn/DOT Metro—have permitted lane closure times either graphically displayed or provided in charts. Graphical representation allows for a quick determination of general time periods when lane closures are permitted, while actual hourly breakdowns offer a more precise beginning and ending time. Similarly, systems that generalize any lane closure during the week (Monday–Friday) as a “weekday closure” do not depict actual conditions as well as those systems that specify permitted lane closure times based on specific days of the week. While different options are available, the level of precision used to determine acceptable lane closure windows is established by each STA through its policy and the resources available to conduct traffic counts.
In terms of lane closure policy development, all states included in this study have similar processes, but the extensiveness of work zone impact analysis—in particular, analysis of the congestion created by a lane closure—differs between states. The methods of analyzing a queue range from simple deterministic queuing theory using a spreadsheet to microscopic modeling through SimTraffic or CORSIM. While each method is only an estimation of what will happen around the work zone, each provides a basis for evaluation of lane closure times. The extensiveness of this analysis also varies between agencies. Many states simply use the work zone lane capacity and compare it to the expected volumes. If the demand exceeds available capacity, the lane closure is not permitted. Other states report their threshold criteria in terms of delay (Caltrans) and/or queue length (ODOT, INDOT). While these states also use a work zone lane capacity, the work zone impact is reported in a manner that people can relate to and visualize.
The methods of collecting or estimating facility traffic volumes vary between states as well. While Automatic Traffic Recorder (ATR) counts are the most accurate (since they count traffic continuously), they are not always located extensively throughout a state. Therefore, estimated AADT (deriving from routine traffic counts) or interpretations of ATR counts (for segments between ATRs) are also used. Using volumes collected over a short period of time (i.e., a few days) as a basis for determining lane closure times is not very accurate, but it does provide insight into actual conditions. When spot counts are applied to a facility analysis, using a seasonal factor and then an hourly factor, the resulting volumes generally do not accurately portray true segment volumes. However, many STAs indicate that this might be the only traffic information available to determine permitted lane closure times, and they stress that engineering judgment in the field is invaluable when finalizing and adjusting times.
Variations to the policy are important to include; if not accounted for, the level of congestion and delay could become unacceptable. Many states have developed special charts or maps that
50

account for seasonal variations. Similarly, some states account for other variations such as holidays, special events and emergencies. To avoid unacceptable delays, it is also important to identify special circumstances that require deviations from the lane closure policy, whether long term (seasonal) or short term (event). Overall, the surveyed states were fairly consistent in their identification of the circumstances and events that require identification and subsequent lane closure variation.
Exceptions to the permitted lane closure times are sometimes needed based on the type of work being performed or the urgency with which the project needs to be completed. All states indicated that lane closure time exceptions involve truly exceptional circumstances compared to the vast majority of lane closures in their state. However, because exceptions are sometimes necessary, the surveyed STAs have implemented criteria and processes that provide a clear understanding of the process by which exceptions are granted. Many states indicated in their policy the flexibility provided to the field engineers with regard to unexpected traffic conditions. When higher than expected traffic volumes are encountered, it is beneficial to be able to remove a lane closure to avoid unacceptable traffic congestion. Similarly, flexibility is also needed in implementing a lane closure (e.g., delaying a lane closure due to unexpectedly high volumes or allowing a lane closure to be placed earlier than anticipated due to unexpectedly low volumes). This sort of flexibility strikes a balance between reducing immediate road user costs and attempting to maximize the lane closure time for construction—an activity that reduces overall project road user costs due to shorter project durations.
The enforcement of a lane closure policy is important for reducing congestion and maintaining the overall integrity of the policy. The surveyed state transportation agencies have exception-granting policies in place, allowing them to work with contractors to strike a balance between the road users and the project. Therefore, when a schedule is set to establish when lane closures are allowed, it should be followed. Other strategies put in place by STAs to reduce congestion—such as demand management strategies or the use of information technology systems to help motorists decide on a commute time or route—rely on the determined and documented times of lane closures. When nighttime construction is utilized, lane closures are usually picked up before the morning commute. The morning peak begins very quickly, and the demand on the facility is quite sudden. Therefore, if the lane closure is not picked up by the time the peak demand begins, long queues and delays will form almost immediately. As a deterrent to overextended lane closures, the surveyed agencies institute monetary penalties based on the user delay costs of the resulting conditions. However, most states indicated that enforcement issues are rare, and that most contractors and other counterparts needing a lane closure understand the importance of reduced congestion and do their part to cooperate.
51

6. REFERENCES
1. Highway Capacity Manual. Transportation Research Board, National Research Council, Washington, D.C. 2000.
2. Maze, Tom, Garrett Burchett, and Joshua Hochstein. 2005. Synthesis of Procedures to
Forecast and Monitor Work Zone Safety and Mobility Impacts. Center for Transportation Research and Education, Iowa State University, Ames, Iowa.
3. Transportation Management Plan Guidelines. State of California Department of
Transportation. Traffic Operations Program, Office of Systems Management Operations. Revised May, 2004.
4. Ghezzi, Jacqueline. Making Work Zones Work Better: Transportation Management Plans.
Presented 9-28-2005 in Charlottesville, Virginia. California Department of Transportation.
5. Traffic Operations Lane Closure System (LCS) User Guide, Section II Advanced User
Functions. California Department of Transportation, Traffic Operations. Version 1.0, December 2003.
6. Traffic Operations Lane Closure System (LCS) Users Guide, Section I (Requesters and
Inspectors). California Department of Transportation, Traffic Operations. Version 1.0, December 2003.
7. Colorado Department of Transportation. 2006.
http://www.dot.state.co.us/TopContent/6regions.htm 8. DeGuzman, Wilfredo C., David Hattan, Lyle E. DeVries, Bernie E. Guevara, Clark Roberts,
James P. Bemelen, and Pamela Hutton. May 2004. Colorado Department of Transportation Region 1 Lane Closure Strategy. Jointly prepared by Felsburg Holt & Ullevig and Colorado Department of Transportation, Region 1 – Traffic Section.
9. Kononov, Jake, David Hattan, Lyle DeVries, Steve Hersey, and Scott McDaniel. July 2005.
Colorado Department of Transportation Region 6 Lane Closure Strategy (A Congestion Management Initiative) Second Edition. Felsburg Holt & Ullevig (FHU) and CDOT Region 6 Traffic and Safety Section.
10. Interstate Highways Lane Closure Policy. Indiana Department of Transportation. Interstate
Task Force. 2003. 11. Metropolitan District Lane Closure Manual. Minnesota Department of Transportation.
October 2003. http://www.dot.state.mn.us/metro/trafficeng/laneclosure/index.html 12. MoDOT Work-Zone Guidelines. Missouri Department of Transportation Traffic. Updated
May 2004. http://www.modot.org/business/workzonesguidelines.htm
52

13. Traffic Management in Work Zones Interstate and Other Freeways. Policy No.: 516-003(P). Ohio Department of Transportation (ODOT), Traffic Engineering. July 18, 2000.
14. Permitted Lane Closure webpage. Ohio Department of Transportation, Office of Traffic
Engineering. 2006. https://dotaw100.dot.state.oh.us/plcm/plcm_web.jsp 15. Missouri Department of Transportation. Tracker. October 2006.
www.modot.org/about/general_info/Tracker.htm 16. Lane Closure Charts: Development and Delay Penalty. California Department of
Transportation. Presentation obtained from National Transportation Operations Coalition Web Casts: Reducing Congestion – Good Work Zone Management Strategies that Can Help. February 17, 2005.
17. Highway Capacity Manual. Transportation Research Board, National Research Council, Washington, D.C. 2000.
53