laser aerosol spectrometer model 3340 ... aerosol spectrometer model 3340 operation and service...
TRANSCRIPT
LASER AEROSOL SPECTROMETER
MODEL 3340
OPERATION AND SERVICE MANUAL
P/N 6002729, REVISION G
SEPTEMBER 2015

LASER AEROSOL
SPECTROMETER
MODEL 3340 OPERATION AND SERVICE MANUAL
Product Overview 1
Unpacking and
System Setup
2
Description of the
Model 3340
3
Model 3340
Operation
4
Theory of Operation 5
Maintenance 6
Calibration 7
Troubleshooting 8
Appendixes
ii Model 3340 Laser Aerosol Spectrometer
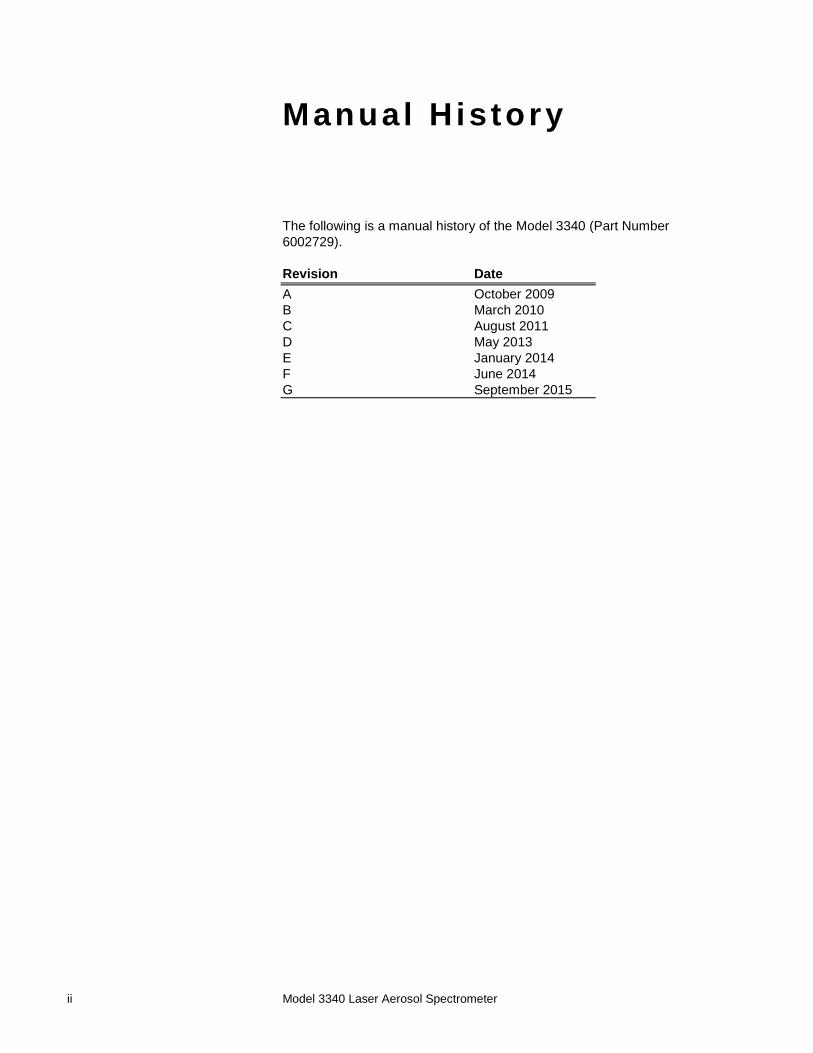
Manual His tory
The following is a manual history of the Model 3340 (Part Number
6002729).
Revision Date
A October 2009
B March 2010
C August 2011
D May 2013
E January 2014
F June 2014
G September 2015
iii
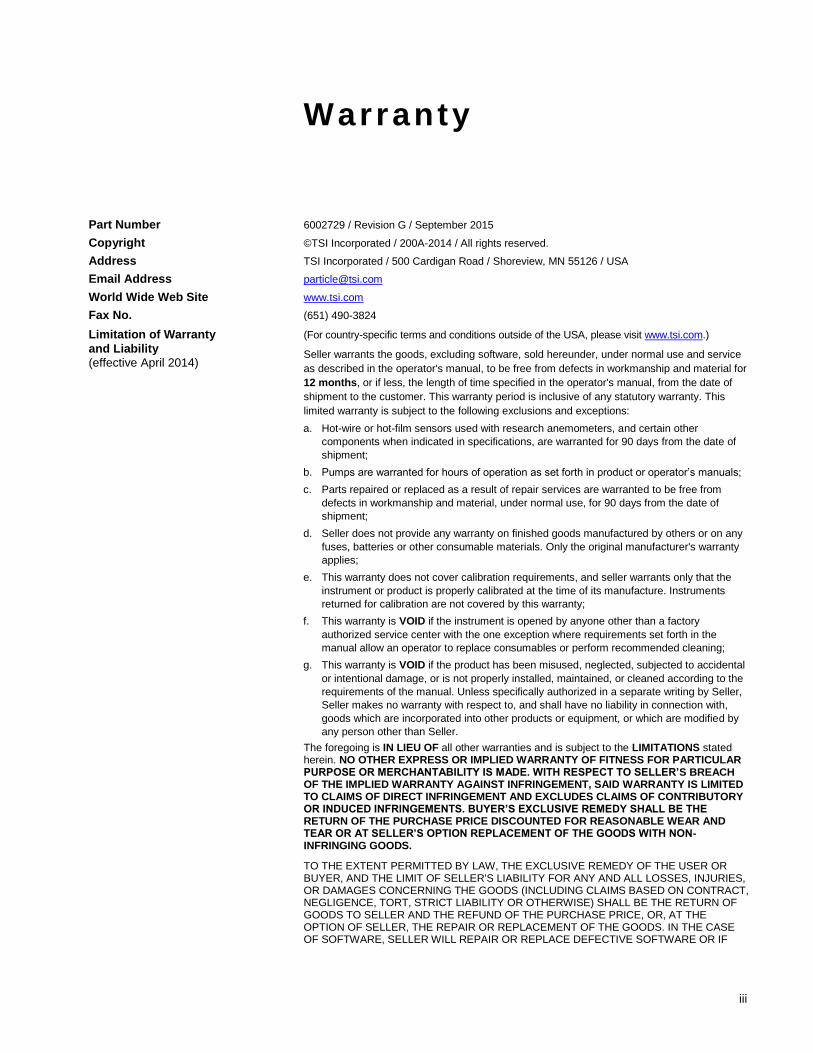
Warranty
Part Number 6002729 / Revision G / September 2015
Copyright ©TSI Incorporated / 200A-2014 / All rights reserved.
Address TSI Incorporated / 500 Cardigan Road / Shoreview, MN 55126 / USA
Email Address [email protected]
World Wide Web Site www.tsi.com
Fax No. (651) 490-3824
Limitation of Warranty
and Liability
(effective April 2014)
(For country-specific terms and conditions outside of the USA, please visit www.tsi.com.)
Seller warrants the goods, excluding software, sold hereunder, under normal use and service
as described in the operator's manual, to be free from defects in workmanship and material for
12 months, or if less, the length of time specified in the operator's manual, from the date of
shipment to the customer. This warranty period is inclusive of any statutory warranty. This
limited warranty is subject to the following exclusions and exceptions:
a. Hot-wire or hot-film sensors used with research anemometers, and certain other
components when indicated in specifications, are warranted for 90 days from the date of
shipment;
b. Pumps are warranted for hours of operation as set forth in product or operator’s manuals;
c. Parts repaired or replaced as a result of repair services are warranted to be free from
defects in workmanship and material, under normal use, for 90 days from the date of
shipment;
d. Seller does not provide any warranty on finished goods manufactured by others or on any
fuses, batteries or other consumable materials. Only the original manufacturer's warranty
applies;
e. This warranty does not cover calibration requirements, and seller warrants only that the
instrument or product is properly calibrated at the time of its manufacture. Instruments
returned for calibration are not covered by this warranty;
f. This warranty is VOID if the instrument is opened by anyone other than a factory
authorized service center with the one exception where requirements set forth in the
manual allow an operator to replace consumables or perform recommended cleaning;
g. This warranty is VOID if the product has been misused, neglected, subjected to accidental
or intentional damage, or is not properly installed, maintained, or cleaned according to the
requirements of the manual. Unless specifically authorized in a separate writing by Seller,
Seller makes no warranty with respect to, and shall have no liability in connection with,
goods which are incorporated into other products or equipment, or which are modified by
any person other than Seller.
The foregoing is IN LIEU OF all other warranties and is subject to the LIMITATIONS stated herein. NO OTHER EXPRESS OR IMPLIED WARRANTY OF FITNESS FOR PARTICULAR PURPOSE OR MERCHANTABILITY IS MADE. WITH RESPECT TO SELLER’S BREACH OF THE IMPLIED WARRANTY AGAINST INFRINGEMENT, SAID WARRANTY IS LIMITED TO CLAIMS OF DIRECT INFRINGEMENT AND EXCLUDES CLAIMS OF CONTRIBUTORY OR INDUCED INFRINGEMENTS. BUYER’S EXCLUSIVE REMEDY SHALL BE THE RETURN OF THE PURCHASE PRICE DISCOUNTED FOR REASONABLE WEAR AND TEAR OR AT SELLER’S OPTION REPLACEMENT OF THE GOODS WITH NON-INFRINGING GOODS.
TO THE EXTENT PERMITTED BY LAW, THE EXCLUSIVE REMEDY OF THE USER OR BUYER, AND THE LIMIT OF SELLER'S LIABILITY FOR ANY AND ALL LOSSES, INJURIES, OR DAMAGES CONCERNING THE GOODS (INCLUDING CLAIMS BASED ON CONTRACT, NEGLIGENCE, TORT, STRICT LIABILITY OR OTHERWISE) SHALL BE THE RETURN OF GOODS TO SELLER AND THE REFUND OF THE PURCHASE PRICE, OR, AT THE OPTION OF SELLER, THE REPAIR OR REPLACEMENT OF THE GOODS. IN THE CASE OF SOFTWARE, SELLER WILL REPAIR OR REPLACE DEFECTIVE SOFTWARE OR IF
iv Model 3340 Laser Aerosol Spectrometer
UNABLE TO DO SO, WILL REFUND THE PURCHASE PRICE OF THE SOFTWARE. IN NO EVENT SHALL SELLER BE LIABLE FOR LOST PROFITS, BUSINESS INTERRUPTION, OR ANY SPECIAL, INDIRECT, CONSEQUENTIAL OR INCIDENTAL DAMAGES. SELLER SHALL NOT BE RESPONSIBLE FOR INSTALLATION, DISMANTLING OR REINSTALLATION COSTS OR CHARGES. No Action, regardless of form, may be brought against Seller more than 12 months after a cause of action has accrued. The goods returned under warranty to Seller's factory shall be at Buyer's risk of loss, and will be returned, if at all, at Seller's risk of loss.
Buyer and all users are deemed to have accepted this LIMITATION OF WARRANTY AND LIABILITY, which contains the complete and exclusive limited warranty of Seller. This LIMITATION OF WARRANTY AND LIABILITY may not be amended, modified or its terms waived, except by writing signed by an Officer of Seller.
Service Policy Knowing that inoperative or defective instruments are as detrimental to TSI as they are to our
customers, our service policy is designed to give prompt attention to any problems. If any mal-
function is discovered, please contact your nearest sales office or representative, or call TSI
at 1-800-874-2811 (USA) or (651) 490-2811.
Trademarks TSI, TSI logo are registered trademarks of TSI Incorporated.
Microsoft, Windows, are registered trademarks of Microsoft Corporation.
LabVIEW is a registered trademark of National Instrument Corporation.
HyperTerminal is a trademark of Hilgraeve, Inc.
Swagelok is a registered trademark of Swagelok Company of Solon, Ohio, USA.
Celeron is a registered trademark of Intel Corporation.
Q-tips is a registered trademark of Chesebrough-Pond's Inc.
Sensidyne and Gilibrator are trademarks of Sensidyne, Inc.
Patents *US Patent Numbers; 5,907,575; 7,079,243; 7,295,585
v
Safety
This section gives instructions to promote safe and proper handling of the
Model 3340.
There are no user serviceable parts inside the instrument. Refer all repair
and maintenance to a qualified technician. All maintenance and repair
information in this manual is included for use by a qualified technician.
The Model 3340 is a Class I laser-based instrument. During normal
operation, you will not be exposed to laser radiation. However, you must
take certain precautions or you may expose yourself to hazardous radiation
in the form of intense, focused, visible light. Exposure to this light may
cause blindness.
Take these precautions:
Do not remove any parts from the Model 3340 unless you are
specifically told to do so in this manual.
Do not remove the Model 3340 housing or covers while power is
supplied to the instrument.
W A R N I N G
The use of controls, adjustments, or procedures other than those
specified in this manual may result in exposure to hazardous optical
radiation.
W A R N I N G
High voltage is accessible in several locations within this instrument.
Make sure you unplug the power source before removing the cover or
performing maintenance procedures.
vi Model 3340 Laser Aerosol Spectrometer
L a b e l s
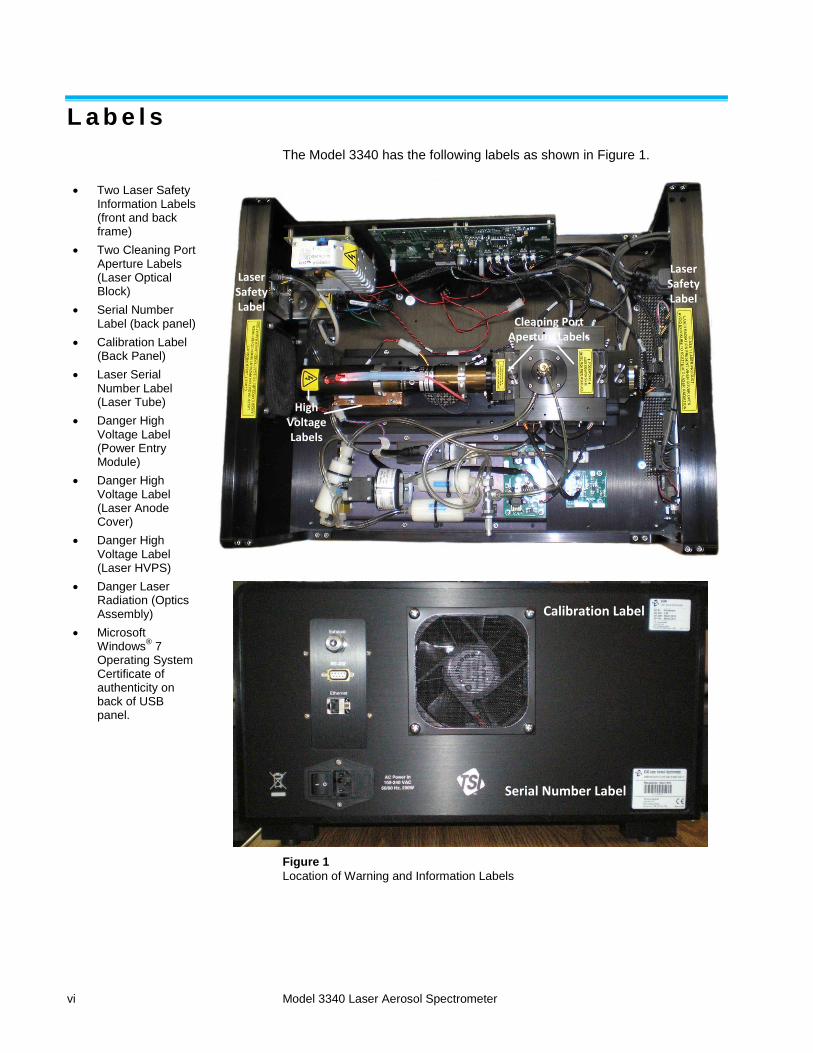
The Model 3340 has the following labels as shown in Figure 1.
Two Laser Safety Information Labels (front and back frame)
Two Cleaning Port Aperture Labels (Laser Optical Block)
Serial Number Label (back panel)
Calibration Label (Back Panel)
Laser Serial Number Label (Laser Tube)
Danger High Voltage Label (Power Entry Module)
Danger High Voltage Label (Laser Anode Cover)
Danger High Voltage Label (Laser HVPS)
Danger Laser Radiation (Optics Assembly)
Microsoft Windows
® 7
Operating System Certificate of authenticity on back of USB panel.
Figure 1
Location of Warning and Information Labels
Cleaning Port Aperture Labels
Laser Safety Label
High Voltage Labels
Laser Safety Label
Calibration Label
Serial Number Label
Safety vii
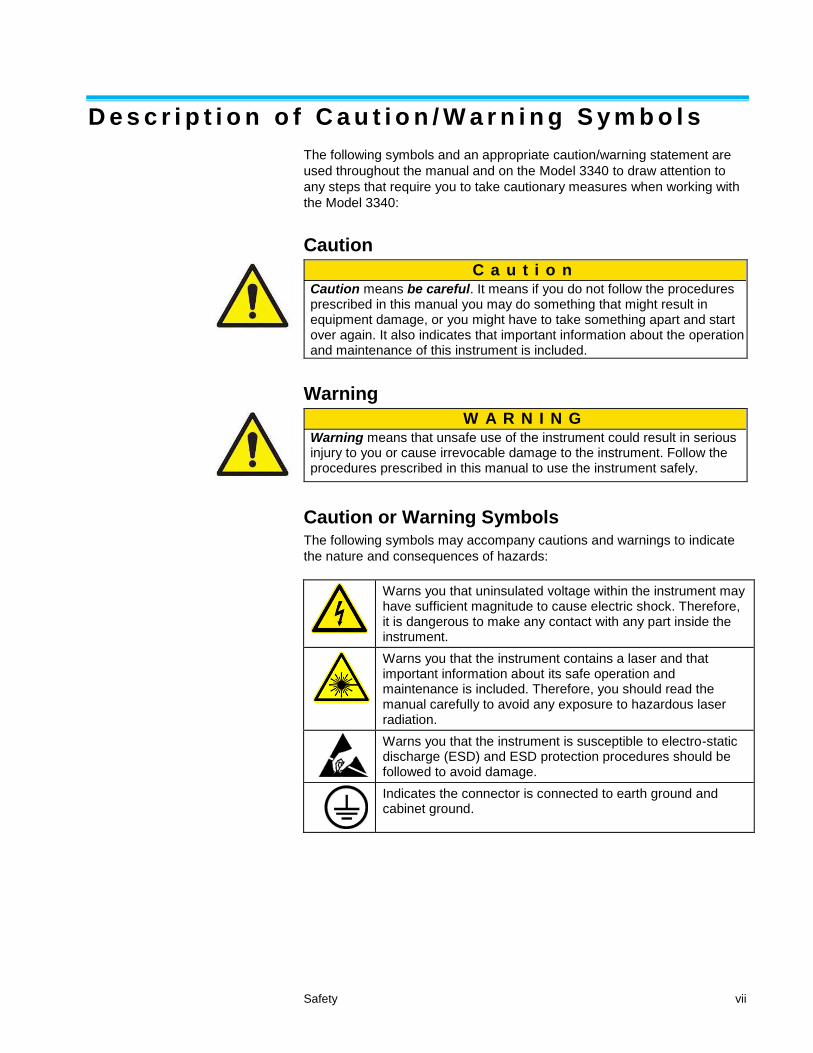
D e s c r i p t i o n o f C a u t i o n / W a r n i n g S y m b o l s
The following symbols and an appropriate caution/warning statement are
used throughout the manual and on the Model 3340 to draw attention to
any steps that require you to take cautionary measures when working with
the Model 3340:
Caution
C a u t i o n
Caution means be careful. It means if you do not follow the procedures prescribed in this manual you may do something that might result in equipment damage, or you might have to take something apart and start over again. It also indicates that important information about the operation and maintenance of this instrument is included.
Warning
W A R N I N G
Warning means that unsafe use of the instrument could result in serious injury to you or cause irrevocable damage to the instrument. Follow the procedures prescribed in this manual to use the instrument safely.
Caution or Warning Symbols The following symbols may accompany cautions and warnings to indicate
the nature and consequences of hazards:
Warns you that uninsulated voltage within the instrument may have sufficient magnitude to cause electric shock. Therefore, it is dangerous to make any contact with any part inside the instrument.
Warns you that the instrument contains a laser and that important information about its safe operation and maintenance is included. Therefore, you should read the manual carefully to avoid any exposure to hazardous laser radiation.
Warns you that the instrument is susceptible to electro-static discharge (ESD) and ESD protection procedures should be followed to avoid damage.
Indicates the connector is connected to earth ground and cabinet ground.

viii Model 3340 Laser Aerosol Spectrometer
(This page intentionally left blank)
ix
Contents
Manual History .......................................................................................... ii
Warranty ................................................................................................... iii
Safety ......................................................................................................... v Labels ...................................................................................................... vi Description of Caution/Warning Symbols .............................................. vii
About This Manual .................................................................................. xi Purpose ................................................................................................... xi Related Product Literature ...................................................................... xi Submitting Comments ............................................................................. xi
CHAPTER 1 Product Overview ............................................................ 1-1 Product Description .............................................................................. 1-1 Applications .......................................................................................... 1-2 How the Model 3340 Operates ............................................................ 1-2
CHAPTER 2 Unpacking and System Setup ........................................ 2-1 Packing List .......................................................................................... 2-1 Mounting the Sensor ............................................................................ 2-2 Power Connection ................................................................................ 2-2 Connections to the Computer .............................................................. 2-3
CHAPTER 3 Description of the Model 3340 ........................................ 3-1 Front Panel ........................................................................................... 3-1 Back Panel ........................................................................................... 3-2 Internal Components ............................................................................ 3-4
CHAPTER 4 Model 3340 Operation...................................................... 4-1 Quick Start Guide ................................................................................. 4-1 Unit Controls......................................................................................... 4-3 Collecting Data ................................................................................... 4-15
CHAPTER 5 Theory of Operation ......................................................... 5-1 Instrument Subsystems ........................................................................ 5-1 Particle Coincidence .......................................................................... 5-10
CHAPTER 6 Maintenance ..................................................................... 6-1 Cleaning Optics .................................................................................... 6-1
CHAPTER 7 Calibration ........................................................................ 7-1 Calibration Mode Controls .................................................................... 7-2 Calibration ............................................................................................ 7-6
CHAPTER 8 Troubleshooting and Service ......................................... 8-1 Technical Contacts ............................................................................... 8-2 Returning the Laser Aerosol Spectrometer for Service ....................... 8-3
APPENDIX A Model 3340 Specifications ............................................A-1 Dimensional Diagram ........................................................................... A-2
x Model 3340 Laser Aerosol Spectrometer
APPENDIX B Using Serial Data Commands ....................................... B-1 Pin Connectors..................................................................................... B-1 Baud Rate ............................................................................................ B-2 Format (8-Bits, No Parity) .................................................................... B-2 Stop Bits and Flow Control .................................................................. B-2 Bi-directional Serial Command Protocol .............................................. B-2 Data File and Output Format ............................................................... B-8
APPENDIX C Computer Related Issues .............................................. C-1 Regional Settings and LabVIEW
® Software ........................................ C-1
Remote Desktop Operation ................................................................. C-9
Index
Reader’s Comments
xi
About This Manual
P u r p o s e
This is an operation and service manual for the Model 3340 Laser Aerosol
Spectrometer.
R e l a t e d P r o d u c t L i t e r a t u r e
Model 3076 Constant Output Atomizer Manual (part number
1933076 TSI Incorporated)
Model 3079 Portable Atomizer Manual (part number 1930070 TSI
Incorporated)
Model 9302 Atomizer Manual (part number 190142 TSI Incorporated)
Model 9306 Six-jet Atomizer Manual (part number 1930099 TSI
Incorporated)
Model 3433 Small Scale Powder Disperser Manual (part number
1933769 TSI Incorporated)
S u b m i t t i n g C o m m e n t s
TSI values your comments and suggestions on this manual. Please use
the comment sheet, on the last page of this manual, to send us your
opinion on the manual’s usability, to suggest specific improvements, or to
report any technical errors.
If the comment sheet has already been used, send your comments to:
TSI Incorporated
500 Cardigan Road
Shoreview, MN 55126
Fax: (651) 490-3824
E-mail Address: [email protected]

xii Model 3340 Laser Aerosol Spectrometer
(This page intentionally left blank)
1-1
C H A P T E R 1 Product Overv iew
This chapter contains a product description of the Model 3340 Laser
Aerosol Spectrometer and a brief description of how the instrument
operates.
P r o d u c t D e s c r i p t i o n
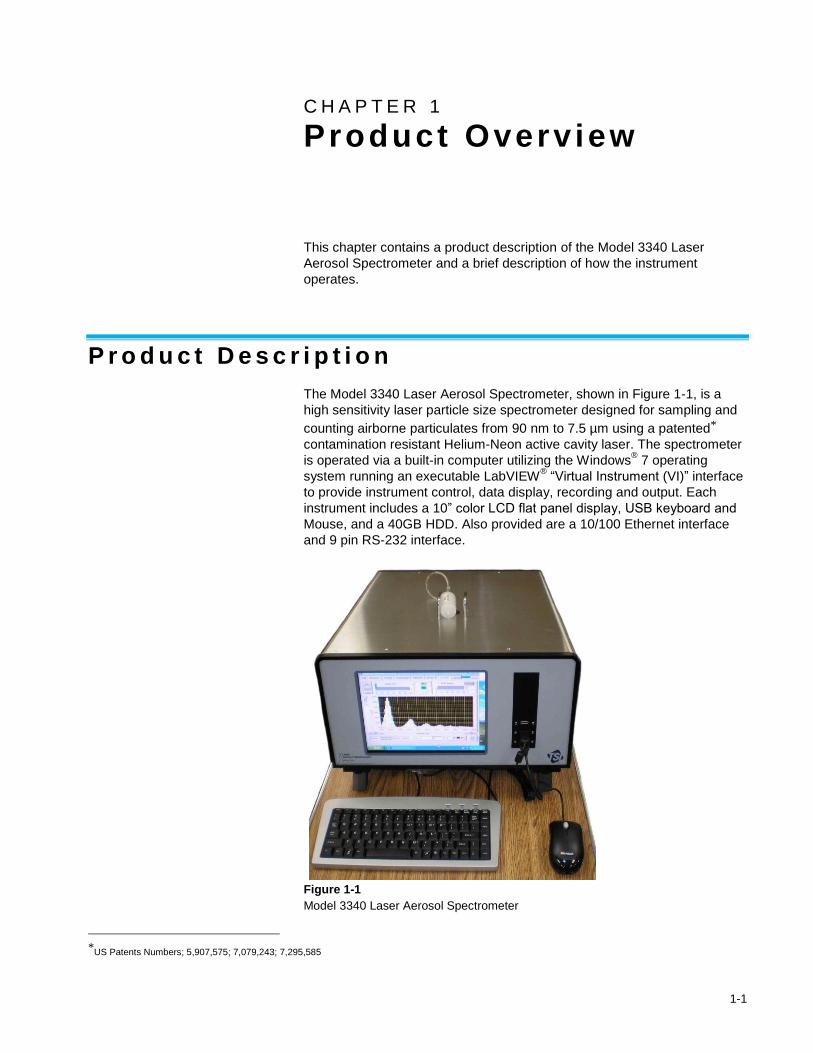
The Model 3340 Laser Aerosol Spectrometer, shown in Figure 1-1, is a
high sensitivity laser particle size spectrometer designed for sampling and
counting airborne particulates from 90 nm to 7.5 µm using a patented*
contamination resistant Helium-Neon active cavity laser. The spectrometer
is operated via a built-in computer utilizing the Windows® 7 operating
system running an executable LabVIEW® “Virtual Instrument (VI)” interface
to provide instrument control, data display, recording and output. Each
instrument includes a 10” color LCD flat panel display, USB keyboard and
Mouse, and a 40GB HDD. Also provided are a 10/100 Ethernet interface
and 9 pin RS-232 interface.
Figure 1-1
Model 3340 Laser Aerosol Spectrometer
*US Patents Numbers; 5,907,575; 7,079,243; 7,295,585
1-2 Model 3340 Laser Aerosol Spectrometer
A p p l i c a t i o n s
The Model 3340 Laser Aerosol Spectrometer has application in the
following areas:
Inhalation toxicology
Atmospheric studies
Ambient air monitoring
Drug-delivery studies
HEPA/ULPA Filter testing and characterization
Indoor air-quality monitoring
Biohazard detection
Basic research
Characterization of test aerosols used in particle-instrument calibration
Performance evaluations of other aerodynamic devices
H o w t h e M o d e l 3 3 4 0 O p e r a t e s
The Model 3340 operates on the principle that the light scattered by a
particle within an active laser cavity is a direct function of its size. Particles
produce pulses of light during transit through the laser beam. The light
pulses are sensed by a pair of detectors that in turn are analyzed by four
cascading amplifier stages coupled to analog-to-digital converters for
sizing. Particles are aerodynamically focused to a sample stream diameter
smaller than the laser beam diameter in order to avoid edge effects.
The Model 3340 contains a computer running the Windows® 7 operating
system. It is assumed that the instrument user is familiar with the normal
operation of this operating system on a computer. The operating program
LAS-3340_3p3_090519.exe is accessed by a desktop icon. This program,
written in National Instruments LabVIEW® provides a user-friendly virtual
instrument (commonly called a VI) panel for the control, data display, and
data logging for the Model 3340.
Refer to Chapter 5, “Theory of Operation,” for a detailed description.
2-1
C H A P T E R 2 Unpacking and System Setup
This chapter provides information concerning the accessories shipped with
the sensor and describes basic setup procedures.
P a c k i n g L i s t
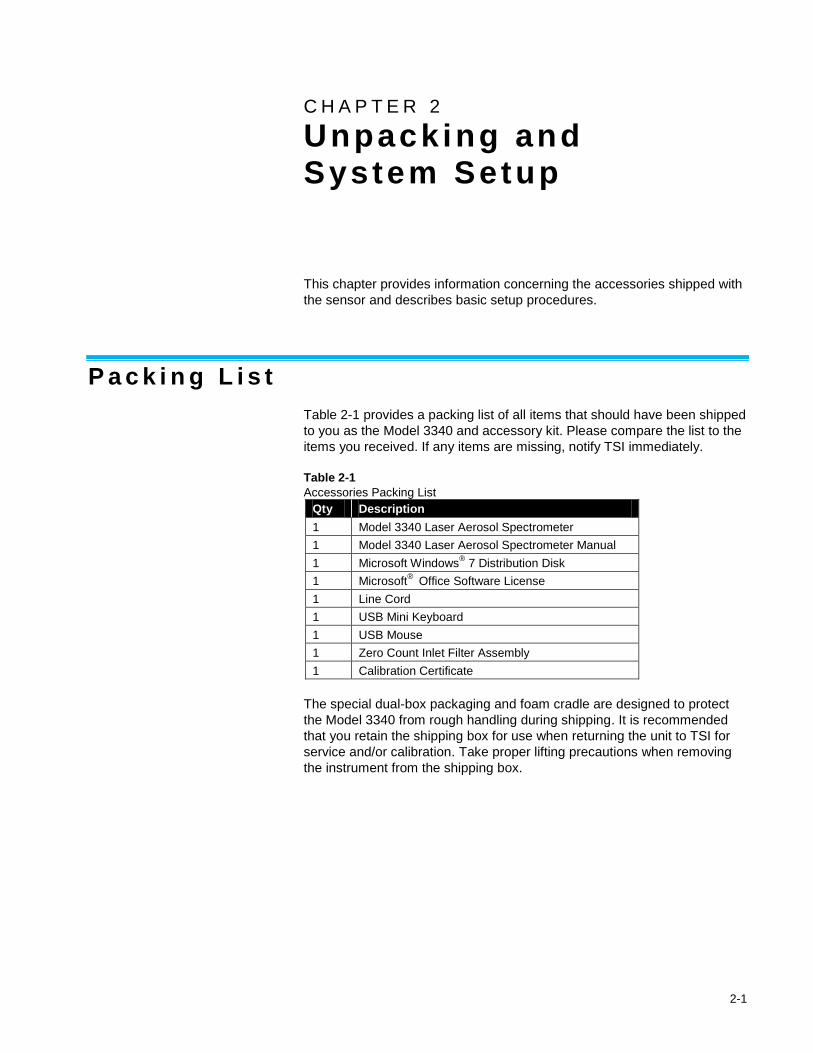
Table 2-1 provides a packing list of all items that should have been shipped
to you as the Model 3340 and accessory kit. Please compare the list to the
items you received. If any items are missing, notify TSI immediately.
Table 2-1
Accessories Packing List
Qty Description
1 Model 3340 Laser Aerosol Spectrometer
1 Model 3340 Laser Aerosol Spectrometer Manual
1 Microsoft Windows® 7 Distribution Disk
1 Microsoft®
Office Software License
1 Line Cord
1 USB Mini Keyboard
1 USB Mouse
1 Zero Count Inlet Filter Assembly
1 Calibration Certificate
The special dual-box packaging and foam cradle are designed to protect
the Model 3340 from rough handling during shipping. It is recommended
that you retain the shipping box for use when returning the unit to TSI for
service and/or calibration. Take proper lifting precautions when removing
the instrument from the shipping box.
2-2 Model 3340 Laser Aerosol Spectrometer
M o u n t i n g t h e S e n s o r
The Model 3340 Laser Aerosol Spectrometer requires no special mounting
requirements other than the ventilation requirements (see below). The
cabinet has four non-marking rubber feet that give the instrument a good
grip on clean, level surfaces and two additional feet mounted on retractable
legs at the front of the unit that allow the unit to be angled for user
convenience.
Ventilation Requirements The Model 3340 cabinet is designed to be cooled by room air drawn in
from the bottom of the cabinet and exhausted through the back of the
cabinet.
The cabinet should be installed with at least 2-inch (50-mm) clearance
between the back panel and any other surface. Most important, the cabinet
should be set on a clean, hard surface so that the exhaust air can move
freely from the cabinet.
P o w e r C o n n e c t i o n
Connect the AC power cord (supplied) to the IDC power input module on
the back of the Model 3340 and then into an available power outlet. It is not
necessary to select the correct voltage, the spectrometer accepts line
voltage of 85 to 260 VAC, 50 to 60 Hz, 200 W, single phase. The
connection is self regulating.
Toggle the on/off switch at the POWER connection to the on position to
verify the sensor has power.
Unpacking and System Setup 2-3
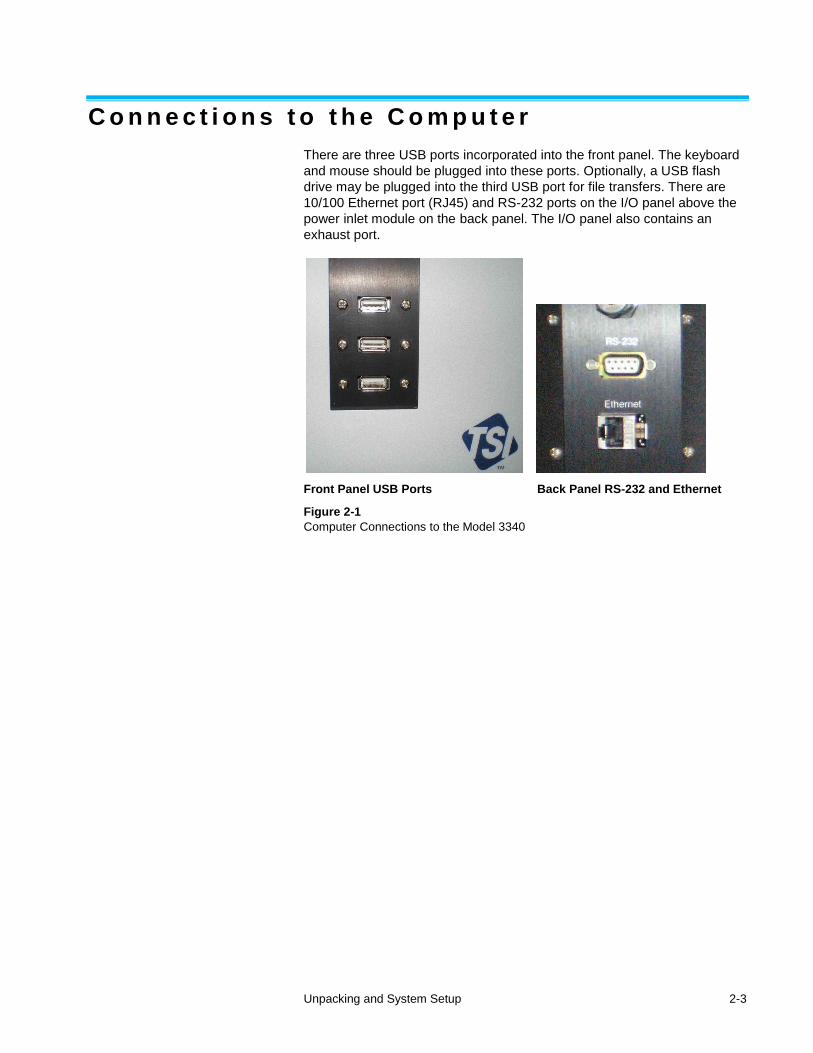
C o n n e c t i o n s t o t h e C o m p u t e r
There are three USB ports incorporated into the front panel. The keyboard
and mouse should be plugged into these ports. Optionally, a USB flash
drive may be plugged into the third USB port for file transfers. There are
10/100 Ethernet port (RJ45) and RS-232 ports on the I/O panel above the
power inlet module on the back panel. The I/O panel also contains an
exhaust port.
Front Panel USB Ports Back Panel RS-232 and Ethernet
Figure 2-1
Computer Connections to the Model 3340

2-4 Model 3340 Laser Aerosol Spectrometer
(This page intentionally left blank)
3-1
C H A P T E R 3 Descr ipt ion of the Model 3340
This chapter describes the front panel, back panel, and internal
components of the Model 3340 Laser Aerosol Spectrometer.
F r o n t P a n e l
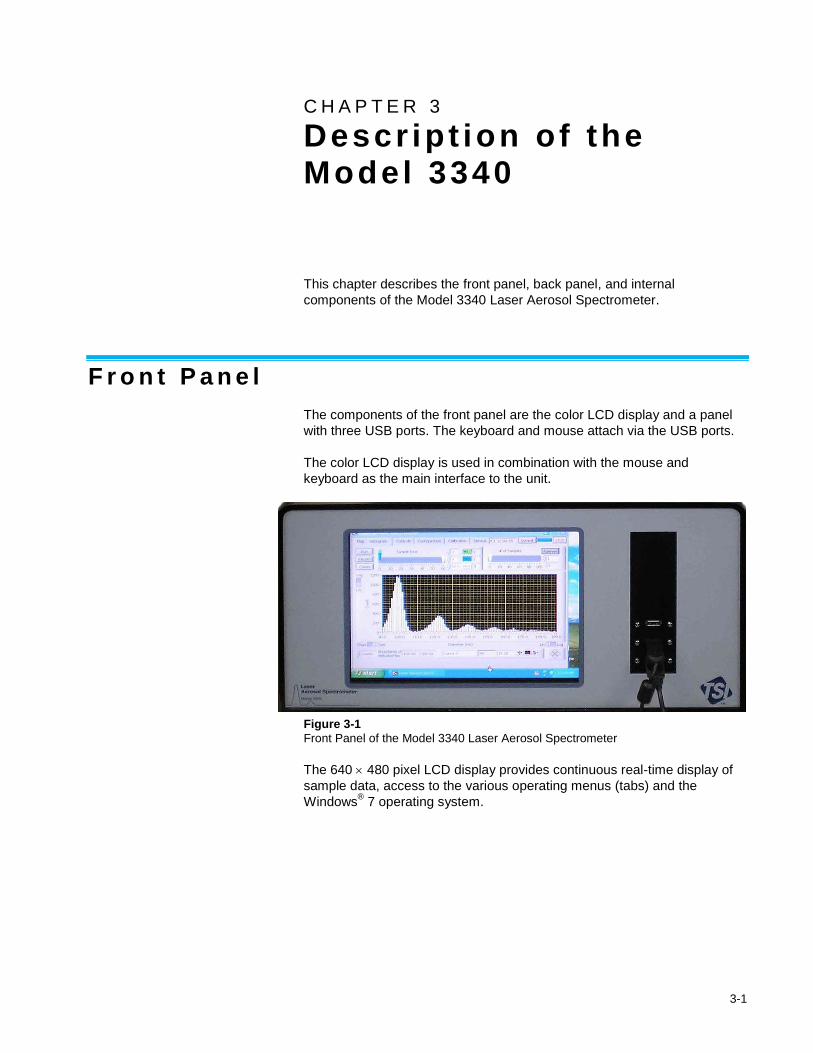
The components of the front panel are the color LCD display and a panel
with three USB ports. The keyboard and mouse attach via the USB ports.
The color LCD display is used in combination with the mouse and
keyboard as the main interface to the unit.
Figure 3-1
Front Panel of the Model 3340 Laser Aerosol Spectrometer
The 640 480 pixel LCD display provides continuous real-time display of
sample data, access to the various operating menus (tabs) and the
Windows® 7 operating system.
3-2 Model 3340 Laser Aerosol Spectrometer
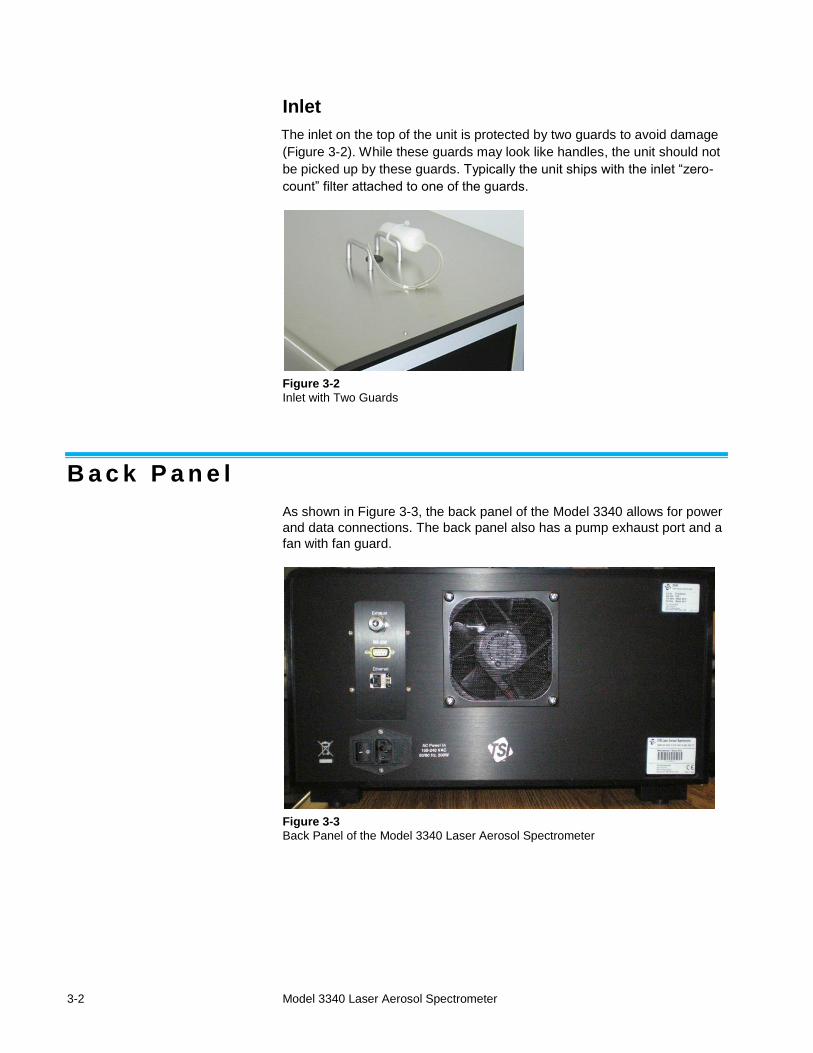
Inlet
The inlet on the top of the unit is protected by two guards to avoid damage
(Figure 3-2). While these guards may look like handles, the unit should not
be picked up by these guards. Typically the unit ships with the inlet “zero-
count” filter attached to one of the guards.
Figure 3-2
Inlet with Two Guards
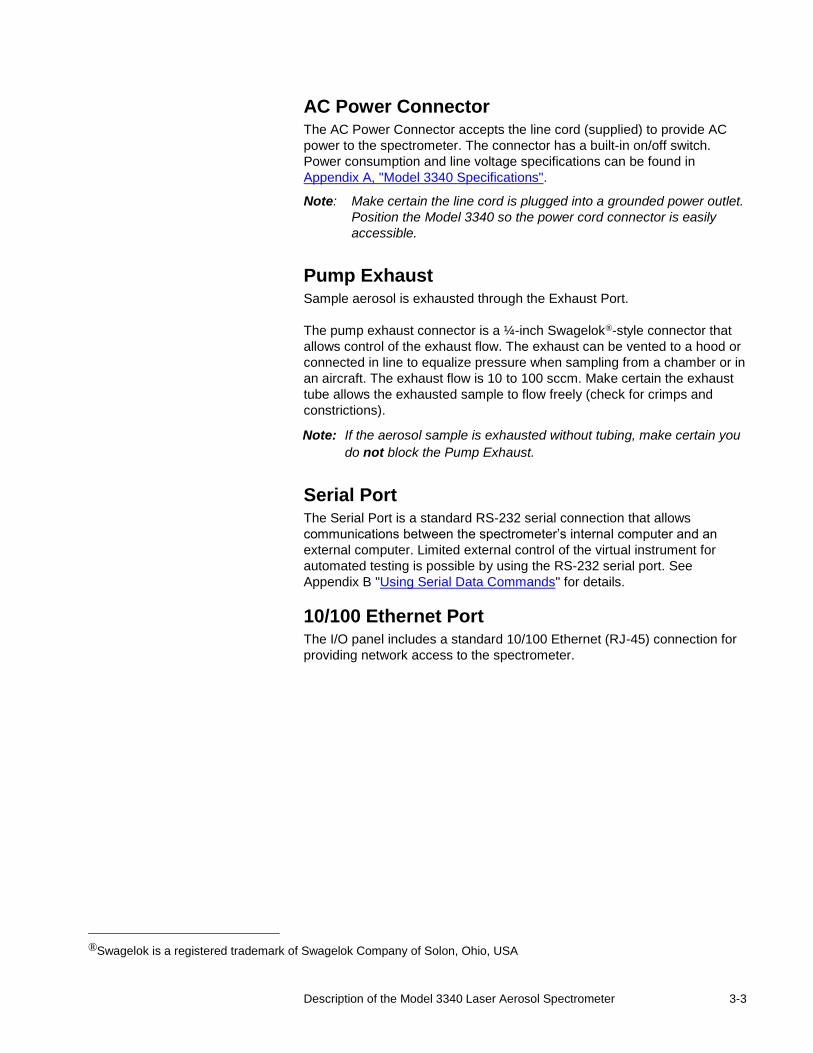
B a c k P a n e l
As shown in Figure 3-3, the back panel of the Model 3340 allows for power
and data connections. The back panel also has a pump exhaust port and a
fan with fan guard.
Figure 3-3
Back Panel of the Model 3340 Laser Aerosol Spectrometer
Description of the Model 3340 Laser Aerosol Spectrometer 3-3
AC Power Connector The AC Power Connector accepts the line cord (supplied) to provide AC
power to the spectrometer. The connector has a built-in on/off switch.
Power consumption and line voltage specifications can be found in
Appendix A, "Model 3340 Specifications".
Note: Make certain the line cord is plugged into a grounded power outlet.
Position the Model 3340 so the power cord connector is easily
accessible.
Pump Exhaust Sample aerosol is exhausted through the Exhaust Port.
The pump exhaust connector is a ¼-inch Swagelok®-style connector that
allows control of the exhaust flow. The exhaust can be vented to a hood or
connected in line to equalize pressure when sampling from a chamber or in
an aircraft. The exhaust flow is 10 to 100 sccm. Make certain the exhaust
tube allows the exhausted sample to flow freely (check for crimps and
constrictions).
Note: If the aerosol sample is exhausted without tubing, make certain you
do not block the Pump Exhaust.
Serial Port The Serial Port is a standard RS-232 serial connection that allows
communications between the spectrometer’s internal computer and an
external computer. Limited external control of the virtual instrument for
automated testing is possible by using the RS-232 serial port. See
Appendix B "Using Serial Data Commands" for details.
10/100 Ethernet Port The I/O panel includes a standard 10/100 Ethernet (RJ-45) connection for
providing network access to the spectrometer.
®Swagelok is a registered trademark of Swagelok Company of Solon, Ohio, USA
3-4 Model 3340 Laser Aerosol Spectrometer
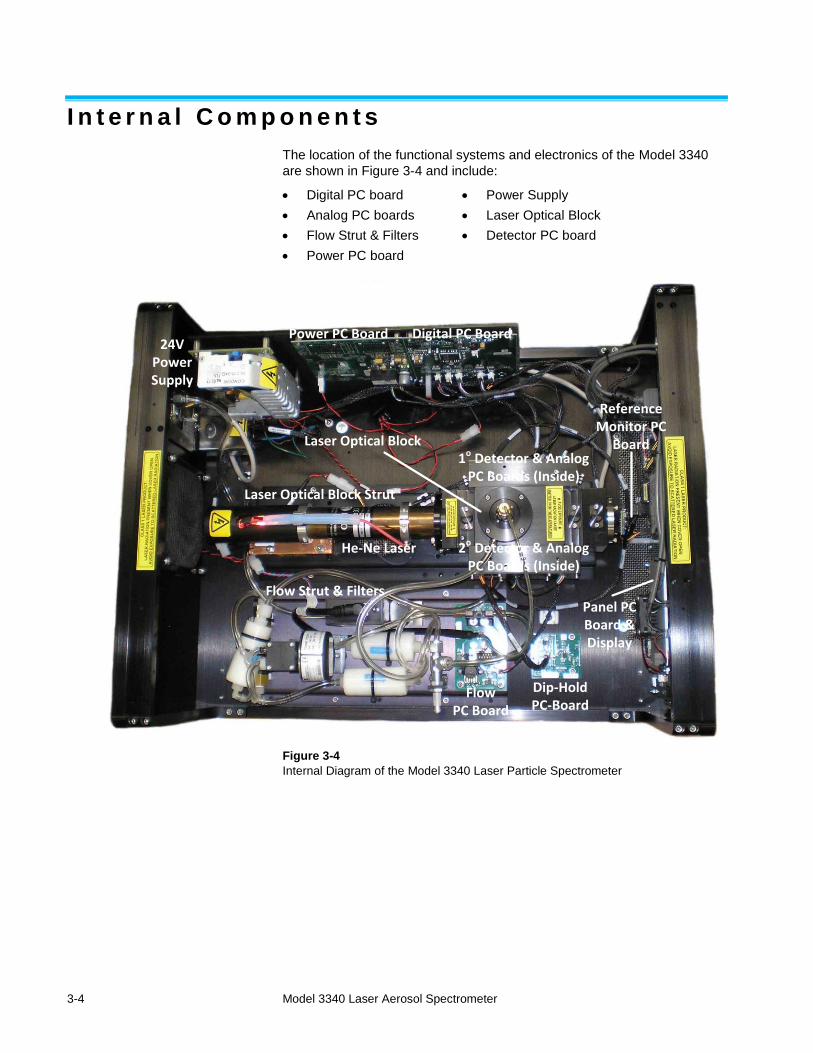
I n t e r n a l C o m p o n e n t s
The location of the functional systems and electronics of the Model 3340
are shown in Figure 3-4 and include:
Digital PC board
Analog PC boards
Flow Strut & Filters
Power PC board
Power Supply
Laser Optical Block
Detector PC board
Figure 3-4
Internal Diagram of the Model 3340 Laser Particle Spectrometer
24V Power Supply
Power PC Board Digital PC Board
Flow Strut & Filters
Flow PC Board
Dip-Hold PC-Board
Panel PC Board & Display
Reference Monitor PC
Board
He-Ne Laser
Laser Optical Block Strut
Laser Optical Block1o Detector & Analog
PC Boards (Inside)
2o Detector & Analog PC Boards (Inside)
4-1
C H A P T E R 4 Model 3340 Operat ion
This chapter describes how to set up and operate the Model 3340. These
instructions assume that the Model 3340 is connected to an AC power
source, the power on/off switch on the back panel has been switched to the
“On” position and that the computer has finished booting. The instrument
contains a computer which runs the Windows®
7 operating system. It is
assumed that the instrument user is familiar with the normal operation of
this operating system on a computer. The default user name entered at the
factory is TSIINC and the default password is 3340. Users may create
additional logins to suit their needs.
Q u i c k S t a r t G u i d e
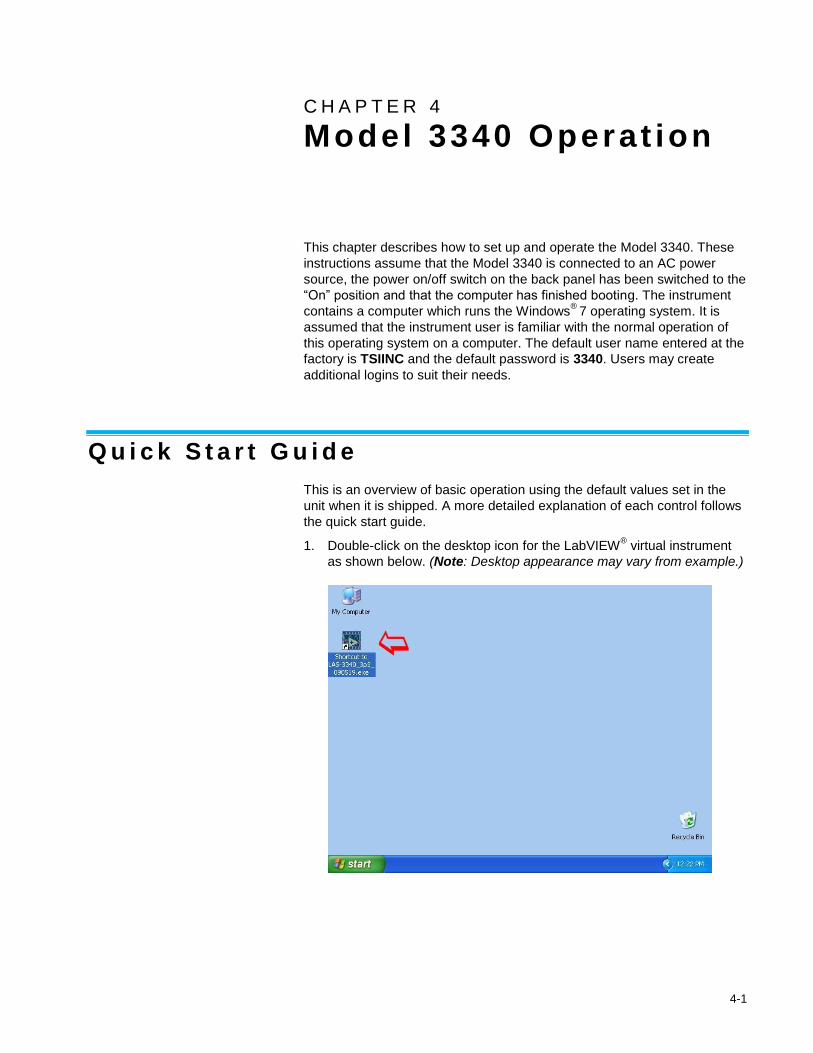
This is an overview of basic operation using the default values set in the
unit when it is shipped. A more detailed explanation of each control follows
the quick start guide.
1. Double-click on the desktop icon for the LabVIEW® virtual instrument
as shown below. (Note: Desktop appearance may vary from example.)
4-2 Model 3340 Laser Aerosol Spectrometer
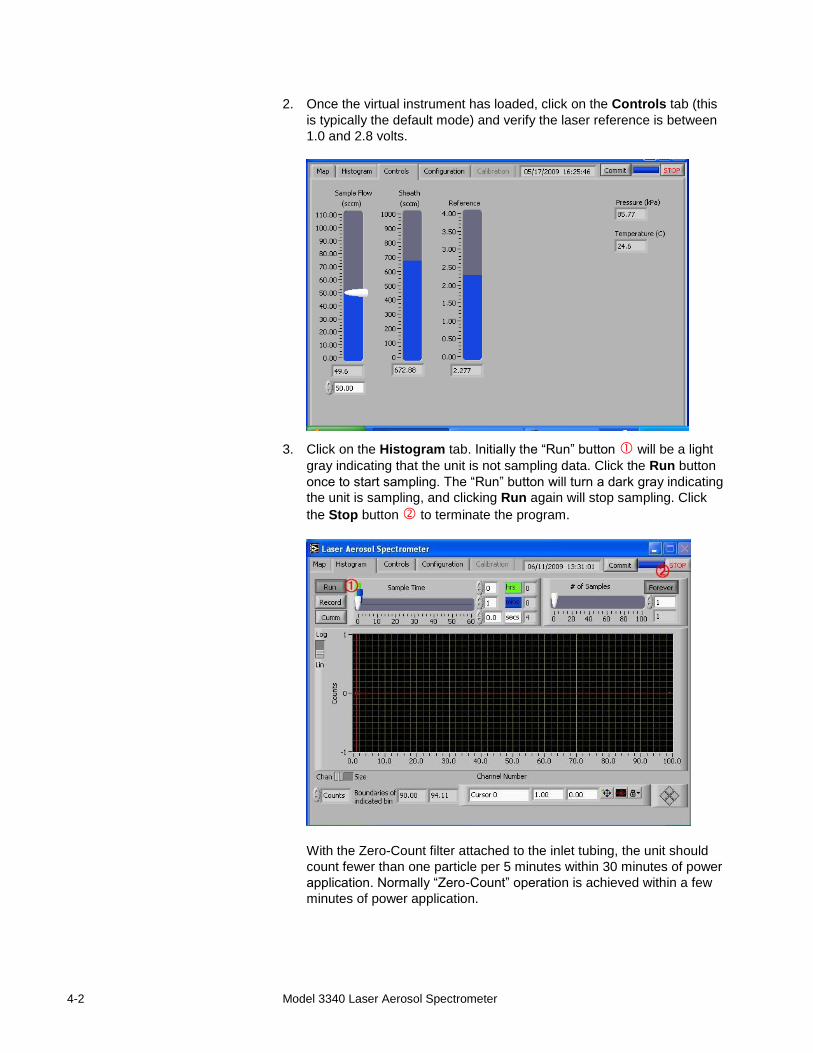
2. Once the virtual instrument has loaded, click on the Controls tab (this
is typically the default mode) and verify the laser reference is between
1.0 and 2.8 volts.
3. Click on the Histogram tab. Initially the “Run” button will be a light
gray indicating that the unit is not sampling data. Click the Run button
once to start sampling. The “Run” button will turn a dark gray indicating
the unit is sampling, and clicking Run again will stop sampling. Click
the Stop button to terminate the program.
With the Zero-Count filter attached to the inlet tubing, the unit should
count fewer than one particle per 5 minutes within 30 minutes of power
application. Normally “Zero-Count” operation is achieved within a few
minutes of power application.
Model 3340 Operation 4-3
U n i t C o n t r o l s
The TSI 3340 Laser Aerosol Spectrometer is completely controlled through
the virtual instrument software. All instrument and run settings can be
defined in the software. The following paragraphs explain in detail which
settings are controlled on which tabs of the software.
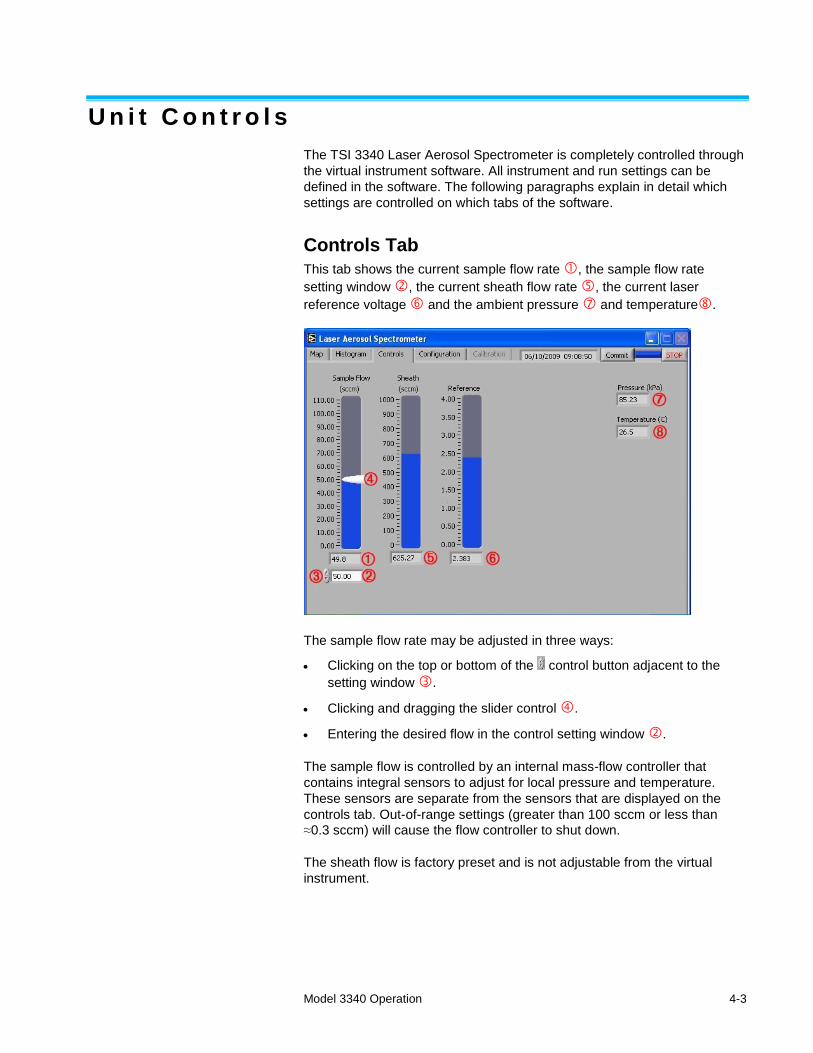
Controls Tab
This tab shows the current sample flow rate , the sample flow rate
setting window , the current sheath flow rate , the current laser
reference voltage and the ambient pressure and temperature.
The sample flow rate may be adjusted in three ways:
Clicking on the top or bottom of the control button adjacent to the
setting window .
Clicking and dragging the slider control .
Entering the desired flow in the control setting window .
The sample flow is controlled by an internal mass-flow controller that
contains integral sensors to adjust for local pressure and temperature.
These sensors are separate from the sensors that are displayed on the
controls tab. Out-of-range settings (greater than 100 sccm or less than
≈0.3 sccm) will cause the flow controller to shut down.
The sheath flow is factory preset and is not adjustable from the virtual
instrument.
4-4 Model 3340 Laser Aerosol Spectrometer
The laser reference voltage is a monitor of the relative laser power and is
not adjustable by the user. Reference values less than 1.0 V or greater
than 2.8 V after warm-up may be an indicator that the unit needs to be
serviced.
The Pressure and Temperature sensors are internal, non-precision
sensors intended for approximate measurements only.
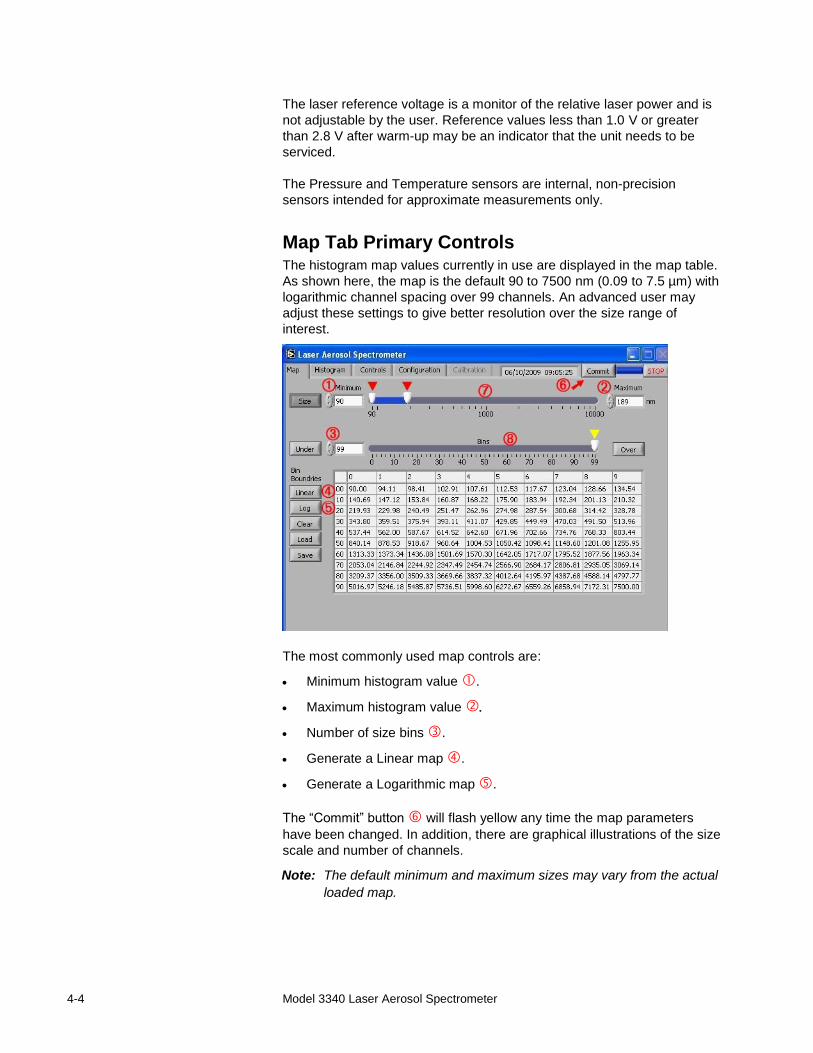
Map Tab Primary Controls The histogram map values currently in use are displayed in the map table.
As shown here, the map is the default 90 to 7500 nm (0.09 to 7.5 µm) with
logarithmic channel spacing over 99 channels. An advanced user may
adjust these settings to give better resolution over the size range of
interest.
The most commonly used map controls are:
Minimum histogram value .
Maximum histogram value
Number of size bins .
Generate a Linear map .
Generate a Logarithmic map .
The “Commit” button will flash yellow any time the map parameters
have been changed. In addition, there are graphical illustrations of the size
scale and number of channels.
Note: The default minimum and maximum sizes may vary from the actual
loaded map.
Model 3340 Operation 4-5
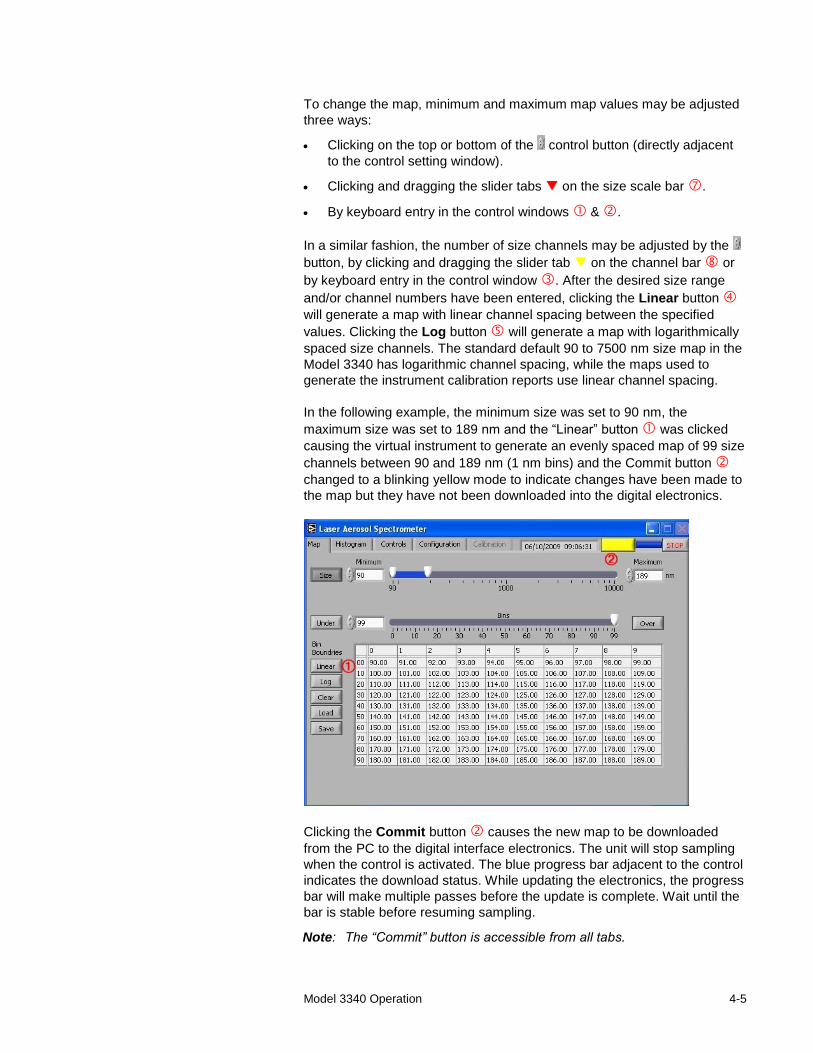
To change the map, minimum and maximum map values may be adjusted
three ways:
Clicking on the top or bottom of the control button (directly adjacent
to the control setting window).
Clicking and dragging the slider tabs on the size scale bar .
By keyboard entry in the control windows & .
In a similar fashion, the number of size channels may be adjusted by the
button, by clicking and dragging the slider tab on the channel bar or
by keyboard entry in the control window . After the desired size range
and/or channel numbers have been entered, clicking the Linear button
will generate a map with linear channel spacing between the specified
values. Clicking the Log button will generate a map with logarithmically
spaced size channels. The standard default 90 to 7500 nm size map in the
Model 3340 has logarithmic channel spacing, while the maps used to
generate the instrument calibration reports use linear channel spacing.
In the following example, the minimum size was set to 90 nm, the
maximum size was set to 189 nm and the “Linear” button was clicked
causing the virtual instrument to generate an evenly spaced map of 99 size
channels between 90 and 189 nm (1 nm bins) and the Commit button
changed to a blinking yellow mode to indicate changes have been made to
the map but they have not been downloaded into the digital electronics.
Clicking the Commit button causes the new map to be downloaded
from the PC to the digital interface electronics. The unit will stop sampling
when the control is activated. The blue progress bar adjacent to the control
indicates the download status. While updating the electronics, the progress
bar will make multiple passes before the update is complete. Wait until the
bar is stable before resuming sampling.
Note: The “Commit” button is accessible from all tabs.
4-6 Model 3340 Laser Aerosol Spectrometer
The map limits may be set anywhere in the units operating range (90 to
7500 nm) such as the 90 to 189 nm range in the example above.
Note: The minimum and maximum settings are integer numbers and
although the size bins are calculated to 2 decimal points it is
generally not useful to set bin widths less than 1nm.
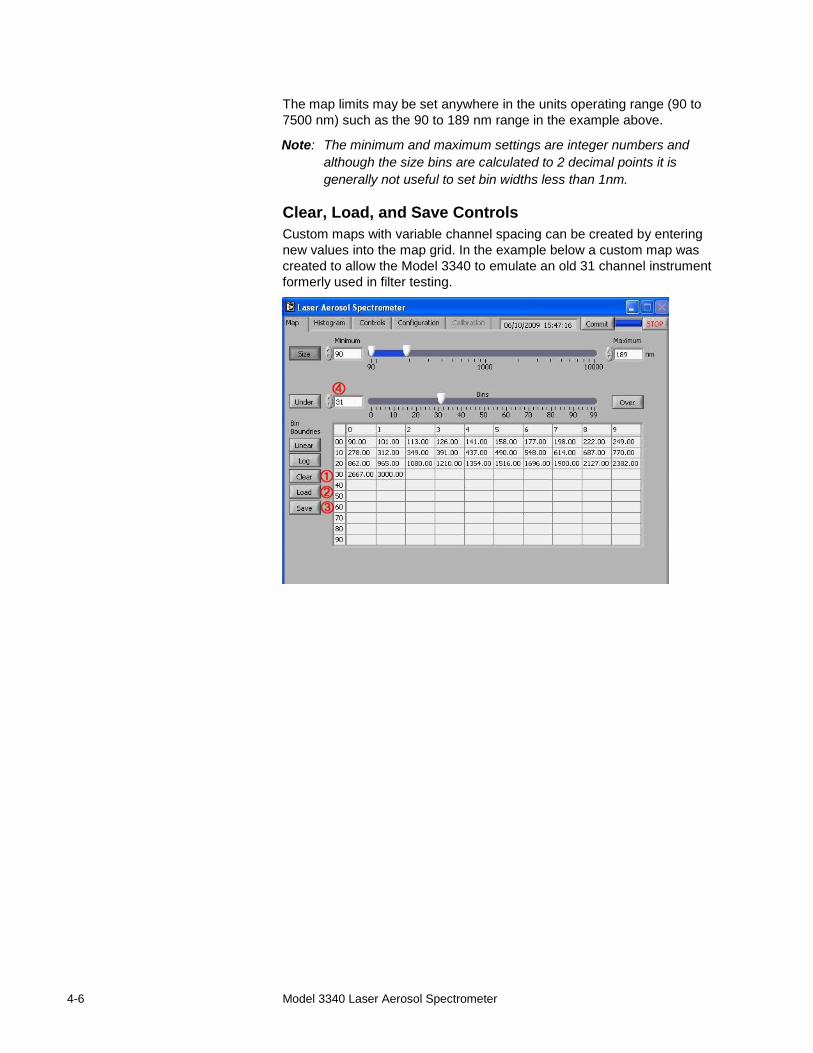
Clear, Load, and Save Controls
Custom maps with variable channel spacing can be created by entering
new values into the map grid. In the example below a custom map was
created to allow the Model 3340 to emulate an old 31 channel instrument
formerly used in filter testing.
Model 3340 Operation 4-7
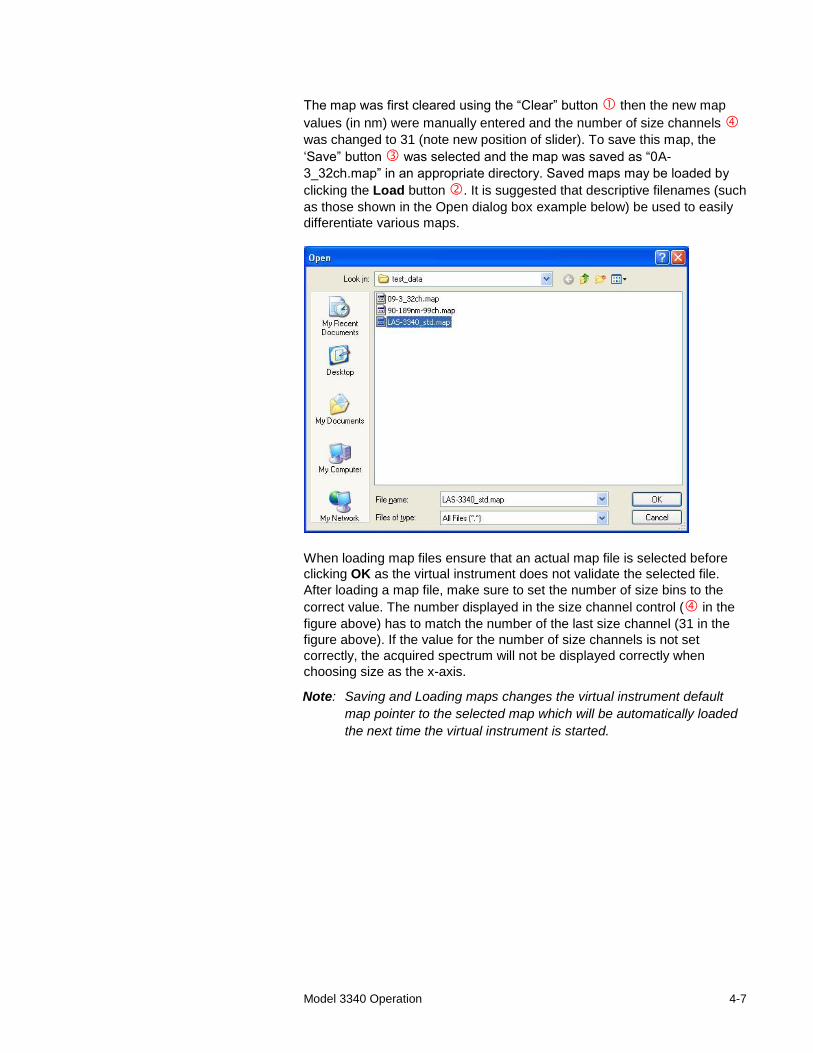
The map was first cleared using the “Clear” button then the new map
values (in nm) were manually entered and the number of size channels
was changed to 31 (note new position of slider). To save this map, the
‘Save” button was selected and the map was saved as “0A-
3_32ch.map” in an appropriate directory. Saved maps may be loaded by
clicking the Load button . It is suggested that descriptive filenames (such
as those shown in the Open dialog box example below) be used to easily
differentiate various maps.
When loading map files ensure that an actual map file is selected before
clicking OK as the virtual instrument does not validate the selected file.
After loading a map file, make sure to set the number of size bins to the
correct value. The number displayed in the size channel control ( in the
figure above) has to match the number of the last size channel (31 in the
figure above). If the value for the number of size channels is not set
correctly, the acquired spectrum will not be displayed correctly when
choosing size as the x-axis.
Note: Saving and Loading maps changes the virtual instrument default
map pointer to the selected map which will be automatically loaded
the next time the virtual instrument is started.
4-8 Model 3340 Laser Aerosol Spectrometer
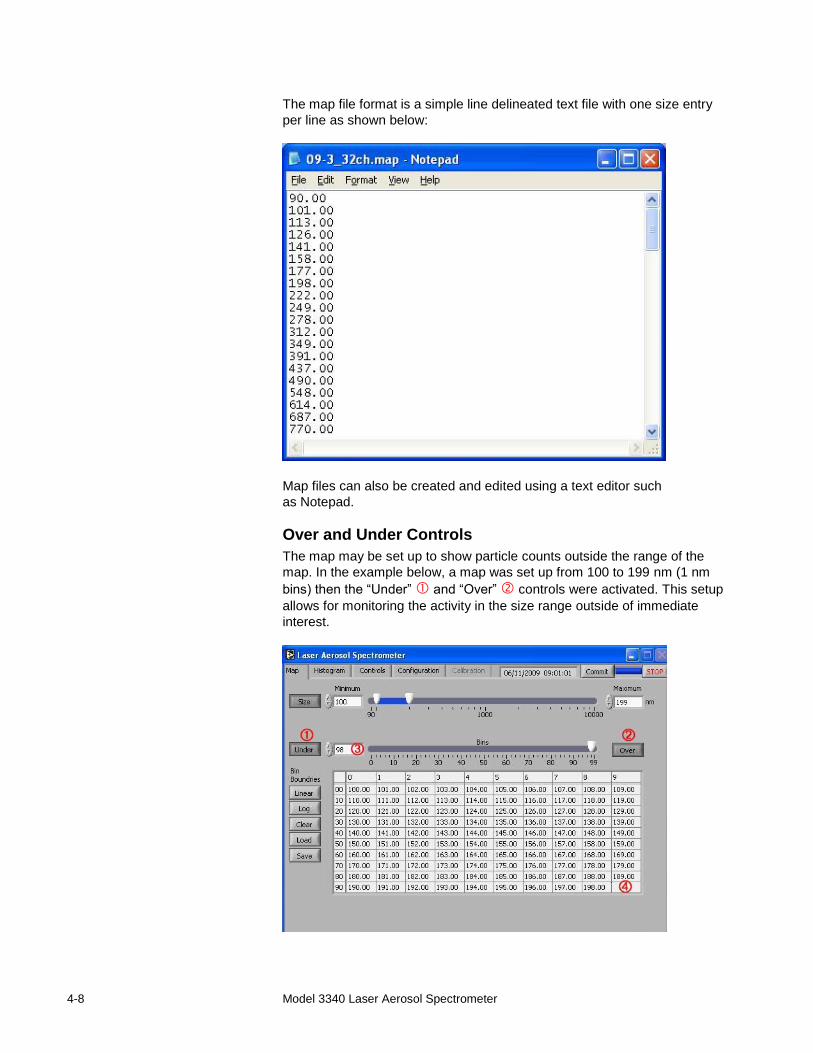
The map file format is a simple line delineated text file with one size entry
per line as shown below:
Map files can also be created and edited using a text editor such
as Notepad.
Over and Under Controls
The map may be set up to show particle counts outside the range of the
map. In the example below, a map was set up from 100 to 199 nm (1 nm
bins) then the “Under” and “Over” controls were activated. This setup
allows for monitoring the activity in the size range outside of immediate
interest.
Model 3340 Operation 4-9
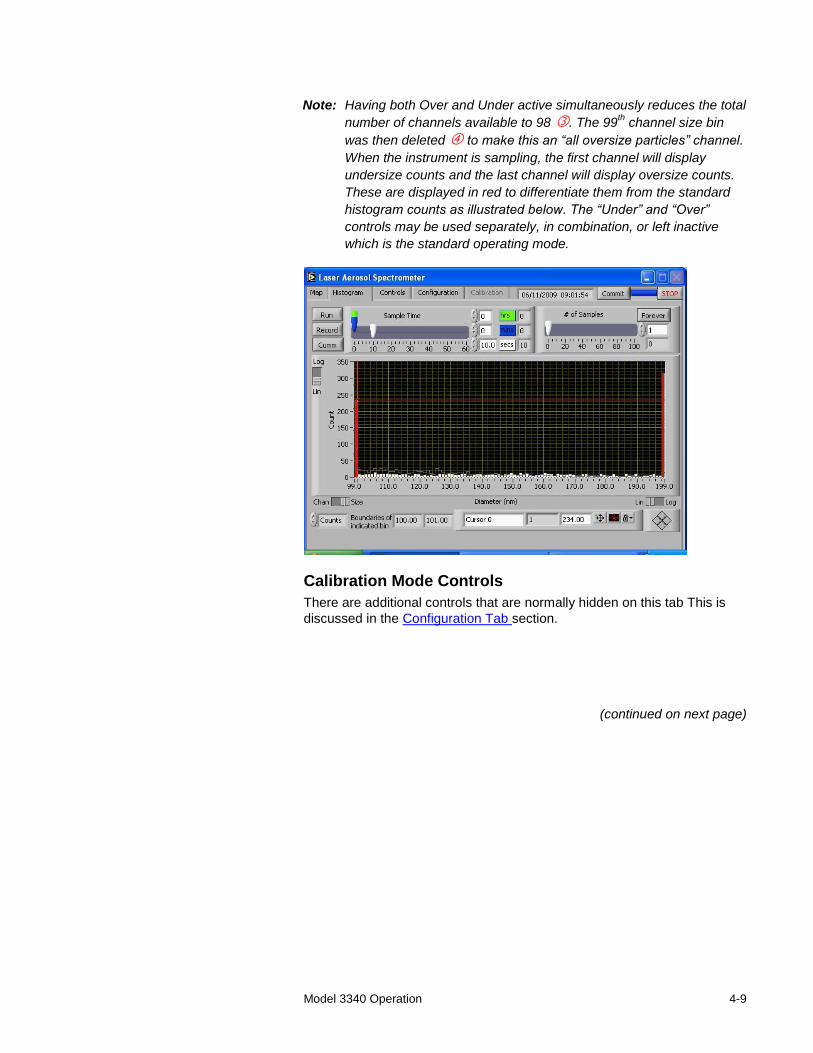
Note: Having both Over and Under active simultaneously reduces the total
number of channels available to 98 . The 99th channel size bin
was then deleted to make this an “all oversize particles” channel.
When the instrument is sampling, the first channel will display
undersize counts and the last channel will display oversize counts.
These are displayed in red to differentiate them from the standard
histogram counts as illustrated below. The “Under” and “Over”
controls may be used separately, in combination, or left inactive
which is the standard operating mode.
Calibration Mode Controls
There are additional controls that are normally hidden on this tab This is
discussed in the Configuration Tab section.
(continued on next page)
4-10 Model 3340 Laser Aerosol Spectrometer
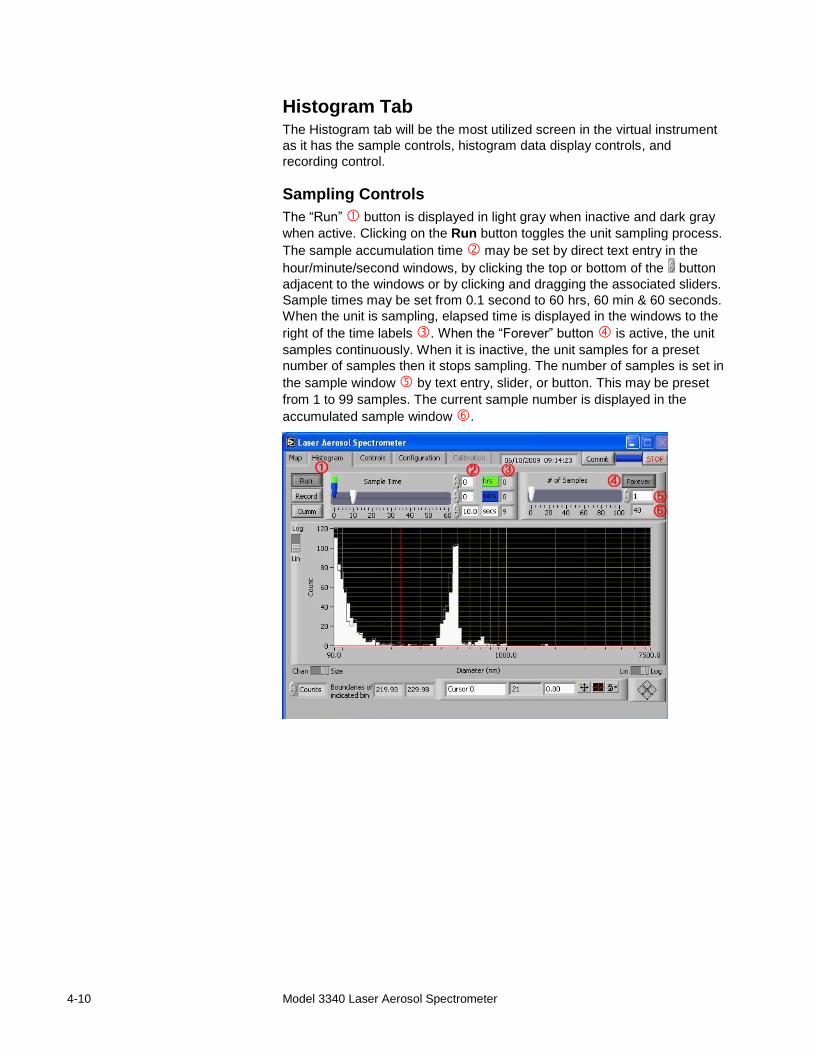
Histogram Tab The Histogram tab will be the most utilized screen in the virtual instrument
as it has the sample controls, histogram data display controls, and
recording control.
Sampling Controls
The “Run” button is displayed in light gray when inactive and dark gray
when active. Clicking on the Run button toggles the unit sampling process.
The sample accumulation time may be set by direct text entry in the
hour/minute/second windows, by clicking the top or bottom of the button
adjacent to the windows or by clicking and dragging the associated sliders.
Sample times may be set from 0.1 second to 60 hrs, 60 min & 60 seconds.
When the unit is sampling, elapsed time is displayed in the windows to the
right of the time labels . When the “Forever” button is active, the unit
samples continuously. When it is inactive, the unit samples for a preset
number of samples then it stops sampling. The number of samples is set in
the sample window by text entry, slider, or button. This may be preset
from 1 to 99 samples. The current sample number is displayed in the
accumulated sample window .
Model 3340 Operation 4-11
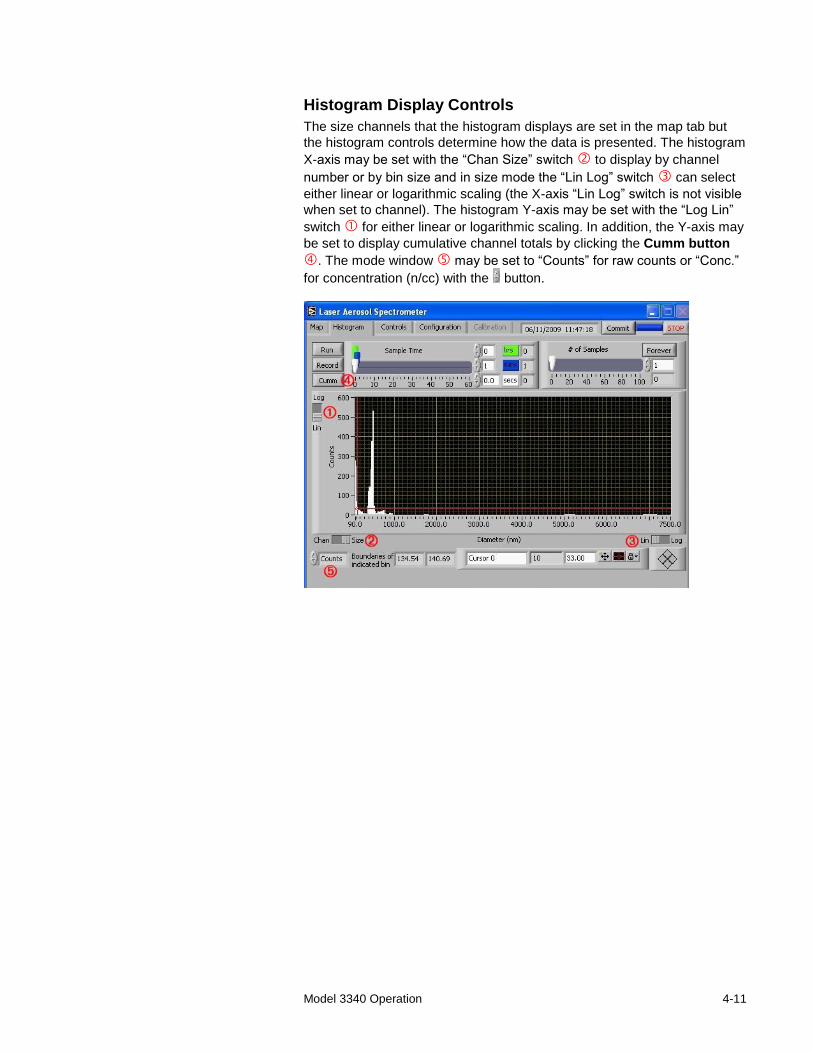
Histogram Display Controls
The size channels that the histogram displays are set in the map tab but
the histogram controls determine how the data is presented. The histogram
X-axis may be set with the “Chan Size” switch to display by channel
number or by bin size and in size mode the “Lin Log” switch can select
either linear or logarithmic scaling (the X-axis “Lin Log” switch is not visible
when set to channel). The histogram Y-axis may be set with the “Log Lin”
switch for either linear or logarithmic scaling. In addition, the Y-axis may
be set to display cumulative channel totals by clicking the Cumm button
. The mode window may be set to “Counts” for raw counts or “Conc.”
for concentration (n/cc) with the button.
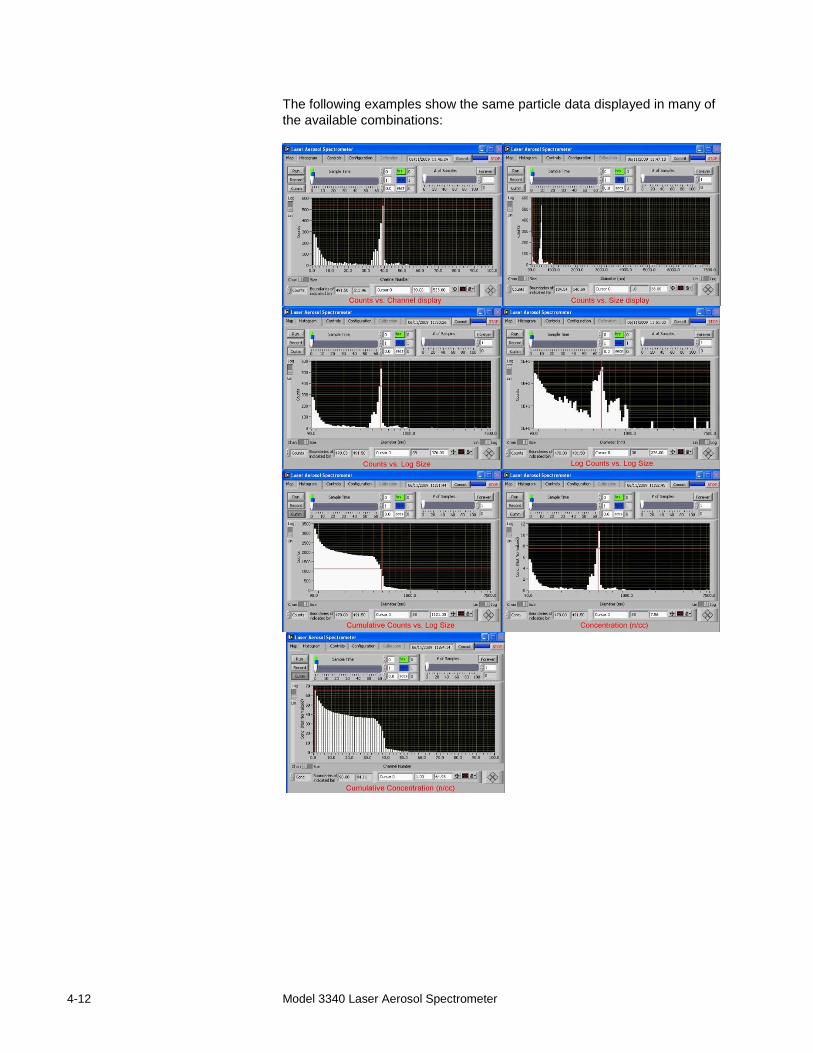
4-12 Model 3340 Laser Aerosol Spectrometer
The following examples show the same particle data displayed in many of
the available combinations:
Model 3340 Operation 4-13
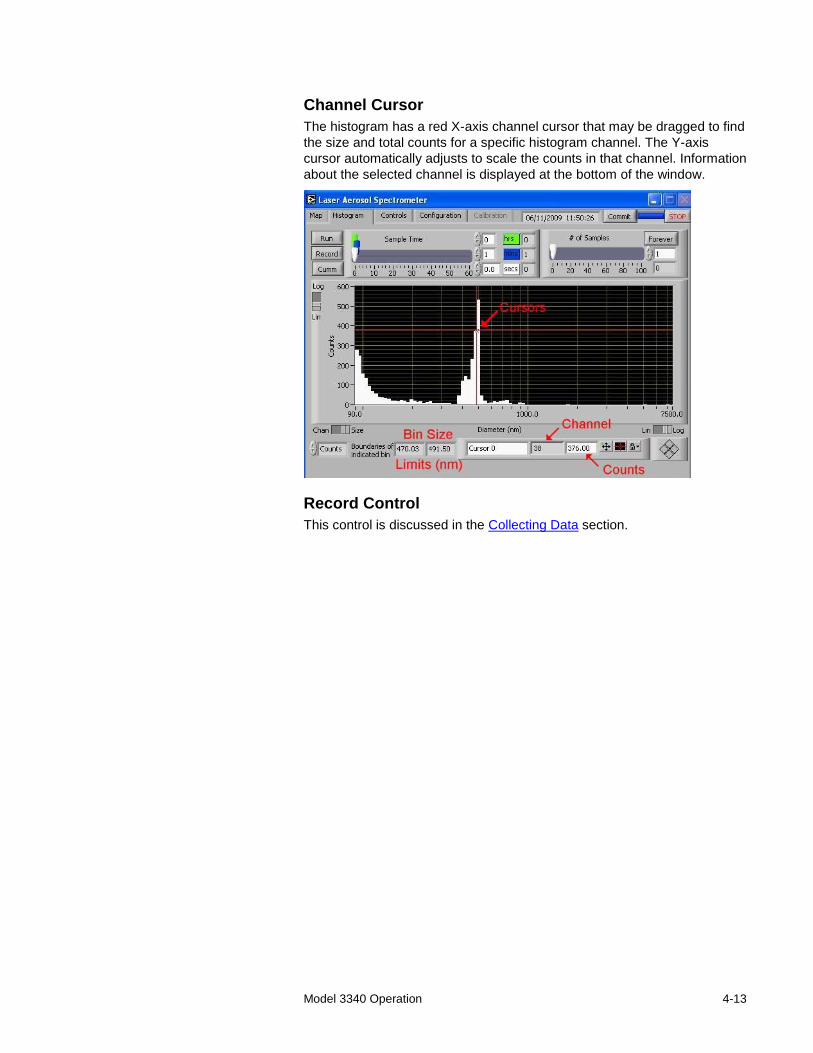
Channel Cursor
The histogram has a red X-axis channel cursor that may be dragged to find
the size and total counts for a specific histogram channel. The Y-axis
cursor automatically adjusts to scale the counts in that channel. Information
about the selected channel is displayed at the bottom of the window.
Record Control
This control is discussed in the Collecting Data section.
4-14 Model 3340 Laser Aerosol Spectrometer
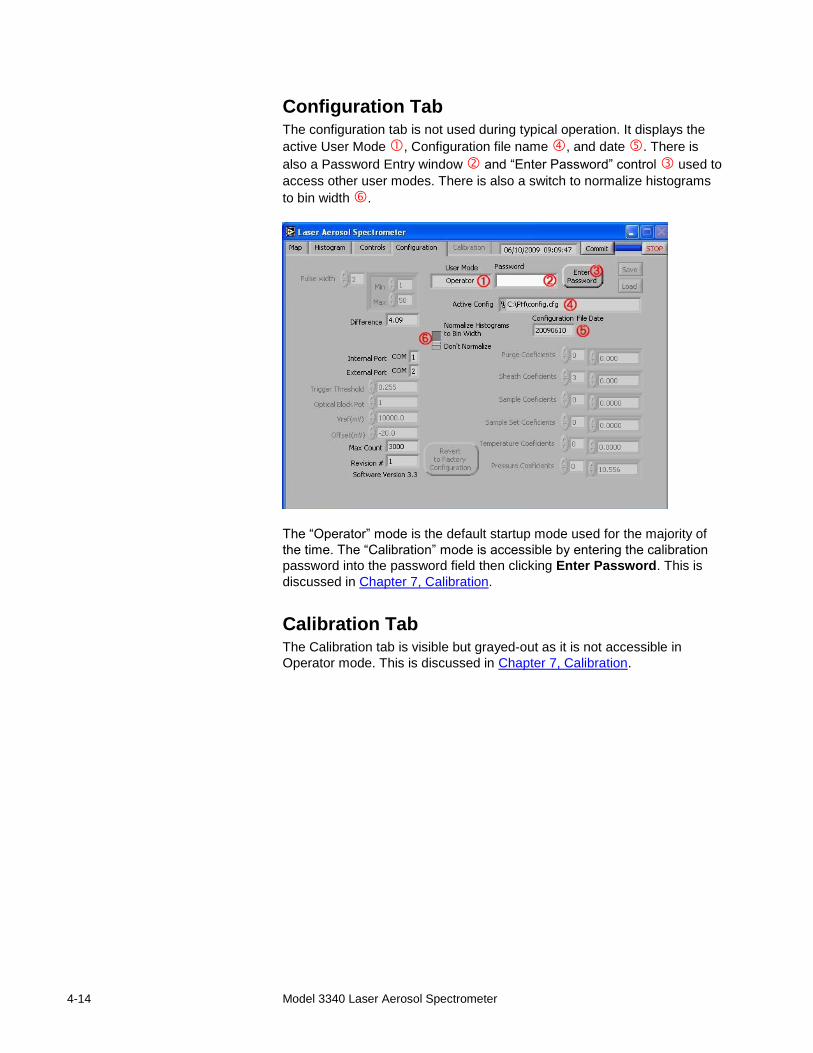
Configuration Tab The configuration tab is not used during typical operation. It displays the
active User Mode , Configuration file name , and date . There is
also a Password Entry window and “Enter Password” control used to
access other user modes. There is also a switch to normalize histograms
to bin width .
The “Operator” mode is the default startup mode used for the majority of
the time. The “Calibration” mode is accessible by entering the calibration
password into the password field then clicking Enter Password. This is
discussed in Chapter 7, Calibration.
Calibration Tab The Calibration tab is visible but grayed-out as it is not accessible in
Operator mode. This is discussed in Chapter 7, Calibration.
Model 3340 Operation 4-15
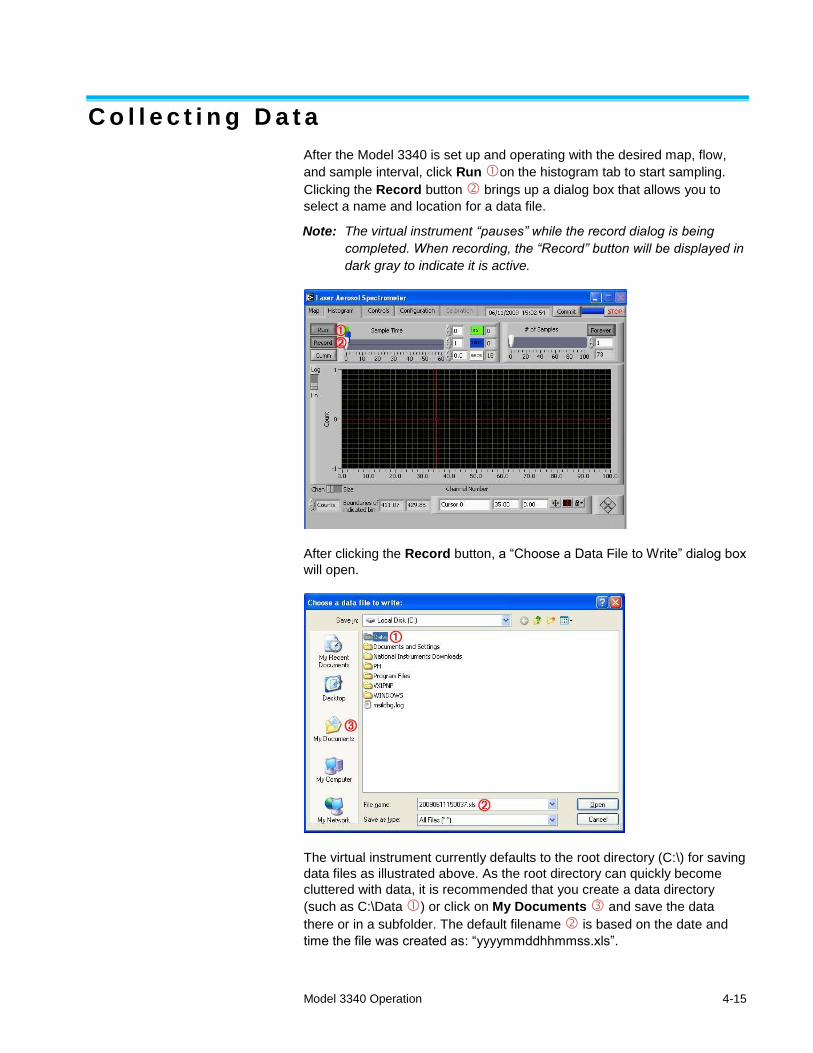
C o l l e c t i n g D a t a
After the Model 3340 is set up and operating with the desired map, flow,
and sample interval, click Run on the histogram tab to start sampling.
Clicking the Record button brings up a dialog box that allows you to
select a name and location for a data file.
Note: The virtual instrument “pauses” while the record dialog is being
completed. When recording, the “Record” button will be displayed in
dark gray to indicate it is active.
After clicking the Record button, a “Choose a Data File to Write” dialog box
will open.
The virtual instrument currently defaults to the root directory (C:\) for saving
data files as illustrated above. As the root directory can quickly become
cluttered with data, it is recommended that you create a data directory
(such as C:\Data ) or click on My Documents and save the data
there or in a subfolder. The default filename is based on the date and
time the file was created as: “yyyymmddhhmmss.xls”.
4-16 Model 3340 Laser Aerosol Spectrometer
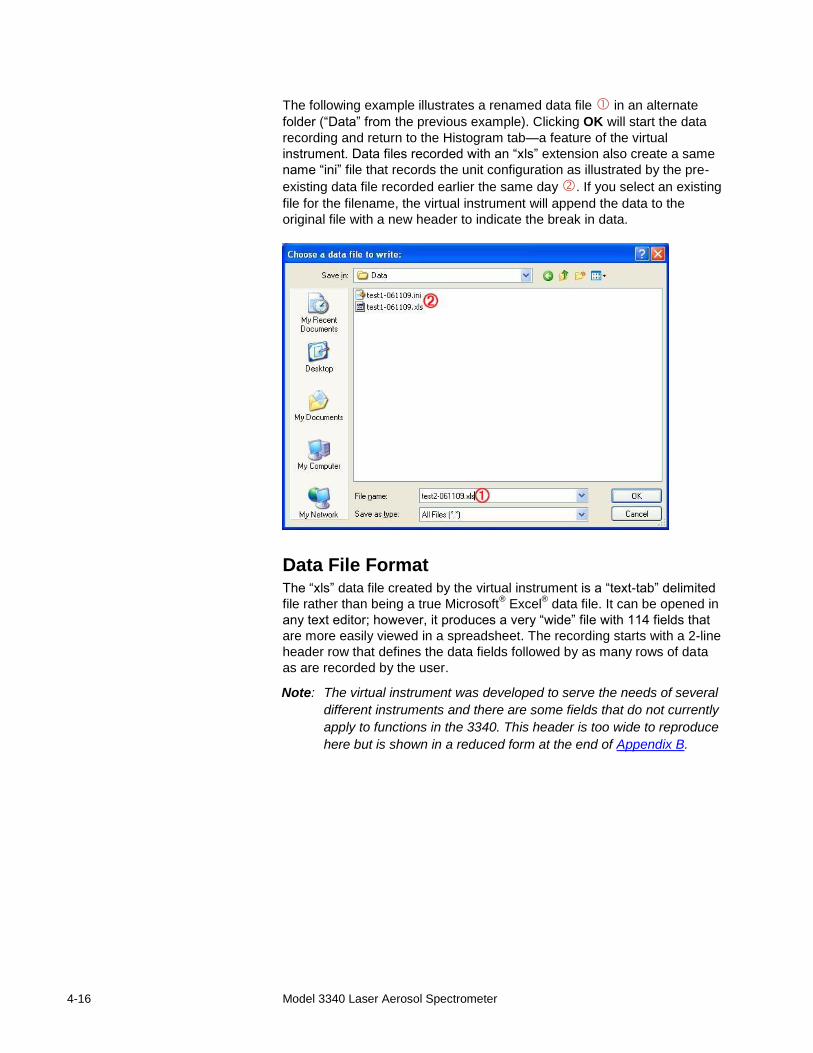
The following example illustrates a renamed data file in an alternate
folder (“Data” from the previous example). Clicking OK will start the data
recording and return to the Histogram tab—a feature of the virtual
instrument. Data files recorded with an “xls” extension also create a same
name “ini” file that records the unit configuration as illustrated by the pre-
existing data file recorded earlier the same day . If you select an existing
file for the filename, the virtual instrument will append the data to the
original file with a new header to indicate the break in data.
Data File Format The “xls” data file created by the virtual instrument is a “text-tab” delimited
file rather than being a true Microsoft® Excel
® data file. It can be opened in
any text editor; however, it produces a very “wide” file with 114 fields that
are more easily viewed in a spreadsheet. The recording starts with a 2-line
header row that defines the data fields followed by as many rows of data
as are recorded by the user.
Note: The virtual instrument was developed to serve the needs of several
different instruments and there are some fields that do not currently
apply to functions in the 3340. This header is too wide to reproduce
here but is shown in a reduced form at the end of Appendix B.
5-1
C H A P T E R 5 Theory of Operat ion
The Model 3340 is a laser aerosol spectrometer that measures the size of
particles based on the amount of light scattered by the particle as it passes
through an intense laser beam.
In the instrument, particles are confined to the centerline of the laser beam
by sheath air. Side-scattered light is collected by dual Mangin mirror pairs
that focus the collected light onto two solid-state photodetectors. The
electronics convert the light pulses into electrical pulses the amplitude of
which are then measured to determine the diameter for each individual
particle. Transit times are also measured and minimum and maximum
transit thresholds may be set for each detector gain stage.
The particle range spanned by the Model 3340 is from 0.09 to 7.5 µm and
particle data are binned into up to 100 user defined size channels.
I n s t r u m e n t S u b s y s t e m s
The TSI Model 3340 is an optical-scattering laser-based aerosol particle
spectrometer system for accurately and precisely sizing particles in the
range from 90 nm to 7.5 µm in diameter. It uses fully user-specified size
binning of up to 100 channels anywhere within its size range.
The spectrometer instrument consists of five general subsystems,
described in this chapter.
1. The main optical subsystem responsible for generating the laser light,
detecting the scattering from the particles and providing a mechanical
enclosure for the optical system and for delivery of the sample aerosol.
2. The flow system for bringing the sample aerosol through the optical
interaction region, including flow control and measurement.
3. The analog electronics system for amplifying and processing the
particle signals.
4. The digital electronics system for analyzing particle signals, binning
signals according to user-specified bin mappings and generating a
histogram of number of particles in the specified bins, and for
communicating with the PC and system monitor/control functions.
5. An onboard PC running Windows and a specialized application GUI for
instrument control, setup and data reporting and collection.
5-2 Model 3340 Laser Aerosol Spectrometer
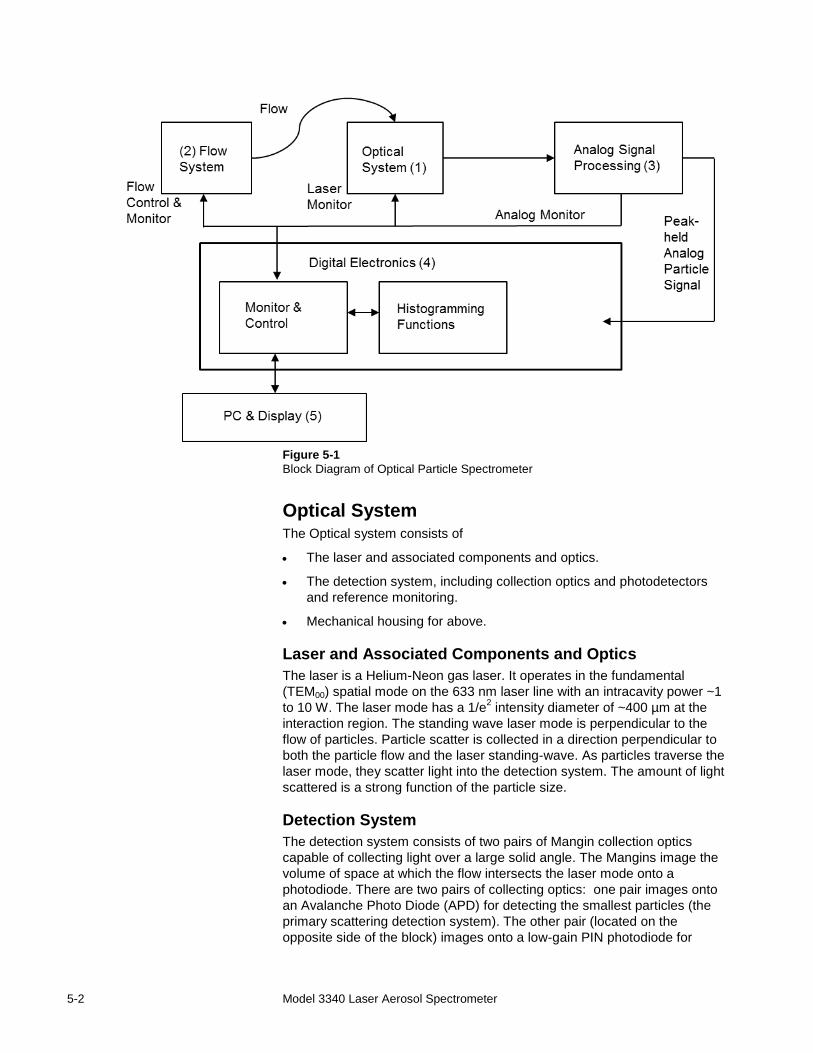
Figure 5-1
Block Diagram of Optical Particle Spectrometer
Optical System The Optical system consists of
The laser and associated components and optics.
The detection system, including collection optics and photodetectors
and reference monitoring.
Mechanical housing for above.
Laser and Associated Components and Optics
The laser is a Helium-Neon gas laser. It operates in the fundamental
(TEM00) spatial mode on the 633 nm laser line with an intracavity power ~1
to 10 W. The laser mode has a 1/e2 intensity diameter of ~400 µm at the
interaction region. The standing wave laser mode is perpendicular to the
flow of particles. Particle scatter is collected in a direction perpendicular to
both the particle flow and the laser standing-wave. As particles traverse the
laser mode, they scatter light into the detection system. The amount of light
scattered is a strong function of the particle size.
Detection System
The detection system consists of two pairs of Mangin collection optics
capable of collecting light over a large solid angle. The Mangins image the
volume of space at which the flow intersects the laser mode onto a
photodiode. There are two pairs of collecting optics: one pair images onto
an Avalanche Photo Diode (APD) for detecting the smallest particles (the
primary scattering detection system). The other pair (located on the
opposite side of the block) images onto a low-gain PIN photodiode for
Theory of Operation 5-3
detection of the upper size range of the instrument (the secondary
scattering detection system). Each detector is amplified in a current-to-
voltage stage which feeds the analog electronics system. The system can
detect particles as small as 90 nm (≥50% efficiency, <01 count/ 5 minute
dark count rate). The system size sensitivity is limited by several noise
sources: a fundamental noise process from the photon shot noise on the
detected molecular scatter from background gas, a fundamental noise
process from the Johnson noise in the photodiode transimpedence
feedback resistor and from technical noise of various sources.
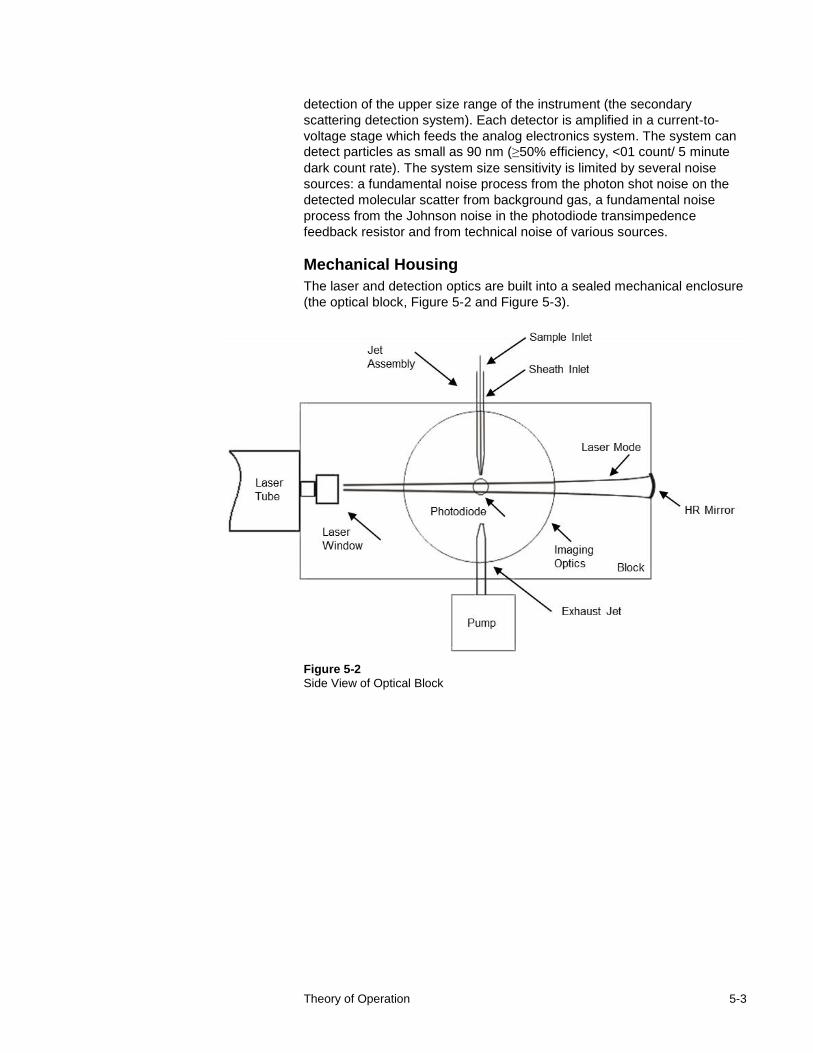
Mechanical Housing
The laser and detection optics are built into a sealed mechanical enclosure
(the optical block, Figure 5-2 and Figure 5-3).
Figure 5-2
Side View of Optical Block
5-4 Model 3340 Laser Aerosol Spectrometer
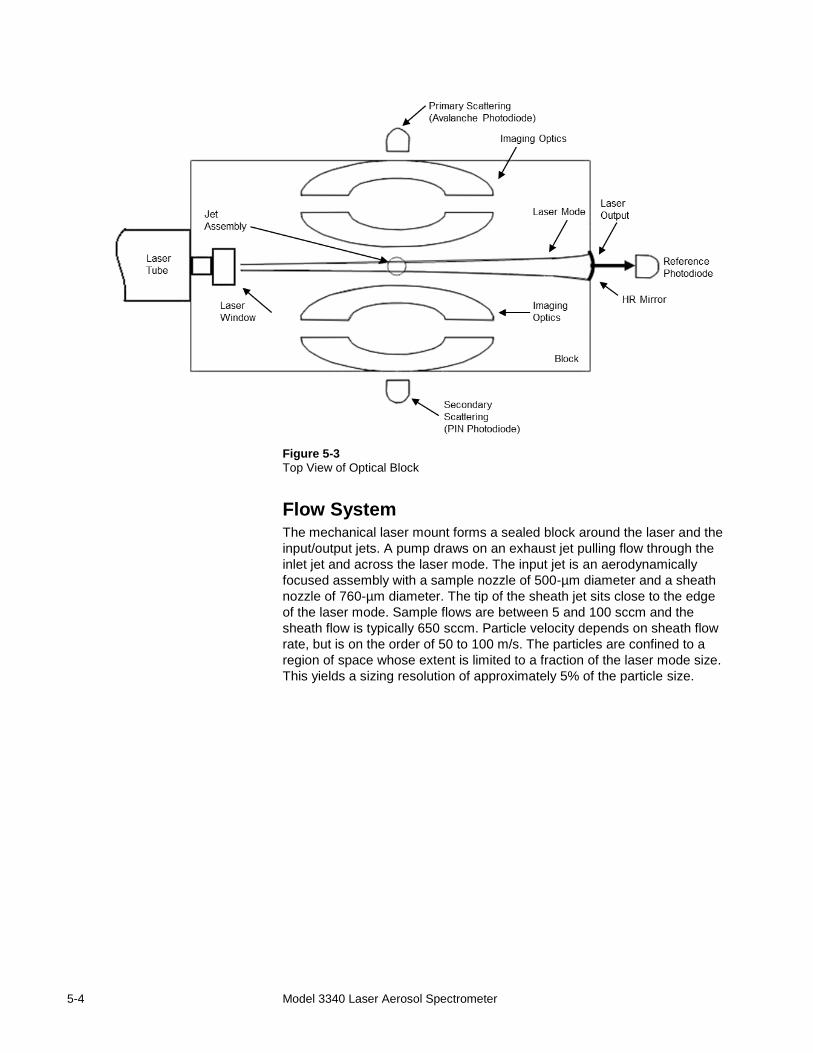
Figure 5-3
Top View of Optical Block
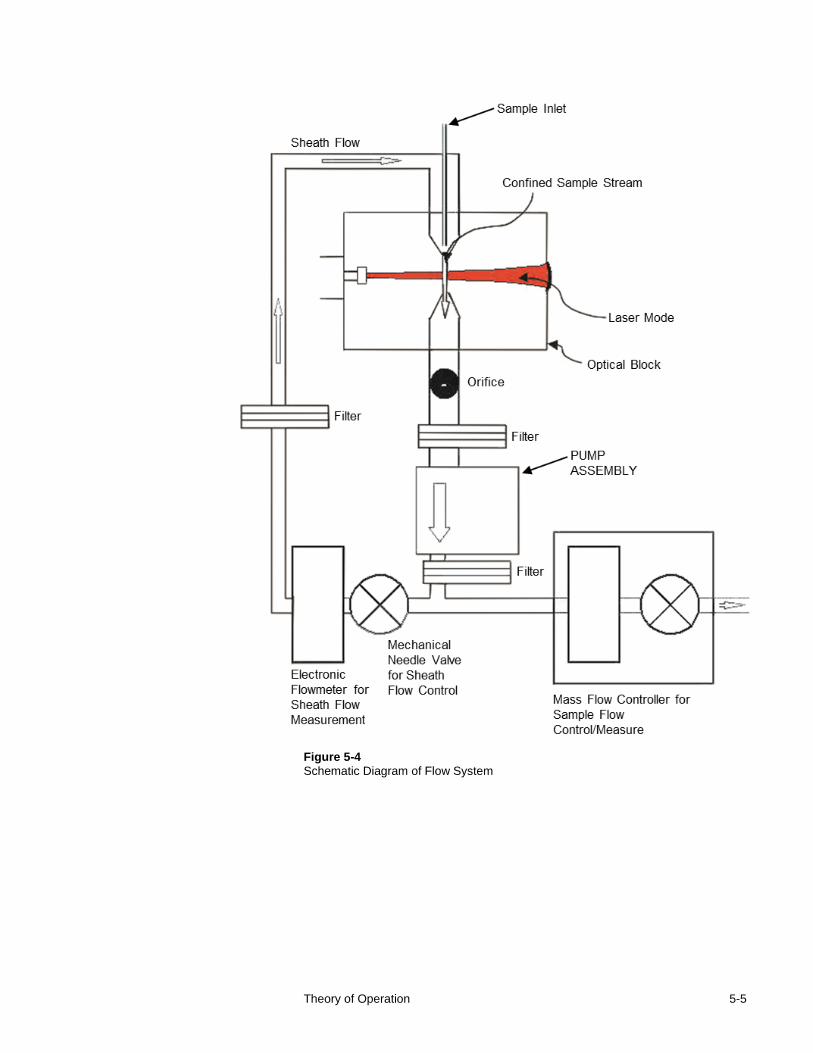
Flow System The mechanical laser mount forms a sealed block around the laser and the
input/output jets. A pump draws on an exhaust jet pulling flow through the
inlet jet and across the laser mode. The input jet is an aerodynamically
focused assembly with a sample nozzle of 500-µm diameter and a sheath
nozzle of 760-µm diameter. The tip of the sheath jet sits close to the edge
of the laser mode. Sample flows are between 5 and 100 sccm and the
sheath flow is typically 650 sccm. Particle velocity depends on sheath flow
rate, but is on the order of 50 to 100 m/s. The particles are confined to a
region of space whose extent is limited to a fraction of the laser mode size.
This yields a sizing resolution of approximately 5% of the particle size.
Theory of Operation 5-5
Figure 5-4
Schematic Diagram of Flow System
5-6 Model 3340 Laser Aerosol Spectrometer
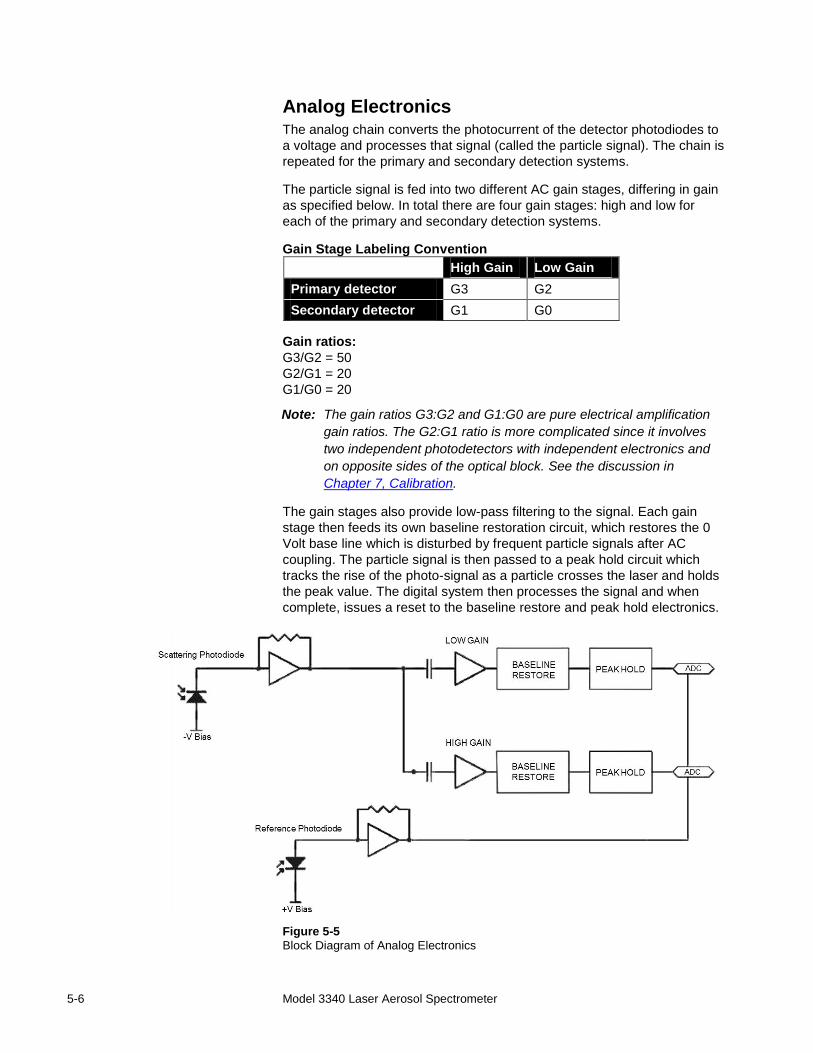
Analog Electronics The analog chain converts the photocurrent of the detector photodiodes to
a voltage and processes that signal (called the particle signal). The chain is
repeated for the primary and secondary detection systems.
The particle signal is fed into two different AC gain stages, differing in gain
as specified below. In total there are four gain stages: high and low for
each of the primary and secondary detection systems.
Gain Stage Labeling Convention
High Gain Low Gain
Primary detector G3 G2
Secondary detector G1 G0
Gain ratios:
G3/G2 = 50
G2/G1 = 20
G1/G0 = 20
Note: The gain ratios G3:G2 and G1:G0 are pure electrical amplification
gain ratios. The G2:G1 ratio is more complicated since it involves
two independent photodetectors with independent electronics and
on opposite sides of the optical block. See the discussion in
Chapter 7, Calibration.
The gain stages also provide low-pass filtering to the signal. Each gain
stage then feeds its own baseline restoration circuit, which restores the 0
Volt base line which is disturbed by frequent particle signals after AC
coupling. The particle signal is then passed to a peak hold circuit which
tracks the rise of the photo-signal as a particle crosses the laser and holds
the peak value. The digital system then processes the signal and when
complete, issues a reset to the baseline restore and peak hold electronics.
Figure 5-5
Block Diagram of Analog Electronics
Theory of Operation 5-7
Digital Electronics System Digital electronics are used for pulse height analysis and monitoring and
control of on-board systems such as flow meters and environmental
variables.
Analog-to-Digital Converters and Peak Height Analysis
For each of the four gain stages (2 primary, 2 secondary) there is an
associated Analog-to-digital (ADC) converter. The ADCs run a 16-bit
conversion at 100 kHz sample rate. The chain of events is begun as a
particle traverses the laser mode and begins scattering light. The particle
signal from the highest gain stage on the primary detector (G3) feeds an
analog comparator. If the signal exceeds a preset (user-settable) threshold
it generates a particle trigger. The threshold value is independent of the
particular active bin map: it is should be set to register the smallest
detectable particle (90 nm diameter) under typical operating parameters.
After a trigger is generated and after a small delay to allow the particle
signal to reach its maximum, the 4 ADCs sample the 4 peak-held particle
signals from the four gain stages. Starting from highest gain (G3) and
working down in gain, the first ADC that is not in saturation is the valid
particle ADC. The value of this ADC is read and compared to a look-up
table of bin boundaries previously loaded into memory. Depending on
where in the look-up table the particle signal belongs, a counter for the
appropriate channel is incremented (There are certain conditions which will
post-invalidate a particle event, for example, if the event falls outside
certain timing requirements.) After the particle signal is sampled, a reset is
sent to the peak hold circuit and the cycle repeats for the next particle.
The look-up table is the heart of the peak-height analysis in this instrument.
It can be reset by the user at any time to generate an arbitrary bin
mapping. The user specifies the boundaries of the channels and this is
automatically converted, via the calibration curve, relative gains and
calibration points into a mapping of voltages at each of the gain stages.
The mapping process is transparent to the user and occurs every time a
bin map is committed to the instrument (see the Calibration section below).
Monitoring/Control
The digital system also provides monitoring and control of onboard
systems. It reads and sets the mass flow controller for monitoring and
control of the sample flow. It reads the electronic flowmeters for the sheath
flow (flow is controlled by a mechanically-actuated needle valve). The laser
reference from the reference photodiode is sampled on an ADC and read
in the digital electronics module. Additional housekeeping parameters such
as case temperature and ambient barometric pressure are also monitored.
All parameters which are read by the digital system are logged with the
sample data. All parameters which are set are stored in configuration files.
5-8 Model 3340 Laser Aerosol Spectrometer
On-board PC The on-board PC provides all user interface to the instrument. It is an
800 mHz Celeron® single-board computer running the Windows
® 7
operating system. The monitor is a standard 640 × 480 LCD display. All
normal OS operations are handled by Windows®, e.g., networking, file
management, printing, etc. The user interface is a virtual instrument written
in National Instruments LabVIEW® (see Chapter 4). Communication with
the digital electronics system is via internal RS-232. The update rate of the
PC I/O is 10 times per second.
Calibration
Calibration is an important process for any particle spectrometer
instrument. The Model 3340 with its high resolution and large number of
arbitrarily settable bins poses unique challenges in this area. Several
features have been added to this instrument to make the calibration
process as easy and accurate as possible.
There are four separate gain stages which must be “stitched” together for
accurate, seamless sizing across the full dynamic range of the instrument.
The gain stages are labeled in the table in a preceding section. There are
two types of gains that need calibrating: absolute and relative gains.
Relative gains are used to calibrate gain stages to one another. Absolute
gain is used to fix the overall scale to a known particle size.
The relative gain calibration is somewhat automated, though the results
can always be altered if you need to make slight adjustments. The relative
gain calibration works by sampling an ambient air distribution which
contains particles of all sizes measured by the spectrometer. The
instrument detects a particle on adjacent gain stages (for example G3 and
G2), noting the signal size on both gain stages (in volts). (For example a
150 nm particle might be 7.5 V on G3 and 0.150 V on G2.) By noting many
such events, a relationship between the signal size of a particle on the two
gain stages can be determined---the relative gain. A linear fit to the data for
many events produces a relative gain and an offset between adjacent gain
stages. By running this procedure on all adjacent gain stage pairs (G3 and
G2; G2 and G1; G1 and G0) a complete specification of the relative gains
can be developed, linking the optical and electronic signals across the
range of the instrument (which spans 6 decades of signal size in volts).
In addition to the relative gains is the calibration curve, that is, the shape of
the particle signal size (in volts) and the particle size (in nm). Once the
relative gains are known the corrected response for the entire instrument
can be formed from the calibration curve. The calibration curve has several
distinct regions. Since the wavelength of the instrument is 633 nm, it is
expected that all particles below approximately 300 nm will lie on a sixth-
power curve, that is, the particle signal is a sixth-power of the particle size.
Larger particle sizing is based on an approximation to a Mie curve
appropriate for the scattering response of the instrument. The very largest
particles have a response curve based on the square of the particle
diameter. This is a complicated function which must be both calculated and
confirmed by test particle measurement during factory calibration. In the
event that you have a preferred curve (empirical or theoretical, with for
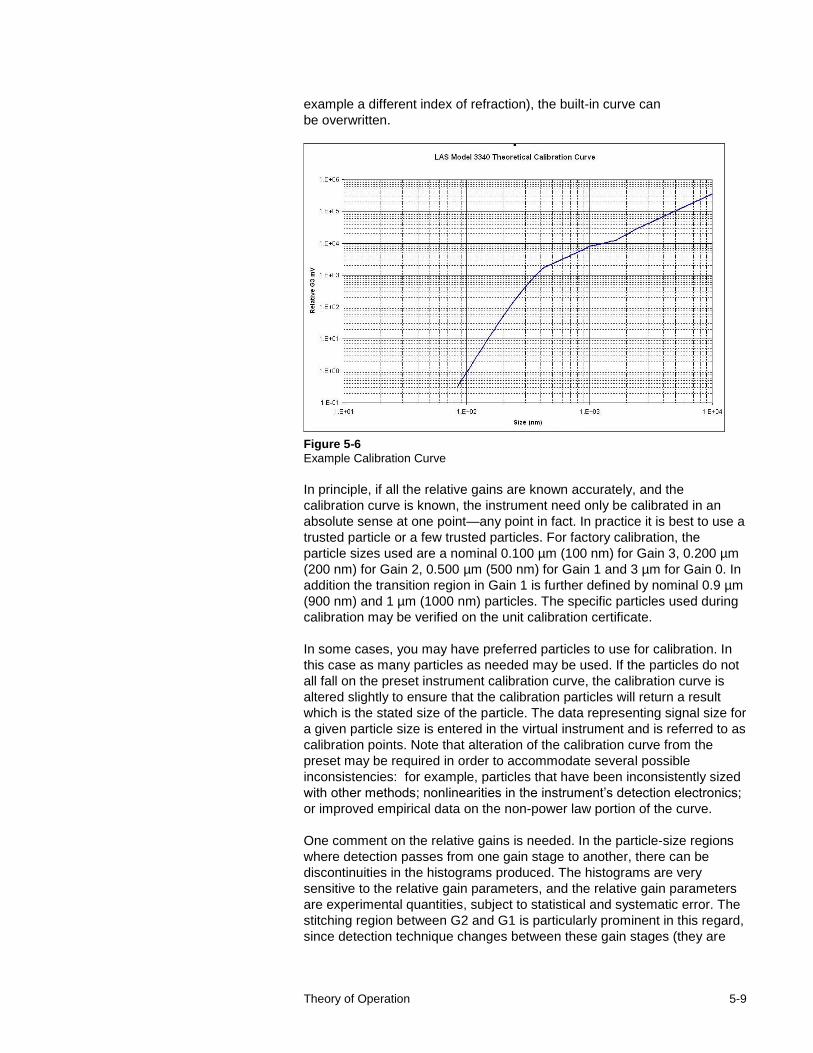
Theory of Operation 5-9
example a different index of refraction), the built-in curve can
be overwritten.
Figure 5-6
Example Calibration Curve
In principle, if all the relative gains are known accurately, and the
calibration curve is known, the instrument need only be calibrated in an
absolute sense at one point—any point in fact. In practice it is best to use a
trusted particle or a few trusted particles. For factory calibration, the
particle sizes used are a nominal 0.100 µm (100 nm) for Gain 3, 0.200 µm
(200 nm) for Gain 2, 0.500 µm (500 nm) for Gain 1 and 3 µm for Gain 0. In
addition the transition region in Gain 1 is further defined by nominal 0.9 µm
(900 nm) and 1 µm (1000 nm) particles. The specific particles used during
calibration may be verified on the unit calibration certificate.
In some cases, you may have preferred particles to use for calibration. In
this case as many particles as needed may be used. If the particles do not
all fall on the preset instrument calibration curve, the calibration curve is
altered slightly to ensure that the calibration particles will return a result
which is the stated size of the particle. The data representing signal size for
a given particle size is entered in the virtual instrument and is referred to as
calibration points. Note that alteration of the calibration curve from the
preset may be required in order to accommodate several possible
inconsistencies: for example, particles that have been inconsistently sized
with other methods; nonlinearities in the instrument’s detection electronics;
or improved empirical data on the non-power law portion of the curve.
One comment on the relative gains is needed. In the particle-size regions
where detection passes from one gain stage to another, there can be
discontinuities in the histograms produced. The histograms are very
sensitive to the relative gain parameters, and the relative gain parameters
are experimental quantities, subject to statistical and systematic error. The
stitching region between G2 and G1 is particularly prominent in this regard,
since detection technique changes between these gain stages (they are
5-10 Model 3340 Laser Aerosol Spectrometer
physically different photo-detectors). The relative stitching will never be
perfect and the ability to zoom in on these transition regions can
overemphasize the stitching errors. You can optimize the stitching
parameters to accommodate unusual requirements in this area; however,
the semi-auto-calibration provided should be adequate in most cases.
Whenever changes are made to the relative gain parameters, the
calibration curve or the calibration points, the new parameters will be used
in the generation of the next bin map as it is committed to the instrument.
P a r t i c l e C o i n c i d e n c e
Particle coincidence is typically defined as more than one particle in the
viewing volume of the particle counter creating a signal that causes the
counter to incorrectly classify the particles as a single, mis-sized particle.
Coincidence typically increases somewhat linearly with particle
concentration until the saturation limit is reached. Above this point
instrument operation is unpredictable. This, along with particle transit time
and processing time is factored into the 3000 particle/second count limit.
Coincidence may be reduced by reducing the instrument flow rate and/or
diluting the sample.
Note: Changing the lower limit of the bin map to exclude small particles
from the histogram does not affect the total number of particles the
instrument has to process and has no effect on coincidence. This is
also why the count limit flag may be displayed even though
relatively few particles are being counted in the histogram.

6-1
C H A P T E R 6 Maintenance
Most components of the Model 3340 Laser Aerosol Spectrometer are solid-
state and require little or no maintenance. This section provides information
about the maintenance procedures that are required.
The Model 3340 does not normally require maintenance beyond the
occasional optical cleaning. The optical system is designed to minimize
contamination and it is not unusual for units to operate for years without
any significant contamination. In addition, the unit is designed with
automatic gain control (AGC) which allows continued accurate particle
sizing with varying laser power.
That said, it is possible for contaminants to end up on the laser optics
which can reduce the laser power to a point where the unit will no longer
zero count or provide adequate resolution of particles. The best indicator of
this is to check the laser reference voltage on the controls tab. If the
reference has declined significantly from the calibration reference recorded
on the calibration label then the optics may be contaminated.
C l e a n i n g O p t i c s
Before starting this operation, read the following safety information and
become familiar with the warning and caution labels found on the
instrument.
Laser High Voltage Supply The laser in this instrument is powered by a high voltage
supply. There is a warning sticker on this power supply.
The supply is capable of producing peak voltages of 9 KV
with an average current of less than 1 milliamp and
continuous voltages of 1.9 KV at a current of 6 milliamps.
The anode wire from this supply is attached to the laser tube anode
connector. This part of the laser is covered. There is a sticker on the anode
cover denoting the danger here.
WARNING: Failure to observe these high voltage
labels can result in injury or death.
6-2 Model 3340 Laser Aerosol Spectrometer
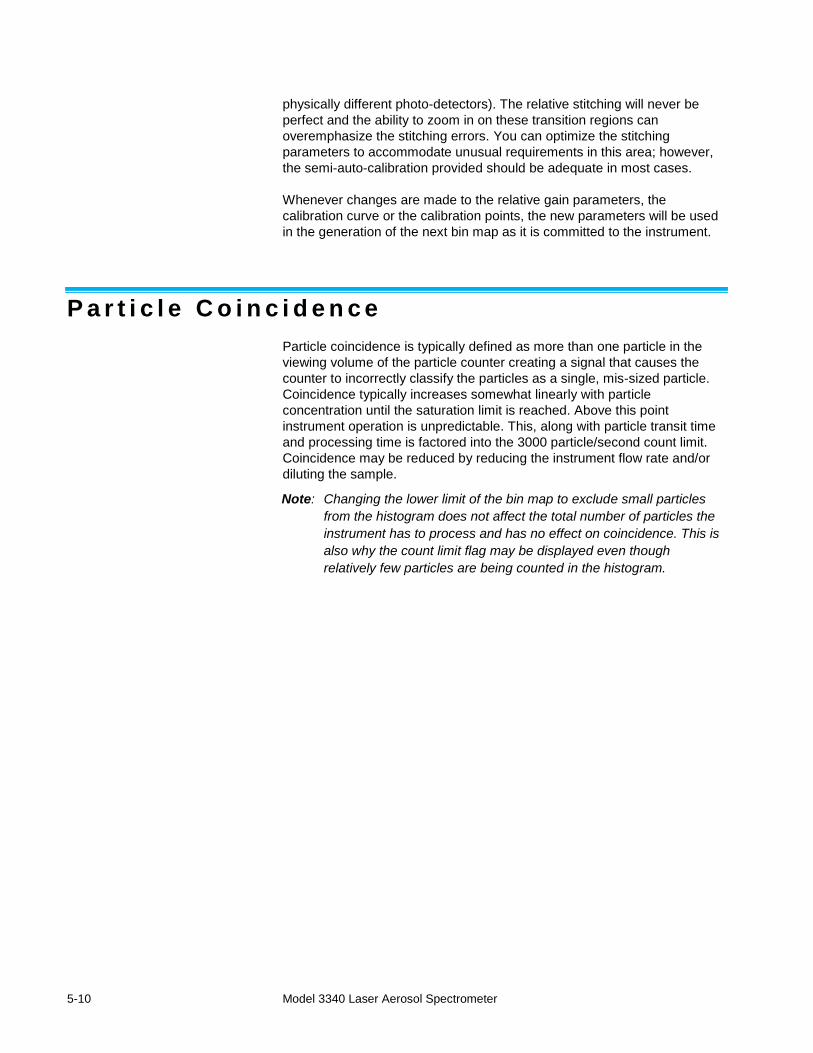
Laser Safety Information This instrument is a Class 1 laser product as defined by the National
Center for Device and Radiological Health (formerly BRH). It has an
internal cavity with no user-accessible transmitted output power. The
internal cavity develops high resonant energy that is inaccessible to you.
Warning labels are located near the cleaning ports.
WARNING: The performance of procedures other
than those specified in this manual may result in
exposure to light radiation that can cause
blindness.
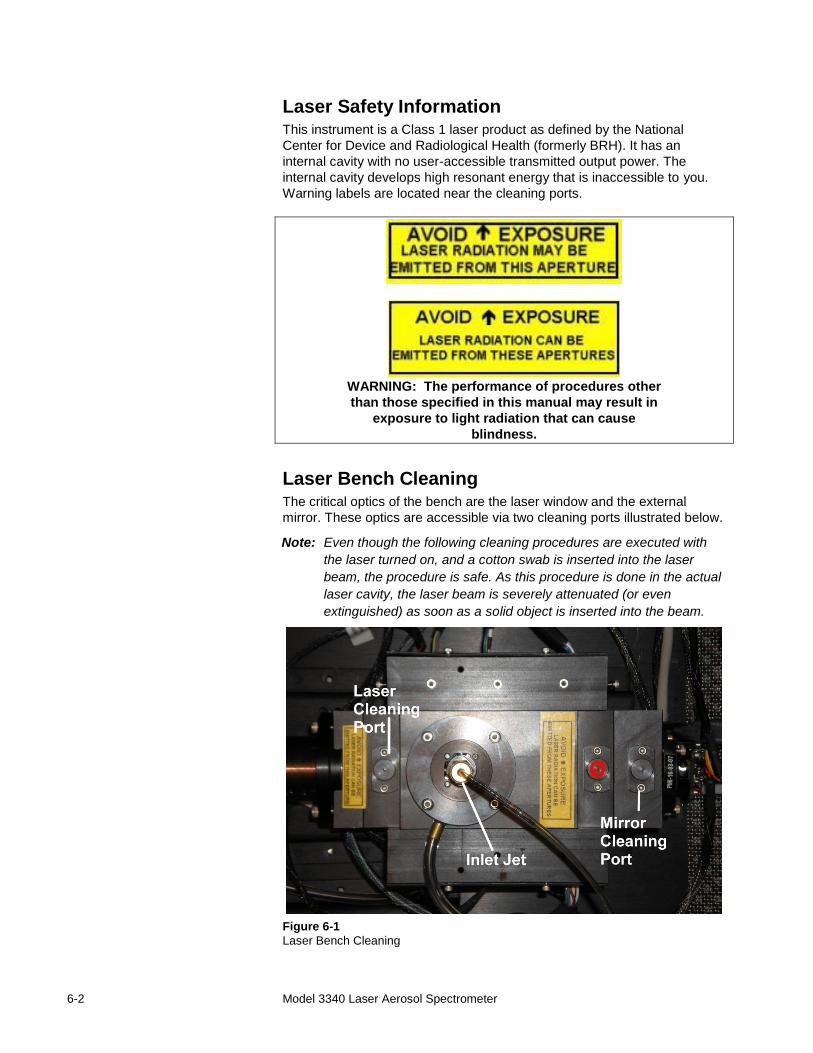
Laser Bench Cleaning The critical optics of the bench are the laser window and the external
mirror. These optics are accessible via two cleaning ports illustrated below.
Note: Even though the following cleaning procedures are executed with
the laser turned on, and a cotton swab is inserted into the laser
beam, the procedure is safe. As this procedure is done in the actual
laser cavity, the laser beam is severely attenuated (or even
extinguished) as soon as a solid object is inserted into the beam.
Figure 6-1
Laser Bench Cleaning
Maintenance 6-3
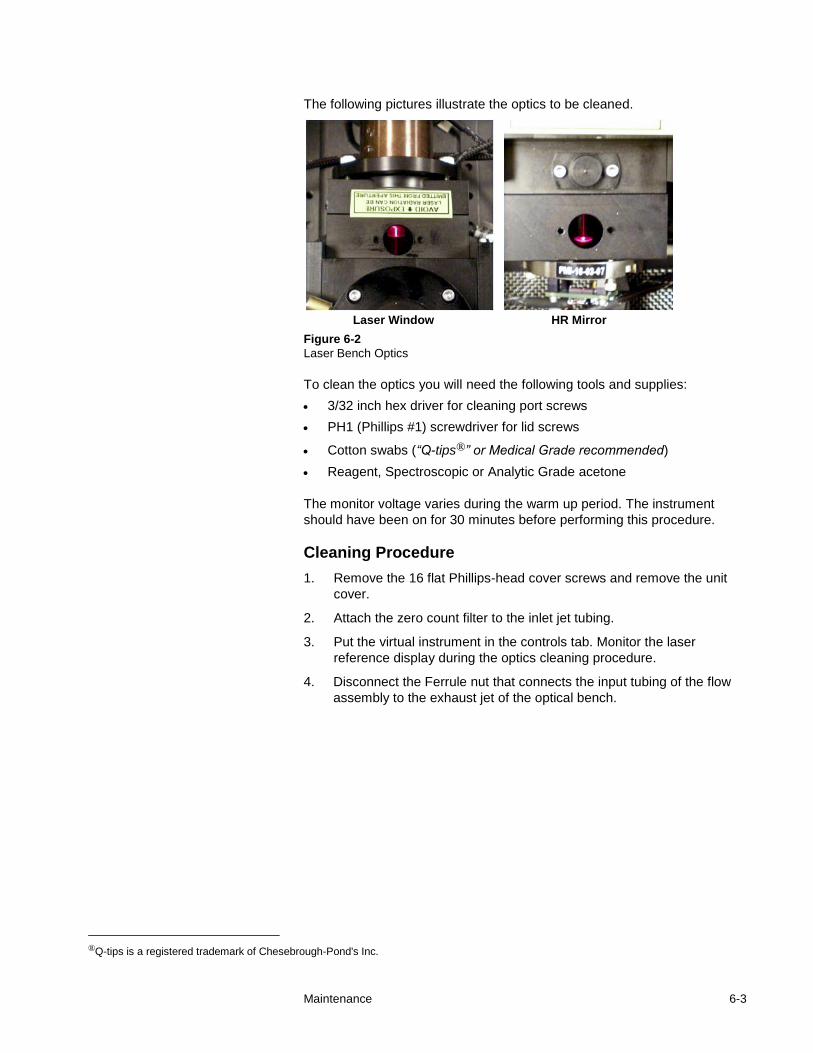
The following pictures illustrate the optics to be cleaned.
Laser Window HR Mirror
Figure 6-2
Laser Bench Optics
To clean the optics you will need the following tools and supplies:
3/32 inch hex driver for cleaning port screws
PH1 (Phillips #1) screwdriver for lid screws
Cotton swabs (“Q-tips®” or Medical Grade recommended)
Reagent, Spectroscopic or Analytic Grade acetone
The monitor voltage varies during the warm up period. The instrument
should have been on for 30 minutes before performing this procedure.
Cleaning Procedure
1. Remove the 16 flat Phillips-head cover screws and remove the unit
cover.
2. Attach the zero count filter to the inlet jet tubing.
3. Put the virtual instrument in the controls tab. Monitor the laser
reference display during the optics cleaning procedure.
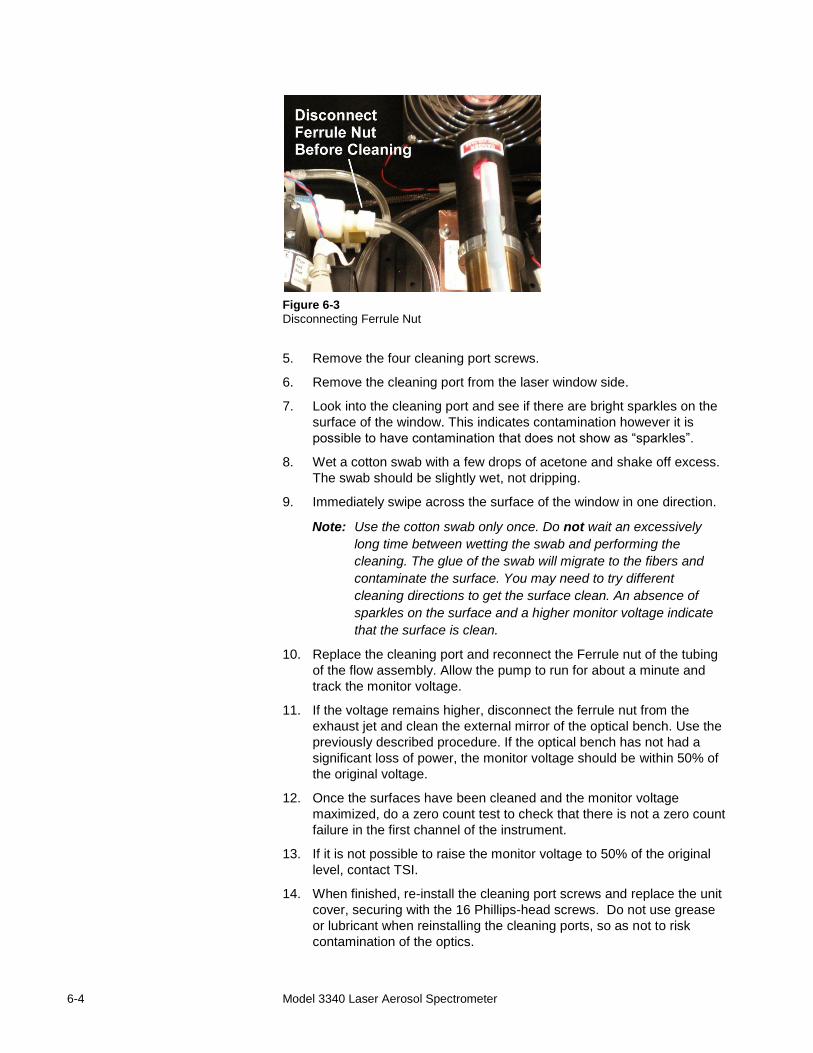
4. Disconnect the Ferrule nut that connects the input tubing of the flow
assembly to the exhaust jet of the optical bench.
®Q-tips is a registered trademark of Chesebrough-Pond's Inc.
6-4 Model 3340 Laser Aerosol Spectrometer
Figure 6-3
Disconnecting Ferrule Nut
5. Remove the four cleaning port screws.
6. Remove the cleaning port from the laser window side.
7. Look into the cleaning port and see if there are bright sparkles on the
surface of the window. This indicates contamination however it is
possible to have contamination that does not show as “sparkles”.
8. Wet a cotton swab with a few drops of acetone and shake off excess.
The swab should be slightly wet, not dripping.
9. Immediately swipe across the surface of the window in one direction.
Note: Use the cotton swab only once. Do not wait an excessively
long time between wetting the swab and performing the
cleaning. The glue of the swab will migrate to the fibers and
contaminate the surface. You may need to try different
cleaning directions to get the surface clean. An absence of
sparkles on the surface and a higher monitor voltage indicate
that the surface is clean.
10. Replace the cleaning port and reconnect the Ferrule nut of the tubing
of the flow assembly. Allow the pump to run for about a minute and
track the monitor voltage.
11. If the voltage remains higher, disconnect the ferrule nut from the
exhaust jet and clean the external mirror of the optical bench. Use the
previously described procedure. If the optical bench has not had a
significant loss of power, the monitor voltage should be within 50% of
the original voltage.
12. Once the surfaces have been cleaned and the monitor voltage
maximized, do a zero count test to check that there is not a zero count
failure in the first channel of the instrument.
13. If it is not possible to raise the monitor voltage to 50% of the original
level, contact TSI.
14. When finished, re-install the cleaning port screws and replace the unit
cover, securing with the 16 Phillips-head screws. Do not use grease
or lubricant when reinstalling the cleaning ports, so as not to risk
contamination of the optics.
Maintenance 6-5
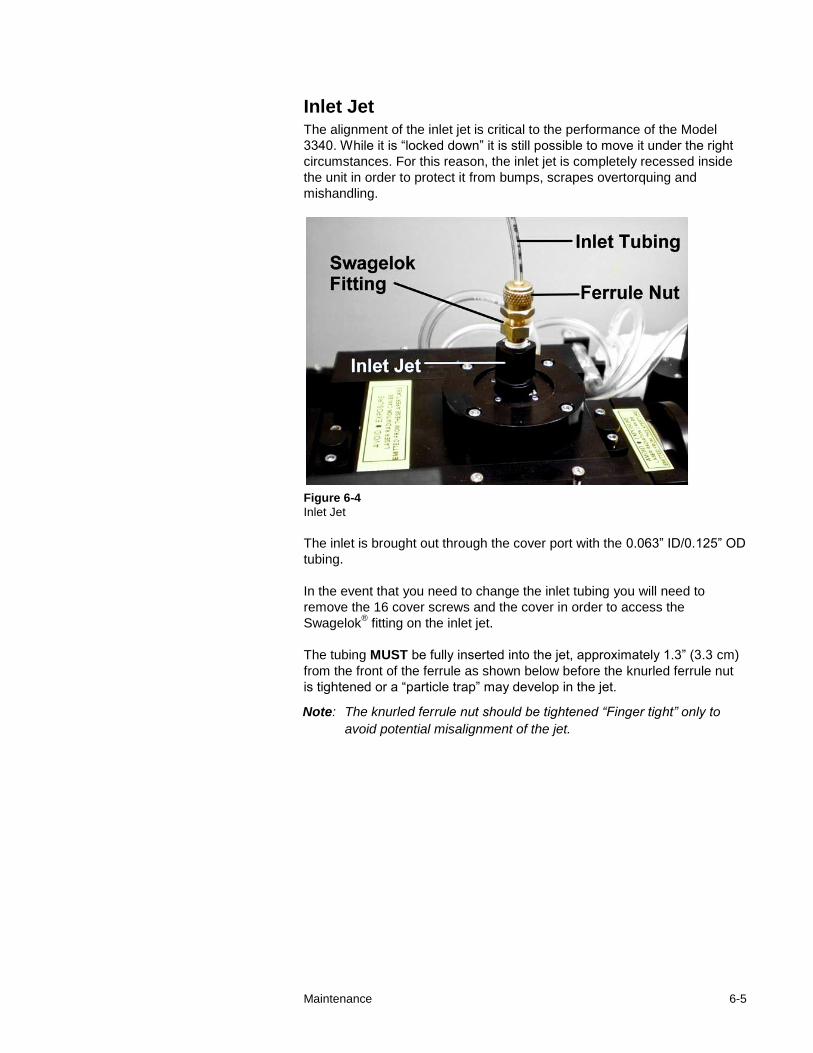
Inlet Jet The alignment of the inlet jet is critical to the performance of the Model
3340. While it is “locked down” it is still possible to move it under the right
circumstances. For this reason, the inlet jet is completely recessed inside
the unit in order to protect it from bumps, scrapes overtorquing and
mishandling.
Figure 6-4
Inlet Jet
The inlet is brought out through the cover port with the 0.063” ID/0.125” OD
tubing.
In the event that you need to change the inlet tubing you will need to
remove the 16 cover screws and the cover in order to access the
Swagelok® fitting on the inlet jet.
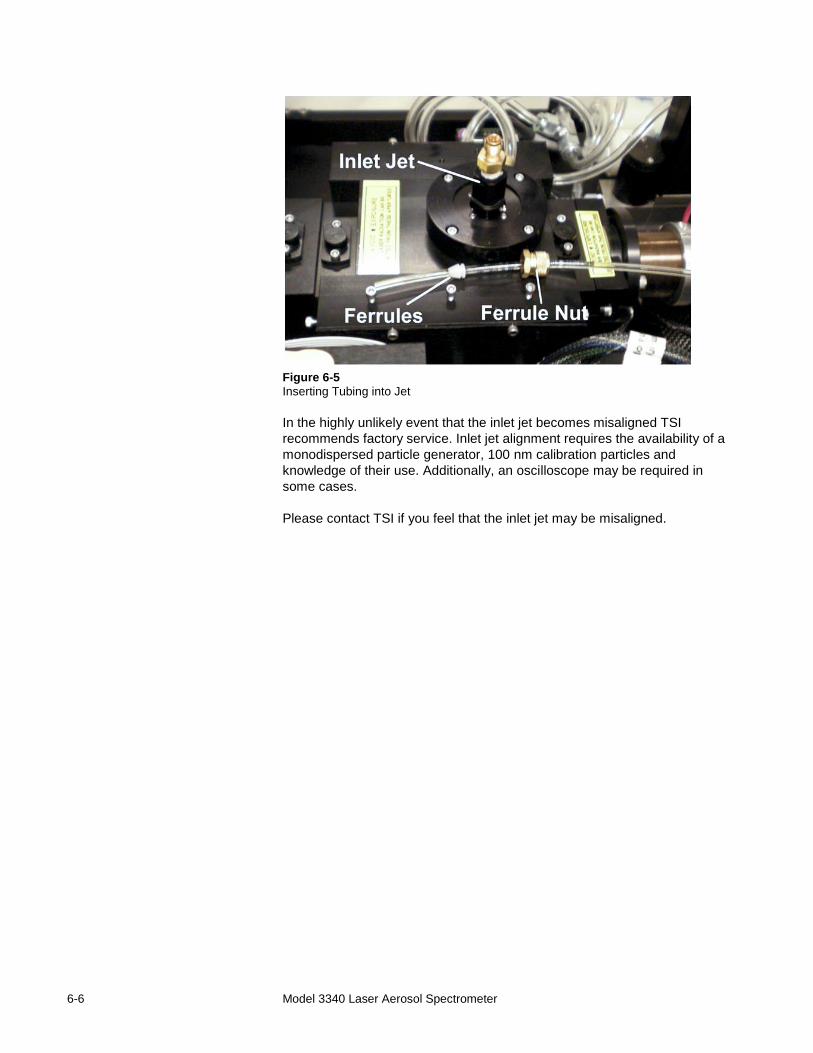
The tubing MUST be fully inserted into the jet, approximately 1.3” (3.3 cm)
from the front of the ferrule as shown below before the knurled ferrule nut
is tightened or a “particle trap” may develop in the jet.
Note: The knurled ferrule nut should be tightened “Finger tight” only to
avoid potential misalignment of the jet.
6-6 Model 3340 Laser Aerosol Spectrometer
Figure 6-5
Inserting Tubing into Jet
In the highly unlikely event that the inlet jet becomes misaligned TSI
recommends factory service. Inlet jet alignment requires the availability of a
monodispersed particle generator, 100 nm calibration particles and
knowledge of their use. Additionally, an oscilloscope may be required in
some cases.
Please contact TSI if you feel that the inlet jet may be misaligned.
7-1
C H A P T E R 7 Ca l ibrat ion
Calibrating the Model 3340 is a moderately complex procedure requiring
some specialized equipment and calibration materials. It is recommended
that the instrument be returned to the factory for calibration. However,
some users may wish to use different particle standards for the primary
calibration points (such as NIST vs. JSR or Duke) or add additional
calibration points beyond what are normally provided. For those users who
wish to perform calibrations with PSL particle size standards, the following
equipment is required:
Particle Generator capable of supplying filtered air to nebulize and dry
PSL (Polystyrene Latex) calibration particles suspended in DI water
PSL Calibration Particles (NIST, Duke, JSR, etc.)
Nebulizer(s)
Filtered Deionized water to dilute particle samples
Note: This discusses the basics of using the calibration mode in the
instrument. This does not necessarily produce an ISO calibration
unless ISO standards are followed.
7-2 Model 3340 Laser Aerosol Spectrometer
C a l i b r a t i o n M o d e C o n t r o l s
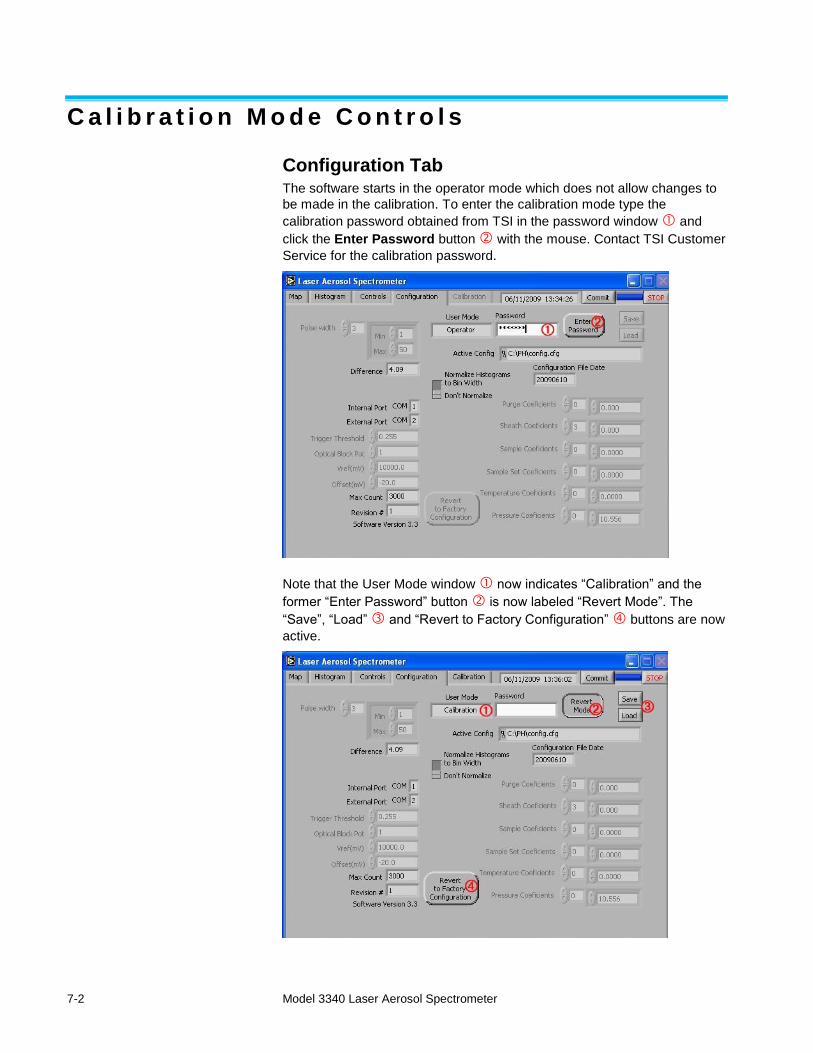
Configuration Tab The software starts in the operator mode which does not allow changes to
be made in the calibration. To enter the calibration mode type the
calibration password obtained from TSI in the password window and
click the Enter Password button with the mouse. Contact TSI Customer
Service for the calibration password.
Note that the User Mode window now indicates “Calibration” and the
former “Enter Password” button is now labeled “Revert Mode”. The
“Save”, “Load” and “Revert to Factory Configuration” buttons are now
active.
Calibration 7-3
Save Button
The “Save” button will be used when saving changes to the configuration. It
is highly recommended that this file be renamed rather than over-writing
the original configuration file. A typical unit is shipped with the configuration
file C:\PH\config.cfg as shown in the “Active Config” window above. TSI’s
suggestion is to rename the configuration file C:\PH\configmmddyy.cfg
where mmddyy is the month, day, and year the change was made. This
keeps a record of each configuration change and allows for recovery of a
previous configuration in the event an undesired change was inadvertently
saved.
Note: The “Save” dialog box may default to the directory in which data
was last saved. It is recommended that configuration files always be
recorded in the C:\PH directory. The virtual instrument creates a
pointer file called last.cfg which points to the saved configuration
file. The configuration file saves all major parameters (flow rate,
sample time, calibration points, etc.) used by the virtual instrument.
This file is updated any time a configuration is saved or loaded.
Load Button
The “Load” button is used to open an alternate configuration file. One use
for this is when a specific alternate calibration is desired for a specific test
without altering the normal calibration. An alternate configuration file can
be created and loaded for specific tests. When the tests are complete, the
original configuration can be loaded which will then be loaded when the
virtual instrument is started.
Revert to Factory Configuration Button
“Revert to Factory Configuration” is a way to recover if a configuration file
has become corrupted or was saved with parameters that cause the unit to
function incorrectly. A duplicate copy of the “as shipped” configuration file
named factory.cfg is loaded when this button is clicked. When using this
feature it is very important that you immediately change the filename from
factory.cfg by clicking on the Save button and entering a new file name.
Otherwise, the original settings in the C:\PH\factory.cfg file will be
overwritten and lost when saving subsequent changes.
7-4 Model 3340 Laser Aerosol Spectrometer
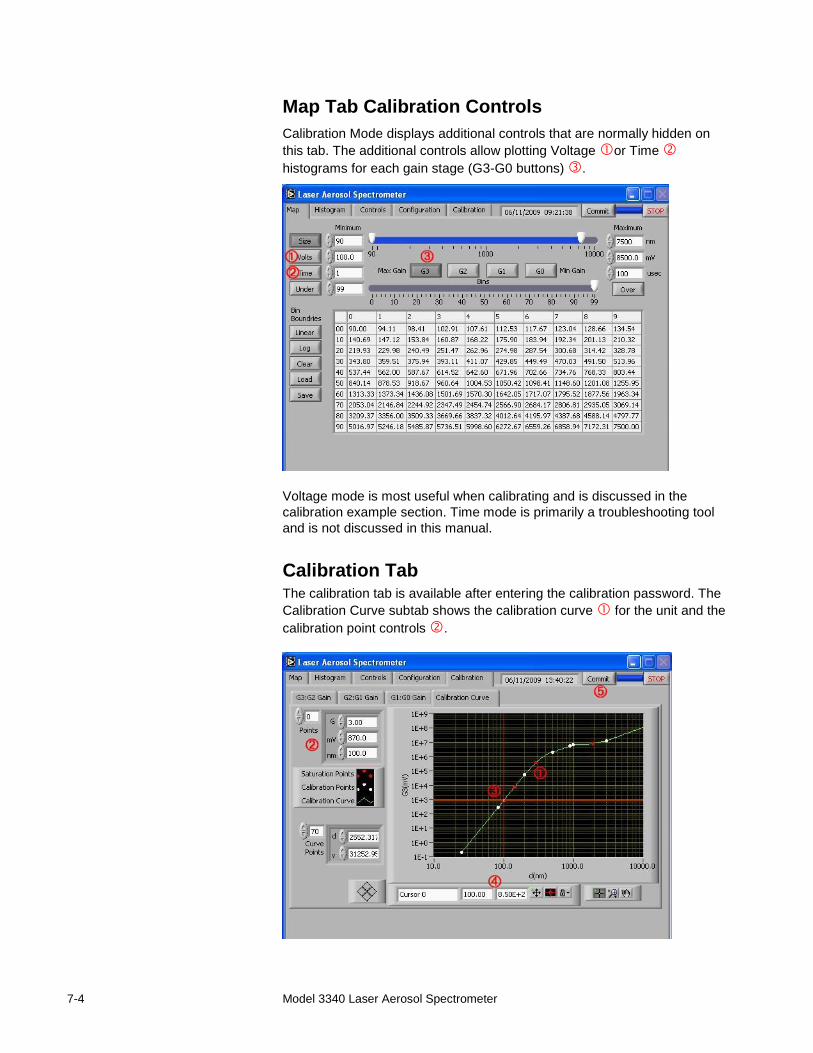
Map Tab Calibration Controls
Calibration Mode displays additional controls that are normally hidden on
this tab. The additional controls allow plotting Voltage or Time
histograms for each gain stage (G3-G0 buttons) .
Voltage mode is most useful when calibrating and is discussed in the
calibration example section. Time mode is primarily a troubleshooting tool
and is not discussed in this manual.
Calibration Tab The calibration tab is available after entering the calibration password. The
Calibration Curve subtab shows the calibration curve for the unit and the
calibration point controls .
Calibration 7-5
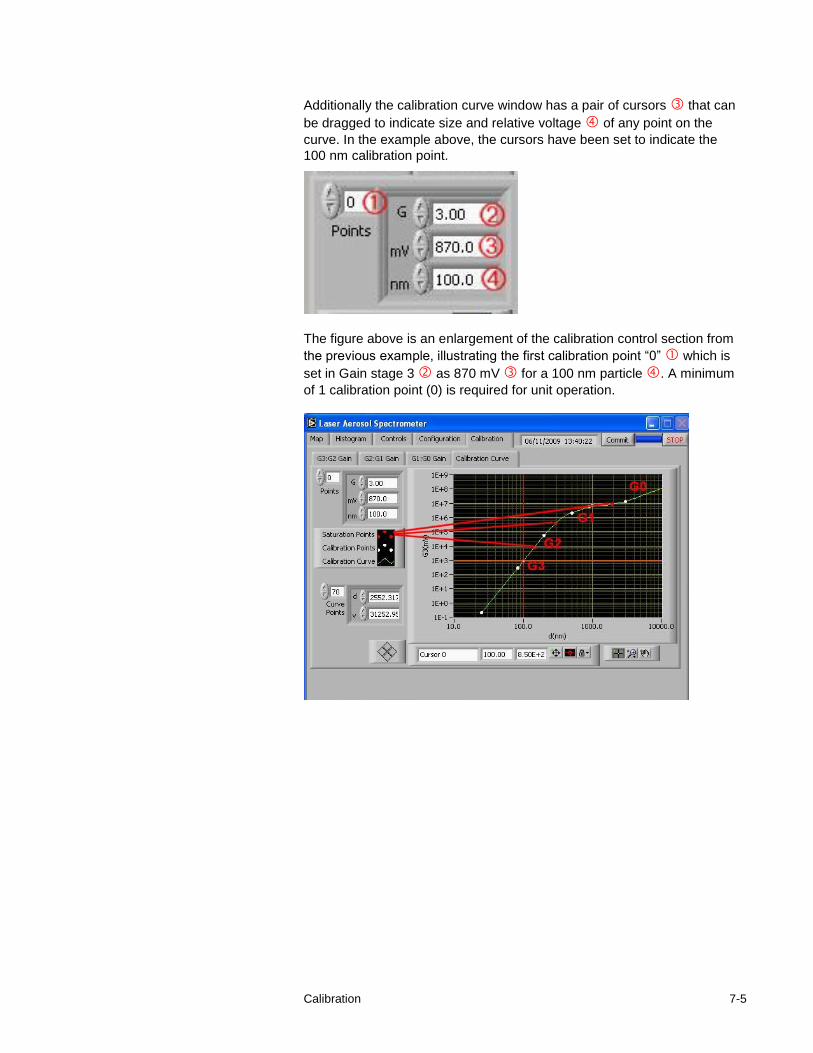
Additionally the calibration curve window has a pair of cursors that can
be dragged to indicate size and relative voltage of any point on the
curve. In the example above, the cursors have been set to indicate the
100 nm calibration point.
The figure above is an enlargement of the calibration control section from
the previous example, illustrating the first calibration point “0” which is
set in Gain stage 3 as 870 mV for a 100 nm particle . A minimum
of 1 calibration point (0) is required for unit operation.
7-6 Model 3340 Laser Aerosol Spectrometer
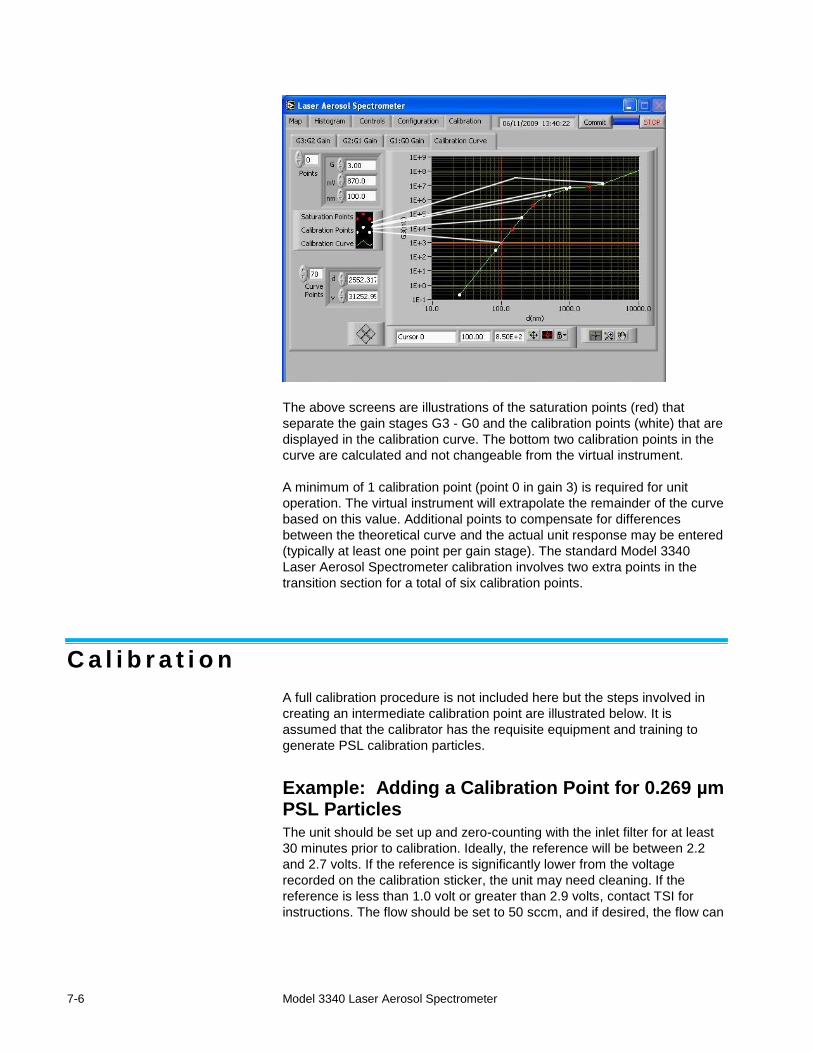
The above screens are illustrations of the saturation points (red) that
separate the gain stages G3 - G0 and the calibration points (white) that are
displayed in the calibration curve. The bottom two calibration points in the
curve are calculated and not changeable from the virtual instrument.
A minimum of 1 calibration point (point 0 in gain 3) is required for unit
operation. The virtual instrument will extrapolate the remainder of the curve
based on this value. Additional points to compensate for differences
between the theoretical curve and the actual unit response may be entered
(typically at least one point per gain stage). The standard Model 3340
Laser Aerosol Spectrometer calibration involves two extra points in the
transition section for a total of six calibration points.
C a l i b r a t i o n
A full calibration procedure is not included here but the steps involved in
creating an intermediate calibration point are illustrated below. It is
assumed that the calibrator has the requisite equipment and training to
generate PSL calibration particles.
Example: Adding a Calibration Point for 0.269 µm PSL Particles The unit should be set up and zero-counting with the inlet filter for at least
30 minutes prior to calibration. Ideally, the reference will be between 2.2
and 2.7 volts. If the reference is significantly lower from the voltage
recorded on the calibration sticker, the unit may need cleaning. If the
reference is less than 1.0 volt or greater than 2.9 volts, contact TSI for
instructions. The flow should be set to 50 sccm, and if desired, the flow can
Calibration 7-7
be verified with a reference standard such as a Sensidyne Gilibrator®,
compensating for local atmospheric pressure and temperature.
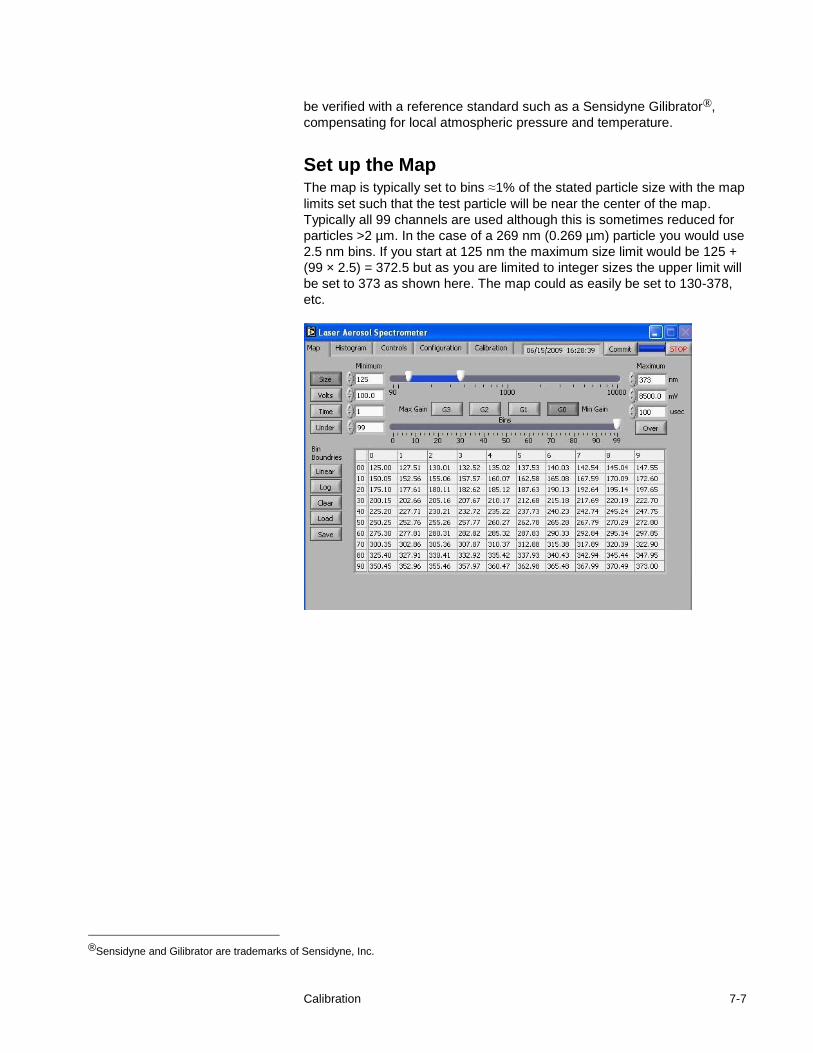
Set up the Map The map is typically set to bins ≈1% of the stated particle size with the map
limits set such that the test particle will be near the center of the map.
Typically all 99 channels are used although this is sometimes reduced for
particles >2 µm. In the case of a 269 nm (0.269 µm) particle you would use
2.5 nm bins. If you start at 125 nm the maximum size limit would be 125 +
(99 × 2.5) = 372.5 but as you are limited to integer sizes the upper limit will
be set to 373 as shown here. The map could as easily be set to 130-378,
etc.
®Sensidyne and Gilibrator are trademarks of Sensidyne, Inc.
7-8 Model 3340 Laser Aerosol Spectrometer
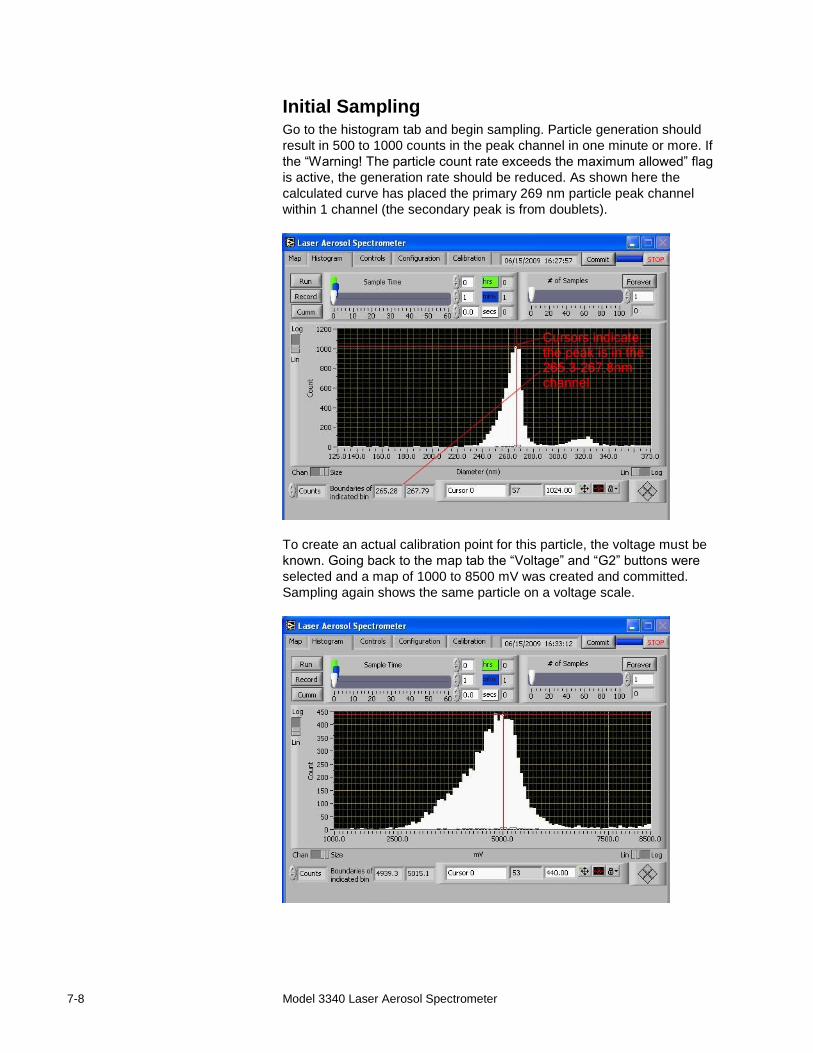
Initial Sampling Go to the histogram tab and begin sampling. Particle generation should
result in 500 to 1000 counts in the peak channel in one minute or more. If
the “Warning! The particle count rate exceeds the maximum allowed” flag
is active, the generation rate should be reduced. As shown here the
calculated curve has placed the primary 269 nm particle peak channel
within 1 channel (the secondary peak is from doublets).
To create an actual calibration point for this particle, the voltage must be
known. Going back to the map tab the “Voltage” and “G2” buttons were
selected and a map of 1000 to 8500 mV was created and committed.
Sampling again shows the same particle on a voltage scale.
Calibration 7-9
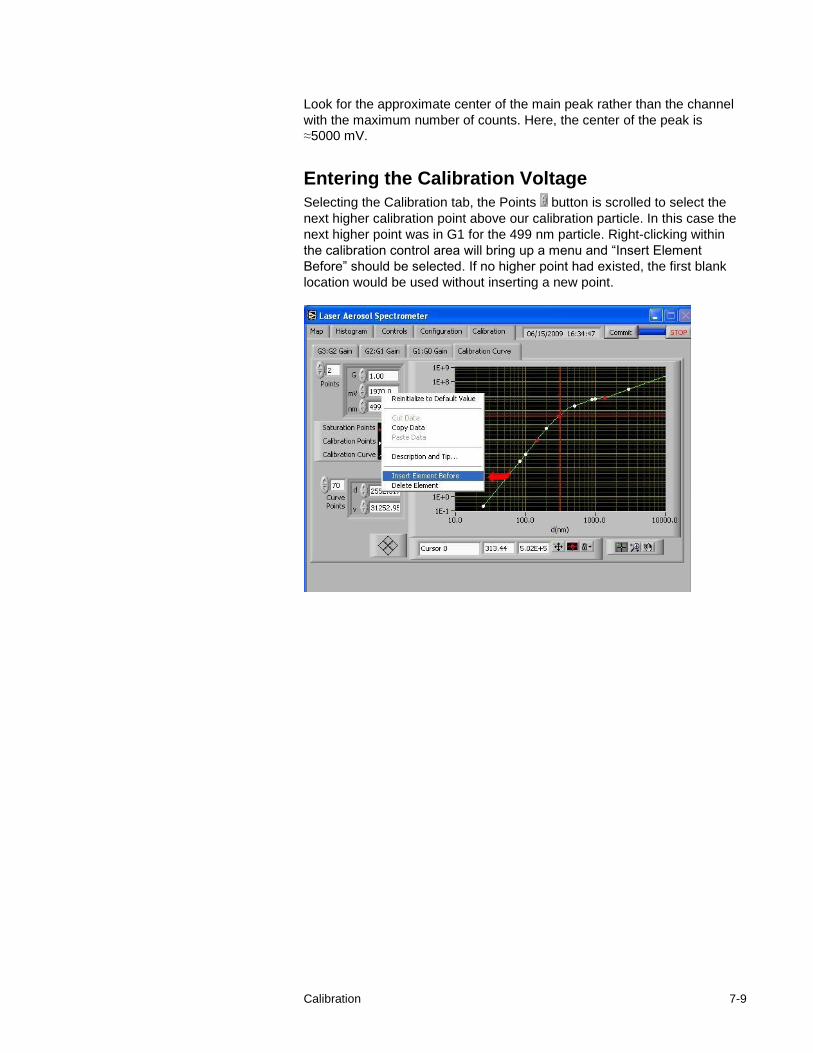
Look for the approximate center of the main peak rather than the channel
with the maximum number of counts. Here, the center of the peak is
≈5000 mV.
Entering the Calibration Voltage
Selecting the Calibration tab, the Points button is scrolled to select the
next higher calibration point above our calibration particle. In this case the
next higher point was in G1 for the 499 nm particle. Right-clicking within
the calibration control area will bring up a menu and “Insert Element
Before” should be selected. If no higher point had existed, the first blank
location would be used without inserting a new point.
7-10 Model 3340 Laser Aerosol Spectrometer
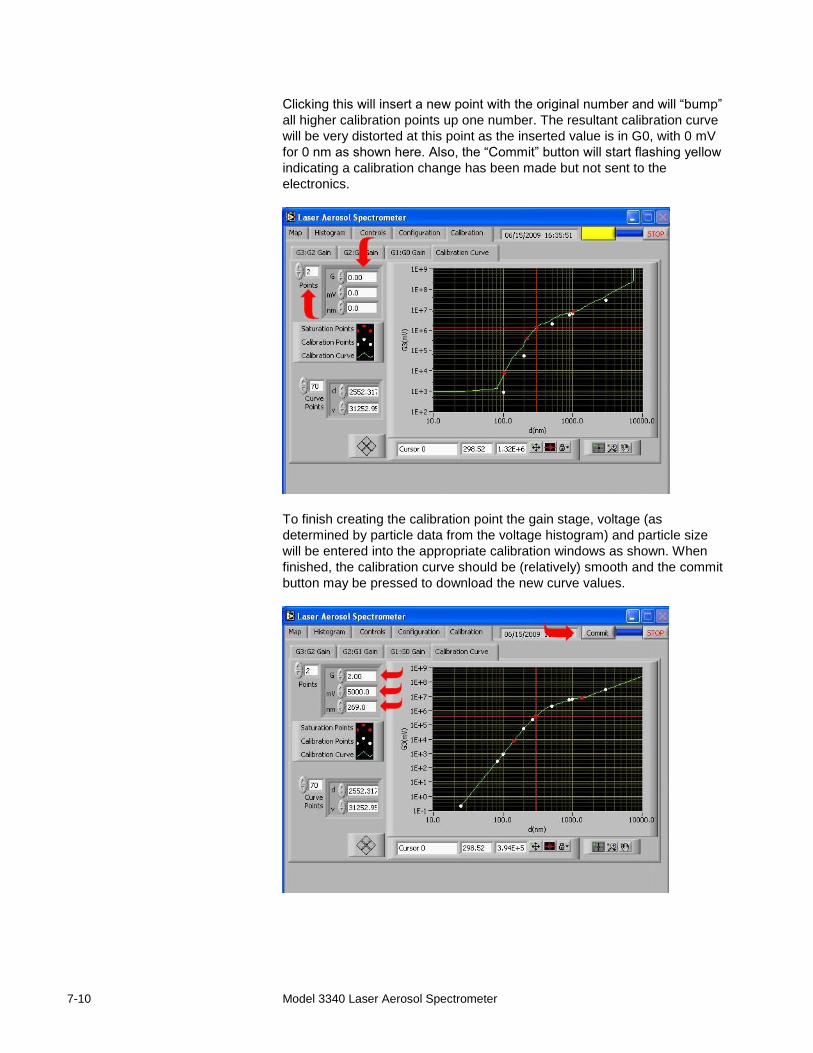
Clicking this will insert a new point with the original number and will “bump”
all higher calibration points up one number. The resultant calibration curve
will be very distorted at this point as the inserted value is in G0, with 0 mV
for 0 nm as shown here. Also, the “Commit” button will start flashing yellow
indicating a calibration change has been made but not sent to the
electronics.
To finish creating the calibration point the gain stage, voltage (as
determined by particle data from the voltage histogram) and particle size
will be entered into the appropriate calibration windows as shown. When
finished, the calibration curve should be (relatively) smooth and the commit
button may be pressed to download the new curve values.
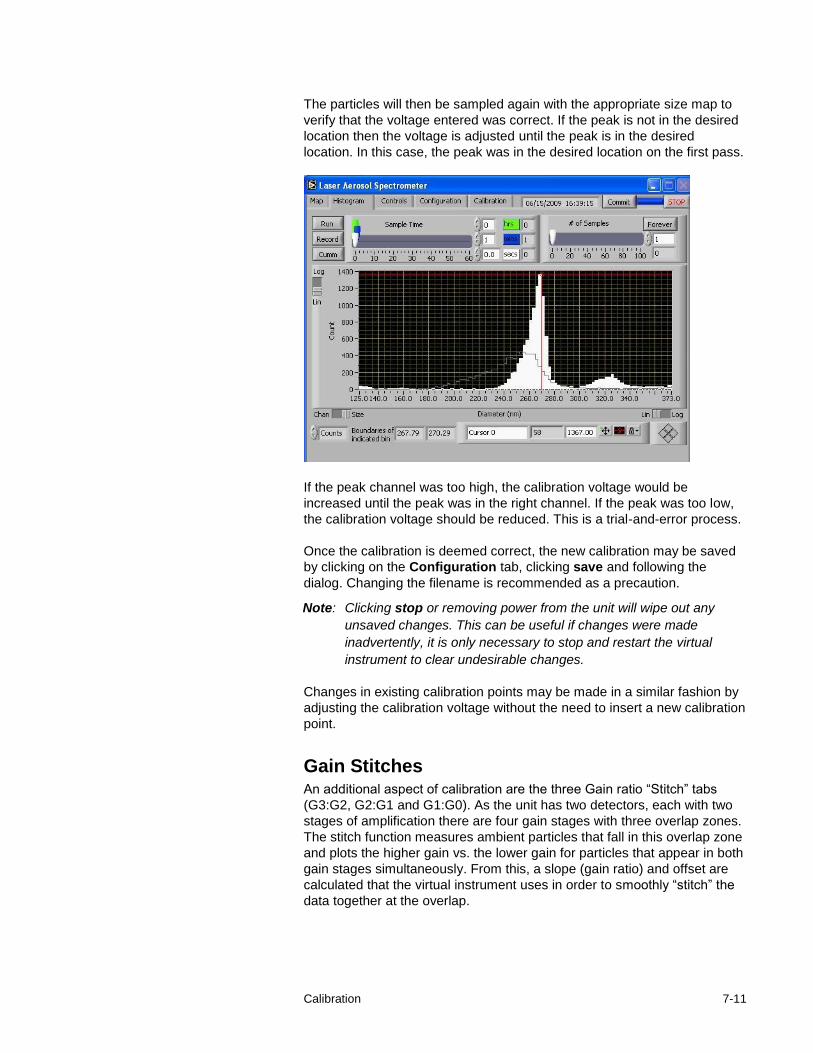
Calibration 7-11
The particles will then be sampled again with the appropriate size map to
verify that the voltage entered was correct. If the peak is not in the desired
location then the voltage is adjusted until the peak is in the desired
location. In this case, the peak was in the desired location on the first pass.
If the peak channel was too high, the calibration voltage would be
increased until the peak was in the right channel. If the peak was too low,
the calibration voltage should be reduced. This is a trial-and-error process.
Once the calibration is deemed correct, the new calibration may be saved
by clicking on the Configuration tab, clicking save and following the
dialog. Changing the filename is recommended as a precaution.
Note: Clicking stop or removing power from the unit will wipe out any
unsaved changes. This can be useful if changes were made
inadvertently, it is only necessary to stop and restart the virtual
instrument to clear undesirable changes.
Changes in existing calibration points may be made in a similar fashion by
adjusting the calibration voltage without the need to insert a new calibration
point.
Gain Stitches An additional aspect of calibration are the three Gain ratio “Stitch” tabs
(G3:G2, G2:G1 and G1:G0). As the unit has two detectors, each with two
stages of amplification there are four gain stages with three overlap zones.
The stitch function measures ambient particles that fall in this overlap zone
and plots the higher gain vs. the lower gain for particles that appear in both
gain stages simultaneously. From this, a slope (gain ratio) and offset are
calculated that the virtual instrument uses in order to smoothly “stitch” the
data together at the overlap.
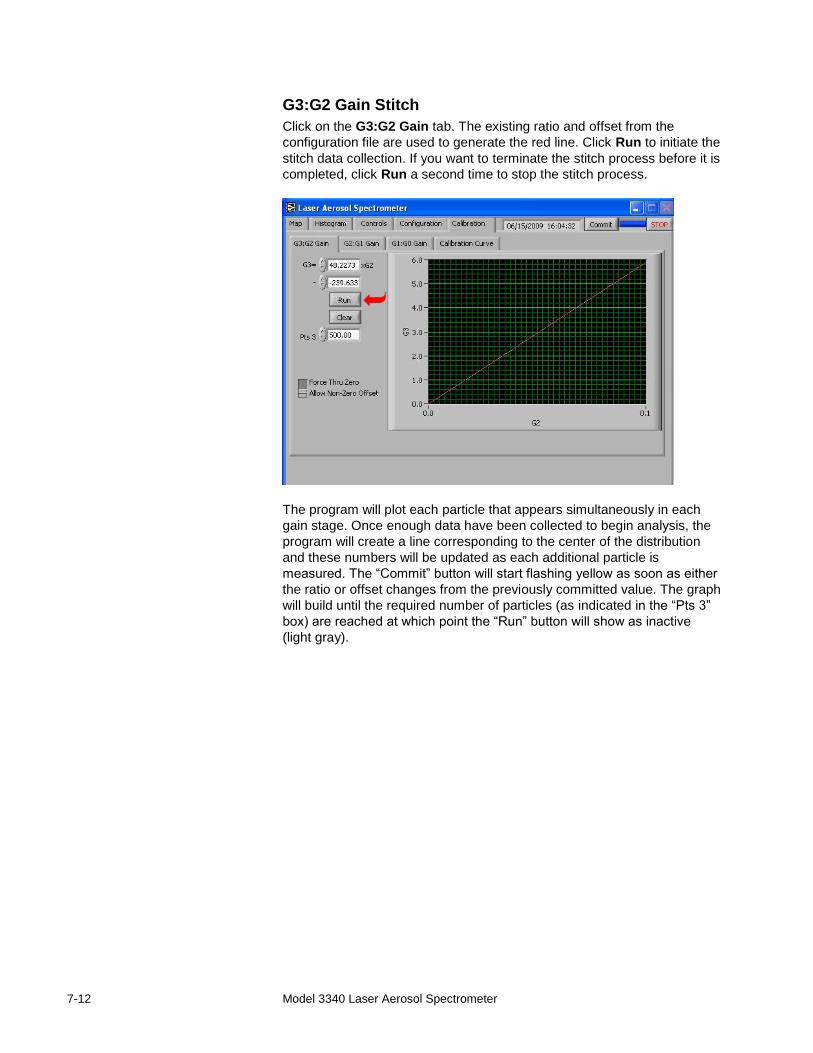
7-12 Model 3340 Laser Aerosol Spectrometer
G3:G2 Gain Stitch
Click on the G3:G2 Gain tab. The existing ratio and offset from the
configuration file are used to generate the red line. Click Run to initiate the
stitch data collection. If you want to terminate the stitch process before it is
completed, click Run a second time to stop the stitch process.
The program will plot each particle that appears simultaneously in each
gain stage. Once enough data have been collected to begin analysis, the
program will create a line corresponding to the center of the distribution
and these numbers will be updated as each additional particle is
measured. The “Commit” button will start flashing yellow as soon as either
the ratio or offset changes from the previously committed value. The graph
will build until the required number of particles (as indicated in the “Pts 3”
box) are reached at which point the “Run” button will show as inactive
(light gray).
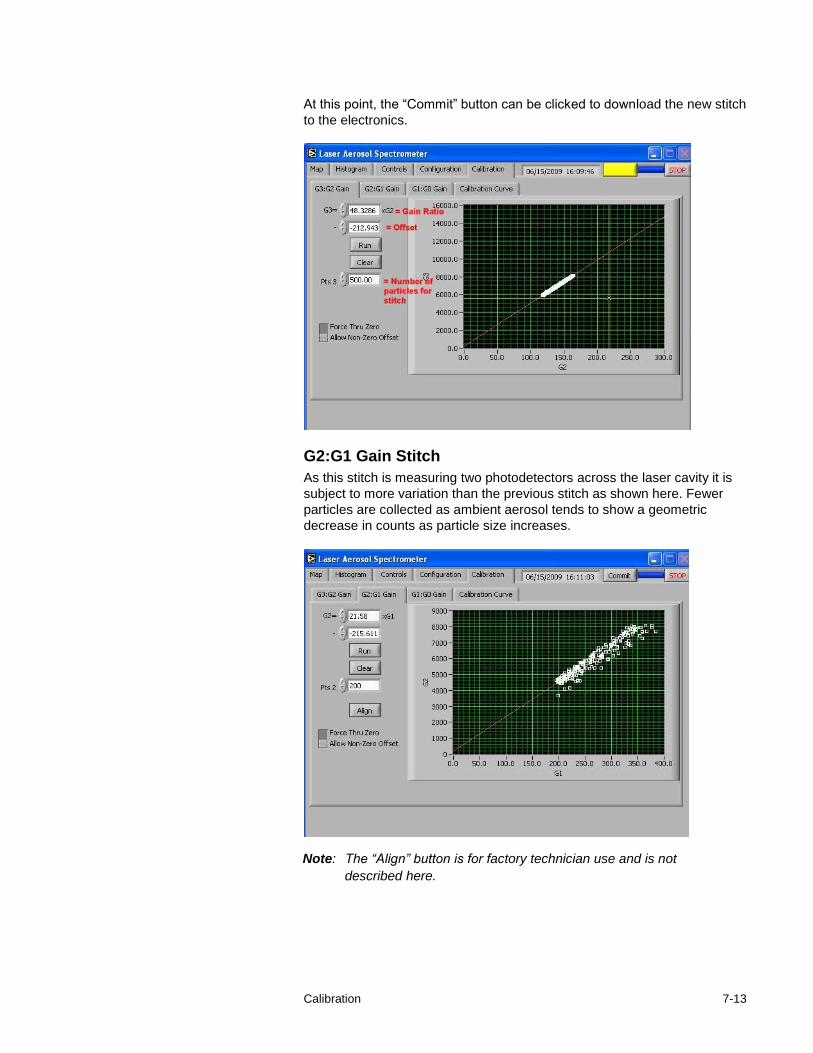
Calibration 7-13
At this point, the “Commit” button can be clicked to download the new stitch
to the electronics.
G2:G1 Gain Stitch
As this stitch is measuring two photodetectors across the laser cavity it is
subject to more variation than the previous stitch as shown here. Fewer
particles are collected as ambient aerosol tends to show a geometric
decrease in counts as particle size increases.
Note: The “Align” button is for factory technician use and is not
described here.
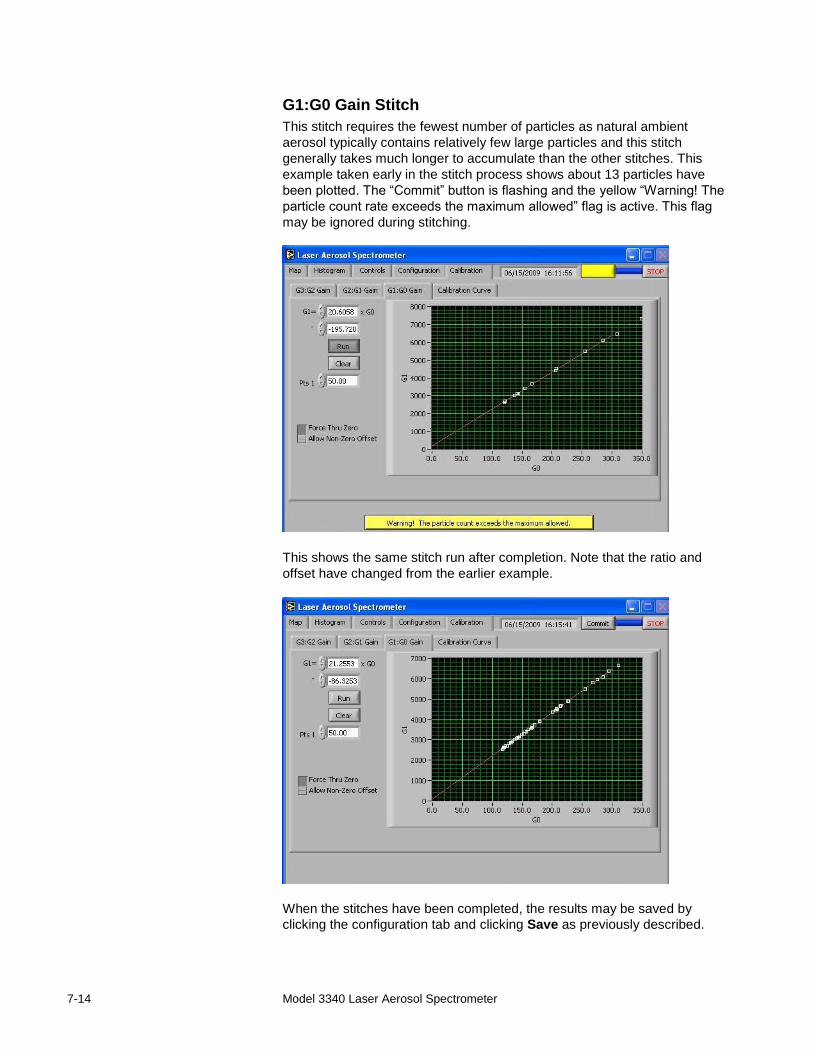
7-14 Model 3340 Laser Aerosol Spectrometer
G1:G0 Gain Stitch
This stitch requires the fewest number of particles as natural ambient
aerosol typically contains relatively few large particles and this stitch
generally takes much longer to accumulate than the other stitches. This
example taken early in the stitch process shows about 13 particles have
been plotted. The “Commit” button is flashing and the yellow “Warning! The
particle count rate exceeds the maximum allowed” flag is active. This flag
may be ignored during stitching.
This shows the same stitch run after completion. Note that the ratio and
offset have changed from the earlier example.
When the stitches have been completed, the results may be saved by
clicking the configuration tab and clicking Save as previously described.
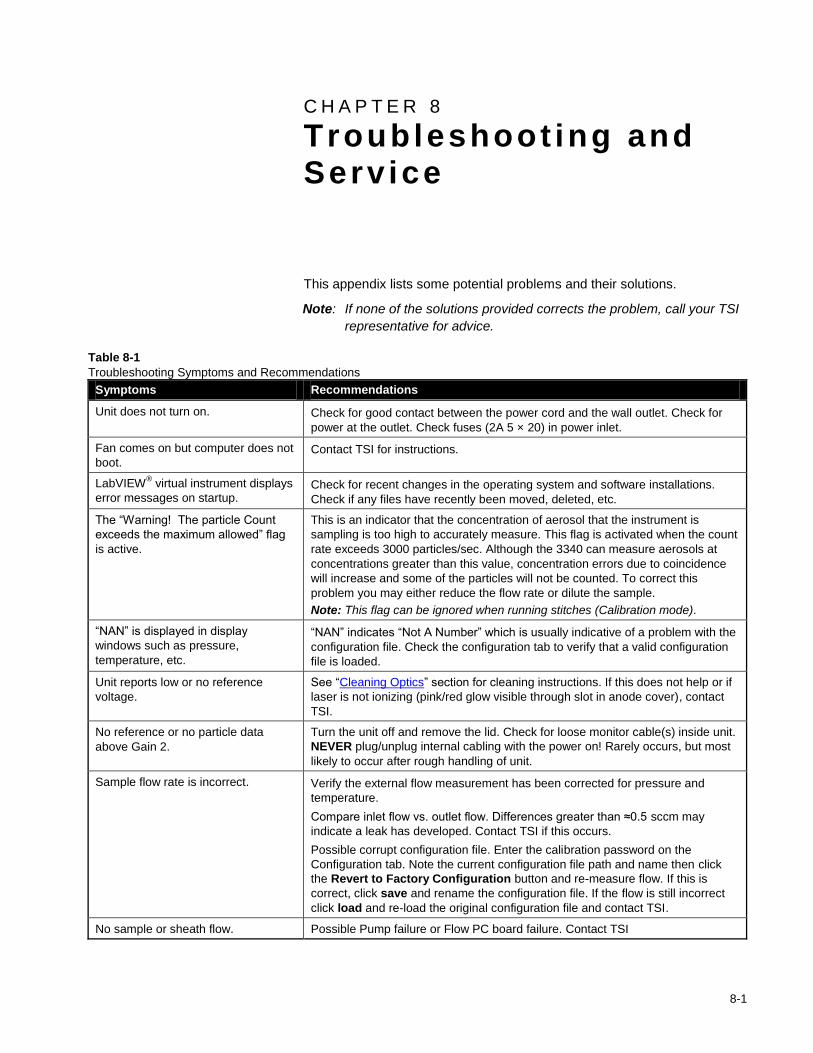
8-1
C H A P T E R 8 Troubleshoot ing and Serv ice
This appendix lists some potential problems and their solutions.
Note: If none of the solutions provided corrects the problem, call your TSI
representative for advice.
Table 8-1
Troubleshooting Symptoms and Recommendations
Symptoms Recommendations
Unit does not turn on. Check for good contact between the power cord and the wall outlet. Check for
power at the outlet. Check fuses (2A 5 × 20) in power inlet.
Fan comes on but computer does not
boot. Contact TSI for instructions.
LabVIEW® virtual instrument displays
error messages on startup. Check for recent changes in the operating system and software installations.
Check if any files have recently been moved, deleted, etc.
The “Warning! The particle Count
exceeds the maximum allowed” flag
is active.
This is an indicator that the concentration of aerosol that the instrument is
sampling is too high to accurately measure. This flag is activated when the count
rate exceeds 3000 particles/sec. Although the 3340 can measure aerosols at
concentrations greater than this value, concentration errors due to coincidence
will increase and some of the particles will not be counted. To correct this
problem you may either reduce the flow rate or dilute the sample.
Note: This flag can be ignored when running stitches (Calibration mode).
“NAN” is displayed in display
windows such as pressure,
temperature, etc.
“NAN” indicates “Not A Number” which is usually indicative of a problem with the
configuration file. Check the configuration tab to verify that a valid configuration
file is loaded.
Unit reports low or no reference
voltage.
See “Cleaning Optics” section for cleaning instructions. If this does not help or if
laser is not ionizing (pink/red glow visible through slot in anode cover), contact
TSI.
No reference or no particle data
above Gain 2.
Turn the unit off and remove the lid. Check for loose monitor cable(s) inside unit.
NEVER plug/unplug internal cabling with the power on! Rarely occurs, but most
likely to occur after rough handling of unit.
Sample flow rate is incorrect. Verify the external flow measurement has been corrected for pressure and
temperature.
Compare inlet flow vs. outlet flow. Differences greater than ≈0.5 sccm may
indicate a leak has developed. Contact TSI if this occurs.
Possible corrupt configuration file. Enter the calibration password on the
Configuration tab. Note the current configuration file path and name then click
the Revert to Factory Configuration button and re-measure flow. If this is
correct, click save and rename the configuration file. If the flow is still incorrect
click load and re-load the original configuration file and contact TSI.
No sample or sheath flow. Possible Pump failure or Flow PC board failure. Contact TSI
8-2 Model 3340 Laser Aerosol Spectrometer
T e c h n i c a l C o n t a c t s
If you have any difficulty installing the Laser Aerosol Spectrometer, or if
you have technical or application questions about this instrument,
contact an applications engineer at one of the locations listed below.
If the Laser Aerosol Spectrometer fails, or if you are returning it for
service, visit our website at http://service.tsi.com or contact TSI at:
TSI Incorporated
500 Cardigan Road
Shoreview, MN 55126 USA
Phone: +1-800-874-2811 (USA) or +1 (651) 490-2811
E-mail: [email protected]
TSI GmbH Neuköllner Strasse 4 52068 Aachen GERMANY
Telephone: +49 241-52303-0 Fax: +49 241-52303-49 E-mail: [email protected] Web: www.tsiinc.de
TSI Instruments Ltd. Stirling Road Cressex Business Park High Wycombe, Bucks HP12 3ST UNITED KINGDOM
Telephone: +44 (0) 149 4 459200 Fax: +44 (0) 149 4 459700 E-mail: [email protected] Web: www.tsiinc.co.uk
Troubleshooting and Service 8-3
R e t u r n i n g t h e L a s e r A e r o s o l S p e c t r o m e t e r f o r S e r v i c e
Before returning the Laser Aerosol Spectrometer to TSI for service, visit
our website at http://service.tsi.com or call TSI at 1-800-874-2811 (USA) or
(651) 490-2811 for specific return instructions. Customer Service will need
this information when you call:
The instrument model number
The instrument serial number
A purchase order number (unless under warranty)
A billing address
A shipping address.
TSI recommends that you keep the original packaging (carton and foam
inserts) of the Laser Aerosol Spectrometer for use whenever the Laser
Aerosol Spectrometer is shipped, including when it is returned to TSI
for service.

8-4 Model 3340 Laser Aerosol Spectrometer
(This page intentionally left blank)
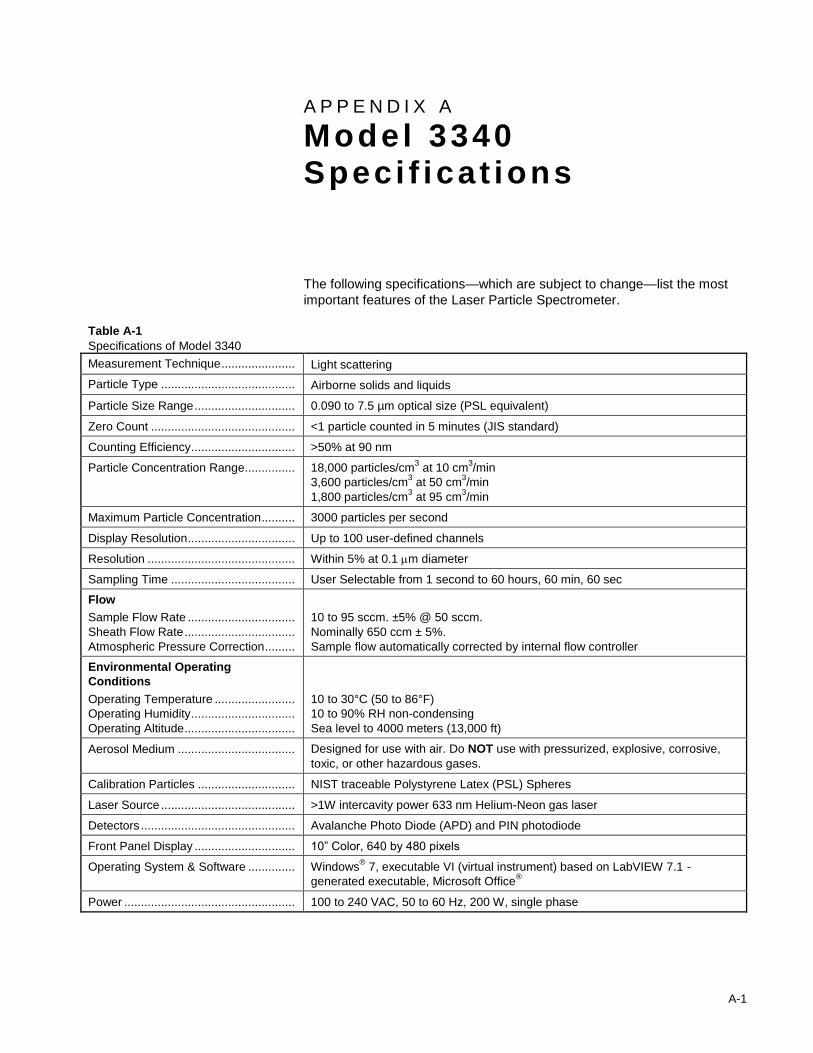
A-1
A P P E N D I X A
Model 3340 Speci f icat ions
The following specifications—which are subject to change—list the most
important features of the Laser Particle Spectrometer.
Table A-1
Specifications of Model 3340
Measurement Technique ...................... Light scattering
Particle Type ........................................ Airborne solids and liquids
Particle Size Range .............................. 0.090 to 7.5 µm optical size (PSL equivalent)
Zero Count ........................................... <1 particle counted in 5 minutes (JIS standard)
Counting Efficiency ............................... >50% at 90 nm
Particle Concentration Range ............... 18,000 particles/cm3 at 10 cm
3/min
3,600 particles/cm3 at 50 cm
3/min
1,800 particles/cm3 at 95 cm
3/min
Maximum Particle Concentration .......... 3000 particles per second
Display Resolution ................................ Up to 100 user-defined channels
Resolution ............................................ Within 5% at 0.1 m diameter
Sampling Time ..................................... User Selectable from 1 second to 60 hours, 60 min, 60 sec
Flow
Sample Flow Rate ................................
Sheath Flow Rate .................................
Atmospheric Pressure Correction .........
10 to 95 sccm. ±5% @ 50 sccm.
Nominally 650 ccm ± 5%.
Sample flow automatically corrected by internal flow controller
Environmental Operating
Conditions
Operating Temperature ........................
Operating Humidity ...............................
Operating Altitude .................................
10 to 30°C (50 to 86°F)
10 to 90% RH non-condensing
Sea level to 4000 meters (13,000 ft)
Aerosol Medium ................................... Designed for use with air. Do NOT use with pressurized, explosive, corrosive,
toxic, or other hazardous gases.
Calibration Particles ............................. NIST traceable Polystyrene Latex (PSL) Spheres
Laser Source ........................................ >1W intercavity power 633 nm Helium-Neon gas laser
Detectors .............................................. Avalanche Photo Diode (APD) and PIN photodiode
Front Panel Display .............................. 10” Color, 640 by 480 pixels
Operating System & Software .............. Windows® 7, executable VI (virtual instrument) based on LabVIEW 7.1 -
generated executable, Microsoft Office®
Power ................................................... 100 to 240 VAC, 50 to 60 Hz, 200 W, single phase
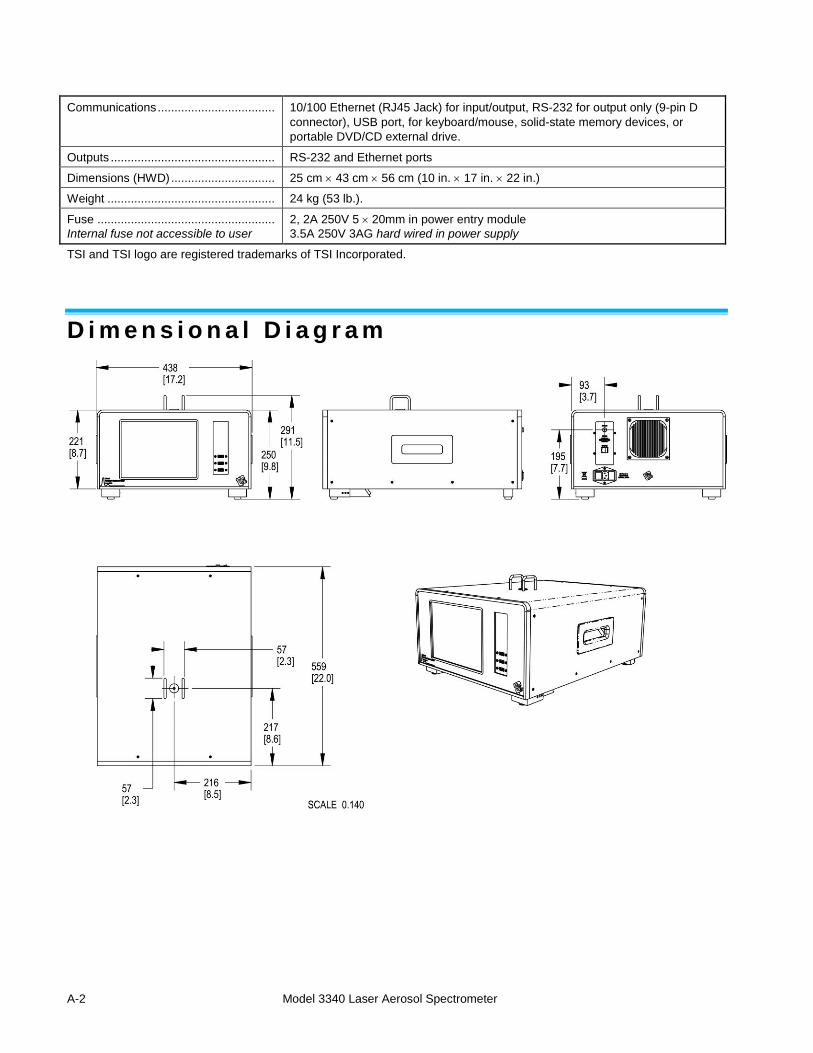
A-2 Model 3340 Laser Aerosol Spectrometer
Communications ................................... 10/100 Ethernet (RJ45 Jack) for input/output, RS-232 for output only (9-pin D
connector), USB port, for keyboard/mouse, solid-state memory devices, or
portable DVD/CD external drive.
Outputs ................................................. RS-232 and Ethernet ports
Dimensions (HWD) ............................... 25 cm 43 cm 56 cm (10 in. 17 in. 22 in.)
Weight .................................................. 24 kg (53 lb.).
Fuse .....................................................
Internal fuse not accessible to user
2, 2A 250V 5 20mm in power entry module
3.5A 250V 3AG hard wired in power supply
TSI and TSI logo are registered trademarks of TSI Incorporated.
D i m e n s i o n a l D i a g r a m
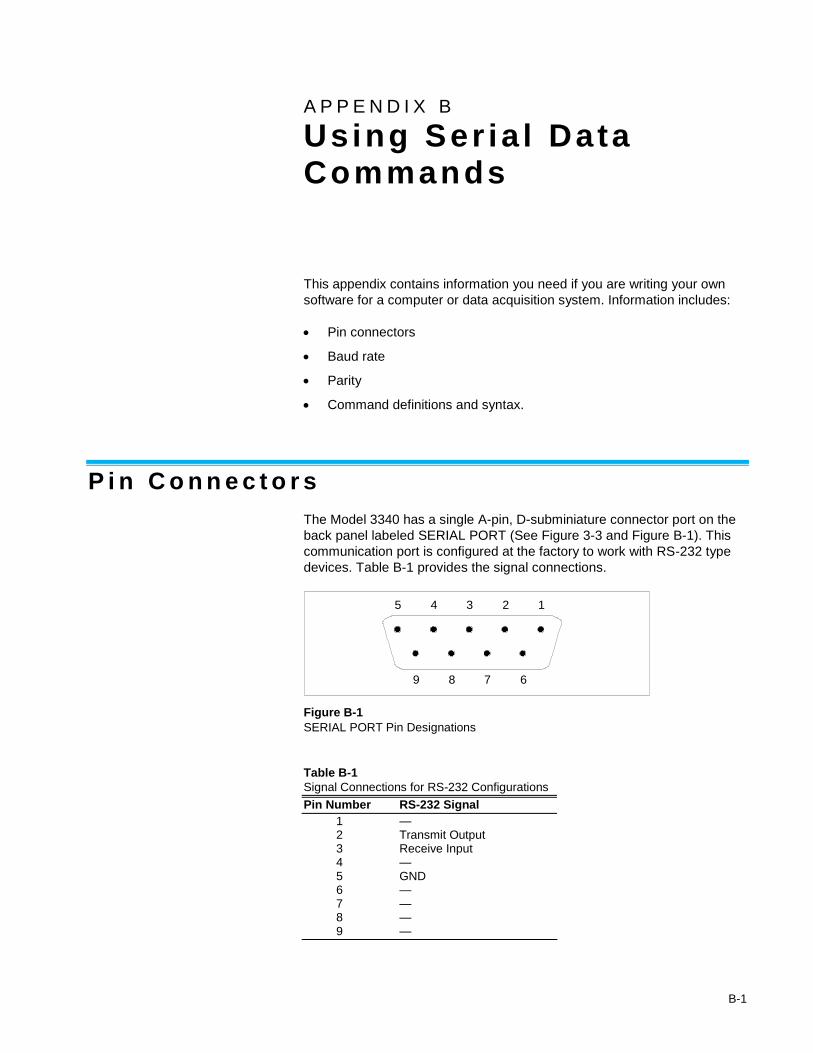
B-1
A P P E N D I X B Us ing Ser ia l Data Commands
This appendix contains information you need if you are writing your own
software for a computer or data acquisition system. Information includes:
Pin connectors
Baud rate
Parity
Command definitions and syntax.
P i n C o n n e c t o r s
The Model 3340 has a single A-pin, D-subminiature connector port on the
back panel labeled SERIAL PORT (See Figure 3-3 and Figure B-1). This
communication port is configured at the factory to work with RS-232 type
devices. Table B-1 provides the signal connections.
Figure B-1
SERIAL PORT Pin Designations
Table B-1
Signal Connections for RS-232 Configurations
Pin Number RS-232 Signal
1 — 2 Transmit Output 3 Receive Input 4 — 5 GND 6 — 7 — 8 — 9 —
5 4 3 2 1
9 8 7 6
B-2 Model 3340 Laser Aerosol Spectrometer
B a u d R a t e
The baud-rate setting is the rate of communication in terms of bits per
second (baud). The Model 3340 uses a baud rate setting of 115,200. For
proper communications, make sure that all software used with the
instrument is set at the appropriate rate.
F o r m a t ( 8 - B i t s , N o P a r i t y )
The Model 3340 RS-232 data output format uses eight data bits with no
parity as the only setting.
S t o p B i t s a n d F l o w C o n t r o l
The Model 3340 uses a Stop bits setting of 1 and a Flow Control Setting
of None.
B i - d i r e c t i o n a l S e r i a l C o m m a n d P r o t o c o l
The Bi-directional Serial Command protocol is designed to allow limited
remote control operation of the spectrometer via the RS-232 port. It allows
you to start a single sample of a user-defined length, verify the status of the
sample, get the sample distribution including sample time, flows, reference,
etc., stop sampling, and verify the map that is in use from a separate
control computer.
Note: This does not allow remote control of map settings, flow rate, or
configuration/calibration settings. This is primarily useful for
automated test setups where the control computer may also be
controlling flow, temperature, etc., and processing the data.
A standard M-F RS-232 cable will need to be connected between the test
computer and the spectrometer which is running the virtual instrument.
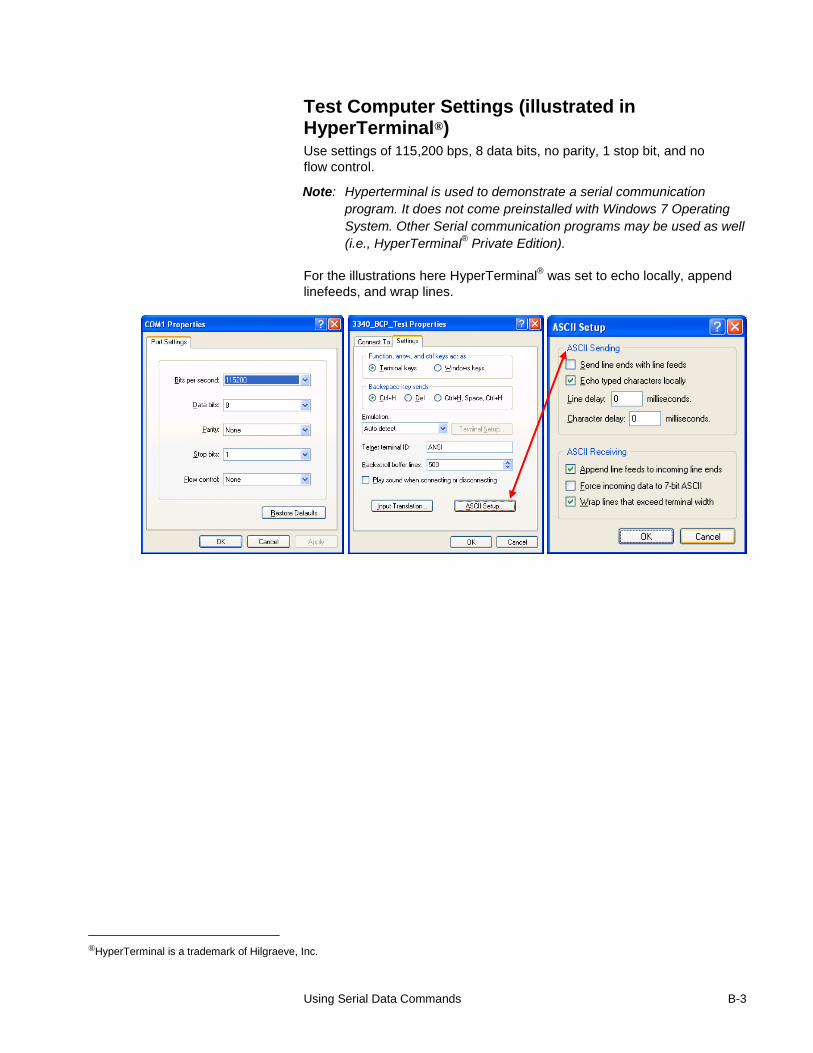
Using Serial Data Commands B-3
Test Computer Settings (illustrated in HyperTerminal®) Use settings of 115,200 bps, 8 data bits, no parity, 1 stop bit, and no
flow control.
Note: Hyperterminal is used to demonstrate a serial communication
program. It does not come preinstalled with Windows 7 Operating
System. Other Serial communication programs may be used as well
(i.e., HyperTerminal® Private Edition).
For the illustrations here HyperTerminal® was set to echo locally, append
linefeeds, and wrap lines.
®HyperTerminal is a trademark of Hilgraeve, Inc.
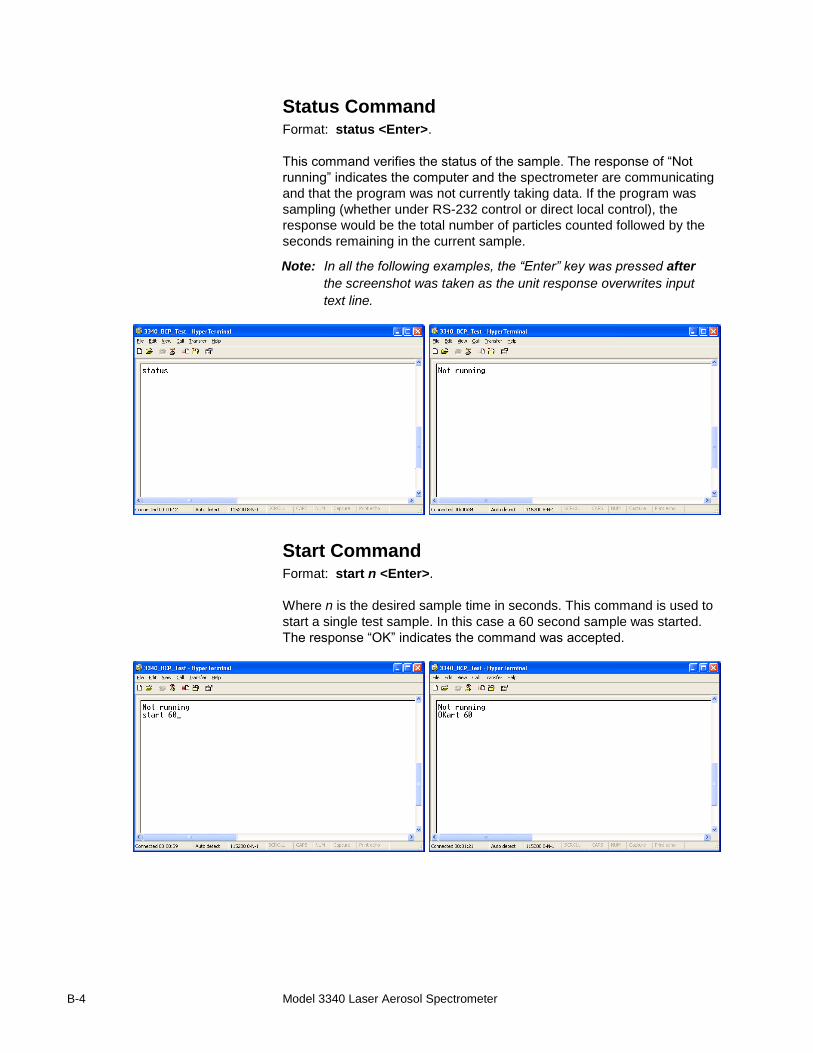
B-4 Model 3340 Laser Aerosol Spectrometer
Status Command Format: status <Enter>.
This command verifies the status of the sample. The response of “Not
running” indicates the computer and the spectrometer are communicating
and that the program was not currently taking data. If the program was
sampling (whether under RS-232 control or direct local control), the
response would be the total number of particles counted followed by the
seconds remaining in the current sample.
Note: In all the following examples, the “Enter” key was pressed after
the screenshot was taken as the unit response overwrites input
text line.
Start Command Format: start n <Enter>.
Where n is the desired sample time in seconds. This command is used to
start a single test sample. In this case a 60 second sample was started.
The response “OK” indicates the command was accepted.
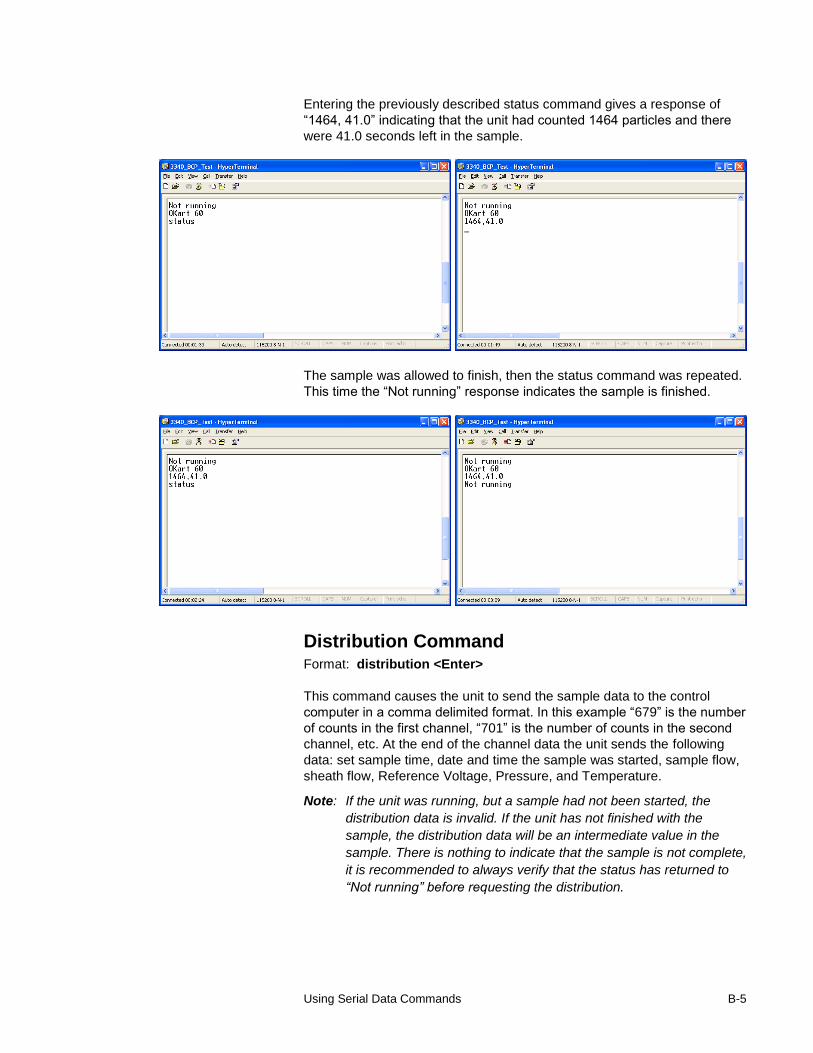
Using Serial Data Commands B-5
Entering the previously described status command gives a response of
“1464, 41.0” indicating that the unit had counted 1464 particles and there
were 41.0 seconds left in the sample.
The sample was allowed to finish, then the status command was repeated.
This time the “Not running” response indicates the sample is finished.
Distribution Command Format: distribution <Enter>
This command causes the unit to send the sample data to the control
computer in a comma delimited format. In this example “679” is the number
of counts in the first channel, “701” is the number of counts in the second
channel, etc. At the end of the channel data the unit sends the following
data: set sample time, date and time the sample was started, sample flow,
sheath flow, Reference Voltage, Pressure, and Temperature.
Note: If the unit was running, but a sample had not been started, the
distribution data is invalid. If the unit has not finished with the
sample, the distribution data will be an intermediate value in the
sample. There is nothing to indicate that the sample is not complete,
it is recommended to always verify that the status has returned to
“Not running” before requesting the distribution.
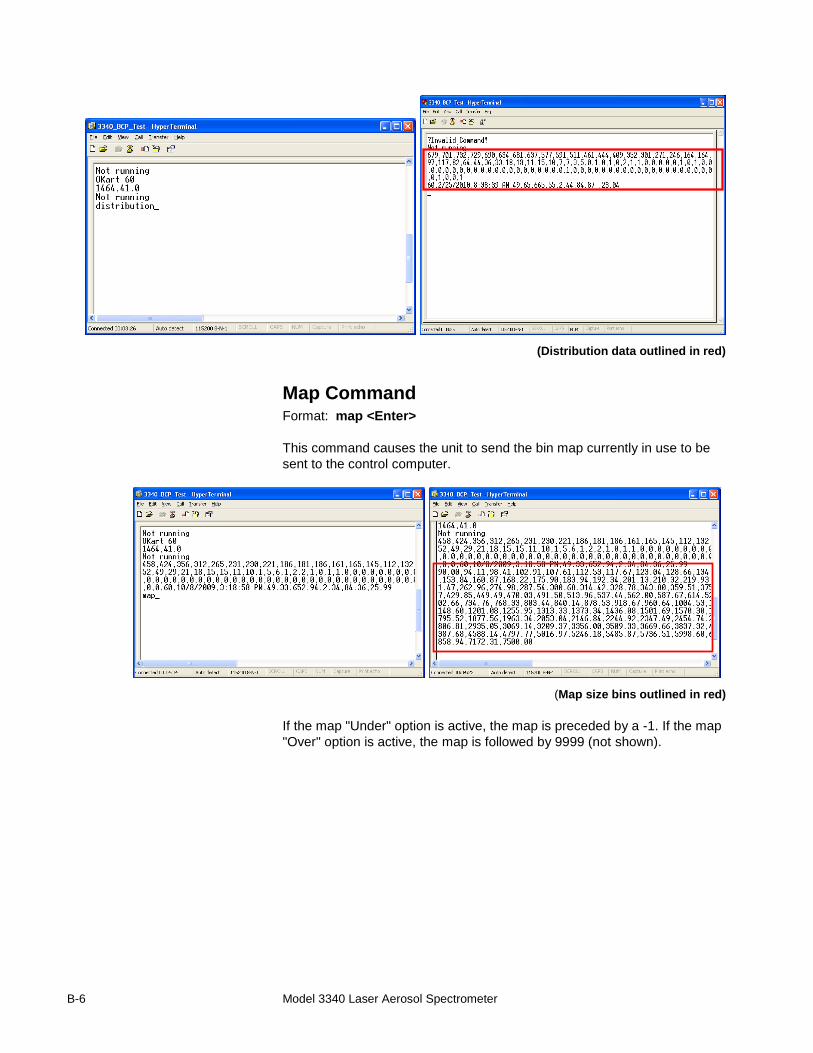
B-6 Model 3340 Laser Aerosol Spectrometer
(Distribution data outlined in red)
Map Command Format: map <Enter>
This command causes the unit to send the bin map currently in use to be
sent to the control computer.
(Map size bins outlined in red)
If the map "Under" option is active, the map is preceded by a -1. If the map
"Over" option is active, the map is followed by 9999 (not shown).
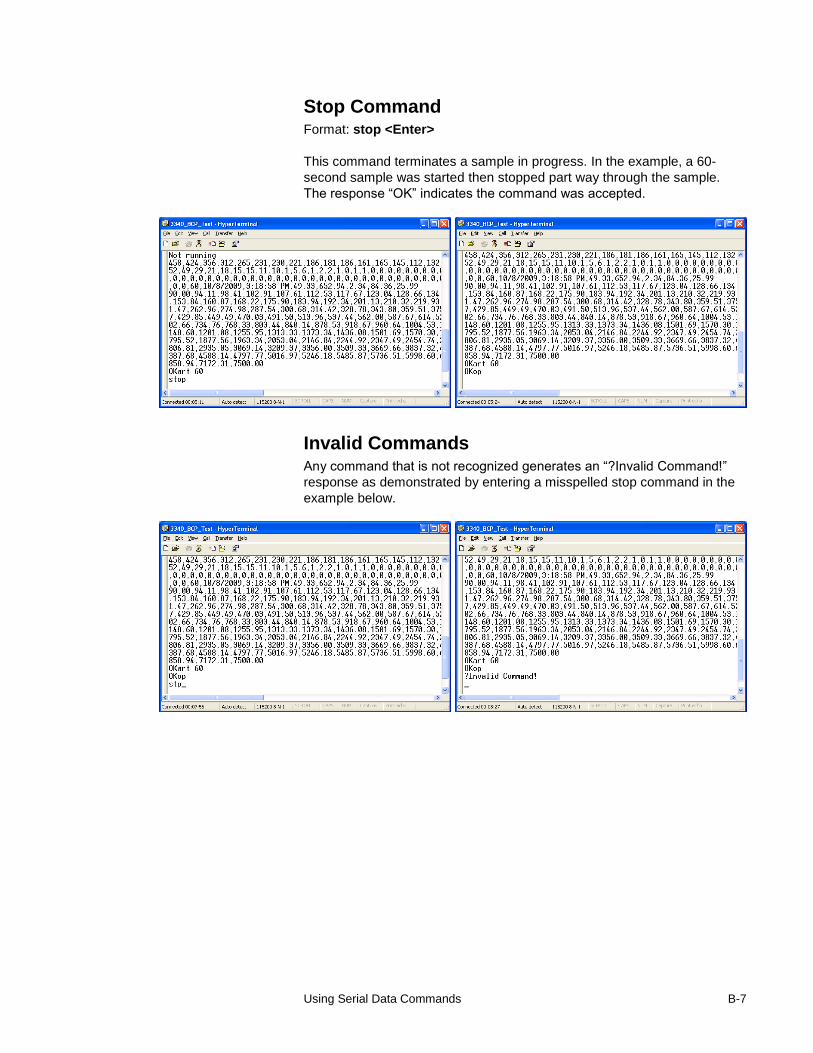
Using Serial Data Commands B-7
Stop Command Format: stop <Enter>
This command terminates a sample in progress. In the example, a 60-
second sample was started then stopped part way through the sample.
The response “OK” indicates the command was accepted.
Invalid Commands Any command that is not recognized generates an “?Invalid Command!”
response as demonstrated by entering a misspelled stop command in the
example below.
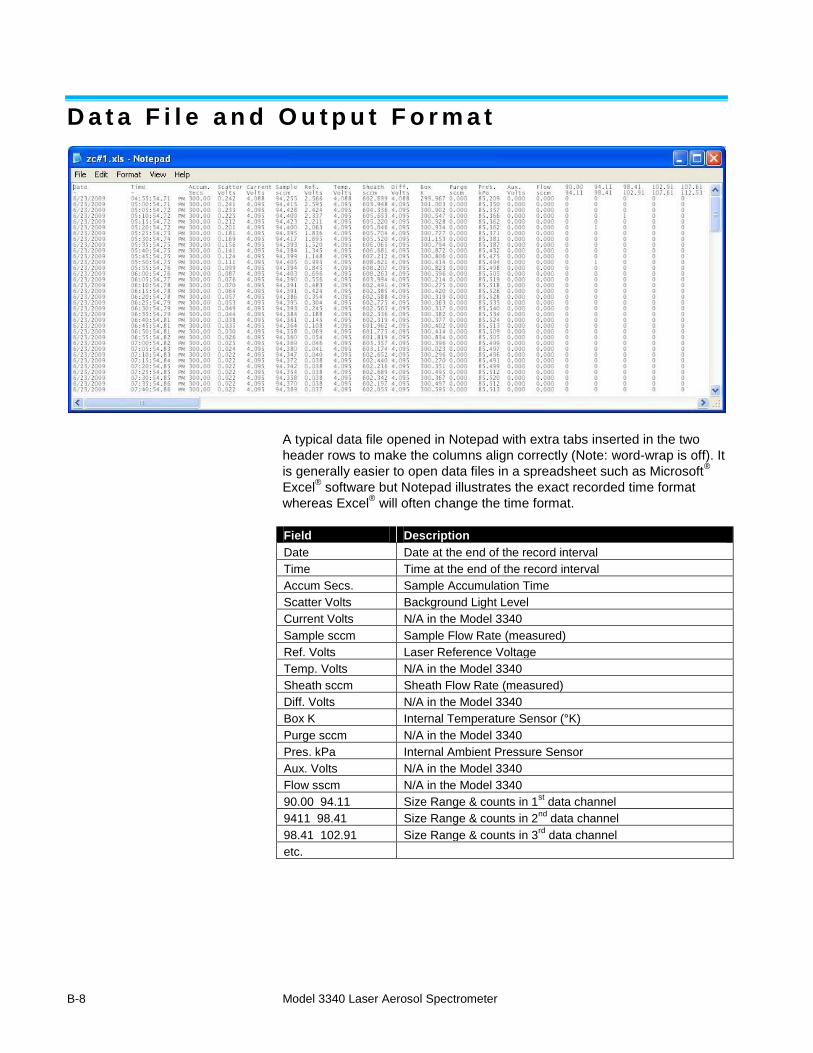
B-8 Model 3340 Laser Aerosol Spectrometer
D a t a F i l e a n d O u t p u t F o r m a t
A typical data file opened in Notepad with extra tabs inserted in the two
header rows to make the columns align correctly (Note: word-wrap is off). It
is generally easier to open data files in a spreadsheet such as Microsoft®
Excel® software but Notepad illustrates the exact recorded time format
whereas Excel® will often change the time format.
Field Description
Date Date at the end of the record interval
Time Time at the end of the record interval
Accum Secs. Sample Accumulation Time
Scatter Volts Background Light Level
Current Volts N/A in the Model 3340
Sample sccm Sample Flow Rate (measured)
Ref. Volts Laser Reference Voltage
Temp. Volts N/A in the Model 3340
Sheath sccm Sheath Flow Rate (measured)
Diff. Volts N/A in the Model 3340
Box K Internal Temperature Sensor (°K)
Purge sccm N/A in the Model 3340
Pres. kPa Internal Ambient Pressure Sensor
Aux. Volts N/A in the Model 3340
Flow sscm N/A in the Model 3340
90.00 94.11 Size Range & counts in 1st data channel
9411 98.41 Size Range & counts in 2nd
data channel
98.41 102.91 Size Range & counts in 3rd
data channel
etc.
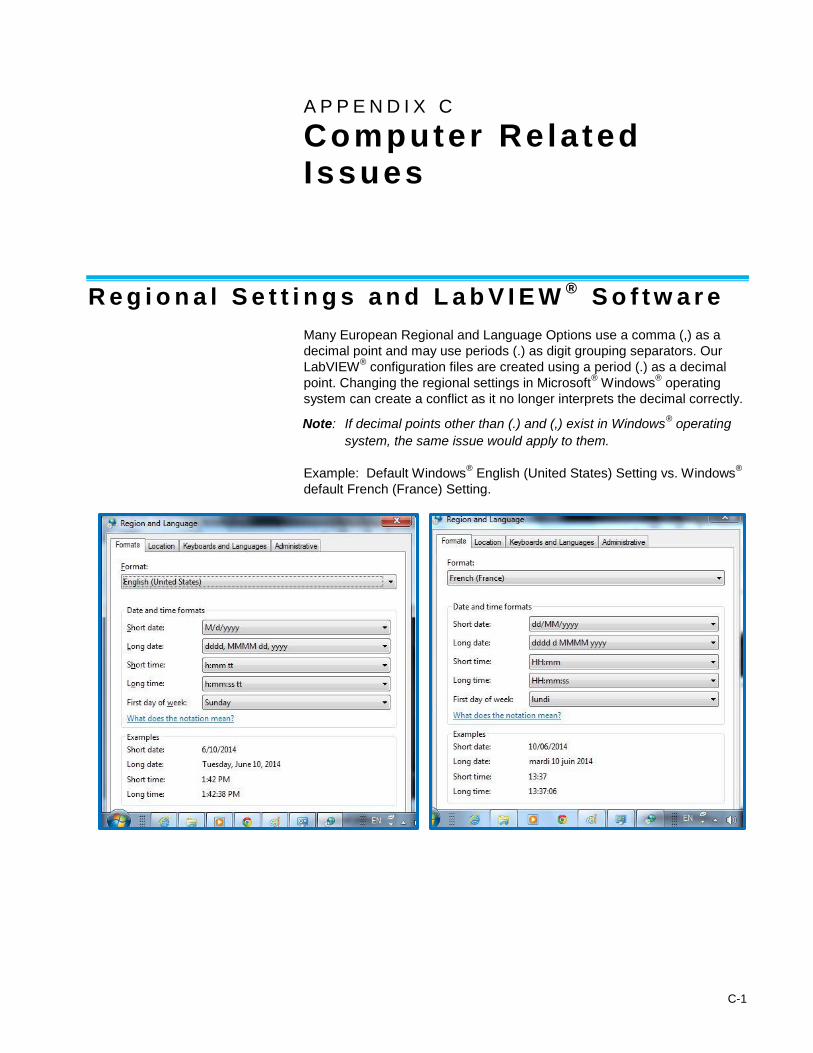
C-1
A P P E N D I X C Computer Rela ted Issues
R e g i o n a l S e t t i n g s a n d L a b V I E W®
S o f t w a r e
Many European Regional and Language Options use a comma (,) as a
decimal point and may use periods (.) as digit grouping separators. Our
LabVIEW® configuration files are created using a period (.) as a decimal
point. Changing the regional settings in Microsoft® Windows
® operating
system can create a conflict as it no longer interprets the decimal correctly.
Note: If decimal points other than (.) and (,) exist in Windows® operating
system, the same issue would apply to them.
Example: Default Windows® English (United States) Setting vs. Windows
®
default French (France) Setting.
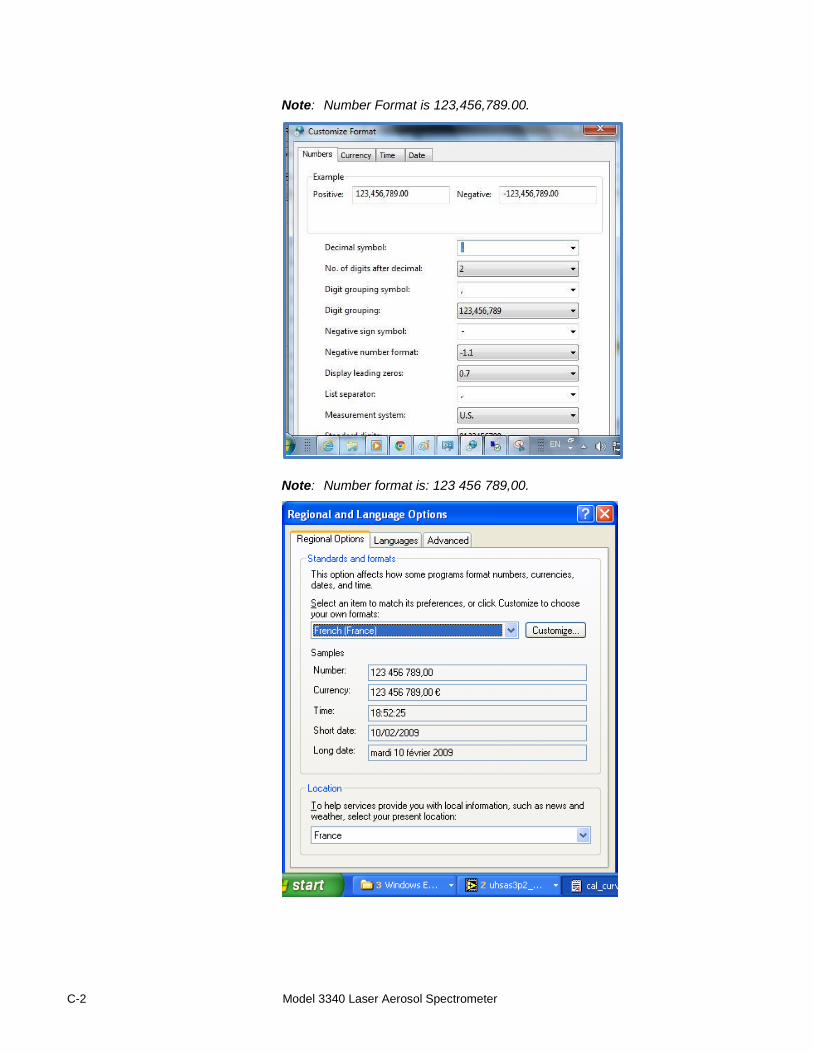
C-2 Model 3340 Laser Aerosol Spectrometer
Note: Number Format is 123,456,789.00.
Note: Number format is: 123 456 789,00.
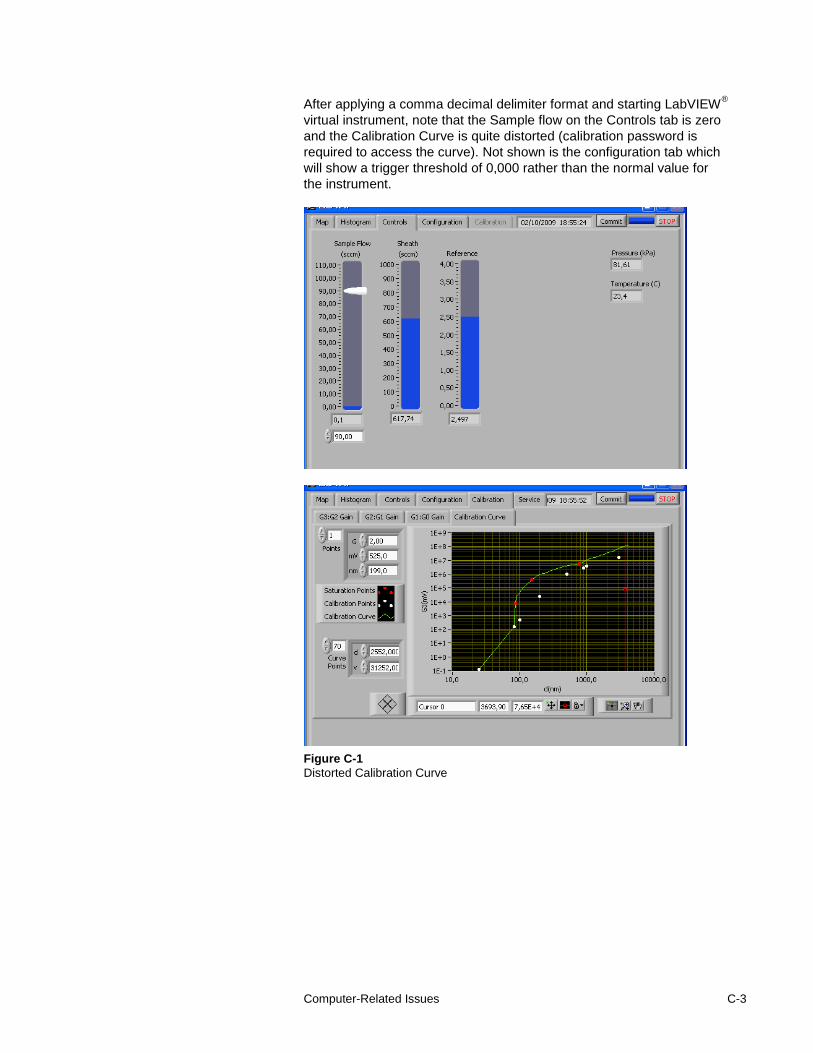
Computer-Related Issues C-3
After applying a comma decimal delimiter format and starting LabVIEW®
virtual instrument, note that the Sample flow on the Controls tab is zero
and the Calibration Curve is quite distorted (calibration password is
required to access the curve). Not shown is the configuration tab which
will show a trigger threshold of 0,000 rather than the normal value for
the instrument.
Figure C-1
Distorted Calibration Curve
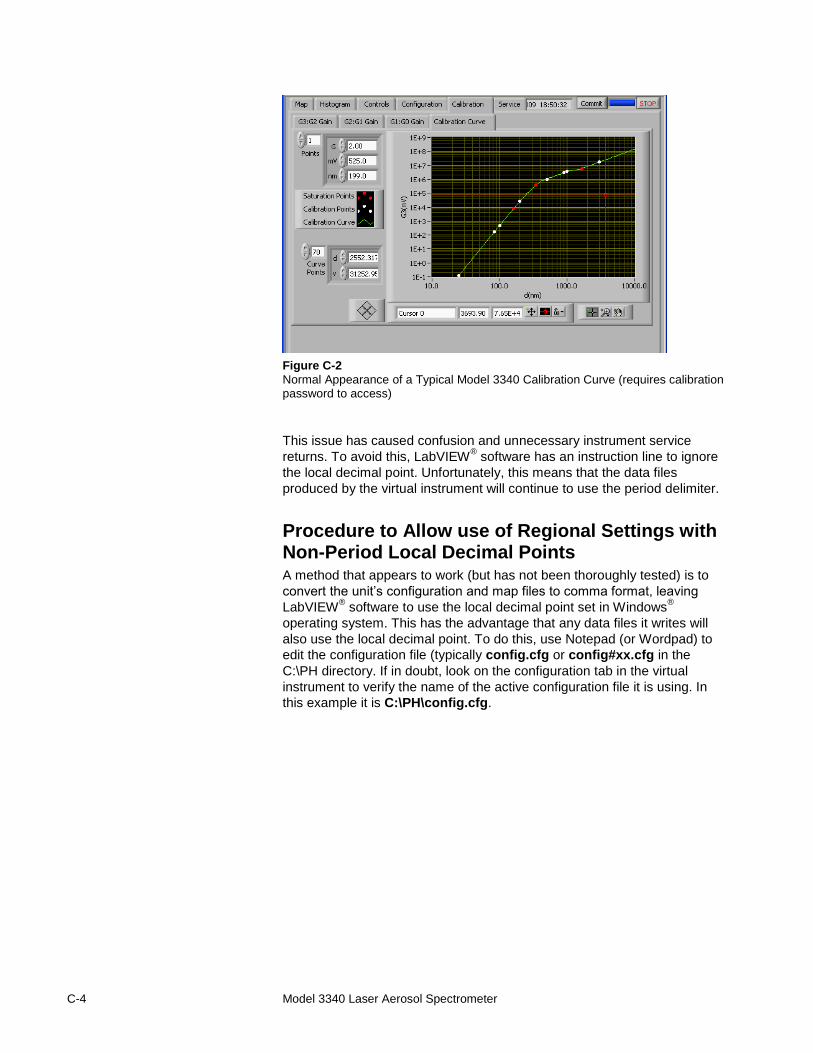
C-4 Model 3340 Laser Aerosol Spectrometer
Figure C-2
Normal Appearance of a Typical Model 3340 Calibration Curve (requires calibration password to access)
This issue has caused confusion and unnecessary instrument service
returns. To avoid this, LabVIEW® software has an instruction line to ignore
the local decimal point. Unfortunately, this means that the data files
produced by the virtual instrument will continue to use the period delimiter.
Procedure to Allow use of Regional Settings with Non-Period Local Decimal Points A method that appears to work (but has not been thoroughly tested) is to
convert the unit’s configuration and map files to comma format, leaving
LabVIEW® software to use the local decimal point set in Windows
®
operating system. This has the advantage that any data files it writes will
also use the local decimal point. To do this, use Notepad (or Wordpad) to
edit the configuration file (typically config.cfg or config#xx.cfg in the
C:\PH directory. If in doubt, look on the configuration tab in the virtual
instrument to verify the name of the active configuration file it is using. In
this example it is C:\PH\config.cfg.
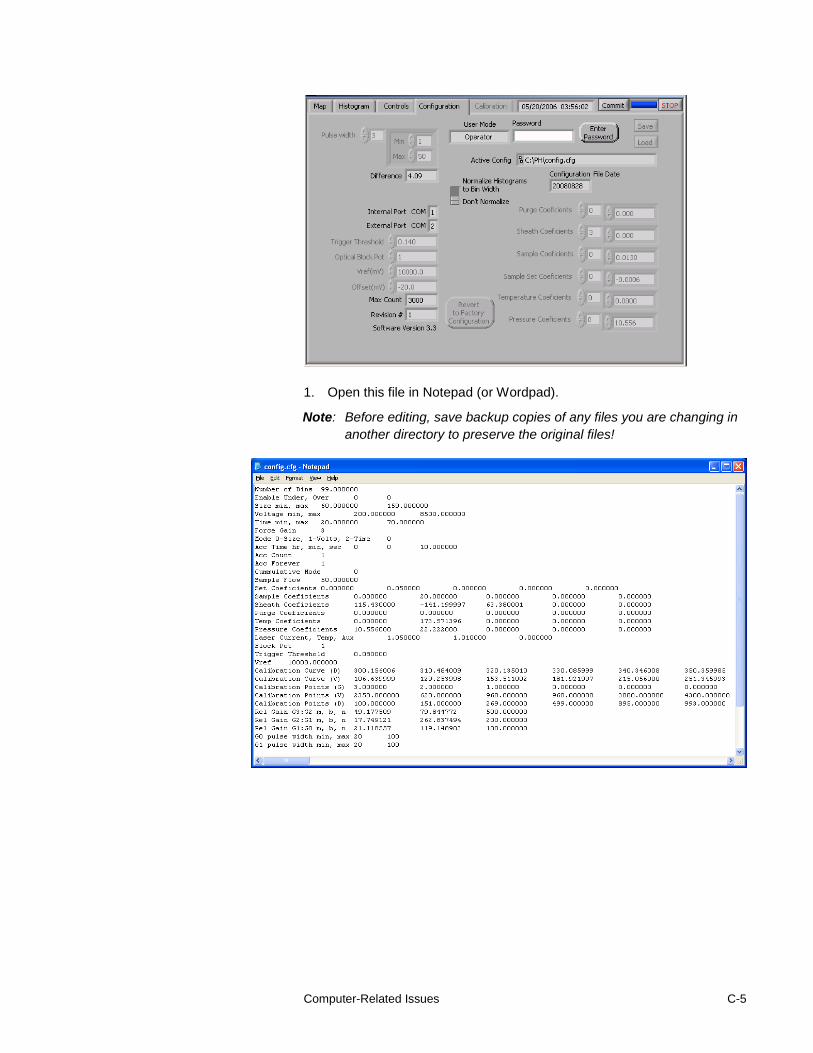
Computer-Related Issues C-5
1. Open this file in Notepad (or Wordpad).
Note: Before editing, save backup copies of any files you are changing in
another directory to preserve the original files!
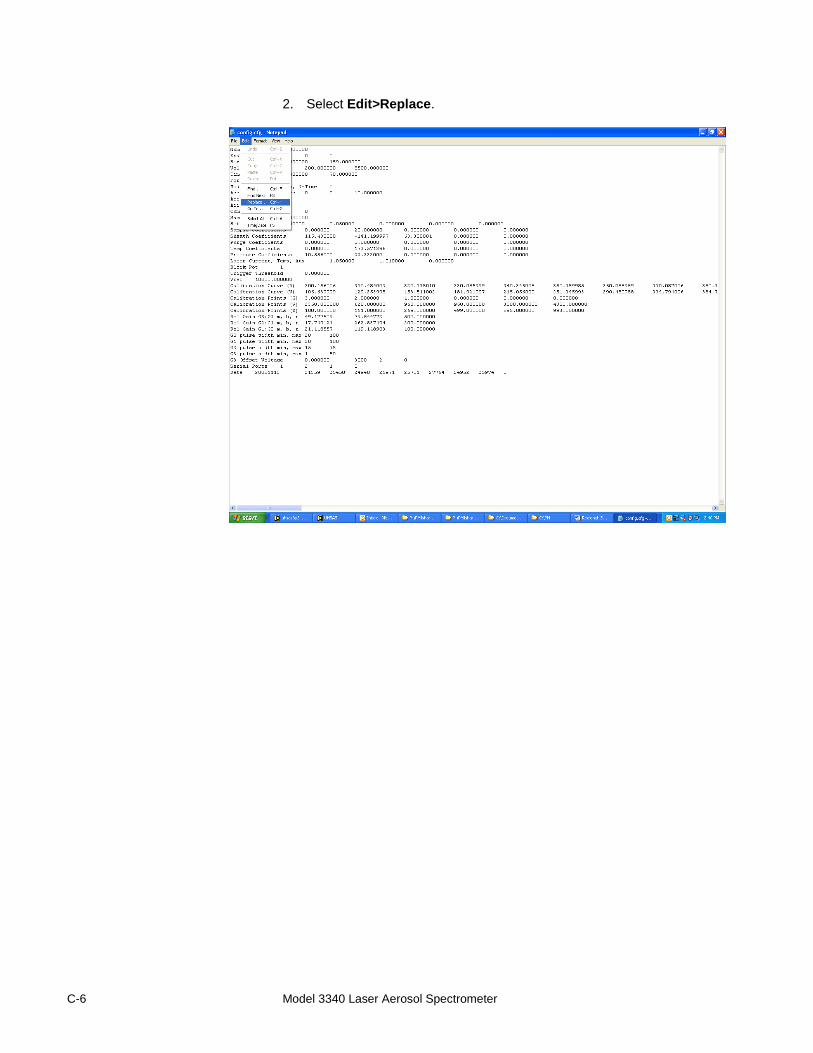
C-6 Model 3340 Laser Aerosol Spectrometer
2. Select Edit>Replace.
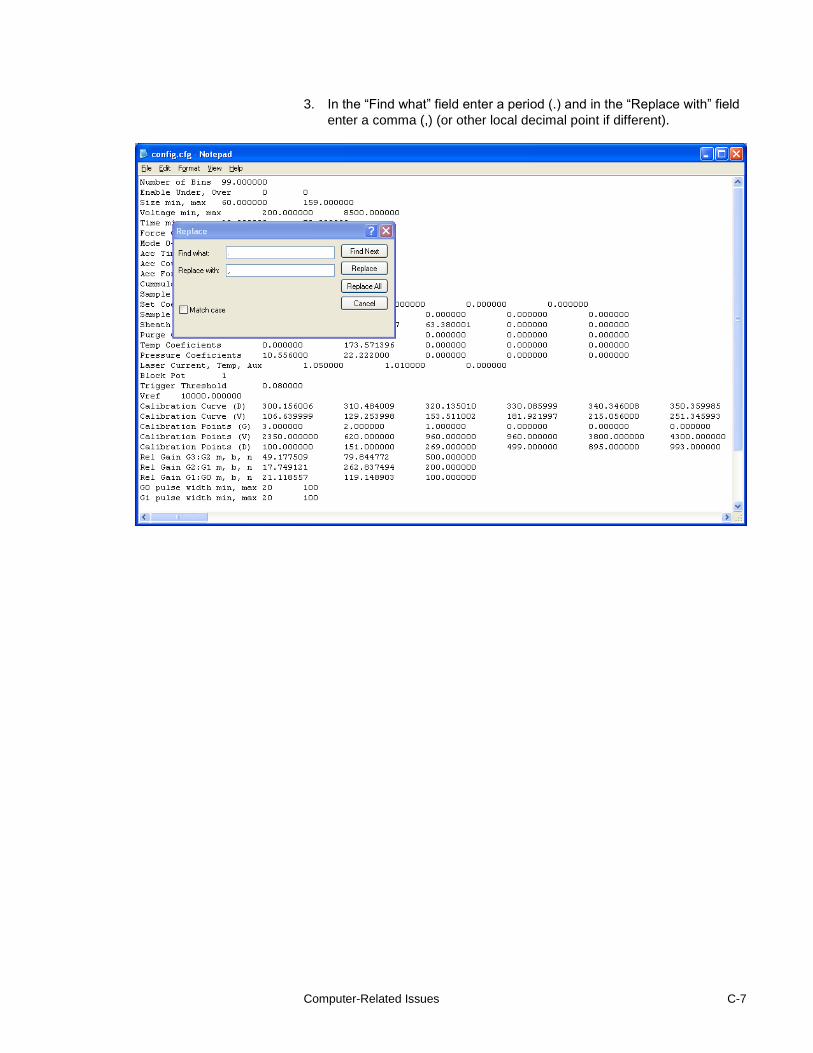
Computer-Related Issues C-7
3. In the “Find what” field enter a period (.) and in the “Replace with” field
enter a comma (,) (or other local decimal point if different).
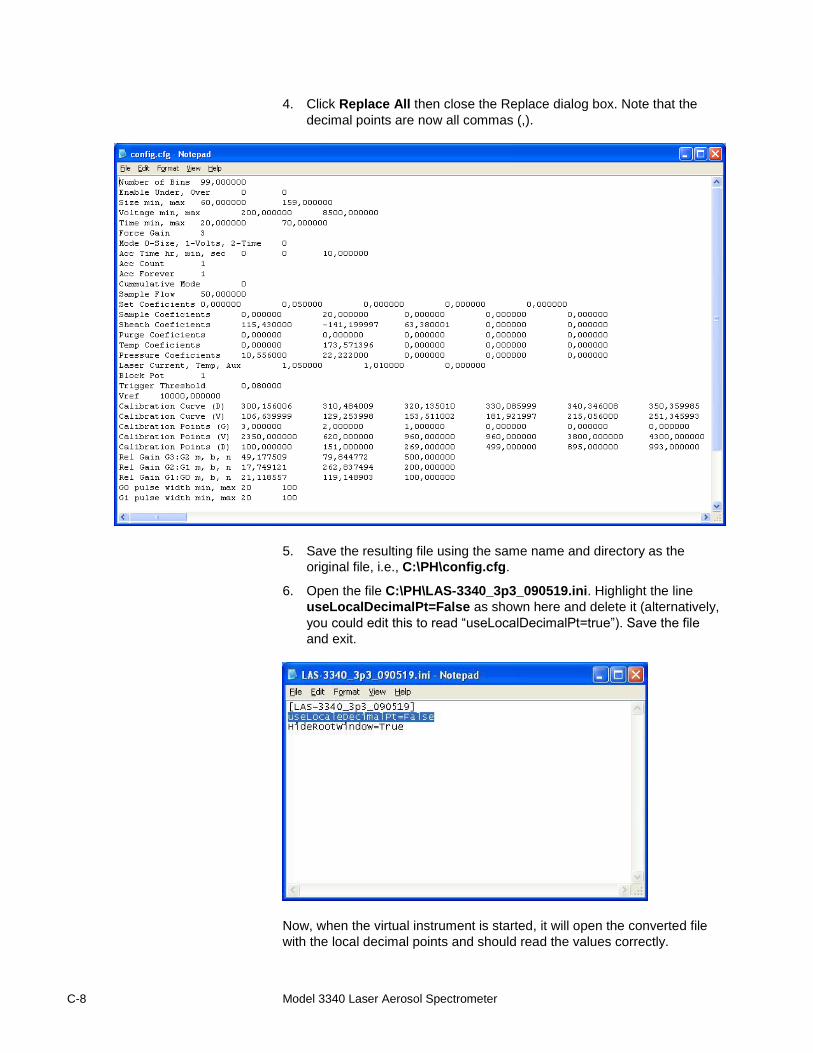
C-8 Model 3340 Laser Aerosol Spectrometer
4. Click Replace All then close the Replace dialog box. Note that the
decimal points are now all commas (,).
5. Save the resulting file using the same name and directory as the
original file, i.e., C:\PH\config.cfg.
6. Open the file C:\PH\LAS-3340_3p3_090519.ini. Highlight the line
useLocalDecimalPt=False as shown here and delete it (alternatively,
you could edit this to read “useLocalDecimalPt=true”). Save the file
and exit.
Now, when the virtual instrument is started, it will open the converted file
with the local decimal points and should read the values correctly.
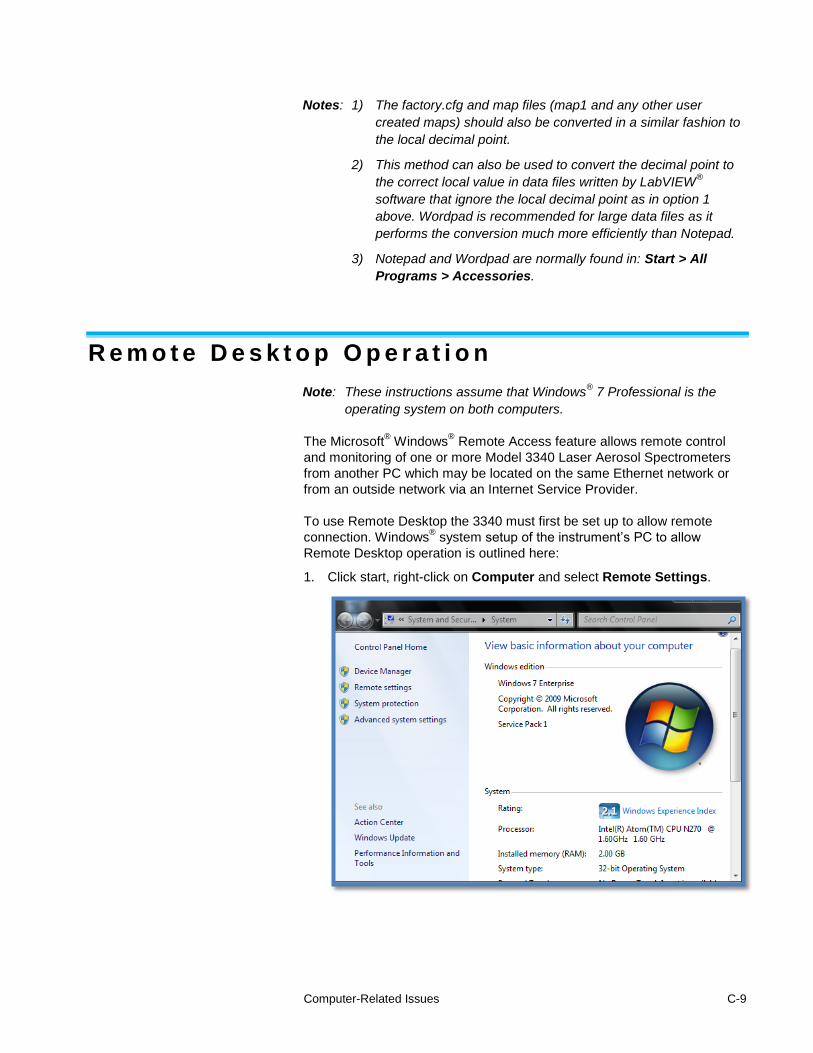
Computer-Related Issues C-9
Notes: 1) The factory.cfg and map files (map1 and any other user
created maps) should also be converted in a similar fashion to
the local decimal point.
2) This method can also be used to convert the decimal point to
the correct local value in data files written by LabVIEW®
software that ignore the local decimal point as in option 1
above. Wordpad is recommended for large data files as it
performs the conversion much more efficiently than Notepad.
3) Notepad and Wordpad are normally found in: Start > All
Programs > Accessories.
R e m o t e D e s k t o p O p e r a t i o n
Note: These instructions assume that Windows® 7 Professional is the
operating system on both computers.
The Microsoft® Windows
® Remote Access feature allows remote control
and monitoring of one or more Model 3340 Laser Aerosol Spectrometers
from another PC which may be located on the same Ethernet network or
from an outside network via an Internet Service Provider.
To use Remote Desktop the 3340 must first be set up to allow remote
connection. Windows® system setup of the instrument’s PC to allow
Remote Desktop operation is outlined here:
1. Click start, right-click on Computer and select Remote Settings.
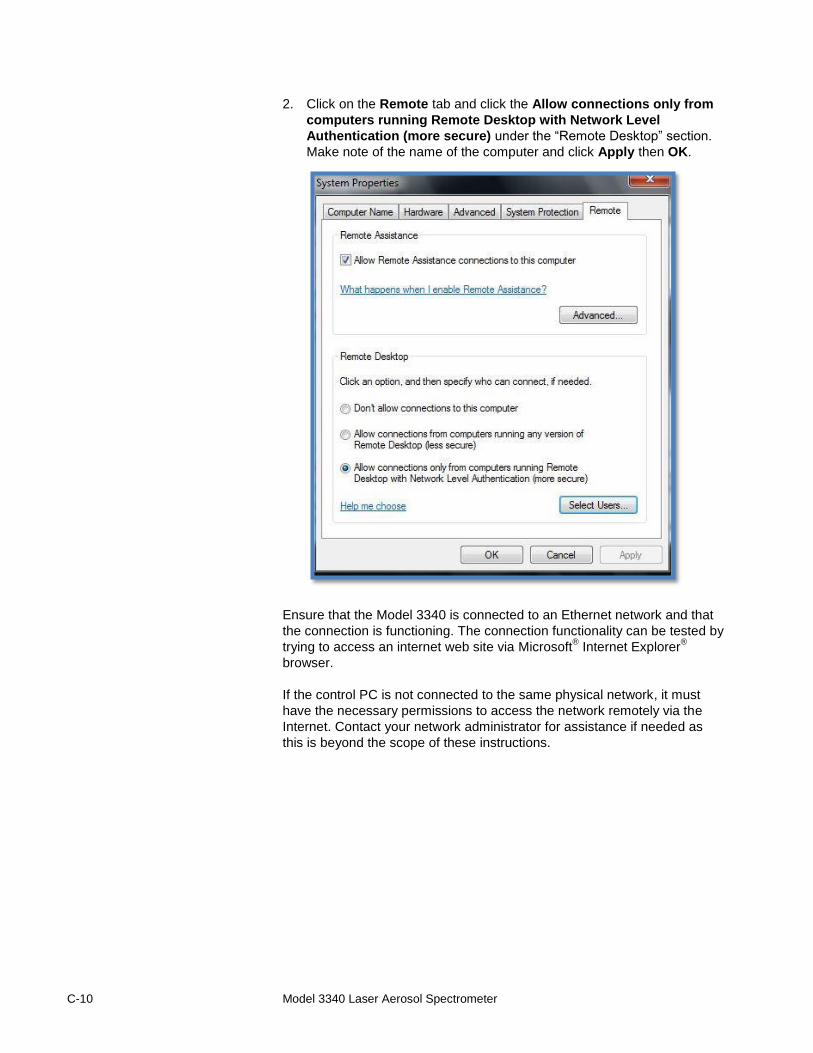
C-10 Model 3340 Laser Aerosol Spectrometer
2. Click on the Remote tab and click the Allow connections only from
computers running Remote Desktop with Network Level
Authentication (more secure) under the “Remote Desktop” section.
Make note of the name of the computer and click Apply then OK.
Ensure that the Model 3340 is connected to an Ethernet network and that
the connection is functioning. The connection functionality can be tested by
trying to access an internet web site via Microsoft® Internet Explorer
®
browser.
If the control PC is not connected to the same physical network, it must
have the necessary permissions to access the network remotely via the
Internet. Contact your network administrator for assistance if needed as
this is beyond the scope of these instructions.
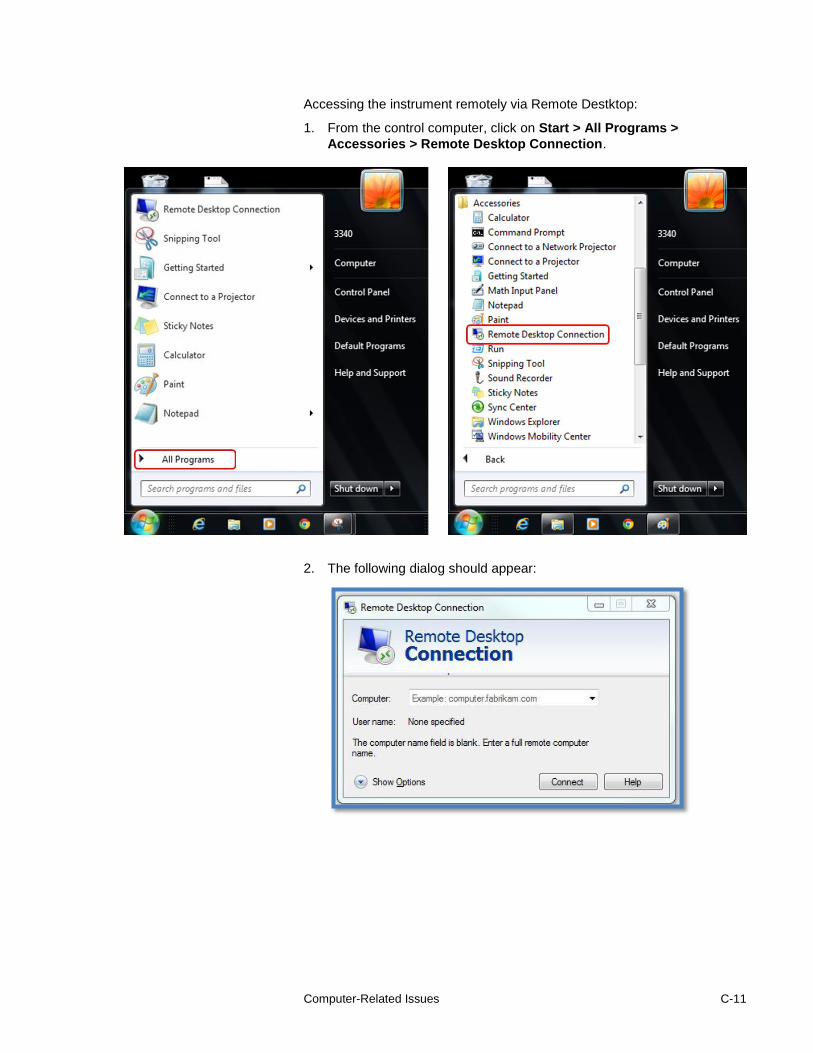
Computer-Related Issues C-11
Accessing the instrument remotely via Remote Destktop:
1. From the control computer, click on Start > All Programs >
Accessories > Remote Desktop Connection.
2. The following dialog should appear:
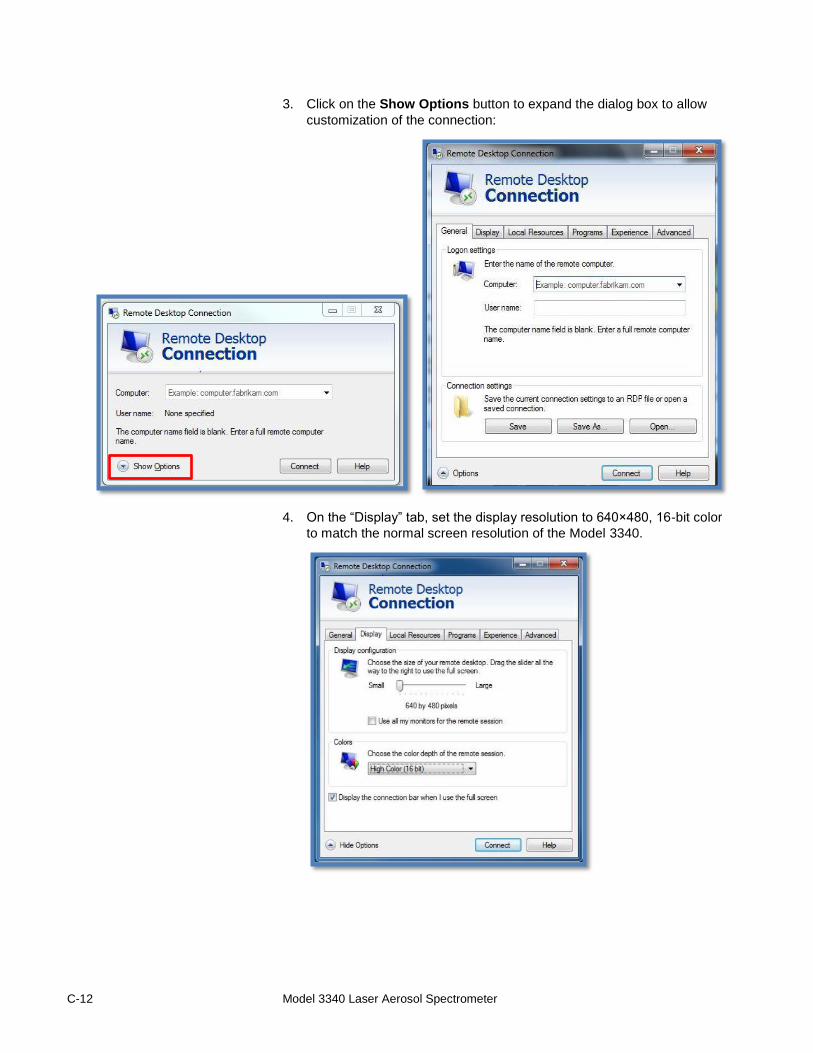
C-12 Model 3340 Laser Aerosol Spectrometer
3. Click on the Show Options button to expand the dialog box to allow
customization of the connection:
4. On the “Display” tab, set the display resolution to 640×480, 16-bit color
to match the normal screen resolution of the Model 3340.
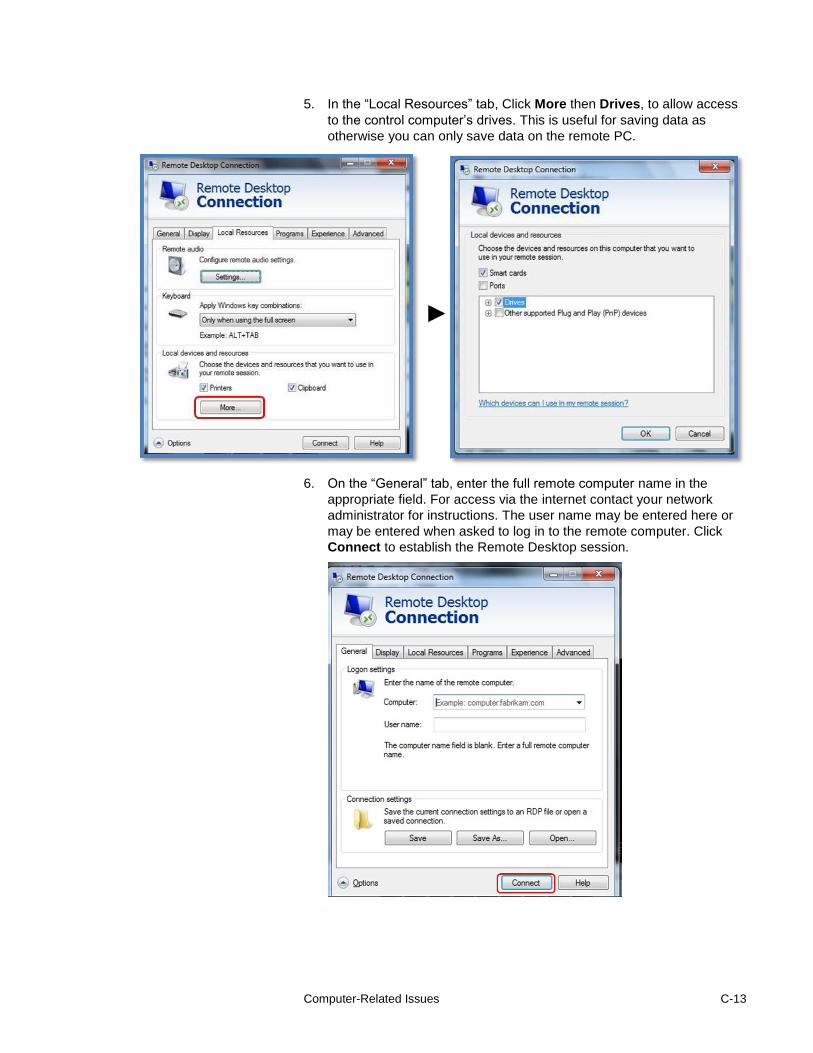
Computer-Related Issues C-13
5. In the “Local Resources” tab, Click More then Drives, to allow access
to the control computer’s drives. This is useful for saving data as
otherwise you can only save data on the remote PC.
6. On the “General” tab, enter the full remote computer name in the
appropriate field. For access via the internet contact your network
administrator for instructions. The user name may be entered here or
may be entered when asked to log in to the remote computer. Click
Connect to establish the Remote Desktop session.
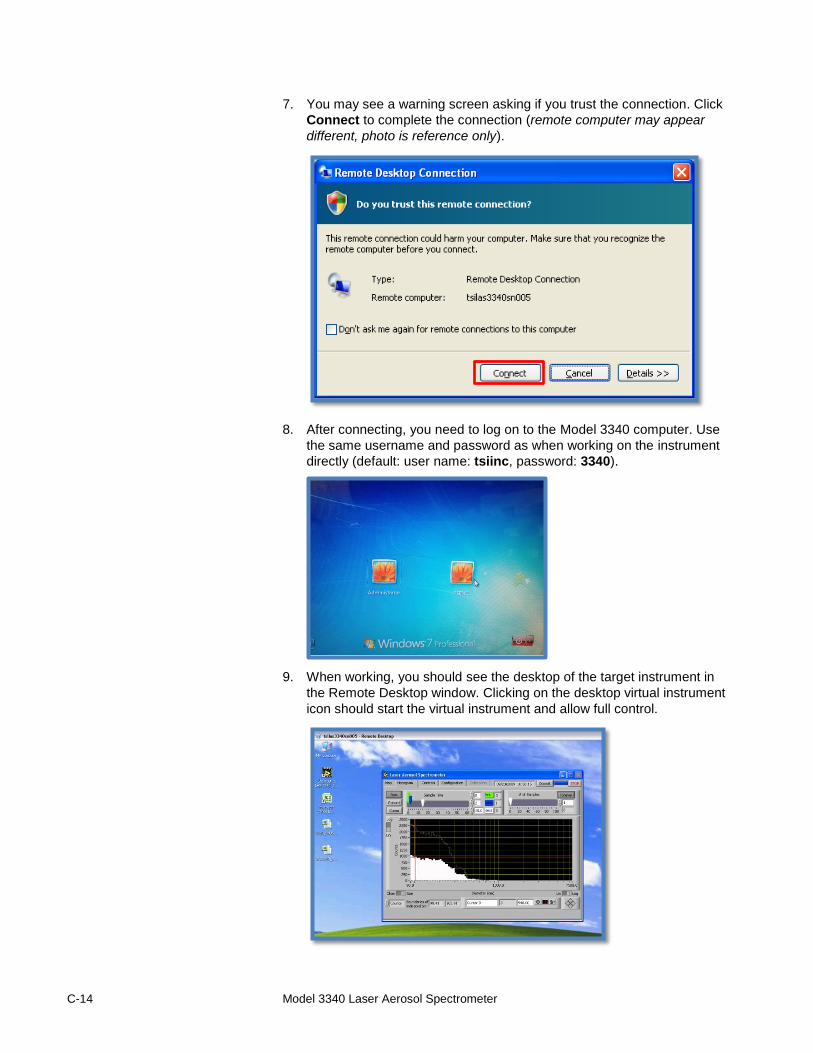
C-14 Model 3340 Laser Aerosol Spectrometer
7. You may see a warning screen asking if you trust the connection. Click
Connect to complete the connection (remote computer may appear
different, photo is reference only).
8. After connecting, you need to log on to the Model 3340 computer. Use
the same username and password as when working on the instrument
directly (default: user name: tsiinc, password: 3340).
9. When working, you should see the desktop of the target instrument in
the Remote Desktop window. Clicking on the desktop virtual instrument
icon should start the virtual instrument and allow full control.
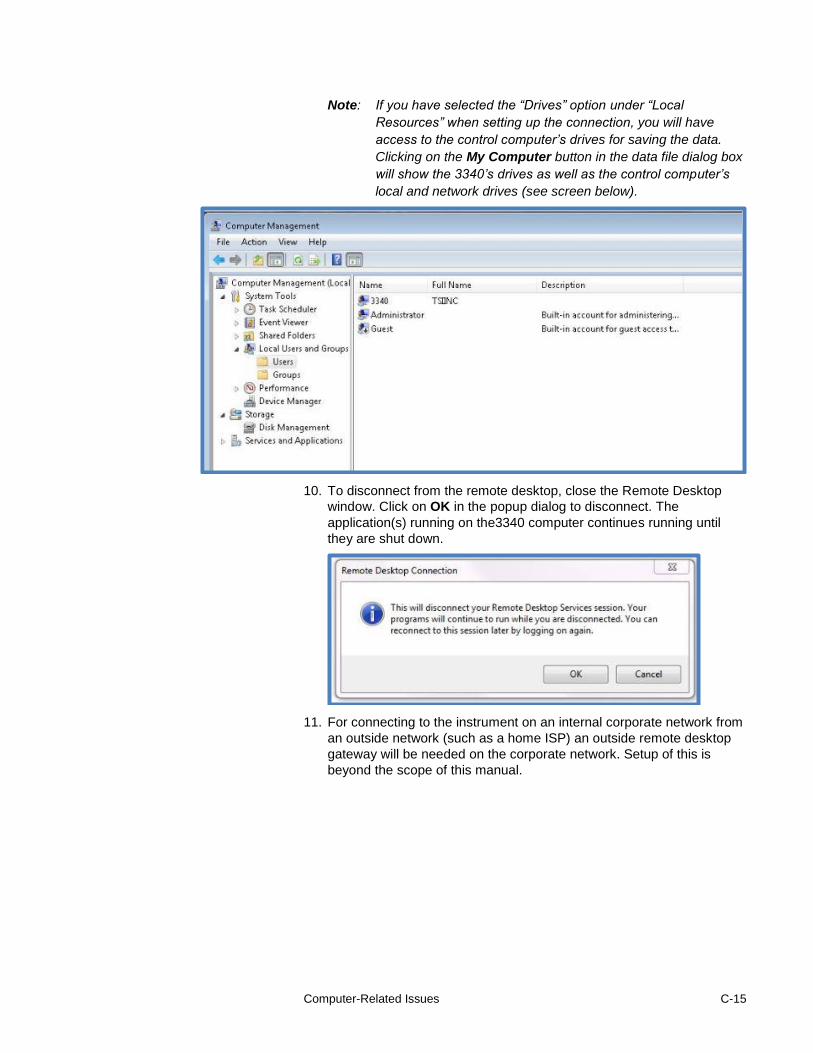
Computer-Related Issues C-15
Note: If you have selected the “Drives” option under “Local
Resources” when setting up the connection, you will have
access to the control computer’s drives for saving the data.
Clicking on the My Computer button in the data file dialog box
will show the 3340’s drives as well as the control computer’s
local and network drives (see screen below).
10. To disconnect from the remote desktop, close the Remote Desktop
window. Click on OK in the popup dialog to disconnect. The
application(s) running on the3340 computer continues running until
they are shut down.
11. For connecting to the instrument on an internal corporate network from
an outside network (such as a home ISP) an outside remote desktop
gateway will be needed on the corporate network. Setup of this is
beyond the scope of this manual.

C-16 Model 3340 Laser Aerosol Spectrometer
(This page intentionally left blank)
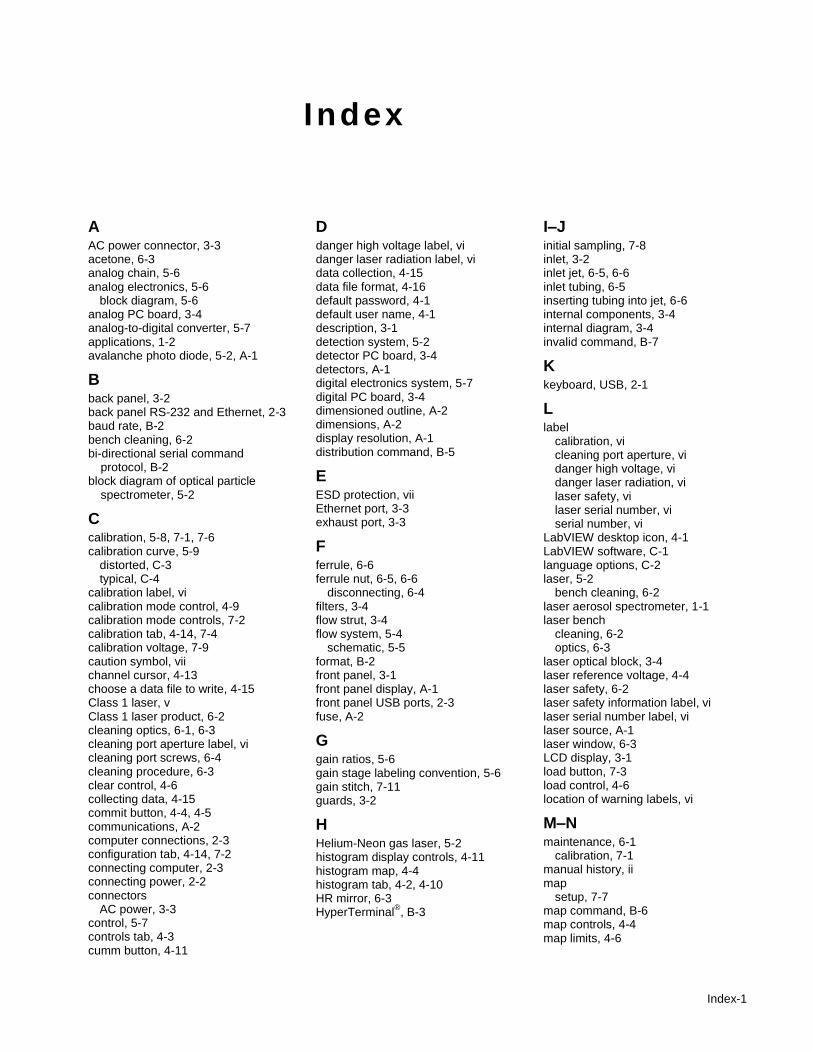
Index-1
Index
A AC power connector, 3-3 acetone, 6-3 analog chain, 5-6 analog electronics, 5-6
block diagram, 5-6 analog PC board, 3-4 analog-to-digital converter, 5-7 applications, 1-2 avalanche photo diode, 5-2, A-1
B back panel, 3-2 back panel RS-232 and Ethernet, 2-3 baud rate, B-2 bench cleaning, 6-2 bi-directional serial command
protocol, B-2 block diagram of optical particle
spectrometer, 5-2
C calibration, 5-8, 7-1, 7-6 calibration curve, 5-9
distorted, C-3 typical, C-4
calibration label, vi calibration mode control, 4-9 calibration mode controls, 7-2 calibration tab, 4-14, 7-4 calibration voltage, 7-9 caution symbol, vii channel cursor, 4-13 choose a data file to write, 4-15 Class 1 laser, v Class 1 laser product, 6-2 cleaning optics, 6-1, 6-3 cleaning port aperture label, vi cleaning port screws, 6-4 cleaning procedure, 6-3 clear control, 4-6 collecting data, 4-15 commit button, 4-4, 4-5 communications, A-2 computer connections, 2-3 configuration tab, 4-14, 7-2 connecting computer, 2-3 connecting power, 2-2 connectors
AC power, 3-3 control, 5-7 controls tab, 4-3 cumm button, 4-11
D danger high voltage label, vi danger laser radiation label, vi data collection, 4-15 data file format, 4-16 default password, 4-1 default user name, 4-1 description, 3-1 detection system, 5-2 detector PC board, 3-4 detectors, A-1 digital electronics system, 5-7 digital PC board, 3-4 dimensioned outline, A-2 dimensions, A-2 display resolution, A-1 distribution command, B-5
E ESD protection, vii Ethernet port, 3-3 exhaust port, 3-3
F ferrule, 6-6 ferrule nut, 6-5, 6-6
disconnecting, 6-4 filters, 3-4 flow strut, 3-4 flow system, 5-4
schematic, 5-5 format, B-2 front panel, 3-1 front panel display, A-1 front panel USB ports, 2-3 fuse, A-2
G gain ratios, 5-6 gain stage labeling convention, 5-6 gain stitch, 7-11 guards, 3-2
H Helium-Neon gas laser, 5-2 histogram display controls, 4-11 histogram map, 4-4 histogram tab, 4-2, 4-10 HR mirror, 6-3 HyperTerminal
®, B-3
I–J initial sampling, 7-8 inlet, 3-2 inlet jet, 6-5, 6-6 inlet tubing, 6-5 inserting tubing into jet, 6-6 internal components, 3-4 internal diagram, 3-4 invalid command, B-7
K keyboard, USB, 2-1
L label
calibration, vi cleaning port aperture, vi danger high voltage, vi danger laser radiation, vi laser safety, vi laser serial number, vi serial number, vi
LabVIEW desktop icon, 4-1 LabVIEW software, C-1 language options, C-2 laser, 5-2
bench cleaning, 6-2 laser aerosol spectrometer, 1-1 laser bench
cleaning, 6-2 optics, 6-3
laser optical block, 3-4 laser reference voltage, 4-4 laser safety, 6-2 laser safety information label, vi laser serial number label, vi laser source, A-1 laser window, 6-3 LCD display, 3-1 load button, 7-3 load control, 4-6 location of warning labels, vi
M–N maintenance, 6-1
calibration, 7-1 manual history, ii map
setup, 7-7 map command, B-6 map controls, 4-4 map limits, 4-6
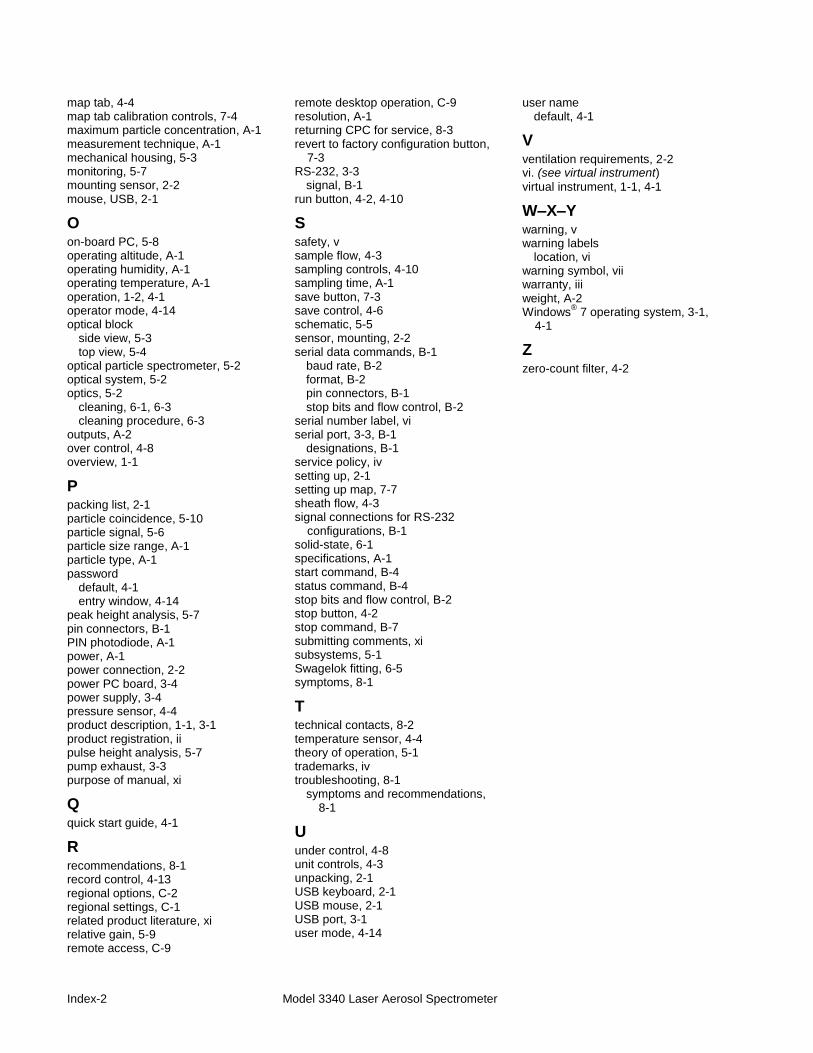
Index-2 Model 3340 Laser Aerosol Spectrometer
map tab, 4-4 map tab calibration controls, 7-4 maximum particle concentration, A-1 measurement technique, A-1 mechanical housing, 5-3 monitoring, 5-7 mounting sensor, 2-2 mouse, USB, 2-1
O on-board PC, 5-8 operating altitude, A-1 operating humidity, A-1 operating temperature, A-1 operation, 1-2, 4-1 operator mode, 4-14 optical block
side view, 5-3 top view, 5-4
optical particle spectrometer, 5-2 optical system, 5-2 optics, 5-2
cleaning, 6-1, 6-3 cleaning procedure, 6-3
outputs, A-2 over control, 4-8 overview, 1-1
P packing list, 2-1 particle coincidence, 5-10 particle signal, 5-6 particle size range, A-1 particle type, A-1 password
default, 4-1 entry window, 4-14
peak height analysis, 5-7 pin connectors, B-1 PIN photodiode, A-1 power, A-1 power connection, 2-2 power PC board, 3-4 power supply, 3-4 pressure sensor, 4-4 product description, 1-1, 3-1 product registration, ii pulse height analysis, 5-7 pump exhaust, 3-3 purpose of manual, xi
Q quick start guide, 4-1
R recommendations, 8-1 record control, 4-13 regional options, C-2 regional settings, C-1 related product literature, xi relative gain, 5-9 remote access, C-9
remote desktop operation, C-9 resolution, A-1 returning CPC for service, 8-3 revert to factory configuration button,
7-3 RS-232, 3-3
signal, B-1 run button, 4-2, 4-10
S safety, v sample flow, 4-3 sampling controls, 4-10 sampling time, A-1 save button, 7-3 save control, 4-6 schematic, 5-5 sensor, mounting, 2-2 serial data commands, B-1
baud rate, B-2 format, B-2 pin connectors, B-1 stop bits and flow control, B-2
serial number label, vi serial port, 3-3, B-1
designations, B-1 service policy, iv setting up, 2-1 setting up map, 7-7 sheath flow, 4-3 signal connections for RS-232
configurations, B-1 solid-state, 6-1 specifications, A-1 start command, B-4 status command, B-4 stop bits and flow control, B-2 stop button, 4-2 stop command, B-7 submitting comments, xi subsystems, 5-1 Swagelok fitting, 6-5 symptoms, 8-1
T technical contacts, 8-2 temperature sensor, 4-4 theory of operation, 5-1 trademarks, iv troubleshooting, 8-1
symptoms and recommendations, 8-1
U under control, 4-8 unit controls, 4-3 unpacking, 2-1 USB keyboard, 2-1 USB mouse, 2-1 USB port, 3-1 user mode, 4-14
user name default, 4-1
V ventilation requirements, 2-2 vi. (see virtual instrument)
virtual instrument, 1-1, 4-1
W–X–Y warning, v warning labels
location, vi warning symbol, vii warranty, iii weight, A-2 Windows
® 7 operating system, 3-1,
4-1
Z zero-count filter, 4-2

Reader ’s Comments
Please help us improve our manuals by completing and returning this questionnaire to the address listed in the
“About This Manual” section. Feel free to attach a separate sheet of comments.
Manual Title Model 3340 Laser Aerosol Spectrometer P/N 6002729
1. Was the manual easy to understand and use?
Yes No
1. Please identify any problem area(s) _________________________________________________________
______________________________________________________________________________________
______________________________________________________________________________________
2. Was there any incorrect or missing information? (please explain) __________________________________
______________________________________________________________________________________
______________________________________________________________________________________
3. Please rate the manual according to the following features:
Good Adequate Poor
Readability
Accuracy
Completeness (is everything there?)
Organization (finding what you need)
Quality and number of illustrations
Quality and number of examples
Comments: ____________________________________________________________________________
______________________________________________________________________________________
______________________________________________________________________________________
4. Which part(s) of this manual did you find most helpful? __________________________________________
______________________________________________________________________________________
______________________________________________________________________________________
5. Rate your level of experience with the product:
Beginning Intermediate Expert
6. Please provide us with the following information:
Name __________________________________ Address ______________________________________
Title ___________________________________ ______________________________________
Company _______________________________ ______________________________________


TSI Incorporated – Visit our website www.tsi.com for more information. USA Tel: +1 800 874 2811 UK Tel: +44 149 4 459200 France Tel: +33 1 41 19 21 99 Germany Tel: +49 241 523030
India Tel: +91 80 67877200 China Tel: +86 10 8219 7688 Singapore Tel: +65 6595 6388
P/N 6002729 Rev. G ©2015 TSI Incorporated Printed in U.S.A.