a wide-range particle spectrometer for aerosol measurement...
TRANSCRIPT

Aerosol and Air Quality Research, 10: 125–139, 2010 Copyright © Taiwan Association for Aerosol Research ISSN: 1680-8584 print / 2071-1409 online doi: 10.4209/aaqr.2009.10.0062
A Wide-Range Particle Spectrometer for Aerosol Measurement from 0.010 µm to 10 µm
Benjamin Y.H. Liu1, Francisco J. Romay1*, William D. Dick1, Keung-Shan Woo1, Mihai Chiruta2
1 MSP Corporation, 5910 Rice Creek Parkway, Suite 300, Shoreview, MN 55126, USA 2 Cummins Inc., 1801 US Highway 51/138, Stoughton, WI 53589, USA
ABSTRACT
The Wide-range Particle Spectrometer (WPS™) is a recently introduced commercial instrument with the unique capability to measure size distributions of aerosols from 0.01 to 10 μm in diameter. The instrument includes a Scanning Mobility Spectrometer (SMS) comprised of a Differential Mobility Analyzer (DMA) and a Condensation Particle Counter (CPC) for particle measurement from 0.01 to 0.5 μm and a Laser Particle Spectrometer (LPS) for measurement in the ~0.4 to 10 μm range. These components are small enough to fit into a small portable cabinet (~26 kg) with all accompanying control hardware and electronics. No external pumps are required and power consumption is only about 150 W.
The DMA is calibrated with Standard Reference Materials (SRM) from the U.S. National Institute of Standards and Technology (NIST), including SRM 1691 and SRM 1963a. These are uniform size polystyrene latex (PSL) spheres available from NIST with mean diameters of 0.269 μm and 0.1018 μm respectively. The CPC has a dual reservoir design to prevent the working fluid from being contaminated by water due to moisture condensation in the condenser. The LPS is calibrated with four NIST-traceable PSL sphere sizes. Calibration curves are generated not only for PSL (real refractive index of 1.585), but also for discrete values real refractive index ranging from 1.30 to 1.60. This procedure allows the user to select the most appropriate curve for determination of the light-scattering-equivalent sphere size that takes into account the effect due to refractive index of real aerosols. The LPS has a wide-angle collection optics design to produce a monotonic response curve for routine measurement in the field.
Keywords: Aerosol spectrometer; Differential mobility analyzer; Condensation particle counter; Laser particle spectrometer.
INTRODUCTION
The Wide-range Particle Spectrometer (WPS™) is a new aerosol-measuring instrument that combines several aerosol sizing techniques to measure aerosols over a wide particle size range. The individual sizing techniques are well known and have been available for some years in stand-alone instruments. In the past, investigators had to combine several stand-alone instruments to form a system to measure aerosols over a wide size range. Substantial effort is required to synchronize data collection from different instruments and to synthesize the data to produce meaningful measurements. Modern advances in microelectronics have allowed us to develop the WPS™ into a compact instrument with user-friendly features and advanced measurement capabilities.
The techniques used in the WPS™ include laser light
Corresponding author. Tel.: (651) 287 8107; Fax: (651) 287 8140 E-mail address: [email protected]
scattering, differential mobility analysis and condensation particle counting. Light scattering instruments are generally referred to as optical particle counters, laser particle counters, or as laser aerosol spectrometers (Liu etal., 1985; Barnard and Harrison, 1988). These instruments sense individual particles by light scattering and measure the scattered-light amplitude to determine particle size. Sizing and counting of particles by the differential mobility analyzer (DMA) and the condensation particle counter (CPC) involves classifying aerosol particles by electrical mobility with the DMA and then counting the classified particles by condensational droplet growth with the CPC. The combination is usually referred to as a differential mobility particle sizer (DMPS; Liu et al.,1978) or as a scanning mobility particle sizer (SMPS; Wang and Flagan, 1990), depending on whether the voltage on the DMA electrode is changed in steps or varied continuously and scanned.
The traditional stand-alone laser-light-scattering instrument typically has a lower size limit of 0.1 μm. The upper size limit is typically 3–10 μm. For the DMPS or SMPS, the typical measurement range is 0.01 μm to ~0.5 μm. In the WPS™, these measurement principles are combined to facilitate

Liu et al., Aerosol and Air Quality Research, 10: 125–139, 2010 126
measurement of particles from 0.01 μm to 10 μm in a single instrument housed in a common cabinet.
Historically, the first attempt at automatic wide-range aerosol measurement was made by the late Prof. Kenneth T. Whitby and his group in the Particle Technology Laboratory at the University of Minnesota during the so-called Los Angeles Smog Study (Whitby et al. 1975).Several aerosol instruments, including a Whitby Aerosol Analyzer (WAA), a condensation nucleus counter (CNC), and three optical particle counters (OPC’s) were used to measure aerosol particles from 0.002 μm to 50 μm in order to study the characteristics of smog aerosols in Los Angeles.
The WAA (Whitby and Clark, 1966) was comprised of a unipolar diffusion charger and an integral mobility analyzer. It measured aerosol size distribution from about 0.015 μm to 1 μm by mobility classification and electrometer current detection. The WAA is the predecessor of the electrical aerosol analyzer (EAA; Pui and Liu, 1975), which is in turn superseded by the DMPS and SMPS systems, which are in wide-spread use today. The WAA was an instrument occupying the volume of two relay racks, and weighing about 270 kg. The CNC and OPC used were also quite large, each weighing about 45 kg. With pumps and other accessories needed to operate the system, this first-generation wide-range aerosol measuring system had an estimated weight of about 680 kg and occupied the space of a modern motor home.
Since this early attempt at environmental aerosol measurement over a wide size range, interest in wide-range atmospheric aerosol measurement has continued. With the implementation of PM10 (1987 Particulate Matter NAAQS) and PM2.5 (1997 Particulate Matter NAAQS) particulate matter air quality standards, wide-range atmospheric aerosol measurement is now generally limited to particles of 10 μm and less in diameter for environmental research, health effects, air pollution, and air quality studies.
An example of a modern wide-range particle measuring system is the one recently assembled by Woo et al. (Woo et al., 2001) for the Atlanta and St. Louis EPA Supersite studies. This system occupies the space of a standard six-foot high relay-rack, and weighs about 115 kg. When compared to the Whitby device, the system of Woo et al.has achieved approximately a factor-of-six reduction in size and weight and improved measurement accuracy and sensitivity.
In this paper we describe a modern wide-range aerosol measuring system, which we refer to as the Wide-range Particle Spectrometer, or WPS™. In developing this instrument, we aimed to design an integrated system using miniaturized aerosol instrument components. The WPS, when compared to the system of Woo et al., has achieved another factor-of-six reduction in size, and a factor-of-four reduction in weight. It retains the same level of accuracy, precision, and resolution, while adding user-friendly features and characteristics. The power consumption has also been greatly reduced, to about 150 W.
The main objective of this paper is to describe the overall design of the WPS™ and of its main components.
A second objective is to discuss the calibration and standardization of the instrument to ensure its accuracy for measuring particle size and concentration. Experimental characterization of the transfer function of the DMA as a function of particle diameter and the comparison of this measured transfer function with the theoretical transfer function are presented. Particle size calibration of the DMA to achieve NIST-traceability is also described. The theoretical response of the laser particle spectrometer (LPS) is described in detail and compared with experimental measurements made with NIST-traceable PSL spheres. Finally, examples of typical measurements made with the WPS are shown to provide some examples of the use of the instrument for different applications.
WPSTM SYSTEM OVERVIEW
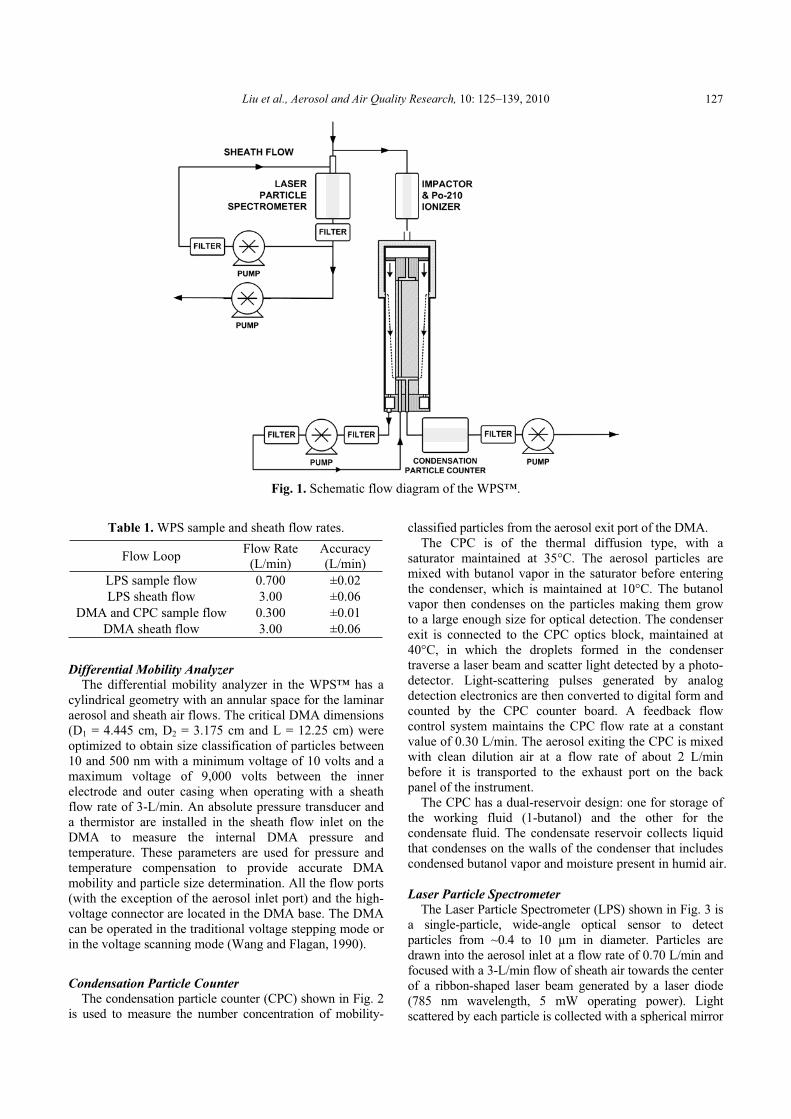
Fig. 1 is a simplified system diagram of the WPS™. The sampled air flow enters the instrument through a common inlet at a flow rate of 1.0 liter per minute (L/min). Of this total flow, 0.70 L/min is sampled into the LPS and the remaining 0.30 L/min is sampled for electrical mobility classification by the DMA followed by single-particle counting by the CPC. At the inlet of the DMA there is a single-stage impactor with a cutpoint diameter of 0.5 mand a radioactive Polonium-210 aerosol charge neutralizer (Liu et al., 1986). The impactor provides a known upper limit on the particle size that can be sampled by the DMA and the charge neutralizer imparts an equilibrium bipolar charge distribution on the aerosol particles sampled by the DMA.
Flow Measurement and Control An important consideration in the design of the WPS™
is to ensure that all flow rates are controlled and measured accurately by the system because both the particle size and concentration are dependent on volumetric flow rate.
Four miniature variable-speed DC pumps are used: two for establishing the sample flow rates for the LPS and the DMA/CPC, and two for providing the clean, re-circulating sheath air flows needed by the LPS and the DMA. There are three separate air-flow circuits in which a laminar-flow element connected with a differential pressure transducer is used to provide an electrical output for flow measurement and control. The pumps are protected at the inlet by high-efficiency air filters to minimize particle contamination and to prolong pump life. The CPC flow circuit uses an orifice as the pressure-drop element. In the case of the sample flow pumps, high-efficiency filters at the pump outlet serve to filter the exhaust gas before it is discharged to the ambient environment.
For flow control, the pump speed is adjusted with pulse-width modulation (PWM) so that just the right amount of electrical power is supplied to each pump to maintain the flow rate at the set-point. The pump speed is typically much lower than full capacity, which reduces the energy consumption and prolongs pump life. The nominal flow rates and control accuracies for the WPS™ are summarized in Table 1.
Liu et al., Aerosol and Air Quality Research, 10: 125–139, 2010 127
Fig. 1. Schematic flow diagram of the WPS™.
Table 1. WPS sample and sheath flow rates.
Flow Loop Flow Rate (L/min)
Accuracy(L/min)
LPS sample flow 0.700 ±0.02 LPS sheath flow 3.00 ±0.06
DMA and CPC sample flow 0.300 ±0.01 DMA sheath flow 3.00 ±0.06
Differential Mobility Analyzer The differential mobility analyzer in the WPS™ has a
cylindrical geometry with an annular space for the laminar aerosol and sheath air flows. The critical DMA dimensions (D1 = 4.445 cm, D2 = 3.175 cm and L = 12.25 cm) were optimized to obtain size classification of particles between 10 and 500 nm with a minimum voltage of 10 volts and a maximum voltage of 9,000 volts between the inner electrode and outer casing when operating with a sheath flow rate of 3-L/min. An absolute pressure transducer and a thermistor are installed in the sheath flow inlet on the DMA to measure the internal DMA pressure and temperature. These parameters are used for pressure and temperature compensation to provide accurate DMA mobility and particle size determination. All the flow ports (with the exception of the aerosol inlet port) and the high-voltage connector are located in the DMA base. The DMA can be operated in the traditional voltage stepping mode or in the voltage scanning mode (Wang and Flagan, 1990).
Condensation Particle Counter The condensation particle counter (CPC) shown in Fig. 2
is used to measure the number concentration of mobility-
classified particles from the aerosol exit port of the DMA. The CPC is of the thermal diffusion type, with a
saturator maintained at 35°C. The aerosol particles are mixed with butanol vapor in the saturator before entering the condenser, which is maintained at 10°C. The butanol vapor then condenses on the particles making them grow to a large enough size for optical detection. The condenser exit is connected to the CPC optics block, maintained at 40°C, in which the droplets formed in the condenser traverse a laser beam and scatter light detected by a photo-detector. Light-scattering pulses generated by analog detection electronics are then converted to digital form and counted by the CPC counter board. A feedback flow control system maintains the CPC flow rate at a constant value of 0.30 L/min. The aerosol exiting the CPC is mixed with clean dilution air at a flow rate of about 2 L/min before it is transported to the exhaust port on the back panel of the instrument.
The CPC has a dual-reservoir design: one for storage of the working fluid (1-butanol) and the other for the condensate fluid. The condensate reservoir collects liquid that condenses on the walls of the condenser that includes condensed butanol vapor and moisture present in humid air.
Laser Particle Spectrometer The Laser Particle Spectrometer (LPS) shown in Fig. 3 is
a single-particle, wide-angle optical sensor to detect particles from ~0.4 to 10 μm in diameter. Particles are drawn into the aerosol inlet at a flow rate of 0.70 L/min and focused with a 3-L/min flow of sheath air towards the center of a ribbon-shaped laser beam generated by a laser diode (785 nm wavelength, 5 mW operating power). Light scattered by each particle is collected with a spherical mirror

Liu et al., Aerosol and Air Quality Research, 10: 125–139, 2010 128
Fig. 2. Condensation particle counter.
Fig. 3. Laser particle spectrometer.

Liu et al., Aerosol and Air Quality Research, 10: 125–139, 2010 129
over a 20-to-100° range of scattering (polar) angle and projected onto a red-enhanced photomultiplier tube (PMT). In response, the PMT generates a pulse of electrical current which is converted into voltage by the LPS preamplifier board.
The LPS amplifier board conditions each light-scattering pulse from the preamplifier board for input into the next stage of electronics in which pulses are binned, i.e. sorted according to their amplitudes.
The optical response of the LPS is dependent upon particle refractive index. However, due to the wide-angle collection optics of the LPS, its response is monotonic with respect to particle size within a moderate range of particle refractive indices. This characteristic allows light-scattering measurements to be converted to geometric diameters based upon an assumed value of the refractive index. In the embedded software in the WPS, the real refractive index n may be selected from a range of 1.30 to 1.60 (including n = 1.585 for PSL) for setting thresholds that are used in binning pulses with respect to diameter. The user may select the particle refractive index most appropriate for the aerosol sample to obtain more accurate measurements of geometric diameters. A set of threshold values (in volts) is generated for a pre-determined set of bin diameters for the selected n based upon theoretical scattered intensities and gain factors programmed in the embedded software configuration utility. In the offline analysis software, the size distribution measured with a particular assumed value of refractive index (set in the embedded software) can be converted to a different diameter scale by changing the value of the refractive index. New bin diameters are inverted from the intensity-based threshold values using scattering theory. Bin counts remain the same; only the bin diameters are changed.
Signal Processing and Control Electronics The WPS hardware system is controlled with proprietary
software executed by a low-power Pentium® single-board computer operating on the Windows® XP platform.
The computer interfaces with analog and digital I/O boards using one RS-485 serial communication port. These boards provide the necessary electronic interface to monitor and control all the operating parameters of the instrument (i.e. flow rates, temperatures, voltage, laser current, liquid levels, etc).
The WPS also allows the user to operate the instrument from a remote location by using either a wireless or a LAN Ethernet connection. This remote control capability allows the user to monitor all the WPS operating parameters, to run the instrument remotely, to see the measurement results in real-time, and to download the raw data files to the remote computer.
DIFFERENTIAL MOBILITY ANALYZER
The DMA has been evaluated experimentally using the TDMA (Tandem Differential Mobility Analysis) technique. A schematic diagram of the experimental setup used for this evaluation is shown in Fig. 4. Sodium chloride aerosols were generated by atomizing a 0.1% w/v solution of NaCl in DI water. The droplet aerosol was then mixed with dry dilution air and neutralized with a Po-210 neutralizer. The first DMA was used to produce a narrow electrical mobility distribution from a broad distribution by operating it at a constant voltage. The second DMA was used to measure the mobility distribution as a function of voltage. The particle concentration was measured at the exit of both DMAs. A four-way cross-over valve was used to switch between sample aerosols from the two DMAs,
Fig. 4. Experimental setup for TDMA measurements.

Liu et al., Aerosol and Air Quality Research, 10: 125–139, 2010 130
the concentrations of which were measured by a CPC. The particle concentration measured at the exit of the second DMA was normalized with respect to the particle concentration at the exit of the first DMA.
Differential Mobility Analyzers are characterized by the transfer function (Knutson et al., 1975; Stolzenburg, 1988). For nondiffusive particles the traditional triangular-shaped transfer function derived by Knutsen et al. works well, while for highly diffusive particles a Gaussian-shaped transfer function, such as the one derived by Stolzenburg, provides a better theoretical model that takes into account the broadening effect induced by particle diffusion. Two parameters are needed to describe any of these DMA transfer functions (i.e. triangular or Gaussian), and the most common choices for these parameters are the peak height (h) and the full width at half maximum height (FWHM).
We adopted the deconvolution scheme described by Martinsson et al. (2001) to retrieve the experimental DMA transfer function from the tandem (TDMA) experimental data. The resulting deconvoluted DMA transfer function includes the effects of all instrument non-idealities associated with the performance of real DMAs, mainly the broadening effect due to diffusion and to instrument imperfections (i.e. flow effects, electrode geometry, etc), and the size-dependent DMA particle losses.
TDMA measurements were made for particle diameters ranging from 5 nm to 400 nm with two identical DMAs operating at Qs = 3.10 L/min sheath air and Qa = 0.31 L/min aerosol flow. After obtaining the DMA transfer function for each particle size using the noted deconvolution scheme, the area under the curve was integrated to determine the transmission efficiency of the DMA. Fig. 5 shows the area of the DMA transfer function, normalized by that of the non-diffusive transfer function (Knutson and Whitby, 1975). The normalized area varies from 0.4 at 10 nm to about 0.9 for particles larger than 50 nm. This trend is consistent with increasing diffusional losses as the particle diameter is decreased. From the deconvoluted transfer function we also determined the mobility resolution of the DMA, which is defined as the ratio of the peak electrical mobility to the FWHM height. Using the diffusive transfer function of Stolzenburg (1988), Flagan (1999) proposed the following relationship to calculate the theoretical DMA mobility resolution:
21
22 6R (1)
Where is the DMA flow ratio (i.e. aerosol flow rate divided by the sheath air flow rate assuming that both aerosol flow rates are the same) and is the diffusion parameter as defined by Stolzenburg (1988). Fig. 6 shows the experimentally obtained DMA resolution (calculated from the deconvoluted transfer function peak height and FWHM) and the theoretical DMA resolution calculated from Eq. (1). From this figure, it is evident that the DMA has lower mobility resolution than what is theoretically possible. The measured DMA mobility resolution varies
Fig. 5. Normalized area of the DMA transfer function.
Fig. 6. Measured and theoretical (solid line) DMA mobility resolution.
from 1.3 at 10 nm to about 7 for particles larger than 100 nm. The discrepancy is most likely attributed to flow effects, mainly the way in which the sheath air flow is introduced at the top of the DMA (very compact flow passage followed by a laminarization screen that may not work as well as expected). It is worth mentioning that the diameter-based resolution is larger than the mobility resolution for particles in the transition and free-molecular regimes (Flagan, 1999). While the DMA performance is not ideal, if the measured size-dependent transfer functions are incorporated in the data reduction algorithm, the mobility-based size distribution measurement will be adequate for the majority of practical applications. This has been demonstrated in a recent performance comparison study of scanning electrical mobility spectrometers (Rodrigue et al., 2007).
Calibration and Standardization of the DMAIn general, particle size is directly related to the DMA
operating conditions by an explicit equation derived from well-known principles (Knutson and Whitby, 1975). Depending on the particular design of a DMA, however, the effects of non-uniformities in the electric field at the two ends of the center rod (i.e., “end effects”) may require

Liu et al., Aerosol and Air Quality Research, 10: 125–139, 2010 131
the introduction of a near-unity correction factor to ensure accurate prediction of the mean mobility diameter from the operating equation. Therefore, we have implemented a DMA calibration factor to obtain better agreement between NIST standard reference material (SRM) certified particle size and particle size reported by the WPS.
The electrical mobility of singly charged particles exiting the DMA is calculated by the following equation,
LVQ
DCeZ s
pp 2
)r/r(ln3
121 (2)
where: e is the elementary unit of charge Zp1 is the electrical mobility of the singly-charged
particle C is the slip correction factor (calculated from
expression by Rader (1990)) Dp is the particle diameter
is the gas viscosity Qs is the DMA sheath air flow rate r1, r2 are the DMA inner and outer radii L is the DMA precipitating length V is the DMA voltage applied to the center rod
When classifying standard reference particles of a known certified diameter the mobility of the particles is known and the voltage corresponding to the centroid of the mobility distribution is determined from the measurement. The ratio between the measured centroid voltage V* and the calculated voltage V (from DMA theory) can be defined as the DMA calibration factor:
VVCF
*
(3)
In practice, V* is generally greater than the value V predicted from Equation 3 and therefore CF > 1. When the DMA is sizing particles of unknown diameter, the following equation can be used to calculate the particle diameter, which is traceable to the NIST standard reference material used to determine the DMA calibration factor,
*** *)()(1
pp
pp D
DCDC
CFD (4)
where: Dp is the particle diameter traceable to NIST Dp
* is the particle diameter calculated from Equation 2 i.e., for an ‘ideal’ DMA (CF = 1.0)
C(Dp) is the slip correction factor for Dp
C*(Dp*) is the slip correction factor for Dp
*
CF is the DMA calibration factor (calculated from Eq. (3))
Fig. 7 shows the particle concentration as a function of
voltage for 269 nm standard reference PSL spheres from NIST (i.e. SRM 1691). The box in the figure shows the measured and calculated voltages for these PSL spheres and the corresponding DMA calibration factor (CF = 1.03). When measuring unknown aerosols the use of the calibration factor provides particle diameter traceability to NIST standards. This calibration factor is nearly independent of particle size as long as the DMA operating parameters remain unchanged when operating the WPS. This has been demonstrated experimentally by measuring several NIST traceable spheres and comparing the corrected mean mobility diameter with the diameter reported by the manufacturer. Table 2 shows the measured particle diameters of several PSL spheres between 70 and 500 nm showing good agreement between the measured and the certified particle diameters. The measured DMA mean diameter and standard deviation of the size distribution are from a best-fit Gaussian distribution applied to the WPS raw data. In all cases, the percentage error is within ±2%.
It is important to note that the NIST traceable calibration method essentially eliminates potential small systematic errors in flow measurement, and uncertainties in the measured geometric dimensions of the device, including imperfections in straightness and concentricity. As part of the NIST traceable calibration method, estimates of uncertainties are made to arrive at an overall uncertainty in the measured particle size.
CONDENSATION PARTICLE COUNTER
The condenser section of the condensation particle counter has been theoretically modeled by solving the Navier-Stokes equations for the flow field, the energy equation for the temperature field, and the convective-diffusion equation for the butanol vapor. These equations were solved numerically using a commercially available
Fig. 7. Concentration versus voltage for NIST SRM 1691 (269 nm PSL).

Liu et al., Aerosol and Air Quality Research, 10: 125–139, 2010 132
Table 2. Comparison of measured particle diameters with PSL reported diameters.
Reported PSL Certified Diameter (nm)
Reported PSL Size
Distribution Standard Deviation (nm)
PSL Supplier NISTTraceability
MeasuredDMA Mean
Diameter
Measured DMA Size Distribution
Standard Deviation (nm)
PercentageError(%)
73 ± 2.6 5.7 Duke Scientific YES 74.4 1.9 100.7 ± 1 2.2 NIST YES 102.7 6 2.0 152 ± 5 3.1 Duke Scientific YES 154.6 9 1.7 199 ± 6 3.4 Duke Scientific YES 201.3 10 1.2 269 ± 7 3 NIST YES 271 12 0.7
329 7 Duke Scientific NO 322.7 16 –1.9 426 9 Duke Scientific NO 428.5 24 0.6
CFD software package (COMPACT-3D, Innovative Research Inc., Plymouth, MN) with the appropriate boundary conditions. The butanol vapor saturation profile was determined for the condenser section at the normal operating conditions.
Fig. 8 shows the contours of constant saturation in the condenser section when the CPC is operated at 35°C in the saturator and 10°C in the condenser with a flow rate of 0.30-L/min. The maximum supersaturation occurs on the axis of the condenser at about one third of its total length. Fig. 9 shows the contours of constant Kelvin diameter (i.e. the droplet diameter that will neither grow nor evaporate at a given saturation ratio) in the condenser section. The calculations predict that this CPC is capable of activating particles to a lower limit of 4 nm in particle diameter.
The CPC has been evaluated experimentally to determine its relative counting efficiency as a function of particle size. This was done by comparing the particle concentration of the CPC with the particle concentration measured with another CPC (TSI Model 3025 CPC). For these measurements monodisperse aerosols of silver were generated and classified by a DMA. The ultrafine silver particles were generated using the technique of Scheibel and Porstendorfer (1983). Fig. 10 shows the relative counting efficiency of the WPS CPC from which we can determine that the 50% cutoff size is about 5 nm, which is below the 10 nm lower limit for the WPS.
Fig. 8. Contours of equal saturation for the condenser section of the CPC (x is the axial coordinate along the condenser tube and r is the radial coordinate of the condenser tube cross section).
Fig. 9. Contours of equal Kelvin diameter for the condenser section of the CPC (x is the axial coordinate along the condenser tube and r is the radial coordinate of the condenser tube cross section).
Fig. 10. Relative counting efficiency of the CPC compared with that of the TSI 3025 UCPC.
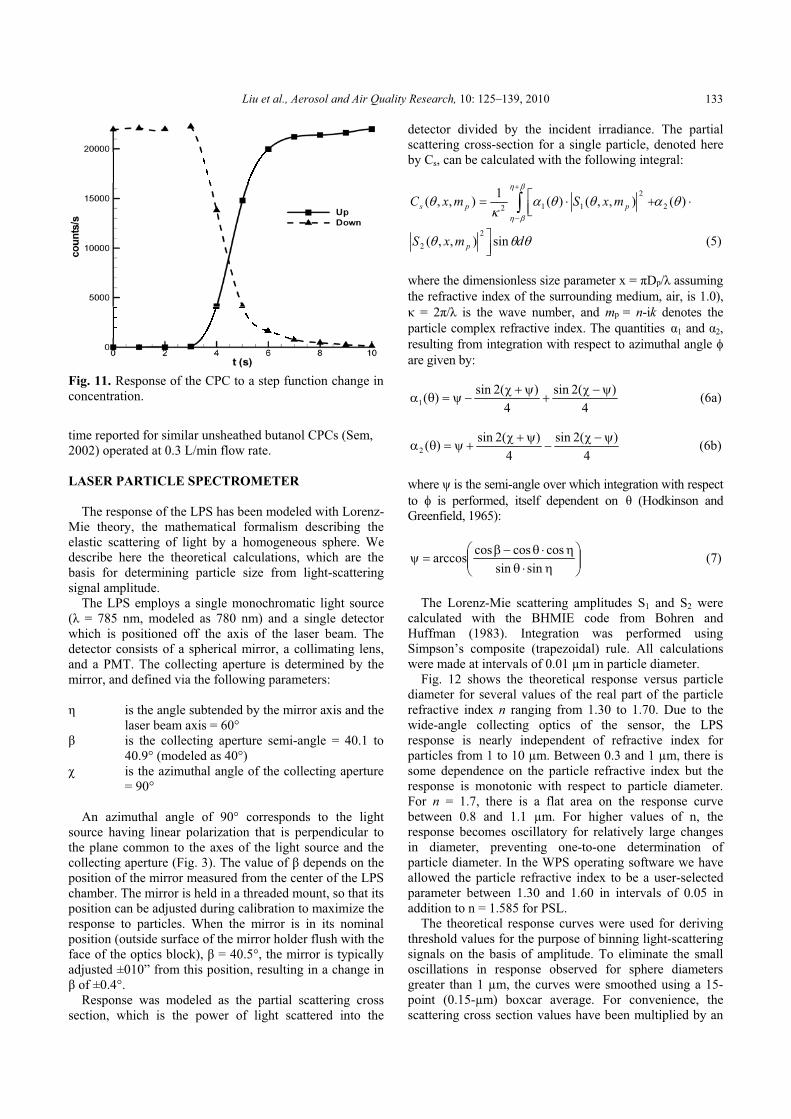
The response t ime of the CPC was measured experimentally by connecting the CPC to two branches with solenoid valves. One branch was open to room air and the other to a high efficiency filter. The CPC was allowed to reach steady-state concentration from one branch, and then the solenoid valves were switched to measure the response to the simulated step change in concentration. The measured response of the CPC to a step function change in particle concentration is shown Fig. 11. Whether the concentration is increasing or decreasing, the response time is about 4 seconds, which is similar to the response
Liu et al., Aerosol and Air Quality Research, 10: 125–139, 2010 133
Fig. 11. Response of the CPC to a step function change in concentration.
time reported for similar unsheathed butanol CPCs (Sem, 2002) operated at 0.3 L/min flow rate.
LASER PARTICLE SPECTROMETER
The response of the LPS has been modeled with Lorenz-Mie theory, the mathematical formalism describing the elastic scattering of light by a homogeneous sphere. We describe here the theoretical calculations, which are the basis for determining particle size from light-scattering signal amplitude.
The LPS employs a single monochromatic light source ( = 785 nm, modeled as 780 nm) and a single detector which is positioned off the axis of the laser beam. The detector consists of a spherical mirror, a collimating lens, and a PMT. The collecting aperture is determined by the mirror, and defined via the following parameters:
is the angle subtended by the mirror axis and the laser beam axis = 60°
is the collecting aperture semi-angle = 40.1 to 40.9° (modeled as 40°)
is the azimuthal angle of the collecting aperture = 90°
An azimuthal angle of 90° corresponds to the light source having linear polarization that is perpendicular to the plane common to the axes of the light source and the collecting aperture (Fig. 3). The value of depends on the position of the mirror measured from the center of the LPS chamber. The mirror is held in a threaded mount, so that its position can be adjusted during calibration to maximize the response to particles. When the mirror is in its nominal position (outside surface of the mirror holder flush with the face of the optics block), = 40.5°, the mirror is typically adjusted ±010” from this position, resulting in a change in
of ±0.4°. Response was modeled as the partial scattering cross
section, which is the power of light scattered into the
detector divided by the incident irradiance. The partial scattering cross-section for a single particle, denoted here by Cs, can be calculated with the following integral:
)(),,()(1),,( 22
112 pps xSxC mm
dxS p sin),,(2
2 m (5)
where the dimensionless size parameter x = Dp/ assuming the refractive index of the surrounding medium, air, is 1.0), = 2 / is the wave number, and mp = n-ik denotes the
particle complex refractive index. The quantities 1 and 2,resulting from integration with respect to azimuthal angle are given by:
4)(2sin
4)(2sin)(1 (6a)
4)(2sin
4)(2sin)(2 (6b)
where is the semi-angle over which integration with respect to is performed, itself dependent on (Hodkinson and Greenfield, 1965):
sinsincoscoscosarccos (7)
The Lorenz-Mie scattering amplitudes S1 and S2 were calculated with the BHMIE code from Bohren and Huffman (1983). Integration was performed using Simpson’s composite (trapezoidal) rule. All calculations were made at intervals of 0.01 μm in particle diameter.
Fig. 12 shows the theoretical response versus particle diameter for several values of the real part of the particle refractive index n ranging from 1.30 to 1.70. Due to the wide-angle collecting optics of the sensor, the LPS response is nearly independent of refractive index for particles from 1 to 10 μm. Between 0.3 and 1 μm, there is some dependence on the particle refractive index but the response is monotonic with respect to particle diameter. For n = 1.7, there is a flat area on the response curve between 0.8 and 1.1 μm. For higher values of n, the response becomes oscillatory for relatively large changes in diameter, preventing one-to-one determination of particle diameter. In the WPS operating software we have allowed the particle refractive index to be a user-selected parameter between 1.30 and 1.60 in intervals of 0.05 in addition to n = 1.585 for PSL.
The theoretical response curves were used for deriving threshold values for the purpose of binning light-scattering signals on the basis of amplitude. To eliminate the small oscillations in response observed for sphere diameters greater than 1 μm, the curves were smoothed using a 15-point (0.15-μm) boxcar average. For convenience, the scattering cross section values have been multiplied by an

Liu et al., Aerosol and Air Quality Research, 10: 125–139, 2010 134
arbitrary scaling factor of 109. In Fig. 13, the smoothed and scaled curves are shown for n = 1.3 to 1.6 from which the threshold values were determined. Each LPS response curve has been subdivided into 24 particle diameter channels or bins. Diameters were chosen to provide relatively equal spacing in response, on a logarithmic scale.
The average ratio of the threshold of a bin and the threshold of the next lowest bin is 1.34. The average is over 23 such ratios for a given refractive index value and for the eight refractive index values from n = 1.3 to 1.6, including that of PSL (n = 1.585). The minimum and maximum ratios among the bins are 1.12 and 1.70, on average, for the eight refractive index values. As a result of this scheme, the spacing in terms of diameter is narrower for submicron particles than it is for micron-size and supermicron particles.
To confirm the theoretical response of the LPS,
experiments were performed with NIST-traceable PSL spheres classified by a DMA. Table 3 shows the response characteristics of an LPS which were measured with an oscilloscope connected to the LPS Amplifier PCB monitor outputs (low-gain and high-gain channels) for several PSL particle diameters. The average peak-to-baseline output from the low-gain and high-gain channels are given in columns 2 and 4, as measured with the oscilloscope trigger settings listed in columns 3 and 5, respectively. The average ratio of high-gain response to low-gain response for the five common PSL sphere diameters is 41. The LPS Amplifier PCB is adjusted during factory calibration to obtain a ratio of 40. The last column shows the regression coefficients of the best-fit linear fit between the pulse amplitude voltages and the theoretical scattering cross-sections for each gain channel. The slope values from the regressions are used to scale low-gain and high-gain threshold values to calibrate the LPS,
Fig. 12. Theoretical LPS response as a function of real refractive index n.
Fig. 13. Smoothed and scaled LPS response curves (solid lines) and bin threshold values.

Liu et al., Aerosol and Air Quality Research, 10: 125–139, 2010 135
Table 3. Experimental response of the LPS: signals measured from the monitor outputs of the Amplifier.
Low-Gain Amp High-Gain Amp Theoretical Scattering Cross Sections
Amplifier Gain Factor Regression
PSL Dp
(μm) Scope
Ave. (V) Trigger
Level (V) Scope*
Ave. (V) Trigger
Level (V) Dp (μm) Csca (cm2)
0.302 N/A N/A N/A 0.072 0.30 7.884 × 10⁻¹¹Low Gain Amp
0.341 0.0026 N/A 0.112 0.072 0.34 1.552 × 10⁻¹⁰ Slope: 1.34 × 10⁷
0.430 0.0090 N/A 0.352 0.072 0.43 5.336 × 10⁻¹⁰ Intercept: 1.21 × 10⁻²
0.500 0.0152 N/A 0.600 0.072 0.50 8.95 × 10⁻¹⁰ R2: 0.996 0.602 0.0262 N/A 1.05 0.100 0.60 1.419 × 10⁻⁹
0.908 0.0580 N/A 2.46 0.100 0.91 3.044 × 10⁻⁹ High Gain Amp
1.517 0.0800 0.005 N/A N/A 1.52 4.379 × 10⁻⁹ Slope: 8.25 × 10⁸
2.00 0.101 0.06 N/A N/A 2.00 5.677 × 10⁻⁹ Intercept: –8.31 × 10⁻²
4.00 0.412 0.2 N/A N/A 4.00 3.02 × 10⁻⁸ R2: 0.997 * 128-point box-car average measurement of pulse amplitude measured from the peak of the pulse to the baseline using a digital storage oscilloscope with AC coupling and the indicated trigger level setting.
although the intercept values are normally set to zero. Fig. 14 shows the measured pulse amplitude outputs as a function of particle diameter and also shows the scaled theoretical response for PSL spheres (i.e. n = 1.585). The agreement between the theoretical and experimental responses is very good, confirming the validity of the predicted response.
The counting efficiency of the LPS as a function of particle diameter has also been determined experimentally with PSL spheres. Fig. 15 shows a schematic diagram of the experimental setup used for these experiments. Suspensions of PSL spheres ranging from 0.4 m to 4 m were generated with a Collison-type atomizer, dried with clean dry air, and neutralized with a Po-210 neutralizer. For PSL spheres below 1.4 m, the PSL spheres were also classified with an MSP Long DMA (classification length = 89.2 cm) operated at the voltage required to classify the singly-charged monomers of the PSL spheres. The PSL spheres were then introduced to the LPS and to a reference particle counter. For PSL spheres smaller than 0.5 m, the number size distribution was measured with another WPS operating in
Fig. 14. Theoretical and experimental LPS response.
the DMS (differential mobility spectrometer) mode and the total number concentration was determined by integration of the measured number size distribution. For PSL spheres between 0.5 m and 4 m an Aerodynamic Particle Sizer (TSI Model 3320) was used as the reference counter.
Fig. 16 shows the LPS experimental counting efficiency curve as a function of particle diameter. For this particular LPS, the counting efficiency curves rises sharply from 57% at 0.40 m to 96% at 0.50 m. PSL spheres between 0.5 m and 4 m show counting efficiencies of nearly 100%. The lower detection limit (LDL), corresponding to 50% counting efficiency, is estimated to be 0.37 m for PSL. For particles with lower values of refractive index (n< 1.585), the LDL is greater. For example, based upon the smoothed theoretical response of the LPS, the LDL is estimated to be 0.42 m for n = 1.45, which is the mid-point of the selectable range of n, and 0.51 m for n = 1.30, which is the lowest selectable value of n.
Although the user may select the refractive index in the embedded software, thereby selecting the most appropriate threshold values for size measurement, the selected refractive index may differ from the actual refractive index of the particles being measured, resulting in erroneous sizing. Sources of the error in assumed n include discretization of n in the software ( n = 0.05), variation in particle chemical composition resulting in variation of n,and general uncertainty about particle composition and/or particle refractive index. To illustrate the effect of the error in assumed refractive index on sizing, we assume a true refractive index for sampled particles of n = 1.45 and estimate the change in measured size for submicron particles for refractive index errors of ±0.05 and ±0.10. The sizing errors, which are based upon smoothed theoretical response (i.e., curves such as those shown in Fig. 13), are listed in Table 4 for the four erroneous refractive index values. For assumed uncertainties in refractive index of ±0.05, the sizing errors are modest: +5.9% for an assumed value of n = 1.40, averaged for actual diameters ranging from 0.4 to 1.0 m, and –4.5% for an assumed value of n = 1.50. Therefore, if the user can

Liu et al., Aerosol and Air Quality Research, 10: 125–139, 2010 136
Fig. 15. LPS Counting efficiency experimental setup.
Fig. 16. LPS counting efficiency.
determine a priori the effective refractive index of the particles being sampled within ±0.05, reasonably accurate sizing can be achieved with the LPS.
Examples of Aerosol Size Distributions Measured with the WPS
We have measured several aerosol size distributions with the WPS to give the reader an idea of several possible applications for using this instrument.
Atmospheric Aerosols One of the most common applications for the WPS is the
monitoring of atmospheric aerosol size distributions, both in urban polluted environments and in pristine environments (e.g. protected National Parks). For this application the WPS is particularly useful as it can be used with semi-continuous sampling schedules to measure the time-evolution of the aerosol size distribution. This type of monitoring allows
detection of the presence of nucleation events, whether they are of natural or anthropogenic origin (Woo et al., 2001). Fig. 17 shows a sequence of four 1-minute long size distribution measurements taken at noon in a highly-congested urban setting. Frame (a) shows the size distribution of the typical atmospheric aerosol during that part of the day. In frame (b) a nucleation event takes place giving a high aerosol concentration at 10 nm. In frame (c) the freshly nucleated aerosol agglomerates to larger sizes. In frame (d) the aerosol size distribution returns to the original one shown in frame (a).
Laboratory Generated Aerosols One common application in any aerosol research facility
is the generation of test aerosols, usually to determine the particle size dependence of a particular device. The test particles can be polydisperse or monodisperse, depending on the type of application. In many instances it is important to verify (e.g. particles generated by a Vibrating Orifice Aerosol Generator) or to experimentally determine the particle size of the generated aerosol (e.g. electrospray aerosol), and for this purpose the WPS is an instrument that can give this information with excellent particle sizing accuracy and resolution. Fig. 18 shows the aerosol number distribution of a mixture of smoke and oleic acid aerosols (e.g. a bimodal distribution). Fig. 18 clearly shows the two peaks associated with each type of aerosol. The clear bars represent the DMA-CPC data while the dark bars represent the LPS data. A good match between the DMA-CPC data and the LPS data is apparent.
Metered-dose Inhaler Aerosol Metered-dose inhalers are used mainly for delivering
therapeutic drugs for treating asthma. These devices are

Liu et al., Aerosol and Air Quality Research, 10: 125–139, 2010 137
Table 4. Errors in particle size measured by the LPS induced by uncertainties in particle refractive index.
Actual n = 1.45 Assumed n = 1.35 Assumed n = 1.40 Assumed n = 1.50 Assumed n = 1.55Actual Meas.* Rel. Err. Meas. Rel. Err. Meas. Rel. Err. Meas. Rel. Err.
Dp (μm) Dp (μm) in Dp Dp (μm) in Dp Dp (μm) in Dp Dp (μm) in Dp
0.40 0.45 12.5% 0.42 5.0% 0.38 –5.0% 0.37 –7.5%0.50 0.57 14.0% 0.53 6.0% 0.47 –6.0% 0.45 –10.0%0.60 0.69 15.0% 0.64 6.7% 0.57 –5.0% 0.54 –10.0%0.70 0.80 14.3% 0.74 5.7% 0.67 –4.3% 0.64 –8.6%0.80 0.92 15.0% 0.85 6.2% 0.76 –5.0% 0.73 –8.8%0.90 1.02 13.3% 0.95 5.6% 0.87 –3.3% 0.84 –6.7%1.00 1.15 15.0% 1.06 6.0% 0.97 –3.0% 0.98 –2.0%Ave. Rel. Error: 14.2% 5.9% –4.5% –7.6%
* Peak diameter hypothetically measured with software selection of the assumed refractive index.
Fig. 17. Example of an atmospheric nucleation event: (a) Before nucleation (b) During nucleation event (c) Aglomeration of freshly nucleated aerosol (d) Return to the pre-nucleation size distribution.
regularly tested with cascade impactors to measure the aerosol mass distribution of the active drug (Dolovich and Smaldone, 1999). These tests are time-consuming because
the particle deposits need to be quantified after the sample has been collected. During the development of these pharmaceutical inhalers it is important to be able to make

Liu et al., Aerosol and Air Quality Research, 10: 125–139, 2010 138
fast measurements of the aerosol size distribution, to optimize the aerosol delivery system, and therefore to ensure the proper sizing of the drug cloud. In these cases an instrument like the WPS can provide near real-time size distribution measurements that can cover the typical inhalable aerosols created by these aerosol delivery devices. Fig. 19 and Fig. 20 show the aerosol number and mass distributions of an aerosol generated from a metered-dose inhaler. Again, these figures show a good match between the DMA-CPC data and the LPS data, demonstrating that it is possible to combine different aerosol measurement techniques successfully to measure a broad size distribution.
Fig. 18. Aerosol number size distribution of smoke and oleic acid. Clear bars represent the DMA/CPC data. Dark bars represent the LPS data.
Fig. 19. Aerosol number size distribution of a metered-dose inhaler.
Fig. 20. Aerosol mass size distribution of a metered-dose inhaler.
REFERENCES
Barnard, J.C., and Harrison, L.C. (1988). Monotonic Responses from Monochromatic Optical Particle Counters. Appl. Opt. 27: 584–592.
Birmili, W., Stratmann, F., Wiedensholer, A., Covert, D., Russell, L.M. and Berg, O. (1997). Determination of Differential Mobility Analyzer Transfer Functions Using Identical Instruments in Series. Aerosol Sci. Technol. 27: 215–223.
Bohren, C.F. and Huffman, D.R. (1983). Absorption and Scattering of Light by Small Particles, John Wiley, New York.
Dolovitch, M. and Smaldone, G.C. (1999). Estimating the Particle Size Characteristics of Therapeutic Aerosols. J. Aerosol Med. 12: 215–216.
Flagan, R.C. (1999). On Differential Mobility Analyzer Resolution. Aerosol Sci. Technol. 30: 556–570.
Hodkinson, J.R. and Greenfield, J.R. (1965). Response Calculations for Light-Scattering Aerosol Counters and Photometers. Appl. Opt. 4: 1463–1474.
Knutson, E.O. and Whitby, K.T. (1975). Aerosol Classification by Electrical Mobility: Apparatus, Theory and Applications. J. Aerosol Sci. 6: 443–451.
Liu, B.Y.H, Pui, D.Y.H. and Whitby, K.T. (1974). A Portable Electrical Analyzer for Size Distribution Measurement of Submicron Aerosols. J. Air Pollut. Contr. Assoc. 24: 1067–1072.
Liu, B.Y.H., Pui, D.Y.H., Whitby, K.T. Kittelson, D.B., Kousaka, Y. and McKenzie, R.L. (1978). The Aerosol Mobility Chromatograph: A New Detector for Sulfuric Acid Aerosols. Atmos. Environ. 12: 99–104.
Liu, B.Y.H., Pui, D.Y.H. and Lin, B.Y. (1986). Aerosol Charge Neutralization by a Radioactive Alpha Source. Particle Characterization 3: 111–116.
Liu, B.Y.H., Szymanski, W.W. and Ahn, K.H. (1985). On Aerosol Size Distribution Measurement by Laser and

Liu et al., Aerosol and Air Quality Research, 10: 125–139, 2010 139
White Light Optical Particle Counters. J. Environ. Sci.28: 29–24.
Martinsson, B. Karlsson, M.N.A. and Frank, G. (2001). Methodology to Estimate the Transfer Function of Individual Differential Mobility Analyzers. Aerosol Sci. Technol. 35: 815–823.
Pui, D.Y.H. and Liu, B.Y.H. (1975). On the Performance of the Electrical Aerosol Analyzer. J. Aerosol Sci. 6: 249–264.
Rader, D.J. (1990). Momentum Slip Correction Factor for Small Particles in Nine Common Gases. J. Aerosol Sci.21: 161–168.
Rodrigue, J., Ranjan, M., Hopke, P.K. and Dhaniyala, S. (2007). Performance Comparison of Scanning Electrical Mobility Spectrometers. Aerosol Sci. Technol. 41: 360–368.
Sem, G.J. (2002). Design and Performance Characteristics of Three Continuous-Flow Condensation Particle Counters: A Summary. Atmos. Res. 62: 267–294.
Scheibel, H.G. and Porstendorfer, J. (1983). Generation of Monodisperse Ag- and NaCl- Aerosols with Particle Diameters between 2 and 300 nm. J. Aerosol Sci. 14: 113–126.
Stolzenburg, M.R. (1988). An Ultrafine Aerosol Size Distribution Measuring System, Ph.D. Thesis, University of Minnesota, MN.
Wang, S.C. and Flagan, R.C. (1990). Scanning Electrical Mobility Spectrometer. Aerosol Sci. Technol. 13: 230–240.
Whitby, K.T. and Clark, W.E. (1966). Electrical Aerosol Particle Counting and Size Distribution Measuring System for the 0.015 to 1 m Size Range. Tellus. 18: 573–586.
Whitby K.T., Clark, W.E. and Marple, V.A. (1975) Characterization of California Aerosols-I. Size Distribution of Free Aerosol. Atmos. Environ. 9: 463–483.
Woo, K.S., Chen, D.R. Pui, D.Y.H. and McMurry, P.H. (2001). Measurement of Atlanta Aerosol Size Distributions in the 3 nm to 2 μm Diameter Range. Aerosol Sci. Technol.34: 75–87.
Received for review, October 5, 2009 Accepted, November 30, 2009