laser-induced damage initiated on the surface of particle...
TRANSCRIPT

UCRL-LR-130583
Laser-induced Damage Initiated on the Surface of Particle Contamina-
tion Fused Silica at 1064nm
Kenneth Jerome Francis Michlitsch (B.S. Thesis)
June 19%
,
I !

DISCLAIMER
This document was prepared as an account of work sponsored by an agency of the United States Government. Neither the United States Government nor the University of California nor any of their employees, makes any warranty, express or implied, or assumes any legal liability or responsibility for the accuracy, completeness, or usefulness of any information, apparatus, product, or process disclosed, or represents that its use would not infringe privately owned rights. Reference herein to any specific commercial product, process, or service by trade name, trademark, manufacturer, or otherwise, does not necessarily constitute or imply its endorsement, recommendation, or favoring by the United States Government or the University of California. The views and opinions of authors expressed herein do not necessarily state or reflect those of the United States Government or the University of California, and shall not be used for advertising or product endorsement purposes.
This report has been reproduced directly from the best available copy,
Available to DOE and DOE contractors from the Office of Scientific and Technical Information
P.O. Box 62, Oak Ridge, TN 37831 Prices available from (615) 576-8401, FTS 626-8401
Available to the public from the National Technical Information Service
U S Department of Commerce 5285 Port Royal Rd.,
Springfield, VA 22161
Work performed under the auspices of the U.S. Department of Energy by Lawrence Livermore National Laboratory under Contract W-7405-ENG-48.

UCRL-LR-130583 Distribution Category UC-700
Laser-induced Damage Initiated on the Surface of Particle Contamina-
tion Fused Silica at 1064nm
Kenneth Jerome Francis Michlitsch (B.S. Thesis)
June 1998
LAWRENCE LIVERMORE NATIONAL LABORATORY University of California l Livermore, California l 94551


Laser-induced Damage Initiated on the Surface of Particle Contaminated Fused Silica Optics at 1061nm
Kenneth Jerome Francis Michlitsch
Submitted to the Department of Mechanical Engineering in Partial Fulfillment of the Requirements
for the Degee of
Bachelor of Science
at the
\tassachusetts Institute of Technology
June 1998
’ 1997 Kenneth Jerome Francis Michlitsch Ail rights reserved
The author hereby gants to MIT permission to reproduce and to distribute publicly paper and electronic copies of this thesis document in whole or in pan-
Signature of Author
December 10. 1997
Certified John H. Lienhard
Associate Professor of LMechanical Engineering Thesis Supervisor
Accepted by . . . .._.....................................-..-...-..........................__..........-.. Derek Rowe11
Professor of Mechanical Engineering Chairman. Undergraduate Thesis Committee

2
Laser-induccti Damage Initiated on the Surface of Particlc Contaminated Fused Silica Optics at 1064nm
bY
Kcnncth Jerome Francis Michlitsch
Submitted 10 the IIepar~ment of Mechanical Engineering in I’arllnl Fulfillment of the Requirements
for the Dcgrcc of Bachelor of Science
ABSTR4CT
4n experimental study \V;IS urldertnhen to quantify the effects of contamination particles on the damage threshold 01 I;lser-illunlirlated fused silica optics and set cleanliness rcquircmcnts for optics on the beam lint of the National Ignition Facility at Laivrcncc Livermore National Laborator!. Circular contamination particles were sputter-deposited onto fused silica LvindoLvs \\ hich ucre then illuminated repetitively using a 1063nm laser. A variety of contanllnnnts were tested including metals. oxides, and organics. Tests were conducted with particles on the input and output surfaces of the window, and the morphological fcaturcs of the damage cvcrc very rcproduciblc. A plasma often ignited at the contamination particle; its intensity was dependent upon the mass of the contaminant. Input surface damage Lvas characteristically more severe than output surface damage. The size of the damaged area scaled with the size of the particle. On a few occasions, catastrophic damage (cracking or ablation of the substrate) initiated on the output surface due to contamination particles on either the input or output surface. From damage growth plots. predictions can be made about the severity of damage expected from contamination particles of known size and material.
Thesis Supervisor: John H Lienhard Title: Associate Professor of Mechanical Engineering
3
TABLE OF CONTENTS
Section Page Number
1 0 INTRODUCTION . . . . . . . . . . . . . . . . . . . . . . . . . . . . . . . . . . . . . . . . . . . . . . . . . . . . . . . . . . . . . . . . . . . . . . . . . . . . . . . . . . . . . . . . . . . . . . . . . . . . . . . . . 4
2 0 EXPERIMENTAL PROCEDURE ..__.... . . . . . . . . . . . . . . . . . . . . . . . . . . . . . . . _ . .._.................................. 7
2.1 Preparation of Contaminated Optics . . . . . . . . . . . . . . . . . . . . . . . . . . . . . . . . . . . . . . . . . . . . . . . . . . . . .._................. 7
2.2 Laser Damage Testing & Characterization . . . . . . . . . . . . . . . . . . . . . . . . . . . . . . . . . . . . . . . . . . . . . . . . . . . . . . . . . . . . . 8
3.0 RESULTS .._.. ._. ., . . . . . . . . . . . . .._.................................................................................... 10
3.1 Input Surface Contamination.. . . . . . . . . . . . . . . . . . . . . . . . . . . . . . . . . . . . . . . . . . . . . . . . . . . . . . . . . . . . . . . . . . . . . . . . . . . . 10
3.1.1 Input Surface Morphologies. . . . . . . . . . . . . . . . . . . . . . . . . . . . . . . . . . . . . . . . . . . . . . . . . . . . . . . . . . . . . . . . . . . . . 11
3.1.2 Input Surface Damage Size . . . . . . . . ,........ . . . . . . . . . . . . . . . . . . . . . . . . . . . . . . . . . . . . . . . . . . . . . . 18
3.2 Output Surface Contamination . . . . . . . . . . . . . . . . . . . . . . . . . . . . . . . . . . . . . . . . . . . . . . . . . . . . . . . . . 25
3.2.1 Output Surface Morphologies. . . . . . . . . . . . .._.................................................... 26
3.2.2 Output Surface Damage Size . . . . . . . . . . . . . . _. . . . . . . . .._.................................... 33
4 0 DISCUSSION . . . . . . . . . . . . . . . . . . . . . . . . . . . . . . . . . . . . . . . . . . . . . . . . . . . . . . . . . . . . . . . . . . . . . . . . . . . . . . . . . . . . . . . . . . . . . . . . . . . . . . . . . . . . . 37
4.1 Uncertainty Analysis.. . . . . . . . . . . . . . . . . . . . . . . . . . . . . . . . . . . . . . . . . . . . . . . . . . . . . . . . . . . . . . . . . . . . . . 37
4.2 Catastrophic Damage . . . . . . . . . . . . . . . . . . . . . . . . . . . . .._.................._.................... 38
5 0 CONCLUSIONS . . . . . . . . . . . . . . . . . . . . . . . . . . . . . . . . . . . . . . . . . . . . . . . . . . . . . . . . . . . . . . . . . . . . . . . . . . . . . . . . .._..__................... 40
6.0 FUTURE.. . . . . . . . . . . . . . . . . . . . . . . . . . . . . . . . . . . . . . . . . . . . . . . . . . . . . . . . . . . . . . . . . . . . . . . . . . . . . . . . .._......................... 42
6.1 Ramping Studies.. . . . . . . . . . . . . . . . . . . . . . . . . . . . . . . . . . . . . . . . . . . . . . . . . . . . . . ._....... . . . . . . . . . ..42
6.2 2pm Dots.. . . . . . . . . . . . . . . . . . . . . . . . . . . . . . . . . . . . . _. . . . . . . . . . . . . . . . _ . . . . . . . . . . . . . . . . . . . . . . . . . . . .42
6.3 NIF Optics . . . . . . . . . . . . . . . . . . . . . . . . . . . . . . . . . . . . . . . . . . . . . . . . . . . . . . . . . . . . . . . . . . . . . . . . . . . . . . . . . . . 43
6.4 355nm Laser Illumination.. . . . . . . . . . . . . . . . . . . . . . . . . . . . . . . . . . . . . . . . . . . . . . . . . . . . . . . . . . . . . . . .43
6.5 Modeling and the Mechanism of Catastrophic Damage . . . . . . . . . . . . . . . . . . . . . . . . . . . . . . 43
7.0 ACKNOWLEDGMENTS . . . . . . . . . . . . . . . . . . . . . . . . . . . . . . . . . . . . . . . . . . . . . . . . . . . . . . . . . . . . . . . . . . . . . 44
8.0 REFERENCES.. . . . . . , . . . . . . . . . . . . . . . . . . . . . . . . . . . . . . . . . . . . . . . . . . . . . . . . . . . . . . . . . . . . . . . . . . . . . . . . .45

4
1. INTRODlJCTION
The use of high fluence lasers to achieve inertial confinement fusion with energy
gain may soon be a reality as efforts are quickly moving forward on both the National
Ignition Facility (NIF) at Lawrence Livermore National Laboratory (LLNL) and the
Laser Megajoule (LMJ) in France. These systems will subject optics to fluences far
above those currently observed on any large system. As designers push fluence levels
ever closer to the damage thresholds of optical components, the need arises to better
understand optical behavior under such intense illumination. Limitations inherent in the
bulk or surface properties of optics can lead to laser-induced damage. Contamination
particles on the surface can aggravate the damage. The survivability of beam line optics
is partially dependent upon the type and size of contamination lying on the optical
surfaces. In order to predict survivability and set cleanliness requirements which balance
cleaning costs against an acceptable optic serviceable lifetime, the effects of surface
contamination must be characterized and quantified.
optics development efforts normally focus on reducin g imperfections and improving
intrinsic properties [ l-3 1. Although contamination effects are known to lower the
damage thresholds of optical components 14-9, 10-161, little work has been done to
quantify or characterize these effects. This article presents the initial results of a study
designed to understand the effects of surface contamination on the survivability and
functional damage threshold of NIF optics. The initial matrix of variables to be studied
included contamination particle material (metals, oxides, organics); particle size, shape,
thickness. mass, and material properties: adherence between the substrate and the
contaminant; laser pulselength and wavelength; substrate material (fused silica,

5
phosphate glass, KDP crystal. multilayer mirrors, polarizers); environment (air vs.
vacuum); fluence level: number of shots: and shot repetition rate.
This article presents the results of all fused silica tests run at 1064nm and at a
constant fluence of GOJ/cm The materials discussed include metals (Al, Ti, stainless
steel, Cu, W, Au), oxides (At,O,. TiO,. ZrO,), and organics (plastic, carbon, Teflon,
hair). The tests conducted \\ere l-on- 1 (sino,\e shot), 20-on-1 (20 shots with 3 seconds
between shots) and S-on- I (600 shots at a repetition rate of 10 Hz). The tests were
conducted at contamination rites on both the input and output surfaces of the fused silica
windows.
An artificial contamination technique was developed in order to allow systematic
control of the test conditions including particle shape and size. l;lrn thick dots were
sputter-deposited through silicon nitride windows onto the fused silica windows. The
dots ranged in size from 10 to 25Ofrm. Contamination particles larger than 250pm were
not studied since it has been shown that obscurations larger than 280/1m will not be
tolerable on NIF optics 1171. To determine whether the damage observed from the
artificial contamination technique closely approximated damage occurring from real
contaminants, the substrates were also tested with high purity Al shavings, and the results
were qualitatively the same as those observed from testing sputtered Al dots.
The following discussion focuses on the morphological features of the laser-induced
damage which was categorized into 3 broad groups: benign, massive, and catastrophic.
Benign damage does not affect the laser performance of the optic with respect to NIF
requirements. Massive damage affects performance beyond acceptable limits set for
NIF. Catastrophic damage is crackin, (J or ablation of the glass which continues to grow

6
with repetitive illumination. The damnse nlorphologies were consistent and reproducible
for particles of different si/c‘s hut qu~le different for particles of different materials and
for contamination on the output surface as opposed to the input surface.
The dependence of damage size on contamination size has been examined in great
detail, and the experimenrnl results are being used to set first-order cleanliness
specifications for NIF optics and quantify the functional damage threshold of fused silica
windows illuminated at 40 J/cm’ by identifyin g the particle sizes which can induce
benign. massive and catastrophic damage.
The report which follo\\s describes the methodology employed during testing in an
experimental procedure scct~on. Results are then presented with an appropriate error
analysis that includes both bias and precision uncertainty. The discussion section
discusses the mechanism of dnma~e and the methodology employed in the error analysis.
Conclusions and recommendations are then provided, and future work in this area of
study is outlined.

7
2. ESPERIhIENTAL PROCEDURE
The experiments were conducted in two major steps which are outlined in Sections 2.1
and 2.2. First, contaminated optics were prepared. Laser damage testing and
characterization was then performed. The optics were contaminated by etching silicon
nitride membranes with circular openings of six different sizes (10, 20,30, 50, 150, and
250/(m). Contaminants were then deposited by sputtering through the membranes onto
fused silica substrates. Jaser damage tests at 1064nm and a fluence of 40J/cm’ were
conducted on the Itlrn thick contaminants deposited on the substrates. Laser-induced
damage initiated at contamination particles on the surface was then characterized by
Nomarski optical microscopy. atomic force microscopy (AFM). and measurements of the
damage size.
2.1 Preparation of Contaminated Optics
Low stress CVD silicon nitride was deposited onto 3” silicon wafers. Small holes
were etched into the nitride on the front side using standard photolithography techniques,
and larger squares were etched on the back. The wafers were then dipped for several
hours in a bath of KOH at 70°C to anisotropicaily etch the silicon and open the windows.
The masks were then placed onto 1.14cm thick UV grade fused silica substrates.
Contaminants were sputter deposited through masks and onto the substrates until the
thickness of the deposit reached ljtm. For the tests conducted with Al shavings (as well
as the limited tests conducted with Teflon, hair, and stainless steel spheres) the samples
were contaminated by breathing on the substrate for adhesion. High purity Al was then
filed over the substrate.

8
2.2 Laser Damage Testing 6; Characterization
The laser damage tests were carried out using an 8.6ns pulse from a 1064nm
Nd:YAG laser. The laser was focused to provide a far field circular Gaussian beam with
a diameter of about 1 mm at I/e’ of the maximum intensity. The beam profile was
recorded for each shot, and the peak fluence was computed. Each site was irradiated
with a sequence of single laser pulses. The tests were conducted in S-polarization at a
near normal incidence of I”. The damage threshold of the surface of the fused silica
samples was tested to establish a baseline: the threshold of the uncontaminated surface
was above SOJ/cm’. The flucncc during tests was 4OJ/cm’. A schematic of the beam line
is presented in Figure I. A more thorough discussion of the laser damage test facility is
given in Reference 18.
Laser Damage Test System
Variable attenuator Nd:YAG 1064nm
a--- lOHz, 8.6ns
I Safety shutter I I Pinhole I I
Calorimeter 1 I I
I I + + Lens1 Len
Mirror-2 Telescope
Photodiode
Variable filter
wedge
-
1 .
d
.
Ieanhood I
Nomarski & Atomic Force I Microscopes
: l:l, N:l, and S:l testing 8.6ns
SampI< / Clean cover 1064 nm XY translation
IO Hz stage
I S polarization I
I High power beam dump
Fig. 1: Schematic of 1064nm laser damage test system. The laser was focused to provide a far field circular Gaussian beam with a diameter of about 1 mm at l/e’ of the maximum intensity. The beam profile was recorded for each shot, and the peak fluence was recorded. Laser damage tests were conducted in S-polarization at I” incidence angle . The fluence was 40J/cm’, and the pulselength was 8.6ns.

9
In order to obtain sufficient statistical information, six particle sizes were
investigated (10, 20. 30. 50. 150. and 2.50 ;frn). 5 dots (contaminalion sites) of each size
were tested on both the Input and output surfaces for a total of 60 testing sites. The
region surrounding each dot I\ as characterized and photographed before illumination,
after 1 shot, after 20 shots \i Ith 3 seconds between illuminations, and after 600 shots at a
IOHz repetition rate ( I -on- I. 20-on- 1, and S-on- 1 testing) by Nomarski optical
microscopy in order to trnch the initiation and growth of laser-induced damage upon
repetitive illumination and to study the surface morphology of the damage. Atomic
Force Microscopy (AFM) \\ as also used to measure the height or depth of the different
damage morphologies. 240 characterizations and measurements comprised a full input
and output surface study of a contamination material.
Al shavings were also tested on both the input and output surfaces of the substrate.
Studying this form of contamination was determined feasible but much more difficult,
time consuming, and less standardized than sputtered contamination. Results obtained
froin Al shavings closely mirrored those obtained from sputtered Al dots.

10
3. IIE!;ULTS
The experiments ~,reldcd \ cr\’ reproducible damage morphologies. Damage was
classified into three areas btnign. massive. and catastrophic. As described previously,
benign damage does not ;rltc%ct the laser performance of the optic with respect to NIF
requirements, massive darna:c nffccrs t)erformance beyond acceptable limits set for NIF,
and catastrophic damage i\ cracking or ablation of the glass which continues to grow
with repetitive illumination Damage behavior (morphology and size) was found to
vary between input and output surfaces and for different materials. However, for
contaminants of the same \i/c and material on the same surface, damage behavior was
relatively consistent and efforts are currently underway to model laser damage initiated
at contamination [ 19-2 1 1.
The results of tests conducted with input surface contamination are discussed first.
This is followed by a discussion of the results obtained with output surface
contamination.
3.1 Input Surface Contamination
Damage initiated at two places with input surface contamination. The first was at the
contamination dot. A plasma usually ignited at the contaminant on the first shot; the
contaminant was then molten and redeposited on the surface, often over a larger area
than the original dot. Subsequent pulses then interacted with the new deposit and
plasmas ignited until a majority of the contaminant was ablated. At that point, the
damage site was stable and did not grow or change upon further irradiation. Atomic

11
force microscopy showed that damage usually did not penetrate more than a few hundred
nanometers into the substrate surface.
Much less frequently, damage initiated on the output surface of the window directly
behind the location of the dot. This damage usually grew very quickly to catastrophic
proportions. A pit initiated on the output surface, and subsequent shots drilled into the
glass.
The characterization of individual contaminants follows. Both morphologies and
damage sizes are presented.
3.1.1 Input Surface hlorphologies
Figures 2-4 show the typical input surface damage morphologies for all materials
tested. The 150~~m contamination particles on the input surface of the substrate are
shown before irradiation, after l-on-l, 20-on-l, and S-on-l testing. For metals, the
morpholopies that have been characterized are Al, Ti. Cu. W, Au, and stainless steel. Of
the oxides, ALO,, TiOl. and ZrO, vvere examined. Organics which have been studied -
include carbon, plastic. Teflon, and hair. Morphologies varied from material to material
and for different contaminant sizes. Figure 5 shows the testing of all six Cu contaminant
sizes on the input surface of the fused silica. It represents l/5 of a full input surface
study for a contamination material.

coppcs
Slainlcss SlCCl
Slainlcss Slccl Sphcrcs
,j :,:
.‘<.‘
._.. ,,.:
.:. ,.‘>,.” >.
. . .

Fig. 2: Nomarski optical micrographs of the input surface damage morphologies initiated by 150frm contamination particles are displayed before irradiation; and after l-on-l, 20- on-l, and S-on-l testing for all metals tested. The morphologies observed were similar for different metals and \ ;rried mainly in severity. Scalding, pitting, and debris are characteristically observed. ‘l‘ho Titanium dot also caused benign output surface damage which did not grow during repetitive illumination.

14
15Qum Inmalt Surface Oxide Contaminants ’ Xrridiated @? 1064nm, 4OJ/cd
Contaminant Bef’o t-c
Fi?. 3: Nomarski optical micrographs of the input surface damage morphologies initiated by 15Opm contamination particles are displayed before irradiation; and after l-on-l, 20- on-t. and S-on-l testin: for all oxides tested. The morphologies observed were similar for different oxides. Damage initiated by oxides is relatively benign unless output s?!rface damage is initiated by pitting or cracking of the substrate. This damage usually . grows to catastrophic size and is most commonly initiated by oxides.

15
15Oj2m Input Surface Organic Contaminants Irradiated @ 1064nm, 4OJkni
Contaminant 20-on- 1 S-on- I
Fig. 4: Nomarski optical micrographs of the input surface damage morphologies initiated by 15O~m contamination particles are displayed before irradiation; and after l-on-l, 20- on-l, and S-on-l testing for all organics tested. The morphologies observed were not characteristic for different organics. Carbon-initiated damage spread a great deal while plastic and Teflon showed little reaction to irradiation. Human hair was destroyed by the beam.

Size
IO
30
50
150
16
Input Surface Copper Contaminants -Irradiated @ 1064nm, 40 J/cwi
l-on- 1 2@on- 1
IFig. 5: Nomarski optical micrographs of the 6 sputtered dot sizes for input surface Cu contamination are shown before irradiation; and after l-on-l, 20-on-l, and S-on- 1 testing (600 shots at a 1OHz repetition rate). Input surface damage often continues to grow during repetitive illumination. Larger dots can initiate more severe damage. Copper contamination initiates relatively benign damage as compared to other materials. If the contaminant is removed, a scald is seen where it was located. Pitting surrounds, and debris is scattered on the outskirts of the damage. The 150pm contaminant initiated catastrophic damage on the output surface (see Fig. IO). This figure represents l/5 of a full input surface contamination study.

17
While the initial findings for Al contamination have already been reported elsewhere
1221, the information is briefI>, presented here in the context of other contaminants
irradiated at 1064nm. Darnagc initiated at input surface Al showed a characteristic burnt
surface. Bumps were visible 111 rhe central region where the Al was located. Craters or
pits surrounded the center. and debris ~‘as scattered farther away.
Al shaving morphologics closely mirrored those of sputtered AI. A plasma ignited at
the shaving on the first shot. [he AI [{‘as redeposited and acted as a sputtered dot. The
burnt surface, bumps. pits. and debris characteristic of the sputtered contaminant were ail
visible.
Ti-initiated input surface damage ~‘as more severe than Al-initiated damage. A
blister on the surface lvas \risible where the dot had been located . Pitting surrounded,
and small raised clumps ofTi were located where the material redeposited after the first
shot. During repetitive illumination. these clumps continued to spread the damaged area.
Debris was again scattered around the outer regions of the damage.
‘Sputtered stainless steel & Cu both initiated damage which showed blistering, pitting,
and debris. Although the (‘u damage sites produced were usually not particularly large,
the morphology appeared very severe and occasionally caused damage on the output
surface which grew to catastrophic size. The Cu contaminants often were not completely
ablated during testing. Stainless steel spheres did not produce damage on the input
surface.
Tungsten and gold reacted in a manner consistent with the other metals. Damage
spread until a majority of the contaminant was ablated. An outline of the original
contaminant was visible in the damage area, and debris was scattered about.

18
Oxides behaved quite differently. Wit.1 TiO,, blistering and pits were seen. Input
surface TiO, contamination cjl‘ten lend to damage on the output surface in the form of a
scald. Al,O, damage sites shotvcd an outline of the dot. Cracking of the glass was rather
common. ZrO, left a faint c)utl~ne 01 the contaminant with debris scattered farther away.
Carbon was the first or~nnic studied. Its damage behavior was quite different than
that observed with other rn;rterials. After irradiation, the damage was nearly transparent
and was very thin and smooth Plastic and Teflon (Teflon particles were applied in a
manner similar to Al sha\ 111~s) u ercn’t noticeably affected by irradiation. With the
exception of a small portion ot the Teflon that was blown off during the l-on-l test, the
appearance and size of these contamrnants did not change with irradiation.
Another major concern for NIF which was briefly considered is the effect of human
contamination. Hair from both cats and humans was placed on the silica substrates by
the method used for Al sha\sings described previously. The hair was then irradiated
using the l-on- I, 20-on- I and S-on- 1 tests. For input surface contamination, cat hair was
not. affected by irradiation lvhile human hair was ablated without damaging the fused
silica.
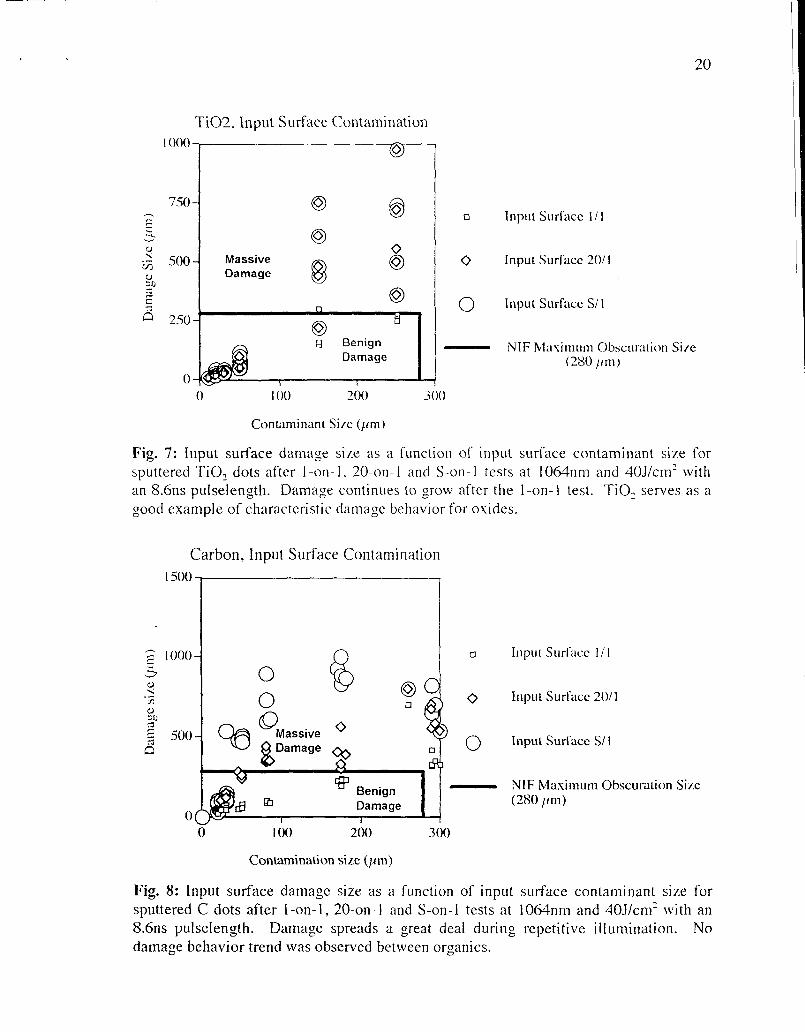
3.1.2 Input Surface Damage Size
Different materials and contaminant sizes caused significant changes in damage
behavior which was discussed previously in terms of damage morphology, but
differences were also apparent in the final, stable size of dama,ae sites. Contamination
size was plotted against damage size to quantitatively measure growth after the l-on-l,
20-on-l and S-on-l (600 shots at a IOHz repetition rate) tests. Figures 6. 7, and 8

19
illustrate this by plottin g input surface contamination size against damage size for a
metal (stainless steel). an oxide (TO,). and an organic (C), respectively.
Stainless Steel, Input Surface Contamination ! -5w
Q @
],
loo 200 3’ O(
Contaminant Si/e (I4m)
q Input Sur!-zd i .‘i
0 Input Surface 20/ 1
0 Input Surface S/I
- NIF hla\;imum Obscuration Si/c (280 pm)
1
Fig. 6: Input surface damage size as a function of input surface contaminant size for sputtered stainless steel dots after l-on-l, Don- 1 and S-on- 1 tests at 1064nm and 4OJ/cm’ with an 8.6ns pulselength. Stainless steel grows a great deal during repetitive illumination. Stainless steel serves as a good example of characteristic damage behavior for metals.
20
TiOZ, Input Surface Contamination
c2 Massive Damage
-
a Input Surface l/ 1
0 Input Surface 20/ 1
0 Input Surface S/l
- NIF Maximum Obscuration Si/e (280 /irn)
0 100 300 300
Conlaminant Si/c (trrn)
Fig. 7: Input surface damage size as a function of input surface contaminant size for sputtered TiO, dots after I-on- I. 20-0~ 1 and S-on-l tests at 106&m and 40J/cm’ with an 8.6ns pulselength. Damage continues to grow after the 1 -on- 1 test. TiO., serves as a good example of characteristic damage behavior for oxides.
Carbon, Input Surface Contamination
Cl Input Surl‘ncc 1 i 1
0 Input Surface 2011
0 Input Surface S/l
NIF Mkmum Obscuration Size (280 j/m)
Contamin.&ion six (pm)
Fig. 8: Input surface damage size as a function of input surface contaminant size for sputtered C dots after l-on- 1, 20-on- I and S-on-l tests at 1064nm and 4OJlcm’ with an 8.6ns pulselength. Damage spreads a great deal during repetitive illumination. No damage behavior trend was observed between organics.

21
From these plots. scaling factors \I cre determined. Final, stable damage size divided
by initial contaminant si/e 21\es the scaling factor for an individual dot. By plotting S-
on- 1 damage size against contaminant size, an average scaling factor for a given material
on either the input or output surface \\ ns determined by overlaying a linear curve fit with
x and y intercepts of zero onto the plot. The slope of the curve fit was equal to the
average scaling factor. This procedure is illustrated in Section 3.2.2 for output surface
carbon contamination. It N;IS repeated for all materials which have been subjected to a
full study, and Figure 9 lists lhese scaling factors for both input and output surfaces.
Catastrophic damage ins nc$ected in these calculations because it was rare. and at this
time it is not possible IO predict I\ hich contamination sites will lead to catastrophic
damage. Materials which caused catastrophic damage are noted in the table.

22
Scaling Factors (95% Confidence)
Material Input Surface Output Surface Scaling Factor Scaling Factor
Metals Aluminum 2.7k.65 2.OIk.88 Titanium 4.4+ 1.34
Stainless Steel 3.8+1.00 Not Available
1.1_+.09*
Oxides A1902 Not Available 1 1.2+. 17* TiO, j 2.8&-.58* I 2.4k.27 ZrO, j Not Available I 1.6+.90*
Carbon / ) I 3.51-l. 16 3.72.72
Plastic I 1 .O+_.OO”- 1 .ok-.oo
* Catastrophic Damage Sites Neglected
Fig. 9: Scaling factors are given for all contaminants which have been subjected to a full or nearly full study. The values were determined as illustrated in Figure 18. Catastrophic (unstable) damage was neglected in the calculation of scaling factors. The values are provided to 95% confidence.
Input surface damage ace ooravated by aluminum particles continued to grow during the
20-on-1 and S-on-l tests. Its scaling factor was about average for the tested materials at
2.7335. Massive damage occurred from contaminants in the lOO;lm range. The Al

23
shavings showed similar grow?h beha\?or to the sputtered dots. Hocvever, the shavings
were usually thicker and of nonstandard mass which led to more scatter in the data.
Ti debris continued to spread a great deal upon repetitive illumination. Its final
damage size at stability \\‘as significantly larger than aluminum’s. Titanium’s input
surface scaling factor was the highest observed at 4.4&l .34. Massive damage occurred at
contaminants as small as 50flrn. bur the damage always reached stability, and no
catastrophic failure occurred.
Copper damage grew at a very moderate rate. Enough data has not yet been
collected to determine its scaling factor. For sputtered stainless steel, smaller dots grew
very little after the I-on-l test while the larger dots continued to spread a great deal. Its
input surface scaling factor was quite high at 3.81k1.00.
Overall, metals and oxides tended to create damage which was more likely to grow
than damage from organics. Oxides appeared most likely to initiate catastrophic
damage. Of these. enough data has only been collected for TiO, to determine an input
surface scaling factor of 2.8+.58. TiO, caused backside damage at several locations, but
it rarely grew to catastrophic. Both Al,O, and ZrO, caused catastrophic damage initiated
on the output surface due to input surface contamination. Figure 10 shows the sort of
damage which was classified as catastrophic. The glass actually cracked and was
ablated.

input Surface S/l Damage Caused by 1SOpn1 Input Surface
Cu Contaniination
Output Surface S/I Damage Caused by 150pu Input Surface
Cu Contanlination
For the organics, plastic wasn’t affected in terms of damage size. It had a scaling
factor of l.O+_.OO for the input surface. However, two 150Jdrn plastic contamination
particles caused backside damage which grew to catastrophic size. No damage was
initiated by any of the other plastic contaminants.
Carbon’s damage behavior was much different than that of other organics and other
materials. No catastrophic damage was observed, but the damage grew a great deal
during the 20-on-1 and S-on-l tests. Its input surface scaling factor was 3.5k1.16.
Although particles as small as 30pm caused damage larger than the 2801lm maximum
obscuration size requirement for NIF which is classified as massive damage, it was

25
unclear whether carbon damage would adversely affect the laser beam characteristics.
The damage morphology. nearly transparent and very thin and smooth, was quite
different from the type initiated by all other materials.
3.2 Output Surface Contamination
Damage only occurred at the contamination particle for output surface
contamination. A plasma was often observed at the contaminant during the first shot.
Subsequent shots rarely initiated plasmas, and damage was usually stable after the l-on- 1
test (damage did not grow) A ring pattern or outline was most common in the location
where the contaminant had been located. A majority of the contaminant was removed
during the first shot and did not redeposit. A wave pattern was sometimes visible over
the damaged area as seen in Figure 11.

26
Catastrophic damage occllrred Cohen th(: first shot was able to produce microcracks
in the substrate. During t‘urther illumination. these cracks coupled with the light and
continued to grow to catastrophic si/.c. Atomic force microscopy showed that damage
usually did not penetrate more than ~1 I‘CV hundred nanometers into the substrate surface.
3.2.1 Output Surface Rlorphologies
Figures 12-13 shop\ the r~p~cnl damage morphologies of 150/lm contamination
particles on the output surl’acl* 01. the substrate for all materials tested before irradiation,
after l-on- 1. 20-on- 1. and S~t)ri- I testing. As stated previously, the metal damage
morphologies which have been characrerized are Al. Ti, Cu, W. Au, and stainless steel.
Oxide morphologies cxamirlcd ;\rc‘ Al&I,. TiO:. and ZrO,. Organics which have been
studied include carbon, plastic. I‘eflon. and hair. Much like input surface contamination,
morphologies vary from material to material and for different contaminant sizes. Figure
IS shows the testing of all SIX Cu contaminant sizes on the output surface of the fused
silica substrate. This represents l/5 of a complete output surface study of a
contamination material.
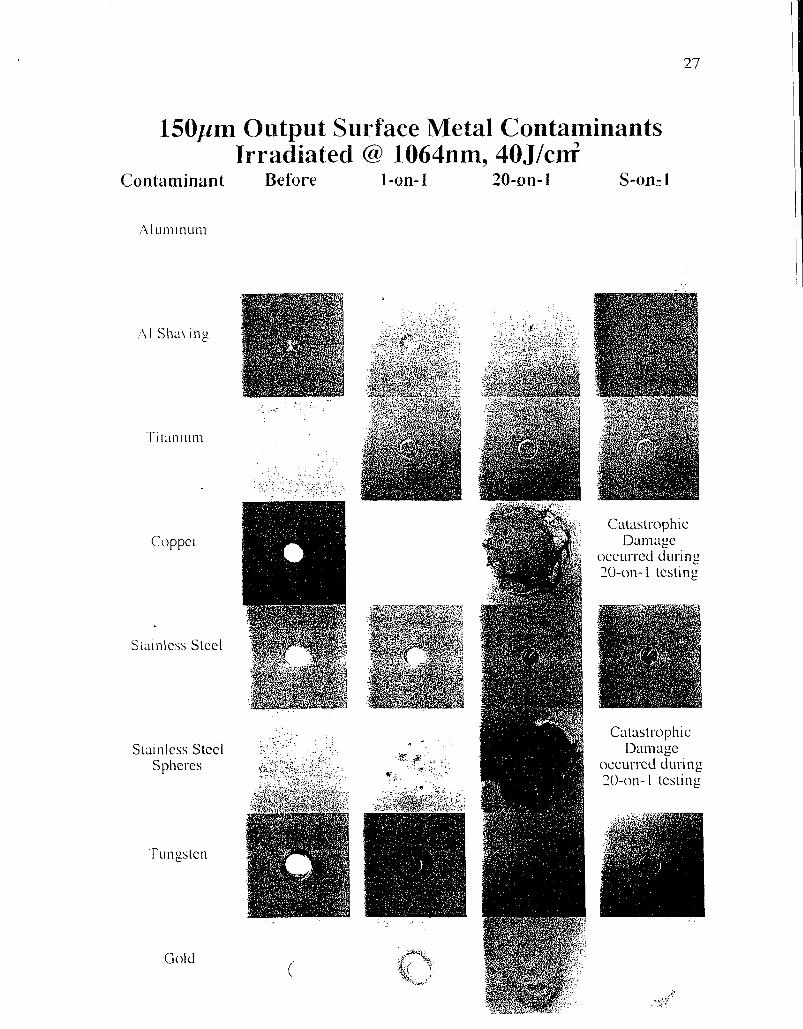
27
15Opm Qutput Surface Metal Contaminants Irradiated 659 1064nm, 4OJkrri
Contaminant &fQR I -on?1 20-m- 1 S-on- I
Al Sha\ Ing
: : . ..I
:, ‘::’ : ;. ..:i.,:: I”.. * . ,,
coppct
Stall~lcss SLCCI
Slainlcss Slccl Spl~crcs
Tungsten
Calnskophic Dmagc
occ~imxi during
20-m- 1 lcsling
Cdastrophic DLllllLlgC
occurs-ed during
30-m- 1 lcsling

28
Fig. 12: Nomarski optical micrographs of the output surface damage morphologies initiated by 1501lm contamination particles are displayed before irradiation; and after l- on- I, 20-on- 1. and S-on- 1 testing for all metals tested. The morphologies observed were similar for different metals. An outline of the contamination particle is left on the surface of the fused silica. The damage grows very little unless serious pitting of the silica occurred during l-on- 1 testing. This pitting will grow to catastrophic proportions as seen here in Cu and the stainless steel spheres.

29
15Opm Output Surface Oxide Contaminants Irradiated @ 1064nm, 4OJlcn?
TiO,
2.1-0,
Fig. 13: Nomarski optical micrographs of the output surface damage morphologies initiated by 15O~m contamination particles are displayed before irradiation; and after l- on-l, 20-on-l, and S-on-l testing for all oxides tested. The morphologies observed tiere similar for different oxides. The damage initiated is usually benign unless catastrophic damage occurs which is common among oxides.

15Opm Output Surface Organic Contaminants Irradiated @ 1064nm, 4OJ/c&
Contaminant
H~tmun Hair
Bef’o I-C I-on- I 20+m-1 S-on- 1
Fig. 14: Nomarski optical micrographs of the output surface damage morphologies initiated by 150,um contamination particles are displayed before irradiation: and after l- on-l, 20-on- 1, and S-on-l testing for all organics tested. The morphoiogies observed were dissimilar for different organics. Input and output surface organic contamination initiate similar damage.

31
Qutput Surface Copper Coutaminants Irradiated @ P064nm, 4OJlcu-8
Size (pm) Before l-ml: 1
IO
20
30
so
- IS0
250
Fig. 15: Nomarski optical micrographs of the 6 sputtered dot sizes for output surface Cu contamination are shown before irradiation and after l-on- 1,20-on- 1, and S-on- I testing (600 shots at a 1OHz repetition rate). Output surface damage does not grow during repetitive illumination. The characteristic output surface damage morphology consists of an outline of the contaminant. Pitting is often observed along the edge of the outline. Copper contamination initiates relatively benign damage as compared to other materials. This figure represents l/S of a full output surface contamination study.

32
Again. although the initial findings for Al contamination have already been reported
elsewhere (221, the information is briefly presented here in the context of other
contaminants irradiated at 106&m. For output surface contamination, the AI dot was
usually ablated on the first shot. An outline or ring was seen where the dot was located,
and a wave pattern was sometimes visible over the outline. The Al shavings behaved
much like the dots, although catastrophic damage did occur during the Al shavings
testing.
Titanium on the output surface often caused crackin, 0 in the larger dots and left an
outline in the smaller dots. Copper’s damage morphology usually consisted of an outline
of the contaminant. The contaminant was not completely ablated during irradiation.
Catastrophic damage was also observed. Sputtered stainless steel contaminants left a
scald in the location of the dot. The material was ablated during the first shot. The
stainless steel spheres were sometimes able to cause cracking in the silica which led to
catastrophic damage. Tungsten and gold initiated benign damage which left a faint
outline of the contaminant and did not grow during repetitive illumination.
The oxides all exhibited similar output surface behavior and left an outline of the
contamination particle. Al?O, and ZrO, also initiated pits or cracking. TiO, damage left
significantly more debris than the other oxides.
The organics damaged in a similar fashion on the output surface to the manner in
which they damaged on the input surface. Carbon-initiated damage was nearly
transparent, thin, and smooth. Plastic and Teflon did not react with the beam. The
contaminant was not ablated. nor was damage observed. The cat hair and human hair

33
damage morphologies changed. On the output surface, human hair did not damage while
cat hair was partially ablated
3.2.2 Output Surface Damage Size
As explained in Section .i I .2. damage size can be plotted against initial contaminant
size, and scaling factors can be determined which predict the size of damage expected
from a particle of known s~/e and material. Figures 16, 17, and 18 illustrate this idea by
plotting output surface contamination size against output surface damage size for a metal
(Al shavings), an oxide (Till). and an organic CC). respectively.
Al Shavings, Output Surface Contamination
0
Massive Damage 69
q
@
(280 t(m)
Contamination si7c @m)
Fig. 16: Output surface damage size as a function of output surface contaminant size for Al shavings after l-on-l and S-on-l tests at 1064nm and XIJ/cm’ with an 8.611s pulselength. Output surface damage doesn’t grow after I-on-l testing. Catastrophic damage can occur. Al shaving damage grew more than other metals on the output surface due to the increased mass of the particles. Sputtering allows better control over the mass of particles.

TiO2, Output Surface Contamination
x00 I
Output Surface 2011
Output Surlacc S/I
NIF Ma\;imum Obscuration Si/e (280 /trn)
Fig. 17: Output surface dnma~c s;rze 3s a function of output surface contaminant size for sputtered TiO, dots after I -on I an 8.6ns puls;length.
. 20-w- 1 and S-on- 1 tests at 106&m and 4OJ/cm’ with IIamayc continues to grow after the l-on-l test. Output surface
damage grows less than input surface damage. TiO, serves as a good example of characteristic damage beha\‘ior for oxides.
Carbon, Output Surface Contamination
0 Massive Damage 0
0
CP O0 6
cl @
0 ouqu1 Surface 1/ I
0 Outpul Surface 20! 1
0 Output Surface S/l
- NIF Ma\;imum Obscuration Six (280 /dm)
0 Contamination si/c (jtm)
Fig. 18: Output surface damage size as a function of output surface contaminant size for sputtered C dots after 1 -on- 1) XI-on- 1 and S-on-l tests at 1064nm and 4OJ/cm’ with an 8.6ns pulselength. Damage spread more for output surface contamination than for input surface contamination. No damage behavior trend was observed between organics.

35
From these and similar plots. scaling factors were determined for all materials subjected
to a full study (see Figure 9). Figure 19 illustrates the procedure for output surface
carbon contamination.
Carbon, Output Surface Scaling Factor
0 output Surface s/ 1
0 50 100 150 200 250 300 Contamination Size (tlm)
Fig. 19: Scaling factors can be determined that predict the final damage size which a contaminant will initiate. The process is shown here for carbon contamination on the output surface. S-on-l damage size is plotted against contaminant size. A linear curve fit with Y and y intercepts of 7ero is overlaid onto the graph. The slope of the cur\‘e fit is equal to the average scaling factor. For output surface C, the curve fit has an equation which is approximately y = 3.8x. This yields a slope of 3.8 which is the average scaling factor. Error analysis then characterizes the quality of the fit and establishes confidence intervals. Output surface carbon has an interval of f.72 to 95% confidence. Catastrophic (unstable) damage was neglected in the calculation of scaling factors.
Output surface Al contamination usually did not grow after the first shot. Massive
damage was mainly observed in the 150 and 250frm contaminants. Al shavings damage
was consistent with the sputtered dots. The sputtered Al dots had a scaling factor of
2.0f.88.

36
Titanium output surface damage grew to catastrophic proportions on several
occasions. When this did not occur. damaoe was benion. Enough reliable data has not 2 =
been collected to determine its scaling factor. Sputtered stainless steel blistered during
the first shot, and the material was ablated- Very little growth occurred: its scaling factor
was 1_1+.09 for the output surface. Enough data is not currently available to determine
scaling factors for stainless steel spheres. tungsten. and gold.
Again. the oxides were able to cause serious damage. TiO, never went catastrophic,
but it left more debris than is common for output surface contaminants and scaled on
average to 2.43~27 times its initial size. Al,O, and ZrO, had lower scalin: factors at
1.24.12 and 1.6k.90, respectively. but the factors neglect the numerous catastrophic
damage sites which they both initiated.
The output surface organics exhibited damage sizes similar to those seen with input
surface organic contamination. Carbon was the only material with a larger output
surface scaling factor than input of 3.7572. Even though carbon damage grew to
massive sizes very quickly. its characteristic damage morpholo_ry was quite different
than other materials. The effect of damage on beam characteristics is currently being
studied by interference microscopy measurements of phase shifts, and it’s unclear at this
time whether carbon damage is detrimental.
Plastic showed no reaction to irradiation and has a scaling factor of 1.~.OO. A full
study has not been conducted on Teflon. cat hair. and human hair.

37
4. DISCUSSION
This section discusses the process used to quantify experimental error in the scaling
factors (4.1) and examines t hc mechanism of catastrophic damage (4.2).
4.1 IJncertainty Analysis
Error in the scaling !-actors l\‘as induced from both bias uncertainty of the.
experimenta! measuremcn!L rind precision uncertainty from fluctua!ion of stab!e damage
size around a mean \Aue Homrever. bias uncertainty was negligible in comparison to
precision uncertainty. Precisic~n uncertainty was determined tn 95% confidence as
discussed in Appendix G of‘ l?e!‘ercnce 24.
Since the precision error in fina! damage sizes was significantly !arger than that in
the initial contaminant si;les. contaminant si7e was plotted against damage si7e and a line
of equation J ’ y= (1~ - h tvas calculated through the data. The intercept N was set to zero ___
since contaminants of no ci7e 0hviousiy do not grow. The slope h was equal to rhe
sca!ing factor for the cnntam;rlan! (see Fig. 19). Least-squares c,. .,...-- ..,. . ‘tIv-\;‘p fltfincr is occpntiallv - . . . . . b . -.,- - .“...“,
a method of averaging out the v precision error in data that satisfy an underlying linear
relationship. Error analysis was used to characterize the quality of the fit.
Confidence intervals for the s!ope were determined under the assumption that the
precision error in yi, the experimenta!!y measured damage size, satisfied the norma!
distribution. The true slope (scaling factor) then lies within the c% confidence interval
given by:

where I~>,” is the l-statistic \\ ith v = c - 2 degrees of freedom (n is the sample size) at an
cy = (1 - C) level of signific3ric.c. ?, ., is the standard error of tie damage size about the
curve fit as determined b!,
This approximates the star1d;in.i deviation of the precision error in J’i. The quantity xi is
the experimentally measured cc~ntnmlrtant size, and ~b:\rJ is the corresponding damage
size calculated from the equation of’ the curve fit. S, is the total squared variation of the
.Y data (precision error and the \(r;li yht-t ine variation of s with ~1) defined by:
The 95% confidence inter\,nts are given in Figure 9.
4.2 Catastrophic Damage
The most interesting and destructive behavior encountered in the stud\: was
catastrophic damage. Modeling efforts are underway at LLNL to determine the
mechanism of such damage in order to limit its occurrence. Research Scientist David
Eder points to three major factors that his modeling group believes contribute to it.
The first two mechanisms cause output surface damage from output surface
contamination. When the laser pulse makes contact with the contaminant on the back
surface, the energy is absorbed by the contaminant at the interface between it and the
silica substrate. This often melts and vaporizes the contaminant, At this point, the

39
temperature mismatch at the interface is sometimes enough to thermally shock and crack
the substrate.
The damage can also be caused by the interface pressure mismatch. When the
contaminant vaporizes at the interface, the pressure locally increases and puts the
contaminant and the substrate in compression at the interface. As the energy spreads
through the contaminant. it continues to vaporize and the pressure is released through the
top or sides of the contamlnnnt. IHowever. the larger the diameter and thickness of the
contaminant. the longer it takes for the pressure to be released. The pressure puts the
surface of the substrate at the interface in compression. This in turn appiies smaii tensile
forces into the silica which. if not alleviated quickly. fracture the surface and lead to
catastrophic failure of the substrate.
The third mechanism can cause catastrophic output surface damage due to both input
I and output surface contamination. When the contaminant absorbs the laser energy and a
plasma is observed, UV radiation is released which is absorbed by the substrate.
Subsequent iaser puises do not slmpiy pass through the silica as before but coupie with
the absorbed radiation to crack the output surface. More intense plasmas are observed
with iarger contaminant sizes for a given material. Piasma intensity is based on the mass
of the contaminant which explains why larger particles cause catastrophic damage more
often.

40
5. CONCLUSIONS
A study to examine the effects of contamination on optics in high fluence lasers such
as NIF and LMJ is underway. The initial results observed for contaminants on both the
input and output surfaces of fused silica irradiated at 1064nm are presented herein. An
artificial contamination method was used to contaminate the optics. This allowed rapid
data collection. The results were very reproducible and systematic.
The contamination method proved to approximate the conditions encountered on
large scale laser systems. At shavings which closer approximate real contaminants
produced data consistent \\.ith that collected from sputtered Al dots.
Input surface contamination tends to cause a plasma during the l-on-l test and
continues to spread during repetitive illumination. The surface usually appears burnt
with craters or pits in the location of the original contaminant. and debris is scattered
about. Organics behave quite differently than other materials. Carbon creates a large,
nearly transparent, smooth damage area. Plastic and Teflon are not affected by
irradiation. Input surface contamination can cause output surface damage through light
intensification. A plasma is often observed on the output surface as well as the input
surface during this phenomenon. The occurrence of backside damage usually leads to
catastrophic damage. This is rare and is almost exclusively encountered in larger dots
(> 1OOpm). Oxides seem to lead to catastrophic failure most often.
Output surface contamination normally causes a plasma during the first shot in which
most of the contaminant is ablated. Further illumination generally has little affect. The
damage morphology is usually an outline where the contaminant had been located and
pitting at the rim. Very little debris is seen scattered around. A fine wave pattern is

41
sometimes observed on the surface. Again, organics behave differently. Their behavior
is very similar for both Input and output surfaces. Catastrophic damage can occur from
output surface contamination it microcracking was caused in the substrate during the first
i shot. Again, for the materials tested. oxides tend to cause catastrophic damage from
output surface contamination most regularly.
The damage morpholor! of a material is very reproducible from particle to particle
for the same fluence and lxirticle size. Morphologies are quite different for particles on
the input versus output surr‘ncc. Different morphoiogies are also observed for different
materials.
This study shows that contamination particles of a critical size determined by
material and illumination suriace will be unacceptable and must be avoided on high
power lasers as they wilt negatively impact performance and perhaps lead to catastrophic
failure of optics in the beam iine. Many other variables must be addressed before
contamination effects arc fully understood and methods of accounting for them are
developed. Scaling factors provide a systematic way of predicting damage size from
initial contaminant size. material. and fluence. These factors in turn can be used to set
first order cleanliness standards for NIF optics. The standards must be arrived at in such
a way that, with a factor of safety, predicted damage size from allowable particle sizes
and materials remains benign (< 28Qlm).
42
This article reports the rrlitial findings of a study designed to characterize the effects
of contamination in all the multitude of \fpays in which it could affect the performance of
optics in high fluence laser<. c<pcc~all! the National Ignition Facility. The study to date
has established a reliable. rcproduciblc. and systematic method of collecting data. The
effects of many differenr c~~rl[arninants on bare fused silica irradiated at 1064nm have
been characterized. Man! I~SIICS still need to be addressed and are currently being
studied or are slated for t‘uturc \\ orb. These are discussed below.
6.1 Ramping Studies
Contamination effects at a fluence of 40J/cm’ are relatively well characterized and
understood. Experimentation at other fluences is now being performed to determine
scaling factors at any fluence by dividing contaminant size by S-on-l damage size and
plotting versus fluencc. This ~1 ill allow prediction of final damage size for contaminants
of any size or material at any tluence.
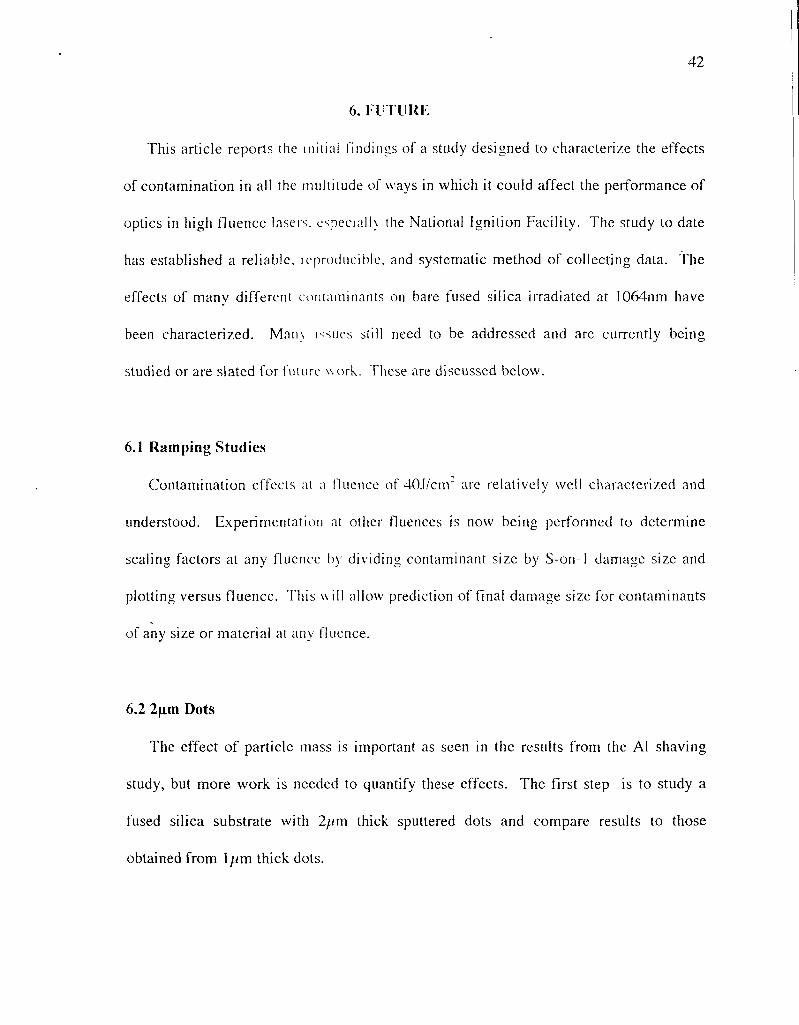
6.2 2pm Dots
The effect of particle mass is important as seen in the results from the Al shaving
study, but more work is needed to quantify these effects. The first step is to study a
fused silica substrate with 2tlm thick sputtered dots and compare results to those
obtained from l;tm thick dots.

43
6.3 NW Optics
Contamination effects on fused silica have been studied. but work must be done on
the other types of optics which will be used in NIF. These include phosphate glass,
mirrors. polarizers, AR-coated fused silica, and KDP crystal. Optics of different
thickness also need to be examined.
6.4 3SSnm Laser Illumination
The NIF beam line \lrill run at both 106&m and 355nm. All studies conducted at
106&m must be repeated at 355nm. Initial results show that damage is much more
severe at 35Snm [ 22-23 ).
6.5 Modeling and the Mechanism of Catastrophic Damage
A fuller understanding must be gained of the physical processes which lead to
damage. Of pertinent interest is the mechanism of catastrophic failure. and modeling
efforts are concentrating on this phenomenon. For input surface contamination. initial
work points to UV radiation caused by plasmas which is absorbed by the glass and
couples with the incoming laser light which cracks the glass. Output surface
contaminants cause a shock wave brought about by a pressure or temperature gradient at
the substrate/contaminant interface which induces cracking of the silica 115, 19-211.
More work must be done to verify that these are the main causes of the damage and to
establish statistical probability about when catastrophic damage will occur.

44
7. ACKNOWLEDGMENTS
This work was performed under the auspices of the U.S. Department of Energy by
Lawrence Livermore National Laboratory under Contract W-7405Eng-43. The study
was conducted by F. Y. GCnin, K. Michlitsch, Mark Kozlowski, Jim Yoshiyama, and Jim
Furr. The researchers wish to acknowledge Peter Krulevitch, Lan Nguyen, and Craig
Alford for the production of silicon nitride membrane masks and contamination deposits.

45
8. REFERENCES
1. R. P. Gonzales and II Milarn. “Evolution during multiple-shot irradiation of I __ .,__ ;.- sLitrounding isolated platinum inclusions in phosphate laser glasses”. I-ccse~-- --‘-‘-a-
lnhced Damug-e in Opl~ul ,I tulesrd.~, A’HS SP 746, 128 ( 1985). 2. M. R. Kozlowski, Ii Chow, and I. M. Thomas, “Optical coatings for high power
laser applications”, Handbook of Laser Science and Technology, Supplement 2: Optical Materials, ed. M. J. Weber. CRC Press. 767, (1995).
3. M. D. Miller, R Chow. and G. E. Loomis, “Electrostatic reduction of particuiates for laser-resistant hafnia coatings”, ldser-IixhceJ Ihmuge in 0pficul Mulerids, SPIE 2114,426(1993).
4. I. A. Fersman, L. II. Khnzov. “The effect of surface cleanliness of optical elements on their radiation resistance”. Soviet .Jo~trxul of &Vicul l’eci~nolo~~~ 37. 627 ( 197 1).
5. G. R. Wirtenson. “HI$ tluence effects on optics in the Argrs and Shiva laser chains”, Opticul EngIneo-lrlg 18. 574 ( 1979).
6. B. E. Newnam, “Optical materials for high-power lasers: recent achievements”, Luser l;ocu.s 18, 53 ( 1992 1.
7. J. B. Heaney. t-I. lHcrlr$. J F Osantowski. “Auger spectroscopic examination of MgF,-coated Al mirrors before and after UV irradiation”, .-lpplietl Op/ics 16. 1886 ( 1977).
8. S. Guch. Jr. and F. E. Hovis. “Beyond perfection: The need for understanding contamination effects on real-world optics”, Luser-/mArced lhqqc ii7 Opficul Adu/eriuls, V/L 21 14, SOS ( 1994).
9. M. A. Acharekar. .. Infra-red absorption spectroscopy of Nd:YAG and Nd:GSGG surface contaminants”. l,U\~~f~-ltl~llIC’~~~I f lUl71UgC in Opf icd iZffUfi?l.iUl.\, IVH~S SI’ 746, 170 ( 1985).
10. K. Mann, B. Wolff-Rottke, and F. Mtiller, “Removal of dust particles from metal mirror surfaces by eximer laser radiation”, AWE 2428, 226 ( 1994).
/,user-Itldzrceti Oumugc ii2 OpIicul A fu,er-ids,
1 I. D. Jollay, “Manufacturing experience in reducing environmental induced failures of laser diodes”, I,u.ser-ldwxi Dumuge in Oplicul Muterids, SPIE 27 14, 679 ( 1995).
12. C. E. Geosling, “Clean cavity contamination in gas lasers”, SI’IL; 2714, 689 (1995).
13. G. A. Harvey, T. H. Chyba. and M. C. Cimolino, “Cleanliness and damage measurements of optics in atmospheric sensing high energy lasers”, Luser-1&z4Ced Dumuge in Opticul Muteriuls. SPIE 27 14, 696 ( 1995).
14. F. E. Hovis, B. A. Sherperd, C. T. Radcliffe, A. L. Bailey, and W. T. Boswell. “Optical damage at the part per million level: The role of trace contamination in laser induced optical damage”, I-user-Jmhced Dumage in Opticul Muterids, V/IT 2428, 72 (1994).
15. F. E. Hovis, B. Sherperd. C. T. Radcliffe, and H. A. Maliborski, “Mechanisms of contamination induced optical damage in pulse lasers”, Iduser-/mArced Damage in Opticul Muterids, S/‘/E 2428,72 ( 1994).
16. F. E. Hovis, B. A. Sherperd, C. T. Radcliffe, and H. A. Maliborski, “Contamination damage in pulse II’m lasers”, Imer-lrzdziced l lu~m~ge iii Optical Muterids, SPlE 27 14,707 ( 1995).

17. J. T. Hunt. K. R. Manes. and P. A. Renard. Appiied Optics 32.5973 (1993). 18. A.J. Morgan. F. Rnlner, F.P DeMarco, R.P. Gonzales, M. R. Kozlowski, and M.
C. Stags. “Expanded damage test facilities at LLNL”. Luser-/m/wed Dumuge in Optical hlurrriuls, :\%CT .qi’ SO 1. 17 i 1989).
19. M. D. Feit. A &I Rubenchik. D. R. Faux. R. A. Riddle. A. Shapiro, D. C. Eder, B. M. Penetrante, D. hlilam. F Y. G&in. and M. R. Koziowski. -‘Modeling of Laser Damage Initiated by Surface Contamination”, Solid State Lasers for Applicarion to Inertiul Confinement Fu.\IoJ~. h-is. France, in press (1996).
20. M. D. Feit, A. bI Rubenchik. D. R. Faux, R. A. Riddle, A. Shapiro, D. C. Eder, B. M. Penetrante. D. Milrlm. F Y Genin, and M. R. Kozlowski. “Modeling of Laser Damage Initiated by Suriace Contamination”, Laser-Induced Dumuge in Optical hfuteriais, SPlE 2966, 4 17 ( 19%).
21. M. D. Feit, A. &I Kubenchik, “Laser Intensity Modulation by Nonabsorbing Defects”, Luser-IndLrceLi lhnrclqe /n Optical Muterials, SPIE 2966. 475 ( 1996).
22. F. Y. G&in. K &lrchlrtsch. J. Furr, .&I. R. Kozlowski. and P. Krulev5tch, “Laser- induced damage of fused srlica at 355 and 1064 nm initiated at aluminum contamination particles on the surface”. hwr-lndrrccd Dumage in Opticul Materiuls, SPIE 2966, 126 (19m.
23. F. Y. G&in. ?vI Ii. Kozlowski. and R. Brusasco. -‘Catastrophic failure of contaminated fused silica optics at 3% nm” , Solid St&e Lasers for Application to lnertiul Confinement Fztsion, Paris. France, in press (19%).
24. T. G. Beckwith. R. D. Marangoni, J. H. Lienhard V, Mechanical Measurements: Fifth Edition, Addison-Wesley Publishing Company, Readins. MA, 1993.

Technical Inform
ation Departm
ent • Lawrence Liverm
ore National Laboratory
University of C
alifornia • Livermore, C
alifornia 94551