late enrollment in primary education: causes and
TRANSCRIPT

LATE ENROLLMENT IN PRIMARY EDUCATION:CAUSES AND RECOMMENDATIONS FOR PREVENTION
2
LATE ENROLLMENT IN PRIMARY EDUCATION:CAUSES AND RECOMMENDATIONS FOR PREVENTION
Research Examining the Factors Associated with Late Primary School Enrollment in Most Problematic Provinces and Developing Strategies for Promoting Timely Enrollment in Turkey.
The contents can only be used with references.The ideas presented in the publication belong to the authors.
MEB Primary Education General DirectorateBakanlıklar - AnkaraTel: 0 312. 413 15 94 / 0 312. 417 71 05 E-posta: [email protected]: http://iogm.meb.gov.tr UNICEF Turkey2. Cadde No:11 Birlik MahallesiÇankaya - ANKARA - TURKEY www.unicef.org.tr
ISBN No: 978 - 92 - 806 - 4577 - 4First Edition: ANKARA, AUGUST 2011Graphic Design : Netvizyon MediaparkPrinting: Aydoğdu Ofset
Research Team
Prof. Dr. Tanju Gürkan: Project Coordinator Prof. Dr. Korkut Tuna: Qualitative Research CoordinatorAssist. Prof. Dr. İbrahim Demir: Member of the Analysis and Report Writing TeamAssist. Prof. Dr. Ayşegül Metindoğan Wise: Member of the Analysis and Report Writing TeamMustafa Şen: Project Administrative DirectorNuran Köse: Assistant Director/Communication CoordinatorEbru Yavuz Tör (MSc): Quantitative Research CoordinatorTalin Evyapan: Member of the Analysis and Report Writing TeamNiğmet Balcı: Field CoordinatorNilgün Sözer: Assistant Field CoordinatorFunda Demir: Data Entry Coordinatorİhsan Aktaş: Member of the Qualitative Research Team Tayfun Şahin: Member of the Qualitative Research Team Gülenden Yıldırım: Member of the Qualitative Research Team
This research was conducted out by GENAR, a research company appointed by UNICEF for Ministry of National Education, General Directorate of Primary Education
3
FOREWORD
The Universal Declaration of Human Rights and the International Convention on the Rights of the Child, which are regarded highly by international community, emphasize that everyone has the right to access to the basic education. In order to provide the right of education for all children -boys and girls- our government made amendments in the constitution, legislation and regulations. Besides that global principles and generally recognized goals concerning primary education have been committed and ensured by policies and acts of the state. All national development plans consist of objectives to provide access to primary education for all children including boys and girls.
In order to ensure that all children -girls and boys- have access to the basic education, Ministry of National Education has implemented numerous comprehensive programs such as “Capacity Building Support Project for The Ministry of National Education” (MEBGEP), “Support to Basic Education Program” (SBEP), “Let’s Go to School”, Girls, “Catch up Education”.
Additionally, it has been required to renew strategies and policies to provide access and attendance to primary education. The researches aiming to develop evidence-based strategy have been carried out such as The Need Analyses upon Non-Attendance and The Risk of Drop-Out, Research as Interim Evaluation of Catch-up Education Program, The Need Analyses on Catch-up Education. Late Enrollment Research, one of these researches, has been operated via the analyses of the indicators of access to primary education that signify low enrollment rates of 6 years-old. The new policies and strategies based on research findings have been improved such as the application of “e-Registration”, “My Child is Going to School” a Guidebook for Parents, a Guidebook for teacher candidates which is entitled as “Welcome, My Teacher” and the letters to parents of students who are going to be enrolled in primary schools etc.
I wish that this research, as an important instrument for developing policies to respond to the problem of late enrollment which has a negative impact on access to primary education, will shed light on works of education policy makers, practitioners and researchers; and will broaden horizons of them.
Ahmet Murat Altuğ General Director of Primary Education

4
Tabl
e of
Con
tens

5
Tabl
e of
Con
tens
LIST OF TABLES ....................................................................................................... 11
LIST OF APPENDIX TABLES ...................................................................................... 16
LIST OF FIGURES ..................................................................................................... 19
ABBREVATIONS ......................................................................................................... 21
SUMMARY ................................................................................................................ 22
1. INTRODUCTION ................................................................................................... 24
1.1.Problem ..................................................................................................... 26
1.1.1. Population of children between 6-13 years of age in
Turkey ........................................................................................................... 26
1.1.2. School enrollment rates disaggregated by academic year
and gender ..................................................................................................... 27
1.2. Purpose and the significance of the study ............................................. 30
1.3. Net school enrollment rates of the provinces based on
socio-economic development index ............................................................... 34
2. METHODOLOGY .................................................................................................... 36
2.1. Research population ................................................................................ 36
2.2. Research sample ..................................................................................... 36
2.2.1. Sample for quantitative research ................................................... 36
2.2.2. Sample for qualitative research ..................................................... 42
2.2.2.1. Focus group meetings .............................................................. 42
2.2.2.2 Semi-structured interviews ...................................................... 43
2.3. Data collection techniques ..................................................................... 43
2.3.1. Data from quantitative research .................................................... 43
2.3.2. Quantitative research measurement .............................................. 44
2.3.3. Sampling techniques for qualitative research ............................... 44
2.3.3.1 Focus groups .............................................................................. 44
2.3.3.2. Semi-structured interviews ...................................................... 45
2.4. Data collection procedure ........................................................................ 47
2.5. Limitations ................................................................................................ 48
2.6. Data analysis and the research report .................................................... 49
2.7. Conceptual definitions .............................................................................. 50
2.7.1. Not enrolling in school on time ....................................................... 50
2.7.2. Late enrollment/Late entrants .................................................. 50
2.7.3. No enrollment/Unenrolled children ................................................. 50
3. FINDINGS .............................................................................................................. 50 3.1. Household members .......................................................................... 50
3.1.1. Number of people living in the household ...................................... 50
3.1.2. Relationship status of the household members living together ............. 51

6
3.1.3. Age distribution of the household members ................................. 52 3.1.4. Gender distribution of the household members ........................... 52
3.1.5. Educational distribution of the household members ................... 53
3.1.6. Relationship between education and gender based on living
in rural or urban residential areas ............................................................. 53
3.1.7. Relationship between age and sex based on living in rural
and urban residential areas ....................................................................... 57
3.1.8. Relationship between education and sex for household
members 15 years and older ..................................................................... 58
3.1.9. Employment status of the household members ........................... 59
3.1.10. Employment status of the household members 15 years
of age and above ........................................................................................ 59
3.1.11. Whether the household members have social security ............. 61
3.2. Characteristics of children in the household ......................................... 61
3.2.1. Number of children in the household ............................................. 61
3.2.2. Children living outside of home ...................................................... 63
3.2.3. Whether students in the household attend regional boarding
schools ......................................................................................................... 64
3. 3. Characteristics of the parents ................................................................ 64
3.3.1. Whether the mothers and fathers are biological parents ............ 64
3.3.2. Characteristics of the mothers ....................................................... 66
3.3.2.1. Ages and the marital statuses of the mothers ....................... 66
3.3.2.2. Educational status of mothers ................................................. 67
3.3.2.3. Employment status of the mothers ......................................... 67
3.3.3. Characteristics of the fathers ...................................................... 67
3.3.3.1. Ages and the marital statuses of the fathers ......................... 67
3.3.3.2. Employment status of the fathers ........................................... 69
3.3.4. Not enrolling in school on time and parental education .............. 69
3.4. Household characteristics ....................................................................... 70
3.4.1. Household incomes and expenses ................................................. 70
3.4.2. Ownership status of the home the families live in ........................ 72
3.4.3. The size of the home ....................................................................... 73
3.4.4. Social and economical factors associated with not
enrolling in school on time ........................................................................ 74
3.5. General characteristics of children who were born in 2001 ................ 76
3.5.1. School enrollment status of children born in 2001 ...................... 76
3.5.2. Sex of children who were not enrolled to school on time ............ 77
3.5.3. Knowledge of the participant about the actual age of
the child ....................................................................................................... 77
Tabl
e of
Con
tens
Tabl
e of
Con
tens

7
3.5.4. Not enrolling in school on time, child’s age and being
unenrolled ........................................................................................................ 80
3.6. General health of children who were born in 2001 .............................. 82
3.6.1. Health status of children based on the provinces they
live in ........................................................................................................... 84
3.6.2. Not enrolling in school on time and child’s development ............ 88
3.6.3. Families’ knowledge of children’s height and weight ................... 89
3.7. Knowledge of expected child age for school enrollment ..................... 93
3.7.1. Participants’ knowledge of the expected time for school
enrollment .................................................................................................. 93
3.7.2. Relationship between selected characteristics of the participants
and their knowledge of legal age for school enrollment .................................... 95
3.7.3. Not enrolling in school on time and enrollment age for
school ........................................................................................................... 99
3.7.4. How the information about the age for school enrollment
is obtained .................................................................................................................. 100
3.7.5. Participant responses about whether they thought
their children were enrolled in school on time or not ............................. 101
3.8. Reasons for not enrolling in school on time ......................................... 104
3.8.1. Reasons for late enrollment ........................................................... 104
3.8.2. Factor analysis examining the reasons for late
school enrollment ...................................................................................... 110
3.8.3. Reasons for no school enrollment in the 2007 – 2008
academic year ............................................................................................ 121
3.8.4. Late enrollment in school and social, cultural,
economic, environmental, and family-related factors ........................... 122
3.9. Examination of the reasons for late enrollment for in
association with various factors ........................................................... 125
3.9.1. The reasons effective in children enrolling in school
after a year delay .......................................................................... 133
3.9.2. Reasons for late school enrollment according to
the other social stakeholders ................................................................... 135
3.9.3. Knowledge of laws concerning school enrollment ............................ 136
3.10. Whether families received guidance about the school
enrollment age ................................................................................................ 142
3.11. Decision makers for children’s enrollment in school the
following year .................................................................................................. 143
3.12. Work that has been done to promote timely enrollment
of children in schools ...................................................................................... 144
Tabl
e of
Con
tens

8
3.13. Activities children were that not enrolled in school on time
engaged in during 2007 – 2008 academic year ..................................... 145
3.14. People who were influential in the decision to not enroll
children in school ...................................................................................... 145
3.15. Educational opportunities provided for the child while the
child was out of school and activities the child engaged in ................ 147
3. 15.1. How did the child spend a typical day when the child
was out of school? ............................................................................. 149
3.15.2. Activities children engage in during a typical day in
the late enrollment group ................................................................. 150
3.15.3. Frequency of the activities the children engage in
during a typical day ............................................................................. 156
3.15.3.1. Late enrollment group ............................................................ 156
3.15.3.2. No enrollment group ...................................................... 156
3.15.4. Examination of children’s activities during a typical
day as a function of different variables in the no enrollment group 160
3.16. How influential were the factors contributing to children’s
enrollment in school in 2007-2008 academic year ............................. 161
3.16.1. Late enrollment group .......................................................... 161
3.16.2. No enrollment group ............................................................. 163
3.16.3. Value indexes of the reasons that were identified as factors contributing to children not enrolling in school the previous year 163
3.16.3.1 Late enrollment group ................................................... 163
3.16.3.2. No enrollment group ..................................................... 165
3.16.4. Regional issues and problems and not enrolling in
school on time .................................................................................. 167
3.17. Being informed of the financial support state provides for
enrolling girls in schools ...................................................................... 167
3.17.1. Examination of being informed of the financial support
state provides for girls’ education as a function of
different variables ............................................................................ 169
3.17.2. Examination of receiving the financial support state
provides for girls’ education ............................................................. 172
3.17.3. Contributions of financial supports received from the
state to enrollment of children in schools ..................................... 172
3.17.4. Factors that would contribute to families enrolling
their children in school in the near future ............................... 175
3.17.5. Not enrolling in school on time, transportation to
school and problems experienced in schools ........................ 182
Tabl
e of
Con
tens
Tabl
e of
Con
tens
9
4.CONCLUSIONS DISCUSSIONS AND RECOMMENDATIONS ................... 183
4.1. Structural characteristics of families ..................................... 183
4.2. Status of mothers and fathers ................................................. 184
4.3. Number of children in the family and the preferences ............ 185
4.4. Age for school enrollment and child’s development .................. 185
4.5. Health and disability status ................................................. 187
4.6. School preparation activities of unenrolled children ................. 187
4.7. Kindergarten / kindergarten attendance ..................................... 187
4.8. School enrollment decision ........................................................... 187
4.9. School-bussing system and YIBO’s ............................................... 188
4.10. Regulation for primary education institutions: Article 15 ........ 188
4.11. Traditional and religious factors ................................................ 188
4.12. Effect of female-male children ................................................ 188
4.13. The case of native language ...................................................... 189
4.14. Being able to focus on late enrollment to school .................... 189
4.15. Work of actors and their roles .................................................... 189
4.16. Recommendations for future efforts and studies .................... 190
4.17. Effective communication practices ................................. 190
4.18. Tasks for the relevant parties .......................................... 190
4.19. Recommendations generated from quantitative and
qualitative research findings ..................................................... 191
Tabl
e of
Con
tens

10
5. SHORT TERM STRATEGIC RECOMMENDATIONS BASED ON
WORKSHOP DISCUSSIONS ....................................................................... 192
REFERENCES ................................................................................................... 195
APPENDIX – I DETAILED TABLES ........................................................... 197 APPENDIX – II QUESTIONNAIRES ......................................................... 234
Questionnaire for quantitative data collection ....................................... 234
Interview form for the semi-structured interviews ................................. 253
Focus group meeting discussion guide ....................................................... 263
APPENDIX – III REPORT OF THE “WORKSHOP ABOUT DEVELOPING
STRATEGIES TO ENSURE TIMELY ENROLLMENT OF CHILDREN IN
PRIMARY SCHOOLS.” ..................................................................................... 265
APPENDIX-IV. SAMPLE CARD USED DURING STRUCTURED
INTERVIEWS FOR THE QUANTITATIVE RESEARCH ........................................ 277
Tabl
e of
Con
tens

11
LIST OF TABLES
Table 1. Number of children aged 6-13 in 2007-2008 school year, ratio of unenrolled
children to total number of unenrolled children between the ages 6 through 13 .................... 26
Table 2. Gender distribution of children at the age of compulsory primary schools children
(6 – 13 years)................................................................................................................................... 26
Table 3. School enrollment rates during the period of 8 years of compulsory education
in the academic years between 1997 and 2008 ......................................................................... 27
Table 4. Ratio of children who are not enrolled in school in the year 2001 to total
population of the provinces, March 2008 ..................................................................................... 37
Table 5. Population and sampling ................................................................................................. 38
Table 6. Using a proportional probability sampling technique to determine sample size ....... 39
Table 7. Number of clusters in provinces and districts ............................................................... 40
Table 8. Number of children included in sample for the quantitative study ............................. 41
Table 9. Number of people participating in focus group meetings disaggregated by
province ............................................................................................................................................ 42
Table 10. Number of people interviewed during semi-structured interviews disaggregated
by province ....................................................................................................................................... 43
Table 11. Research participant’s relationship to target child ..................................................... 43
Table 12. Participants of the focus groups disaggregated by the backgrounds of the
stakeholders .................................................................................................................................... 45
Table 13. Number of social stakeholders in semi-structured interviews .................................. 46
Table 14. Social stakeholder participants disaggregated by gender ......................................... 46
Table 15. Timeline for the current research ................................................................................. 48
Table 16. Descriptive statistics for the number of household members ................................... 51
Table 17. Household members shown based on their relationship to the target children....... 51
Table 18. Education and gender distribution of household members 6 years and older who
live in rural and urban areas in the late enrollment group .......................................................... 55
Table 19. Education and gender distribution of household members 6 years and older who
live in rural and urban areas in the unenrolled group .................................................................. 56
Table 20. Sex and education distribution in the late enrollment group for household
members 15 years and older living in the rural and urban areas ............................................... 58
Table 21. Distribution of the employment status of the household members ......................... 59
Table 22. Employment status of household members 15 years of age and older ................... 60
Table 23. Types of jobs held by household members 15 years of age and older ..................... 60
Table 24. Distribution of number of student household members ............................................ 62
Table 25. Number of children living in the household ................................................................. 62
Table 26. Whether students in the household attend regional boarding schools .................... 64
Table 27. Distribution of mothers based on their marital status ............................................... 67

12
Table 28. Distribution of the fathers’ ages .......................................................................... 68
Table 29. Distribution of the educational status of the fathers .................................... 68
Table 30. Types of jobs fathers hold .................................................................. 69
Table 31. Ways to close income-expenditure gap ................................................ 72
Table 32. Ownership status of the home the families live in .......................... 73
Table 33. Average size of the home ......................................................................... 73
Table 34. Descriptive statistics for the number of rooms in the residence the household
member live in ................................................................................................................. 74
Table 35. Calculated age (based on participant reports) of the children whose ID date of
birth was 2001 ........................................................................................................... 79
Table 36. Distribution of those whose reports indicated a discrepancy between the
actual and the recorded age of the child by province they live in ................... 80
Table 37. Birth months as indicated in the ID record of children who were born in 2001 81
Table 38. Whether their health problems or consequences of their health problems had
lasting effects .................................................................................................................. 83
Table 39. How much does the health issue when the child was born influence life quality
of the child .................................................................................................................. 84
Table 40. Effects of the child’s health problem lasting since birth on child’s life . 85
Table 41. Health status of children when born based on the province .............. 86
Table 42. Effects of the child’s illness/special need on his/her life ............... 87
Table 43. Length of illness/disability ..................................................................... 88
Table 44. Descriptive statistics for parental reports of children’s heights that did not
enroll in school on time by child sex ........................................................... 91
Table 45. Descriptive statistics for children’s weight .................................... 92
Table 46. Participants’ knowledge of legal age for school enrollment by province ... 94
Table 47. Mothers’ knowledge of legal age for school enrollment by level ofeducation .. 95
Table 48. Fathers’ knowledge of legal age for school enrollment by level of education ... 96
Table 49. Participants’ knowledge of legal age for school enrollment by having social
security/insurance ............................................................................................................ 97
Table 50. Participants’ knowledge of legal age for school enrollment by living in urban
or rural areas ................................................................................................................................... 100
Table 51. How the information about the age for school enrollment is obtained .................... 101
Table 52. Whether the participants thought the child was enrolled in school on time
based on the province they lived in ......................................................................... 102
Table 53. Participants’ educational levels and their views on whether they believed their
children had enrolled in school on time ................................................................ 103
Table 54. Participant responses on whether they believe their children had enrolled in
school on time based on whether they live in urban or rural areas ........................ 103
13
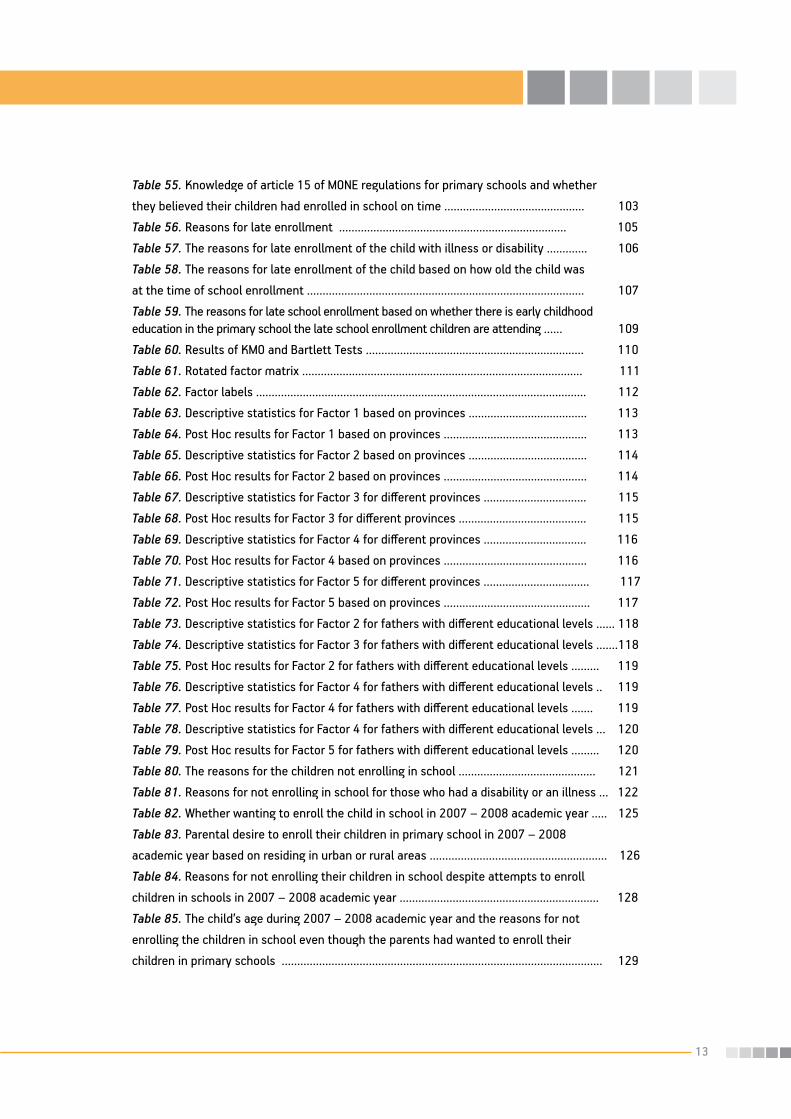
Table 55. Knowledge of article 15 of MONE regulations for primary schools and whether
they believed their children had enrolled in school on time ............................................. 103
Table 56. Reasons for late enrollment ......................................................................... 105
Table 57. The reasons for late enrollment of the child with illness or disability ............. 106
Table 58. The reasons for late enrollment of the child based on how old the child was
at the time of school enrollment ......................................................................................... 107
Table 59. The reasons for late school enrollment based on whether there is early childhood education in the primary school the late school enrollment children are attending ...... 109
Table 60. Results of KMO and Bartlett Tests ...................................................................... 110
Table 61. Rotated factor matrix .......................................................................................... 111
Table 62. Factor labels .......................................................................................................... 112
Table 63. Descriptive statistics for Factor 1 based on provinces ...................................... 113
Table 64. Post Hoc results for Factor 1 based on provinces .............................................. 113
Table 65. Descriptive statistics for Factor 2 based on provinces ...................................... 114
Table 66. Post Hoc results for Factor 2 based on provinces .............................................. 114
Table 67. Descriptive statistics for Factor 3 for different provinces ................................. 115
Table 68. Post Hoc results for Factor 3 for different provinces ......................................... 115
Table 69. Descriptive statistics for Factor 4 for different provinces ................................. 116
Table 70. Post Hoc results for Factor 4 based on provinces .............................................. 116
Table 71. Descriptive statistics for Factor 5 for different provinces .................................. 117
Table 72. Post Hoc results for Factor 5 based on provinces ............................................... 117
Table 73. Descriptive statistics for Factor 2 for fathers with different educational levels ...... 118
Table 74. Descriptive statistics for Factor 3 for fathers with different educational levels .......118
Table 75. Post Hoc results for Factor 2 for fathers with different educational levels ......... 119
Table 76. Descriptive statistics for Factor 4 for fathers with different educational levels .. 119
Table 77. Post Hoc results for Factor 4 for fathers with different educational levels ....... 119
Table 78. Descriptive statistics for Factor 4 for fathers with different educational levels ... 120
Table 79. Post Hoc results for Factor 5 for fathers with different educational levels ......... 120
Table 80. The reasons for the children not enrolling in school ............................................ 121
Table 81. Reasons for not enrolling in school for those who had a disability or an illness ... 122
Table 82. Whether wanting to enroll the child in school in 2007 – 2008 academic year ..... 125
Table 83. Parental desire to enroll their children in primary school in 2007 – 2008
academic year based on residing in urban or rural areas ......................................................... 126
Table 84. Reasons for not enrolling their children in school despite attempts to enroll
children in schools in 2007 – 2008 academic year ................................................................ 128
Table 85. The child’s age during 2007 – 2008 academic year and the reasons for not
enrolling the children in school even though the parents had wanted to enroll their
children in primary schools ....................................................................................................... 129

14
Table 86. Reasons for unenrolled children to be not enrolled in schools in 2007-2008
academic year although the parents had wanted to enroll their children in school .......... 130
Table 87. Reasons for unenrolled children to be not enrolled in schools in 2007-2008
academic year although the parents had wanted to enroll their children in school by
living in rural or urban areas .................................................................................................... 131
Table 88. Attempts made to enroll the child in school up to this point ........................ 132
Table 89. The reasons for enrolling the child in school in 2008 – 2009 academic year .... 133
Table 90. Reasons for enrolling children in school a year later ................................. 134
Table 91. The reasons for enrolling their children in school 2008-2009 academic year
for those parents who wanted to enroll their children in school 2007-2008 academic year 135
Table 92. Sources of information about the school enrollment age .................................... 137
Table 93. Petitioning to postpone children’s school enrollment disaggregated by fathers’
educational levels ..................................................................................................................... 139
Table 94. Petitioning to postpone children’s school enrollment disaggregated by living
in urban and rural areas ........................................................................................................... 139
Table 95. Whether families received guidance about the school enrollment again the
2007-2008 academic year disaggregated by living in urban and rural areas ..................... 141
Table 96. Distribution of the people who informed families that the school enrollment
age was six ................................................................................................................................ 141
Table 97. The information given by the person who guided the families that they
needed to enroll their 6 year old children in school .............................................................. 142
Table 98. Whether the information about all 6 year old children being required
to be in school was given before or after the registration period of 2007 – 2008
academic year ............................................................................................................................ 143
Table 99. Activities late enrollment children engaged majority of the time within
a day during 2007 – 2008 academic year .............................................................................. 146
Table 100. Activities unenrollment children engaged majority of the time within
a day during 2007 – 2008 academic year .............................................................................. 147
Table 101. Relationship status of the individual who decided to enroll the child
in school and lives outside the home ...................................................................................... 148
Table 102. Educational activities taught at home to children in the late enrollment
group .......................................................................................................................................... 149
Table 103. Educational activities thought at home to children in the no enrollment group . 150
Table 104. Activities the children engaged in a typical day the previous year when
the child was out of school ...................................................................................................... 151

15
Table 105. Descriptive statistics for the frequency of activities children engage in during a typical day in 2007-2008 academic year when they were out of school in the late enrollment group ....................................................................................................................... 157Table 106. Frequency of the activities the children engage in during a typical day in the
no enrollment group ....................................................................................................... 158
Table 107. Descriptive statistics for the frequency of activities children engage in during
a typical day in 2007-2008 academic year when they were out of school in the no
enrollment group ....................................................................................................................... 159
Table 108. How influential were the factors contributing to children’s enrollment in
schools in 2007-2008 academic year in the late enrollment group ............................. 162
Table 109. How influential were the factors contributing to children’s enrollment in
schools in 2007-2008 academic year in the no enrollment group ....................................... 164
Table 110. Parental ratings of various factors that contributed to children’s late
enrollment .................................................................................................................................. 166
Table 111. Parental ratings of various factors that contributed to children’s late
enrollment .................................................................................................................................. 168
Table 112. Examination of being informed of the financial support state provides
for girls’ education disaggregated by the province that they live in ................................... 169
Table 113. Examination of being informed of the financial support state provides
for girls’ education disaggregated by the fathers’ occupation .............................................. 170
Table 114. Examination of being informed of the financial support state provides
for girls’ education disaggregated by the total incomes of the families .............................. 171
Table 115. Examination of receiving financial support the state provides for girls’
education disaggregated by fathers’ occupation .................................................................... 173
Table 116. Type of aid received from the state ...................................................................... 174
Table 117. Factors that would contribute to parents enrolling their children in school 176
Table 118. Expected changes in the living conditions that would contribute to parents
enrolling their children in school on time ................................................................................ 177
Table 119. Expectations from the state to enroll children in school on time ...................... 178
Table 120. Factors influencing the decision to enroll children in school the
following year ............................................................................................................................ 180
Table 121. When would those parents who considering enrolling their children in school
in the future would enroll their children in school ................................................................. 181

16
LIST OF APPENDIX TABLES
Appendix Table 1. Net enrollment rates of males at single ages based on the
developmental degrees of the provinces ........................................................................ 197
Appendix Table 2. Net enrollment rates of females at single ages based on the
developmental degrees of the provinces .................................................................. 197
Appendix Table 3. Sex distribution of participants in semi-structured interviews ...... 198
Appendix Table 4. Distribution of participants in relation to the target child ....... 198
Appendix Table 5. Age group distribution of participants in semi-structured interviews . 199
Appendix Table 6. Distribution of participants in semi-structured interviews based
on level of education ............................................................................................................... 199
Appendix Table 7. Distribution of participants in semi-structured interviews based
on their occupations .................................................................................... 200
Appendix Table 8. Distribution of participants in semi-structured interviews based
on how long they have worked at their current jobs ............................................... 200
Appendix Table 9. Distribution of household members based on their relationship
to the target child who did not participate in school on time ........................................... 201
Appendix Table 10. Age distribution of household members ........................................... 202
Appendix Table 11. Age – sex distribution based on living in urban and rural living areas . 203
Appendix Table 12. Age – sex distribution based on living in urban and rural living areas . 204
Appendix Table 13. Sex and education distribution of household members 15 years of
age and above living in urban and rural living areas .......................................................... 205
Appendix Table 14. Employment status of household members based on age groups
in late enrollment group .................................................................................................. 206
Appendix Table 15. Occupational distribution of household members15 years of age
and above ................................................................................................................................. 207
Appendix Table 16. Distribution of educational backgrounds of the mothers .................. 207
Appendix Table 17. Distribution of occupations mothers have .......................................... 208
Appendix Table 18. Distribution of occupations fathers have ............................................ 208
Appendix Table 19. Rental rates ........................................................................................... 209
Appendix Table 20. Distribution of the size of the residence ............................................. 209
Appendix Table 21. Reasons for the difference between the actual age and the age
indicated in state ID cards ..................................................................................................... 210
Appendix Table 22. Detailed description of the problems children experienced at birth .. 211
Appendix Table 23. Having an illness or a disability that would prevent the child
from enrolling in school on time .............................................................................................. 214
Appendix Table 24. Height of the child who was not enrolled in school on time based on
the actual year of birth ............................................................................................... 216
Appendix Table 25. Weight distribution of children ............................................................... 217

17
Appendix Table 26. Sources of information about the school enrollment age ................ 217
Appendix Table 27. Reasons for late enrollment ....................................... 218
Appendix Table 28. Reasons for late enrollment of the child who had a
disability/illness ..................................................................................................................... 219
Appendix Table 29. Reasons for no enrollment .................................................................. 220
Appendix Table 30. Whether they wanted to enroll the child in school in 2007-2008
academic year disaggregated by the province they lived in ............................................... 221
Appendix Table 31. Whether they wanted to enroll the child in school in 2007-2008
academic year disaggregated by fathers’ educational levels .......................................... 221
Appendix Table 32. Whether they wanted to enroll the child in school in 2007-2008
academic year disaggregated by total household income ................................................. 222
Appendix Table 33. Reasons for children to stay out of school despite wanting to enroll
the child in school during 2007-2008 academic year ......................................................... 223
Appendix Table 34. Attempts made to enroll the child in school previously
disaggregated by the province they live in .............................................................. 224
Appendix Table 35. Reasons to enroll the children in school after a year delay ............. 225
Appendix Table 36. Reasons for enrolling children in school during 2008-2009
academic year instead of enrolling children in school during 2007-2008 academic year . 226
Appendix Table 37. Being informed of article 15 of primary schools regulations of
ministry of education disaggregated by the province they lived in ....................... 228
Appendix Table 38. Whether participants applied to legally postpone child’s
enrollment in school disaggregated by the province they lived in ......................... 229
Appendix Table 39. Whether participants were informed of the school enrollment
age during 2007-2008 academic year disaggregated by the province they lived in ...... 230
Appendix Table 40. People who were influential in the decision to not enroll children
in school during 2007-2008 academic year ............................................. 231
Appendix Table 41. Distribution of the people who were most influential in the
decision to not enroll children in school during 2007-2008 academic year ......... 232
Appendix Table 42. Whether they received state’s financial support for the
enrollment of their girls in schools disaggregated by the province they lived in ............. 233
Appendix Table 43. Whether they received state’s financial support for the enrollment
of their girls in schools disaggregated by total family income ........................................... 233
18
LIST OF FIGURES
Figure 1. Net enrollment rates during the period of 8 years of compulsory education in
the academic years between 1997 and 2008 ................................................................... 28
Figure 2. School enrollment rates for single ages by child sex ....................................... 29
Figure 3. Sex ratios by academic years ............................................................................. 29
Figure 4. 2007 – 2008 school year net schooling rates for age 6 ................................... 32
Figure 5. Net schooling rates for boys based on developmental degree of the
provinces they live in ......................................................................................................... 34
Figure 6. Net schooling rates for boys in the provinces that were included in the study ... 34
Figure 7. Net enrollment rates for girls at single ages disaggregated by the
developmental degrees of provinces ................................................................................. 35
Figure 8. Net enrollment rates for girls at single ages in the provinces included in the
study...................................................................................................................................... 35
Figure 9. Provinces included in the study ......................................................................... 37
Figure 10. Total number of people living in the household ............................................. 50
Figure 11. Gender distribution of the household members .............................................. 52
Figure 12. Educational levels of household members older than 15 years of age ........ 53
Figure 13. Age and gender distribution in the rural and urban living areas .................... 57
Figure 14. Age and gender distribution in the rural and urban living areas .................... 57
Figure 15. Whether the household members have social security ................................. 61
Figure 16. Reasons for children living outside of the household ..................................... 63
Figure 17. Whether the parent child is living together is a stepparent or a biological
parent ..................................................................................................................................... 65
Figure 18. Distribution of the mothers’ ages based on 5 year age ranges ..................... 66
Figure 19. Average monthly expenditure of households .................................................. 71
Figure 20. Total household monthly income ..................................................................... 71
Figure 21. School enrollment status of children born in 2001 who were not enrolled
in school on time .................................................................................................................. 76
Figure 22. Sex distribution of children who were not enrolled school on time .............. 77
Figure 23. Age of the child based on the calculation of the participant ......................... 78
Figure 24. Consistency between the actual and the recorded date of birth for the
child who did not enroll in school on time ......................................................................... 78
Figure 25. Health of children when they were born .......................................................... 82
Figure 26. Whether the child had an illness or disability that would prevent the child
from enrolling in school on time ......................................................................................... 83
Figure 27. Figure of knowledge of children’s height and weight ...................................... 89
Figure 28. Height of children who did not enroll primary school on time ....................... 90
Figure 29. Knowledge the target children’s weight .......................................................... 91
Figure 30. Weight of children who did not enroll primary schools on time .................... 92

19
Figure 31. Participants’ knowledge of legal age for school enrollment .............................. 93
Figure 32. Knowledge of MONE, Department of Primary Education Bylaws Article 15 and Participants’ knowledge of legal age for school enrollment in late enrollment group 99
Figure 33. Participant responses about whether they thought their children were
enrolled in school on time or not ............................................................................................ 102
Figure 34. Whether there is early childhood education in the primary school the
late school enrollment children are attending ............................................................... 108
Figure 35. Parental desire to enroll their children in primary school in 2007 – 2008
academic year based on financial status of the legal guardian ........................................... 127
Figure 36. Whether parents had made attempts to enroll their children in school up
to this point ............................................................................................................................... 132
Figure 37. Knowledge of Article 15 within MONE Regulations for Primary School
Institutions Ministry of Education ........................................................................................... 136
Figure 38. Knowledge of Article 15 in Ministry of Education Primary Schools Regulations
based on living in rural or urban areas in late enrollment group .................................. 137
Figure 39. Whether parents petitioned to delay their child’s enrollment in schools
in late enrollment group ................................................................................................... 138
Figure 40. Someone giving information to families about the school enrollment age
being 6 in the academic year of 2007 – 2008 ....................................................................... 140
Figure 41. Those who decide to enroll the children in school in 2008-2009 academic
year ............................................................................................................................................ 144
Figure 42. Teaching educational activities at home during 2007 – 2008 academic year 148
Figure 43. Looking after siblings disaggregated by child sex .............................................. 152
Figure 44. Playing at home or in the streets disaggregated by child sex ........................... 152
Figure 45. Playing computer games disaggregated by child sex ......................................... 152
Figure 46. Helping with household chores disaggregated by child sex .............................. 152
Figure 47. Helping with the work in the field and in the garden disaggregated by child sex 153
Figure 48. Child receiving educational activities disaggregated by child sex .................... 153
Figure 49. Child helping with the care of a sick person at home disaggregated by
child sex ..................................................................................................................................... 153
Figure 50. Helping with the work in the place the families go to work as seasonal workers
disaggregated by child sex ...................................................................................................... 153
Figure 51. Child attending kindergarten disaggregated by child sex .................................. 154
Figure 52. Child engaging in painting and music activities disaggregated by child sex .... 154
Figure 53. Looking after siblings disaggregated by living in urban or rural areas ............. 155
Figure 54. Playing at home or in the streets disaggregated by living in urban or rural
areas .......................................................................................................................................... 155
Figure 55. Playing computer games disaggregated by living in urban or rural areas ........ 155
Figure 56. Helping with the work in the place the families go to work as seasonal workers
disaggregated by living in urban or rural areas ..................................................................... 155

20
Figure 57. Child attending kindergarten disaggregated by living in urban or rural areas ... 156
Figure 58. Child engaging in painting and music activities disaggregated by living in urban
or rural areas .............................................................................................................................. 156
Figure 59. Looking after siblings disaggregated by child sex ................................................ 160
Figure 60. Playing at home or in the streets disaggregated by child sex ............................. 160
Figure 61. Playing computer games disaggregated by child sex ........................................... 161
Figure 62. Helping with household chores disaggregated by child sex ................................ 161
Figure 63. Whether parents were informed of the financial support state provides for
enrolling girls in schools ............................................................................................................ 167
Figure 64. Being informed of textbooks being given free of charge disaggregated by living
in rural and urban areas ............................................................................................................. 171
Figure 65. Examination of being informed of the financial support state provides for girls’ education disaggregated by living in urban and rural areas .................................................. 171
Figure 66. Examination of receiving the financial support state provides for girls’
education .................................................................................................................................... 172
Figure 67. Whether these aids were influential in the child enrolling in school in
2007-2008 academic year ........................................................................................................ 174
Figure 68. Whether being informed of this aid contribute to beliefs about sending girls
in schools ....................................................................................................................... 175
Figure 69. Whether the parents are interested in enrolling their children in school in the unenrolled group ........................................................................................................................ 179
Figure 70. Being informed of free textbook distribution of the state for primary school
children ........................................................................................................................................ 181

21
ABBREVATIONS
EU EUROPEAN UNION (AB)
MCEF MOTHER CHILD EDUCATION FOUNDATION (AÇEV)
SPO STATE PLANNING ORGANIZATION (DPT)
GEC THE GIRLS’ EDUCATION CAMPAIGN (HKO)
MONE MINISTRY OF NATIONAL EDUCATION (MEB)
NGO NON GOVERNMENTAL ORGANIZATION (STK)
TRT TURKISH RADIO TELEVISION CORPORATION
TSI TURKISH STATISTICAL INSTITUTE (TÜİK)
UNESCO UNITED NATIONS EDUCATIONAL, SCIENTIFIC AND CULTURAL ORGANIZATION
UNICEF UNITED NATIONS CHILDREN’S FUND
RBS REGIONAL BOARDING SCHOOLS (YİBO)
SSI SOCIAL SECURITY INSTUTITION (SGK)
GRC GUIDANCE AND RESEARCH CENTER (RAM)

22
SUMMARYLate school enrollment is one of Turkey’s recently recognized educational issues. As defined by the Ministry of National Education (MONE) bylaws for elementary schools in Turkey, the concept of late school enrollment refers to the phenomenon of children not enrolling in formal schooling when they were at the legal age for school enrollment in the beginning of the school year. The minimum legal age for school enrollment is 72 months. Late school enrollment is especially problematic in the Eastern and South Eastern provinces of Turkey. There are many factors responsible for late school enrollment.
With collaboration between MONE and UNICEF, this project was carried out by the GENAR Research and Consulting Company. The goals of this research were to 1) explore the various aspects of the phenomenon called “late school enrollment,” 2) describe the profiles of families whose children are late entrants, 3) determine the causes of the problem and 4) develop strategies to help increase the number of children entering school on-time. Both qualitative and quantitative research methods were used in this research study. Ten provinces were included in the study and were selected using e-school and Address Registration System findings on school enrollment for 6 year olds for the school year 2007-2008. These provinces were Ağrı, Van, Muş, Osmaniye, Şanlıurfa, Şırnak, Hakkâri, Bitlis, Diyarbakır and Gümüşhane. A total of 1.095 (N= 1.095) children were included in the study. These children included those who were eligible to attend school the previous year but attended school a year later (Late enrollment, n= 959) and those children who are still unenrolled despite being school-eligible for two years (No enrollment, n= 136). The children’s households were visited and one person, generally a mother, was interviewed. During these interviews, a series of questions was asked to collect data about household demographics, development of the child who did not enter school on time, and the reasons why these children were not in school. For the qualitative part of the research, focus group meetings and semi-structured interviews were used. Focus group meetings were conducted with a total of 42 people in the provinces of Ağrı, Van, Şanlıurfa, Diyarbakır and Bitlis. There were between 6 to 10 people in each meeting. Meeting participants included
parents, teachers, school principals, mukhtars, local governors, MONE directors, religious official, and representatives from non-governmental organizations and local media. Semi-structured interviews took place in the provinces where focus group meetings took place. Of the respondents, six were parents (five fathers, one mother), and the rest were individuals in the community.
Research findings indicated that children who enteredschool late are generally from families with low socio-economic status (SES). These families were nuclear, with both a mother and father present, and consisted of seven family members and five children, on average. One consequence of having a low SES level is that many parents try to close the gap between income and expenditure by getting into debt and obtaining assistance from different sources.
This situation is worsened by the limited education of parents. Most mothers who delay school entry of their children do not know how to read or write. Although fathers have more education than mothers, on average, the overall level of education is still very low. Most mothers are housewives and do not have jobs outside of the home that generate income. Unemployment is widespread, and fathers with jobs mostly work without a stable income. When the household profiles of children who are in the late group are compared to those who have not yet entered school, the SES of the “unenrolled” group was much lower than the “late enrollment” group.
When families were asked why their children were not enrolled in school by the cut-off-age, the reasons listed included: thinking the child’s age was too young, thinking the child needed time to mature because the child was perceived to be too weak and small developmentally, financial difficulties and problems accessing schools. Parents who late their children’s school entrance one year were more likely to cite as a reason their child was too young.
Among the no enrollment group, it was found that financial problems were more prominent. However, developmental concerns or illness-related issues were expressed more frequently in this group. Thinking the child was too young for school was also among the reasons for not enrolling in school.

23
For both groups families had difficulties with the calculation of their children’s age and lacked necessary information about the age at which children start school. Families were not informed about MONE regulations.
Another important finding emerged when the characteristics of the no enrollment and late enrollment children were examined. There were more male children in the late enrollment group and more girls in the no enrollment group. Considering that families have limited resources, it appears that families prefer that male children attend school. Moreover, when access to schools is difficult and schools are at distant locations, girls are less likely to attend school.
Although it looks like families report making decisions to send their children to school together, fathers have more influential roles in the decision making process. The biggest reason why families send their children one year late to school is their belief that their children are now at school age or their children physically matured enough to attend school. In the no enrollment group, it was reported that the most influential reason why families send their children to school would be improvements in their financial status.
How children spent their time while they were out of school was examined. Children mainly spent their time playing at home or outside in the neighborhood. These children engaged in very few activities that would help them prepare for school. Almost none of the children who were kept out of school because they were too young were enrolled in a preschool or kindergarten.
Not being able to speak Turkish, a unique problem for the people living in the East and Southeast regions is a factor influencing whether families can access available resources. Language is another factor negatively influencing whether children enroll in schools when they are at the legal age.
This research investigated the factors associated with school no enrollment when children are age-eligible. It was found that economical factors (e.g., families cannot pay for the school expenditures and unemployment) social and cultural factors (e.g., limited parental education), not recognizing the importance of enrolling children in school when
they are age-eligible, not sending girls to school, language barriers, traditions, problems with schools (e.g., access to schools, the school-busing program, limited resources parental awareness, family structure (e.g., too many children, level of parental education), confusion about legal age for school enrollment, and limited screening work of children at the legal age for school enrollment all contribute to not enrolling children at the legal age for school. Short term plans should include identifying children who do not enroll school on time, creating awareness among families and providing financial support. Following this, long term plans should be prepared taking into consideration the needs of these provinces that have educational problems, and providing solutions that address the unique problems of the region.
24
1. INTRODUCTIONThe Universal Declaration of Human Rights and Convention on the Rights of Child both indicate that obtaining basic education is a right of every human being. Article 26 of Human Rights Declaration states that “Everyone has the right to education. Education shall be free, at least in the elementary and fundamental stages. Elementary education shall be compulsory.” This statement clearly presents the responsibilities and the position of the countries that signed the document (http://www.unicef.org/turkey/pdf/_gi17.pdf). The UNICEF Convention On The Rights Of The Child, Article 28 indicates that all children have the right to education. It was also emphasized that, particularly in the developing world, this right should be guaranteed by the state and the state should monitor and ensure regular school attendance (http://www2.ohchr.org/english/law/crc.htm#art28).
Parties recognize the right of the child to education, and with a view to achieving this right progressively and on the basis of equal opportunity, they shall, in particular: Make primary education compulsory and available free to all; Take measures to encourage regular attendance at schools and the reduction of drop-out rates. Parties shall take all appropriate measures to ensure that school discipline is administered in a manner consistent with the child’s human dignity and in conformity with the present Convention. States Parties shall promote and encourage international co-operation in matters relating to education, in particular with a view to contributing to the elimination of ignorance and illiteracy throughout the world and facilitating access to scientific and technical knowledge and modern teaching methods. In this regard, particular account shall be taken of the needs of developing countries.
In addition to these documents, The World Education Forum met in 2000 and passed certain agreements. These decisions included concerted action to combat gender inequalities in primary and secondary education by year 2005 (UNESCO, 2000). Furthermore, the decisions also included that by year 2015, in all levels of education gender inequalities that put girls at disadvantage shall be removed. By this year, again the decisions included achieving gender equality and
providing free compulsory and good quality education for all (Kavak, Ergen, 2007).
In addition to the international documents, in our country, since the foundation of the Republic of Turkey, education has been among the most emphasized issues by the state. In the 1924 Constitution, the right to basic education for children of compulsory school age was clearly stated. For this reason, in the early years of the republic, national literacy campaigns were started and important steps have been taken to increase school enrollment rates. The right to have basic education was protected in all the various constitutions passed since the foundation of the republic by providing education as a constructional right for children who are at the age of compulsory schooling. Global principals and objectives of the Convention on the Rights of Child for primary school education were also adopted, and national laws were passed to guarantee these as rights for children. As a result, providing free compulsory education and equal opportunities for all children were included both in the constitutions (1961 and 1982 constitutions) and the National Education Basic Law (1973) and the Primary Education Act (1961).
When Turkey’s five-year development plans were examined, even though expansion of primary school education to all children has been on the agenda starting in the 1970s, this goal has not been achieved. For the 2005-2006 school year, the net enrollment rate was 95.6%. However, 100% was targeted for the 2012-2013 school year, (Ninth Development Plan 2007-2013, SPO).
In addition, the Ministry of Education has also implemented various comprehensive programs. The main goal of the projects like National Education Development Project, Basic Education Programs and Projects (http://web.worldbank.org), the EU Basic Education Support Program (http://www.meb.gov.tr - 11.28.2007-) is to make primary education available for the children who are the expected age to start school. Children who are at the expected age to start school are the children who are at the legal age at the beginning of an academic year to enroll in primary school. Of these programs, the Basic Education Program and the EU Basic Education Support Program

25
are still going on, and the activities are underway to reach this goal. Even though a lot of progress has been made because of these projects, the goal to reach all children at the age of compulsory education and to provide them with educational opportunities has not been reached (MONE, National Education Statistics, Formal Education, 2007-2008). In addition to these projects, because studies about gender inequalities have shown that girls were at a disadvantage, MONE and UNICEF have launched the girl’s education campaign called “Haydi Kızlar Okula (HKO)” (“Hey Girls, Let’s Go to School”) in 2003. With this campaign, MONE aimed at reaching a 100% enrollment rate by the end of 2007. To accomplish this goal by the end of 2007 involved bringing the girls aged 6-14 back into the schooling system who were taken out of school due to reasons such as absenteeism, not enrolling in school, or dropping out of school. As a result, by the end of 2006, in Turkey as a whole, there were 273.447 girls who were out of the school system between the years 2003 and 2006. Of these girls, 222.800’ of them (81%) were brought back to school system with the girls’ education campaign. MONE reports that the work is underway to bring the remaining girls back into the school system (http://haydikizlarokula.meb.gov.tr-/uygulama_sonuclari.php).
In Turkey there are two different terms used to explain schooling rates. One of them is “gross enrollment rate” and the other is “net enrollment.” Previously, primary school enrollment rates were reported using “gross enrollment” rates by the involved institutions (such as, SPD, TSI and MONE). Especially since 2000, there are debates concerning age groups as well as net enrollment rates. Gross enrollment rates are based on total number of children in primary schools. As a result, in cities where there are a lot of repeat children at various grade levels, these enrollment rates based on gross enrollment have a tendency to appear much higher. However, for participation in the educational system to be represented more realistically, to be able to calculate the number of children out of school, and because it is based on the ratio and allows for comparisons with similar situations, and because it shows a clearer picture of school enrollment rates, net enrollment rates are more important than gross enrollment rates. Recently, in order to calculate
the number of children who are out of schools, and those who did not start school at the year they were expected to, net enrollment rates have been used. Net enrollment rate is calculated by dividing the number of students enrolled in primary education who are of the official primary school age by the population for the same age-group and then multiplying the results by 100. (MONE, National Education Statistics, Formal Education, 2007-2008,). According to the National Education Formal Education Statistics for 2007 – 2008 published by the Ministry of National Education, the net enrollment rate in primary education was 97.37% in 2007-2008 academic year (MONE, National Education Statistics, Formal Education, 2007-2008).
When data from the address-based registration system and e-school are examined, in March 2008 there were 410.000 children between the ages 6-13 who were unenrolled in schools. Of these children, 35% (approximately 145.000) were children who were six (6) years of age (See Table 1). For children who were at the age of seven, unenrollment rate was 9.5% (38.000). Even though these numbers show children of that given year who were unenrolled in school, there were more 6 year old children, (1/3), represented than 7 year old children, (1/10), within the group of unenrolled children. This finding illustrates that 6 years old children were more likely to experience late entry into the school system.

26
1.1.Problem1.1.1. Population of children between 6-13 years of age in TurkeyAccording to Ministry of Education “e-school” data foMarch 2008, in Turkey there are a total of 10.126.411 children between the ages of 6 – 13.
When the entire country of Turkey is considered, the central district of Diyarbakır province has the highest number of children within this age group with 162.222 children. The next district following this is Gaziosmanpaşa which is the largest district of İstanbul province with 155.015 children. Bingöl’s Yayladere district has the lowest number of children within this age group with 75 children.
Source: Population statistics, State Ministry of Internal Affairs and Census Department Address Registration System (2008)Data for unenrolled children were obtained from population statistics and MONE’s (March, 2008)
Table 2. Gender distribution of children at the age of compulsory primary schools children (6 – 13 years) (%)
Source: Population statistics were obtained from the Ministry of Internal Affairs, the General Directorate of Population and Citizenship, Address Based Registration System (2008).
13 Years1994
Age/Year of birth
12 Years1995
11 Years1996
10 Years1997
9 Years1998
8 Years1999
7 Years2000
6 Years2001 Total
Table 1. Number of children aged 6-13 in 2007-2008 school year, ratio of unenrolled children to total number of unenrolled children between the ages 6 through 13
Age / year of birthNumber of
children
Number of enrolled children
Number of unenrolled
children
Ratio of unenrolled children to total number of unenrolled children between the ages 6
through 13
6 years / 2001 1.259.663 1.114.898 144.765 35.4
7 years / 2000 1.287.273 1.248.630 38.643 9.5
8 years / 1999 1.284.752 1.257.863 26.889 6.6
9 years / 1998 1.286.715 1.261.259 25.456 6.2
10 years / 1997 1.282.727 1.254.762 27.965 6.8
11 years / 1996 1.234.804 1.201.871 32.933 8.1
12 years / 1995 1.227.844 1.183.195 44.649 10.9
13 years / 1994 1.262.633 1.195.137 67.496 16.5
Total 10.126.411 9.717.615 408.796 100
Female 51,21 51,33 51,34 51,34 51,3 51,21 51,28 51,34 51,29
Male 48,79 48,67 48,66 48,66 48,7 48,79 48,72 48,66 48,71
Total 100 100 100 100 100 100 100 100 100

27
Gross Net Gross Net Gross Net
1997-1998 89,51 84,74 96,26 90,25 82,43 78,97
1998-1999 94,31 89,26 100,72 94,48 87,60 83,79
1999-2000 97,52 93,54 103,31 98,41 91,47 88,45
2000-2001 100,93 95,28 106,32 99,58 95,31 90,79
2001-2002 99,45 92,40 104,19 96,20 94,51 88,45
2002-2003 96,49 90,98 100,89 94,49 91,91 87,34
2003-2004 96,30 90,21 100,31 93,41 92,14 86,89
2004-2005 95,74 95,74 99,48 99,48 91,85 91,85
2005-2006 95,59 89,77 98,83 92,29 92,24 87,16
2006-2007 96,34 90,13 99,21 92,25 93,37 87,93
2007-2008 104,54 97,37 106,41 98,53 102,57 96,14
Source: MONE, National Education Statistics Formal Education, 2007-2008
Table 3. School enrollment rates during the period of 8 years of compulsory education in the academic years between 1997 and 2008 (%)
Total Male Female
1.1.2. School enrollment rates disaggregated by academic year (during the period of 8 years of compulsory education) and gender (Gross – Net)When the children at the age of the 8 years of compulsory education were examined based on sex, there are no significant differences for different age groups. It was found that girls as a whole constituted 49% of the students while boys constituted 51%.
Table 3 and Figure 1 show the enrollment rates of children during the 8 year compulsory education period for different academic years. Enrollment rates for 1997 and the years following that up to the year 2007 were calculated based on 2000 population census data and the latest population projections, and the school enrollment rates for 2007 – 2008 academic year were calculated based on Address Registration System results and 2007 population census data. When the school enrollment rates were examined, striking gender differences in enrollment rates are noticeable. Even though there is a notable increase in girls’ school
enrollment rates, the differences between males and females are still present. At the same time, how the 2001 economic crisis influenced the enrollment can easily be noticed in 2001-2002 academic year and in the years following. In the 2000-2001 academic year, the net enrollment rate was 95.28%, but in the years following the net enrollment rates went down to 90.98% and 90.21% to respectively.
When the impact of the financial crisis lessened, an increase in the net enrollment rate was observed. This finding indicates that economical conditions could also influence children’s on-time school enrollment. The important point is that the economic crisis influenced both girls and boys. Interestingly, even though boys’ enrollment rate was higher than girls, it appears that the boys were influenced more by the economical crisis. It is possible to explain this decline in school enrollment rates by families depending on their children, particularly boys, to contribute financially to the family income. This contribution could either be by children’s direct involvement in labor force to support family income or by decreasing the resources families need to allocate to education.

28
When the single age school enrollment rates in Turkey were examined some interesting findings emerged. First of all, these findings show that the net enrollment rates for six-year-old children were lower than all other age groups. Moreover, girls’ enrollment rates are lower than boys for all the other age groups except among six-year-olds. But for the first time at six years of age, the enrollment rates for boys are lower than the enrollment rates for girls. Still, one important factor that needs to be paid attention to is that even though girls’ enrollment rates are higher than boys at six years of age, the enrollment rates are considerably low for both girls (89%) and boys (88%). In fact, when we look at the statistics for children seven years of age, we find that the enrollment rates become more similar to the enrollment rates for the other age groups during primary education, with the expected gender inequality presenting itself to be effective for the remaining grade levels of primary education. Results of all these findings show that gender inequality shows itself at all age levels and girls continue to benefit less from the educational opportunities than do boys. However, both girls and boys experience the problem of late school enrollment. The fact that male children have slightly higher levels of late enrollment shows that while girls experience
the problems of both never attending school and late enrollment, boys face the problem of late school enrollment more.
According to “e-school” March 2008 data, in Turkey there were 411.805 children who were never enrolled in schools. When the provinces were examined for the number of children living in them who were never enrolled in schools, İstanbul, Şanlıurfa, Van, Diyarbakır and Ağrı provinces are among the top. Of those unenrolled children, 10% live in İstanbul. Over one third (35.3%) of the unenrolled children lived in one of the provinces ranked in the top five for total unenrollment. When the gender distribution of the children at the primary school age is examined, it was found that there were more girls in Turkey who never enrolled in schools at every age except for age six.
Source: MONE, National Education Statistics Formal Education, 2007-2008
Figure 1. Net enrollment rates during the period of 8 years of compulsory education in the academic years between 1997 and 2008

29
Source: TSI Address-Based Registration System, e-school March 2008
Source: MONE, National Education Statistics Formal Education, 2007-2008
Figure 2. School enrollment rates for single ages by child sex
Figure 3. Sex ratios by academic years (During the period of 8 years of compulsory education)
Sex ratio1 refers to the number of girls relative to the number of boys. As the ratio increases it means that there are more equal opportunities for girls and boys because the number of girls and boys would be closer to each other. When Figure 3 is examined, it can be seen that the educational reforms carried out
in 1997-1998 academic year allowed for increases in the enrollment rates both for girls and boys. When the “sex ratios” were examined, a tendency for an increase in the ratios was observed, in other words, more equal opportunities for boys and girls were provided.
1 Sex ratio means the relative ratio of the gross enrollment rate of girls to boys for a given academic year and a given age level. In mathematical terms, the two different indicators (gross enrollment rate) divided by each other and then multiplied by 100 (Ministry of Education, National Education Statistics Formal Education, 2007-2008).

30
1.2. Purpose and the significance of the study
Even though examining net and gross school enrollment rates show problems with school enrollment in Turkey, when we examine school enrollment rates for each age group for primary schools, we come an entirely different problem. This problem indicates that overall, in Turkey, children do not enter school at the time they are supposed to enter school when they are 6 years old. This problem is defined as no enrollment in school at the determined age. Article 15 of Ministry of Education Regulations for Primary Schools clearly states the enrollment age for primary school. This article states that “Children who are 72 months old by 31 of December of a given academic year are eligible to enroll in elementary schools that academic year. Even though a child is eligible to enroll in school based on his or her chronological age, if a parent applies with a written request to delay entry to school, a child’s enrollment can be postponed for one year” (http://mevzuat.meb.gov.tr/html/225_0.html). Focusing on how many months old a child is might seem to be a factor that can possibly help increase school enrollment of children by the expected age. This is because, by focusing on the number of months a child has completed, a controversy between how a child’s age is calculated can be avoided2. In other words, any problems that can be experienced because of the confusion about whether the actual age of the child is calculated based on the number of years a child has completed or whether we add one more year to the child’s age for the age the child is going on can be avoided. However, by allowing a parent guardian to give a written request to postpone a child’s enrollment in school for one year, this article provides flexibility to families when they think their child is not physically developed enough to attend school on-time. Even though delaying a child’s school entry can be done without consulting an expert, a written request of a parent guardian is required. If this is not done, a child is considered to be a child who did not enroll in the expected year.
The Ministry of Education listed factors for enrolling in school in the expected year as, child’s age, child’s readiness based on physical development, availability of schools, and parental decisions to enroll children in school (MONE, 2006). Undoubtedly, there is a great interaction among these factors. When these factors are examined in more detail, the families who make the final decision are under the influence of many factors. These factors can be listed as financial opportunities, health and nutrition problems, family structure, religious beliefs and values, traditions customs, traditional family structure, perceptions about women’s role in society and the effects social environment. Findings of numerous international and national researches point to social, economical, environmental and cultural factors such as poverty, disability, gender inequality, migration, low education rates, polygamy, problems with growth and development, neglect, family priorities, scant number of schools, limited number of teachers and schools with insufficient conditions, accessibility of schools, the value given to education or perceptions of functionality of the schools, patriarchal families, role of women in society as factors influencing children not enrolling in school in the expected year (See, Buchmann, 2000; Case, Paxson & Ableidinger, 2004; Çivi & Koruk, 2005; Dilli, 2006; Fazlıoğlu & Dersan, 2004; Kavak & Ergen, 2007; Özbek & Miral, 2003; )
Not enrolling in school by 72 months of age as determined by the Ministry of Education (MONE) regulation comes across as a national problem in Turkey. However, when looked closely, the problem seems to be more prominent especially in the provinces located in the geographical regions of Eastern and Southern Anatolia and more so in their rural living areas. When Figure 4 is examined closely, the provinces where the problem reaches alarming levels can be seen. Based on this picture, MONE and UNICEF determined the provinces to be included in the study as Ağrı, Bitlis, Diyarbakır, Gümüşhane, Hakkâri, Muş, Osmaniye, Şanlıurfa, Şırnak and Van.
When the net enrollment rates for the provinces are examined the lowest net enrollment rates were found
2 There is a confusion on how a child’s age is calculated. For example, a child who is 75 months old (6 years and 3 months) would be considered 6 by MONE and by some families but others consider this child as 7.
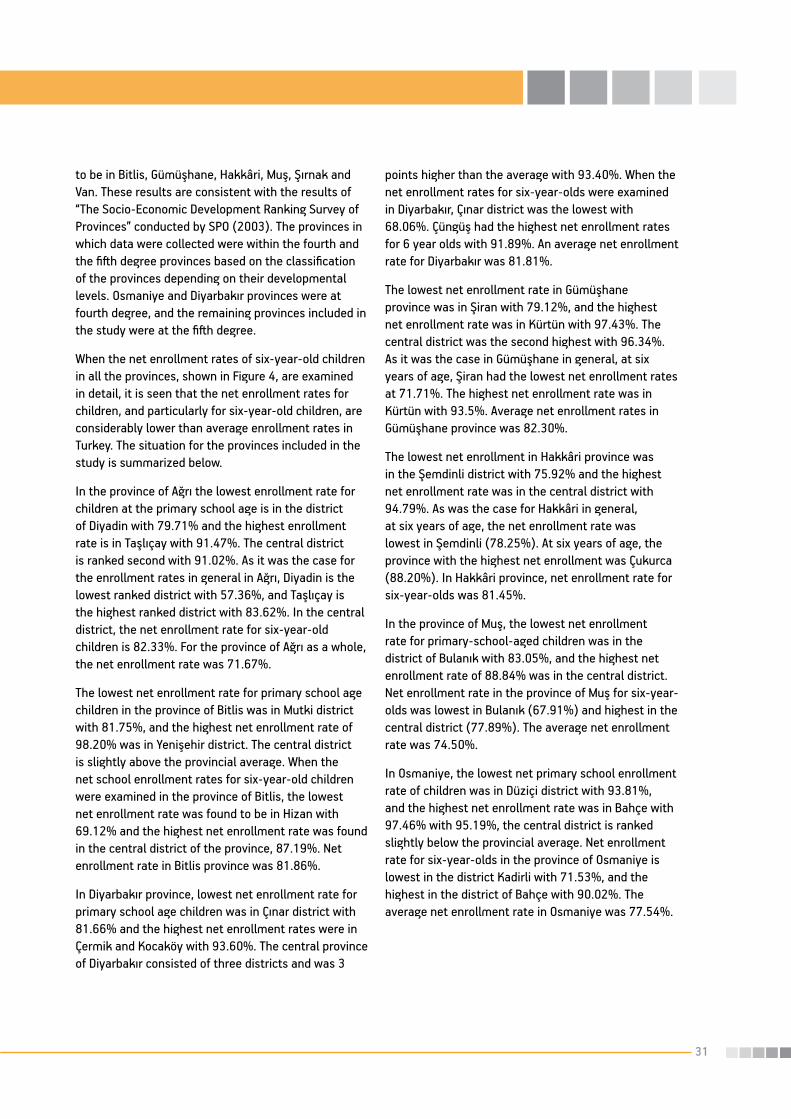
31
to be in Bitlis, Gümüşhane, Hakkâri, Muş, Şırnak and Van. These results are consistent with the results of “The Socio-Economic Development Ranking Survey of Provinces” conducted by SPO (2003). The provinces in which data were collected were within the fourth and the fifth degree provinces based on the classification of the provinces depending on their developmental levels. Osmaniye and Diyarbakır provinces were at fourth degree, and the remaining provinces included in the study were at the fifth degree.
When the net enrollment rates of six-year-old children in all the provinces, shown in Figure 4, are examined in detail, it is seen that the net enrollment rates for children, and particularly for six-year-old children, are considerably lower than average enrollment rates in Turkey. The situation for the provinces included in the study is summarized below.
In the province of Ağrı the lowest enrollment rate for children at the primary school age is in the district of Diyadin with 79.71% and the highest enrollment rate is in Taşlıçay with 91.47%. The central district is ranked second with 91.02%. As it was the case for the enrollment rates in general in Ağrı, Diyadin is the lowest ranked district with 57.36%, and Taşlıçay is the highest ranked district with 83.62%. In the central district, the net enrollment rate for six-year-old children is 82.33%. For the province of Ağrı as a whole, the net enrollment rate was 71.67%.
The lowest net enrollment rate for primary school age children in the province of Bitlis was in Mutki district with 81.75%, and the highest net enrollment rate of 98.20% was in Yenişehir district. The central district is slightly above the provincial average. When the net school enrollment rates for six-year-old children were examined in the province of Bitlis, the lowest net enrollment rate was found to be in Hizan with 69.12% and the highest net enrollment rate was found in the central district of the province, 87.19%. Net enrollment rate in Bitlis province was 81.86%.
In Diyarbakır province, lowest net enrollment rate for primary school age children was in Çınar district with 81.66% and the highest net enrollment rates were in Çermik and Kocaköy with 93.60%. The central province of Diyarbakır consisted of three districts and was 3
points higher than the average with 93.40%. When the net enrollment rates for six-year-olds were examined in Diyarbakır, Çınar district was the lowest with 68.06%. Çüngüş had the highest net enrollment rates for 6 year olds with 91.89%. An average net enrollment rate for Diyarbakır was 81.81%.
The lowest net enrollment rate in Gümüşhane province was in Şiran with 79.12%, and the highest net enrollment rate was in Kürtün with 97.43%. The central district was the second highest with 96.34%. As it was the case in Gümüşhane in general, at six years of age, Şiran had the lowest net enrollment rates at 71.71%. The highest net enrollment rate was in Kürtün with 93.5%. Average net enrollment rates in Gümüşhane province was 82.30%.
The lowest net enrollment in Hakkâri province was in the Şemdinli district with 75.92% and the highest net enrollment rate was in the central district with 94.79%. As was the case for Hakkâri in general, at six years of age, the net enrollment rate was lowest in Şemdinli (78.25%). At six years of age, the province with the highest net enrollment was Çukurca (88.20%). In Hakkâri province, net enrollment rate for six-year-olds was 81.45%.
In the province of Muş, the lowest net enrollment rate for primary-school-aged children was in the district of Bulanık with 83.05%, and the highest net enrollment rate of 88.84% was in the central district. Net enrollment rate in the province of Muş for six-year-olds was lowest in Bulanık (67.91%) and highest in the central district (77.89%). The average net enrollment rate was 74.50%.
In Osmaniye, the lowest net primary school enrollment rate of children was in Düziçi district with 93.81%, and the highest net enrollment rate was in Bahçe with 97.46% with 95.19%, the central district is ranked slightly below the provincial average. Net enrollment rate for six-year-olds in the province of Osmaniye is lowest in the district Kadirli with 71.53%, and the highest in the district of Bahçe with 90.02%. The average net enrollment rate in Osmaniye was 77.54%.

32
Figure 4. 2007 – 2008 school year net schooling rates for age 6
NET ENROLLMENT
AVERAGE
70 72 74 76 78 80 82 84 86 88 90 92 94 96 98 100

33
In Şanlıurfa, the lowest net enrollment rate of children was in the district of Siverek with 85.35%, and the highest net enrollment rate was in Birecik district with 95.11%. With a rate of 91.15%, the central district ranked just above the provincial average. Net enrollment rates for six-year-olds were highest in Birecik (85.32%) and lowest in Siverek (68.19%). Average net enrollment rate in Şanlıurfa for six-year-olds was 77.75%.
In Şırnak, the lowest net enrollment rate was in Beytüşşebap (88.19 %). The highest net enrollment rate was in the central district with 92.02 %. Net enrollment rate for six-year-old children was highest in Cizre with 81.97%, and the lowest in İdil with 79.11%. In Şırnak, the average rate of net enrollment for six-year-olds was 80.73%.
In Van, Ozalp district had the lowest net enrollment rate at 78.42% while Edremit had the highest net enrollment rate of 94.32%. The central district was ranked third 91.24%. Net enrollment rate for six-year-olds was the highest in Gevaş district (89.46%), and lowest in Çaldıran at 61.12%. Net enrollment ratio of children aged six in the province of Van was 74.05%.
Because the goal of this research was to understand the magnitude of the issue of not enrolling in schools when the children were at the legally determined age and identifying factors that could lead to the solution of the problem, MONE identified the children that were affected by the problem in the provinces included in the study. Of these identified households with children who had not enrolled in primary schools the previous years, 1.095 of them were included in the study. In the randomly selected sample, there were 959 children who had not enrolled in school in the year they completed 72 months of age, but they had enrolled in primary schools a year late, the following year. The remaining 136 children had become legally eligible to enter school like the children in the late enrollment group, but they had been unenrolled for two years in a row. They were identified as unenrolled children.
In the current research unenrolled children and children who had late enrollment were examined separately. It was assumed that by examining these two groups separately, where these two groups were similar and where they were different could be understood more clearly. Another goal for
separating these two groups was to examine whether the unenrolled children would have any potential to eventually enroll in primary schools or whether they would continue to stay unenrolled. In order to accomplish these objectives and to be able to better generalize the findings three different labels were used: late enrollment, no enrollment and no enrollment at the determined age. No enrollment in school at the determined age includes both the unenrolled and the late enrollment children.
This research was designed because children not enrolling in primary schools by the determined legal age are an understudied phenomenon in Turkey. Thus, designed as a descriptive research, the goal was to explore the magnitude of the problem. It was also expected that by using both the address based registration system and e-school data, the findings of this research would allow for a clear understanding of the reasons for children not enrolling in school on time. Following identification of the reasons for not enrolling in school by the determined age, strategies could be developed to ensure timely school enrollment.
As a result, in a country where widespread efforts are made to make compulsory education 9 years long with the inclusion of kindergarten (60 – 72 months old children) into compulsory education and with the use of e-school system data for every child who is registered with the state, obtaining findings of such an extensive research is definitely a necessity in Turkey. Despite numerous efforts made to improve the educational situation of the country, overall in Turkey and particularly in rural areas and in provinces of the Eastern and South Eastern regions of Turkey, problems with access to and quality of education and not having equal educational opportunities for all continue to exist. In addition to this, not reaching the target enrollment rates.
In the entire country and having teacher-related problems are some of the other problems experienced in Turkey. Even though children not enrolling in primary school on time are a function and a part of the existing educational problems, this research has allowed for the unique conditions and factors associated with this particular problem, hence developing new strategies became possible. As a result, providing solutions

34
Figure 5. Net schooling rates for boys based on developmental degree of the provinces they live in
Figure 6. Net schooling rates for boys in the provinces that were included in the study
that are unique in addressing the problems of the risk group can be made possible and conditions that allow for the timely enrollment of children can be prepared. Without a doubt, ensuring timely enrollment of children will positively impact net enrollment rates and will help the efforts to improve the educational situation in Turkey.
The State Planning Organization determined the developmental degrees of the provinces based on
findings from “The Socio-Economic Development Ranking Survey of Provinces.” This survey included 58 variables in order to examine the social and economical indicators of 81 provinces based on administrative structure in December 2003. Among the variables included were demographic, employment, education, health, industry, agriculture, construction, financial, infrastructure and other welfare indicators that were examined under 10 main categories. Based on further evaluation of the results of the survey, the country was classified in 5 separate groups with varying levels of development. The developmental degrees of the provinces are listed below:
First Degree Second Degree Third Degree Fourth Degree Fifth Degree
İstanbul,Ankara, İzmir, Kocaeli, Bursa
Eskişehir, Tekirdağ, Adana, Yalova, Antalya, Kırklareli, Denizli, Muğla, Bolu, Balıkesir, Edirne, Mer-sin, Bilecik, Kayseri, Gaziantep, Zonguldak, Aydın, Sakarya, Çanak-kale, Manisa
Konya, Karabük, Isparta, Hatay, Uşak, Burdur, Samsun, Kırıkkale, Nevşehir, Karaman, Elazığ, Rize, Trabzon, Amasya, Kütahya, Malatya, Kırşehir, Artvin, Afyon, Düzce, Çorum
Osmaniye, Kahramanmaraş, Niğde, Giresun, Kastamonu, Tunceli, Sivas, Kilis, Bartın, Aksaray,Sinop, Erzincan, Çankırı, Erzurum,Tokat, Ordu, Diyarbakır, Yozgat, Adıyaman
Bayburt, Kars, Şanlıurfa, Iğdır, Batman, Gümüşhane, Mardin, Siirt, Ardahan, Van, Bingöl, Hakkâri, Şırnak, Bitlis, Ağrı, Muş
1.3. Net school enrollment rates of the provinces based on socio- economic development index
When the list above is examined, it is observed that the provinces included in the study are either within the fourth or fifth degree classifications. While Osmaniye
and Diyarbakır provinces are fourth degree, the remaining provinces are fifth degree.
The net enrollment rates of boys and girls in the 10 provinces included in the study were examined as a function of the degree of development of the provinces determined based on SPO’s research conducted in 2003 to identify the level of social and economical development of the provinces. Striking
results were obtained from these examinations (See Appendix Table 1 – 2). It was found that in the 10 provinces the data were collected, the net enrollment rates of the males were higher than the net enrollment rates of the girls at single ages for the ages between 6 – 13.

35
Figure 7. Net enrollment rates for girls at single ages disaggregated by the developmental degrees of provinces
Figure 8. Net enrollment rates for girls at single ages in the provinces included in the study
Using the same method used to analyze the data for male students, female children’s enrollment rates were examined as a function of the degrees of development of the provinces. It was found that the rates varied in the provinces. In the 10 provinces included in the study, net enrollment rates of female children were lower than the national averages for all age groups and similar to 5th degree development provinces. In the provinces included in the study, the enrollment rates of six-year-old female children (born in 2001) was even lower than the provinces that were within the fifth degree of development. The highest enrollment rates were found within the provinces that were identified as first degree (92.8%). This was followed by 3rd degree (91.8%), 2nd degree (90.5%), 4th degree (86.4%) and 5th degree (78.7%) development provinces. Net enrollment rates of male and female children were similar when the enrollment rates were examined as a function of the developmental degrees of the provinces (See Appendix Table 2).
When Figure 7 was examined, it was found that the access female children have for education was similar among the provinces that had 1st, 2nd and 3rd degree development. This, however, was different for 4th and 5th degree development provinces. The net enrollment rates for the provinces included in the study were similar to 5th degree development provinces. In addition, the net enrollment rates for six-year-old females were even lower than the 5th degree provinces. Possible reasons for this could be the beliefs families have about not finding girls’ education profitable, the girls’ contribution to household labor, and looking after younger siblings and working on the farm.
When the net enrollment rates of the male children were examined based on the degrees of development of the provinces included in the study, even though the net enrollment rates varied based on the age of the child, the net enrollment rates of the children in the provinces of the sample were lower than the country average for all ages. The net enrollment rates of these provinces were similar to the net enrollment rates of the fifth degree provinces. In some of the provinces included in the study, the net enrollment rates of male children at age 6 (born in 2001) were even lower than the levels of the fifth degree provinces. Overall in the country, the highest levels for net enrollment of male children at age 6 (born in 2001) were highest in the first degree provinces. This was followed by 3rd, 2nd, 4th and 5th degree provinces respectively (See Figure 5 - 6 and Appendix Table 1)
When figure 5 and 6 were examined, it was found that the male children’s access to education was very different in the provinces that were within the fifth degree of development than all other provinces. According to TSI’s Child Labor research for children 6-14 years of age, 41.7% of these children were currently participating in the labor force (TSI, Child labor research, 2006). Another research conducted by TSI showed that being teased by teachers and/or classmates was one of the main reasons for poor or working children to drop out of school (Bulutay, 1999). When “e-school” 2008 data were examined, the child/teacher ratio in the 10 provinces included in the study and the provinces within the fifth degree of development was among the highest compared to all the other provinces in the country.

36
2. METHODOLOGYFor this project, both quantitative and qualitative methods were used as complementary methods. The quantitative research included face-to-face interviews conducted with parents in participating cities using questionnaires prepared for the research. Quantitative research methods included asking a series of questions prepared beforehand to a set number of people (Nakip, 2005). The purpose for using this method was to reach a large number of respondents and allow for possible generalizations. Qualitative research methods were used to get responses from the other stakeholders. Semi-structured interviews, focus groups, and document analyses were all qualitative research methods and they were used to understand more realistic perceptions of the people in their natural settings as they experience the events to reach a more holistic understanding of the phenomena studied. Before the data were collected for the research, relevant past research studies were examined and document analyses were implemented. By implementing a document analysis, both national and international sources were examined and the state of unenrolled and enrolled students explored. In addition, the data obtained from document analyses were used to form the research instruments. Lastly, the databases that were obtained from numerous institutions were analyzed in order to make inferences about the possible reasons for late enrollment.
2.1. Research population
In this research 10 provinces that most experienced the problem of children not enrolling in schools by the determined age were studied. These provinces were identified by the Ministry of Education and UNICEF using the address-based registration system and e-school data which identified the net enrollment rates for six-year-old children in all the provinces of Turkey. The population for the study were the provinces of Ağrı, Bitlis, Diyarbakır, Gümüşhane, Hakkâri, Muş, Osmaniye, Şanlıurfa, Şırnak and Van as shown in the map on Figure 9. Teachers, administrators, legal guardians, primary school inspectors and stakeholders (community leaders,
local administrators, NGOs, etc.) were included in the study.
2.2. Research sample
2.2.1. Sample for quantitative researchWhen the total number of children who were born in 2001 and those who were enrolled in school in the year 2008 were examined, striking situations these provinces have in terms of their school enrollment rates can be seen. Table 4 shows that 185.668 children were born in 2001. Of these children, 40.169 of them (21.63%) were still unenrolled at the time of the study. When the ratio of children who were born in 2001 and not enrolled in schools to total number of children who were born in 2001 calculated, it was found that 22.38% of the girls, and 20.93% of the boys, and the 21.63% of all the children of this age group were out of school at that time. In the provinces that were in the research population, girls seemed to be at a slight advantage over boys at age six, except in Osmaniye and Gümüşhane (See Table 4).
In determining the sample size for this research, confidence level of 95%, the tolerance rate of 3%, were used. As a result, the numbers of mass units (number of households) were identified to be 1080. When the sample sizes for each of the provinces were identified based on the unenrolled or late enrolled children in these provinces were determined, number of mass units for Gümüşhane became 10. In order to conduct statistical analyses that would compare the results for different provinces, this number was increased to 15 mass units. Using the same method, when the sample was divided into 15 sample units, 73 clusters were identified. In the application of this, sample distribution and application was done based on the number of clusters obtained. As a result of this, the number of mass units increased to 1.095. Therefore, 73 clusters were obtained from 40169/15=2678.
First of all, because the entire 10 provinces were targets of the study, the clusters that were obtained were proportionately selected for the children who had late enrollment and unenrolled children (See Table 5).
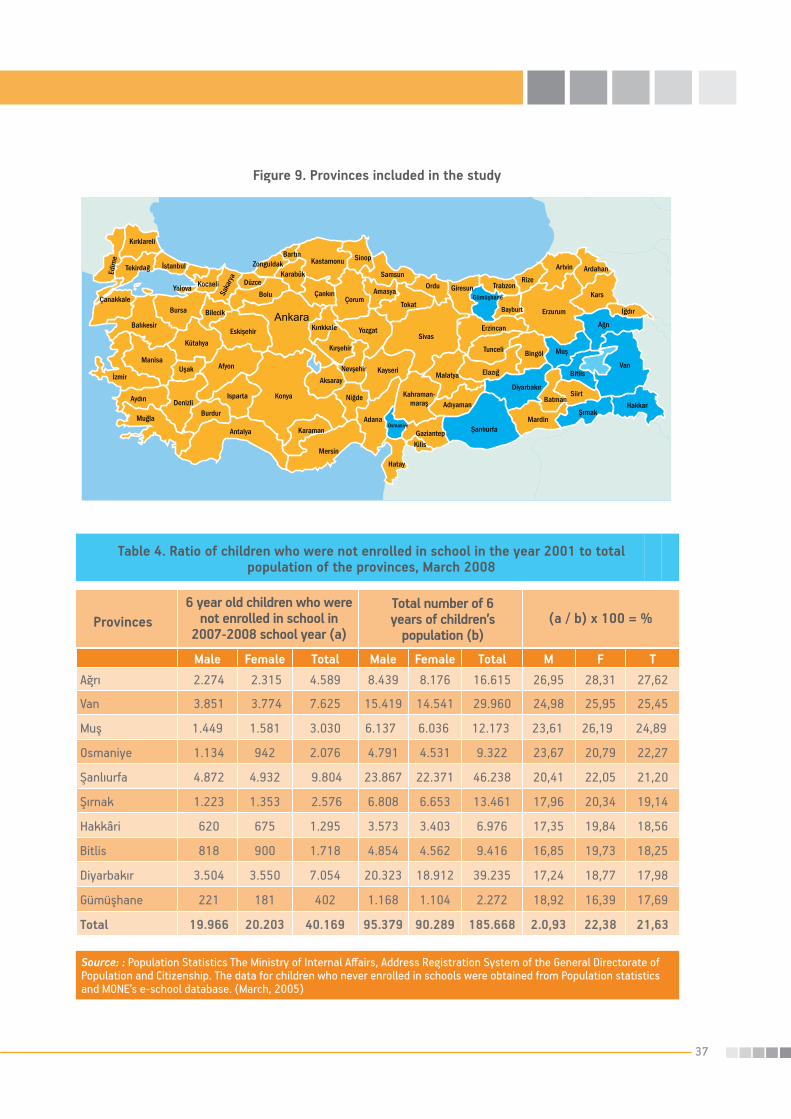
37
Figure 9. Provinces included in the study
Male Female Total Male Female Total M F TAğrı 2.274 2.315 4.589 8.439 8.176 16.615 26,95 28,31 27,62
Van 3.851 3.774 7.625 15.419 14.541 29.960 24,98 25,95 25,45
Muş 1.449 1.581 3.030 6.137 6.036 12.173 23,61 26,19 24,89
Osmaniye 1.134 942 2.076 4.791 4.531 9.322 23,67 20,79 22,27
Şanlıurfa 4.872 4.932 9.804 23.867 22.371 46.238 20,41 22,05 21,20
Şırnak 1.223 1.353 2.576 6.808 6.653 13.461 17,96 20,34 19,14
Hakkâri 620 675 1.295 3.573 3.403 6.976 17,35 19,84 18,56
Bitlis 818 900 1.718 4.854 4.562 9.416 16,85 19,73 18,25
Diyarbakır 3.504 3.550 7.054 20.323 18.912 39.235 17,24 18,77 17,98
Gümüşhane 221 181 402 1.168 1.104 2.272 18,92 16,39 17,69
Total 19.966 20.203 40.169 95.379 90.289 185.668 2.0,93 22,38 21,63 Source: : Population Statistics The Ministry of Internal Affairs, Address Registration System of the General Directorate of Population and Citizenship. The data for children who never enrolled in schools were obtained from Population statistics and MONE’s e-school database. (March, 2005)
Table 4. Ratio of children who were not enrolled in school in the year 2001 to total population of the provinces, March 2008
Provinces6 year old children who were
not enrolled in school in 2007-2008 school year (a)
Total number of 6 years of children’s
population (b)(a / b) x 100 = %

38
In the first stage of sample selection, the developmental degrees of the districts, the selection of districts to collect data and distribution of clusters. Using the developmental index for the districts prepared by SPD, the districts for each province were ranked (SPD, 2004). Because the number of districts were too many, only some of the districts were included in the selection. The number of districts and the clusters that were going to be created for each of the provinces included in the study were decided upon based on the sizes of the provinces (See Table 7).
Stratified sampling that determined the size of the sample in Şırnak proportional to that of the population is shown in Table 6. It was determined that there were going to be five clusters for Şırnak province (75 mass units). According to the report of the SPD, the districts shown in Table 6 are listed in order of development. Then, the following steps were taken.
Stages of proportional probability cluster sampling are as follows;
1. The developmental degrees of all the districts, their
population sizes (number of children who are out of school) and number of clusters are listed (columns 2, 3 and 4).
2. The cumulative total number of clusters is calculated (column 5). (The last number in this column refers to the total number of clusters in the target area for this research).
3. A constant k value was determined using a formula, k=N/n=171/5=34 to determine the clusters used for the research.
4. Using the “RAND ()” function in MS Excel program a random number is generated to become the starting point between 1 and k. The number produced was 5. After this number every k (kth) cluster is the cluster that is included in the sample. As a result, the five identified clusters were 5, 39, 73, 107 and 141.
As it can be found in table 6, the districts that had these numbers included the central district, Silopi (two clusters), Cizre and İdil. Second stage: sampling from the districts that were selected to be in the research
Provinces Male Female Total SamplingNumber
of Clusters
Number of
Clusters Selected
Size of Sampling
Ağrı 2.274 2.315 4.589 123 306 8 15*8 = 120
Van 3.851 3.774 7.625 205 508 14 15*14 = 210
Muş 1.449 1.581 3.030 81 202 5 15*5 = 75
Osmaniye 1.134 942 2.076 56 138 4 15*4 = 60
Şanlıurfa 4.872 4.932 9.804 264 654 18 15*18 = 270
Şırnak 1.223 1.353 2.576 69 172 5 15*5 = 75
Hakkâri 620 675 1.295 35 86 2 15*2 = 30
Bitlis 818 900 1.718 46 115 3 15*3 = 45
Diyarbakır 3.504 3.550 7.054 190 470 13 15*13 = 195
Gümüşhane 221 181 402 11 27 1 15*1 = 15
Total 19.966 20.203 40.169 1.080 2.678 73 1.095
Table 5. Population and sampling

39
LocationLevel of develop-
ment
Number of children
not attending
school
Total number of clusters
Cumulative total of clusters
Range of change
Number of
clusters selected
Number of
People
Center 3 412 412/15=27 27 1-27 1 15
Silopi 3 693 46 73 28-73 2 30
Cizre 3 649 43 116 74-116 1 15
İdil 6 459 31 14 117-147 1 15
Uludere 6 202 14 161 148-161
Beytüşşebap 6 112 7 168 162-168
Güçlükonak 6 49 3 171 169-171
Total 2.576 171 5 75
* Selected settlements were central district, Silopi, Cizre and İdil.
Table 6. Using a proportional probability sampling technique to determine sample size
sample were carried out using “simple random sampling.” The sample selection method used in this research was a “stratified two-stage cluster sampling.” In this research, the provinces made up the strata. From each province, using cluster sampling, clusters of 15 people were selected in the first stage from each of the provinces included in the research. In the second stage of sample selection, simple random sampling was used to determine the sample.
The addresses of the mass units were found in the database. However, using this method, the actual addresses and the listed addresses did not always match.
The lack of urban-rural distinction in the database, as well as not having any information about sex distribution, these two criteria could not be included in the sample selection. On the other hand, because the participants in each district were randomly selected, this problem was eliminated.
When this happened, and when there were no door numbers, principals of the schools were approached and identified people for the research were contacted and the interviews carried out.

40
To make predictions for the population, mass total, average and ratio were calculated. Formulas used in these, and confidence interval calculations can be found below. Here was set. Indices used in these formulas are:
Number of Clusters
Number of Clusters
AĞRI 8 HAKKARİ 2
Doğubeyazıt 3 Merkez 1
Eleşkirt 1 Yüksekova 1
Merkez 1 MUŞ 5
Patnos 3 Bulanık 2
BİTLİS 3 Malazgirt 1
Adilcevaz 1 Merkez 2
Güroymak 1 OSMANİYE 4
Merkez 1 Düziçi 1
DİYARBAKIR 13 Kadirli 1
Bağlar 4 Merkez 2
Bismil 1 ŞANLIURFA 18
Çermik 1 Akçakale 1
Çınar 2 Birecik 1
Dicle 1 Harran 1
Eğil 1 Merkez 8
Sur 2 Siverek 4
Yenişehir 1 Suruç 1
GÜMÜŞHANE 1 Viranşehir 2
Merkez 1
Table 7. Number of clusters in provinces and districts

41
: Layers, : Total number of clusters, : Total number of clusters in a province, : Number of clusters in the sample, : Number of sample units in clusters, : Characteristic of a unit, : One characteristic being present in one unit.
€
M
’dir. For mass ratio
Accordingly, the following formulas were used:
€
sh( ) p ) = V ( ˆ p )
€
phi =
aii=1
nhi
∑nhi
€
V ( ) p ) = Wh (Mh −mh
Mh
) sh2
mhh =1
L
∑
€
ˆ p = Whh =1
L
∑ p h
€
sh2 =
(phi − p h )2
i=1
mh
∑mh −1
€
p h =
phii=1
mh
∑mh
Frequency %
Late enrollment 959 88,0
No Enrollment 136 12,0
Not Enrolled When Eligible (Total) 1.095 100
Table 8. Number of children included in sample for the quantitative study
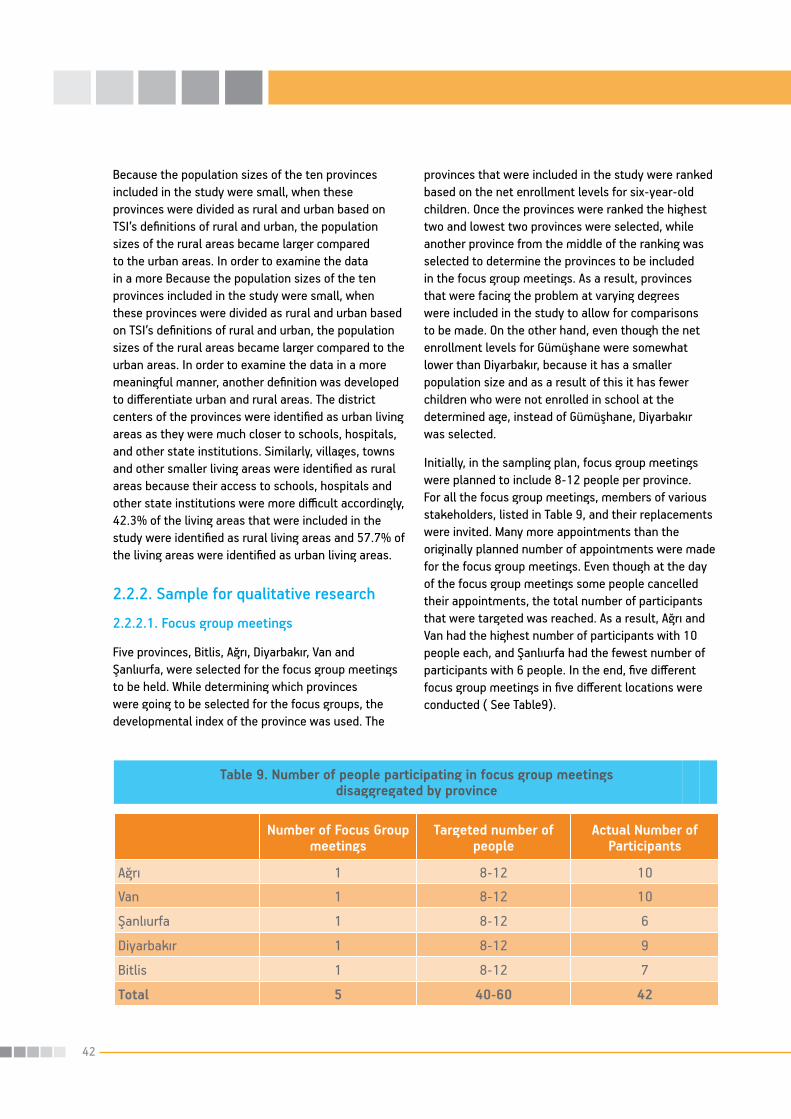
42
Number of Focus Group meetings
Targeted number of people
Actual Number of Participants
Ağrı 1 8-12 10
Van 1 8-12 10
Şanlıurfa 1 8-12 6
Diyarbakır 1 8-12 9
Bitlis 1 8-12 7
Total 5 40-60 42
Table 9. Number of people participating in focus group meetings disaggregated by province
Because the population sizes of the ten provinces included in the study were small, when these provinces were divided as rural and urban based on TSI’s definitions of rural and urban, the population sizes of the rural areas became larger compared to the urban areas. In order to examine the data in a more Because the population sizes of the ten provinces included in the study were small, when these provinces were divided as rural and urban based on TSI’s definitions of rural and urban, the population sizes of the rural areas became larger compared to the urban areas. In order to examine the data in a more meaningful manner, another definition was developed to differentiate urban and rural areas. The district centers of the provinces were identified as urban living areas as they were much closer to schools, hospitals, and other state institutions. Similarly, villages, towns and other smaller living areas were identified as rural areas because their access to schools, hospitals and other state institutions were more difficult accordingly, 42.3% of the living areas that were included in the study were identified as rural living areas and 57.7% of the living areas were identified as urban living areas.
2.2.2. Sample for qualitative research2.2.2.1. Focus group meetings
Five provinces, Bitlis, Ağrı, Diyarbakır, Van and Şanlıurfa, were selected for the focus group meetings to be held. While determining which provinces were going to be selected for the focus groups, the developmental index of the province was used. The
provinces that were included in the study were ranked based on the net enrollment levels for six-year-old children. Once the provinces were ranked the highest two and lowest two provinces were selected, while another province from the middle of the ranking was selected to determine the provinces to be included in the focus group meetings. As a result, provinces that were facing the problem at varying degrees were included in the study to allow for comparisons to be made. On the other hand, even though the net enrollment levels for Gümüşhane were somewhat lower than Diyarbakır, because it has a smaller population size and as a result of this it has fewer children who were not enrolled in school at the determined age, instead of Gümüşhane, Diyarbakır was selected.
Initially, in the sampling plan, focus group meetings were planned to include 8-12 people per province. For all the focus group meetings, members of various stakeholders, listed in Table 9, and their replacements were invited. Many more appointments than the originally planned number of appointments were made for the focus group meetings. Even though at the day of the focus group meetings some people cancelled their appointments, the total number of participants that were targeted was reached. As a result, Ağrı and Van had the highest number of participants with 10 people each, and Şanlıurfa had the fewest number of participants with 6 people. In the end, five different focus group meetings in five different locations were conducted ( See Table9).

43
2.2.2.2 Semi-structured interviews
In the provinces, Bitlis, Ağrı, Diyarbakır, Van and Şanlıurfa, where focus group meetings were held, interviews were held with the social stakeholders
that are of similar backgrounds. There were 85 semi-structured interviews, with 78 males and 7 females (See Appendix Table 3). are of similar backgrounds. There were 85 semi-structured interviews, with 78 males and 7 females (See Appendix Table 3).
Targeted number of interviews
Actual Number of interviews
Ağrı 14 23
Bitlis 14 14
Diyarbakır 14 18
Şanlıurfa 14 13
Van 14 17
Total 70 85
Table 10. Number of people interviewed during semi-structured interviews disaggregated by province
2.3. Data collection techniques
2.3.1. Data from quantitative researchData for this research were collected in the homes of these children via face-to-face interviews that were conducted with one of the legal guardians by data collectors who were trained for this research. The data collector who carried out the interviews read each question and asked the parents to give their answers using a scale that is shown on a card (See Appendix - IV). Most of the interviews were conducted with mothers (n=729) because mothers were the ones at home at the time of data collection during
the day. A significant number of remaining interviews were conducted with fathers (n=329). When there was neither a mother nor father present or when neither of them could speak Turkish, another family member was interviewed. Only 3.6% of the interviews did not include either a mother or father. Table 11 lists the people interviewed. Additional information can be found in Appendix Table 4.
As can be seen in Table 11, because the majority of the participants are parents, descriptive statistics about the participants were provided and examined in the section about the household members.
No enrollment
Frequency % Frequency % Frequency %
Mother 630 65,8 99 72,8 729 66,6
Father 297 31,0 32 23,5 329 30,0
Other 32 3,2 5 3,7 37 3,6
Total 959 100 136 100 1.095 100
Table 11. Research participant’s relationship to target child(More detailed information can be found in Appendix Table 4)
Late enrollment Not enrolling on time (Total)
No enrollment

44
2.3.2. Quantitative research measurementQuestionnaires used for the quantitative research included demographic information (household members’ levels of education, income and expenditures, employment status, etc.), information about household members and information about target children (health, development, etc.) and questions about the age for school enrollment. In addition to the questions asked to both groups, there were two separate sections for the late enrollment and no enrollment groups. The questions for the late enrollment group included questions about why children were not enrolled in school the previous year even though they were at the legal age for school enrollment and the reasons for enrolling children in school the following year. Similarly, the parents in the unenrolled children’s group were asked to report on why they did not send their children to school on time and what sorts of changes would be needed for them to enroll their children in school. In addition, both groups were asked to report on the types of activities their children engaged in at home while they were not in school and what type of attempts they made to enroll their children in schools. When open ended questions were asked, the participant responses were coded to quantify their answers. Other questions used a nominal, yes-no response format, while others used a Likert scale (See Appendix – II for a copy of the questionnaire).
2.3.3. Sampling techniques for qualitative researchSemi-structured interviews and focus group meetings were used in the qualitative section of this research study. In this section, participants’ perceptions were targeted and the goal was to capture qualitatively the perceptions and events as they were experienced in their natural settings in a more comprehensive and realistic way. Prior to interviews and focus group meetings, database and document analyses were conducted. Document analysis included examining the international and Turkish literature about late school enrollment or related subjects both in the world and in Turkey. Database analysis included examination of “National Education Statistics, Formal Education
2007-2008,” 2007 born children’s population statistics of TSI’s Address Based Registration System, 2008 e-school statistics (number of enrolled children by sex for single ages for all the provinces and districts of Turkey), the socio-economic development ranking survey of districts (2004) and provincial and regional socio-economical developmental index reranking survey (2003) in order to examine the current state in the country regarding late school enrollment.
2.3.3.1 Focus groups
A qualified and trained professional (social psychologist or a sociologist) served as a moderator, and in focus group meetings the purpose was to engage participants in a discussion to examine the problem of late school enrollment and its causes. These meetings were designed to be informal and took place either in meeting rooms of schools or directorates of national education and took an average of 1.5 to 2 hours in length. Each person was given a chance to speak and express his or her opinion, and the discussions were recorded using voice recorders and were later transcribed. With focus group meetings, the goal was to have a detailed discussion among social stakeholders and to gain insights into their understanding of late school enrollment (Nakip, 2005). Numerous ideas were brought into discussion during these meetings and the data were collected to understand the needs, motivations, and attitudes of target population to better interpret the findings of the current research.
In the beginning of these meetings, some time was spent to warm up, and this time was used for everyone to meet and get to know each other and to express their ideas more comfortably. Following warm up time, the problem was defined, and the thoughts and opinions of the participants and their experiences in the areas they live regarding the issue at hand were discussed. Next, the reasons for and possible solutions suggested by the participants were discussed. As a result, three main topics, identification and definition of the problem, the reasons for why it happens and possible solutions to help solve the problem, were discussed in these meetings.
In these focus group meetings, parents (n=3), teachers and principals of schools (n=13), mukhtars (n=6), local administrators (n=2), MDNE district

45
directors (n=5), religious employees (n=5), representatives from NGOs (n=5) and members of local media (n=3) were included. The number of participants and who the participants were are included in Table 12.
Participants expected
Participants reached
Parents Between 5-7 3
Teachers and principals of schools, Inspectors Between 5-8 13
Village and neighborhood district mukhtars Between 5-7 6
Local governments Between 5-8 2
Province/City MONE directors Between 5-8 5
Imams Between 5-7 5
Representatives of NGOs Between 5-8 5
Local media workers Between 5-7 3
Total 40-60 42
Table 12. Participants of the focus groups disaggregated by the backgrounds of the stakeholders
2.3.3.2. Semi-structured interviews
Semi-structured interviews took place in the homes of participants by a trained data collector using a questionnaire prepared for the research. The goal was to identify and define the problem, obtain subjective thoughts and experiences of the participants and to examine how people in the region experienced the problem. It was also expected that participants would give their insights into the reasons and solutions for the problem. Even though question categories prepared for the quantitative research were kept the same for the semi-structured interviews, participants were encouraged to feel free to expand on any topic
they wished to talk about with a hope that more of the insiders’ experiences would be explored.
As can be seen in Table 13, parents (n=6) and religious employees (n=6) were the two groups that had the fewest number of semi-structured interviews. Most of the interviews were completed with teachers, principals and national education inspectors (n=14), and the members of local media (n=14). When the number of participants for the semi-structured interviews was examined based on the provinces they lived in, it was found that least number of participants came from Şanlıurfa with 13 people, and the highest number of participants came from Ağrı with 23 people.

46
Ağrı 3 1 2 2 4 4 5 2 23 27,1Bitlis 1 1 2 2 3 1 2 2 14 16,5
Diyarbakır 1 1 2 2 3 3 3 3 18 21,2
Şanlıurfa 0 1 2 2 2 2 2 2 13 15,3
Van 1 2 2 3 2 2 2 3 17 20
Total 6 6 10 11 14 12 14 12 85 100
Male 5 6 10 10 10 11 14 12 78Female 1 - - 1 4 1 - - 7
Total 6 6 10 11 14 12 14 12 85
Table 13. Number of social stakeholders in semi-structured interviews
Table 14. Social stakeholder participants disaggregated by gender
The average age of the participants was 40, and most of the participants were between the ages of 25 and 44 (See Appendix Table 5). When the educational levels of the participants were examined, it was found that most of the participants (52 people) were graduates of a university and only 3 of the participants were illiterate (See Appendix Table 6). Examination of the occupations revealed that the majority of the participants had professional jobs and the most frequently held job was being an “educator” (See Appendix Table 7).
With 91% of the participants having more than a year, and 67% of the participants having more than 5 years, the majority of the participants were experienced at their jobs. Considering that participants are sharing their opinions based on their own experiences, it was important that they have some experience at their current positions (See Appendix Table 8).
Pare
nts
Pare
nts
Imam
sIm
ams
Prov
ince
/city
MON
E di
rect
ors
Prov
ince
/City
MON
E di
rect
ors
Villa
ge a
ndne
ighb
orho
od d
istric
tm
ukht
ars
Villa
ge a
ndne
ighb
orho
od
Insp
ecto
rs a
nd p
rincip
als
of sc
hool
s, te
ache
rsIn
spec
tors
and
pr
incipa
ls
Repr
esen
tativ
es o
f NG
OsRe
pres
enta
tives
of
NGOs
Loca
l m
edia
wor
kers
Loca
l med
iaw
orke
rs
Loca
l ad
min
istr
ator
sLo
cal
gove
rnm
ents
Tota
l
Over
all T
otal
%
47
2.4. Data collection procedureThree qualified researchers were appointed to work in the five provinces studied for the qualitative research. Moreover, there were three other people working in the İstanbul office to organize the interviews and the focus group meetings. On June 2, 2009, the qualified researchers started their work by conducting their first semi-structured interviews in Diyarbakır. After Diyarbakır, interviews were carried out in Şanlıurfa, Bitlis, Van and Ağrı provinces. In the provinces they went for the semi-structured interviews, they held five focus group meetings consisting of one per province. Started on June 2, 2009, the field work for the qualitative research ended on June 29, 2009 in Ağrı. When the data collectors moved from one province to another, they sent their data including interview documents and voice recording to the headquarters of the company for transcription. When the procedure was completed, findings of the semi-structured interviews and the focus group meetings were written up for the final report.
The first week of field work for quantitative research was spent in training, starting on June 8, 2009. During the training, information about the research prior to its start, such as the goals of the research, importance, and the time frame for the research were provided. Next, each question in the questionnaire was examined and the reasons for why each question was asked were discussed, as well as how these questions would be asked, and how the answers would be recorded were all part of the training. In addition, the data collectors were educated about how to identify the addresses of the participants and use of the address templates, preparation of progress reports for the field work, quality check procedures, organizational structure, the roles and responsibilities of the field personnel, and their job descriptions. During the data collection procedure, the data collectors were taught to read the questions thoroughly before their answers were taken for the participants who can read and write. When interviewing the participants who cannot read or write, the data collectors were taught to read the questions thoroughly, make sure the participant
understood the question, and provide additional, predetermined explanations when needed. At the end of the training, different participant characters were developed and the data collectors were given a chance to practice data collection with them. In addition, data collectors who speak both local language and Turkish were given preference. When this was not possible, data collectors were informed to select a parent, if not a family member, to interview who can speak both Turkish and local language. There were seven teams of data collectors. These teams carried out their work simultaneously in different provinces. In addition, for field work, there was one fieldwork coordinator, and an assistant fieldwork coordinator and supervisors in each of the provinces. Fieldwork for the quantitative research was carried out between June 10, 2009 and July 7, 2009. Completed questionnaires were sent out to the main office immediately to be checked for accuracy and phone controls. Next, questionnaires that were checked for errors were examined for coding of the open ended questions using a code book prepared prior to data collection and all the open ended responses were coded. For questionnaire entry a new program that has a self-check feature was used. Next the questionnaires that were entered into the computer using this program were transferred into MySQL database. After the data entry and check were complete, the findings were statistically examined and results interpreted.
The results of this study were presented at a workshop that focused on ways to address late school enrollment following the completion of the workshop, a report was prepared, which can be found in Appendix-III. The final stage of the research was to prepare the final report.

48
2.5. LimitationsBecause of geographical, sociological and economical conditions of the area researched, some difficulties were experienced during data collection.Difficulties faced during quantitative research process •Someneighborhoodsandvillagesdidnothave proper address labeling. •Duringfieldwork,theschoolswereclosedand some families were not found at their addresses due to reasons like seasonal migrant work (Particularly in the province of Şanlıurfa, seasonal and migrant farm work starts around March and ends around November).
•InHakkari,thedatacollectorswerenotallowed entry into the city because of security measures, and they were faced to wait outside of the city for a day. •Inalltheprovinces,datacollectorshadto go through security checks. These checks were not always lengthy. •Problemswithaccesstotheaddresses included in the sample were experienced. One of the main reasons for this was that many of these villages had very limited transportation options. •Becauselocallanguageiswidelyspokeninthe provinces included in the study, most of
Preparation of Initial Report•LiteratureReview•PreparationofDatabase•SampleSelection•PreparationofQuestionnairesforQualitative and Quantitative Research
Conducting Qualitative and Quantitative Research•QualitativeandQuantitativeResearchInterviews•TranscribingvoicerecordsandRecordingofQualitativeResearch Findings•QuantitativeResearchQuestionnaireCheck,Coding,and Data Entry
Data Analysis and Report Writing•AnalyzingQualitativeResearchFindingsandReport Writing •AnalyzingQuantitativeResearchFindings•DraftReport
Developing Strategies and Preparing Workshops•ExpertsWorkshop•StakeholdersWorkshop
Preparation of Final Report
Table 15. Timeline for the current research
MAY
200
9
JUNE
200
9
JULY
200
9
AUGU
ST20
09
SEPT
EMBE
R20
09OC
TOBE
R20
09NO
VEM
BER
2009
DECE
MBE
R20
09

49
the time, a data collector that spoke local language was interviewing with the people in the family. However, from time to time, when the data collector could not speak local language and neither of the parents of the children spoke Turkish,communication problems were experienced. When this was experienced, somebody else in the household, who could speak Turkish and could give the information asked for was interviewed. •Someparentsthatwereselectedinthesample refused to answer the questions that were included in the questionnaires.
Problems experienced in the qualitative data collection: •Fromtimetotime,becausesomeofthe interviewed people were bureaucrats, difficulties were experienced when arranging an appropriate time to set for the interviews. •Someoftheinterviewswereduringthetime of inspections in the Directorate of Education in the provinces, which necessitated that changes in the organization for the meetings and the interviews needed to be made. •Becausethefieldworkwascarriedoutduring the summer break, reaching teachers and the principals was difficult at times. •Participantsofthesemi-structuredinterviews were mostly from the stakeholder groups, very few parents were interviewed.
2.6. Data analysis and the research report After completing the data collection and the accuracy checks, data were entered into SPSS (Statistical Package for the Social Sciences) and analyzed. Frequency and percentage values for all the variables were calculated and interpreted. Descriptive analyses were run for continuous variables and Likert scale questions. Where it was found appropriate, in order to see the distribution of the data sum, average, and ratio statistics were calculated. For population predictions, mass total, average and ratio were calculated. In
addition to descriptive and frequency distributions, cross tabulations were computed and interpreted using Chi-square statistics.
Independent t-test analyses were used to compare the scores of two independent groups. When the groups compared were more than two analysis of variance (ANOVA) was used. Appropriate post hoc analyses based on whether the distributions of the scores in the groups were homogeneous or not were computed when the group differences were significant.
While preparing the reports of the quantitative analyses, separating children who are currently unenrolled and those who enrolled in school with a year delay was thought to be more appropriate. By implementing such a practice, it was expected that the similarities and the differences of the two groups could be understood more clearly. By separating these two groups of children, making predictions for who would continue to be unenrolled and who would possibly enroll in schools among the unenrolled children could be understood. In order to both compare the results for the two groups, and to see the results for the overall sample, in the tables, there were three columns labeled as late enrollment, no enrollment and not enrolling on time (both groups combined). The definitions provided in the conceptual scheme of the “Initial Report” were used for these labels.
Voice recording and the interview forms were examined for the report of the qualitative research. Focus group meetings were transcribed and grouped under several headings based on the information obtained. The information obtained from the semi-structured interviews was examined based on how the stakeholders expressed them and grouped under several themes. After the completion of the examination of the documents obtained from the qualitative research, initially prepared individually, quantitative and qualitative findings were merged. interviews was examined based on how the stakeholders expressed and grouped them under several themes. After the completion of the examination of the documents obtained from the qualitative research, initially prepared individually, quantitative and qualitative findings were merged.

50
Figure 10. Total number of people living in the household (%)
2.7. Conceptual definitions2.7.1. Not enrolling in school on timeThis term is used to describe the entire cohort of children who were born in 2001, and even though they were completing 72 months of age in the 2007 – 2008 academic year, they had not enrolled in primary schools during that particular academic year. These children could be either those who had enrolled in schools a year late, or they could still be unenrolled at the time of data collection, two years after they were at the determined age for school enrollment.
2.7.2. Late enrollment/Late entrantsThese children were born in the year 2001 and were at the age of 72 months or older and eligible to attend school in 2007 – 2008 educational year. However, these children were not enrolled in school that year, but attended school the following year with a year delay.
2.7.3. No enrollment/Unenrolled childrenThis term is used to refer to children who were born in the year 2001 and were not enrolled in school during the 2007 – 2008 academic year, or the year following this even though they were 72 months of age or older
at the time and were eligible to attend school. These children were currently unenrolled in schools at the time of data collection.
3. FINDINGS
3.1. Household members3.1.1. Number of people living inthe householdFamilies that were included in this study were generally living in crowded households with at least 3 or more other people. The percentage of three or more people living in the household were 91% in the late entrants, and it was 95.6% in no enrollment ones.When the average number of people living in these households was examined, it was found that in the late-entrants’ group average number of family members was 7.38 (SD: 2.53). The average number of people living in the same household was more in the no-entry group (M= 7. 72, SD= 2.44). Total number of people living in the households that were included in the study was 298,872±1340. Distribution of number of people living in the households that were included in the study can be found in Table 16.
Not enrolling on time [Total ]Base: 1975 People
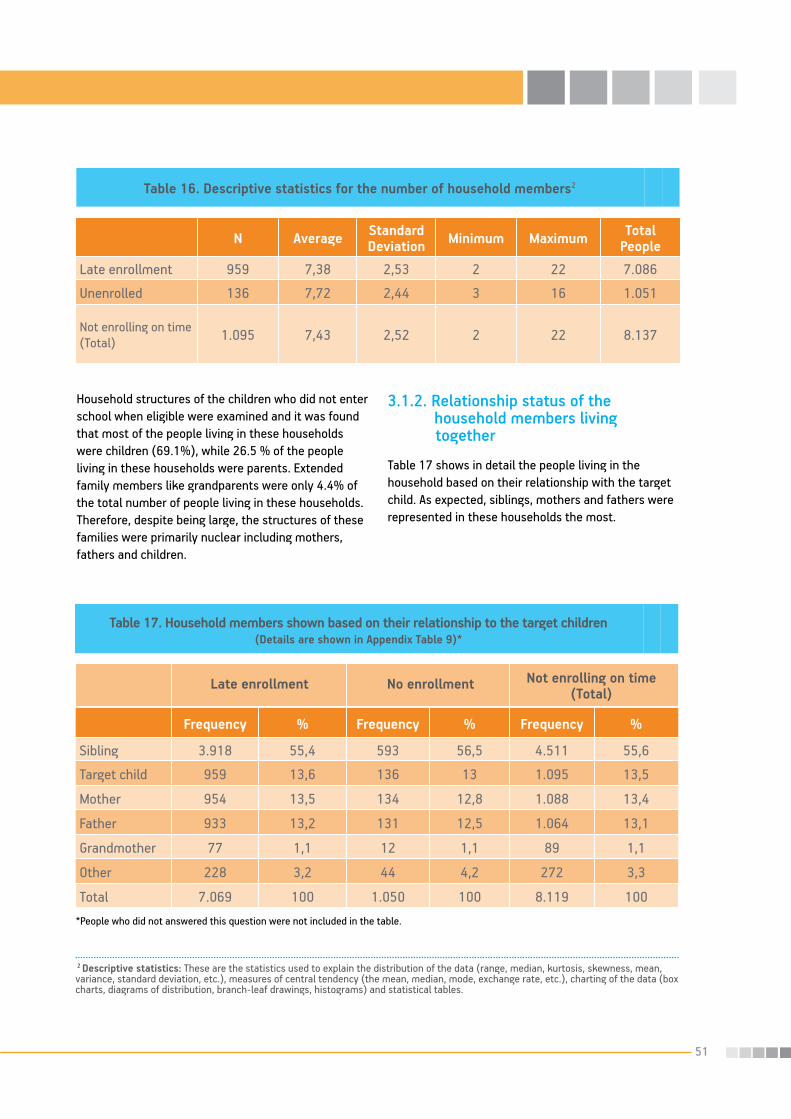
51
N Average Standard Deviation Minimum Maximum Total
People
Late enrollment 959 7,38 2,53 2 22 7.086
Unenrolled 136 7,72 2,44 3 16 1.051
Not enrolling on time (Total) 1.095 7,43 2,52 2 22 8.137
Table 16. Descriptive statistics for the number of household members2
Household structures of the children who did not enter school when eligible were examined and it was found that most of the people living in these households were children (69.1%), while 26.5 % of the people living in these households were parents. Extended family members like grandparents were only 4.4% of the total number of people living in these households. Therefore, despite being large, the structures of these families were primarily nuclear including mothers, fathers and children.
3.1.2. Relationship status of the household members living together
Table 17 shows in detail the people living in the household based on their relationship with the target child. As expected, siblings, mothers and fathers were represented in these households the most.
2 Descriptive statistics: These are the statistics used to explain the distribution of the data (range, median, kurtosis, skewness, mean, variance, standard deviation, etc.), measures of central tendency (the mean, median, mode, exchange rate, etc.), charting of the data (box charts, diagrams of distribution, branch-leaf drawings, histograms) and statistical tables.
Table 17. Household members shown based on their relationship to the target children (Details are shown in Appendix Table 9)*
Frequency % Frequency % Frequency %
Sibling 3.918 55,4 593 56,5 4.511 55,6
Target child 959 13,6 136 13 1.095 13,5
Mother 954 13,5 134 12,8 1.088 13,4
Father 933 13,2 131 12,5 1.064 13,1
Grandmother 77 1,1 12 1,1 89 1,1
Other 228 3,2 44 4,2 272 3,3
Total 7.069 100 1.050 100 8.119 100
No enrollmentLate enrollment Not enrolling on time (Total)
*People who did not answered this question were not included in the table.
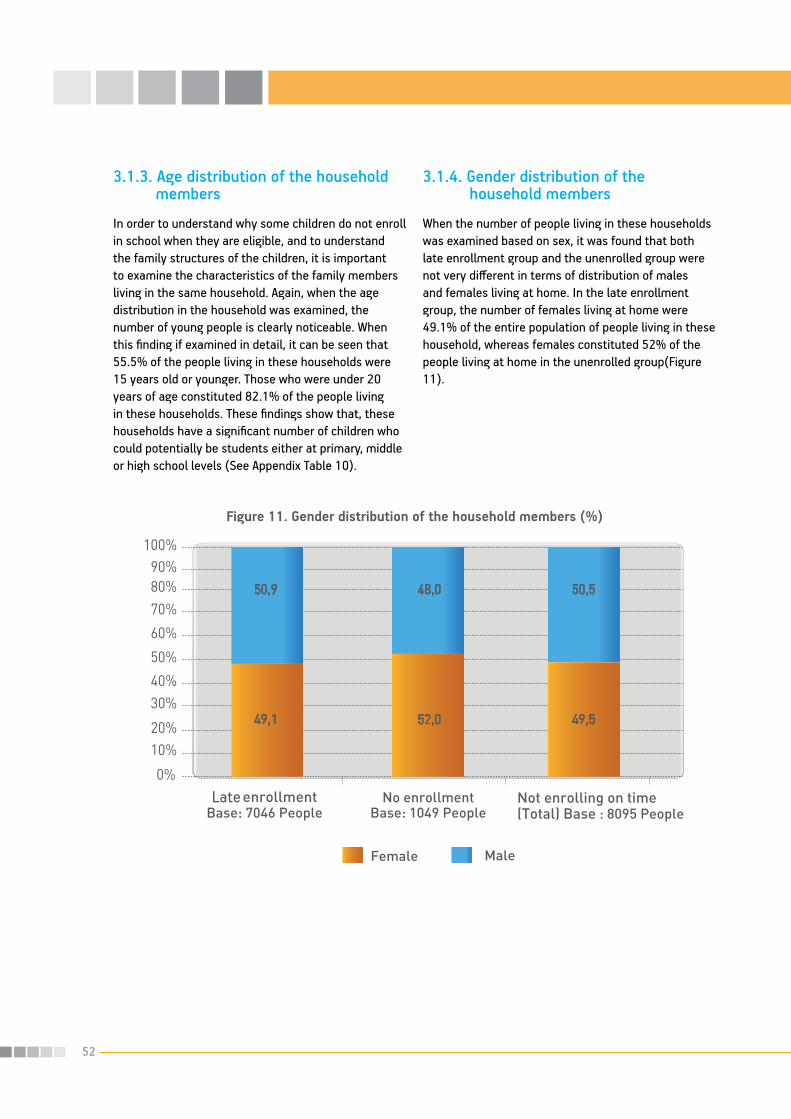
52
3.1.3. Age distribution of the household membersIn order to understand why some children do not enroll in school when they are eligible, and to understand the family structures of the children, it is important to examine the characteristics of the family members living in the same household. Again, when the age distribution in the household was examined, the number of young people is clearly noticeable. When this finding if examined in detail, it can be seen that 55.5% of the people living in these households were 15 years old or younger. Those who were under 20 years of age constituted 82.1% of the people living in these households. These findings show that, these households have a significant number of children who could potentially be students either at primary, middle or high school levels (See Appendix Table 10).
3.1.4. Gender distribution of the household membersWhen the number of people living in these households was examined based on sex, it was found that both late enrollment group and the unenrolled group were not very different in terms of distribution of males and females living at home. In the late enrollment group, the number of females living at home were 49.1% of the entire population of people living in these household, whereas females constituted 52% of the people living at home in the unenrolled group(Figure 11).
Figure 11. Gender distribution of the household members (%)

53
3.1.5. Educational distribution of the household membersWhen the educational levels of the household members who are over 15 years of age were examined, it was found that a significant number of these people were illiterate. In the late enrollment group, 42.3% of the household members were illiterate whereas this was 53.5% in the unenrolled group. In the late enrollment group, household members who are over 15 years of age and had education higher than primary level (includes high school drop-outs) constituted
10.3%, and in the unenrolled group, this group constituted 6.7% of the household members. People with primary school education constituted 19.5% of the late enrollment group, and in the unenrolled group people with primary school education constituted 17.5%. Even though people living in the households of both groups had lower educational levels, the people in the unenrolled group had considerably lower levels of education. When the sample was examined as a whole, it was found that 43.8+4.13% of the people living in the participating households were illiterate (Figure 12).
3.1.6. Relationship between education and gender based on living in rural or urban residential areasThe educational levels and gender distribution of everyone, children and adults alike, were examined based on whether they lived in rural or urban areas both
for unenrolled and late enrollment groups. Results were presented both with children 5 years old and under included and excluded. Strikingly, results show that women, both in rural and urban areas were unable to benefit from educational opportunities. Particularly, in the unenrolled group, and among those who live in the rural living areas of this group, independent of including
Figure 12. Educational levels of household members older than 15 years of age (%)

54
children 5 years old and under in the analysis, women had the worst educational levels. This is an extremely alarming situation. When the results were examined in detail, it was found that when children 5 and under were included in the analysis, in the late enrollment group, 48% of the females in the urban living areas and 51.9% of females in the rural living areas were illiterate. When children 5 years old and under were exluded from the analysis, it was found that in the late enrollment group, 39.3% of the females, and in the rural living areas 42.9% of the females were illiterate.
The results were also examined for the unenrolled group, which includes children who stayed out of school two years in a row, and the situation was found to be even more problematic. In this group, 73.9% of all women and female children in rural areas, 68.7% of the all women and female children in urban areas were illiterate. These numbers include all female members of the households including young female children. When the educational levels of the females at or above 6 years of age were examined, it was found that in rural areas 60.2% of the females, and in urban areas 53.9% of the females were deprived of any educational opportunities.
The situation was somewhat different for the male members of the households. Findings indicated that in the late enrollment group, 31,5% of the males, and in the unenrolled group 28,9% of the males were illiterate. When only the males at or above 6 years of age were examined, even though their levels of illiteracy were above national averages, the situation seemed much better than females: 18,3% of the males in the rural living areas and 16,8% of the males in the urban living areas were illiterate.
As it was the case for women, men who were in the unenrolled group were at a higher disadvantage. Accordingly, in the unenrolled group, 46,5% of the males living in the urban areas, and 53,4% of the males living in rural areas were illiterate. In the rural areas, 37,7% of the males 6 years and above, and 29,7% of the males, again 6 years and above, in the urban areas were illiterate. These numbers illustrate how serious the problem is. Although children under
the age of 6 were included in the results, children 5 years of age and under were about 15% both in rural and urban areas of the late enrollment group.
In the research population, the total number of children younger than 6 years of age, living in the households of children who were not enrolled in school at the determined age for school enrollment, there were a total of 135.428±243. Based on the social and economical backgrounds of these families, it can be argued that these people are at risk for not enrolling in school on time.
The educational levels of the household members based on their sex and the provinces they live in are presented in Table 18 for the late enrollment group, and the same data were presented for the unenrolled group in Table 19.

55
Tabl
e 18
. Edu
catio
n an
d ge
nder
dis
trib
utio
n of
hou
seho
ld m
embe
rs 6
yea
rs a
nd o
lder
who
liv
e in
rura
l and
urb
an a
reas
in th
e la
te e
nrol
lmen
t gro
up (
Late
Enr
ollm
ent)
Freq
uenc
y%
Freq
uenc
y%
Frequ
ency
%Fre
quen
cy%
Frequ
ency
%Fre
quen
cy%
No s
choo
ling
531
42,8
239
18,3
770
30,2
655
39,2
286
16,8
941
27,9
Can
read
and
writ
e49
4,0
624,
711
14,
447
2,8
754,
412
23,
6
Early
chi
ldho
od e
duca
tion
60,
54
0,3
100,
47
0,4
60,
413
0,4
Prim
ary
scho
ol g
radu
ate
534,
319
214
,724
59,
695
5,7
234
13,8
329
9,8
Prim
ary
scho
ol d
rop-
out
766,
185
6,5
161
6,3
804,
888
5,2
168
5,0
Prim
ary
scho
ol s
tude
nt47
037
,953
540
,910
0539
,565
939
,468
840
,413
4739
,9Pr
imar
y sc
hool
gra
duat
e -(
1st t
hrou
gh 8
th)
403,
212
19,
316
16,
364
3,8
132
7,8
196
5,8
High
sch
ool d
rop-
out
40,
36
0,5
100,
46
0,4
251,
531
0,9
High
sch
ool s
tude
nt8
0,6
262,
034
1,3
372,
270
4,1
107
3,2
High
sch
ool g
radu
ate
30,
227
2,1
301,
218
1,1
754,
493
2,8
Univ
ersi
ty d
rop-
out
00
00,
00
0,0
00,
00
0,0
00,
0
Univ
ersi
ty s
tude
nt0
09
0,7
90,
41
0,1
110,
612
0,4
Grad
uate
of u
nive
rsity
and
abo
ve0
01
0,1
10,
04
0,2
100,
614
0,4
Curr
ently
att
endi
ng o
ccup
atio
nal
trai
ning
00
00,
00
00
0,0
10,
11
0,0
Tota
l1.
240
100
1.30
710
02.
547
100
1.67
310
01.
701
100
3.37
410
0
Fem
ale
Tota
lM
ale
Mal
eFe
mal
eTo
tal
R
ural
livi
ng a
reas
U
rban
livi
ng a
reas

56
Tabl
e 19
. Edu
catio
n an
d ge
nder
dis
trib
utio
n of
hou
seho
ld m
embe
rs 6
yea
rs a
nd o
lder
who
liv
e in
rura
l and
urb
an a
reas
in th
e un
enro
lled
grou
p (N
o en
rollm
ent)
Freq
uenc
y%
Freq
uenc
y%
Frequ
ency
%Fre
quen
cy%
Frequ
ency
%Fre
quen
cy%
No s
choo
ling
150
60,2
9337
,724
349
,016
053
,976
29,7
236
42,7
Can
read
and
writ
e7
2,8
83,
215
3,0
31,
010
3,9
132,
4
Early
chi
ldho
od e
duca
tion
00,
00
0,0
00,
00
0,0
10,
41
0,2
Prim
ary
scho
ol g
radu
ate
104,
032
13,0
428,
59
3,0
2710
,536
6,5
Prim
ary
scho
ol d
rop-
out
104,
017
6,9
275,
416
5,4
124,
728
5,1
Prim
ary
scho
ol s
tude
nt30
12,0
3715
,067
13,5
4715
,856
21,9
103
18,6
Prim
ary
scho
ol g
radu
ate-
(1st
th
roug
h 8t
h)6
2,4
156,
121
4,2
144,
714
5,5
285,
1
High
sch
ool d
rop-
out
00,
00
0,0
00,
00
0,0
31,
23
0,5
High
sch
ool s
tude
nt0
0,0
20,
82
0,4
31,
04
1,6
71,
3
High
sch
ool g
radu
ate
10,
44
1,6
51,
01
0,3
52,
06
1,1
Univ
ersi
ty s
tude
nt0
0,0
00,
00
0,0
00,
04
1,6
40,
7
Grad
uate
of u
nive
rsity
and
abo
ve1
0,4
00,
01
0,2
00,
01
0,4
10,
2
Tota
l24
910
024
710
049
610
029
710
025
610
055
310
0
Rur
al li
ving
are
as
Ur
ban
livin
g ar
eas
Fem
ale
Fem
ale
Tota
lTo
tal
Mal
eM
ale

57
3.1.7. Relationship between age and sex based on living in rural and urban residential areasThe relationship between age and gender as a function of living in rural or urban areas was examined both for the late enrollment and no enrollment groups. Results
indicate that, in both groups, both males and females were relatively young. This was similar both for rural and urban living areas. In other words, more than half of the people living in the participating households were at or younger than 14 years of age (See Appendix Table 11).
The relationship between living in rural or urban areas and gender was examined for the no enrollment group. Results indicated that, similar to late enrollment were
children 15 years of age or younger. This was the case both for males and females (See Appendix Table 12).
Figure 13. Age and gender distribution in the rural and urban living areas (%)(Late Enrollment )
Figure 14. Age and gender distribution in the rural and urban living areas (%) (No enrollment )
Rural living areas Urban living areas
Rural living areas Urban living areas
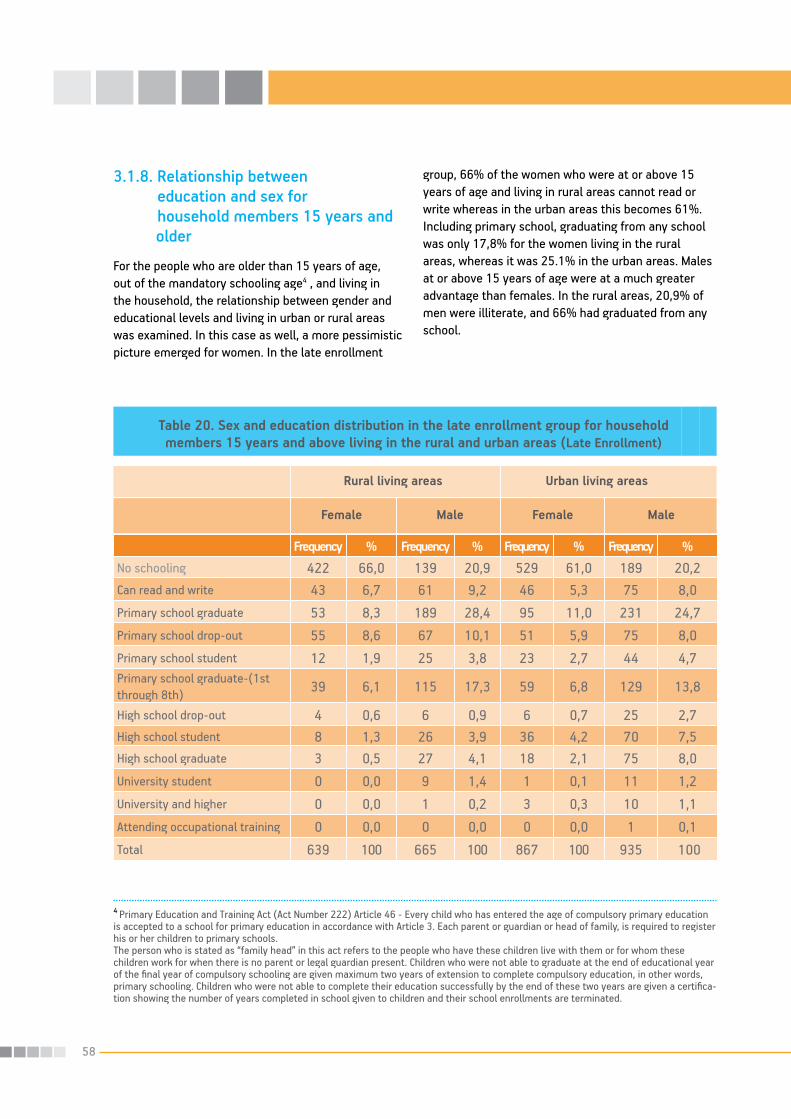
58
3.1.8. Relationship between education and sex for household members 15 years and older For the people who are older than 15 years of age, out of the mandatory schooling age4 , and living in the household, the relationship between gender and educational levels and living in urban or rural areas was examined. In this case as well, a more pessimistic picture emerged for women. In the late enrollment
group, 66% of the women who were at or above 15 years of age and living in rural areas cannot read or write whereas in the urban areas this becomes 61%. Including primary school, graduating from any school was only 17,8% for the women living in the rural areas, whereas it was 25.1% in the urban areas. Males at or above 15 years of age were at a much greater advantage than females. In the rural areas, 20,9% of men were illiterate, and 66% had graduated from any school.
4 Primary Education and Training Act (Act Number 222) Article 46 - Every child who has entered the age of compulsory primary education is accepted to a school for primary education in accordance with Article 3. Each parent or guardian or head of family, is required to register his or her children to primary schools. The person who is stated as “family head” in this act refers to the people who have these children live with them or for whom these children work for when there is no parent or legal guardian present. Children who were not able to graduate at the end of educational year of the final year of compulsory schooling are given maximum two years of extension to complete compulsory education, in other words, primary schooling. Children who were not able to complete their education successfully by the end of these two years are given a certifica-tion showing the number of years completed in school given to children and their school enrollments are terminated.
Table 20. Sex and education distribution in the late enrollment group for household members 15 years and above living in the rural and urban areas (Late Enrollment)
Frequency % Frequency % Frequency % Frequency %
No schooling 422 66,0 139 20,9 529 61,0 189 20,2Can read and write 43 6,7 61 9,2 46 5,3 75 8,0Primary school graduate 53 8,3 189 28,4 95 11,0 231 24,7Primary school drop-out 55 8,6 67 10,1 51 5,9 75 8,0Primary school student 12 1,9 25 3,8 23 2,7 44 4,7Primary school graduate-(1st through 8th) 39 6,1 115 17,3 59 6,8 129 13,8
High school drop-out 4 0,6 6 0,9 6 0,7 25 2,7High school student 8 1,3 26 3,9 36 4,2 70 7,5High school graduate 3 0,5 27 4,1 18 2,1 75 8,0University student 0 0,0 9 1,4 1 0,1 11 1,2University and higher 0 0,0 1 0,2 3 0,3 10 1,1Attending occupational training 0 0,0 0 0,0 0 0,0 1 0,1Total 639 100 665 100 867 100 935 100
Rural living areas Urban living areas
Female FemaleMale Male

59
When the data were examined for the group of unenrolled children, it was found that in the rural areas women were illiterate at much higher rates (74,5%), and only 14,2% had graduated from any level of school, including primary school. In the urban areas, the educational level of the women were not much different from women in the rural areas, with the rate of illiteracy among women at 68%, and the rate for completing any schooling was 18,8%. For the men as well in this group, it was found that both in rural and urban areas, the educational levels were low. As a result, in the rural living areas of the unenrolled children’s group, 34,5% of the men, whereas in the urban areas 30,1% of the men were illiterate. The rate for completing any schooling including primary schools for men was 47% (See Appendix Table 13).
3.1.9. Employment status of the household membersWhen the people living in the household were examined based on their employment status, the results that emerged was not very surprising considering the number of children living in these households. In these households, only 13% of the household members were employed. Findings were similar both in late enrollment and no enrollment groups. When the employment statuses of the household members were examined in the late enrollment group, it was found that 46,3% of people between the ages of 40 and 44 were employed. In the group for unenrolled children, the people who were employed the most were between the ages of 35 and 39 with 45,6% (See Appendix Table 14).
3.1.10. Employment status of the household members 15 years of age and aboveOf those household members who are at or above 15 years of age and out of compulsory schooling age, 29% of them were currently employed. This rate was similar both in the late enrollment and no enrollment groups. When this was calculated for the research population, it was found to be 30,5% ±2.21.Examination of the types of jobs the household
members were holding underscores the seriousness of unemployment for both groups. Among the employed, the most common jobs were those that do not earn much revenue like, skilled or unskilled labor work, freelance or temporary labor work, farming, and seasonal work. The percentage of family members with jobs like state employee/civil servant, soldier, managers or professionals among people 15 years and above were only 2.5% in the late enrollment group and, 2.6% in the unenrolled group.
Table 21. Distribution of the employment status of the household members*
Frequency % Frequency % Frequency %
Unemployed 6.120 86,9 916 87,2 7,036 87,0
Employed 922 13,1 134 12,8 1,056 13,0
Total 7.042 100 1,050 100 8,092 100
No enrollmentLate Enrollment Not enrolling on time (Total)
* People who did not answer this question were not included in the table.
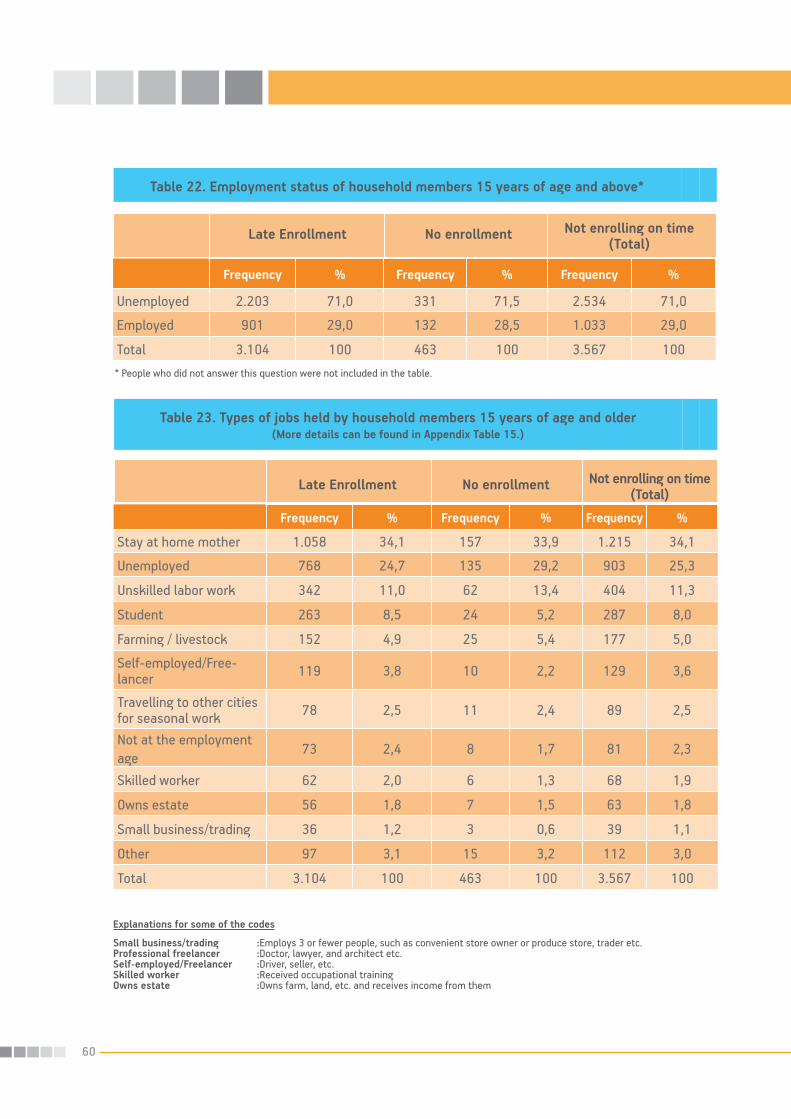
60
Table 22. Employment status of household members 15 years of age and above*
Frequency % Frequency % Frequency %
Unemployed 2.203 71,0 331 71,5 2.534 71,0
Employed 901 29,0 132 28,5 1.033 29,0
Total 3.104 100 463 100 3.567 100
No enrollmentLate Enrollment Not enrolling on time (Total)
* People who did not answer this question were not included in the table.
Table 23. Types of jobs held by household members 15 years of age and older(More details can be found in Appendix Table 15.)
Frequency % Frequency % Frequency %
Stay at home mother 1.058 34,1 157 33,9 1.215 34,1
Unemployed 768 24,7 135 29,2 903 25,3
Unskilled labor work 342 11,0 62 13,4 404 11,3
Student 263 8,5 24 5,2 287 8,0
Farming / livestock 152 4,9 25 5,4 177 5,0
Self-employed/Free-lancer 119 3,8 10 2,2 129 3,6
Travelling to other cities for seasonal work 78 2,5 11 2,4 89 2,5
Not at the employment age
73 2,4 8 1,7 81 2,3
Skilled worker 62 2,0 6 1,3 68 1,9
Owns estate 56 1,8 7 1,5 63 1,8
Small business/trading 36 1,2 3 0,6 39 1,1
Other 97 3,1 15 3,2 112 3,0
Total 3.104 100 463 100 3.567 100
No enrollmentLate Enrollment Not enrolling on time (Total)
Explanations for some of the codes
Small business/trading :Employs 3 or fewer people, such as convenient store owner or produce store, trader etc. Professional freelancer :Doctor, lawyer, and architect etc. Self-employed/Freelancer :Driver, seller, etc. Skilled worker :Received occupational trainingOwns estate :Owns farm, land, etc. and receives income from them

61
3.1.11. Whether the household members have social securityHealthy development of the household members, particularly children would depend on whether they have access to social security. When the households in the sample were examined for their status of holding social security, it was found that in the late enrollment
group 71,8% of families had social security, and in the no enrollment 80,9%. Very few families benefited from SGK (Social Security Institution, SSI). Of those families interviewed, 12,5% of them had no social security, hence no health insurance. When the employment status and the types of jobs the households were seen in the household included in the sample, this is not very surprising .
Figure 15. Whether the household members have social security* (%)
* People who did not answer this question were not included in this graph.** SGK: SSI, Pension Fund, Bağ-Kur
3.2. Characteristics of children in the household3.2.1. Number of children in the householdThe number of children living in the household was examined. It was found that the majority of the people living in the household were children (n=5676). Of these children 2785 of them were students. When the participants were asked how many of the children in their households were students, in the late enrollment
group, the most frequently seen number of children per household were two (28.9%). In the households with children who were born in 2001, not yet enrolled in schools (unenrolled), the most frequently repeated number of students living in the household was one with 36%. In this group, in 22.8% of the households, there were no children who were attending school (See Table 24). When the average number of children who were students were examined, in the late enrollment, the average number of students was 2.69 (SD=1.34), whereas in the unenrolled group it was 1.9 (SD=1.05).
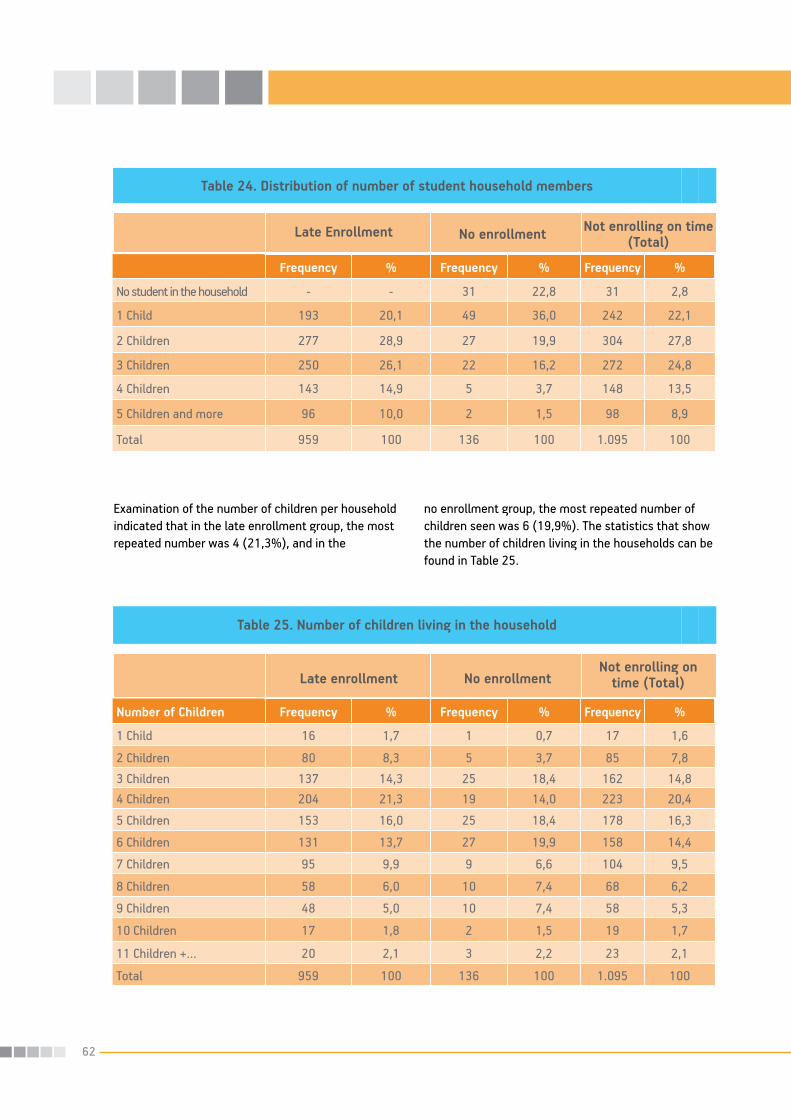
62
Table 24. Distribution of number of student household members
Frequency % Frequency % Frequency %
No student in the household - - 31 22,8 31 2,8
1 Child 193 20,1 49 36,0 242 22,1
2 Children 277 28,9 27 19,9 304 27,8
3 Children 250 26,1 22 16,2 272 24,8
4 Children 143 14,9 5 3,7 148 13,5
5 Children and more 96 10,0 2 1,5 98 8,9
Total 959 100 136 100 1.095 100
No enrollmentLate Enrollment Not enrolling on time (Total)
Table 25. Number of children living in the household
Number of Children Frequency % Frequency % Frequency %
1 Child 16 1,7 1 0,7 17 1,6
2 Children 80 8,3 5 3,7 85 7,83 Children 137 14,3 25 18,4 162 14,84 Children 204 21,3 19 14,0 223 20,4
5 Children 153 16,0 25 18,4 178 16,3
6 Children 131 13,7 27 19,9 158 14,4
7 Children 95 9,9 9 6,6 104 9,5
8 Children 58 6,0 10 7,4 68 6,2
9 Children 48 5,0 10 7,4 58 5,3
10 Children 17 1,8 2 1,5 19 1,7
11 Children +… 20 2,1 3 2,2 23 2,1
Total 959 100 136 100 1.095 100
No enrollmentLate enrollmentNot enrolling on
time (Total)
Examination of the number of children per household indicated that in the late enrollment group, the most repeated number was 4 (21,3%), and in the
no enrollment group, the most repeated number of children seen was 6 (19,9%). The statistics that show the number of children living in the households can be found in Table 25.

63
When the number of children living at home was examined, it was found that the late enrollment and the no enrollment groups were similar. There was an average of at least 5 children living in these households. However, in the no enrollment group there were more households with 6 children living at home. When the situation was examined in detail, it was found that in the late enrollment group the average was 5.14 (SD= 2.31), and in the no enrollment group the average was 5.43 (SD= 2,24 ). The Population and Health Survey of Turkey (2003) based on interviews with 10.836 households was conducted with the main purpose of providing data on fertility rates and the changes in reproductive strategies, infant and child mortality, family planning, maternal and child health and nutrition. The number of people living in the households of Turkey was 4.1 in 2003. However, the findings of the current research show that even just the number of children living in the households of children who were not enrolled in school on time were more than the national average of
total household members. As it was discussed earlier, in the households of the current research the average number of people living in each household was 7.43. When this number is compared with the numbers obtained from 2003 survey (4.1), it can be clearly seen that the households of children who did not enroll in schools on time are much more crowded.
3.2.2. Children living outside of homeApproximately 8% of the households included in the study (late enrollment=7.7%; unenrolled= 9,6%) had children who lived outside the household. These children were mainly out of home because either they were serving in the military or they were working somewhere else. The other reason given for why the child was living out of the home was education. However, these children were very few, and in the late enrollment group, only 10,9% of the children who live outside of home were there for reasons related to education.
Figure 16. Reasons for children living outside of the household (%)*
* More than one answer was given.
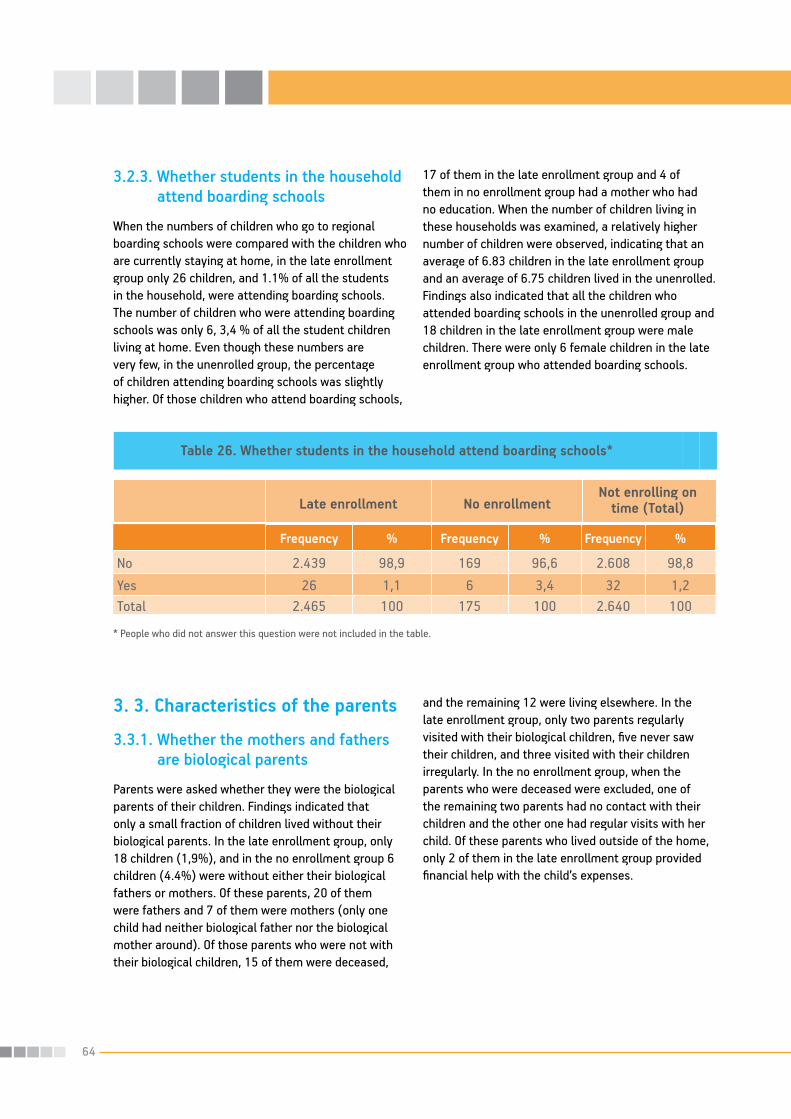
64
3.2.3. Whether students in the household attend boarding schoolsWhen the numbers of children who go to regional boarding schools were compared with the children who are currently staying at home, in the late enrollment group only 26 children, and 1.1% of all the students in the household, were attending boarding schools. The number of children who were attending boarding schools was only 6, 3,4 % of all the student children living at home. Even though these numbers are very few, in the unenrolled group, the percentage of children attending boarding schools was slightly higher. Of those children who attend boarding schools,
17 of them in the late enrollment group and 4 of them in no enrollment group had a mother who had no education. When the number of children living in these households was examined, a relatively higher number of children were observed, indicating that an average of 6.83 children in the late enrollment group and an average of 6.75 children lived in the unenrolled. Findings also indicated that all the children who attended boarding schools in the unenrolled group and 18 children in the late enrollment group were male children. There were only 6 female children in the late enrollment group who attended boarding schools.
3. 3. Characteristics of the parents
3.3.1. Whether the mothers and fathers are biological parentsParents were asked whether they were the biological parents of their children. Findings indicated that only a small fraction of children lived without their biological parents. In the late enrollment group, only 18 children (1,9%), and in the no enrollment group 6 children (4.4%) were without either their biological fathers or mothers. Of these parents, 20 of them were fathers and 7 of them were mothers (only one child had neither biological father nor the biological mother around). Of those parents who were not with their biological children, 15 of them were deceased,
and the remaining 12 were living elsewhere. In the late enrollment group, only two parents regularly visited with their biological children, five never saw their children, and three visited with their children irregularly. In the no enrollment group, when the parents who were deceased were excluded, one of the remaining two parents had no contact with their children and the other one had regular visits with her child. Of these parents who lived outside of the home, only 2 of them in the late enrollment group provided financial help with the child’s expenses.
Table 26. Whether students in the household attend boarding schools*
Frequency % Frequency % Frequency %
No 2.439 98,9 169 96,6 2.608 98,8Yes 26 1,1 6 3,4 32 1,2Total 2.465 100 175 100 2.640 100
* People who did not answer this question were not included in the table.
No enrollmentLate enrollmentNot enrolling on
time (Total)

65
When the characteristics of and interactions with the biological parent who does not reside with the children were examined, the following were found;•Inthelateenrollmentgroup,15%ofthe children did not live with their biological fathers and 5% did not live with their biological mothers. •Ofthesenoenrollmentchildren,5ofthemdidnot live with the biological fathers and two of them did not live with biological mothers. When it was examined whether the parent who did not live at home with the child was alive or deceased;•10%ofchildreninthelateenrollmentgroup, and•5%ofchildreninunenrolledgrouphadbiological parents who did not live with them •Inthelateenrollmentgroup,fivechildrendid not have regular contact, 3 had no contact, and 2 had regular contact,•Intheunenrolledgroup,1childhadnocontact, and 1 child had regular contact.When how much children had contact with their biological parents who lived outside the home was examined:
•Inthelateenrollmentgroup,3ofthemhadone or two days a week, one of them had one a month and one of them had once a year contact;
•Intheunenrolledgroup,oneofthemhadoneor two days a week contact.
When the marital status of the biological parent was examined; •Inlateenrollmentgroup,4ofthemwere
married, 2 of them were divorced, 3 of them were widowed and 1 one of them was separated,
•Innoenrollmentgroup,oneoftheparentswas married, and the other one was divorced. When the types of jobs of the biological parents
who lived outside the home was examined; •Inthelateenrollmentgroup,3ofthemwere
farmers/feeding livestock, 2 of them were temporary freelance workers, 1 of them was a civil servant, 1 of them was unskilled worker, 1 of them was unemployed,
•Innoenrollmentgroup,oneparentwasastayat home mother .
Figure 17. Whether the parent child is living together is a stepparent or a biological parent (%)
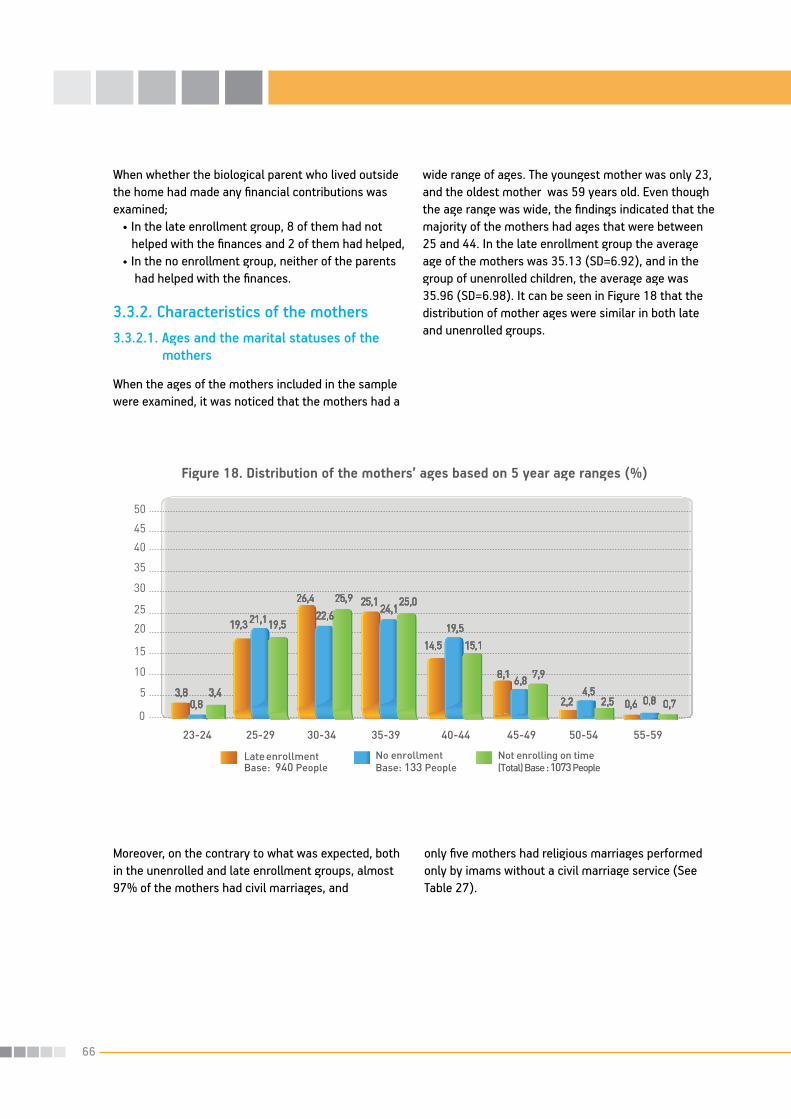
66
When whether the biological parent who lived outside the home had made any financial contributions was examined; •Inthelateenrollmentgroup,8ofthemhadnot helped with the finances and 2 of them had helped,•Inthenoenrollmentgroup,neitheroftheparents had helped with the finances.
3.3.2. Characteristics of the mothers3.3.2.1. Ages and the marital statuses of the
mothers
When the ages of the mothers included in the sample were examined, it was noticed that the mothers had a
wide range of ages. The youngest mother was only 23, and the oldest mother was 59 years old. Even though the age range was wide, the findings indicated that the majority of the mothers had ages that were between 25 and 44. In the late enrollment group the average age of the mothers was 35.13 (SD=6.92), and in the group of unenrolled children, the average age was 35.96 (SD=6.98). It can be seen in Figure 18 that the distribution of mother ages were similar in both late and unenrolled groups.
Moreover, on the contrary to what was expected, both in the unenrolled and late enrollment groups, almost 97% of the mothers had civil marriages, and
only five mothers had religious marriages performed only by imams without a civil marriage service (See Table 27).
Figure 18. Distribution of the mothers’ ages based on 5 year age ranges (%)

67
3.3.2.2. Educational status of mothersSimilar to the educational status of all the mothers living in the same household, mothers had extremely low educational levels and mothers who were illiterate were considerably high. This indicates that in the late enrollment group, 22.2% of the mothers and in unenrolled group, 71.8% of the mothers did not know how to read or write. This problem seemed to be more of a problem in the group of unenrolled children. Of these mothers, only 14.2% had enrolled in school at some point in their lives. This includes mothers who dropped out of schools and those who received diplomas. Mothers who cannot read or write constituted 85.1% of all the mothers. (See Appendix Table 16).
When we consider the research population, in the late school enrollment group, 71.6 % was illiterate whereas in the unenrolled group the illiteracy levels of the mothers go up to 87%.
3.3.2.3. Employment status of the mothers
When the employment status of the mothers was examined nearly all of them were unemployed. The percentage of mothers who were unemployed outside of the home were 96.3% in the late enrollment group and 96.2% were in the unenrolled group. These mothers were stay at home mothers, in other words, homemakers. The details of maternal educational
levels can be found in Appendix Table 16, and the details of employment statuses of these mothers can be found in Appendix Table 7.
3.3.3. Characteristics of the fathers3.3.3.1. Ages and the marital statuses of the fathers
When the ages of the fathers were examined, most fathers were between the ages 25 and 49. In late enrollment group, the youngest father was 22 years old, and the oldest father was 75 years old. It was found that the average age of the fathers in this group was 38,68 (SD=7.71). In the group where the children were still unenrolled in school two years after the expected age for school entry, the age distribution was similar to the late enrollment group. In this group, the oldest father was 73, and the youngest father was 25 years old. The average age of the fathers was 39,97 (SD=8.87).
When the educational levels of the fathers were examined, even though their illiteracy rates were considerably high, the levels of illiteracy among fathers were not as striking as mothers. As it was the case for mothers, the rates of illiteracy for the fathers were higher in the unenrolled group, (38,2%), than it was in the late enrollment group (26,8%). In both groups more than one third of the fathers were primary school graduates.
Table 27. Distribution of mothers based on their marital status
Frequency % Frequency % Frequency %
With civil marriage certificates
924 96,9 129 96,3 1.053 96,8
Widow 16 1,7 3 2,2 19 1,7Religious marriage only 5 0,5 - - 5 0,5Living together 3 0,3 1 0,7 4 0,4Divorced 3 0,3 1 0,7 4 0,4Separated 3 0,3 - - 3 0,3
Total 954 100 134 100 1.088 100
No enrollmentLate enrollmentNot enrolling on
time (Total)

68
Table 28. Distribution of the fathers’ ages based on 5 year age ranges (%)
Frequency % Frequency % Frequency %
20-24 5 0,5 - - 5 0,525-29 84 9,1 14 10,7 98 9,330-34 207 22,4 24 18,3 231 21,935-39 441 47,8 58 44,3 499 47,335-39 441 47,8 58 44,3 499 47,350-54 46 5 10 7,6 56 5,355-59 22 2,4 3 2,3 25 2,460-64 11 1,2 1 0,8 12 1,165-69 4 0,4 - - 4 0,470-74 - - 2 1,5 2 0,275-79 1 0,1 - - 1 0,1Total 923 100 131 100 1.054 100
No enrollmentLate enrollmentNot enrolling on
time (Total)
Table 29. Distribution of the educational status of the fathers
Frequency % Frequency % Frequency %
No schooling 249 26,8 50 38,2 299 28,2
Can read and write 98 10,5 9 6,9 107 10,1
Primary school graduate 373 40,2 49 37,4 422 39,8
Primary school drop-out 63 6,8 12 9,2 75 7,1Primary school gradu-ate-(1st through 8th)
84 9,0 6 4,6 90 8,5
High school drop-out 7 0,8 0 0,0 7 0,7High school graduate 45 4,8 3 2,3 48 4,5
University student 1 0,1 1 0,8 2 0,2Graduate of a college or higher
8 0,9 1 0,8 9 0,8
Attending vocational training 1 0,1 0 0,0 1 0,1
Total 929 100 131 100 1.060 100
No enrollmentLate enrollmentNot enrolling on
time (Total)

69
3.3.3.2. Employment status of the fathers
Parallel to the findings about the unemployment levels of the household members, when fathers were exam-ined about their employment statuses, it was found that in the late enrollment group, 73.4% of the fathers, and in the no enrollment group, 75.6% of the fathers were currently unemployed. As it was seen in the
section about the types of jobs household members engaged in, most of the fathers did not have a regular job with a regular income. When the educational levels of the fathers and the economical levels of the families are taken into consideration, this result is as expected and shows the levels of poverty these families are experiencing.
Table 30. Types of jobs fathers hold*(More information can be found in Appendix Table 18.)
Frequency % Frequency % Frequency %
Unskilled labor work 262 28,4 45 34,6 307 29,1
Unemployed 233 25,2 31 23,8 264 25,0Farming / livestock 123 13,3 18 13.8 141 13,4Self-employed/freelancer 110 11,9 7 5,4 117 11,1Owns estate 49 5,3 7 5,4 56 5,3Skilled labor 47 5,1 5 3,8 52 4,9Travelling to other cities for seasonal work
28 3,0 8 6,2 36 3,4
Small business/trading 30 3,2 1 0,8 31 2,9State employee/civil serv-ant
23 2,5 5 3,8 28 2,7
Other 19 2,1 3 2,3 22 2,1Total 924 100 130 100 1.054 100
* People who did not answer this question were not included in the table.
No enrollmentLate enrollmentNot enrolling on
time (Total)
3.3.4.Not enrolling in school on time and parental educationQuantitative research findings clearly showed that both the mothers and the fathers of children who did not enroll in schools at the legally determined age had very low levels of education, almost none of the mothers had paid jobs outside the home, most fathers had low-paying and irregular jobs requiring unskilled labor work and unemployment levels were very high. In fact, the educational levels of the mothers and fathers were examined for late enrollment and no enrollment groups separately. It was found that mothers and
fathers of children who were still outside the school system had lower educational levels than those in the late enrollment group. The group that had the lowest educational levels was the mothers of unenrolled children. These findings obtained from the quantitative investigation clearly show that one of the biggest predictors of children not enrolling in school on time is the low educational levels of mothers and fathers.
Examination of the qualitative findings revealed a similar picture showing that one of the biggest contributors to late school enrollment was parental educational levels. Examination of the qualitative

70
data in detail show that, particularly in focus group meetings, participants often discussed the fact that when mothers and fathers do not know how to read or write, in other words, when they are not educated, their children are at a greater risk for not enrolling in school on time. Those who expressed this opinion also stated that parents who themselves did not get to experience schooling would have a difficult time sending their children to school and they would even perceive not sending their children to school as “normal.” They also stated during the focus group meeting discussions that school and education were part of “culture,” only those who had such an experience could and would want their children to have the same experience. A participant who identified himself as an educator emphasized the relationship between parental education and timely school enrollment:
“Educational level of the people living in the region is obvious. Findings of a research I conducted in my own district show that number of illiterate men and women in my district is very high. We get students from these families. What type efforts would a family fitting into this description put into getting education for its child? We have to spread the notion of education to famlies.”
The importance of mothers’ and fathers’ education was also emphasized during the semi-structured interviews similar to the findings of quantitative research and focus group meetings. When the participants were asked to speculate on the reason for late school enrollment, the most important reason stated by the participants was that “families (legal guardians) were unaware of the notion of how education was important and there was social and cultural deprivation.” Without a doubt, the fact that the majority of the participants were not parents experiencing the problem should be a factor for why such a finding emerged. This response was given largely by MONE workers, local governors and administrators. As stated by the participants, families experiencing problems with “awareness for
education” is an important finding because this is a view expressed by people who know the local people more closely. Moreover, it is also important because this is a view expressed by the people, most of whom, interact with these families closely regarding enrolling children in school on time.
3.4. Houseehold characteristics3.4.1. Household incomes and expensesQuestions asked about the income and the expenditures of the families show that these families have very low income levels. In the late enrollment group, 76,9% of the participants and in the unenrolled group, 79,5% of the participants reported that they spent 750 TL or less per month. Both in the late enrollment and unenrollment groups, it was found that monthly expenditures were more than monthly income stated. In the late enrollment group, median expenditure level was 545 TL, whereas median income level was 399 TL. In the no enrollment group, median expenditure level was reported to be 573 TL, whereas median income was 422 TL.

71
Participants who reported higher levels of monthly expenditure than income were asked how they were making up the difference. Findings indicated that 51% of the participants in the late enrollment group and 43.9% of the participants in no enrollment group were
getting loans. The remaingning people indicated that their families, neighbors, municipalities, and other governmental agencies and charities were helping them.
Figure 19. Average monthly expenditure of households (TL) (%)
Figure 20. Total household monthly income (TL) (%)
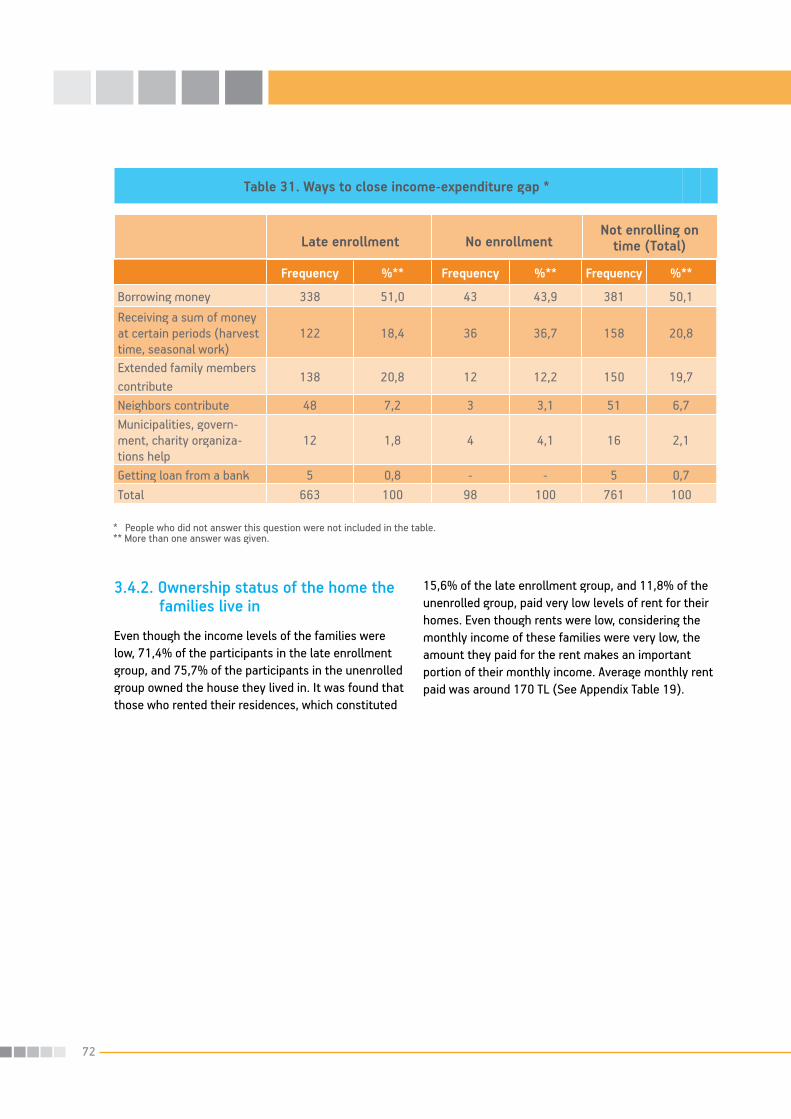
72
* People who did not answer this question were not included in the table.** More than one answer was given.
Table 31. Ways to close income-expenditure gap *
Frequency %** Frequency %** Frequency %**
Borrowing money 338 51,0 43 43,9 381 50,1Receiving a sum of money at certain periods (harvest time, seasonal work)
122 18,4 36 36,7 158 20,8
Extended family members contribute
138 20,8 12 12,2 150 19,7
Neighbors contribute 48 7,2 3 3,1 51 6,7Municipalities, govern-ment, charity organiza-tions help
12 1,8 4 4,1 16 2,1
Getting loan from a bank 5 0,8 - - 5 0,7Total 663 100 98 100 761 100
No enrollmentLate enrollmentNot enrolling on
time (Total)
3.4.2. Ownership status of the home thefamilies live in
Even though the income levels of the families were low, 71,4% of the participants in the late enrollment group, and 75,7% of the participants in the unenrolled group owned the house they lived in. It was found that those who rented their residences, which constituted
15,6% of the late enrollment group, and 11,8% of the unenrolled group, paid very low levels of rent for their homes. Even though rents were low, considering the monthly income of these families were very low, the amount they paid for the rent makes an important portion of their monthly income. Average monthly rent paid was around 170 TL (See Appendix Table 19).

73
Table 33. Average size of the home(When the residence was a house, garden, patio, etc. not included.)
NAverage
(m2)Standard Deviation
Minimum Maximum
Late Enrollment 785 91,37 33,51 20 301
No enrollment 92 92,06 33,07 20 200
Not enrolled on time (Total) 877 91,44 33,4 20 301
3.4.3. The size of the homeEven though majority of the families were not paying rent for their homes and it was somewhat of a financial relief for these families not to deal with this, the homes they lived in were usually small (See Appendix Table 20 to review the sizes of the residences families lived in). The average size of a home in the late enrollment group was 91 meters square, and in the
unenrolled group, it was 92 meters square (Table 33). Even though 90 meter square could give a comfortable living space for a small family, considering the families included in the sample were very large in size, these homes were very small and did not give enough space for living.
When the number of rooms in these homes was examined, it was found that there were 2 or 3 rooms on average. As expected, only 1,7% of the children in
the late enrollment group, and 0,7% of the children in the unenrolled group had their own rooms.
* People who did not answer this question were not included in the table.
Table 32. Ownership status of the home the families live in*
Frequency % Frequency % Frequency %
Home owner 683 71,4 103 75,7 786 71,8
Renter 149 15,6 16 11,8 165 15,1Belongs to a relative, no rent paid
117 12,2 16 11,8 133 12,2
Housing unit 7 0,7 - - 7 0,6State property, no rent paid
1 0,1 1 0,7 2 0,2
Total 957 100 136 100 1.094 100
No enrollmentLate enrollmentNot enrolling on
time (Total)

74
Table 34. Descriptive statistics for the number of rooms in the residence the household member live in(Bathroom, toilet not included)
NAverage(no.of rooms)
Standard Deviation
Minimum Maximum
Late Enrollment 938 2,66 0,93 1 6
No enrollment 135 2,77 0,90 1 5
Not enrolling on time (Total) 1073 2,67 0,93 1 6
3.4.4. Social and economical factors associated with not enrolling in school on timeWhen the findings of the quantitative research were examined, it was found that families of children who did not enroll in school on time had very low income levels, and were having serious financial difficulties, particularly the ones with unenrolled children. When the monthly incomes and expenditures of these families were examined, it was found that to make up the difference, families were getting either loans or financial support from various sources. Even though in both groups families were living in their own homes, these homes were very small when the sizes of these families are considered, and almost no child had a room of his or her own. In summary, the families of children who did not enroll in school on time were low income families.
Parallel to the findings of the quantitative research, in semi-structured interviews, participants emphasized the importance of financial limitations, seasonal work, the need for children to work and migration as factors influencing children not to enroll in school on time. As a function of these difficulties, some participants stated, children were not sent to school because of developmental problems they were experiencing. It was further expressed that in Eastern and South Eastern regions, financial and social problems were deeply experienced at large and many of the aforementioned problems were simply larger in magnitude. Because it clearly represents how families are negatively experienced by the social and economical challenges experienced in these regions,
it is important to take a note of what a parent who participates from Van has to say:
”Children of our neighborhood go downtown and become a seller of tissues, polishes shoes on the streets at ages of 7 or 8 because of financial challenges. Then the child comes to age 10 and cannot even go to school at all after that time, is denied enrollment. There is not one school built in our neighborhood. They are all far. For example, I look at it, in the mornings I take my child to school or if I am not there his mother take the child to school or the child’s school is really far away, I take him to school in the car, but I am not home all the time. His mother is not able to take him to school everyday, the school is far, and I am not able to send him to school. I cannot send him to school on his own, once he gets a little older, when he gets to be eight, I think…”
Furthermore, children not being able to speak Turkish at a sufficient level and families not sending their children to school, or sending their children to school late because of political factors were also expressed by some participants as factors associated with social and economical challenges people in the region face. Moreover, safety issues because of terrorism, children being scared, and illness/disability were some of the other factors expressed by the participants. Participants stated that these problems, when experienced with economical challenges the interaction effect becomes more and multiplied and influences the lives of families worse. A principal participating from province of Ağrı talks about the difficulties experienced with Turkish language acquisition;
“ The actual problem is even deeper. How do you

75
call a child? In your own language. Child does not even know Turkish until he/she is 6 or 7, is not even ready for school.”
It was also reported that children of families who work in agriculture and livestock business often end up helping their families during the busy seasons of work, hence causing these children to start school a few months late. This, accordingly was one of the factors stated by the participants contributing to children not enrolling in school on time. Participants reported that even though this did not seem to them as a factor directly influencing late school entry, it illustrated family priorities. Some families sent their children out to work, for example selling tissues on the street, which was a factor contributing to children not enrolling in school on time. It was discussed that while this was a factor contributing to late school entry, sometimes this was a factor influencing children to be completely out of school. Some of the social stakeholders participated in focus group meetings emphasized that economical factors were more influential on issues like missing school, school drop-outs, and not continuing on with education after primary school more so than not enrolling in school on time. As a result, a principal from province of Diyarbakır discussed how child labor is a serious problem both in Diyarbakır and many regions of Turkey, and shared his views as follows;
“We have seasonal workers in Diyarbakır, children are working in the outskirts of the city. The children of such families are automatically not enrolled in schools. This is not only a problem for Diyarbakır, it is a problem in many areas in Turkey. There are children living in what we call varoş [outskirts of a city, poor] and most of them work in streets. Let me give you an example, I researched that in my own school we have 3000 children, and 30-40% of them work in the streets.”
In the focus group meetings, it was discussed that one of the significant sources of income for many families in the region was to migrate to somewhere else during a season for a few months and work there. In addition to this, another practice for some families was to move to plateaus. Both practices cause these families to leave where they live for some time during the year, hence they are similar in this respect. In
focus group meetings, it was discussed that as a function of this type of life style, when they finish their work and return to where they live, many families find that the school registrations are closed, and even classes resumed. The main problem here was not so much the closing of registration period, rather, it was families not knowing their right to register their school whenever they were able, and families not being informed of this right. In fact, in Şanlıurfa, one parent reported that because of poverty, they had to engage in seasonal migrant work, and because of this they had to enroll one of their children to school with a year delay. This parent expressed the difficulties experienced by them as a family and by their children as follows:
”We had the child registered right at 7 years of age. We did not send the child to school for a period of time, we left for work. We went to Yozgat to pick potatoes. I had to take the child with me. We have to, if we had any other way, we would not go. Your own home could not be compared to staying in the field…Twice a year in May and in July we go to Manisa to pick grapes. When we come back from Manisa, schools are already open and one whole month is gone by. I have to send the child to school when we come back home, I have no other choice. Everyone learned how to read when they first started, but this one [child] came late, cannot catch up with all the school work. He gets very upset when we are behind. [The child] says “I love my teacher, I love my school, and I am going to go [to school]. If I had a job here, if I have a place where I can leave my child, then the child can go to school. We do not have jobs, we are poor. We have a house, we do not have anything else. They [state]give assistance, they are giving it to the rich, to land owners. Where are the poor?
We do not get any assistance, scholarships or educational support.”
Another problem associated with seasonal migrant work and moving up to plateaus was that because of the life style of these families, these families are difficult to contact and their children are difficult to be screened and identified. As a result of this, monitoring and identifying these families are difficult and the MONE officials do not really know about the

76
status of these children, thus unable to have any intervention. Again in the province of Ağrı, a member of an NGO discussed the difficulties with screening and monitoring of such children and emphasized how all the stakeholders need to work together to fight this problem.
“This is a job for all…Healthcare providers should also share the burden, they go everywhere. When they meet with the families, while immunizing school-age children, they can provide information about the importance of education to the families. This is not just a problem for educators. Everyone has a responsibility.”
In focus group meetings, factors such as economic deprivation, seasonal migration, families having too many children and being uneducated were all discussed as factors contributing both to late school entry and no school enrollment. Specifically, in these meetings, the lack of education of parents was emphasized as one of the main reasons for why children do not enroll in school on time.
3.5. General characteristics ofchildren who were born in 2001
3.5.1. School enrollment status ofchildren born in 2001
Of those children who were born in 2001, and were eligible to attend school in 2007 – 2008 educational year, 12,4% of them (n=136) were still unenrolled and out of school two years after their eligibility to enroll in school. The remaining 87,6% of the children (n=959) had enrolled in school a year after their eligibility to attend school even though they were not enrolled in school on time.
Figure 21. School enrollment status of children born in 2001 who were not enrolled in school on time (No enrollment on time, Base: 1095 people)

77
3.5.2. Sex of children who were not enrolled to school on timeWhen we examine the sex distribution of children who were not enrolled on time and included in the sample, we found that there were differences between the late enrollment and no enrollment groups. The late enrollment group had more male children (51,5%), while in the unenrolled group, there were more female children (63,2%) (Figure 22).
3.5.3. Knowledge of the participant of the actual age of the childIt was important to investigate how parents determine their child’s age for school enrollment because one of the most important goals of this study was to find out the factors contributing to why children do not enroll in school even though they are at the legal age for primary school enrollment. Even though in their official birth certificate the birth years of target children included in the study were written as 2001, the interviewees were asked one more time to state the age the children had completed. According to the
birth year indicated in their birth certificate these children were eight years old in 2009. However, in the late enrollment group, 35,9% of the parents, and in the unenrolled group, 41,9% of the parents, indicated that their children were eight years old. The number of parents who answered this question was 948. It is surprising to note that, of those parents, 64% of them in the late enrollment group and 56,6% of them in the unenrolled group indicated that their children were just now 7 years of age.
This difference was statistically significant based on the results obtained from chi square analysis, [(χ2(1)=10.36, p<0.005)]. Even though in general the educational levels were low for the entire population of the provinces included in the study, findings show that females are more seriously affected by this problem than are males. More attention needs to be paid to the fact that more female children were out of school in the group that had been out of school two years in a row.
Figure 22. Sex distribution of children who were not enrolled school on time (%)

78
Figure 23. Age of the child based on the calculation of the participant (%)
Next, the parents were asked whether the actual date of birth of these children was the same as the one indicated on their birth certificate cards. It was found that in the late enrollment group, 98,9% of the
children and in the unenrolled group, 94,9% of the children had parental reports of their dates of birth match with what is written on their birth certificate cards.
Figure 24. Consistency between the actual and the recorded date of birth for the child who did not enroll in school on time (%)
* People who did not answer this question were not included in the table.
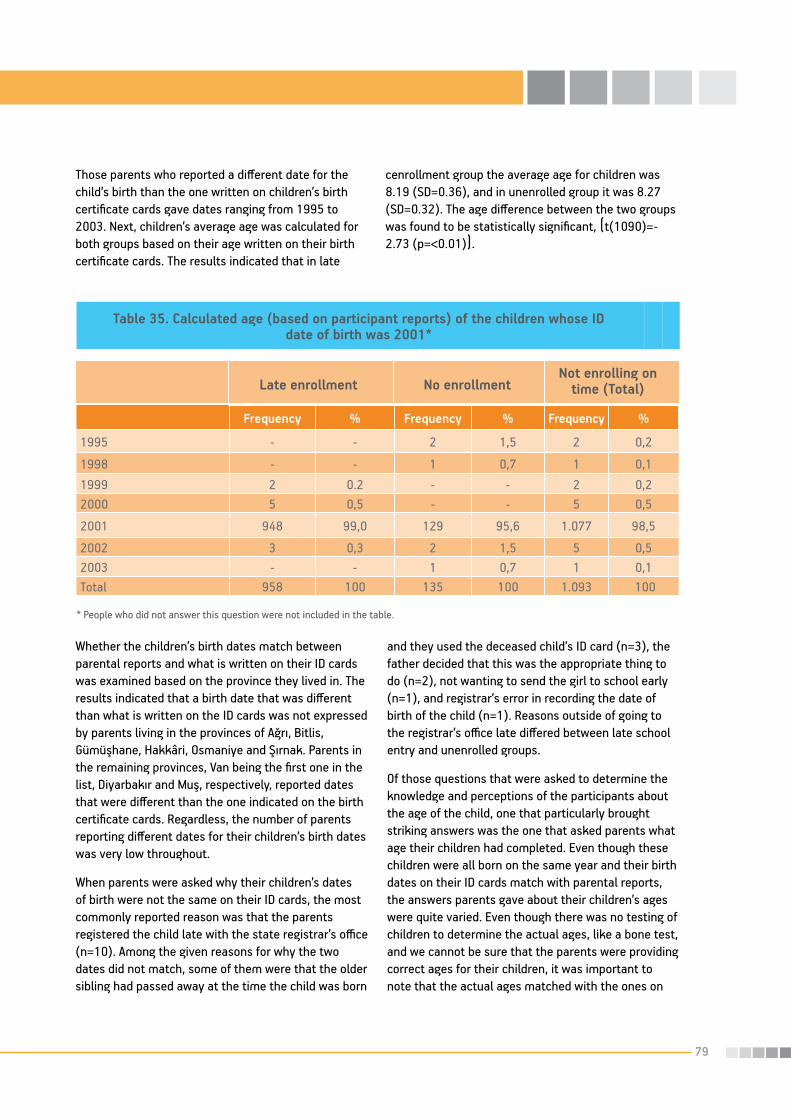
79
Those parents who reported a different date for the child’s birth than the one written on children’s birth certificate cards gave dates ranging from 1995 to 2003. Next, children’s average age was calculated for both groups based on their age written on their birth certificate cards. The results indicated that in late
cenrollment group the average age for children was 8.19 (SD=0.36), and in unenrolled group it was 8.27 (SD=0.32). The age difference between the two groups was found to be statistically significant, (t(1090)=-2.73 (p=<0.01)).
Whether the children’s birth dates match between parental reports and what is written on their ID cards was examined based on the province they lived in. The results indicated that a birth date that was different than what is written on the ID cards was not expressed by parents living in the provinces of Ağrı, Bitlis, Gümüşhane, Hakkâri, Osmaniye and Şırnak. Parents in the remaining provinces, Van being the first one in the list, Diyarbakır and Muş, respectively, reported dates that were different than the one indicated on the birth certificate cards. Regardless, the number of parents reporting different dates for their children’s birth dates was very low throughout.
When parents were asked why their children’s dates of birth were not the same on their ID cards, the most commonly reported reason was that the parents registered the child late with the state registrar’s office (n=10). Among the given reasons for why the two dates did not match, some of them were that the older sibling had passed away at the time the child was born
and they used the deceased child’s ID card (n=3), the father decided that this was the appropriate thing to do (n=2), not wanting to send the girl to school early (n=1), and registrar’s error in recording the date of birth of the child (n=1). Reasons outside of going to the registrar’s office late differed between late school entry and unenrolled groups.
Of those questions that were asked to determine the knowledge and perceptions of the participants about the age of the child, one that particularly brought striking answers was the one that asked parents what age their children had completed. Even though these children were all born on the same year and their birth dates on their ID cards match with parental reports, the answers parents gave about their children’s ages were quite varied. Even though there was no testing of children to determine the actual ages, like a bone test, and we cannot be sure that the parents were providing correct ages for their children, it was important to note that the actual ages matched with the ones on
Table 35. Calculated age (based on participant reports) of the children whose ID date of birth was 2001*
Frequency % Frequency % Frequency %
1995 - - 2 1,5 2 0,2
1998 - - 1 0,7 1 0,11999 2 0.2 - - 2 0,22000 5 0,5 - - 5 0,5
2001 948 99,0 129 95,6 1.077 98,5
2002 3 0,3 2 1,5 5 0,52003 - - 1 0,7 1 0,1Total 958 100 135 100 1.093 100
* People who did not answer this question were not included in the table.
No enrollmentLate enrollmentNot enrolling on
time (Total)

80
Table 36. Distribution of those whose reports indicated a discrepancy between the actual and the recorded age of the child by province they live in
Different TotalSame
Frequency % Frequency % Frequency %
No enrollment
DiyarbakırMuşŞanlıurfaVan
12124147
92,392,397,692,2
1114
7.77.72.47.8
13134251
100100100100
Frequency % Frequency % Frequency %
Not enrolling on time (Total)
DiyarbakırMuşŞanlıurfaVan
197 72
260201
98,598,697,496,6
3177
1,51,42,63,4
20073
267208
100100100100
Frequency % Frequency % Frequency %
Late enrollment
DiyarbakırŞanlıurfaVan
185219154
98,997,398,1
263
1,12,71,9
187225157
100100100
the ID cards. One of the most common reasons for the dates not matching was that parents had gone to the registrar’s office late to register their child in citizenship/census bureau (See Appendix Table 21).
As it was already discussed, parents have a legal right to postpone their children’s primary school enrollment for a year as stated in Article 15. Because it is a question of concern to decide when to enroll children in school if they were born later than September, which is when the academic year officially begins in Turkey, children’s ages were also examined based on the month they were born. Results show that in the late enrollment group 291 (30,4%) of the children and in the unenrolled group, 30 children (22,1%) was born either in October or later.
3.5.4. Not enrolling in school on time, child’s age and being unenrolled
Quantitative findings revealed that most of the parents were legally married, all the children had a citizen’s
state ID, and most of the birth dates on these IDs matched with what the parents reported the children’s actual birth dates were. Despite these findings, it was also found that parents were calculating the children’s ages differently, and most of them were reporting that their children were younger than their actual ages. As a result, parents’ calculations of children’s ages seem to be a factor contributing to children not enrolling in school on time.
In focus group meetings, children’s ages, whether the parents were legally married, and the household structure and functioning, seem to bring up very interesting discussions.
Participants discussed that parents being legally married, children being registered at the citizenship bureau, and even mother being registered with the citizenship bureau were all factors influencing children’s timely school enrollment. It was discussed that families without legal marriage certificates did not register their children with the state citizenship

81
Table 37. Birth months as indicated in the birth certificate record of children who were born in 2001*
Frequency % Frequency % Frequency %
January 134 14 29 21,3 163 14,9February 58 6,1 8 5,9 66 6March 68 7,1 11 8,1 79 7,2April 62 6,5 10 7,4 72 6,6May 72 7,5 11 8,1 83 7,6June 64 6,7 8 5,9 72 6,6July 55 5,7 11 8,1 66 6August 74 7,7 12 8,8 86 7,9September 80 8,4 6 4,4 86 7,9October 110 11,5 13 9,6 123 11,2November 92 9,6 9 6,6 101 9,2December 89 9,3 8 5,9 97 8,9Total 958 100 136 100 1.094 100
* People who did not answer this question were not included in the table.
No enrollmentLate enrollmentNot enrolling on
time (Total)
bureau, and waited until they get a legal marriage certificate to register their children. As a result, children, particularly girls, were registered late with the state. Participants further discussed that some children were actually at high school age, but when you looked at their state ID cards, it was showing that
these children were at the age of elementary school. Moreover, parents were sometimes coming to primary schools to enroll their children in schools at those ages.
Another problem that was discussed was that when the mothers were not registered with the state, and did not have birth certificate cards, they were not able to have legal marriage certificates and sometimes their children were registered under another woman’s name. As a result, according to focus group discussants, the families were not thinking about the issue on enrolling children in school on time. Furthermore, some participants reported that the problem was more than just not enrolling children on time; they believed that such families did not even think about enrolling children in school because of not having the awareness or the recognition of such a responsibility. Even though quantitative findings did not show similar results, it is possible that some children who do not enroll in schools on time might possibly be affected by such conditions as the participants of focus group
meetings claimed.
In focus group meetings, using state birth certificate cards of deceased children for younger children was also discussed as another practice engaged in by some families. Instead of recording the death of the older child and getting a new birth certificate card for the newborn, some families were simply using the birth certificate card that they already had for various reasons, including not being able to go and complete the paperwork necessary to obtain a new birth certificate due to limited Turkish. Thus, even though the families were actually taking the child at the accurate age when the child was completing 72 months of age, because the birth certificate card belonged to the deceased older sibling, the child was treated as an older child who enrolled in school late.

82
3.6. General health of children who were born in 2001One of the very important factors influencing children’s timely enrollment in school is the physical health of children. Premature birth, disability, chronic illnesses, and developmental delay are all among the factors that negatively influence children’s enrollment in school on time. As a result, families were asked to report on the child’s health status when born, and if
there was a health problem then the parents were asked to report the type of the problem, how long the problem lasted and whether the problem currently affects the child’s well being.
Based on the information parents reported, it was found that the children in the unenrolled group had experienced more problems than children in the late school entry group, (χ2(1)=4.48, p<0.05).
Figure 25. Health of children when they were born (%)
Findings indicated that 12.2% of the children in the late school entry group had various health problems or developmental challenges while it was 19.1% of the children in the unenrolled group. This means, the ratio of children with a disability or illness were more in the unenrolled group than it was in the late enrollment group.Parents who reported that their children had some problems at birth were asked to describe these problems. The most common response provided in the late enrollment group was developmental problems (31.5%), followed by seizures (8.7%) and problems with the eyes (5.5%). In the unenrolled group, seizures, physical disability, and speech problems
were reported at similar rates (11.1%) by parents (See Appendix Table 22). Even though problems experienced at birth could have the potential to affect children’s health during school years and their school experiences, if the problem was resolved during infancy or early childhood period, the result would be different. Because of this, parents were asked to report whether these health or developmental problems continued into school years. Parents’ responses showed that a significant number of children in both the late enrollment group (67.5%) and the unenrolled group (76.9%) continued to have these problems throughout their childhood.
Only during infancy, then it was resolved/cured
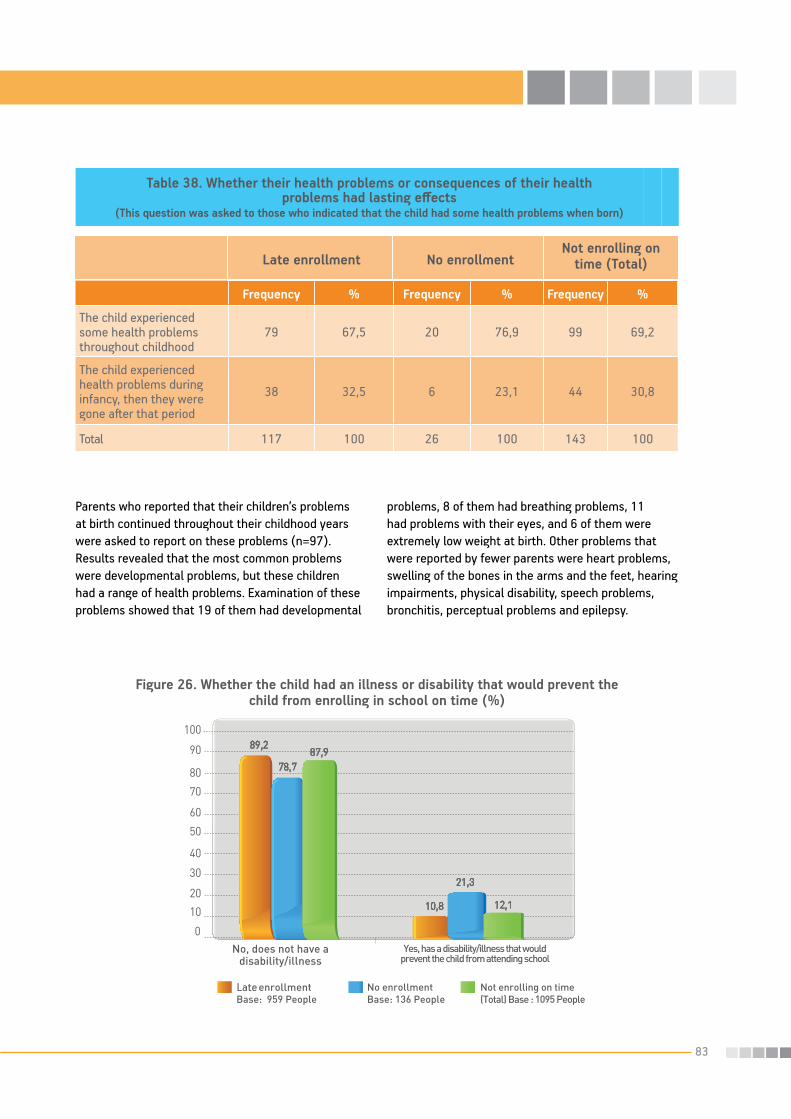
83
Parents who reported that their children’s problems at birth continued throughout their childhood years were asked to report on these problems (n=97). Results revealed that the most common problems were developmental problems, but these children had a range of health problems. Examination of these problems showed that 19 of them had developmental
problems, 8 of them had breathing problems, 11 had problems with their eyes, and 6 of them were extremely low weight at birth. Other problems that were reported by fewer parents were heart problems, swelling of the bones in the arms and the feet, hearing impairments, physical disability, speech problems, bronchitis, perceptual problems and epilepsy.
Table 38. Whether their health problems or consequences of their health problems had lasting effects
(This question was asked to those who indicated that the child had some health problems when born)
Frequency % Frequency % Frequency %
The child experienced some health problems throughout childhood
79 67,5 20 76,9 99 69,2
The child experienced health problems during infancy, then they were gone after that period
38 32,5 6 23,1 44 30,8
Total 117 100 26 100 143 100
No enrollmentLate enrollmentNot enrolling on
time (Total)
Figure 26. Whether the child had an illness or disability that would prevent the child from enrolling in school on time (%)

84
Frequency %** Frequency %**
Long-term; Does not effect school or daily life but prevents participating in social activities that require effort
59 46,5 6 22,2
Long-term; Does not affect life quality but requires regular medical checks 19 15 1 3,7
Long-term; Requires receiving assistance for hygiene and living needs 14 11 4 14,8
Conditions that affect one through 3 months 12 9,4 6 22,2
Long-term; Conditions that require receiving assistance to get education and daily activities 8 6,3 8 29,6
Conditions that affect between one month and up to three months 8 6,3
Conditions, temporary, yet affecting more than 3 months 3 2,4 2 7,4
Conditions that would have no influence 4 3,1Total 127 100 27 100
No enrollmentBase: 26 People
Late enrollment Base: 116 People
Table 39. How much does the health issue when the child was born influence life quality of the child*
(This question was asked to those who indicated that the child had some health problems when born.)
When the parents reported children’s problems, it was observed that there was a range of problems. Because of this, these responses were grouped thematically and examined again. A medical doctor who specialized in pediatrics was consulted for this grouping. The main criterion used was to assess how these problems affected the life quality of the children. As a result, with this type of qualification, the goal was to understand whether the problem the child was experiencing was preventing the child from enrolling inor attending school. We sought to determine whether the child’s condition would have the potential to affect decisions for school enrollment. It is important to note that we were unaware of the fact that these children were not assessed by medical doctors for the current research and the magnitude of the problem might
be different from what parents reported. Despite this limitation, this qualification gives an idea about the effects of the problems children were experiencing. As can be found in Table 39, most of the problems listed by the parents had the potential to be easily controlled and not be problematic for the lives of these children with care and support services provided for them.
3.6.1. Health status of children based on the provinces they live inThe presence of childhood problems present at birth was examined based on the province in which children lived. Both in the late enrollment (38,1%) and unenrolled (33,3%) groups, a greater percentage
* People who did not answer this question were not included in the table.** More than one answer was given.

85
Table 40. Effects of the child’s health problem lasting since birth on child’s life* (This question was asked to those indicated the child had a some health problems
that lasted throughout childhood.)
Frequency %** Frequency %**
Long-term; Does not effect school or daily life but prevents participating in social activities that require effort
43 51,8 5 23,8
Long-term; Does not affect life quality but requires regular medical checks 19 22,9 - -
Long-term; Requires receiving assistance for hygiene and living needs 11 13,3 7 33,3
Conditions that affect one through 3 months 3 3,6 7 33,3
Long-term; Conditions that require receiving assistance to get education and daily activities 2 2,4 1 4,8
Condition that affect between one week and one month 3 3,6 - -
Conditions, temporary, yet affecting more than 3 months 1 1,2 1 4,8
Conditions that would have no influence 1 1,2 - -Total 83 100 21 100
No enrollment Base: 20 People
Late enrollmentBase: 77 People
of parents in Bitlis reported having children with problems at birth. None of the parents in Hakkâri who were in the late enrollment group, and none of the parents in Hakkâri and Ağrı in the unenrolled group reported children having any problems at birth. Statistical examination of these differences among provinces revealed significant differences both for the late enrollment, (X2 (9)=41.32, p<0.001) and unenrolled (X2(9)=38.45, p<0.001) groups.
The majority of the parents reported that their children did not have any illness or disability that would prevent them from attending school. Parents reported that in the no enrollment group, 21,3% of the children and in the late enrollment group, 10,8%, of the children had a problem that prevented school enrollment. Based on these findings, in the
provinces that were included in the study, 12±2.7 % of the population was predicted to have an illness or a disability that would prevent them from attending school. Again, those parents who indicated that their children actually did have an illness or a disability that prevented them from enrolling in school, were asked to specify the problems their children were experiencing. Similar to the parental reports of birth problems, 9,6% of these problems were developmental. This problem was followed by other health issues and physical disability (See Appendix Table 23).
The responses of the parents who indicated that their children did have a problem that prevented their children from attending school were grouped
* People who did not answer this question were not included in the table.** More than one answer was given.
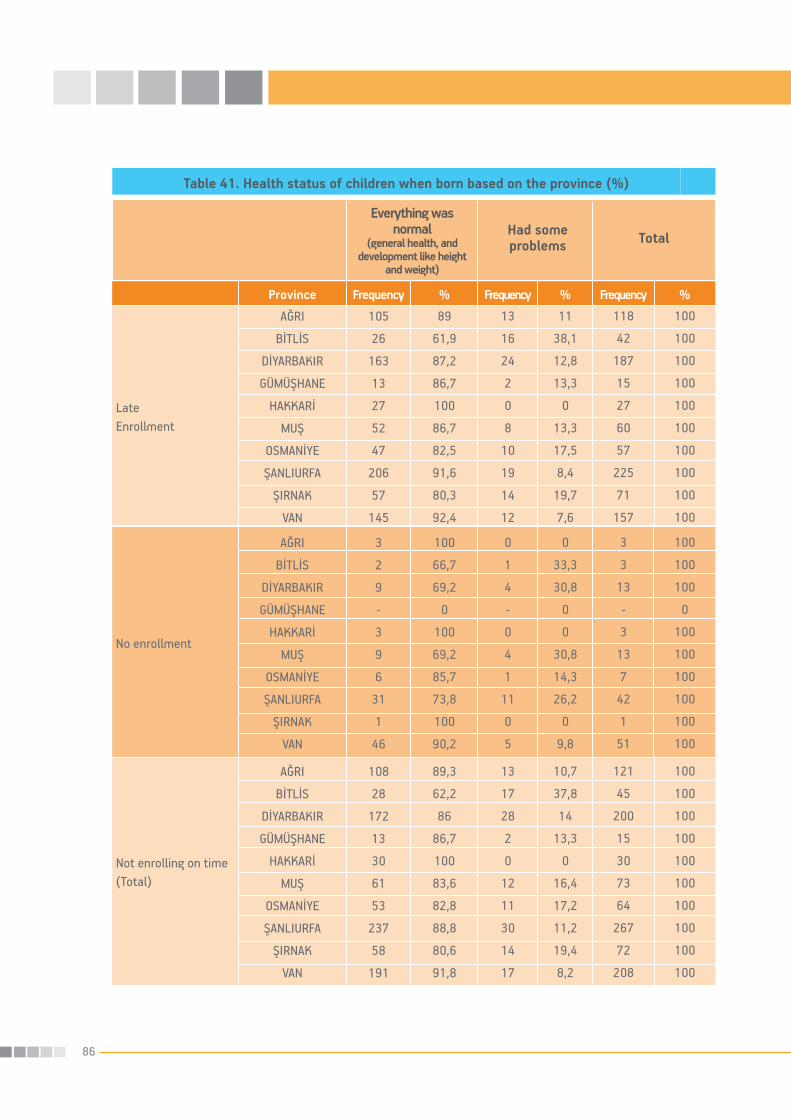
86
Table 41. Health status of children when born based on the province (%)
Had some problems Total
Province Frequency % Frequency % Frequency %
Late Enrollment
AĞRI
BİTLİS
DİYARBAKIR
GÜMÜŞHANE
HAKKARİ
MUŞ
OSMANİYE
ŞANLIURFA
ŞIRNAK
VAN
105
26
163
13
27
52
47
206
57
145
89
61,9
87,2
86,7
100
86,7
82,5
91,6
80,3
92,4
13
16
24
2
0
8
10
19
14
12
11
38,1
12,8
13,3
0
13,3
17,5
8,4
19,7
7,6
118
42
187
15
27
60
57
225
71
157
100
100
100
100
100
100
100
100
100
100
No enrollment
AĞRI
BİTLİS
DİYARBAKIR
GÜMÜŞHANE
HAKKARİ
MUŞ
OSMANİYE
ŞANLIURFA
ŞIRNAK
VAN
3
2
9
-
3
9
6
31
1
46
100
66,7
69,2
0
100
69,2
85,7
73,8
100
90,2
0
1
4
-
0
4
1
11
0
5
0
33,3
30,8
0
0
30,8
14,3
26,2
0
9,8
3
3
13
-
3
13
7
42
1
51
100
100
100
0
100
100
100
100
100
100
Not enrolling on time (Total)
AĞRI
BİTLİS
DİYARBAKIR
GÜMÜŞHANE
HAKKARİ
MUŞ
OSMANİYE
ŞANLIURFA
ŞIRNAK
VAN
108
28
172
13
30
61
53
237
58
191
89,3
62,2
86
86,7
100
83,6
82,8
88,8
80,6
91,8
13
17
28
2
0
12
11
30
14
17
10,7
37,8
14
13,3
0
16,4
17,2
11,2
19,4
8,2
121
45
200
15
30
73
64
267
72
208
100
100
100
100
100
100
100
100
100
100
Everything was normal
(general health, and development like height
and weight)

87
Table 42. Effects of the child’s illness/special need on his/her life*(This question was asked to those indicated the child had an illness/special need
that prevented him/her from going to school.)
Frequency %** Frequency %**
Long-term; Does not effect school or daily life but prevents participating in social activities that require effort
31 31,6 8 28,6
Long-term; Does not affect life quality but requires regular medical checks
33 33,7 2 7,1
Long-term; Requires receiving assistance for hygiene and living needs
9 9.2 9 32,1
Conditions that affect one through 3 months 11 11,2
Long-term; Conditions that require receiving assistance to get education and daily activities
5 5,1 5 17,9
Conditions that affect between one week and one month
5 5,1 2 7,1
Conditions, temporary, yet affecting more than 3 months
2 2 2 7,1
Conditions that would have no influence 2 2Total 98 100 28 100
No enrollment Base: 26 People
Late enrollment Base: 96 People
thematically based on whether these problems would have the potential to affect children’s life quality. Findings revealed that most of these problems would not necessarily prevent these children from attending school; rather, these children would require additional care, but would still be able to attend school.
In order to better understand the illnesses or disabilities of these children, parents were asked for
how long these children were facing these problems. In the late enrollment group 55% (n=91) of the children and in the unenrolled group 67,8% (n=28) of the children had these problems since infancy and toddlerhood. More specifically, in the late enrollment group, children experienced problems for an average of 59 months, and in the unenrolled group, children experienced these problems for 69 months.
* People who did not answer this question were not included in the table.** More than one answer was given.

88
Table 43. Length of illness/disability*
Frequency % Frequency % Frequency %
Less than a year 10 11,0 1 3,6 11 9,2
More than a year and 2 years 9 9,9 2 7,1 11 9,2
More than 2 years and 3 years 15 16,5 3 10,7 18 15,1
More than 3 years and 4 years 3 3,3 1 3,6 4 3,4
More than 4 years and 5 years 4 4,4 2 7,1 6 5,0
More than 5 years and 6 years 8 8,8 2 7,1 10 8,4
More than 6 years and 7 years 20 22,0 11 39,3 31 26,1
7 years and above 22 24,2 6 21,4 28 23,5
Total 91 100 28 100 119 100
* People who did not answer this question were not included in the table.
3.6.2. Not enrolling in school on time and child’s development Quantitative research findings indicated that there was a significant relationship between the parental concerns about children’s development and not enrolling children in school on time. A considerable number of parents, especially in the late school entry group, had not sent their children to school at the age of 6 because they thought their children were too young to go to school and they would be overwhelmed. They wanted to keep their children from school for a year in order for their children to grow and mature. In addition to this, especially in the group with unenrolled children, illnesses, developmental problems and disability were factors influencing late school enrollment.
Similar to the quantitative research findings, focus group meetings also revealed that some families send their children school late so that their children
can grow and mature more. According to the results of focus group discussions, some families make this decision in order for their children to mature enough to protect themselves from assaults. Parents reported that the assaults could be either physical or sexual, but regardless, if the children matured they would be better able to defend and protect themselves. One parent from Diyarbakır argued that it was very important for the child to be able to engage in self defense and it was why he had his child enroll in school late. His words below clearly show that he was determined to do this for his other children in the future.
”I had my child enroll in the first grade of primary school at the age of 8. I wanted my child to be the dominant, bigger and the stronger of the classroom so that nobody would take advantage of the child, the child can defend herself. I have another daughter, I want to have her enroll in school at the age of 8 as well.”
No enrollmentLate enrollmentNot enrolling on
time (Total)

89
* People who did not answer this question were not included in the table.
In focus group meetings, discussants emphasized that families had a habit of distinguishing children based on whether they think the children were smart or not. Discussants argued that such a distinction made among children resulted in distinguishing children who can succeed in school, and should go to school, and who cannot succeed, and thus should not go to school. According to the participants of focus group meetings, children who were thought unable to finish school and not able to succeed, were either enrolled in schools late or denied school enrollment altogether by their families. The problem of only sending to school those children who were perceived to be smart was argued to be a more noticeable problem among families who had too many children and those who had limited financial resources. Added to this by the discussants was another problem, that was parents being uneducated, not knowing birth control methods and having children more than they can actually support.
Another point that was concluded in focus group meetings was that some children were chronologically at the age to enroll in school but they were perceived to be not physically or cognitively mature enough to attend school, thus their enrollment in school was late. Discussants argued that the delays or retardations in their growths were a result of malnutrition or inadequate and imbalanced diet. Focus group participants discussed that children with
disabilities were also facing similar consequences and their enrollments in school were also late. Discussants seemed to agree that having disabilities was a significant challenge everywhere in Turkey and those disabilities were always a contributing factor to late school enrollment.
3.6.3. Families’ knowledge of children’s height and weightIt is already discussed that families’ perceptions of children’s physical development, particularly perceptions that children are small and weak for their ages, are contributing to children’s late school enrollment. In order to explore the issue in depth, and determine how the children were developing, families were asked to report on the heights and weights of their children after the families were asked about whether the children had any disabilities. Interestingly, 88,8% of the parents in the late enrollment group and 89,7% in the unenrolled group reported that they did not know their children’s height.
Figure 27. Knowledge of children’s height and weight* (%)

90
Growth charts are developed for children from many different ethnic and racial backgrounds. An eight-year old Turkish child who is 120 cm tall is within the 10th percentile for height, while a nine-year old would be within the 3rd percentile. This was similar both for boys and girls (Neyzi et al., 2006). Of those who answered the question 77,6% (n=107) of parents in the late enrollment (n=107) group and 57.1% (n=14) of the parents in the unenrolled (n=14) group reported their children’s heights were 120 cm or below. When parental reports of average height for these children were examined, it was found that in the late enrollment group, the average height reported was
110,33 cm (SD=14.90) and in the unenrolled group the average height was 116,93 cm (SD=24.47). Even though these numbers indicate that these children were shorter than the average height for their ages, their reported heights suggest that parents’ reports are most likely inaccurate. It was unclear whether the reported heights were too short because these children were too short or the parents made wrong inaccurate guesses (Even if the reported answers of these families were wrong, these findings are still important in terms of showing what type of knowledge these families have of the development of their children).
Parental reports of children’s heights were examined separately both for the late enrollment and unenrolled groups (See Table 44). Results show that in the late enrollment group there was not a lot of difference between male and female children in terms of parental reports of children’s heights (girls=109.4 cm; boys=111 cm). Even though in the group of unenrolled children there were very few parents who could state
what they think their children’s heights were, there seemed to be a great difference for the average heights of boys and girls (girls=130.6 cm; boys= 109.3 cm). Children’s heights as reported by their parents based on their birth years are shown in Appendix Table 24.
Figure 28. Height of children who did not enroll primary school on time (meter)(%)

91
Similarly, when the children’s weight was asked, both in late school entry group (80,8%) and in no enrollment group (88,2%), parents reported that they did not know their children’s weight. When the families were asked to report on their children’s weights, in the late enrollment group, 56% of the parents and in the unenrolled group, 43,8% of the parents reported that their children were 24kg and under (See Appendix Table 25). When these numbers were examined based
on the growth norms for Turkish children, children at or less than 24 kg would be in 25th percentile at age 8 and in the 10th percentile at age 9. Of those children whose parents could report a weight for them, 34,2% of them in the late enrollment group and 37,5% of them in the unenrolled group were at the 50th percentile of of growth for 8 year olds and, these same children would be at the 25th percentile of growth for 9 year olds (Neyzi et al., 2006). Similar to
Figure 29. Knowledge the target children’s weight
Table 44. Descriptive statistics for parental reports of children’s heights that did not enroll in school on time by child sex
N Average Minimum Maximum
Late Enrollment
FemaleMaleTotal
45
62
107
109,40
111,00
110,33
65
75
65
136
145
145
N Average Minimum Maximum
No enrollmentFemaleMaleTotal
5
9
14
130,60
109,33
116,93
100
70
70
175
125
175
N Average Minimum Maximum
Not enrolling on timeFemaleMaleTotal
50
71
121
111,52
110,79
111,09
65
70
65
175
145
175
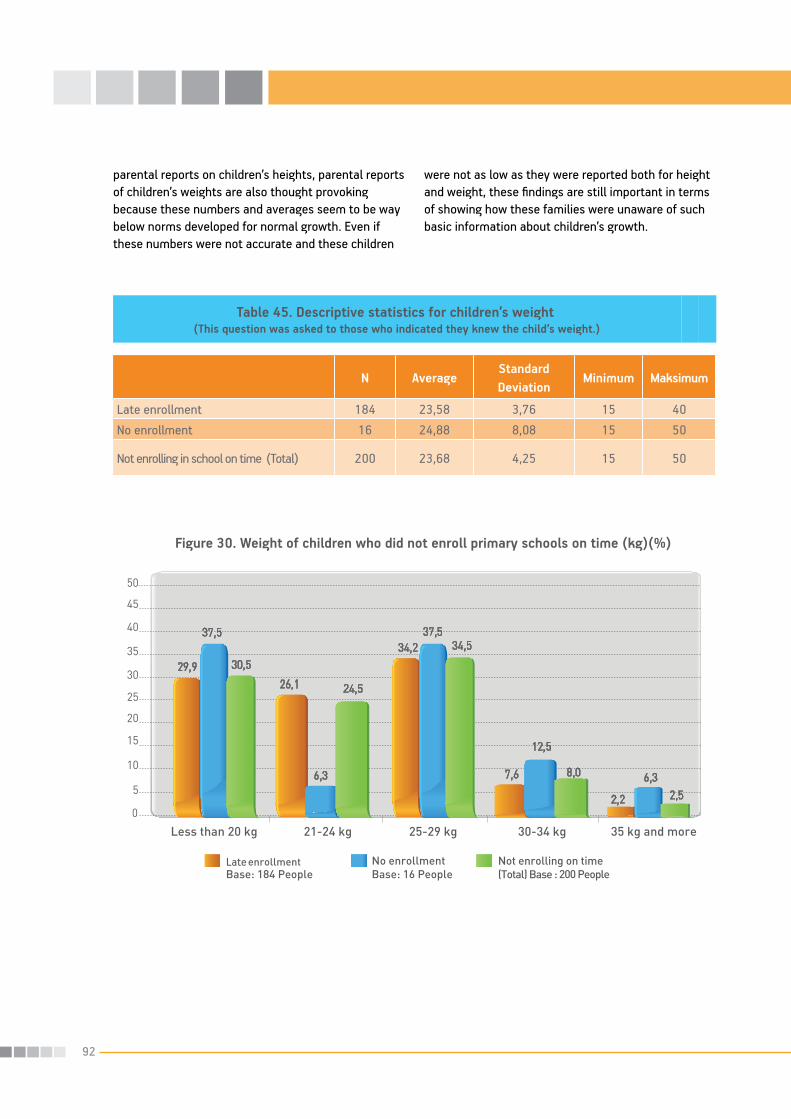
92
Table 45. Descriptive statistics for children’s weight (This question was asked to those who indicated they knew the child’s weight.)
N AverageStandard Deviation
Minimum Maksimum
Late enrollment 184 23,58 3,76 15 40No enrollment 16 24,88 8,08 15 50
Not enrolling in school on time (Total) 200 23,68 4,25 15 50
Figure 30. Weight of children who did not enroll primary schools on time (kg)(%)
parental reports on children’s heights, parental reports of children’s weights are also thought provoking because these numbers and averages seem to be way below norms developed for normal growth. Even if these numbers were not accurate and these children
were not as low as they were reported both for height and weight, these findings are still important in terms of showing how these families were unaware of such basic information about children’s growth.

93
3.7. Knowledge of the school enrollment time
3.7.1. Participants’ knowledge of the expected time for school enrollmentPreviously we discussed that parents had different ideas about how to calculate the current age of their child. In other words, a child who was born in the year 2001 could be perceived to be 7 or 8 or even 9 for some families in the year 2009. Just like how families’ perceptions of their child’s age is influential in the decision to enroll their child in school, knowledge
families have for school enrollment age can also be influential. According to the Ministry of National Education, a child can enroll in school at 72 months of age. When families were asked what the age for school enrollment was, 74,35% of the families in the late enrollment group and 85% in the unenrolled group reported that children had to complete 7 years (84 months) of age to start school. Both in the late enrollment group and also in the unenrolled group 20,1% and 10,5% of the families, respectively, indicated that the age for school enrollment was 6 years of age. It is important to note that 5% of the families thought the age of school enrollment was 8 years (96 months) of age.
Parents’ knowledge of school enrollment age for children was examined based on the province they lived in and the findings revealed that both in the late enrollment group, (63,4%) and in the unenrolled group (33,3%) indicating that age of 6 was the age for school enrollment was highest in Bitlis. Indicating
that age for school enrollment was 7 was highest in Hakkâri with 100% of the parents giving this answer.
Figure 31. Participants’ knowledge of legal age for school enrollment (%)

94
Table 46. Participants’ knowledge of legal age for school enrollment by province
Province % % % Frequency Total %
Late enrollment
AĞRI
BİTLİS
DİYARBAKIR
GÜMÜŞHANE
HAKKARİ
MUŞ
OSMANİYE
ŞANLIURFA
ŞIRNAK
VAN
10,3
63,4
24,5
40
-
25,4
25
18,4
2,8
19,1
88
36,6
75
60
100
71,2
73,2
80,2
39,4
79
1.7
-
0.5
-
-
3,4
1,8
1,4
57,7
1,9
117
41
184
15
27
59
56
217
71
157
100
100
100
100
100
100
100
100
100
100
% % % Frequency Total
Not enrolling on time (Total)
AĞRI
BİTLİS
DİYARBAKIR
GÜMÜŞHANE
HAKKARİ
MUŞ
OSMANİYE
ŞANLIURFA
ŞIRNAK
VAN
10
61,4
23,5
40
-
25
22,2
17,1
2,8
16,9
88,3
38,6
76
60
100
70,8
74,6
81
38,9
81,2
1.7
-
0.5
-
-
4,2
3,2
1,9
58,3
1,9
120
44
196
15
30
72
63
258
72
207
100
100
100
100
100
100
100
100
100
100
% % % Frequency Total
No enrollment
AĞRI
BİTLİS
DİYARBAKIR
GÜMÜŞHANE
HAKKARİ
MUŞ
OSMANİYE
ŞANLIURFA
ŞIRNAK
VAN
-
33,3
8,3
-
-
23,1
-
9,8
-
10
100
66,7
91,7
-
100
69,2
85,7
85,4
-
88
-
-
-
-
-
7,7
14,3
4,9
100
2
3
3
12
-
3
13
7
41
1
50
100
100
100
-
100
100
100
100
100
100
6 7 8 TotalAge

95
3.7.2. Relationship between selected characteristics of the participants and their knowledge of legal age for school enrollmentParticipant responses about school enrollment age were re-examined based on the sex of the parent. The relationship between maternal age and mothers’ reports of their knowledge of school enrollment for
school was also examined. Findings showed that the majority of mothers who thought the school enrollment age were 7 (82%) and those who thought school enrollment age was 6 (76%), were mothers with no education in the late education group. In the no enrollment group, 100% of the mothers who reported that school enrollment were 6, and 90,2% of the mothers who reported school enrollment age was 7 were mothers with no education.
Table 47. Mothers’ knowledge of legal age for school enrollment by level of education(When participants were mothers)
Frequency % Frequency % Frequency %
Late enrollment
Has no schoolingPrimary/First through eight grade graduateGraduate of high school or higher
143
39
7
189
75,7
20,6
3,7
100
562
123
6
691
81,3
17,8
0,9
100
52
-
-
52
100
-
-
100
Frequency % Frequency % Frequency %
No enrollment
Has no schooling Primary/First through eight grade graduate
Graduate of high school or higher
12 100 111 100 6 100
Frequency % Frequency % Frequency %
No enrollment
Has no schooling Primary/First through eight grade graduate
Graduate of high school or higher
8 3,9 7 0,9 - -
6 7 8Age
12
155
100
76,4
99
660
89,2
82,3
5
57
59
83,3
-
40
-
19,7
12
135
10,8
16,8
1
2
16,7
96,6
3,4
203 100 802 100 100

96
Fathers with different educational levels were compared in terms of their knowledge of school enrollment age. As seen in Table 48, in the late school entry group, most of the parents who indicated that age 6 (51,9%) was the age for school enrollment and those who indicated that age for school enrollment was 7 (52,1%) were fathers with primary school education in the no enrollment group, most of the
fathers who reported that they believed the age for school enrollment was 6 were graduates of at least high schools (50%), and those who reported 7 years of age as for the age for school enrollment were fathers (40,7%) who had no formal schooling degrees. Chi Square statistics indicated that these differences among fathers based on their educational levels were statistically significant, (χ2(4)=54.22, p<0.001).
Table 48. Fathers’ knowledge of legal age for school enrollment by level of education(When participants were fathers)
7 86Frequency % Frequency % Frequency %
Late enrollment
Has no schooling
Primary/First through eight grade graduate
Graduate of high school and higherTotal
65
95
23
183
35,5
51,9
12,6
100
297
356
30
683
43,5
52,1
4,4
100
42
6
1
49
85,7
12,2
2,0
100
Frequency % Frequency % Frequency %
No enrollment
Has no schoolingPrimary/First through eight grade graduateGraduate of high school and higher
5
7
2
14
35,7
50,0
14,3
100
62
44
2
108
57,4
40,7
1,9
100
2
3
1
6
33,3
50,0
16,7
100
Frequency % Frequency % Frequency %
Not enrolling on time (Total)
Has no schoolingPrimary/First through eight grade graduateGraduate of high school and higher
70
102
25
197
35,5
51,8
12,7
100
359
399
33
791
45,4
50,4
4,2
100
44
9
2
55
80,0
16,4
3,6
100
A g e
Total
Total

97
Table 49. Participants’ knowledge of legal age for school enrollment by having social security/insurance
Social Security SGK
Green Card/Free medical care at state hospitals provided by the state*
No social security/insurance
Frequency % Frequency % Frequency %
Late enrollment
6
7
8
Total
17
79
7
103
16,5
76,7
6,8
100
53
107
4
164
32,3
65,2
2,4
100
120
513
42
675
17,8
76,0
6,2
100
Frequency % Frequency % Frequency %
No enrollment
6
7
8
Total
2
13
1
16
12,5
81,3
6,3
100
2
7
1
10
20,0
70,0
10,0
100
10
93
4
107
9,3
86,9
3,7
100
Frequency % Frequency % Frequency %
Not enrolling on time (Total)
6
7
8
Total
19
92
8
119
16,0
77,3
6,7
100
55
114
5
174
31,6
65,5
2,9
100
130
606
46
782
16,6
77,5
5,9
100
Having social security, at least a “green card,” which provides free medical care at state hospitals for families with very low income, is very important for the children because it shows whether the children are registered with the state and also shows the socio-economical backgrounds of families. For this reason, the knowledge of accurate age for school enrollment the participants had been examined based on the type of social security/insurance they had. In the late enrollment group, 77% of those who reported not having any social security and in the unenrolled group over 81% of those who had no social security
reported that the legal age for school enrollment was 7. Of those who had social security (SGK), 65% of them in the late enrollment group and 70% in the unenrolled group also reported that the age to start school was 7. For those who had a green card*, the findings were not very different, revealing that in the late enrollment group 76% of the participants and in the unenrolled group, 87% of the participants reported that the age to start school for children was 7. Despite what social security the families had, the majority of the participants still believed that the age to start school was 7.
*Green card. Free medical care provided by the state to those in need.

98
In the late enrollment group however, the responses of participants based on the type of social security they had were significantly different, (X2(4)=20.39, p<0.001). Parental answers about at what age children should start school were examined based on whether they lived in rural or urban areas. The results indicated that in the late enrollment group, 76,9% of the respondents who lived in urban living areas and 72,4% of those who lived in rural areas, and in the unenrolled group 77,8% of those who lived in the rural areas and 93,4% of those who lived in urban areas indicated that the age to start school was 7 years. Both for the late enrollment group, (X2(2)=7.13, p<.05), and for the unenrolled group, (X2(2)=8.92, p<.05), urban-rural differences were statistically significant as revealed by chi-square analysis. Knowledge of correct school enrollment age was higher in both groups among those who lived in urban living areas. Moreover, correct school enrollment age was reported more by participants in the late enrollment group than in the group of unenrolled children.
In another disaggregated graph (See Figure 32),
having knowledge of Article 15 included in the Primary Schools Regulations of Ministry of National Education, and the reports of people’s knowledge of the school enrollment age were compared for the late enrollment group. The majority of parents (74%) who had knowledge of Article 15 reported that the school enrollment age for a child was age 6. Only 3,6% of the people who reported not being aware of Article 15 stated they believed the school enrolment age was 6. Interestingly, of those who claimed to have knowledge of Article 15, 25,8% stated that the school enrollment age was 7. Not surprisingly, the majority of the people, 89,1%, who reported having knowledge of Article 15 reported that they believed the school enrollment age were 7. This difference was statistically significant, (X2(2)=518.121, p<0.001). As a result, it can be argued that having knowledge of the related rules and regulations of MONE is one of the important predictors of having accurate information and knowledge about the school enrollment age. It is important to note that relatively few parents had knowledge of Article 15 (n=221) compared to those who did not know (n=718).
Figure 32. Knowledge of MONE, Department of Primary Education Bylaws Article 15 and Participants’ knowledge of legal age for school enrollment in late enrollment
group (%)

99
3.7.3. Not enrolling in school on time and enrollment age for schoolFindings indicated that families experience a significant degree of confusion concerning time for school enrollment. The majority of families included in the sample stated that the age for school enrollment was 7 not 6. Even though the difference was small, mothers and fathers with low educational levels and people living in rural areas had a higher probability of using the wrong age. In addition to this, having knowledge of MONE regulations was a factor that positively influenced having an accurate knowledge of the age for school enrollment.
Examination of the findings from semi-structured interviews revealed that when participants were asked whether the people living where they live and work knew the accurate age for school enrollment, 72,3% indicated that they believed the parents knew this information. In other words, most participants in the interviews assumed that parents knew the legal age for school enrollment. Participants also reported that the parents in rural living areas had little knowledge about the age for school enrollment. Participants who reported that parents did not know the age for school enrollment reported that parents had a lot of confusion about calculating a child’s age, and they also incorrectly thought the age for school enrollment was seven. It was also reported that rather than looking at their children’s chronological age, parents paid attention to their children’s level of physical development to decide to enroll their children in school. When the responses given were examined based on who the participants were, it was found that
those who believed parents knew the accurate age for school enrollment were mostly principals of schools, primary school teachers and inspectors. Those who believed that the parents did not know the accurate information were mainly local administrators. In addition, when this question was asked to parents who took part in the interviews, they also reported that they believed parents knew the accurate age for school enrollment. When the participants were asked how they knew whether parents knew the accurate age for school enrollment, 61% reported that they base their responses on their own observations. Those who reported that their observations and experiences lead them to think this way were mainly district directorates of national education, principals of schools, local media representatives, mukhtars and representatives from NGOs. While some reported that they had this view based on their guesses, others, mainly teachers, principals, inspectors and district directors of national education reported that they base their opinions on screening work. Moreover, one of the teachers reported that as educators they inform parents of this information and a religious employee reported that he put announcements in the mosque.
Of those who reported that the accurate age for school enrollment was not known by parents, 83,3% thought this was influencing children not enrolling in school on time. The majority of those with such beliefs were local administrators. Even though there were not that many, others were vice principals, teachers, inspectors, and local media and NGO representatives.

100
3.7.4. How the information about the age for school enrollment is obtainedParticipating parents were asked to report where they received the information about the expected age for school enrollment. Although their answers indicated more than one source for where they received the information, it is interesting to note that both in the late enrollment group (27,2%), and in the unenrolled group (32,4%) the source that was reported as a source for the information for the expected age for school enrollment was school. The other sources
reported were family elders, relatives, and neighbors,. Principals of schools, religious officials, spouses and other students were almost never used as resources for obtaining the expected age for school enrollment.
Table 50. Participants’ knowledge of legal age for school enrollment by living in urban or rural areas
Urban living areasRural living areas
Frequency % Frequency %
Late enrollment
6
7
8
Total
78
303
13
394
19,8
76,9
3,3
100
112
398
40
550
20,4
72,4
7,3
100
Frequency % Frequency %
No enrollment
6
7
8
Total
2
57
2
61
3,3
93,4
3,3
100
12
56
4
72
16,7
77,8
5,6
100
Frequency % Frequency %
Not enrolling in school on time(Total)
6
7
8
Total
80
360
15
455
17,6
79,1
3,3
100
124
454
44
622
19,9
73,0
7,1
100
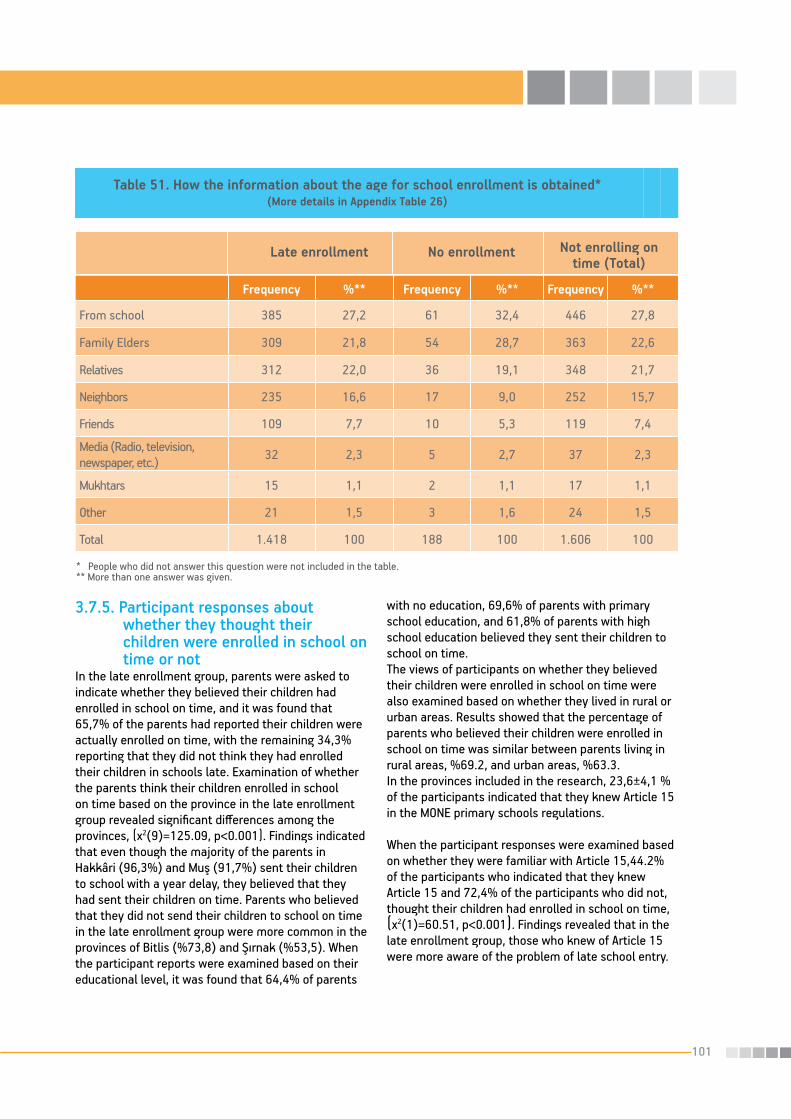
101
3.7.5. Participant responses about whether they thought their children were enrolled in school on time or notIn the late enrollment group, parents were asked to indicate whether they believed their children had enrolled in school on time, and it was found that 65,7% of the parents had reported their children were actually enrolled on time, with the remaining 34,3% reporting that they did not think they had enrolled their children in schools late. Examination of whether the parents think their children enrolled in school on time based on the province in the late enrollment group revealed significant differences among the provinces, (χ2(9)=125.09, p<0.001). Findings indicated that even though the majority of the parents in Hakkâri (96,3%) and Muş (91,7%) sent their children to school with a year delay, they believed that they had sent their children on time. Parents who believed that they did not send their children to school on time in the late enrollment group were more common in the provinces of Bitlis (%73,8) and Şırnak (%53,5). When the participant reports were examined based on their educational level, it was found that 64,4% of parents
with no education, 69,6% of parents with primary school education, and 61,8% of parents with high school education believed they sent their children to school on time. The views of participants on whether they believed their children were enrolled in school on time were also examined based on whether they lived in rural or urban areas. Results showed that the percentage of parents who believed their children were enrolled in school on time was similar between parents living in rural areas, %69.2, and urban areas, %63.3.In the provinces included in the research, 23,6±4,1 % of the participants indicated that they knew Article 15 in the MONE primary schools regulations.
When the participant responses were examined based on whether they were familiar with Article 15,44.2% of the participants who indicated that they knew Article 15 and 72,4% of the participants who did not, thought their children had enrolled in school on time, (χ2(1)=60.51, p<0.001). Findings revealed that in the late enrollment group, those who knew of Article 15 were more aware of the problem of late school entry.
Table 51. How the information about the age for school enrollment is obtained*(More details in Appendix Table 26)
Frequency %** Frequency %** Frequency %**
From school 385 27,2 61 32,4 446 27,8
Family Elders 309 21,8 54 28,7 363 22,6
Relatives 312 22,0 36 19,1 348 21,7
Neighbors 235 16,6 17 9,0 252 15,7
Friends 109 7,7 10 5,3 119 7,4
Media (Radio, television, newspaper, etc.) 32 2,3 5 2,7 37 2,3
Mukhtars 15 1,1 2 1,1 17 1,1
Other 21 1,5 3 1,6 24 1,5
Total 1.418 100 188 100 1.606 100
No enrollmentLate enrollment Not enrolling on time (Total)
* People who did not answer this question were not included in the table.** More than one answer was given.

102
Figure 33. Participant responses about whether they thought their children were enrolled in school on time or not (Late enrollment, Base: 954 people)
Table 52. Whether the participants thought the child was enrolled in school on time based on the province they lived in (Late enrollment)
Province Frequency % Frequency % Frequency %
Ağrı 60 51,3 57 48,7 117 100
Bitlis 11 26,2 31 73,8 42 100
Diyarbakır 99 53,2 87 46,8 186 100
Gümüşhane 6 40,0 9 60,0 15 100
Hakkâri 26 96,3 1 3,7 27 100
Muş 55 91,7 5 8,3 60 100
Osmaniye 46 80,7 11 19,3 57 100
Şanlıurfa 168 75,0 56 25,0 224 100
Şırnak 33 46,5 38 53,5 71 100
Van 123 79,4 32 20,6 155 100
No, I do not think soYes, I think so Total
Article 15 and 72,4% of the participants who did not,thought their children had enrolled in school on time,[x2(1)=60.51, p<0.001]. Findings revealed that in the late enrollment group, those who knew of Article15 were more aware of the problem of late school entry.

103
Table 53. Participants’ educational levels and their views on whether they believed their children had enrolled in school on time (Late enrollment)
Frequency % Frequency % Frequency %
Yes, I believe the enrollment was done on time
425 64,4 179 69,6 21 61,8
No, I don’t believe the enrollment was done on time
235 35,6 78 30,4 13 38,2
Total 660 100 257 100 34 100
Primary/First through eight grade graduateHas no schooling Graduate of high
school or higher
Table 54. Participant responses on whether they believe their children had enrolled in school on time based on whether they live in urban or rural areas (Late enrollment)
Urban living areasRural living areas
Frequency % Frequency %
Yes, I think so 274 69.2 353 63.3
No, I don’t think so 122 30.8 205 36.7
Total 396 100 558 100
Table 55. Knowledge of article 15 of MONE regulations for primary schools and whether they believed their children had enrolled in school on time (Late enrollment)
I don’t knowI know
Frequency % Frequency %Yes, I believe enrollment was done on time
99 44,2 525 72,4
No, I don’t believe the enrollment was done on time
125 55,8 200 27,6
Total 224 100 725 100

104
3.8. Reasons for not enrolling in school on time3.8.1. Reasons for late enrollmentThe majority of the participants (n=843) who did not have their children enroll in school the previous year, but had them enrolled in school in 2008-2009 educational year, indicated reasons other than health and disability. Even though responses given by this group varied considerably, the most frequently mentioned reasons for late enrollment were the physical readiness of children and financial difficulties. Thinking that children were too young to go to school the previous year, in when the child was legally eligible to enroll in school, was the most commonly indicated reason for late school entry. This answer constituted 37,8% of all the answers and, 31,8% of all the participants gave this answer. Parents listed, respectively, having financial difficulties the previous year (27,8%), school administration denying school enrollment by claiming these children were too young for school (16,3%), thinking that child will be oppressed due to being physically frail (9,7%), child not wanting to go to school (%5,7), school being too far away (%3,2) and school administration thinking the child was too frail and weak (%3,2) as reasons for not having their children enroll in school the previous year. Even though mothers and fathers listed generally more than one reason, the above reasons make up of 87,3% of all the reasons reported. It was found that of the remaining reasons, 6% were factors associated with family beliefs and 8% were related to factors associated with limited structural or physical opportunities. Parents with children who enrolled in schools late and were reported to have a disability or illness (n:104) were asked to report the reasons for not enrolling their children in school on time. When their answers were examined, having a child fall ill often the previous year, or having an illness that
was ongoing was reported by 42,3% of the parents as reasons for not enrolling their children in school the previous year. Reasons other than illness and related to other factors such as their mistaken beliefs about the appropriate age for school enrollment, physical and environmental factors and financial difficulties constituted answers of 60% of the parents who indicated that their children had an illness or a disability. The reasons for delaying school entry for children who had a disability or illness can be found in Table 57.
By looking at how many months old the children were at the time school started, the reasons for delaying school entry for these children were examined. Findings showed that during the 2008 – 2009 school year, only 84 children (24,5%) were not sent to school because they were younger than 72 months of age. Of those children, 228 of them (66,5%) were 72 months old or older. Even more interestingly, when school administration claimed that the children were too young to enter school and denied school enrollment for these children, only 41 of them (28,1%) were younger than 72 months, and 105 of these children (71,9%) were 72 months old or older. Even though concerns about the development of these children were influencing families’ decisions to allow for school enrollment, findings of this research clearly indicates that state determined legal age for school entry did not match up with what families perceived the school enrollment age should be for their children. As a result, it was found that perceptions of parents about child’s age being too young were more influential than the actual age of the child for parental decisions to enroll children in school.

105
Table 56. Reasons for late enrollment*(More information can be found in Appendix Table 27) (Late enrollment, Base: 843 people)**
This table includes the answers of those who indicated earlier that the child did not have any disability or illness that prevents the child form attending school.
Frequency % of Responses
% of Respondents***
We thought the child was too young to enroll in school last year 319 31,8 37,8
We had very limited financial opportunities to enroll the child in school last year
234 23,4 27,8
School administration said the child was too young and did not register the child
137 13,7 16,3
Because the child was too skinny, small for his age and frail, we felt the child would be the downtrodden one
82 8,2 9,7
Child did not want to attend school the previous year 48 4,8 5,7
Could not send the child to school because the school was too far away
27 2,7 3,2
School administration said the child was too small/frail and did not register the child
27 2,7 3,2
Teachers did not take the child because the classrooms were overcrowded
12 1,2 1,4
We had the child registered to school last year, but could not continue for various reasons
12 1,2 1,4
Last year, transportation opportunities to school were very limited 11 1,1 1,3
Last year the school administration said that the child was too small and weak and told us to enroll the child in kindergarten 11 1,1 1,3
We migrated to somewhere else as a family to work as seasonal workers
10 1 1,2
We could not enroll the child in school because the child did not have a state birth certificate (registration)
10 1 1,2
Other 62 6,2 7,0
Total 1002 100 118,9
* This question was asked as an open ended question with no answer choices provided.** People who did not answer this question were not included in the table *** More than one answer was given.
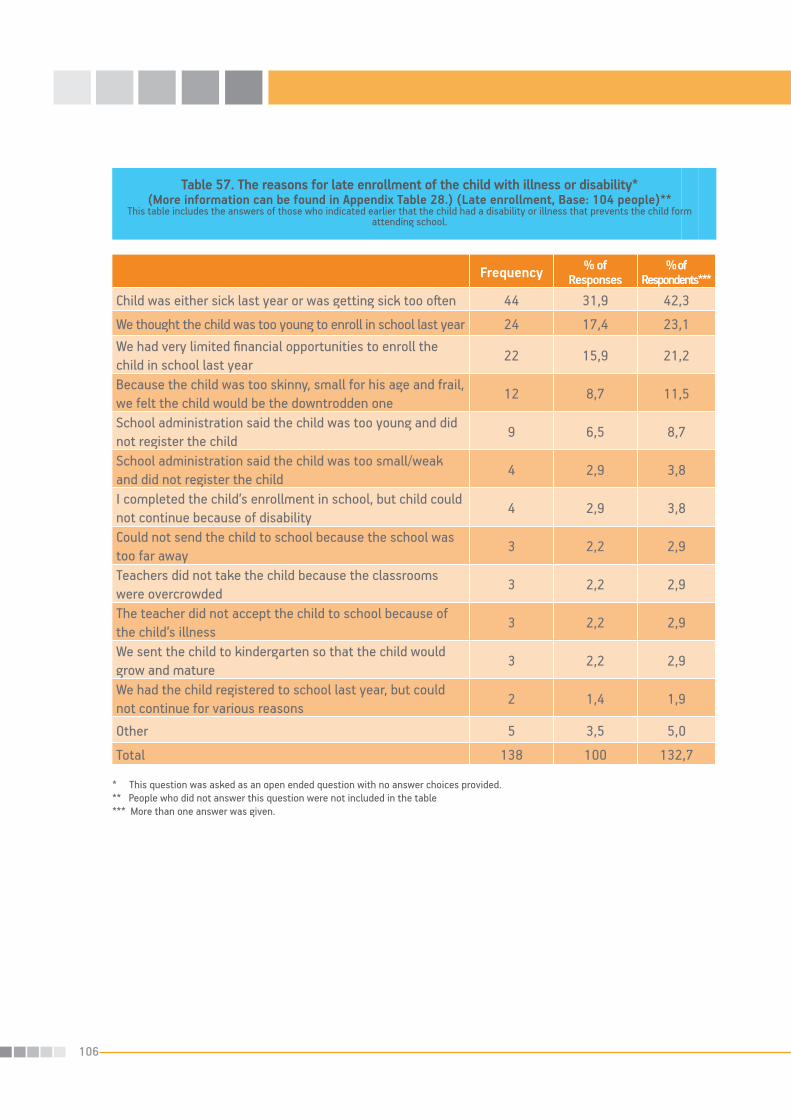
106
Table 57. The reasons for late enrollment of the child with illness or disability*(More information can be found in Appendix Table 28.) (Late enrollment, Base: 104 people)**
This table includes the answers of those who indicated earlier that the child had a disability or illness that prevents the child form attending school.
Frequency % of Responses
% of Respondents***
Child was either sick last year or was getting sick too often 44 31,9 42,3
We thought the child was too young to enroll in school last year 24 17,4 23,1We had very limited financial opportunities to enroll the child in school last year
22 15,9 21,2
Because the child was too skinny, small for his age and frail, we felt the child would be the downtrodden one
12 8,7 11,5
School administration said the child was too young and did not register the child
9 6,5 8,7
School administration said the child was too small/weak and did not register the child
4 2,9 3,8
I completed the child’s enrollment in school, but child could not continue because of disability
4 2,9 3,8
Could not send the child to school because the school was too far away
3 2,2 2,9
Teachers did not take the child because the classrooms were overcrowded
3 2,2 2,9
The teacher did not accept the child to school because of the child’s illness
3 2,2 2,9
We sent the child to kindergarten so that the child would grow and mature
3 2,2 2,9
We had the child registered to school last year, but could not continue for various reasons
2 1,4 1,9
Other 5 3,5 5,0
Total 138 100 132,7
* This question was asked as an open ended question with no answer choices provided.** People who did not answer this question were not included in the table *** More than one answer was given.

107
Table 58. The reasons for late enrollment of the child based on how old the child was at the time of school enrollment (%) (Late enrollment)
Younger than 72 months of age
72 months of age
Older than 72 months of
age*Base: 254
PeopleBase: 133
PeopleBase: 749
People
We thought the child was too young to enroll in school last year 33,1 23 30,4
We had very limited financial opportunities to enroll the child in school last year 21,3 23 22,8
School administration said the child was too young and did not register the child 16,1 14 11,5
Because the child was too skinny, small for his age and frail, we felt the child would be the downtrodden one 4,7 8,3 9,3
Child did not want to attend school the previous year 5,1 3 4,1
Child was either sick last year or was getting sick too often 3,5 4,5 3,9
School administration said the child was too small/weak and did not register the child 4,7 6 1,5
Could not send the child to school because the school was too far away 2,4 1,5 2,9
Teachers did not take the child because the classrooms were overcrowded 0,4 2,3 1,5
We had the child registered to school last year, but could not continue for various reasons 0,8 1,6
Last year, transportation opportunities to school were very lim-ited 1,2 1,5 0,8
Last year school administration did not register the child to school saying the child was too small and weak, and referred us to kindergarten
1,2 1,5 0,8
We migrated to somewhere else as a family to work as seasonal workers 0 2,3 0,9
We could not enroll the child in school because the child did not have a state birth certificate (registration)
0,4 1,2
Other 5,1 11 6,7
Total 100 100 100
* More than one answer was given.
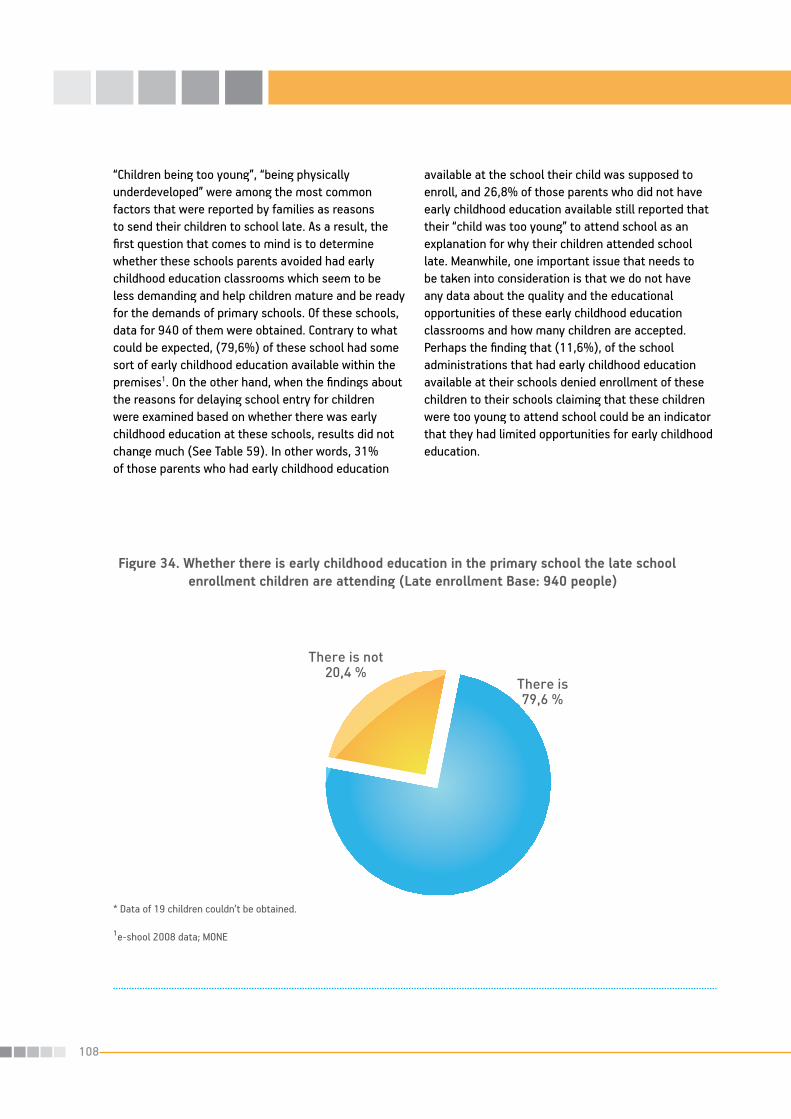
108
“Children being too young”, “being physically underdeveloped” were among the most common factors that were reported by families as reasons to send their children to school late. As a result, the first question that comes to mind is to determine whether these schools parents avoided had early childhood education classrooms which seem to be less demanding and help children mature and be ready for the demands of primary schools. Of these schools, data for 940 of them were obtained. Contrary to what could be expected, (79,6%) of these school had some sort of early childhood education available within the premises1. On the other hand, when the findings about the reasons for delaying school entry for children were examined based on whether there was early childhood education at these schools, results did not change much (See Table 59). In other words, 31% of those parents who had early childhood education
available at the school their child was supposed to enroll, and 26,8% of those parents who did not have early childhood education available still reported that their “child was too young” to attend school as an explanation for why their children attended school late. Meanwhile, one important issue that needs to be taken into consideration is that we do not have any data about the quality and the educational opportunities of these early childhood education classrooms and how many children are accepted. Perhaps the finding that (11,6%), of the school administrations that had early childhood education available at their schools denied enrollment of these children to their schools claiming that these children were too young to attend school could be an indicator that they had limited opportunities for early childhood education.
Figure 34. Whether there is early childhood education in the primary school the late school enrollment children are attending (Late enrollment Base: 940 people)
* Data of 19 children couldn’t be obtained.
1e-shool 2008 data; MONE

109
Table 59. The reasons for late school enrollment based on whether there is early childhood education in the primary school the late school enrollment children are attending (Late enrollment)
* More than one answer was given.
Frequency %* Frequency %*
We thought the child was too young to enroll in school last year
278 31 60 26,8
We had very limited financial opportunities to enroll the child in school last year
207 23,1 46 20,5
School administration said the child was too young and did not register the child
104 11,6 40 17,9
Because the child was too skinny, small for his age and frail, we felt the child would be the downtrodden one
83 9,2 9 4
Child did not want to attend school the previous year 35 3,9 12 5,4
Child was either sick last year or was getting sick too often
35 3,9 8 3,6
School administration said the child was too small/weak and did not register the child
21 2,3 10 4,5
Could not send the child to school because the school was too far away
25 2,8 5 2,2
Teachers did not take the child because the class-rooms were overcrowded
8 0,9 7 3,1
We had the child registered to school last year, but could not continue for various reasons
9 1 5 2,2
Last year, transportation opportunities to school were very limited
11 1,2 - -
Last year the school administration said that the child was too small and weak and told us to enroll the child in kindergarten
11 1,2 - -
We migrated to somewhere else as a family to work as seasonal workers
9 1 1 0,4
We could not enroll the child in school because the child did not have a state birth certificate (registration)
9 1 1 0,4
Other 53 5,9 20 8,9
Total 898 100 224 100
There is early
childhood educationThere is no early
childhood education

110
3.8.2. Factor analysis examining the reasons for late school enrollmentAs was seen with the other questions about late school enrollment, it was found that the answers provided by the participating parents varied. Therefore, it was important to identify the general themes of these varying answers. In order to be able
to accomplish this Factor Analysis was implemented. Especially because there was a sufficient number of participants in the study, theoretical justification was accomplished for implementation of factor analysis for the late enrollment group. Moreover, in order to determine whether the data set was suitable for factor analysis Bartlett and Kaiser – Meyer – Olkin (KMO) tests were conducted and their findings were examined.
The findings of the Barlett test were statistically significant, indicating that there were sufficient numbers of statistically significant correlations among the variables that were not examined due to large numbers of variables in the correlation matrix. Bartlett test is an important analysis to determine whether the dataset is suitable for factor analysis and the findings support implementation of this test. As seen in Table 60, KMO was 90,8%, and because 0,91>0,50 and other factors support this, it was concluded that the dataset was suitable for factor analysis.
Common variance for the variables (Communality) was examined and those variables that had lower variances were dropped from the analysis (those that were under .50). These variables included the following statements: “Child was either sick last year or was getting sick too often” and “Last year there was no school where we lived.” In addition, “In order for her brother to attend school first, we did not send
our daughter to school” was only asked to those with daughters, and was therefore excluded from the analysis. There were five factors identified that had Eigenvalues greater than the first factor explained 24,210% of the total variance, both first and second combined explained 36.276%, three factors combined explained 45,714%, and four factors combined explained 54,199% of the total variance. When all of them were combined, it was found that all five factors together explained 62,610% of the total variance.
When the variables that loaded on each of the factors were examined, it was found that each of these components were creating a theoretically meaningful factor and were different from the components of the other factors. As a result, as it can be found in Table 62, based on the items loaded in each of the factors, five different labels were created to identify each of these factors.
Table 60. Results of KMO and Bartlett Tests
Frequency %
Bartlett’s Test of Sphericity Chi Square 9912.735
Degrees of Freedom 253
Statistical significance (p). 0.000
Test for Adequacy of the number of participants (Kaiser-Meyer-Olkin) 0.908

111
Tabl
e 61
. Rot
ated
fact
or m
atrix
12
34
5
One
of th
e cl
ose
frien
ds o
f the
chi
ld p
asse
d aw
ay ri
ght a
roun
d th
e tim
e th
e sc
hool
s st
arte
d0.
846
Last
yea
r, th
e ch
ild h
ad to
take
car
e of
som
ebod
y si
ck in
the
hous
ehol
d 0.
821
Last
yea
r, a
fam
ily m
embe
r pas
sed
away
aro
und
the
time
scho
ol s
tart
ed0.
810
Last
yea
r, ar
ound
the
time
scho
ol s
tart
ed, a
fam
ily m
embe
r fel
l ill
0.75
8
We
had
just
mov
ed h
ere
last
yea
r, so
we
wer
e un
able
to re
gist
er th
e ch
ild to
sch
ool
0.70
9
We
did
not w
ant t
he te
ache
r tha
t was
ass
igne
d la
st y
ear
0.67
8
Last
yea
r the
chi
ld w
as n
ot to
ilet t
rain
ed0.
615
We
wan
ted
him
/her
to g
o to
sch
ool w
ith th
e on
e ye
ar y
oung
er s
iblin
g0.
593
We
mig
rate
d to
som
ewhe
re e
lse
as a
fam
ily to
wor
k as
sea
sona
l wor
kers
0.53
0
Child
was
uni
nter
este
d in
sch
ool l
ast y
ear
0.86
1
Child
did
not
wan
t to
atte
nd s
choo
l the
pre
viou
s ye
ar0.
818
Child
was
afra
id o
f goi
ng to
sch
ool l
ast y
ear
0.81
8
The
child
did
not
wan
t to
sepa
rate
from
the
mot
her l
ast y
ear
0.54
7La
st y
ear t
here
wer
e se
curit
y pr
oble
ms
in th
e ro
ad to
sch
ool
0.86
6La
st y
ear t
here
wer
e se
curit
y pr
oble
ms
at th
e sc
hool
0.81
7La
st y
ear,
tran
spor
tatio
n op
port
uniti
es to
sch
ool w
ere
very
lim
ited
0.61
5La
st y
ear t
he c
hild
was
sup
pose
d to
hel
p w
ith th
e w
ork
in th
e fie
ld /
gard
en
0.63
2W
e ha
d ve
ry li
mite
d fin
anci
al o
ppor
tuni
ties
to e
nrol
l the
chi
ld in
sch
ool l
ast y
ear
0.62
9La
st y
ear t
he ch
ild n
eede
d to
hel
p at
hom
e w
ith th
e ho
usew
ork
(was
hing
, cle
anin
g, lo
okin
g aft
er y
oung
er si
blin
gs, e
tc.)
0.57
3Th
e ch
ild h
ad to
wor
k an
d ea
rn m
oney
last
yea
r0.
550
We
thou
ght t
he c
hild
wou
ld d
evel
op b
ette
r and
be
mor
e su
cces
sful
in sc
hool
if w
e w
aite
d an
othe
r yea
r0.
813
We
thou
ght t
he c
hild
was
too
youn
g to
enr
oll i
n sc
hool
last
yea
r0.
774
Beca
use t
he ch
ild w
as to
o sk
inny
, sm
all f
or h
is ag
e and
frail
, we f
elt t
he ch
ild w
ould
be t
he d
ownt
rodd
en o
ne0.
604
Varia
nce
expl
aine
d24
.210
12.0
669.
438
8.48
58.
411
Com
pone
nts

112
As a result of the factor analysis, the number of the variables associated with late school enrollment was dropped to five. For each of these factors, a total point score was calculated and various statistical analysis were conducted to indentify the relationships between these factors and several other independent variables. In order to indentify group differences for variables with two response categories an independent t-test analysis was conducted. When there were more than two response categories, analysis of variance (ANOVA) was conducted. When the findings indicate significant group differences for variables with more than two levels, results of post hoc analysis were examined to identify the sources of these differences. These post hoc analysis were determined based on whether or not the variances were homogeneous.
Independent t test analysis were conducted to compare whether living in urban and rural areas made a difference in terms of what issues participants provided were the reasons for late school enrollment. Findings indicate group differences for Factor 1 (Social and environmental factors), Factor2 (Child’s interest and willingness to go to school), Factor 3 (The transportation of the child to school), Factor 4 (Financial difficulties of the family) and Factor 5 (Child’s growth and development). As a result when the mean scores of these factors were compared for participants living in urban and rural areas, it was found that social and environmental factors were more influential for participants living in urban areas, (M=10.97; SD=3.31) than participants living in rural areas, (M=10.55; SD=2.78), (t(946)=-2.077, p<0.05). Child’s interest and willingness to go to school was more influential in rural living areas (M=6.84;
SD=3.11), than urban living areas (M=6.13; SD=2.73), as a factor contributing to children not enrolling in school on time, (t(941)=3.73,p<0.001). Another factor that showed a difference between rural and urban living areas was the transportation of the child to school, (t(950)=2,93,p<0.005). Results indicated that a child’s transportation to school was more influential in urban living areas (M=8.56; SD=3.11), than rural living areas (M=7,73; SD=3,14).
In order to examine the factors that explained why children’s school enrollment was late in different provinces a series of ANOVAs was conducted for each of the five factors. Next, because there were more than two provinces, post hoc analysis were conducted to compare provinces. Provinces differed in terms of how “social and environmental factors” influenced the decisions to delay children’s enrollment in school, (F(9,938)=16.22;p<0.001). Table 64 summarizes the post hoc findings of how provinces differed.
Another analysis examined whether there was a difference between provinces in listing that “Child’s interest and willingness to go to school,” was a factor explaining child’s late school enrollment (F(9,933)=33,68,p<0.001).
The next ANOVA analysis was conducted to determine how “the transportation of the child to school” was indicated as a reason for late school enrollment for different provinces, and the results indicated significant differences among the provinces included in the study, (F(9,942)=46.952;p<0.001).
Table 62. Factor labels
Factor 1 Social and environmental factors
Factor 2 Child’s interest and willingness to go to school
Factor 3 The transportation of the child to school
Factor 4 Financial difficulties of the family
Factor 5 Child’s growth and development

113
Table 63. Descriptive statistics for Factor 1 based on provinces
Ağrı 9,52 0,17 9,17 9,86 9 21
Bitlis 16,15 0,41 15,32 16,98 9 24
Diyarbakır 9,20 0,06 9,08 9,33 9 15
Gümüşhane 11,40 1,06 9,12 13,68 9 18
Hakkâri 10,22 0,25 9,70 10,74 9 13
Muş 9,19 0,10 9,00 9,38 9 13
Osmaniye 9,81 0,28 9,25 10,36 9 18
Şanlıurfa 12,43 0,26 11,91 12,95 9 23
Şırnak 9,69 0,25 9,19 10,18 9 18
Van 11,46 0,23 11,00 11,92 9 24
General 10,80 0,10 10,60 11,00 9 24
Provinces
95% Confidence
IntervalStandard Deviation Minimum MaximumAverage
Table 64. Post Hoc results for Factor 1 based on provinces
Ağrı
Bitlis
Diyarbakır
Gümüşhane
Hakkâri
Muş
Osmaniye
Şanlıurfa
Şırnak
Van
Ağrı
Bitl
is
Diya
rbak
ır
Güm
üşha
ne
Hakk
âri
Muş
Osm
aniy
e
Şanl
ıurf
a
Şırn
ak
Van
: Statistically significant findings representing the provinces listed in rows have greater average scores than the ones in columns (p<0,05): Statistically significant findings representing the provinces listed in rows have smaller average scores than the ones in columns (p<0,05): Represents the average scores of the provinces are not significantly different (p<0,05)
Provinces

114
Table 65. Descriptive statistics for Factor 2 based on provinces
Ağrı 4,72 0,14 4,43 5,00 4 12
Bitlis 7,78 0,25 7,28 8,28 4 12
Diyarbakır 5,83 0,22 5,39 6,27 4 18
Gümüşhane 5,07 0,47 4,05 6,08 4 8
Hakkâri 7,27 0,57 6,10 8,44 4 12
Muş 4,48 0,26 3,95 5,01 4 16
Osmaniye 5,02 0,22 4,58 5,46 4 12
Şanlıurfa 7,74 0,17 7,39 8,08 4 17
Şırnak 4,62 0,19 4,24 5,01 4 14
Van 8,22 0,27 7,69 8,74 4 16
General 6,42 0,09 6,24 6,61 4 18
95% Confidence Interval
Standard Deviation Minimum MaximumAverage
Table 66. Post Hoc results for Factor 2 based on provinces
Ağrı
Bitlis Diyarbakır
Gümüşhane
Hakkâri
Muş
Osmaniye
Şanlıurfa
Şırnak
Van
Ağrı
Bitl
is
Diya
rbak
ır
Güm
üşha
ne
Hakk
âri
Muş
Osm
aniy
e
Şanl
ıurf
a
Şırn
ak
Van
: Statistically significant findings representing the provinces listed in rows have greater average scores than the ones in columns (p<0,05): Statistically significant findings representing the provinces listed in rows have smaller average scores than the ones in columns (p<0,05): Represents the average scores of the provinces are not significantly different (p<0,05)
Provinces
Provinces

115
Table 67. Descriptive statistics for Factor 3 for different provinces
Ağrı 3,42 0,13 3,16 3,68 3 10
Bitlis 7,52 0,47 6,57 8,47 3 15
Diyarbakır 3,53 0,11 3,32 3,75 3 10
Gümüşhane 4,07 0,41 3,19 4,94 3 7
Hakkâri 3,93 0,18 3,56 4,29 3 5
Muş 3,43 0,14 3,16 3,71 3 7
Osmaniye 5,63 0,41 4,80 6,46 3 15
Şanlıurfa 5,67 0,12 5,43 5,90 3 11
Şırnak 3,23 0,09 3,06 3,41 3 6
Van 4,39 0,13 4,14 4,64 3 12
General 4,45 0,07 4,32 4,58 3 15
95% Confidence Interval
Standard Deviation Minimum MaximumAverage
: Statistically significant findings representing the provinces listed in rows have greater average scores than the ones in columns (p<0,05): Statistically significant findings representing the provinces listed in rows have smaller average scores than the ones in columns (p<0,05): Represents the average scores of the provinces are not significantly different (p<0,05)
Table 68. Post Hoc results for Factor 3 for different provinces
Ağrı
Bitlis Diyarbakır
Gümüşhane
Hakkâri
Muş
Osmaniye
Şanlıurfa
Şırnak
Van
Ağrı
Bitl
is
Diya
rbak
ır
Güm
üşha
ne
Hakk
âri
Muş
Osm
aniy
e
Şanl
ıurf
a
Şırn
ak
VanProvinces
Provinces
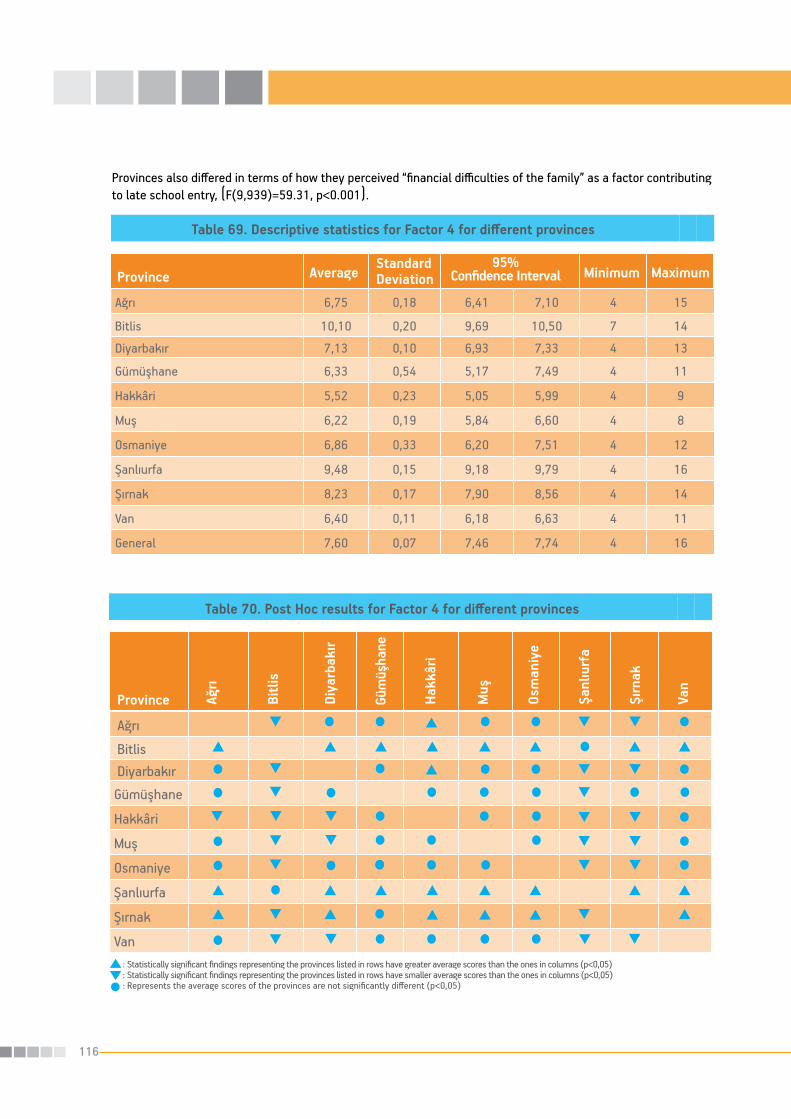
116
Provinces also differed in terms of how they perceived “financial difficulties of the family” as a factor contributing to late school entry, (F(9,939)=59.31, p<0.001).
Table 69. Descriptive statistics for Factor 4 for different provinces
Ağrı 6,75 0,18 6,41 7,10 4 15
Bitlis 10,10 0,20 9,69 10,50 7 14
Diyarbakır 7,13 0,10 6,93 7,33 4 13
Gümüşhane 6,33 0,54 5,17 7,49 4 11
Hakkâri 5,52 0,23 5,05 5,99 4 9
Muş 6,22 0,19 5,84 6,60 4 8
Osmaniye 6,86 0,33 6,20 7,51 4 12
Şanlıurfa 9,48 0,15 9,18 9,79 4 16
Şırnak 8,23 0,17 7,90 8,56 4 14
Van 6,40 0,11 6,18 6,63 4 11
General 7,60 0,07 7,46 7,74 4 16
95% Confidence Interval
Standard Deviation Minimum MaximumAverage
: Statistically significant findings representing the provinces listed in rows have greater average scores than the ones in columns (p<0,05): Statistically significant findings representing the provinces listed in rows have smaller average scores than the ones in columns (p<0,05): Represents the average scores of the provinces are not significantly different (p<0,05)
Table 70. Post Hoc results for Factor 4 for different provinces
Ağrı
Bitlis Diyarbakır
Gümüşhane
Hakkâri
Muş
Osmaniye
Şanlıurfa
Şırnak
Van
Ağrı
Bitl
is
Diya
rbak
ır
Güm
üşha
ne
Hakk
âri
Muş
Osm
aniy
e
Şanl
ıurf
a
Şırn
ak
Van
Province
Province

117
Table 72. Post Hoc results for Factor 5 based on provinces
Ağrı
Bitlis Diyarbakır
Gümüşhane
Hakkâri
Muş
Osmaniye
Şanlıurfa
Şırnak
Van
Ağrı
Bitl
is
Diya
rbak
ır
Güm
üşha
ne
Hakk
âri
Muş
Osm
aniy
e
Şanl
ıurf
a
Şırn
ak
Van
: Statistically significant findings representing the provinces listed in rows have greater average scores than the ones in columns (p<0,05): Statistically significant findings representing the provinces listed in rows have smaller average scores than the ones in columns (p<0,05): Represents the average scores of the provinces are not significantly different (p<0,05)
Table 71. Descriptive statistics for Factor 5 for different provinces
Ağrı 8,61 0,24 8,13 9,10 3 14
Bitlis 9,17 0,42 8,32 10,01 3 12Diyarbakır 6,56 0,22 6,13 6,98 3 15
Gümüşhane 8,87 0,82 7,10 10,63 3 13
Hakkâri 7,96 0,36 7,21 8,71 3 11
Muş 7,20 0,45 6,30 8,11 3 15
Osmaniye 11,04 0,32 10,39 11,68 4 15
Şanlıurfa 10,02 0,17 9,69 10,35 3 15
Şırnak 4,77 0,32 4,14 5,41 3 13
Van 7,90 0,20 7,51 8,30 3 14
General 8,22 0,10 8,02 8,42 3 15
95% Confidence Interval
Standard Deviation Minimum MaximumAverage
Lastly, provinces were also compared in terms of how much the participants in each of these provinces perceived “family concerns about child’s growth and development” as factors influencing late school. entry.
Province
Province

118
Findings indicated statistically significant differences among the provinces, F(9,936)=41.27, p<0.001.
Because fathers are more influential when decisions about children’s schooling are made, the reasons families gave for the late enrollment of their children to schools were examined based on paternal educational levels. No relationship between fathers’ educational level and social and environmental factors associated with late school enrollment was found, F(2,915)=0.327,p>0.05.
ANOVA results indicated that “child’s interest and willingness to go to school” as a factor influencing late school enrollment as a function of fathers’ educational level was significant, F(2,910)=3.24, p<0.05. Findings indicate that fathers with different levels of education rated factors about child’s interest and willingness to go to school as factors influencing late school entry. Fathers who are primary school graduates found these factors more influential and fathers who did not graduate from any formal school.
Table 73. Descriptive statistics for Factor 2 for fathers with different educational levels
Has no schooling 6,20 0,15 5,91 6,48 4 18
Primary/First through eight grade graduate
6,66 0,14 6,39 6,92 4 16
Graduate of high school or higher 6,00 0,33 5,34 6,66 4 14
General 6,42 0,10 6,23 6,60 4 18
95% Confidence Interval
Standard Deviation Minimum MaximumAverage
Findings showed that fathers’ educational levels made a difference for whether transportation to school was seen as a factor influencing late school entry, F(2,919)=3.581 p<0.05. The average scores of the participants with fathers of different educational levels were examined with post hoc analysis. Findings
indicated that when fathers had no education the participants indicated transportation issues to be more influential in delaying children’s school entry than participants with primary school education (including 1st through 8th).
Table 74. Descriptive Statistics for Factor 3 for fathers with different educational levels
Has no schooling 4,28 0,09 4,09 4,46 3 15
Primary/First through eight grade graduate
4,64 0,10 4,44 4,83 3 15
Graduate of high school or higher 4,28 0,30 3,68 4,87 3 15
General 4,46 0,07 4,33 4,59 3 15
95% Confidence Interval
Standard Deviation Minimum MaximumAverage
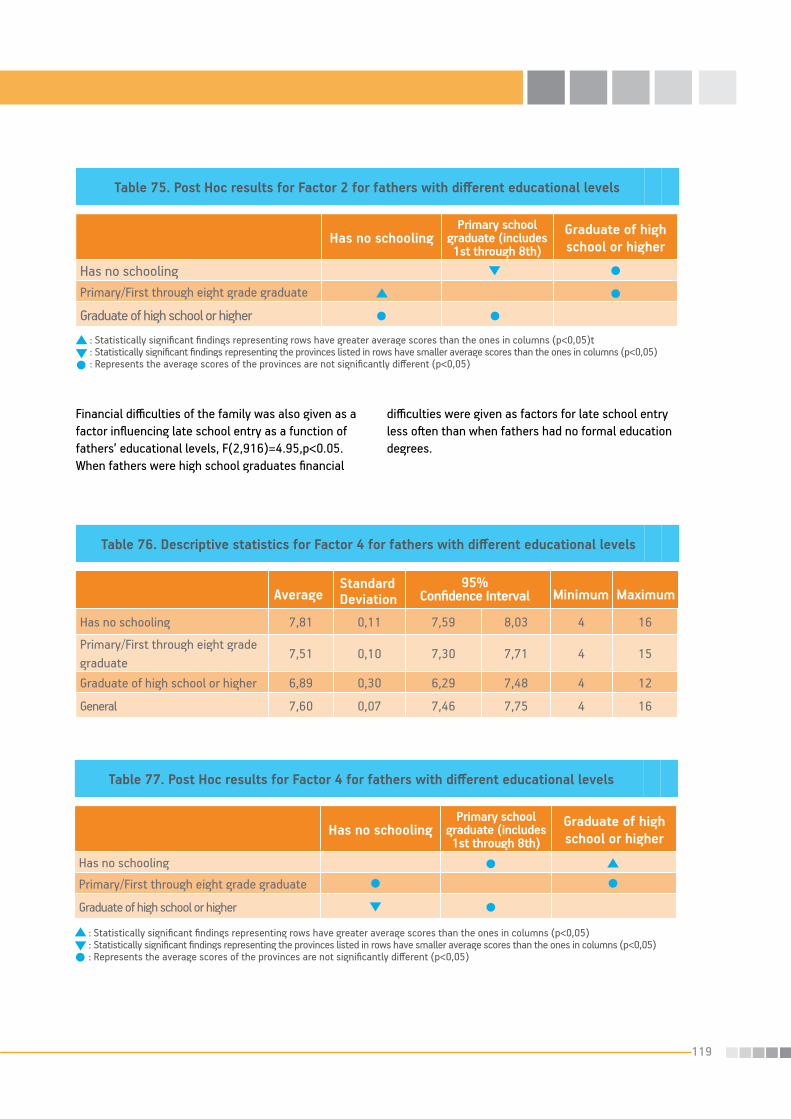
119
Table 77. Post Hoc results for Factor 4 for fathers with different educational levels
Has no schoolingPrimary school
graduate (includes 1st through 8th)
Graduate of high school or higher
Has no schooling
Primary/First through eight grade graduate
Graduate of high school or higher
: Statistically significant findings representing rows have greater average scores than the ones in columns (p<0,05): Statistically significant findings representing the provinces listed in rows have smaller average scores than the ones in columns (p<0,05): Represents the average scores of the provinces are not significantly different (p<0,05)
Table 76. Descriptive statistics for Factor 4 for fathers with different educational levels
Has no schooling 7,81 0,11 7,59 8,03 4 16
Primary/First through eight grade graduate
7,51 0,10 7,30 7,71 4 15
Graduate of high school or higher 6,89 0,30 6,29 7,48 4 12
General 7,60 0,07 7,46 7,75 4 16
95% Confidence Interval
Standard Deviation Minimum MaximumAverage
Financial difficulties of the family was also given as a factor influencing late school entry as a function of fathers’ educational levels, F(2,916)=4.95,p<0.05. When fathers were high school graduates financial
difficulties were given as factors for late school entry less often than when fathers had no formal education degrees.
Table 75. Post Hoc results for Factor 2 for fathers with different educational levels
Has no schoolingPrimary school
graduate (includes 1st through 8th)
Graduate of high school or higher
Has no schoolingPrimary/First through eight grade graduate
Graduate of high school or higher
: Statistically significant findings representing rows have greater average scores than the ones in columns (p<0,05)t: Statistically significant findings representing the provinces listed in rows have smaller average scores than the ones in columns (p<0,05): Represents the average scores of the provinces are not significantly different (p<0,05)

120
Table 78. Descriptive statistics for Factor 4 for fathers with different educational levels
Has no schooling 7,68 0,16 7,37 7,99 3 15
Primary/First through eight grade graduate
8,59 0,14 8,32 8,87 3 15
Graduate of high school or higher 9,11 0,45 8,22 10,01 3 14
General 8,22 0,10 8,02 8,42 3 15
95% Confidence Interval
Standard Deviation Minimum MaximumAverage
Table 79. Post Hoc results for Factor 5 for fathers with different educational levels
Has no schoolingPrimary school
graduate (includes 1st through 8th)
Graduate of high school or higher
Has no schooling
Primary/First through eight grade graduate
Graduate of high school or higher
: Statistically significant findings representing rows have greater average scores than the ones in columns (p<0,05): Statistically significant findings representing the provinces listed in rows have smaller average scores than the ones in columns (p<0,05): Represents the average scores of the provinces are not significantly different (p<0,05)
Lastly, paternal education as a factor influencing how much child’s growth and development is given as a factor influencing late school enrollment was examined and findings revealed a statistically significant differences for fathers with different
F(2,915)=11.82, p<0.001. Children with fathers who had primary and higher educational levels were more likely than fathers with no schooling to delay school entry due to their children’s growth and development.

121
3.8.3. Reasons for no school enrollment in the 2007 – 2008 academic year
The examination of factors contributing to no school enrollment in the 2007 and 2008 academic year of children who were also born in 2001 but were not enrolled to school two years in a row could not be completed using factor analysis because of not having enough units for each variable. Instead, responses were grouped thematically under meaningful groups and labeled accordingly to have fever variables to examine. A total score for each of the combined factors was obtained by adding the scores of each of the statements included. The scores ranged from 1 to 5. Similar to the examination of the factors in the late enrollment group, in the unenrolled group, the variables examined in relation to why children were not enrolled in school included: living in urban versus rural areas, province, and fathers’ educational level. The group differences for these variables were tested using appropriate statistics. However, due to insufficient number of participants for the variables examined to conduct analysis, statistical analysis for the provinces were not reported.
Families of unenrolled children who were reported to not have any illness or disability that would prevent them from attending school (n=106) were asked to report the reasons for not enrolling their children in school even though their children had passed the school enrollment age. Examination of the parental responses revealed that 46,2% of the parents had reported financial limitation as a reason, 19,8% reported that the school was too far, 10,4% reported that the child did not want to go to school and 8,5% reported that the child was too young to go to school. It was interesting that in this group, parents would report child not wanting to attend school as a factor for children’s unenrollment. Other reasons reported were that the child was underdeveloped (5,7%), they were seasonal migrant workers (4,7%) and they had missed the registration period for school enrollment (3,8%). All the aforementioned reasons constituted 86,1% of all the responses. The remaining 9% of the reasons were related to various beliefs, with 5% related to physical and environmental limitations and difficulties.
Table 80. The reasons for the children not enrolling in school*(More information can be found in Appendix Table 29) (No enrollment, Base: 106 people)
This Table includes the answers of those who indicated their children did not have any illness/special need that prevents the child from attending school.
Frequency % of Responses
% of Respondents**
Because our financial situation was not good 49 40,2 46,2
Because the school was too far 21 17,2 19,8
Because the child did not want to 11 9 10,4
Because the child was too young 9 7,4 8,5
Because the child did not develop properly 6 4,9 5,7
Because we were seasonal migrant workers 5 4,1 4,7
Because we missed the registration period 4 3,3 3,8School administration did not register the child saying that the child was too young 3 2,5 2,8
Because we could not pay the registration fee 2 1,6 1,9
Other 2 1,6 1,9Total 122 100 115,1
* People who did not answer this question were not included in the table.** More than one answer was given.

122
Parents of unenrolled children who reported their children had a disability or an illness that prevented their children from attending school (n:28) were asked to state the reasons for not enrolling their children in school. Of these parents, only 42,8% of them
reported that their children’s disability or illness was reason for not enrolling their children in schools. Of the responses, 29,4% were related to structural and environmental limitations.
When the findings of the quantitative analysis were examined, it was found that families had perceived their children to be small and weak and had not sent them to school for this reason. Interestingly, when the children’s ages were calculated based on their ages on their state identification cards, even children who were at or above 72 months of age at the time of school enrollment were not sent to school for this reason. Even though waiting for children to develop was also reported in the unenrolled group as a reason, main reasons reported by parents for not enrolling their children in school within this group were illness, disability, and limited financial opportunities as well as structural factors like difficulties experienced with having access to schools. In addition, factor analysis was conducted to explore the reasons for not enrolling children in schools, and five major categories including social an environmental factors, child’s interest and
willingness to go to school, access to school, financial difficulties and concerns for children’s development were identified.
3.8.4. Late enrollment in school and social, cultural, economic, environmental, and family-related factorsIn semi-structured interviews, when participants were asked whether any children who should have enrolled in school during the 2007-2008 academic year failed to do so, 41% of them said there were such children. As a result of their closer interest in the subject, those
who serve under the Ministry of National Education such as teachers, principals, inspectors, and parents reported that that they come across this situation
Table 81. Reasons for not enrolling in school for those who had a disability or an illness(No enrollment, Base: 28 people)
This table includes the answers of those who indicated their children had an illness/special need that prevented the child from attending school
Frequency % of Responses
% of Respondents**
We could not send the child because of the child’s illness 12 35,3 42,9
We could not send the child because of the child’s disability 12 35,3 42,9
Because our financial situation was not good 4 11,8 14,3
Because the child was too young 2 5,9 7,1We could not send the child because the child had some vision/eye problems 1 2,9 3,6
We could not send the child because the child had some behavior problems 1 2,9 3,6
Because the child did not want to 1 2,9 3,6We could not send the child because the school did not accept the child due to the child’s illness 1 2,9 3,6
Total 34 100 121,4
* People who did not answer this question were not included in the table.** More than one answer was given.

123
relatively frequently. It was observed that when asked if this problem was present in their environment, participants did not converge on the same judgment. It is thought that whether the participants perceive the situation as a problem or not may causally explain this divergence in their judgments. A striking example of this is that, as stated earlier, when the subject of enrollment in school is brought up, the prevalent thought is that the most fundamental problem in the region is the failure to ever enroll in school.
A remarkable point that emerged from both focus group meetings and semi-structured interviews are the research participants’ difficulty in concentrating on the basic topic of the research, timely enrollment. Nearly every participant stated that the region has many problems relating to education, and that as far as enrollment goes, the problem was not one about timely enrollment but of never enrolling. When participants were asked directly whether they were aware of late enrollments, 80% of the participants in the semi-structured interviews were aware. However, it is a cause for concern that nearly half of stakeholders who are closer to the people and who have great means of communication with the people, such as mukhtars (heads of local village governments) and local media representatives, have reported that they are not aware of a late enrollment problem. The participants who said they were aware of the problem offered a variety of causes of the problem. Often topics that have not been already brought up or analyzed were mentioned, and causes such as rural – urban living differences, economic problems, gender discrimination, and developmental problems in children were cited. The distribution of factors that influence the child’s timely enrollment according to the qualitative research was generally similar to the sets that emerged from the factor analysis data that were among the quantitative research analysis methods.
Factors that influence timely enrollment according to existing literature were brought up with the participants under specific titles, and the influence of these factors on timely enrollment was more systematically investigated. When, with that in mind, the effects of the cultural characteristics of the region on this problem were examined, 80% of the responses given by the participants emphasized that the cultural
characteristics of the region are influential. When cultural influences were examined, principal factors mentioned were awareness levels of the family, gender discrimination (relative disregard for girls), the inability of girls to go to school while wearing a headscarf, and the dominance of a feudal social structure. On the other hand, province and district administrative of the MONE and education-related representatives of various CSOs and local media have stated that, unlike in the past, religious faith has the effect of encouraging school attendance. It is observed that participants gave similar responses, and that a large portion of parents and mukhtars and one third of local leaders stated that the problem does not rest on cultural reasons alone. In other words, it was determined that parents and mukhtars, i.e. people who experience this problem with their own children or with people in their own town, and people who in some sense face parents in the context of this problem have different views on the degree to which cultural factors were effective in bringing about the problem. It was observed that MONE employees such as inspectors, school principals, and teachers gave explanations citing as causes families’ life style and faith, whereas parents expressed that the problem had causes other than their faith that it rather stemmed from economic factors.
When participants were asked which social factors influence not enrolling on time, causes such as mistrust in education, high number of children, waiting for a younger sibling to become school-age, and terror events were listed. Some participants also stated that there are those who, because of their religious beliefs, do not want to keep girls in school for eight years, and that social factors lead to never enrolling more than late enrollment.
Eighty percent of the participants stated that economic factors constitute an important problem in late enrollments. Families’ not giving priority to children’s education and not being concerned enough about education due to their economic hardship, or their being unable to give priority to education even though they had wanted to, and children employed in various jobs (herder, cultivation, housework for girls) in order to supply extra income for their families were given as the main reasons. Also, some participants emphasized that the financial supports

124
given by MONE and other various institutions are important but insufficient. The fact that both in terms of education and as regards financial development the provinces in the region are among Turkey’s least developed coincides with these responses. Among the participants, parents, mukhtars, local administrators, and members of local media economic factors were seen as the leading cause of late school enrollment.
When the participants were asked which environmental factors influence not enrolling on time, that the schools are distant, and that because of this commuter education is offered as an alternative, and security problems on the roads were specified as the main reasons. Although commuter education is viewed by MONE as a solution to a big problem, due to troubles in application it plays an important role in the problem of late enrollment. Delaying enrollment by at least one year to wait for children to develop more so they can better withstand the troubles that are brought about by traveling long distance, reluctance to place children, especially girls, in crowded school buses, or not wanting to send girls on their own to primary education boarding schools (PEBS), which is the alternative to commuting, and waiting for a younger sibling to become school-age, were important factors stated as direct results of commuter education. Almost all the participants have voiced similar thoughts. Furthermore, it was noted that even MONE authorities and employees, while on the one hand stating that commuter education and PEBS solved various problems, were on the other hand mentioning a series of problems caused by these two structures.
When participants were asked which institutional factors were influential in not enrolling on time it was stated that MONE authorities did not fulfill their duties to disseminate information accurately and sufficiently. Although there is a group of MONE employees who deny the existence of this problem, it was determined that those who admit its existence are greater in number. It was also indicated that preschool education opportunities were insufficient, even non-existent in rural areas, and that therefore timely enrollment could not be facilitated by way of preschool education. Among the responses was that not enrolling on time
can be detected with the e-school project and that through the middle of the first semester teachers visit and try to persuade families, but that these efforts are not enough.
When participants were asked about general educational problems, approximately one third indicated that problems such as lack of sufficient number of teachers or crowded classrooms were not effective factors. On the other hand, factors such as teachers’ being viewed as insufficient in quality or in number, or classrooms’ containing too many students were emphasized as reasons effective in guardians’ sending their children to school with one year delay. Because the participants were not well informed about this issue, they repeated the factors that they already discussed.
In semi-structured interviews, when participants were asked which attributes of children were effective in not enrolling in school on time, a large portion listed being handicapped or ill and/or being physically underdeveloped, that is, being smaller than their age-mates as the salient causes of not enrolling in school. Specifically, it was indicated that in circumstances where the children have disabilities they could not go to school at all and that they were not accepted to school but referred to rehabilitation centers. When participants were asked to report the most influential factors for not enrolling children in school in the expected year, the following responses were obtained: •Socialandculturalfactors 47,6%,•Economicalreasons 35,0%,•Institutionalcauses 8,8%,•Thechild’sowncharacteristics 5,0%,•Overallprobleminthefieldofeducation2,5%,•Environmentalreasons 1,3%.
As it can be seen, stakeholders determined social and cultural factors to be the most influential factors associated with children not enrolling in school in the expected year. Following this, were the economical reasons and these two together far outweighed the other factors listed as reasons for not enrolling in school on time. Social and cultural factors were mixed together in the participant answers and were
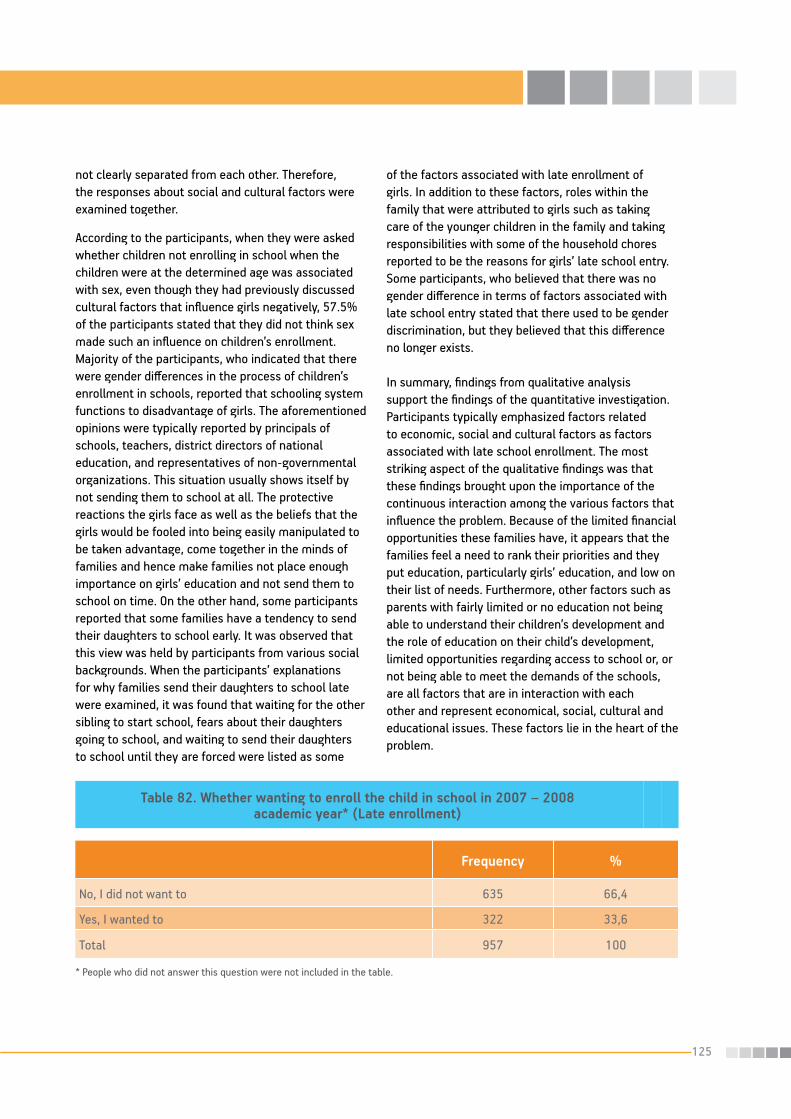
125
Table 82. Whether wanting to enroll the child in school in 2007 – 2008 academic year* (Late enrollment)
Frequency %
No, I did not want to 635 66,4
Yes, I wanted to 322 33,6
Total 957 100
* People who did not answer this question were not included in the table.
not clearly separated from each other. Therefore, the responses about social and cultural factors were examined together.
According to the participants, when they were asked whether children not enrolling in school when the children were at the determined age was associated with sex, even though they had previously discussed cultural factors that influence girls negatively, 57.5% of the participants stated that they did not think sex made such an influence on children’s enrollment. Majority of the participants, who indicated that there were gender differences in the process of children’s enrollment in schools, reported that schooling system functions to disadvantage of girls. The aforementioned opinions were typically reported by principals of schools, teachers, district directors of national education, and representatives of non-governmental organizations. This situation usually shows itself by not sending them to school at all. The protective reactions the girls face as well as the beliefs that the girls would be fooled into being easily manipulated to be taken advantage, come together in the minds of families and hence make families not place enough importance on girls’ education and not send them to school on time. On the other hand, some participants reported that some families have a tendency to send their daughters to school early. It was observed that this view was held by participants from various social backgrounds. When the participants’ explanations for why families send their daughters to school late were examined, it was found that waiting for the other sibling to start school, fears about their daughters going to school, and waiting to send their daughters to school until they are forced were listed as some
of the factors associated with late enrollment of girls. In addition to these factors, roles within the family that were attributed to girls such as taking care of the younger children in the family and taking responsibilities with some of the household chores reported to be the reasons for girls’ late school entry. Some participants, who believed that there was no gender difference in terms of factors associated with late school entry stated that there used to be gender discrimination, but they believed that this difference no longer exists.
In summary, findings from qualitative analysis support the findings of the quantitative investigation. Participants typically emphasized factors related to economic, social and cultural factors as factors associated with late school enrollment. The most striking aspect of the qualitative findings was that these findings brought upon the importance of the continuous interaction among the various factors that influence the problem. Because of the limited financial opportunities these families have, it appears that the families feel a need to rank their priorities and they put education, particularly girls’ education, and low on their list of needs. Furthermore, other factors such as parents with fairly limited or no education not being able to understand their children’s development and the role of education on their child’s development, limited opportunities regarding access to school or, or not being able to meet the demands of the schools, are all factors that are in interaction with each other and represent economical, social, cultural and educational issues. These factors lie in the heart of the problem.

126
Late Enrollment : Χ2 : 19,407 degrees of freedom: 1 p=0,000
Table 83. Parental desire to enroll their children in primary school in 2007 – 2008 academic year based on residing in urban or rural areas (Late enrollment)
Rural living areas
Frequency % Frequency %
No, I did not want it 233 58,4 402 72,0
Yes, I wanted it 166 41,6 156 28,0
Total 399 100 558 100
Urban living areas
3.9. Examination of the reasonsfor late enrollment for inassociation with various factorsAccording to the findings of the quantitative investigation, families enrolled their children in school not when these children were legally eligible, but with a year delay for various reasons. Interestingly, even though, limited opportunities, illness, child’s developmental immaturity were reported to be factors associated with not enrolling their children in school the previous year, the majority of participants, (66,4%), reported that they did not want to send their children to school the previous year. When these responses of the parents were examined based on the province they lived in, in the late enrollment group, it was found that in Şırnak, majority of the participants (80,3%) had not wanted to enroll their children in school. Şırnak was followed by province of Ağrı (70,3%) in terms of having most parents not wanting to enroll their children in school the previous year. Bitlis, at 68%, was the province with most parents reporting that they had wanted to enroll their children in school the previous year. The differences among the provinces were found to be
statistically significant, (χ2(9)=19.371, p<0.022) (See Appendix Table 30). When this was examined in detail based on paternal educational levels, no differences among provinces were found (See Appendix Table 31). When a comparison was made based on paternal occupations, it was found that 42,9% of the fathers who were seasonal workers in the area they lived in, and 35,6% of the unskilled workers had wanted to enroll their children in school. Of those that were business managers and administrators, 100% of them and 82,1% of the migrant seasonal workers had indicated that they had not wanted to enroll their children in school the previous years. This particular finding indicates that parents with different financial opportunities could have different motivations to enroll their children in school with delays. Still another interesting finding is that in the rural living areas, 41,6% of the parents had reported that they had wanted to enroll their children in school the previous year while in the urban areas this was only 28% of the parents. This difference between rural and urban living areas were found to be statistically significant as well and indicated that it was possible that in rural living areas there were more serious structural barriers to children’s timely enrollment in schools.
An interesting and a statistically significant finding emerged when the relationship between whether parents wanted to enroll their children in primary school the previous year and the monthly income of the families were examined, (χ2(6)=14.66, p<0.05) . Coming first in line with 30.3%, were the parents with a monthly income of 200 TL and less who indicated that they did not want to enroll their children in primary school the previous year. Parents with monthly incomes between 601 and 750 TL were among the parents who indicated least not wanting
to enroll their children in school the previous year with 8,8%. Among the parents who indicated that they had wanted to enroll their children in school the previous year first in line were parents with a monthly income of 200 TL and less (18,70%) and parents with a monthly income of 501 and 600 TL (18,70%). Those who made between 701 TL and 650 TL monthly, were least likely to report that they had wanted to enroll their children in schools with only 7% (See Appendix Table32).
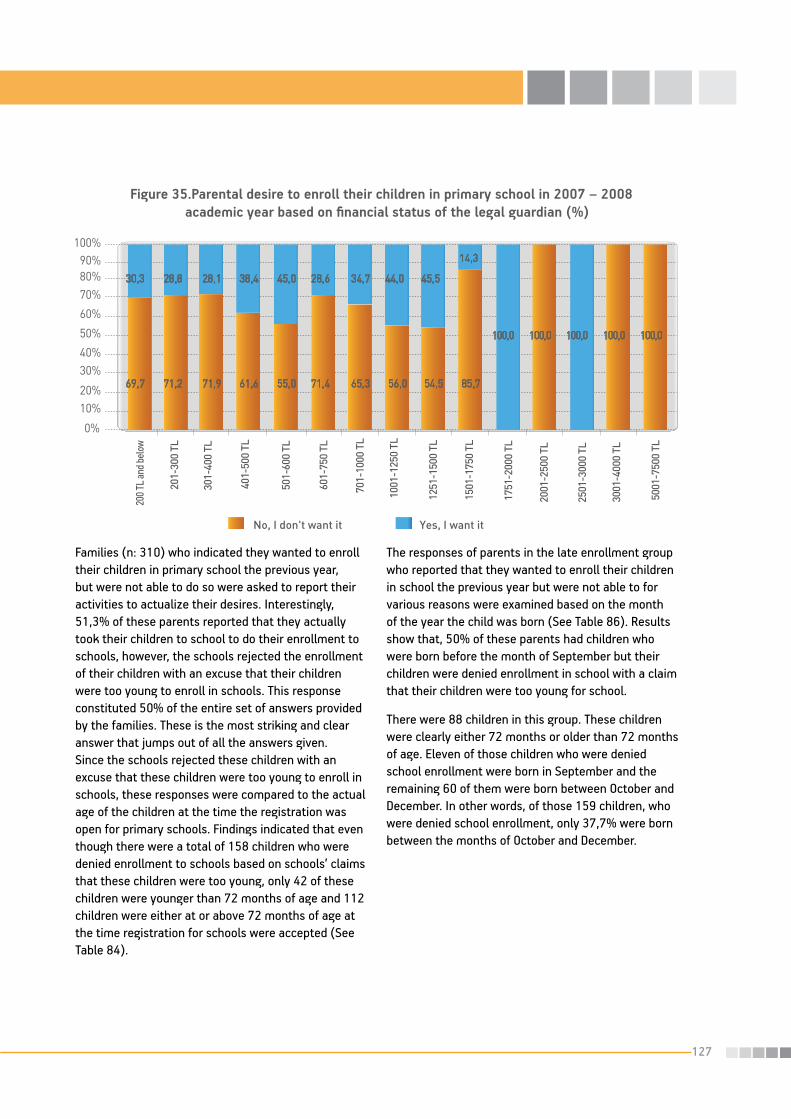
127
Families (n: 310) who indicated they wanted to enroll their children in primary school the previous year, but were not able to do so were asked to report their activities to actualize their desires. Interestingly, 51,3% of these parents reported that they actually took their children to school to do their enrollment to schools, however, the schools rejected the enrollment of their children with an excuse that their children were too young to enroll in schools. This response constituted 50% of the entire set of answers provided by the families. These is the most striking and clear answer that jumps out of all the answers given. Since the schools rejected these children with an excuse that these children were too young to enroll in schools, these responses were compared to the actual age of the children at the time the registration was open for primary schools. Findings indicated that even though there were a total of 158 children who were denied enrollment to schools based on schools’ claims that these children were too young, only 42 of these children were younger than 72 months of age and 112 children were either at or above 72 months of age at the time registration for schools were accepted (See Table 84).
The responses of parents in the late enrollment group who reported that they wanted to enroll their children in school the previous year but were not able to for various reasons were examined based on the month of the year the child was born (See Table 86). Results show that, 50% of these parents had children who were born before the month of September but their children were denied enrollment in school with a claim that their children were too young for school.
There were 88 children in this group. These children were clearly either 72 months or older than 72 months of age. Eleven of those children who were denied school enrollment were born in September and the remaining 60 of them were born between October and December. In other words, of those 159 children, who were denied school enrollment, only 37,7% were born between the months of October and December.
Figure 35.Parental desire to enroll their children in primary school in 2007 – 2008 academic year based on financial status of the legal guardian (%)

128
Table 84. Reasons for not enrolling their children in school despite attempts to enroll children in schools in 2007 – 2008 academic year.*
(This question was asked only to those who reported that they had wanted to enroll their children in school in 2007 – 2008 academic year)
(More information can be found in Appendix Table 33)(Late enrollment, Base: 310 people)
Frequency % of Responses
% of Respondents**
I took my child to school, but the school denied enrollment claiming that the child was too young. 159 50,0 51,3
I did not do anything because of economical problems 28 8,8 9,0They did not enroll the child because the child was frail/ the child was underdeveloped 28 8,8 9,0
We did the child’s enrollment, but the child did not want to go to school
18 5,7 5,8
They did not take the child to school because the classrooms were overcrowded 18 5,7 5,8
Because the child was too frail, they advised for the child’s enrollment in kindergarten so that the child would become more physically mature
11 3,5 3,5
They did not enroll the child in school because the child was unwell 9 2,8 2,9
I was late for the registration, they did not enroll the child in school 8 2,5 2,6
I did the child’s enrollment, but the child did not attend school for various reasons*** 6 1,9 1,9
We enrolled the child in school but the teacher sent the child back home two months after the school began 6 1,9 1,9
Other 27 8,4 8,6
Total 318 100 102,6
* More than one answer was given. ** People who did not answer this question were not included in the table.*** This situation was found to happen for some children: The children’s enrollments were completed, but the teachers had sent them back home for reasons like the child was not succeeding and the child was too young. Principle of the school had recalled these children, but no report cards were given to these children even though they were enrolled in schools at the end of the school year.

129
Table 85. The child’s age during 2007 – 2008 academic year and the reasons for not enrolling the children in school even though the parents had wanted to enroll their
children in primary schools* (%) (Late enrollment) (This question was asked only to those who reported that they had wanted to enroll their children in
school in 2007 – 2008 academic year.)
Younger than 72 months
of age Base: 80 People
72 months of age
Base: 45 People
Older than 72 months
of age Base: 192 People
I took my child to school, but the school denied enrollment claiming that the child was too young.
57,5 42,0 48,4
I did not do anything because of economical problems 6,25 6,7 10,4They did not enroll the child because the child was frail/ the child was underdeveloped
13,75 13,0 5,7
We did the child’s enrollment, but the child did not want to go to school 5 2,2 6,8
They did not take the child to school because the classrooms were overcrowded 1,25 6,7 7,3
Because the child was too frail, they advised for the child’s enrollment in kindergarten so that the child would become more physically mature
1,25 6,7 3,6
They did not enroll the child in school because the child was unwell
2,5 2,2 3,1
I was late for the registration, they did not enroll the child in school
2,5 4,4 2,1
I did the child’s enrollment, but the child did not attend school for various reasons 1,25 - 2,6
We enrolled the child in school but the teacher sent the child back home two months after the school began 1,25 2,2 2,1
Other 7,5 13 7,8
Total 100 100 100
* More than one answer was given.
The reasons for not enrolling their children in school of those parents who wanted to enroll their children in school in 2007-2008 academic year, but were not able to do so, were examined in terms of whether they lived in urban or rural areas. For both rural (52,5%) and urban (47,4%) parents, one the most common reason for not being able to enroll their children in school was that their children were denied enrollment in school with the claim that their children were too young for school. Following this, the next most common response for groups was financial difficulties experienced by the families (See Table 87).
Parents whose children are still unenrolled in schools (n:134), were asked to report whether they had made any attempts to enroll their children in school and the majority of them (85,1%) reported that they had not made any attempts. When the provinces were examined, it was found that no parent in Şırnak or Hakkari had made any attempts to enroll their children in school. Osmaniye (66,7%) and Bitlis (66,7%) had the most parents who had made attempts to enroll their children in school. The differences among the provinces were statistically significant, (χ2(8)=19.36, p<0.05) (See Appendix Table 34).
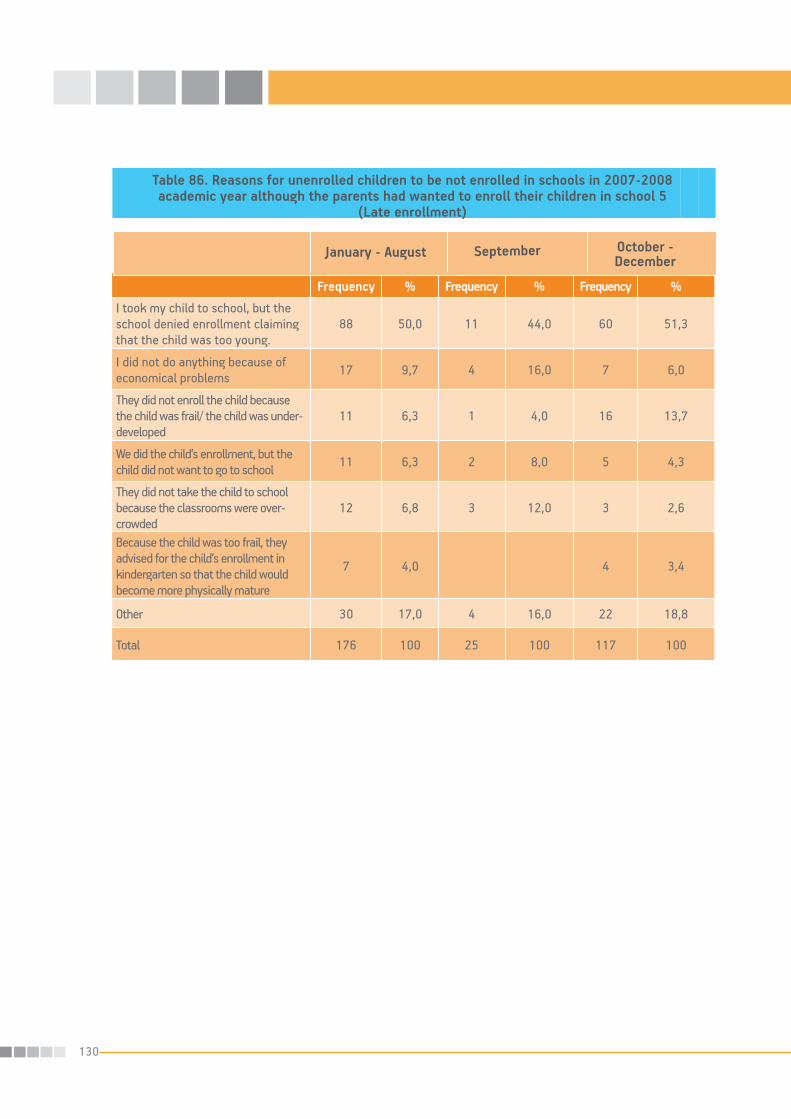
130
Table 86. Reasons for unenrolled children to be not enrolled in schools in 2007-2008 academic year although the parents had wanted to enroll their children in school 5
(Late enrollment)
Frequency % Frequency % Frequency %
I took my child to school, but the school denied enrollment claiming that the child was too young.
88 50,0 11 44,0 60 51,3
I did not do anything because of economical problems 17 9,7 4 16,0 7 6,0
They did not enroll the child because the child was frail/ the child was under-developed
11 6,3 1 4,0 16 13,7
We did the child’s enrollment, but the child did not want to go to school 11 6,3 2 8,0 5 4,3
They did not take the child to school because the classrooms were over-crowded
12 6,8 3 12,0 3 2,6
Because the child was too frail, they advised for the child’s enrollment in kindergarten so that the child would become more physically mature
7 4,0 4 3,4
Other 30 17,0 4 16,0 22 18,8
Total 176 100 25 100 117 100
SeptemberJanuary - August October - December

131
* More than one answer was given.
Table 87. Reasons for unenrolled children to be not enrolled in schools in 2007-2008 academic year although the parents had wanted to enroll their children
in school by living in rural or urban areas* (Late enrollment) (This question was asked to those who wanted to enroll their children in school in
2007-2008 academic year)
Urban living areasRural living areas
Frequency % Frequency %I took my child to school, but the school denied enrollment claiming that the child was too young.
85 52,5 74 47,4
I did not do anything because of economical problems
11 6,8 17 10,9
They did not enroll the child because the child was frail/ the child was underdeveloped
12 7,4 16 10,3
We did the child’s enrollment, but the child did not want to go to school
9 5,6 9 5,8
Teachers did not want to enroll the child in school because of overcrowded classrooms
14 8,6 4 2,6
I took the child to school but they said the child was too small and asked me to take the child to kindergarten
6 3,7 5 3,2
They did not enroll the child in school because the child was unwell
3 1,9 6 3,8
I was late for the registration, they did not enroll the child in school
3 1,9 5 3,2
I did the child’s enrollment, but the child did not attend school for various reasons
1 0,6 5 3,2
We enrolled the child in school but the teacher sent the child back home two months after the school began
4 2,5 2 1,3
Other 14 8,6 13 8,3
Total 162 100 156 100
Those parents who reported that they had made some attempts to enroll their children in school were asked to clarify what types of attempts they had made. Of
those parents, 19 of them responded to this question. Their answers are listed below in Table 88.
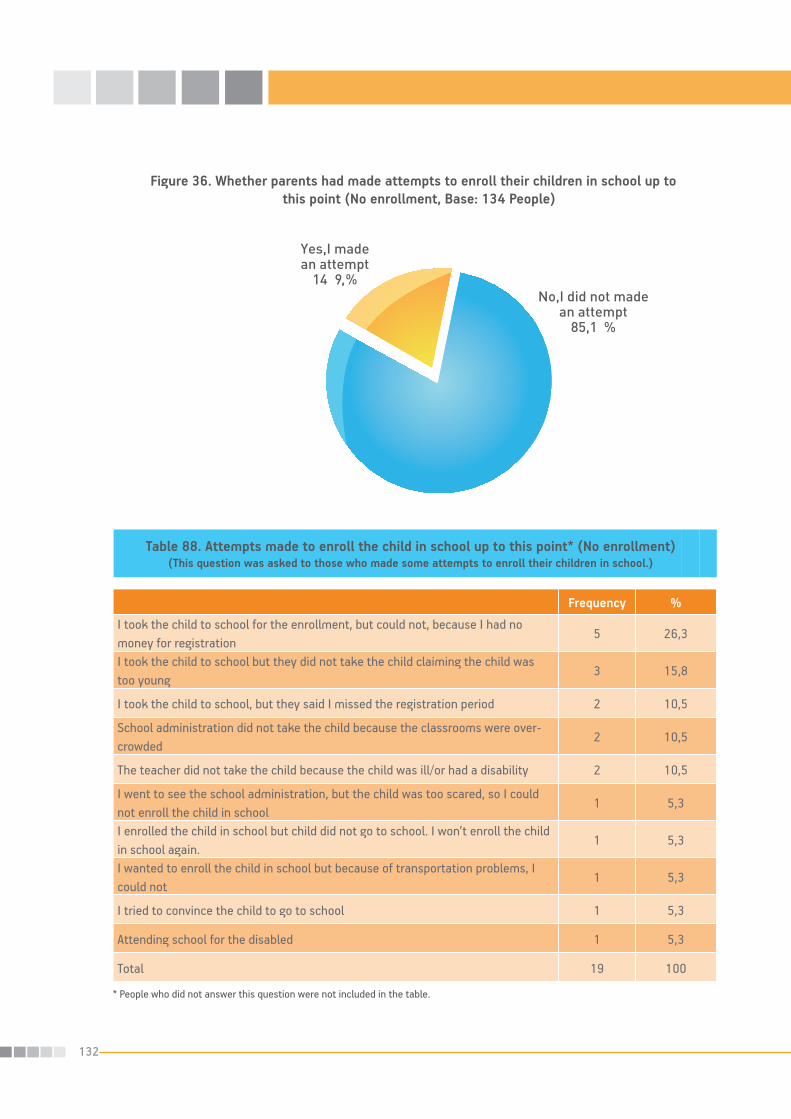
132
Figure 36. Whether parents had made attempts to enroll their children in school up to this point (No enrollment, Base: 134 People)
* People who did not answer this question were not included in the table.
Table 88. Attempts made to enroll the child in school up to this point* (No enrollment) (This question was asked to those who made some attempts to enroll their children in school.)
Frequency %
I took the child to school for the enrollment, but could not, because I had no money for registration
5 26,3
I took the child to school but they did not take the child claiming the child was too young
3 15,8
I took the child to school, but they said I missed the registration period 2 10,5
School administration did not take the child because the classrooms were over-crowded
2 10,5
The teacher did not take the child because the child was ill/or had a disability 2 10,5
I went to see the school administration, but the child was too scared, so I could not enroll the child in school
1 5,3
I enrolled the child in school but child did not go to school. I won’t enroll the child in school again.
1 5,3
I wanted to enroll the child in school but because of transportation problems, I could not
1 5,3
I tried to convince the child to go to school 1 5,3
Attending school for the disabled 1 5,3
Total 19 100

133
Table 89. The reasons for enrolling the child in school in 2008 – 2009 academic year* (Late enrollment)
Frequency % of Responses
% of Respondents**
The child was now at the age for school enrollment 700 68,4 73,5
Child’s development was well 75 7,3 7,9
Improvements in the financial situation of the families 66 6,5 6,9
The child wanting to go to school/the child not being scared to go to school
54 5,3 5,7
The child’s health had improved 25 2,4 2,6
Transportation problem was resolved 8 0,8 0,8
Other 95 9,3 10,0
Total 1023 100 107,5
3.9.1. The reasons effective in children enrolling in school after a year delay The parents who had not enrolled their children in school the previous year were asked to report what made them enroll their children in school in 2008-2009 academic year. They were asked to report what had happened that year that was different from the previous year that allowed them to take their children to school. Responses obtained from the parents showed that the majority of parents (73.5%) had thought that their children were not at the right age the previous year. Thinking that the child was at the right age to enroll in school constituted 68.4% of all the responses provided. The next common response following this was the parents had thought their children’s development was better this year. This was a reason for 7.9% of the parents and it constituted 7.3% of all the responses.
Parent’s responses to why they had enrolled their children in school this year were examined based on whether they had wanted to enroll their children in school the previous year. First, the responses of the parents who did not think about enrolling
their children in school were examined. Detailed examination of the results showed that 72,6% of parents had not enrolled their children in school because they believed their children were not at the right age for school enrollment. Thinking their children was at the right age for school now was 67.5% of all the responses. The next most common reason for the parents (7.8%) was thinking their children were developing well this year. This was 7.2% of all the responses.
Next, the reports of those parents who reported that they had wanted to enroll their children in school during the 2007 - 2008 academic year, but were not able to do so were examined in terms of what made them enroll their children in school in the 2008 – 2009 academic year. For these parents as well, the most common response was that they had believed their children were at the right age for school this year. This was given as a reason by 73,3% of the parents, and again this answer constituted 68,1% of all the answers. Interestingly even though families had differed in terms of wanting to enroll their children in school the previous year, their reasons for enrolling their children in school during the 2008-2009 academic year, after a year delay, were very similar.
* People who did not answer this question were not included in the table.** More than one answer was given.

134
Table 90. Reasons for enrolling children in school a year later*(Late enrollment, Base: 632 people)
(More information can be found in Appendix Table 35)This table included the responses of the parents who had not wanted to enroll their children in school in
2007-2008 academic year.
Frequency % of Responses
% of Respondents**
Enrolled the child because it was the time the child enrolled in school/The child was not at the right age for school last year
459 67,5 72,6
Enrolled the child in school because we thought the child’s development was fine
49 7,2 7,8
The child wanted to go to school 29 4,3 4,6
Family friends provided financial help 21 3,1 3,3
We enrolled the child in school so that the child would go to school with the friends and peers
19 2,8 3,0
We got some loans to enroll the child in school 14 2,1 2,2
Child’s health improved/ got well 13 1,9 2,1
Our financial condition improved 12 1,8 1,9
Other 57 7,8 9,3
Total 680 100 107,6
Table 91 shows the reasons for sending their children in school in 2008-2009 academic year even though they had wanted to enroll their children in school during the 2007 - 2008 academic year.
* People who did not answer this question were not included in the table.** More than one answer was given.

135
Table 91. The reasons for enrolling their children in school 2008-2009 academic year for those parents who had wanted to enroll their children in school
2007-2008 academic year* (Late enrollment, Base: 318 people)(More information can be found in Appendix Table 36)
This table included the responses of the parents who had wanted to enroll their children in school in 2007-2008 academic year.
Frequency % of Responses
% of Respondents**
Enrolled the child because it was the time the child enrolled in school/The child was not at the right age for school last year
233 68,1 73,3
Enrolled the child in school because we thought the child’s development was fine
20 5,8 6,3
The child wanted to go to school 16 4,7 5,0
Child’s health improved/ got well 10 2,9 3,1
I had already wanted to enroll the child in school, so we did it. 9 2,6 2,8
Our financial condition improved 6 1,8 1,9
Despite having financial problems, we wanted to send the child to school
4 1,2 1,3
We resolved the problem of school bus 4 1,2 1,3
Other 40 12 12
Total 342 100 107,5
3.9.2. Reasons for late school enrollment according to the other social stakeholdersWhen the findings of quantitative research were examined, it was found that one of the most important reasons for enrolling children in school after a year delay was thinking or believing that the child’s development or age was now sufficient. It was also found that it was not only parents, also some schools had not enrolled the children in school claiming that the children were too young to enroll in school. This finding suggests that issues such as schools being overcrowded were also effective in this result. In addition to the factors associated with children’s age and development, more structural problems such as economical difficulties and resolving issues related to transportation to schools were also provided as reasons for late school enrollment.
During semi-structured interviews participants were asked to speculate on whether various efforts put on enrolling children in schools on time were effective. Overall participants seem to agree that these efforts were effective, particularly the ones that are done after screening and identification work are complete. Especially the visits of teachers and principles of schools once the children are identified to convince parents to enroll their children in school were thought to be very effective. For this reason, participants emphasized the importance of home visits and close monitoring after identifying these children who were not enrolled in school on time. Along with close monitoring, media campaigns to create awareness and provide information, and information’s provided in the mosques were also thought to be effective. Even though there were few participants who believed that the efforts put into fighting late school enrollment were not effective, they seemed to put the blame
* People who did not answer this question were not included in the table.** More than one answer was given.

136
on the mukhtars and teachers for not being very sensitive. This group also believed that the school expenses associated with sending a child to school were burdensome and had not been adequately resolved.
3.9.3. Knowledge of laws concerning school enrollmentWhen parents were asked about whether they knew the laws and regulations of concerning school enrollment, only 23,5% of them indicated that they knew the laws. When the knowledge of parents residing in different provinces were compared, it was found that Bitlis had the most parents with the knowledge of the laws (66,7%); the highest rate of parents who did not have knowledge of such laws was found in Hakkari at 100%. Differences among the provinces were found to be statistically significant, (χ2(9)=76.89, p<0.001) (See Appendix Table ).
Discussants of focus group meetings generally reported that they believed parents had a knowledge that school enrollment began at age 72 months. However, the discussants believed that the families had a tendency to pretend not to know or ignore such information. the topic of discussion was about the Discussants further reported that when education of female children, the families generally believe and defend themselves with the idea that “The girls will go to school then what” When the discussants reports on whether people know of this information based on whether they live in rural or urban areas were examined, no difference was found. Overall about 23% reported that this information was known to the families.
Figure 37. Knowledge of Article 15 within MONE Regulations for Primary School Institutions Ministry of Education (Late enrollment, Base: 954 people)

137
Figure 38. Knowledge of Article 15 in Ministry of Education Primary Schools Regulations based on living in rural or urban areas in late enrollment group (%)
Table 92. Sources of information about the school enrollment age (Late enrollment)
Those reported not knowing the enrollment
age was 6
Those reported knowing the enrollment age was 6
Frequency %* Frequency %*
School 79 21,3 303 29,1
Relatives 78 21 233 22,4
Family elders 68 18,3 240 23,1
Neighbor 74 19,9 159 15,3
Friend 44 11,9 65 6,3
Media 16 4,3 16 1,5
Mukhtar 3 0,8 12 1,2
Kindergarten teacher/teacher 5 1,3 2 0,2
Principle of the school 1 0,3 1 0,1
Imam - 1 0,1
Spouse 1 0,3 - -
Students 1 0,3 -
Does not remember 1 0,3 8 0,8
Total 371 100 1.040 100
* More than one answer was given.
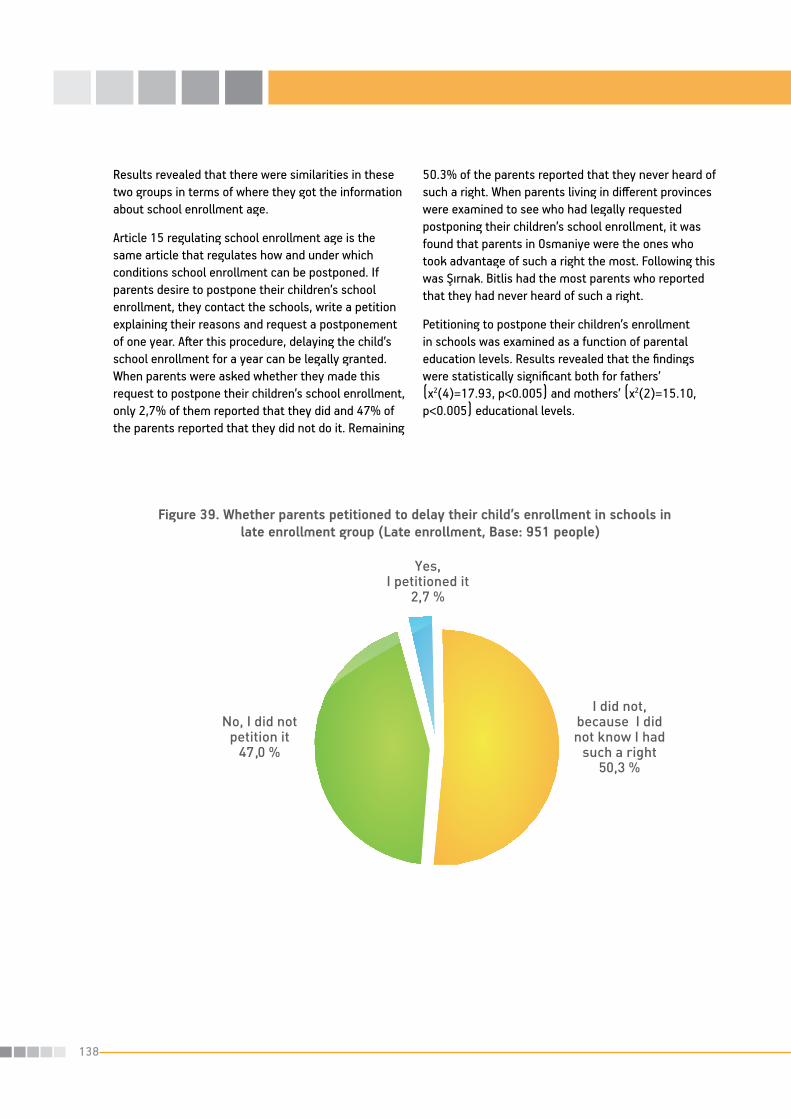
138
Results revealed that there were similarities in these two groups in terms of where they got the information about school enrollment age.
Article 15 regulating school enrollment age is the same article that regulates how and under which conditions school enrollment can be postponed. If parents desire to postpone their children’s school enrollment, they contact the schools, write a petition explaining their reasons and request a postponement of one year. After this procedure, delaying the child’s school enrollment for a year can be legally granted. When parents were asked whether they made this request to postpone their children’s school enrollment, only 2,7% of them reported that they did and 47% of the parents reported that they did not do it. Remaining
50.3% of the parents reported that they never heard of such a right. When parents living in different provinces were examined to see who had legally requested postponing their children’s school enrollment, it was found that parents in Osmaniye were the ones who took advantage of such a right the most. Following this was Şırnak. Bitlis had the most parents who reported that they had never heard of such a right.
Petitioning to postpone their children’s enrollment in schools was examined as a function of parental education levels. Results revealed that the findings were statistically significant both for fathers’ (χ2(4)=17.93, p<0.005) and mothers’ (χ2(2)=15.10, p<0.005) educational levels.
Figure 39. Whether parents petitioned to delay their child’s enrollment in schools in late enrollment group (Late enrollment, Base: 951 people)

139
Table 93. Petitioning to postpone children’s school enrollment disaggregated by fathers’ educational levels (Late enrollment)
(When the participant was a father)
Frequency % Frequency % Frequency %
Has no schooling 9 36,0 214 49,9 185 39,5
Primary school graduate-(1st through 5th and 1st through 8th) 13 52,0 184 42,9 262 56,0
Graduate of high school or above 3 12,0 31 7,2 21 4,5
Total 25 100 429 100 468 100
No, I did notYes, I did itI did not, but did not know we had such
a right
Table 94. Petitioning to postpone children’s school enrollment disaggregated by living in urban and rural areas (Late enrollment)
Urban living areas
Rural living areas
Frequency % Frequency %
Yes, I did it 10 2,5 16 2,9
No, I did not 217 54,4 230 41,7
I did not, but did not know we had such a right 172 43,1 306 55,4
Total 399 100 552 100
Petitioning to legally postpone children’s school enrollment was examined as a function of living in urban and rural areas. The results were statistically significant, (χ2(2)=15.10, p<0.005). Moreover, results revealed that there were very few people who knew the right or took advantage of this right (Appendix Table 38).
During the qualitative investigations, participants who were not MONE workers such as teachers, principles, province or districts directors of national education
were asked whether they had a knowledge of Article 15. More than half of the participants (57,1%) reported that they did not know of such a regulation. As it was discussed previously, Article 15 states that “children who complete 72 months of age by December 31 of a given year can be enrolled in primary schools that academic year. Those who are eligible in terms of their chronological age can be granted a year of legal delay if the legal guardian gives a written petition.”

140
Not being aware of this article was examined for what backgrounds these social stakeholders had. Findings revealed that those who did not know this article were parents, local media representatives, and mukhtars the most frequently. Examination of the knowledge of this article which is an important legal statement clarifying legal age for school enrollment is important for this research.
Participants, including MONE employees, were asked whether they thought Article 15 was in effect. Of those participants, 67% reported that they believed that Article 15 was in effect. These participants stated that this was not just what their beliefs, it was based on their observations, and experiences of themselves and others. When the responses were examined based on the backgrounds of participants, it was found that MONE employees being in the lead, NGO representatives, local government workers, and religious officials thought or believed that Article 15 was used. These participants seemed to have more optimistic beliefs about the use of Article 15. Principals of schools were more represented among these people. Moreover, school administrators among
the participants reported that they are using Article 15 for the children of parents doing seasonal migrant work who seem to show signs of developmental problems. One of the participants reported that they accepted children in these conditions into schools without officially enrolling them in schools and monitored them for a while to determine whether they should keep these children in school or not. And it was also reported that both because of financial limitations and wanting to see their children develop better when they enter school, parents defer to the decisions of school administrators. A few participants discussed that because of the limitations they are experiencing at their schools in terms of materials and teachers, school administrators are using Article 15 to not accept more children in their schools. On the other hand, the number of people who claimed that parents came with such requests and they ended up using Article 15 was not very few.
Some of the participants who reported that Article 15 was not used in full effect claimed that the issue was not so much enrolling children in school late, they claimed that the issue rather wanted to enroll their
Figure 40. Someone giving information to families about the school enrollment age being 6 in the academic year of 2007 – 2008 (%)

141
Table 95. Whether families received guidance about the school enrollment again the 2007-2008 academic year disaggregated by living in urban and rural areas
Frequency % Frequency %
No, there was not 392 97,8 531 95,5
Yes, There was 9 2,2 25 4,5
Total 401 100 556 100
Urban living areasRural living areas
Table 96. Distribution of the people who informed families that the school enrollment age was 6* (Late enrollment)
(This question was asked to those who reported that somebody had provided guidance about the school enrollment age was 6 in the 2007-2008 academic year.)
No enrollmentBase: 34 People
FrequencyPercentage
of ResponsesPercentage of Respondents**
Frequency %
Relative, neighbor etc. people from the sur-roundings
18 46,2 52,9 1 100
Teachers in the neighborhood 14 35,9 41,2 - -
Principal of the school in the neighborhood 4 10,3 11,8 - -
Mukhtar of the neighborhood 2 5,1 5,9 - -
Imam of the mosque 1 2,6 2,9 - -
Total 39 100 114,7 1 100
children earlier than the school enrollment age. These participants claimed to witness that even if the school administration argued that these children needed to be in school on time, not early, these families were not easily convinced.
When participants were asked whether they believed that Article 15 was misused or abused, 93% of the participants did not agree. It was the same for
participants from different backgrounds. Of those 5 participants who claimed that Article 15 was misused, 3 of them reported that their report was not based on experience, it was rather based on their perceptions and expectations. On the other hand, those who claimed that Article 15 was not misused argued that parents could not do it because they did not even know of such a regulation.
* People who did not answer this question were not included in the table.** More than one answer was given.
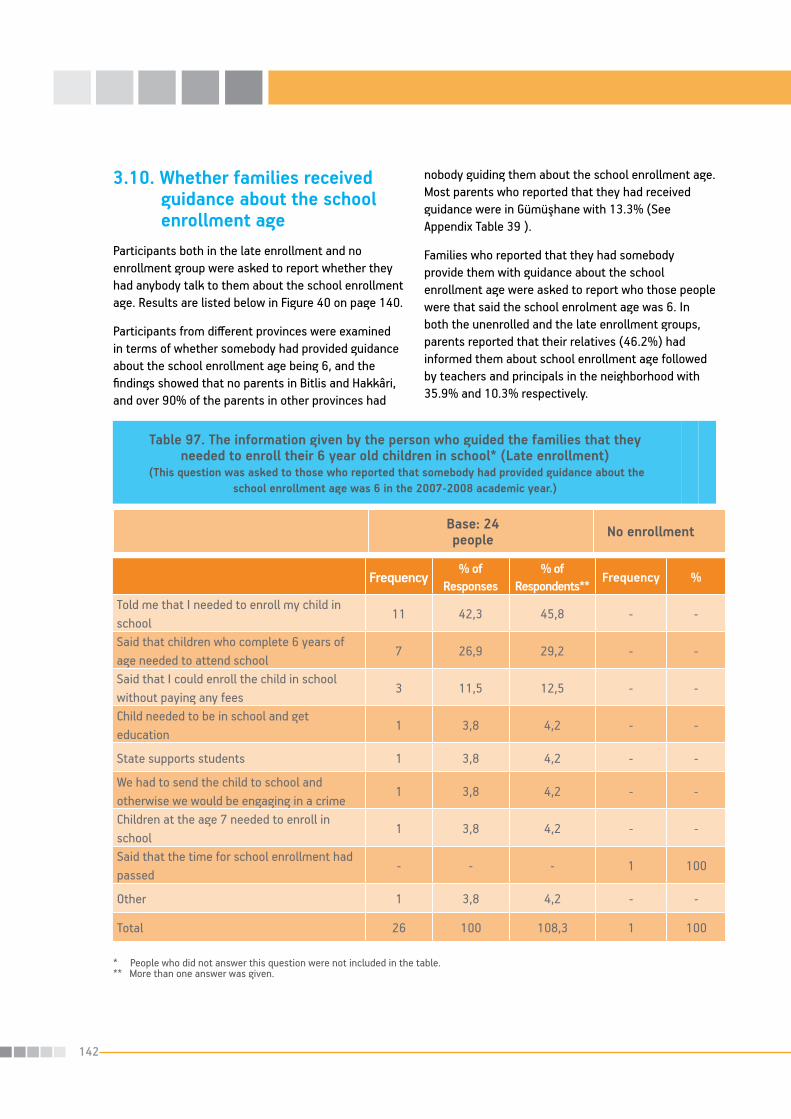
142
3.10. Whether families received guidance about the school enrollment ageParticipants both in the late enrollment and no enrollment group were asked to report whether they had anybody talk to them about the school enrollment age. Results are listed below in Figure 40 on page 140.
Participants from different provinces were examined in terms of whether somebody had provided guidance about the school enrollment age being 6, and the findings showed that no parents in Bitlis and Hakkâri, and over 90% of the parents in other provinces had
nobody guiding them about the school enrollment age. Most parents who reported that they had received guidance were in Gümüşhane with 13.3% (See Appendix Table 39 ).
Families who reported that they had somebody provide them with guidance about the school enrollment age were asked to report who those people were that said the school enrolment age was 6. In both the unenrolled and the late enrollment groups, parents reported that their relatives (46.2%) had informed them about school enrollment age followed by teachers and principals in the neighborhood with 35.9% and 10.3% respectively.
Table 97. The information given by the person who guided the families that they needed to enroll their 6 year old children in school* (Late enrollment)
(This question was asked to those who reported that somebody had provided guidance about the school enrollment age was 6 in the 2007-2008 academic year.)
No enrollmentBase: 24 people
Frequency% of
Responses% of
Respondents**Frequency %
Told me that I needed to enroll my child in school
11 42,3 45,8 - -
Said that children who complete 6 years of age needed to attend school
7 26,9 29,2 - -
Said that I could enroll the child in school without paying any fees
3 11,5 12,5 - -
Child needed to be in school and get education
1 3,8 4,2 - -
State supports students 1 3,8 4,2 - -
We had to send the child to school and otherwise we would be engaging in a crime
1 3,8 4,2 - -
Children at the age 7 needed to enroll in school
1 3,8 4,2 - -
Said that the time for school enrollment had passed
- - - 1 100
Other 1 3,8 4,2 - -
Total 26 100 108,3 1 100
* People who did not answer this question were not included in the table.** More than one answer was given.
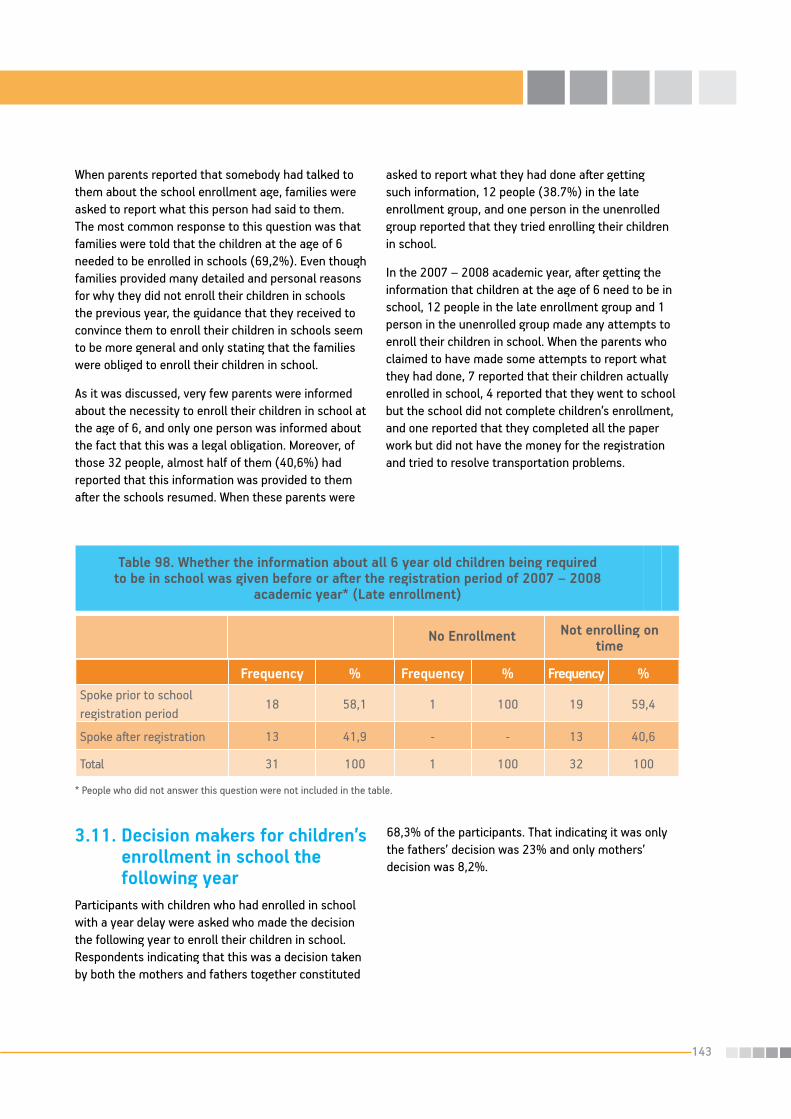
143
3.11. Decision makers for children’s enrollment in school the following yearParticipants with children who had enrolled in school with a year delay were asked who made the decision the following year to enroll their children in school. Respondents indicating that this was a decision taken by both the mothers and fathers together constituted
68,3% of the participants. That indicating it was only the fathers’ decision was 23% and only mothers’ decision was 8,2%.
Table 98. Whether the information about all 6 year old children being required to be in school was given before or after the registration period of 2007 – 2008
academic year* (Late enrollment)
Frequency % Frequency % Frequency %Spoke prior to school registration period
18 58,1 1 100 19 59,4
Spoke after registration 13 41,9 - - 13 40,6
Total 31 100 1 100 32 100
No Enrollment Not enrolling on time
* People who did not answer this question were not included in the table.
When parents reported that somebody had talked to them about the school enrollment age, families were asked to report what this person had said to them. The most common response to this question was that families were told that the children at the age of 6 needed to be enrolled in schools (69,2%). Even though families provided many detailed and personal reasons for why they did not enroll their children in schools the previous year, the guidance that they received to convince them to enroll their children in schools seem to be more general and only stating that the families were obliged to enroll their children in school.
As it was discussed, very few parents were informed about the necessity to enroll their children in school at the age of 6, and only one person was informed about the fact that this was a legal obligation. Moreover, of those 32 people, almost half of them (40,6%) had reported that this information was provided to them after the schools resumed. When these parents were
asked to report what they had done after getting such information, 12 people (38.7%) in the late enrollment group, and one person in the unenrolled group reported that they tried enrolling their children in school.
In the 2007 – 2008 academic year, after getting the information that children at the age of 6 need to be in school, 12 people in the late enrollment group and 1 person in the unenrolled group made any attempts to enroll their children in school. When the parents who claimed to have made some attempts to report what they had done, 7 reported that their children actually enrolled in school, 4 reported that they went to school but the school did not complete children’s enrollment, and one reported that they completed all the paper work but did not have the money for the registration and tried to resolve transportation problems.
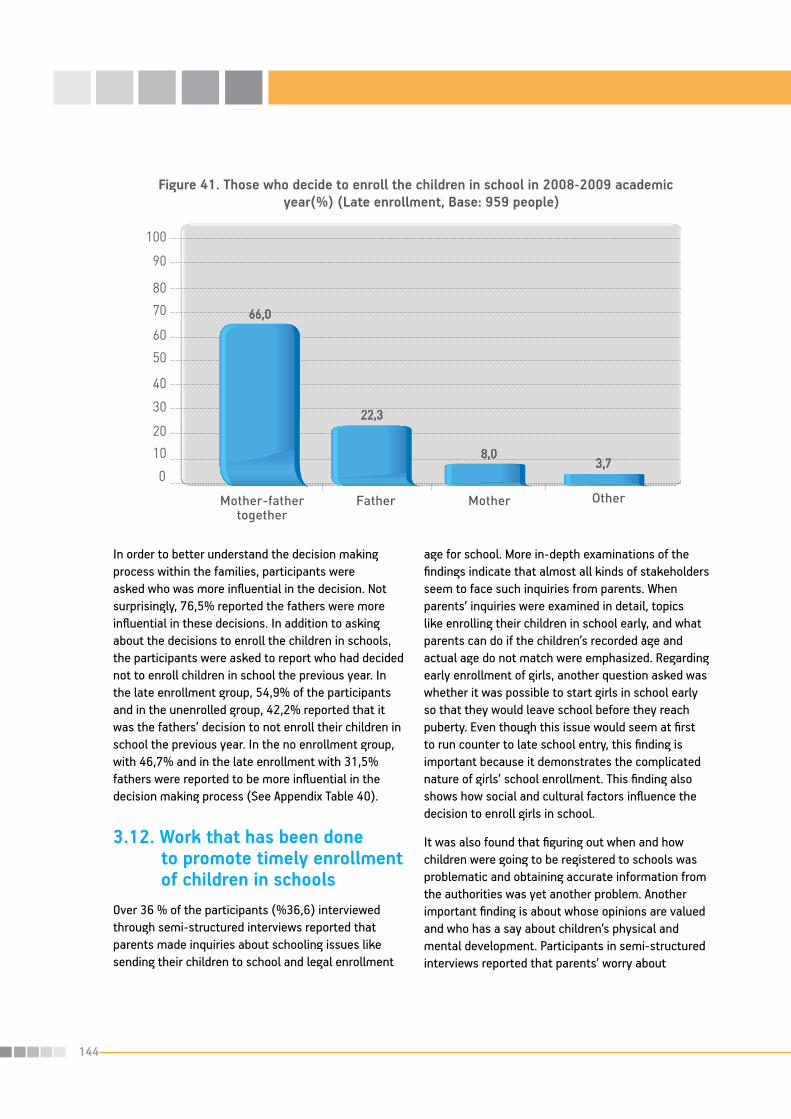
144
Figure 41. Those who decide to enroll the children in school in 2008-2009 academic year(%) (Late enrollment, Base: 959 people)
In order to better understand the decision making process within the families, participants were asked who was more influential in the decision. Not surprisingly, 76,5% reported the fathers were more influential in these decisions. In addition to asking about the decisions to enroll the children in schools, the participants were asked to report who had decided not to enroll children in school the previous year. In the late enrollment group, 54,9% of the participants and in the unenrolled group, 42,2% reported that it was the fathers’ decision to not enroll their children in school the previous year. In the no enrollment group, with 46,7% and in the late enrollment with 31,5% fathers were reported to be more influential in the decision making process (See Appendix Table 40).
3.12. Work that has been done to promote timely enrollment of children in schoolsOver 36 % of the participants (%36,6) interviewed through semi-structured interviews reported that parents made inquiries about schooling issues like sending their children to school and legal enrollment
age for school. More in-depth examinations of the findings indicate that almost all kinds of stakeholders seem to face such inquiries from parents. When parents’ inquiries were examined in detail, topics like enrolling their children in school early, and what parents can do if the children’s recorded age and actual age do not match were emphasized. Regarding early enrollment of girls, another question asked was whether it was possible to start girls in school early so that they would leave school before they reach puberty. Even though this issue would seem at first to run counter to late school entry, this finding is important because it demonstrates the complicated nature of girls’ school enrollment. This finding also shows how social and cultural factors influence the decision to enroll girls in school.
It was also found that figuring out when and how children were going to be registered to schools was problematic and obtaining accurate information from the authorities was yet another problem. Another important finding is about whose opinions are valued and who has a say about children’s physical and mental development. Participants in semi-structured interviews reported that parents’ worry about

145
their children’s development is an important factor influencing late school entry. Therefore, according to participants any decision to not send a child to school based on developmental concerns should be taken with a specialist.
Of the participants in semi-structured interviews, 29,5% reported that, currently, either they or their institutions are involved in work to achieve school enrollment of children when they are legally eligible. When types of work they are involved in were examined, it was found that their primary focus was on identifying children who were at the legal age to enter school. Religious officials of the state religious affairs department reported that they inform parents about school registration dates during their Friday sermons. Similarly, local media representatives also stated that they air programs related to school registration around school starting dates. Local media representatives also reported airing programs that encourage parents to enroll children in school, and they also work in collaboration with mukhtars. One finding worth highlighting was that all the work listed above concerning school enrollment was carried out only by one third of the participants who were interviewed.
3.13. Activities children were not enrolled in school on time engaged in during 2007 – 2008 academic yearWhen the participants were asked to report about how the children with late enrollment to schools spent their time during the past year when they were out of school, the reponses provided a variety of activities. It is interesting to note that activities reported to be done by the children the most were playing in the streets. It was also found that in the late enrollment group 55 out of 959 children were going to preschool a few days a week or everyday.
When children who are still out of school were examined in terms of how they spent their time during the school year, it was also found that playing at home or in the street was the most common activities
followed by watching TV, and taking care of younger siblings at home (See Table 100).
Findings that were obtained from semi-structured interviews supported the findings of the quantitative investigation and showed that 81% of the participants reported that families did not prepare their children for school. Even though this was typically reported by principals, teachers and inspectors more than other participants of the interviews among all the social groups, people reporting similar thoughts were high. When participants were asked about what families fail to teach their children the most, participants typically concluded that families are uneducated and because of that they do not teach self-hygiene and self-care skills.
3.14. People who were influential in the decision to not enroll children in schoolEven though it was found that mothers and fathers act together in the decision to enroll their children to school, fathers play a much more important role in the decision to not enroll their children to school. In the late enrollment group, 77,6%, in the unenrolled group 88.8% reported that fathers were more influential (See Appendix Table 41).
Teachers (n=16) and principles (n=14) being on the top of the list, 37 people outside of the household decided for the enrollment of children in late enrollment group. In the unenrolled group there were only two people influential on this decision. As expected, majority of these people were males (n=31). Of these people, 25 of them were university graduates, most of them being principals and teachers, and only 3 of them were graduates of primary schools.
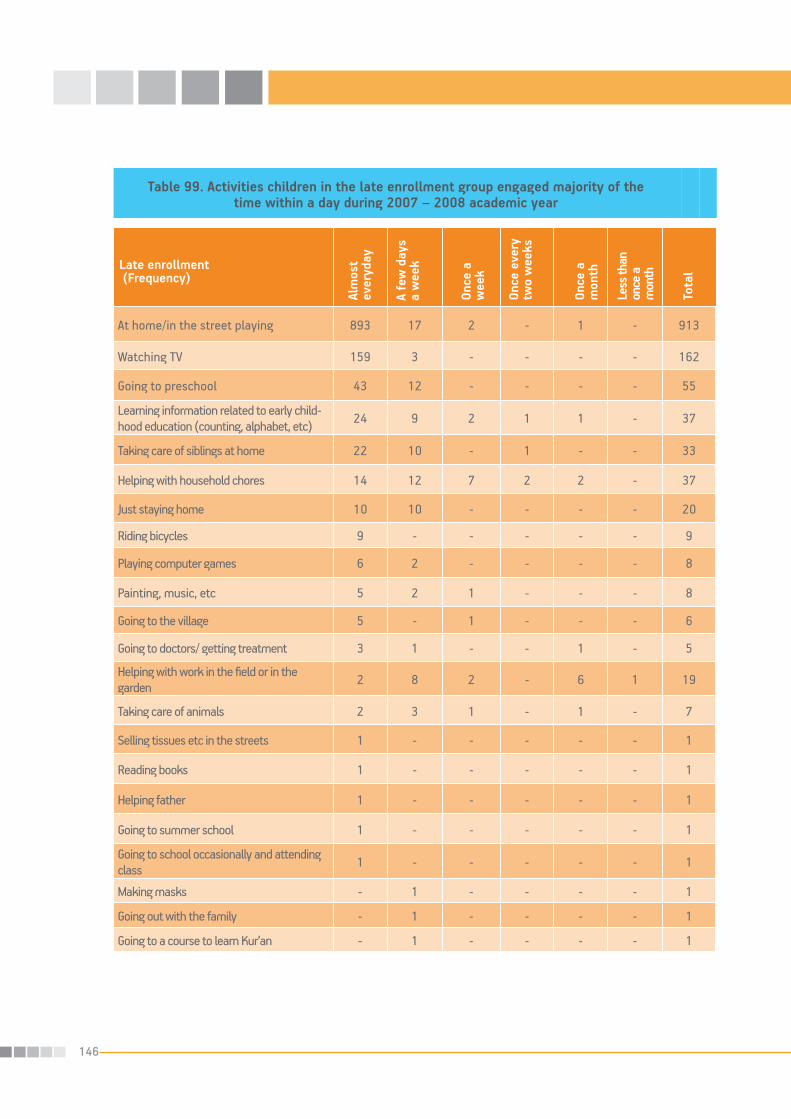
146
Table 99. Activities children in the late enrollment group engaged majority of the time within a day during 2007 – 2008 academic year
At home/in the street playing 893 17 2 - 1 - 913
Watching TV 159 3 - - - - 162
Going to preschool 43 12 - - - - 55
Learning information related to early child-hood education (counting, alphabet, etc) 24 9 2 1 1 - 37
Taking care of siblings at home 22 10 - 1 - - 33
Helping with household chores 14 12 7 2 2 - 37
Just staying home 10 10 - - - - 20
Riding bicycles 9 - - - - - 9
Playing computer games 6 2 - - - - 8
Painting, music, etc 5 2 1 - - - 8
Going to the village 5 - 1 - - - 6
Going to doctors/ getting treatment 3 1 - - 1 - 5
Helping with work in the field or in the garden 2 8 2 - 6 1 19
Taking care of animals 2 3 1 - 1 - 7
Selling tissues etc in the streets 1 - - - - - 1
Reading books 1 - - - - - 1
Helping father 1 - - - - - 1
Going to summer school 1 - - - - - 1
Going to school occasionally and attending class 1 - - - - - 1
Making masks - 1 - - - - 1
Going out with the family - 1 - - - - 1
Going to a course to learn Kur’an - 1 - - - - 1
Late enrollment (Frequency)
Alm
ost
ever
yday
A fe
w d
ays
a w
eek
Once
a
wee
k
Once
eve
ry
two
wee
ks
Once
a
mon
th
Tota
l
Less
than
on
ce a
m
onth
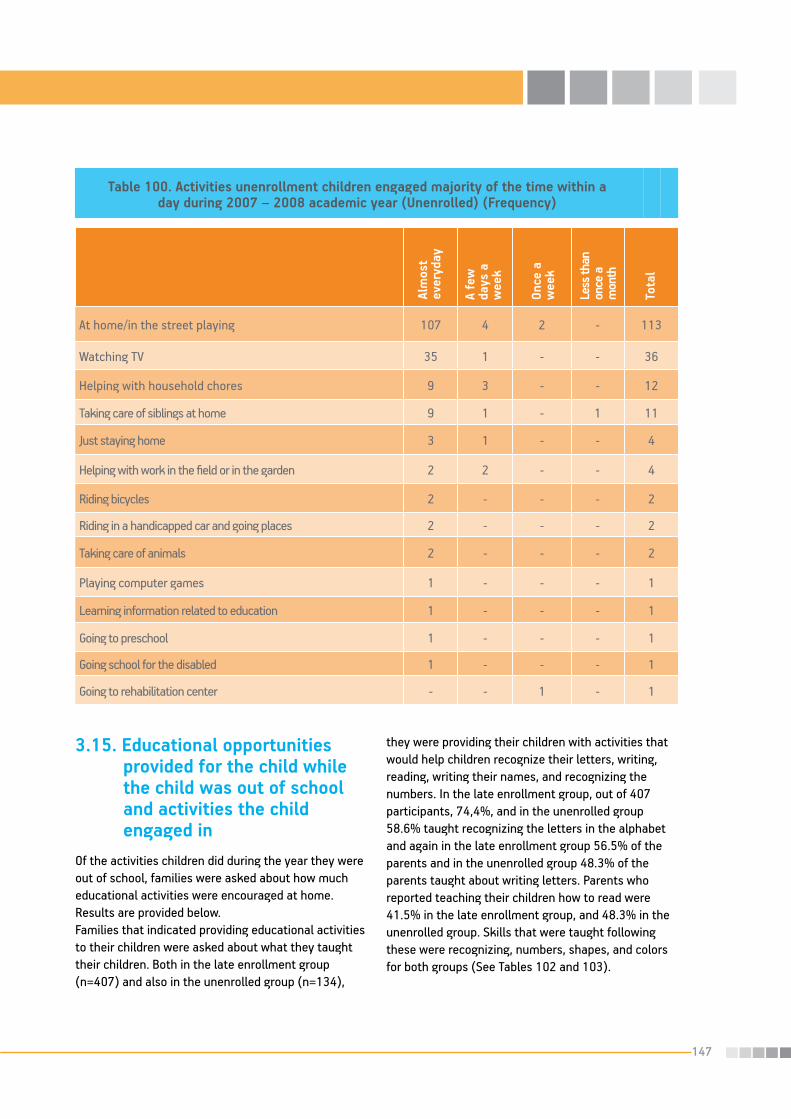
147
Table 100. Activities unenrollment children engaged majority of the time within a day during 2007 – 2008 academic year (Unenrolled) (Frequency)
At home/in the street playing 107 4 2 - 113
Watching TV 35 1 - - 36
Helping with household chores 9 3 - - 12
Taking care of siblings at home 9 1 - 1 11
Just staying home 3 1 - - 4
Helping with work in the field or in the garden 2 2 - - 4
Riding bicycles 2 - - - 2
Riding in a handicapped car and going places 2 - - - 2
Taking care of animals 2 - - - 2
Playing computer games 1 - - - 1
Learning information related to education 1 - - - 1
Going to preschool 1 - - - 1
Going school for the disabled 1 - - - 1
Going to rehabilitation center - - 1 - 1
Alm
ost
ever
yday
A fe
w
days
a
wee
k
Once
a
wee
k
Tota
l
Less
than
on
ce a
m
onth
3.15. Educational opportunities provided for the child while the child was out of school and activities the child engaged inOf the activities children did during the year they were out of school, families were asked about how much educational activities were encouraged at home. Results are provided below.Families that indicated providing educational activities to their children were asked about what they taught their children. Both in the late enrollment group (n=407) and also in the unenrolled group (n=134),
they were providing their children with activities that would help children recognize their letters, writing, reading, writing their names, and recognizing the numbers. In the late enrollment group, out of 407 participants, 74,4%, and in the unenrolled group 58.6% taught recognizing the letters in the alphabet and again in the late enrollment group 56.5% of the parents and in the unenrolled group 48.3% of the parents taught about writing letters. Parents who reported teaching their children how to read were 41.5% in the late enrollment group, and 48.3% in the unenrolled group. Skills that were taught following these were recognizing, numbers, shapes, and colors for both groups (See Tables 102 and 103).

148
Table 101. Relationship status of the individual who decided to enroll the child in school and lives outside the home
No enrollmentLate enrollment
Frequency % Frequency %
Teacher 16 43,2 - -
Principal 14 37,8 1 50,0
Uncle (father’s brother) 3 8,1 - -
Sibling (older sister/brother) 2 5,4 1 50,0
Grandmother (father’s mother) 1 2,7 - -
Uncle (mother’s brother) 1 2,7 - -
Total 37 100 2 100
Figure 42. Teaching educational activities at home during 2007 – 2008 academic year
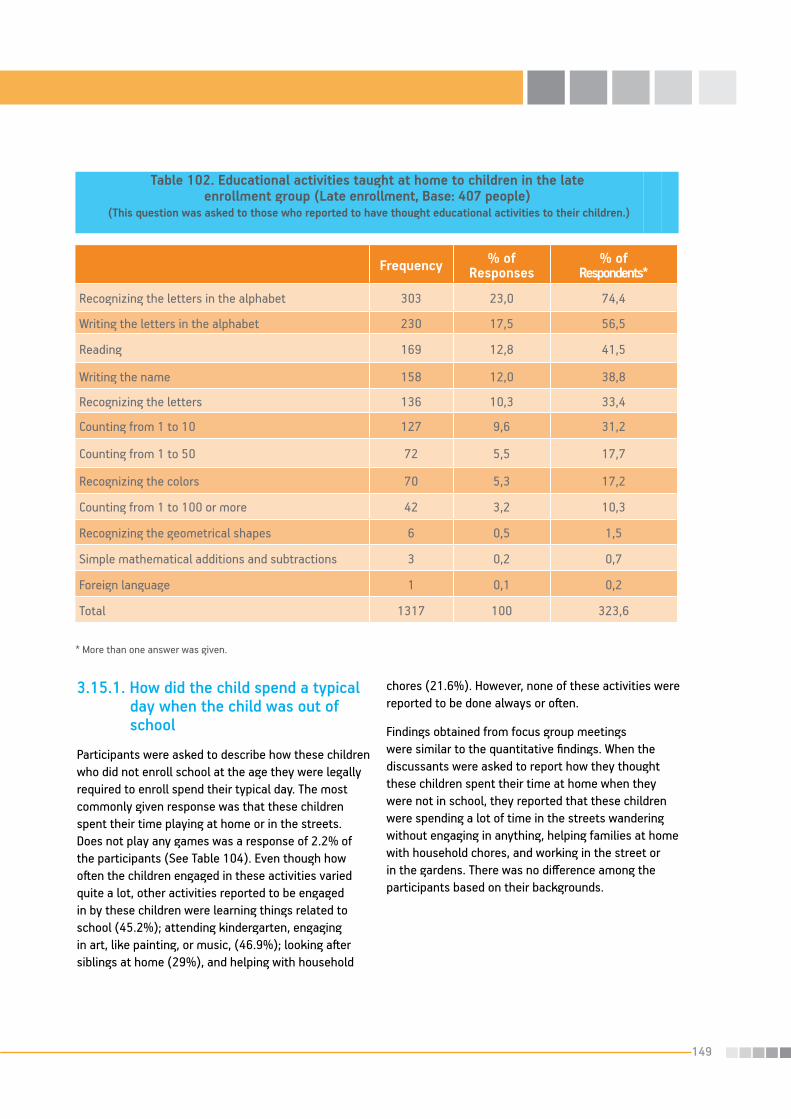
149
Table 102. Educational activities taught at home to children in the late enrollment group (Late enrollment, Base: 407 people)
(This question was asked to those who reported to have thought educational activities to their children.)
Frequency % of Responses
% of Respondents*
Recognizing the letters in the alphabet 303 23,0 74,4
Writing the letters in the alphabet 230 17,5 56,5
Reading 169 12,8 41,5
Writing the name 158 12,0 38,8
Recognizing the letters 136 10,3 33,4
Counting from 1 to 10 127 9,6 31,2
Counting from 1 to 50 72 5,5 17,7
Recognizing the colors 70 5,3 17,2
Counting from 1 to 100 or more 42 3,2 10,3
Recognizing the geometrical shapes 6 0,5 1,5
Simple mathematical additions and subtractions 3 0,2 0,7
Foreign language 1 0,1 0,2
Total 1317 100 323,6
* More than one answer was given.
3.15.1. How did the child spend a typical day when the child was out of school Participants were asked to describe how these children who did not enroll school at the age they were legally required to enroll spend their typical day. The most commonly given response was that these children spent their time playing at home or in the streets. Does not play any games was a response of 2.2% of the participants (See Table 104). Even though how often the children engaged in these activities varied quite a lot, other activities reported to be engaged in by these children were learning things related to school (45.2%); attending kindergarten, engaging in art, like painting, or music, (46.9%); looking after siblings at home (29%), and helping with household
chores (21.6%). However, none of these activities were reported to be done always or often.
Findings obtained from focus group meetings were similar to the quantitative findings. When the discussants were asked to report how they thought these children spent their time at home when they were not in school, they reported that these children were spending a lot of time in the streets wandering without engaging in anything, helping families at home with household chores, and working in the street or in the gardens. There was no difference among the participants based on their backgrounds.

150
Table 103. Educational activities thought at home to children in the no enrollment group(No enrollment, Base: 29 people)
(This question was asked to those who reported to have thought educational activities to their children.)
Frequency % of Responses
% of Respondents*
Recognizing the letters in the alphabet 17 17,5 58,6
Writing the letters in the alphabet 14 14,4 48,3
Reading 14 14,4 48,3
Writing the name 12 12,4 41,4
Counting from 1 to 10 10 10,3 34,5
Recognizing the letters 9 9,3 31
Counting from 1 to 50 8 8,2 27,6
Recognizing the colors 7 7,2 24,1
Counting from 1 to 100 or more 4 4,1 13,8
Recognizing the geometrical shapes 2 2,1 6,9
Total 97 100 334,5
* More than one answer was given.
3.15.2. Activities children engage in during a typical day in the late enrollment groupIn the late enrollment group, children were examined based on their sex and whether they looked after their siblings at home. The findings revealed significant differences between boys and girls, (χ2(1)=9.74, p<0.005) indicating that more girls (15.4%) looked after their siblings at home than did boys (8,8%). The remaining children were reported to not participate in the care of their siblings. Even though the portion of these children appears to be small, considering these children quite young and they are out of school system, the fact that they are taking care of their siblings at home is striking. It was reported either for boys and girls that they were playing at home or in the streets. No statistically significant differences between boys and girls were found in this regard. Another activity the children were reported to engage in was playing games on the computer. As it can be
expected because of very limited financial conditions of these families, most children (girls= 97,8%; boys= 96,3%) did not spend any time on the computer. When parents were asked to report whether their children sold tissues in the streets, only one male child was reported to do this. As it can be predicted, this was associated with living in an urban area. Because the traditional family structures and the gendered division of labor in the household are commonly observed in Turkey, it was not surprising that there were differences between male and female children in terms of how much they were reported to help with household chores, (χ2(1)=12.55, p<0.001). Findings revealed that 12.6% of the female children and only 6% of the male children helped around the house. Even though there were few parents reporting that their children were helping around the house, findings still indicated that more girls were helping around the house than boys. Working in the field or in the garden seems to be reported slightly more for boys (97%) than girls (94.4%), but this difference

151
%
Table 104. Activities the children engaged in a typical day the previous year when the child was out of school (Late Enrollment)*
(2007-2008 academic year)
Playing at home/in the street 55,6 34,1 6,8 1,3 2,2 947 100
Attending kindergarten 4,7 3,4 1,5 1,2 89,3 949 100
Engaging in activities like art (painting), music 4,2 10,1 13,4 9,2 63,1 945 100
Learning things related to school 4,3 16,1 19,6 5,2 54,8 908 100
Looking after siblings at home 2,6 2,8 6,5 17,0 71,0 949 100
Playing computer games 0,8 0,9 1,2 2,0 95,0 949 100
Help with household chores 0,5 1,7 7,0 12,5 78,4 947 100
Help with the work in the garden/field 0,2 0,4 3,7 8,6 87,1 946 100
Selling things in the streets like tissues 0,1 - - 0,9 98,9 949 100
Help take care of someone sick at home 0,1 - 0,5 1,0 98,4 947 100
Help with the work where we go to work as seasonal workers 0,1 0,3 1,5 5,4 92,7 949 100
(%)Alw
ays
Often
Som
etim
es
Rare
ly
Neve
r
Total
Frequency
* People who did not answer this question were not included in the table.
was not statistically significant. Again when children were examined based on their sex whether they were provided with educational activities or not, 40.9% of the boys and 39% of the girls were reported to be provided with such activities, not revealing any statistical significant sex differences. Because there were too few children reported to take care of someone sick at home, no examinations based on child sex were conducted. Those reported to go for seasonal migrant work reported that both boys (n=9) and girls (n=9) engaged in such work equally. Even though the findings did not reveal any statistically
significant sex differences, only 8% of the girls and 11.1% of the boys were reported to have attended kindergarten. Both female (27.7%) and male (27.8%) children almost equally engaged in painting or music activities at home. Statistical examination of sex differences for looking after siblings did not reveal any significant differences indicating 14.2% of the girls and 10.5% of the boys had looked after their siblings at home.

152
Figure 43. Looking after siblings disaggregated by child sex (%)
Figure 44. Playing at home or in the streets disaggregated by child sex (%)
Figure 45. Playing computer games disaggregated by child sex (%)
Figure 46. Helping with household chores disaggregated by child sex (%)

153
Figure 47. Helping with the work in the field and in the garden disaggregated by child sex (%)
Figure 48. Child receiving educational activities disaggregated by child sex (%)
Figure 49. Child helping with the care of a sick person at home disaggregated by child sex (%)
Figure 50. Helping with the work in the place the families go to work as seasonal workers
disaggregated by child sex (%)

154
Figure 51. Child attending kindergarten disaggregated by child sex (%)
Figure 52. Child engaging in painting and music activities disaggregated by child sex (%)
Of those children in the late enrollment group, those living in rural areas (98,2%) played in the streets more than those in urban areas (95,3%). This difference was statistically significant, (χ2(1)=5.85, p<0.05). The children who enrolled in school with a year delay were reported to spend most of their time playing at home or in the streets. Those living in the urban areas (4,7%) played on the computers more than those who lived in rural areas (0,5%), The difference between the late enrollment and unenrolled groups in terms of playing on the computers was significant, (χ2(2)=14.12, p<0.005). Children helping with the household chores were examined as a function of living in urban and rural areas and statistically significant differences were found. In the late enrollment group, children living in the rural areas (12,4%) were helping with household chores more than those living in urban areas (6.9%), (χ2(1)=8.54, p<0.005). As can be expected, in the rural
living areas (7.7%), more children were helping with the garden or the work in the field than in the urban areas (2%), (χ2(1)=17.78, p<0.001). Examination of rural and urban differences did not reveal any statistically significant differences for the following variables: children receive school related knowledge, children taking care of a sick person at home, children helping with the work in the place where families go for seasonal migrant work and attending kindergarten. When whether children engage in activities like painting or music as a function of whether they lived in urban or rural areas, it was found that more urban children (30.4%) than rural children (23.9%) in the late enrollment group engaged in such activities. These differences were statistically significant, (χ2(1)=4.86, p<0.05).

155
Figure 53. Looking after siblings disaggregated by living in urban or rural areas (%)
Figure 55. Playing computer games disaggregated by living in urban or rural
areas (%)
Figure 56. Helping with the work in the place the families go to work as seasonal workers
disaggregated by living in urban or rural areas (%)
Figure 54. Playing at home or in the streets disaggregated by living in urban or rural
areas (%)

156
3.15.3. Frequency of the activities the children engage in during a typical day3.15.3.1. Late enrollment group
In the late enrollment group, participants were asked to report how often their children engaged in the activities they were asked using a scale ranging from 1 to 5. In this Likert scale rating, 1 indicates Never, 2 indicates Rarely, 3 means Sometimes, 4 means Often and 5 means Always. Parental reports suggested that playing was an activity that children spent most of their time engaged in (M=4.40, SD=0.85). Following this were educational activities, (M=2.10, SD=1.33), and engaging in painting or music, (M=1.83, SD=1.23). Activities outside of playing seem to be very rarely or never done by the majority of the children as it can seen when the average points attributed to each of them are closely examined. Parents reported that among the activities children engage in “learning things related to school” seem to be also done rarely. As these responses show, children in general spend
their time without receiving any direction and without any preparation for school.3.15.3.2. No enrollment group
Parents of children who are still not enrolled in school were asked to report which activities their children engaged in. In this group as well, the most often repeated activity was to play at home or in the streets, (M=3.96, SD=0.13) followed by looking after siblings, (M=1.67, SD=1.02), doing things like making music or painting, (M=1.64, SD=0.97) and helping with household chores, (M=1.63, SD=0.97).
Figure 57. Child attending kindergarten disaggregated by living in urban or rural
areas (%)
Figure 58. Child engaging in painting and music activities disaggregated by living in urban or
rural areas (%)

157
Table 105. Descriptive statistics for the frequency of activities children engage in during a typical day in 2007-2008 academic year when they were out of school in
the late enrollment group (Late enrollment)
N AverageStandard Deviation
Minimum Maximum
Looking after siblings at home 949 1,49 0,93 1 5
Playing at home/in the street 947 4,40 0,85 1 5
Playing computer games 949 1,11 0,53 1 5
Selling things in the street like tissues 949 1,01 0,16 1 5
Helping with household chores 947 1,34 0,73 1 5
Helping with the work in the garden/field 946 1,18 0,52 1 5
Learning things related to school 908 2,10 1,33 1 5
Help take care of someone sick at home 947 1,02 0,22 1 5
Helping with the work where we go to work as seasonal workers
949 1,10 0,39 1 5
Attending kindergarten 949 1,33 1,01 1 5
Engaging in activities like art (painting), music
945 1,83 1,23 1 5
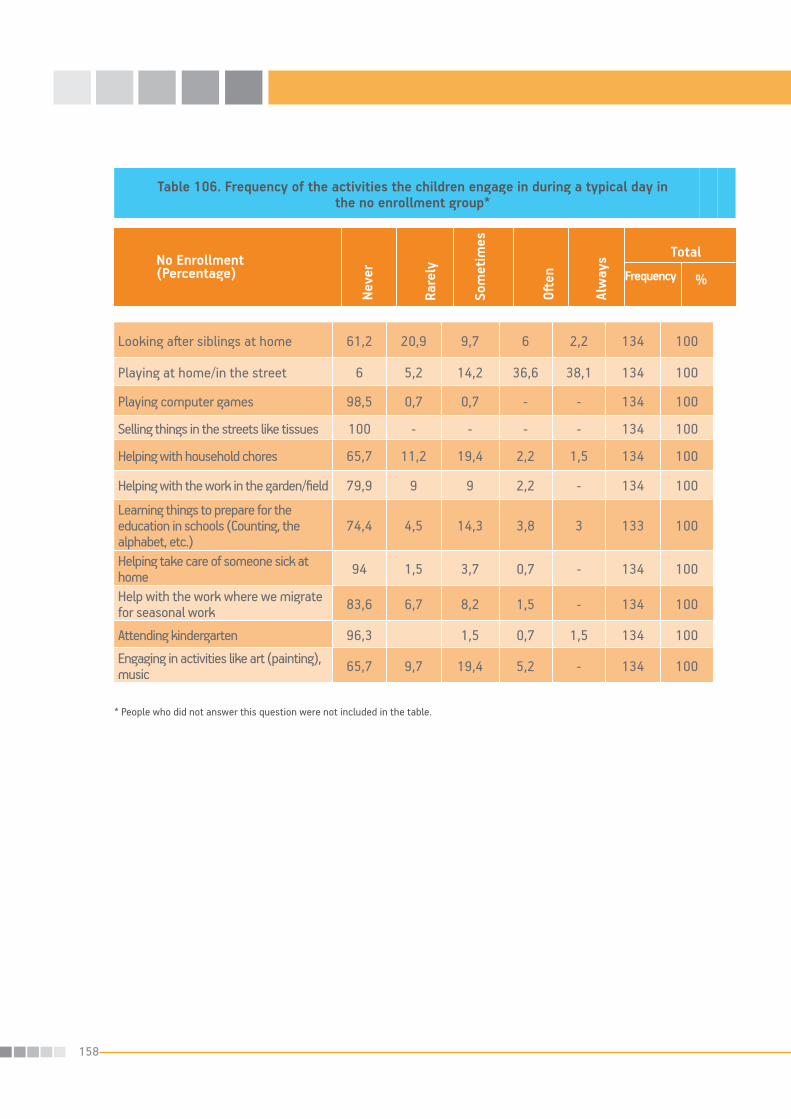
158
Table 106. Frequency of the activities the children engage in during a typical day in the no enrollment group*
Looking after siblings at home 61,2 20,9 9,7 6 2,2 134 100
Playing at home/in the street 6 5,2 14,2 36,6 38,1 134 100
Playing computer games 98,5 0,7 0,7 - - 134 100
Selling things in the streets like tissues 100 - - - - 134 100
Helping with household chores 65,7 11,2 19,4 2,2 1,5 134 100
Helping with the work in the garden/field 79,9 9 9 2,2 - 134 100
Learning things to prepare for the education in schools (Counting, the alphabet, etc.)
74,4 4,5 14,3 3,8 3 133 100
Helping take care of someone sick at home 94 1,5 3,7 0,7 - 134 100
Help with the work where we migrate for seasonal work 83,6 6,7 8,2 1,5 - 134 100
Attending kindergarten 96,3 1,5 0,7 1,5 134 100
Engaging in activities like art (painting), music 65,7 9,7 19,4 5,2 - 134 100
Neve
r
Rare
ly
Som
etim
es
Often
Alw
ays
%
Total
Frequency
* People who did not answer this question were not included in the table.
No Enrollment(Percentage)

159
Table 107. Descriptive statistics for the frequency of activities children engage in during a typical day in 2007-2008 academic year when they were out of school in
the no enrollment group
N AverageStandard Deviation
Minimum Maximum
Looking after siblings at home 134 1,67 1,02 1 5
Playing at home/in the street 134 3,96 1,13 1 5
Playing computer games 134 1,02 0,19 1 3
Selling things in the street like tissues
134 1,00 0,00 1 1
Helping with household chores 134 1,63 0,97 1 5
Helping with the work in the garden/field
134 1,34 0,74 1 4
Learning things to prepare for the education in schools
133 1,56 1,06 1 5
Helping take care of someone sick at home
134 1,11 0,47 1 4
Help with the work where we go to work as seasonal workers
134 1,28 0,68 1 4
Attending kindergarten 134 1,11 0,60 1 5
Engaging in activities like art (painting), music
134 1,64 0,97 1 4

160
3.15.4. Examination of children’s activities during a typical day as a function of different variables in the no enrollment group
How children spend their typical day when they were out of school was examined for boys and girls in the no enrollment group as well. Examination of sex differences revealed statistically significant results. Findings suggested that in this group, 26,2% of the girls and 4% of the boys were looking after their younger siblings, (χ2(1)=10.50, p<0.005). There was no statistically significant difference between boys and girls in terms of selling things in the streets such. An examination of the number of boys and girls helping with household chores revealed that 32,1% of the girls and 8% of the girls were doing such tasks at home. This difference between boys and girls was statistically significant, (χ2(1)=10.28, p<0.005). suggesting that there were more girls than boys who would do household chores and help around the house in the unenrolled children’s group. Examination of child sex differences in terms of helping in the field/garden, learning school related subjects, looking after someone
sick at home, helping with the work where the family migrates to do seasonal work, attending kindergarten/preschool, engaging in painting and music did not reveal any statistically significant results.Next, analyses were conducted to determine whether there were differences between urban and rural children in the unenrolled group in terms of various activities children engage in during a typical day. Findings revealed a statistically significant differences for looking after younger siblings, (χ2(1)=4.89, p<0.05), indicating that more children in rural areas (25.8%), were looking after their children than in urban areas (11.1%). Examination of how many rural and urban children played in the streets, played computer games, helping with household chores, learning education related materials, taking care of someone sick at home, helping with work in the place where the family goes for seasonal migrant work, attending kindergarten, and engaging in activities such as painting and music did not reveal any significant differences.
Figure 59. Looking after siblings disaggregated by child sex (%)
Figure 60. Playing at home or in the streets disaggregated by child sex (%)

161
Figure 61. Playing computer games disaggregated by child sex (%)
Figure 62. Helping with household chores disaggregated by child sex (%)
3.16. How influential were the factors contributing to children’s enrollment in school in 2007-2008 academic year3.16.1. Late enrollment groupIn this group, various challenges or limitations were reported to be somewhat influential for not enrolling
children in school. Thinking that their children were too young for school and if they kept the children out of school for another year their children would be better prepared for school was also reported to be an important factor contributing to delaying children’s enrollment. Other factors such as safety problems at school or transportation problems, or helping the family with various chores at home were also reported (Table 108).

162
Table 108. How influential were the factors contributing to children’s enrollment in schools in 2007-2008 academic year in the late enrollment group*
(Late enrollment) (%)
We had very limited financial opportu-nities to enroll the child in school last year
37,9 26,8 13,8 7,4 14,1 958 100
We thought the child was too young to enroll in school last year
18,9 36,3 20,1 5,3 19,4 950 100
We felt that the child would have a lot of difficulties because of being physically weak and skinny
9,3 16,4 28,5 7,9 37,9 956 100
We thought the child would develop better and be more successful in school if we waited another year
6,1 23,5 18,3 7,9 44,3 958 100
Child did not want to attend school the previous year 3,2 5,5 14,2 21,9 55,3 951 100
Child was either sick last year or was getting sick too often 2,7 2,6 1,8 18,5 74,4 953 100
Last year, transportation opportunities to school were very limited 2,3 6,4 17,7 14,3 59,3 955 100
Child was afraid of going to school last year 1,9 3,4 12,0 21,6 61,0 957 100
We migrated to somewhere else as a family to work as seasonal workers 1,0 0,5 6,7 14,4 77,3 958 100
Child was uninterested in school last year 0,9 6,3 11,6 22,8 58,4 956 100
Last year there were security problems in the road to school 0,9 1,6 4,3 19,4 73,8 957 100
Last year there was no school where we lived 0,7 1,0 3,0 17,6 77,5 953 100
Last year there were security problems at the school 0,7 0,7 3,8 19,0 75,8 955 100
We wanted the child to go to school with the sibling who is a year younger 0,5 0,7 1,3 16,6 80,9 958 100
Last year the child was supposed to help with the work in the field / garden 0,3 0,8 7,2 17,9 73,7 953 100
We had just moved here last year, so we were unable to register the child to school
0,3 0,3 2,9 16,1 80,3 956 100
The child did not want to separate from the mother last year 0,2 0,8 5,9 17,1 76,0 956 100
The child had to work and earn money last year 0,2 0,1 1,7 19,6 78,4 957 100
It w
as v
ery
influ
entia
l
It w
as
influ
entia
l
It w
as
som
ewha
t in
fluen
tial
It w
as n
ot
influ
entia
l
It w
as n
ot
influ
entia
l at
all
%
Total**
Frequency

163
Last year the child needed to help at home with the housework (washing, cleaning, looking after younger siblings, etc.)
0,1 0,3 4,8 20,7 74,1 958 100
Last year, around the time school started, a family member fell ill 0,1 0,2 0,2 16,7 82,8 958 100
Last year, a family member passed away around the time school started 0,1 0,2 0,3 15,0 84,3 958 100
Last year, the child had to take care of somebody sick in the household 0,0 0,1 0,6 15,1 84,2 959 100
Last year the child was not toilet trained 0,0 0,1 2,5 17,8 79,6 956 100
It w
as
very
in
fluen
tial
It w
as
influ
entia
l
It w
as
som
ewha
t in
fluen
tial
It w
as n
ot
influ
entia
l
It w
as n
ot
influ
entia
l at
all
%
Total**
Frequency
Table 108 Continued
3.16.2. No enrollment groupOf those 134 parents in this group who responded to this question, 120 of them reported that financial difficulties or limitations were among the reasons that prevented their children from enrolling in school. Following this were transportation problems, safety, thinking that the child was too young, and the child having a disability were listed as reasons contributing to children not enrolling in school the previous year in the unenrolled group (Table 109).
3.16.3. Value indexes of the reasons that were identified as factors contributing to children not enrolling in school the previous year3.16.3.1 Late enrollment group
Participants were asked to rate how influential were the reasons that they listed as factors contributing to why they did not enroll their children in school
the previous year (Table 110). Results showed that financial difficulties were rated as more important for not enrolling their children in school in the late enrollment group. Following this were factors such as thinking the child was too young the previous year for school, and thinking that the child’s physical development was too underdeveloped and the child would develop better if they waited for a year listed as more important factors contributing to not sending the child to school.
* People who did not answer this question were not included in the table.** More than one answer was given.
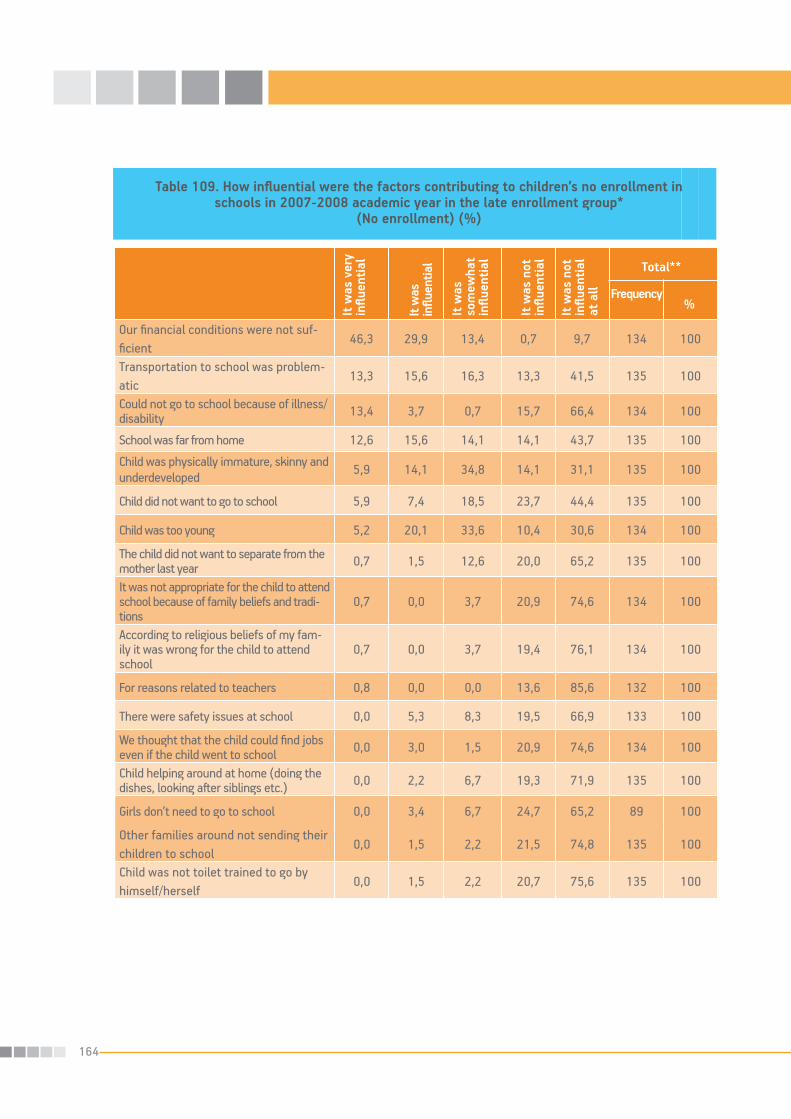
164
Our financial conditions were not suf-ficient
46,3 29,9 13,4 0,7 9,7 134 100
Transportation to school was problem-atic
13,3 15,6 16,3 13,3 41,5 135 100
Could not go to school because of illness/disability 13,4 3,7 0,7 15,7 66,4 134 100
School was far from home 12,6 15,6 14,1 14,1 43,7 135 100
Child was physically immature, skinny and underdeveloped 5,9 14,1 34,8 14,1 31,1 135 100
Child did not want to go to school 5,9 7,4 18,5 23,7 44,4 135 100
Child was too young 5,2 20,1 33,6 10,4 30,6 134 100
The child did not want to separate from the mother last year 0,7 1,5 12,6 20,0 65,2 135 100
It was not appropriate for the child to attend school because of family beliefs and tradi-tions
0,7 0,0 3,7 20,9 74,6 134 100
According to religious beliefs of my fam-ily it was wrong for the child to attend school
0,7 0,0 3,7 19,4 76,1 134 100
For reasons related to teachers 0,8 0,0 0,0 13,6 85,6 132 100
There were safety issues at school 0,0 5,3 8,3 19,5 66,9 133 100
We thought that the child could find jobs even if the child went to school 0,0 3,0 1,5 20,9 74,6 134 100
Child helping around at home (doing the dishes, looking after siblings etc.) 0,0 2,2 6,7 19,3 71,9 135 100
Girls don’t need to go to school 0,0 3,4 6,7 24,7 65,2 89 100
Other families around not sending their children to school
0,0 1,5 2,2 21,5 74,8 135 100
Child was not toilet trained to go by himself/herself
0,0 1,5 2,2 20,7 75,6 135 100
It w
as v
ery
influ
entia
l
It w
as
influ
entia
l
It w
as
som
ewha
t in
fluen
tial
It w
as n
ot
influ
entia
l
It w
as n
ot
influ
entia
l at
all
%
Total**
Frequency
Table 109. How influential were the factors contributing to children’s no enrollment in schools in 2007-2008 academic year in the late enrollment group*
(No enrollment) (%)

165
We had just moved here last year, so we were unable to register the child to school
0,0 1,5 4,5 21,8 72,2 133 100
We did not believe female children needed to go to school 0,0 1,1 6,4 26,6 66,0 94 100
Even if the child went to school, the child was still going to live in the village 0,0 0,7 1,5 19,4 78,4 134 100
Our child needed to work and earn money instead of attending school 0,0 0,0 6,7 19,3 74,1 135 100
Child needed to work in the field/garden 0,0 0,0 10,4 19,3 70,4 135 100
Schools teaching children in mixed-sex classrooms 0,0 0,0 0,7 22,2 77,0 135 100
We believe that besides learning to read and write, nothing taught at school was worthwhile
0,0 0,0 3,0 19,3 77,8 135 100
Child was going to get married anyway, there was no need for school 0,0 0,0 3,0 23,0 74,1 135 100
Child had an arranged marriage (“beşik kertmesi” the promise at the cradle) and the family the child was going to marry into did not approve school
0,0 0,0 0,0 20,0 80,0 90 100
In order for her brother to attend school, the female child was not send to school 0,0 0,0 0,0 19,1 80,9 89 100
The child would learn how to read and write during military service, so there was no need to attend school
0,0 0,0 0,0 11,9 88,1 59 100
It w
as v
ery
influ
entia
l
It w
as
influ
entia
l
It w
as
som
ewha
t in
fluen
tial
It w
as n
ot
influ
entia
l
It w
as n
ot
influ
entia
l at
all
%
Total**
Frequency
Table 109. Continued
3.16.3.2. No enrollment group
Parents whose children were still unenrolled in schools were asked to report how some of the predetermined factors contributed to not enrolling children in school. Parental ratings indicated that it was clear that financial limitations were a significant factor for
parents to not enroll their children in school. Following this were reasons such as thinking the child was too young, the child was physically underdeveloped and the school was too far from the home.
* People who did not answer this question were not included in the table.** More than one answer was given.
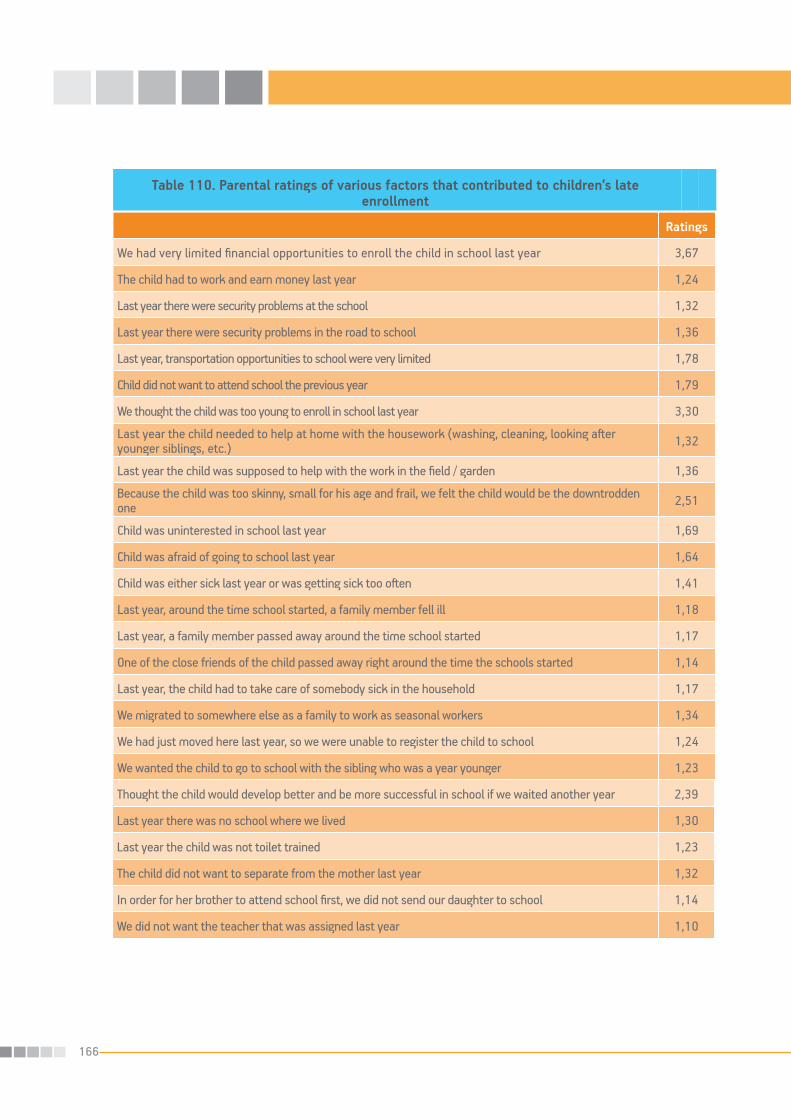
166
Table 110. Parental ratings of various factors that contributed to children’s late enrollment
Ratings
We had very limited financial opportunities to enroll the child in school last year 3,67
The child had to work and earn money last year 1,24
Last year there were security problems at the school 1,32
Last year there were security problems in the road to school 1,36
Last year, transportation opportunities to school were very limited 1,78
Child did not want to attend school the previous year 1,79
We thought the child was too young to enroll in school last year 3,30
Last year the child needed to help at home with the housework (washing, cleaning, looking after younger siblings, etc.) 1,32
Last year the child was supposed to help with the work in the field / garden 1,36
Because the child was too skinny, small for his age and frail, we felt the child would be the downtrodden one 2,51
Child was uninterested in school last year 1,69
Child was afraid of going to school last year 1,64
Child was either sick last year or was getting sick too often 1,41
Last year, around the time school started, a family member fell ill 1,18
Last year, a family member passed away around the time school started 1,17
One of the close friends of the child passed away right around the time the schools started 1,14
Last year, the child had to take care of somebody sick in the household 1,17
We migrated to somewhere else as a family to work as seasonal workers 1,34
We had just moved here last year, so we were unable to register the child to school 1,24
We wanted the child to go to school with the sibling who was a year younger 1,23
Thought the child would develop better and be more successful in school if we waited another year 2,39
Last year there was no school where we lived 1,30
Last year the child was not toilet trained 1,23
The child did not want to separate from the mother last year 1,32
In order for her brother to attend school first, we did not send our daughter to school 1,14
We did not want the teacher that was assigned last year 1,10

167
3.16.4. Regional issues and problems and not enrolling in school on timeIn the focus group meetings, during the discussion of the issues that are unique problems of the region, participants talked about how Turkish is not a native language for some of the children in the region and they learn Turkish after they start school. The discussants emphasized the importance of language and some stated that some of these children have had some negative attitudes toward school or felt shy or embarrassed to go to school because they did not speak Turkish. One particular participant argued that it was not always directly related to not enrolling in schools on time, rather even if these children enrolled in schools they wasted their time in schools without being able to understand anything. Although participants emphasized the importance of traditional and religious beliefs, some discussants reported that these religious and traditional beliefs were not as influential as other factors. Discussants argued that traditional and religious beliefs were more influential in controlling the lives of girls and their education. In fact, as the girls get older, mature and develop, effects of these elements on the lives of
girls were becoming even more detrimental. Thus, as a result of the effects of such beliefs, if the families were going to enroll their daughters in schools, they would want their daughters to go to school earlier and be out of the school system before puberty. Participants in focus group meetings concluded that, although these factors were contributing to children’s, particularly girls’ unenrollment in school, in some families these factors were influential in familial decisions to enroll their children in schools early.
3.17. Being informed of the financial support state provides for enrolling girls in schoolsBeing informed of the financial support the state provides was 47,5% in the late enrollment group, whereas in the unenrolled group this rate was 34,7%. As the numbers indicate the levels of not being informed of such state support was very high in both groups. This could indicate a possible limitation in the state’s end to get the information known to all the families at risk.
Figure 63. Whether parents were informed of the financial support state provides for enrolling girls in schools (%)
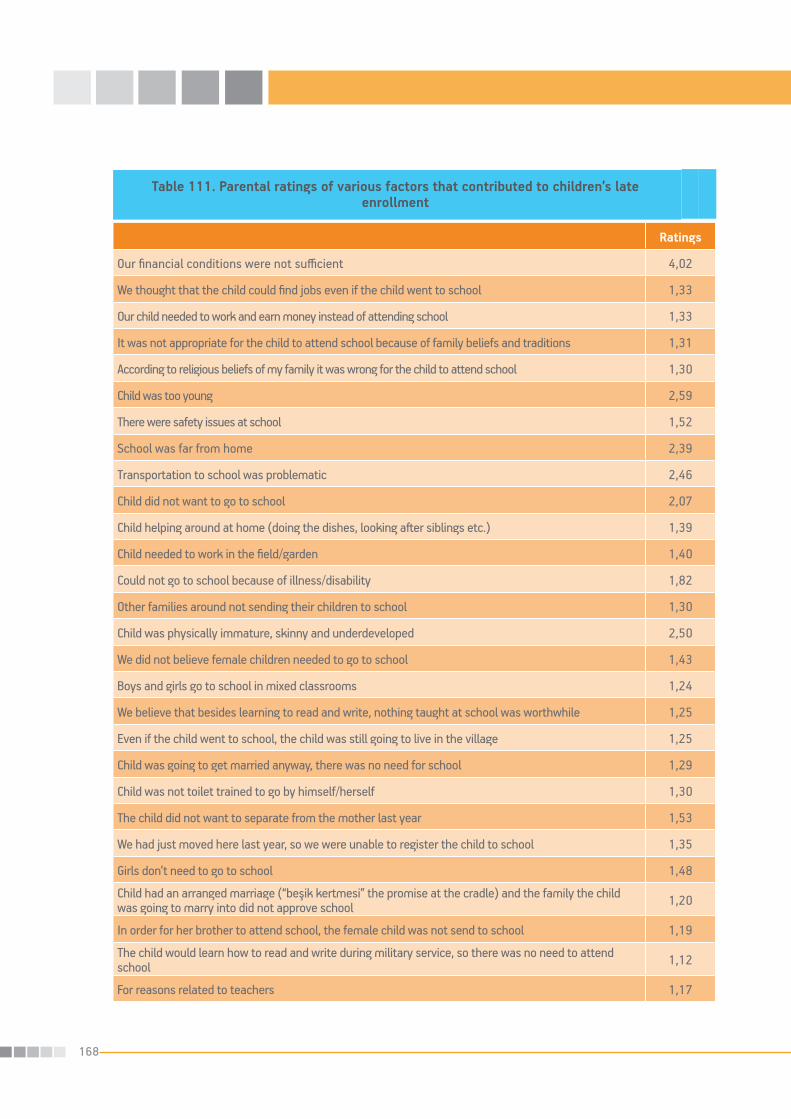
168
Table 111. Parental ratings of various factors that contributed to children’s late enrollment
Ratings
Our financial conditions were not sufficient 4,02
We thought that the child could find jobs even if the child went to school 1,33
Our child needed to work and earn money instead of attending school 1,33
It was not appropriate for the child to attend school because of family beliefs and traditions 1,31
According to religious beliefs of my family it was wrong for the child to attend school 1,30
Child was too young 2,59
There were safety issues at school 1,52
School was far from home 2,39
Transportation to school was problematic 2,46
Child did not want to go to school 2,07
Child helping around at home (doing the dishes, looking after siblings etc.) 1,39
Child needed to work in the field/garden 1,40
Could not go to school because of illness/disability 1,82
Other families around not sending their children to school 1,30
Child was physically immature, skinny and underdeveloped 2,50
We did not believe female children needed to go to school 1,43
Boys and girls go to school in mixed classrooms 1,24
We believe that besides learning to read and write, nothing taught at school was worthwhile 1,25
Even if the child went to school, the child was still going to live in the village 1,25
Child was going to get married anyway, there was no need for school 1,29
Child was not toilet trained to go by himself/herself 1,30
The child did not want to separate from the mother last year 1,53
We had just moved here last year, so we were unable to register the child to school 1,35
Girls don’t need to go to school 1,48
Child had an arranged marriage (“beşik kertmesi” the promise at the cradle) and the family the child was going to marry into did not approve school 1,20
In order for her brother to attend school, the female child was not send to school 1,19
The child would learn how to read and write during military service, so there was no need to attend school 1,12
For reasons related to teachers 1,17

169
3.17.1. Examination of being informed of the financial support state provides for girls’ education as a function of different variablesExamination of the rates of being informed of the financial support for girls’ education in different provinces revealed interesting results. It was as high as 78.6% in Bitlis and 69.5% in Ağrı and as low as 6.7%
in Gümüşhane and 1.4% in Şırnak. These differences among the provinces were statistically significant, (χ2(9)=129.04, p<0.001). Bitlis had the most parents who knew about the state support provided for girls’ education and Şırnak had the highest number of parents who were not informed of such state support
Examination of how parents were informed of state support for girls’ education as a function of fathers’ occupation, it was found that those who reported themselves to be in administrative positions all knew about this. Examination of the income levels revealed that those who earned 751 TL and above had the fewest number of parents who were informed of the state support available. There was not much difference for the other income levels. In addition, urban-rural
differences were examined for the group of unenrolled children. The findings revealed that those who lived in urban areas (66.7%) were slightly more informed than those who lived in rural areas (63.6%). (See Figures 64 & 65).
Total
Table 112. Examination of being informed of the financial support state provides for girls’ education disaggregated by the province that they live in (%)
(Late enrollment)
Frequency % Frequency % Frequency %
Ağrı 36 30,5 82 69,5 118 100
Bitlis 9 21,4 33 78,6 42 100
Diyarbakır 82 43,9 105 56,1 187 100
Gümüşhane 14 93,3 1 6,7 15 100
Hakkâri 14 51,9 13 48,1 27 100
Muş 43 71,7 17 28,3 60 100
Osmaniye 37 64,9 20 35,1 57 100
Şanlıurfa 122 54,5 102 45,5 224 100
Şırnak 70 98,6 1 1,4 71 100
Van 76 48,4 81 51,6 157 100
No, I was not informed Yes, I was informed
Late Enrollment: χ2: 129,036, degrees of freedom:9 p=0,000

170
Table 113. Examination of being informed of the financial support state provides for girls’ education disaggregated by the fathers’ occupation
(Late enrollment)
Frequency % Frequency % Frequency %
Farming-livestock 79 64,2 44 35,8 123 100
Retired, not working 4 57,1 3 42,9 7 100
Small business/trainer 15 50,0 15 50,0 30 100
Civil servant 14 60,9 9 39,1 23 100
Operates medium/large scale opera-tions, employer 2 66,7 1 33,3 3 100
Self-employed/Freelancer 69 62,7 41 37,3 110 100
Skilled worker 29 61,7 18 38,3 47 100
Unskilled labor work 93 35,5 169 64,5 262 100
Administrator 0 0,0 1 100 1 100
Seasonal worker in the city they live in 4 57,1 3 42,9 7 100
Travelling to other cities for seasonal work 17 60,7 11 39,3 28 100
Owns estate 26 53,1 23 46,9 49 100
Unemployed 132 56,7 101 43,3 233 100
Student 3 60,0 2 40,0 5 100
No, I was not informed Yes, I was informed Total

171
Financial support Frequency % Frequency % Frequency %
200 TL and below 97 49,5 99 50,5 196 100
201 - 300 TL 69 52,3 63 47.7 132 100
301 - 400 TL 78 53,4 68 46,6 146 100
401 - 500 TL 78 56,5 60 43,5 138 100
501 - 600 TL 60 45,8 71 54,2 131 100
601 - 750 TL 35 45,5 42 54,5 77 100
751 TL and above 77 63,1 45 36,9 122 100
No, I am not informed Yes, I am informed Total
Table 114. Examination of being informed of the financial support state provides for girls’ education disaggregated by the total incomes of the families
(Late enrollment)
Figure 65. Examination of being informed of the financial support state provides for girls’ education disaggregated by living in urban
and rural areas
Figure 64. Being informed of textbooks being given free of charge disaggregated by living
in rural and urban areas

172
3.17.2. Examination of receiving the financial support state provides for girls’ educationThose who stated that they were informed of state financial support for girls’ education were asked to report whether they were receiving support. Of those who were asked, 44.2% of reported receiving support. In the late enrollment group, when this was examined as a function of living in rural or urban areas, it was found that 48.7% of the families living in rural areas and 41% of the families living in the urban areas were receiving financial support.
Examination of different provinces revelaed that most parents who took advantage of state support lived in Hakkâri (See Appendix Table 42). Having received state support for girls’ education varied as a function of family income levels. Those who took advantage of this support were most likely to have an income between 301 – 400 TL and 501 – 600 TL. This difference was statistically significant, (χ2(6)=25.466, p<0.05) (See Appendix Table 43). Distribution of receiving state support disaggregated by father’s occupation can be found in Table 115.
3.17.3. Contributions of financial supports received from the state to enrollment of children in schoolsParticipants were asked whether aid received was influential in decisions to enroll their children in schools, and 61.7% of the participants indicated that it was influential in their decision making process. This finding indicates that it is important to continue to provide assistance.
Those who stated that they did not know the state provided financial support for families who were asked to report whether they would enroll their daughters in schools if they were informed of such state support. Of those related participants, 94,4% stated their answers positively. As it was discussed earlier, it becomes clear that the news about such supports need to be delivered to families more effectively. In fact, this one factor seemed to be singlehandedly solving the problem of not enrolling children in school for the families in the late enrollment group who were eligible to receive such a support the previous year.
Figure 66. Examination of receiving the financial support state provides for girls’ education (Late enrollment, Base: 455 people) (This question was asked to those who reported that they were

173
Table 115. Examination of receiving financial support the state provides for girls’ education disaggregated by fathers’ occupation (Late Enrollment)
Frequency % Frequency % Frequency %
Farming / livestock 30 68,2 14 31,8 44 100
Retired, does not work 3 100 0 0,0 3 100
Small business/trading 13 86,7 2 13,3 15 100
State employee/civil servant 7 77,8 2 22,2 9 100
Operates medium/large scale operations, employer 1 100 0 0,0 1 100
Self-employed/freelancer 21 51,2 20 48,8 41 100
Skilled worker 12 66,7 6 33,3 18 100
Unskilled labor work 89 52,7 80 47,3 169 100
Administrator 1 100 0 0,0 1 100
Seasonal worker in the city they live in 2 66,7 1 33,3 3 100
Travelling to other cities for seasonal work 7 63,6 4 36,4 11 100
Owns estate 18 78,3 5 21,7 23 100
Unemployed 41 40,6 60 59,4 101 100
Student 1 50,0 1 50,0 2 100
No, I am not informed Yes, I am informed Total
In focus group meetings, discussants often emphasized the fact that financial support helps families enroll their children in school. For example, they indicated conditional cash transfers helped families whose difficulties in sending their children to schools were primarily related to their finances. This, they believed, helped families send their children in school on time as well. Participants reported that they themselves directly witnessed mothers bringing their daughters to school to collect money given through
the program of conditional cash transfer. On the other hand, it was also discussed that not all parents in all the provinces knew about this program, and as a result, children who could be in schools because of this program are unfortunately out of schools because they do not know there is such a program.
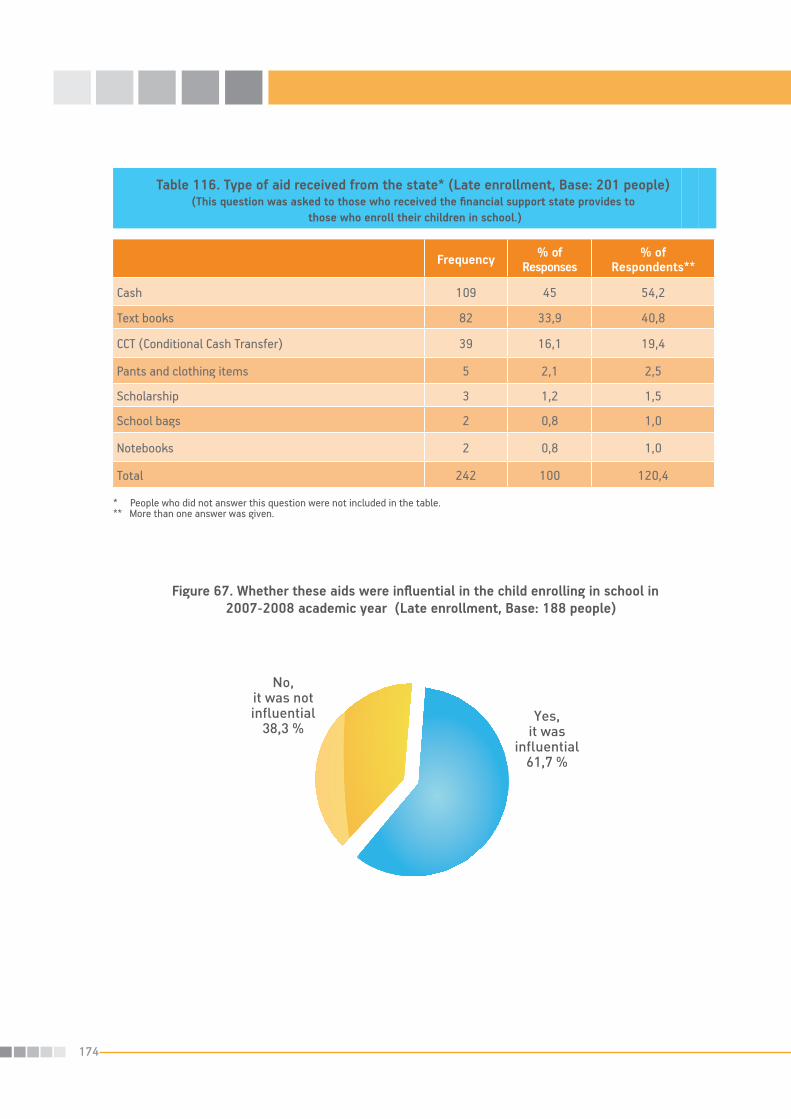
174
Table 116. Type of aid received from the state* (Late enrollment, Base: 201 people)(This question was asked to those who received the financial support state provides to
those who enroll their children in school.)
Frequency % of Responses
% of Respondents**
Cash 109 45 54,2
Text books 82 33,9 40,8
CCT (Conditional Cash Transfer) 39 16,1 19,4
Pants and clothing items 5 2,1 2,5
Scholarship 3 1,2 1,5
School bags 2 0,8 1,0
Notebooks 2 0,8 1,0
Total 242 100 120,4
Figure 67. Whether these aids were influential in the child enrolling in school in 2007-2008 academic year (Late enrollment, Base: 188 people)
* People who did not answer this question were not included in the table.** More than one answer was given.

175
Figure 68. Whether being informed of this aid contribute to beliefs about sending girls in schools (Late enrollment, Base: 36 people)
Another important finding that came out of semi-structured interviews is related to the fee some schools are taking during the registration period to enroll children. Even though officially there is no registration fee and schools cannot legally take such payments from parents, participants indicated that schools continue to take money from the parents under the name of donation. Participants stated that this really hurts a lot of the families who are experiencing financial difficulties and cannot send their children to schools because of these difficulties. Moreover, it was also reported that schools take this money from some parents while they don’t take such a payment from others, simply based on arbitrary procedures or personal preferences. This influences the families’ perceptions of schools negatively
3.17.4. Factors that would contribute to families enrolling their children in school in the near futureParents were asked to speculate on what they would need to see have changed in terms of opportunities of living conditions in order for them to enroll their
children in school. Examination of the child related factors contributing positively to decisions about enrolling children in schools, 31,6% of the families in the unenrolled group reported that financial factors had prevented them from enrolling their children, and their decisions were unrelated to factors related to children themselves. As a result, as long there is no change in their financial situations, it is difficult to determine what will happen to these children and if they will ever go to school. Of those parents, 21,8% reported that they were going to enroll their children in school anyway the upcoming year, however, it is also difficult to determine how sincere these families were in their answers since they were already going to enroll their children in school after keeping their children out of school for two years in a row.
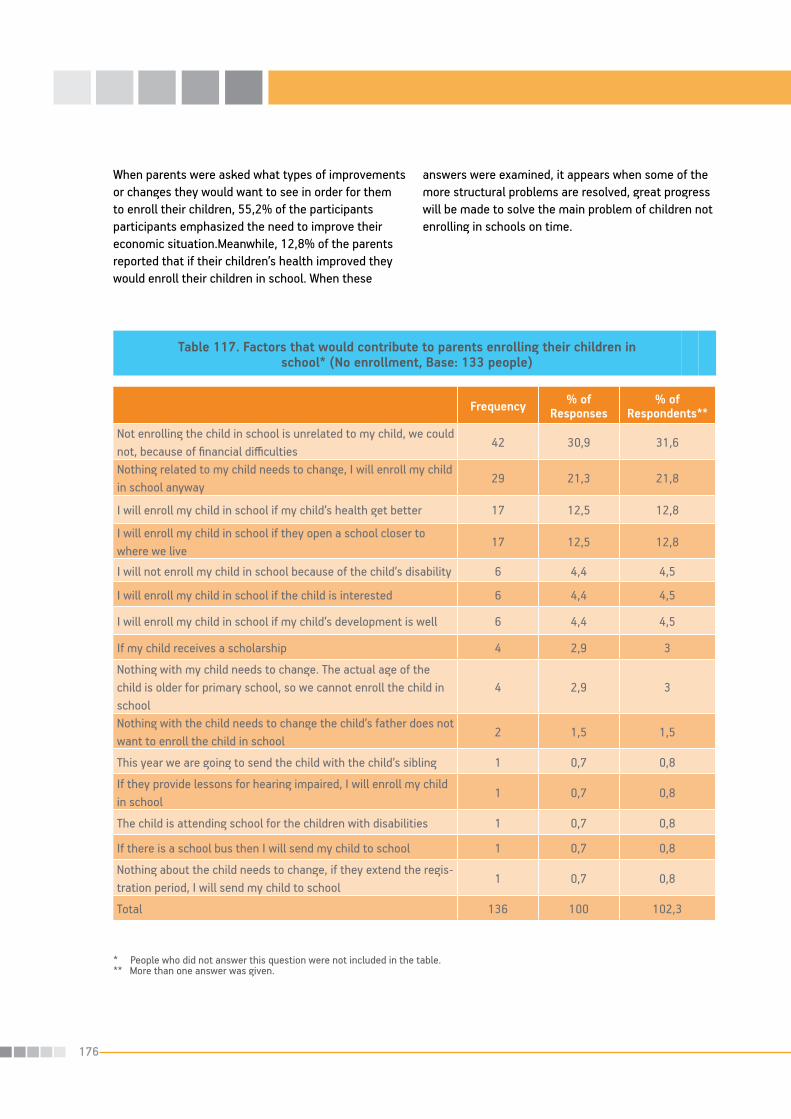
176
Table 117. Factors that would contribute to parents enrolling their children in school* (No enrollment, Base: 133 people)
Frequency % of Responses
% of Respondents**
Not enrolling the child in school is unrelated to my child, we could not, because of financial difficulties
42 30,9 31,6
Nothing related to my child needs to change, I will enroll my child in school anyway
29 21,3 21,8
I will enroll my child in school if my child’s health get better 17 12,5 12,8
I will enroll my child in school if they open a school closer to where we live
17 12,5 12,8
I will not enroll my child in school because of the child’s disability 6 4,4 4,5
I will enroll my child in school if the child is interested 6 4,4 4,5
I will enroll my child in school if my child’s development is well 6 4,4 4,5
If my child receives a scholarship 4 2,9 3
Nothing with my child needs to change. The actual age of the child is older for primary school, so we cannot enroll the child in school
4 2,9 3
Nothing with the child needs to change the child’s father does not want to enroll the child in school
2 1,5 1,5
This year we are going to send the child with the child’s sibling 1 0,7 0,8
If they provide lessons for hearing impaired, I will enroll my child in school
1 0,7 0,8
The child is attending school for the children with disabilities 1 0,7 0,8
If there is a school bus then I will send my child to school 1 0,7 0,8
Nothing about the child needs to change, if they extend the regis-tration period, I will send my child to school
1 0,7 0,8
Total 136 100 102,3
* People who did not answer this question were not included in the table.** More than one answer was given.
When parents were asked what types of improvements or changes they would want to see in order for them to enroll their children, 55,2% of the participants participants emphasized the need to improve their economic situation.Meanwhile, 12,8% of the parents reported that if their children’s health improved they would enroll their children in school. When these
answers were examined, it appears when some of the more structural problems are resolved, great progress will be made to solve the main problem of children not enrolling in schools on time.
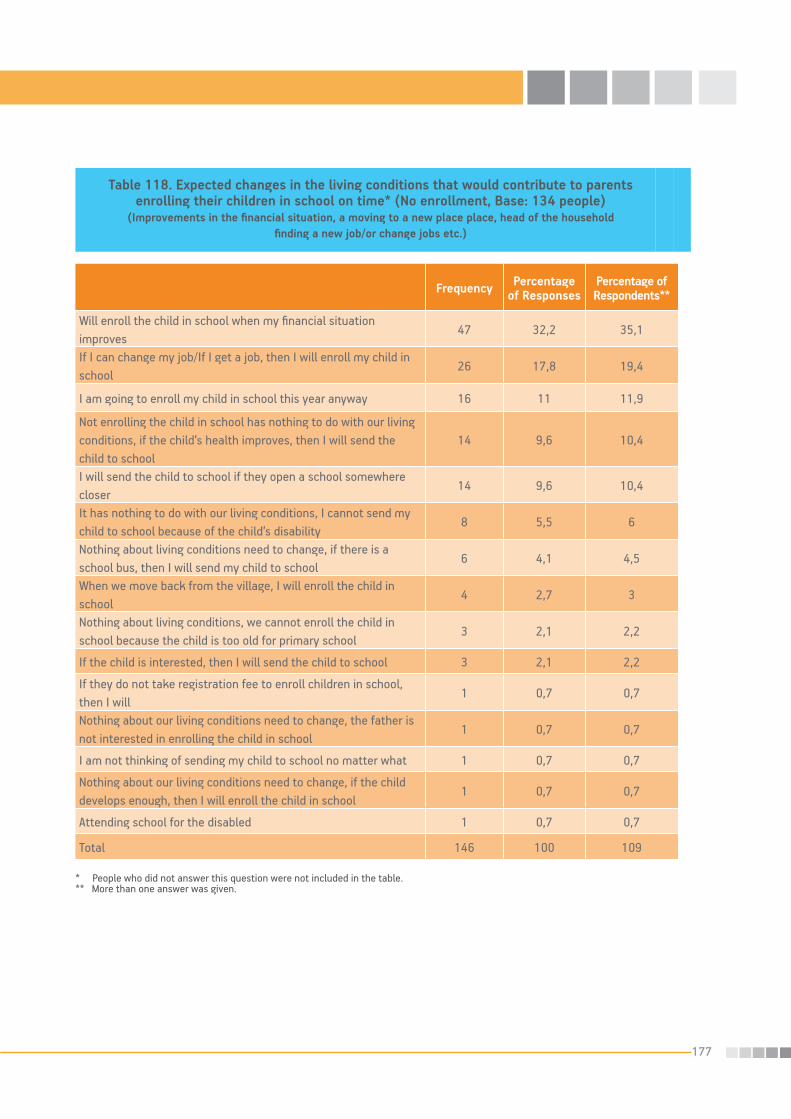
177
Table 118. Expected changes in the living conditions that would contribute to parents enrolling their children in school on time* (No enrollment, Base: 134 people)
(Improvements in the financial situation, a moving to a new place place, head of the household finding a new job/or change jobs etc.)
Frequency Percentage of Responses
Percentage of Respondents**
Will enroll the child in school when my financial situation improves
47 32,2 35,1
If I can change my job/If I get a job, then I will enroll my child in school
26 17,8 19,4
I am going to enroll my child in school this year anyway 16 11 11,9
Not enrolling the child in school has nothing to do with our living conditions, if the child’s health improves, then I will send the child to school
14 9,6 10,4
I will send the child to school if they open a school somewhere closer
14 9,6 10,4
It has nothing to do with our living conditions, I cannot send my child to school because of the child’s disability
8 5,5 6
Nothing about living conditions need to change, if there is a school bus, then I will send my child to school
6 4,1 4,5
When we move back from the village, I will enroll the child in school
4 2,7 3
Nothing about living conditions, we cannot enroll the child in school because the child is too old for primary school
3 2,1 2,2
If the child is interested, then I will send the child to school 3 2,1 2,2
If they do not take registration fee to enroll children in school, then I will
1 0,7 0,7
Nothing about our living conditions need to change, the father is not interested in enrolling the child in school
1 0,7 0,7
I am not thinking of sending my child to school no matter what 1 0,7 0,7
Nothing about our living conditions need to change, if the child develops enough, then I will enroll the child in school
1 0,7 0,7
Attending school for the disabled 1 0,7 0,7
Total 146 100 109
* People who did not answer this question were not included in the table.** More than one answer was given.

178
When families were asked earlier to report what the most important reasons were for not enrolling their children in schools two years in a row in the unenrolled group, financial difficulties and access and transportation to schools were the most important reasons. Similar findings emerged when families were asked to speculate on what they expected from the state in order for them to enroll their children in schools. Of those respondents who answered the question, almost all of them reported that they expected financial support from the state, or they hoped the registration fees would no longer be asked for, or the schools would not be too far to reach. The responses of the participants living both in urban and rural areas were remarkably similar. Of those parents who answered the question in the unenrolled group, 58,5% of them reported that they are thinking about enrolling their children in school the upcoming year. The remaining 17,3% reported that they would enroll
their children in school even later, and the remaining 23,7% reported that they were not going to enroll their children in school at all. The first group of people who reported they would enroll their children in school reported that they would do it because they were finally convinced that it was time their children went to school, because they would move down to the district, and the child was finally interested. The second group that reported they would enroll their children in school later in the future reported that if the family received financial support, or if their children’s health improved they would eventually enroll their children in school. The third group who stated that they would not enroll their children in school at all reported reasons such as that their finances were not good, their children had a disability or their children were not interested in school.
Table 119. Expectations from the state to enroll children in school on time* (No enrollment)
Frequency %
Provide scholarships 42 32,8
Not just textbooks, provide free school materials 42 32,8Abolish the fees schools take for registration when we are enrolling our chil-dren in school
21 16.4
I cannot enroll my child in school because of the child’s disability, the state does not have to do anything
13 10.2
Opening a school closer to where we live 3 2.3
Nothing needed, I will enroll my child in school anyway 2 1.6
The state does not have to do anything, I am not going to send my child to school
2 1.6
Child is not interested in school 1 0.8
Resolve transportation problems 1 0.8
If financial support is provided, I would enroll the child in school for children with disabilities
1 0.8
Total 128 100
* People who did not answer this question were not included in the table.

179
Figure 69. Whether the parents are interested in enrolling their children in school in the unenrolled group (Late enrollment, Base: 135 people)
w not
w
notw
Parents who claimed that they would enroll their children in school the upcoming year were asked to report the factors that contributed to them making such a decision. Of those parents, 51,9% reported that their children were finally at the age to enroll in
school, 15.6% reported moving to the district, 5.2% reported improvements in their financial situation, and 6.5% reported that they were receiving financial support from the state.

180
Those 19 parents, who reported that they would enroll their children in schools sometime in the future were
asked when they were thinking about enrolling their children in school. Results are listed below.
Table 120. Factors influencing the decision to enroll children in school the following year* (No enrollment, Base: 77 people)
(This question was asked to those who indicated that they would enroll their children in school the following year.)
Frequency Percentage of Responses
Percentage of Respondents**
The child was not at the right age for school 40 50,0 51,9
Because we moved to downtown/Returned from the village 12 15,0 15.6
Because the child wanted it 6 7,5 7,8
Our financial condition improved 4 5,0 5,2
Because the child’s health got better 4 5,0 5,2
Because the child needs to get education 3 3,8 3,9
Because the state provides scholarship 3 3,8 3,9
Because the state will pay for the expenses 2 2,5 2,6
Just having a school is enough, I already want to send my child to school
2 2,5 2,6
Because the registration fee is removed 1 1,3 1,3
Because the child’s sibling is also starting school 1 1,3 1,3
If there is a special education teacher 1 1,3 1,3
Because education is mandated 1 1,3 1,3
Total 80 100 103,9
* People who did not answer this question were not included in the table.** More than one answer was given.

181
Table 121. When would those parents who considering enrolling their children in school in the future would enroll their children in school* (No enrollment)
(This question was asked to those who stated that they were considering enrolling their children in school.)
Frequency %
If our financial situation improves 10 52,6
If financial support is provided 4 21,1
If the child health improves 3 15,8
If a nearby school is built by next year 1 5,3
If financial support is provided, I would send the child to a school for children with disabilities
1 5,3
Total 19 100
* People who did not answer this question were not included in the table.
The answers of 32 parents in the unenrolled group who stated that they would never enroll their children in schools were examined and it was found that again financial difficulties (34,4%) and disability (28,1%) were the main reasons.When the parents in group of unenrolled children were asked whether they knew that the state gives free textbooks to all primary school children, of 126
respondents, 98 of them reported that they were informed of such state support and the remaining 28 reported that they did not. Those who reported that they did not know the state was providing free textbooks were asked if they knew this information if this would help them enroll their children in school, and 21 out of 24 parents reported that they would.
Figure 70. Being informed of free textbook distribution of the state for primary school children (No enrollment, Base: 126 people)
182
3.17.5. Not enrolling in school on time, transportation to school and problems experienced in schoolsQualitative research findings indicate that some of the most important factors contributing to children not enrolling in school on time were limited resources, overcrowded classrooms and teachers who are too busy with everything they have to do at school being unable to screen and identify children who do not enroll in schools on time. According to the teacher participants, student screening work is not completed from one central location and this causes difficulties with completing the work and collecting reliable data. Participants reported that if the screening work improved and the children who do not enroll schools even though they are at the legal age to attend school are identified, they believed that the cases of late enrollment would be minimized. At the same time, when what the teachers discussed about the limitations of the schools are considered, it would be difficult to assume that simple monitoring would be enough to fight and eliminate children not enrolling in school on time. Bussing children to schools or having children go to schools in boarding schools brings very serious complications and difficulties for the families. Particularly, those who live in villages and girls seem to be more negatively influenced. As a result, providing children the opportunity to go to schools in their own villages would be a very important step to take. Considering that in families, especially in the ones with many children, when families are in a situation to choose a child to send to school because of financial difficulties, it appears that the girls are the one who are negatively affected by this choice, it is important to provide financial support to these families.
In focus group meetings, one of the most important reasons for late school enrollment was reported to be the fact that the teachers are left alone in the region in either overcrowded classrooms or in classrooms where multiple grades get education in one classroom with one teacher. Because of limited resources the teachers are unable to go around in the neighborhood and identify which eligible children are out of school. Besides, some participants reported that the teachers would not even want to simply bring more children in
when they had no resources to accommodate even the ones who were already in schools. It was discussed that perhaps having a committee to do the screening work would ease the situation. The participants concluded that the screening of these children was not done sufficiently.
Another important factor contributing to children not enrolling in schools on time was discussed to be YIBOs. Participants reported that YIBOs were not built in very central locations and were very far from where the families lived and families sent their children, particularly girls, to these schools at least a year later. Schools’ being spread apart was seen to be an important problem and it was also reported that families did not want their daughters in either the bussing system or in YIBOs. It was emphasized that this issue was more of a problem for families who had more children going to school at the same time. Having to do this was perceived as an extra load of work by the families and they were simply postponing the enrollment of a child for the following year. This problem was less of an issue in the villages that were close to districts and central districts.
In addition to this, constant changes in the TSI’s address registration system was also causing a lot of problems. The reason for this was that TSI would make all the address changes in late December, however, the families would continue to change their addresses after that time and would be difficult to find. The discussants argued that it would be important to work in coordination with citizenship bureaus.
Participants emphasized repeatedly that the families often go to schools to enroll their children, but their children are denied school enrollment because of the overcrowded classrooms.
During the qualitative interviews and focus group meetings, it was clearly emphasized that the various efforts the state makes to get children to enroll in school at the age determined for school enrollments were helpful. Although the view that these efforts were helpful was pronounced, the majority of the participants emphasized that these efforts were not enough and were very limited (80,6%). When the reasons participants provided for why these efforts

183
were not sufficient were examined, it was found that tradional and conservative values were very resistant to break and this could only be overcome if economic levels of the families were increased. For everything to work, the participants emphasized, all the social stakeholders needed to work together in cooperation, works needed to put families in the center, work needed to be done at institutional levels, and screening and follow-up work needed to be completed with the execution of more strict enforcement. More discussion on these issues included increasing the quality of the teachers, placing more value on teaching profession and protecting them from political ups and downs, getting the help of sociologists and psychologists, and being in direct contact with parents instead of relying on other vehicles such as mukhtars were all emphasized. It was concluded that when all these are accomplished, then more serious progress would be made to overcome the problem of late enrollment.
These were the factors that made the efforts o bring very minimal positive outcomes. As a result, it was openly stated that there needed to be a greater and more organic contact needed to be established between the ones that are affected by the problem and those who are going to provide the services for them. Hence the work needed to be more family centered.
Reasons participants provided for why these efforts were not sufficient were examined, it was found that tradional and conservative values were very resistant to break and this could only be overcome if economic levels of the families were increased. The participants emphasized, all the social stakeholders needed to work together in cooperation, works needed to put families in the center, work needed to be done at institutional levels, and screening and follow-up work needed to be completed with the execution of more strict enforcement. More discussion on these issues included increasing the quality of the teachers, placing more value on teaching profession and protecting them from political ups and downs, getting the help of sociologists and psychologists, and being in direct
contact with parents instead of relying on other vehicles such as mukhtars were all emphasized. It was concluded that when all these are accomplished, then more serious progress would be made to overcome the problem of late enrollment. These were the factors that made the efforts to bring very minimal positive outcomes. As a result, it was openly stated that there needed to be a greater and more organic contact needed to be established between the ones that are affected by the problem and those who are going to provide the services for them. Hence the work needed to be more family centered.
4. CONCLUSIONS, DISCUSSIONS AND RECOMMENDATIONSLate school enrollment is a problem in the 10 provinces in this study. Children who are held out from school may be delayed in terms of academic skills compared to their peers. They may also have emotional problems due to early maturation. It is also expected that children whose school enrollment is late will face challenges in the higher grades. The findings regarding late school entry are quite interesting and mixed. In more developed countries where children have enriched early experiences, no or little differences were found when children who enter school by the enrollment cutoff date and those enter school after some delay are compared. In fact, each group seemed to have advantages in different areas (Montz, 1985; Rabinowitz, 1989). On the other hand, when the levels of development and living conditions in Turkey, and especially in the provinces included in the sample, are considered and the research findings from other countries with similar levels are examined, late school entry appears as a major problem. For example, Wils (2004) conducted research in Mozambique, a developing country, and found that children who are late entrants have low school achievement. Wils (2004) also concluded that children who are late entrants are also at a greater risk for school drop out and have a very slim chance of obtaining higher levels of education. Families that delay children’s school entry are different from families who do not enroll their children. At the same

184
time, even thought there are differences, because of the similarities between these groups in terms of family structures and locations they live in, there are many similarities.
4.1. Structural characteristics of familiesThe families included in the research have similar structural features. Families of children who do not enroll in primary school on time are often from lower socio-economic groups. Both the economic status of the families and parents’ education levels are low. Furthermore, when we examine the family structures of those families with children who are late entrants to school and those who have unenrolled children, we found that the families of unenrolled children are poorer and almost all of the mothers are either uneducated or have very low levels of education. Also, unemployment and employment with low-paid low-skilled jobs are very common. In addition, families living in rural areas face bigger economic challenges than those living in urban areas. Transportation, for example, is a more serious problem for urban families than for rural families. As previously stated, though they are not well represented in the sample, migrant workers face additional problems. In the center of Şanlıurfa province, which was within the scope of this research, there is total of 282,936 people living in 33 neighborhoods, and 44% of these people are agricultural workers. Seasonal migrant workers leave their homes starting in February, and go to 21 different provinces and they do not come back to their homes before November (Şimşek & Koruk, 2008).
4.2. Status of mothers and fathersIt was found that the majority of the women who were included in this research were uneducated. There are a higher percentage of girls in the unenrolled group than in the late enrollment group. The girls in the former group are likely to reach adulthood without having had any formal schooling and will be the mothers in the future who are uneducated and illiterate. Years of negligence of girls and women in the region is discusses by several researchers as factors contributing to no or very little education of girls and women (see, for example, Kavak and Ergen, 2007). Religion and culture are important
forces influencing a family’s decision to enroll or not enroll their children in school. As the findings of the present research illustrate more religious families, for example, are more likely to want girls to leave school before puberty begins. Many of these girls will marry at an earlier age, receive less formal schooling, have an earlier sexual debut, and become pregnant more frequently than girls who remain in school. As a result, their children in the future will face similar problems these girls are facing now. The limited education of mothers appears as one of the most distinctive characteristics encountered in the families of both late school entry children and unenrolled children. However, the situation is more problematic among families of children who are not enrolled in school. The lack of maternal education is a serious risk factor not only in terms of children’s development in the present time, but also in terms of future generations’ inability to adequately benefit from education. When a mother is deprived of education, it creates a serious obstacle to the development of a “culture of education” within the family.
In fact, although fathers have higher levels of education than mothers, the average level of fathers’ education is still quite low. Parental level of education has emerged as a serious factor that influences children’s late school entry. Intervention programs to combat late enrollment must first bring parents to the school and afterward, these parents should be included in school programs, should attend events and be provided with basic education, including, Turkish language courses.
Moreover, considering that fathers are the most influential individuals regarding school enrollment, the awareness activities that target fathers need to receive greater attention. Fathers should be reached at their frequently visited living areas and through their social partners. These partners are mukhtars, religious officials, and community leaders and related others. Meanwhile, it must be ensured that these social partners are first equipped with the right information, act in a coordinated manner and assume an active and responsible role. On this issue, support of local and national media, local managers and education officials should be sought and cooperation should be established. Fathers are usually trying to provide for their families with unskilled agricultural

185
labor and seasonal work. Unemployment rates are very high. Considering that mothers do not generally receive remuneration for their work, which is mainly domestic, and fathers do not hold stable jobs, the majority of families in this study experienced serious financial problems. In line with previous research, poverty and unemployment are important risk factors for school enrollment on time. (Al Qudsi, 2003; Fazlıoğlu & Dersan, 2004; Ravinder, 2007). As Urquiola and Caldero (2006) demonstrated in their study of Latin American countries, timely school enrollment can be positively affected through job creation and the provision of community-based trade schools. In this study, participants indicated that financial assistance was needed to help ensure children enroll on time. In particular, some research participants mentioned that conditional cash transfers encouraged mothers to bring their children to school. This help can be provided when families register both girls and boys on time and it can be encouraging if the amount of financial assistance is increased. It is also important that state makes a better effort to disseminate the information that state provides financial assistance to the families in need when they enroll their children in school.
4.3. Number of children in the family and the preferencesThe number of children is relatively higher among the group of families whose children are not registered on time. When the number of children increases in the family, each additional child makes it more difficult for the other children to access educational opportunities. When parents are forced to decide among children to attend school, boys are usually preferred. Families also prefer to send children to school that they perceive as “more intelligent”. The fact that families make distinctions between “well-developed” and “underdeveloped” children was discussed earlier and deserves greater study. Various studies in the world and in Turkey have established in detail that having too many children in the family affects the education of children adversely (Buchmann, 2000, Rankin & Aytaç, 2006). Therefore, it is important to raise family awareness of “family planning” and various birth control methods should be made more available.
4.4. Age for school enrollment and child’s developmentMany families don’t send their children to school on time because they think their children are too young
for school, or they don’t know the actual age for school enrollment or they miscalculated the age for school enrollment. Most parents think that the school age is 7, meaning, for them the starting age for school is 84 months of age, not 72 months of age. Families should be informed about the age for primary school enrollment by the Ministry of National Education, Provincial and District Directorates of Education and school principals. Screening and monitoring should be carried out through the collaboration of social partners, such as MONE employees, local authorities, health care providers and religious officials. They need to better coordinate and allow for better exchange of information, knowledge and ideas.Some families were not informed about the legal age for school enrollment by the school authorities and it appears that even some teachers had refused to register children because of overcrowded classrooms. Another striking finding was that at times, children were refused school enrollment by school administration with an excuse that the child was too young. The majority of the parents who wanted to enroll their children in the previous year but were denied, noted that they were refused by the school officials because of their children’s age. In the focus group meetings, teachers reported that the school conditions, including inadequate resources and crowded classrooms, made them feel desperate and alone. The stress teachers experienced was often influencing how effectively they were screening children for school enrollment. Thus, the importance of screening of children and the need for awareness-raising activities become more noticeable in dealing with and diminishing the problem of children not enrolling in school on time. Emergency measures need to be taken and new strategies need to be developed in this regard.The findings of this study indicate that parents are deprived of some very basic knowledge or have wrong information related to school enrollment. In this study, parents were misinformed about the age for school entry, parent’s rights to enroll their children even if they miss the enrollment deadline, financial aid provided to families, and that textbooks are provided for all students without cost. In this regard, it is quite important to plan screening work in a way that includes both identifying children who were late in school enrollment and the ones who are at risk for late school enrollment as well as increasing awareness among families and providing accurate information for them concerning school enrollment.

186
Giving teachers active roles in screening studies, and having them cooperate with nurses, midwives and health care workers will be an important move toward ensuring timely school enrollment. In this way, employees of the Ministry of National Education will have the opportunity to access the information about the children recorded by the health workers since the birth of these children. It may prove useful to recruit local high school and university students as volunteers to screen children and educate parents and families. In this regard, NGOs can also be actively involved. However, at this point, it is important to investigate how and when temporary seasonal workers and seasonal migrant workers will be screened and monitored. Particular attention needs to be paid to the fact that awareness-raising efforts alone will not be sufficient in dealing with the problem. While providing awareness and knowledge for the families, it is important to include both screening and monitoring work that continue up through the time the child starts school and attends classes.
As mentioned earlier, since these families are very poor, education is not always their first priority, and in fact, most of the time they are trying to meet their basic needs and necessities. When they deal with these more pressing problems they usually neglect the education of their children. An interesting finding that supports this conclusion is that during the focus group meetings and semi-structured interviews with social stakeholders, parental indifference and ignorance were emphasized. In the interviews conducted with parents, economic difficulties, the age of children and general problems with the schools were more frequently emphasized.
Due to a lack of knowledge concerning school and its processes, families, especially mothers have many misunderstandings about primary school. For example, many families delay school entry for fear that children will be harassed if they enroll on-time. At this point, school administration and teachers need to enlighten families about the purpose of primary schools and what is happening in the daily activities. This kind of awareness is expected to contribute to the solution of the problem. However, nutritional problems and growth retardation is another factor influencing late enrollment. This situation also continues to have negative effects on educational process after school enrollment (Çabuk, Soylu, Kavukçu, Türkmen &
Büyükgebiz, 1999; Çivi & Koruk, 2005; Jukes, 2006). Having a weak and frail child is a source of serious concern for families. Therefore, child screenings should include an expert in child development. If developmental problems are detected, necessary support should be provided either in school or in early childhood institutions. In cases where support is not provided through the school, it may be necessary to provide alternative forms of support, including, for example, the provision of nutrition and health services to families of undernourished, frail and sick children, or children with developmental delays. Indeed, by providing such services to these children at home, it is possible for these children to develop the skills needed for schools and, they can eventually attend schools. When the concerns of families are not based on any realistic problems, and these children are capable of attending school, the people who can convince these families to send their children to school would be the trained professionals such as child development experts, doctors and educators who are evaluating the development of these children. Concerning that these families are already poor and have very limited opportunities, keeping these children at home alone would not be beneficial, if they have actual problems. Therefore, having experts see these children and assess their development could be the only chance these children would ever get to be evaluated by experts. In fact, research clearly states that the probability of encountering the problems of child malnutrition and growth retardation is higher in poor families (Amante, Van Houten, Grieve, Bader, & Margules, 1977; Nails & Koruk, 2005, Gabriele & Schettino, 2008; Jukes, 2006).
Another finding related to this situation is the information about how these children spent their time when they did not go to school. As the families stated, children spent their time “playing” without any educational activities that can support their physical, cognitive, and social-emotional development. On the other hand, girls in late enrollment and unenrolled groups, especially the girls from unenrolled groups, help with housework and do more domestic work than do boys. There is a false belief in families in this region that girls who held domestic responsibilities in the early years can handle the burden when they grow up.

187
4.5. Health and disability statusThe health status of children is another important reason for late school enrollment. The fact that the rate of children with disabilities is higher in the group of unenrolled children suggests that there is still a tremendous amount of work to do in Turkey to integrate these children into the public school system. What is more surprising is that, according to the findings of this research, health problems and disabilities these children face are not so severe that they should prevent these children from attending school. However, it is important to note that the physical conditions of schools and the teaching staff are not prepared to meet the needs and to facilitate the attendance of such children. It appears to be very difficult to solve this problem unless schools and the educational system in a broader sense take into account the individual differences of children, adapt more “child-friendly school” views, and provide teachers with the necessary training. Regardless, the fact that these children have the right to education cannot be ignored. Therefore, the issue must be handled seriously.
4.6. School preparation activities of unenrolled childrenWhen carefully examined, research findings suggest that unenrolled children did not participate in any activities at home to prepare them for primary school; in a sense, the time they spend outside the school is lost time in terms of education. These children often work in the field or care for younger siblings at home. There are also kids working outside the family and contributing to family finances. Usually it is girls who take care of their brothers and sisters and help with the housework. Watching television is the most common activity followed by playing at home or, in the streets.
Children not enrolled in school did not seem to engage in any educational or learning activities, and are not provided any direction or guidance by their parents. There are important learning experiences that need to be provided to these children at this critical period in learning and development. If these skills are not
gained in this period, it will be more difficult for children to learn them later in life. In our interviews, people other than parents, emphasize ignorance of families and their lack of education as the single most important reason for late enrollment problem. However, parents focus on their limited resources, the age of their children, and children’s underdevelopment. Apparently, many factors such as lack of appreciation of the importance of education, ignorance, lack of awareness, economic and environmental constraints and socio-cultural issues are responsible for late school enrollment. If we consider all these factors together, it is clearly seen that urgent measures should be taken to improve economic, social and cultural development of the regions where we conducted our research.
4.7. Kindergarten / kindergarten attendanceAlthough “young age” and “physically insufficient development” of these children are mentioned by parents as reasons for not sending children to school and this also emerged as the most important reason for late enrollment, among this group of kids, the number of children who attended kindergarten last year is almost negligible. Therefore, it is quite important to enlighten people in this region about the importance of early childhood education; to increase the number of preschools and kindergartens; and to make them more functional. Since children in this region are at risk because of poverty, one of the important functions of preschools/ kindergartens in the province should be supporting and monitoring the physical and mental development of children. Again, at this stage, with the cooperation and the coordination between the Ministry of Health and Ministry of National Education, enrollment records and other information about children can be collected and stored more systematically, and can be used in support of educational activities. In addition, another function of kindergarten is to provide opportunities for Turkish language acquisition for children whose native language is not Turkish. This would help them not to have language problem when they start school.

188
4.8. School enrollment decisionAlthough the decision for enrolling the child in school seems to be made by the mother and father together, it is understood that the most influential person in making the decision is the father. Therefore, it is even more important to inform and direct fathers about the school starting age and the characteristics of primary schools. Those who can communicate better with the fathers such as the mukhtars, religious officials and other local administrators should be enlightened and so that they can help fathers to understand the importance of the problem. Even during the military service, young men can have both awareness education and training about child development. Thus, fathers-to-be can understand the importance of enrolling children in school on time. In the provinces that this research was carried out, many families experienced transportation difficulties, school expenses, although legally prohibited- registration fees collected under the name of school donation, economic problems prevent these families to enroll their children to school in time. Some families do not know the contribution made by the government that facilitates the enrollment of children to primary education. The announcement to families in the region by the local governments before the beginning of each academic year, about what the type of contribution is, who, when and where to apply can be very helpful.
4.9. School-bussing system and YİBO’sAnother important factor that causes late school enrollment is the practice of “school-bussing” and boarding schools (YİBO) developed as a result of dispersed schools in the area. Families do not feel comfortable about bussing their kids, especially the girls to school and boarding school education. Parents believe their boys are too young for bussing and boarding schools. Therefore, they prefer to wait one year and enroll them the next year. It is recommended that this situation should be taken into account and both programs must be re-considered. Traveling every day for several hours or having education in boarding schools away from home poses serious question in terms of late school enrollment
and failure to enroll children in school at all. It must be kept in mind that in the case of children who did not register on time, there is a particular situation: if their enrollment is postponed more than a year, their enrollment chance considerably decreases. In this frame, it is interesting to note that the number of girls is greater among children who did not register two consecutive years. Considering the research findings about some religiously oriented families who prefer to enroll their girls earlier to make them graduate before puberty, we can easily conclude that since every passing year children will develop a little more, girls who do not enroll in time will lose their chance to complete their education.
4.10. Regulation for primary education institutions: Article 15With the exception of MONE employees, about half of the social stakeholders did not know the contents of Article 15. Especially among the parents, the media members and mukhtars, there were many people who did not know this article. Considering the influence of media members and mukhtars, it is necessary to enlighten these two groups and other stakeholders on this issue. Parents usually obtain information about the age of school enrollment from teachers. Therefore, teachers must be knowledgeable about Article 15 and its guidelines so they can help parents.
4.11. Traditional and religious factorsIn our study, participants stated that the effect of traditional and religious factors on late enrollment is very minimal. As mentioned before, traditional and religious factors negatively impact girls’ enrollment in secondary school. This situation indicates that even if they enroll in primary school on time, the chance is much less for girls to pursue higher education because of traditional and religious factors. In other words, it is evident that traditions and religious factors work ultimately against girls. Therefore, it is important that religious and traditional factors be considered, particularly in the case of girls’ education.
189
4.12. Effect of female-male childrenIn interviews it has been understood that gender differences play a role in primary school enrollment. In terms of continuing their education in the future, girls are more affected by this situation than boys. The most common reasons for this are the idea that girls will get married at an early age leave home; taking care of younger siblings; because of negative portrayals in the media make parents feel that their girls at risk and parents are concerned about them, and thus, they do not want them to be in school once puberty begins. As seen, the importance of the sensitivity of media outlets in this regard is significant. To strengthen the role of women in society, awareness is needed to be created in society that women are not beings to be driven by men, and they are not in need of protection by men. In particular, women (mothers) can be drawn into the school and meet teachers by means of free literacy and various skills courses in schools. Thus, these uneducated mothers can get acquainted with education. This can be very helpful in terms of raising the awareness of mothers. We can expect that consequently, they may show extra efforts to ensure the education of their girls. Perhaps these training can help mothers to participate in working life thus their dependency to the seasonal work that make them to leave home for long time, can be reduced a little bit.
4.13. The case of native languageAnother significant finding of the study is the issue of native language. In these cities some children are not enrolled in school because their mother tongue is not Turkish. Their parents think their children will have difficulties in school because they don’t speak Turkish. Although it has not been mentioned by parents, this issue was emphasized during the focus group meetings. Of course, it is not a fair situation for a kid who does not understand Turkish to sit down in a classroom where the instruction is given in Turkish language. In order to eliminate this problem, MONE, Early Childhood Education General Directorate should expand the practice of “the Summer School” carried out by the support of AÇEV. Increasing the number of kindergartens in these cities and implementing
intensive training programs in these schools to understand and speak Turkish will be helpful. At the same time there should be literacy courses for parents to learn Turkish. One of the most important factors in acquisition of a second language is the age of the child. The earlier a child starts to learn a language, the better she can read, write and speak that language and be a true bilingual (Johnson, 1992; Slavoff, and Johnson, 1995). Children who learn a second language at an early age develop better in terms of social, emotional and cognitive growth. Besides teaching Turkish to children and parents, languages spoken in the region must be taught to teachers who work there.
4.14. Being able to focus on late enrollment to schoolAnother striking finding of the research is that during both focus group meetings, as well as semi-structured interviews, the participants could not focus on the late enrollment problem. One of the important reasons for this is that participants are heavily involved with issues such as economical issues of the region, rural-urban distinction, children’s health and development, and therefore, late enrollment to school does not seem to be a major issue for them. It is difficult for them to isolate themselves from other vital issues. This case is significant in terms of showing the situation of cities and people who live in the region.
4.15. Work of actors and their rolesIt was determined in the study that MONE employees, officials of the Department of Religious Affairs and local media have done some work for timely enrollment of children in schools. However, these efforts are very inadequate. Since they don’t work in cooperation, these agents are not aware of each other’s work, thus, inter-agency or inter-institutional cooperation is needed urgently. In particular, the commissions and committees that are in charge of increasing parental awareness campaigns and household screening procedures must include the local and government agencies and other grassroots stakeholders. This would be an important step to understand, follow and resolve the problem. Collaboration with healthcare workers may be veryuseful especially in rural areas. Considering the
190
methods that midwives and nurses use such as mother-child follow-up card or vaccination record, cooperation with healthcare workers makes possible to follow the development of children from birth to theend of primary school education. Providing financial support to parents, improving physical conditions of schools, reducing classroom sizes, improving the attitudes of teachers toward parents, and the cooperation of all local and government agencies in the region will help ensure that children are enrolled in school at the appropriate age.
4.16. Recommendations for future efforts and studiesThe knowledge obtained from the quantitative research findings emphasized the importance of the improvement efforts in economic, social and cultural sense, awareness trainings, the arrangements to be made in schools and education systems that grant quality school for every child, fight against the gender inequalities in the society and providing Turkish language education at an early age. The 96.2% of participants who participated in semi-structured interview offered additional endeavors apart from the efforts have already been made. These recommendations are built on views such as raising education awareness of parents, work of the official and local institutions by establishing a joint commission, providing economic support for parents in need, and increasing the quality schooling. Among those recommendations, the highest priority is given to raising the awareness of parents. However, it is also noted that (parents alone should not be held responsible for) the burden of disadvantages should not be commissioned to the parents alone; especially some economic problems, lack of organizational approaches, the troubles in use of technology and perspectives to education must also be taken into consideration. Indeed, in this context, participants listed following wishes as additional steps for the solution: functionalizing the electronic enrollment system, enforcement of penal sanctions against parents, putting the religious officials in place more effectively, more publicity efforts (posters and
advertisements), financial support for the seasonal worker families and allowing their children enroll in schools where they do migrant work, solving the native language issue and making schools more attractive.
4.17. Effective communication practicesThinking the potential role of effective communication practices and the use of proper communication channels in the achievement of timely school enrollment campaign, people were asked of the best channels to be announced of the campaign efforts to be done in their cities, towns and villages. The most obvious method presented is one to one, face to face communication. It has been highlighted that no other communication channels other than face to face option include sincerity and earnestness.When we analyzed the expressed communicative terms, the actors that are expected to take an active role in communication were ranked as media, teachers, religious officials, the mukhtars, and MONE officials. However, it has been expressed that, all of them must be considered as a whole in practice and functionalized according to their weight. It was also noted that no matter how effective it is, working with a single method cannot replace multi-channel methods, parallel to face to face communication; various other ways of communication also must be conducted.
4.18. Tasks for the relevant partiesSince participants repeatedly stated that everybody had responsibilities for the timely enrollment of school age children, we asked them to indicate what kind of tasks they think for individuals and institutions having a certain position in society. Considering the region and provinces where the research was conducted, and the influence people in these positions have on the local people, it was particularly asked what kind of tasks were expected from the mukhtars, teachers, local governors, non-governmental organizations, religious officials, doctors and nurses. Opinions of participants were taken separately for each one of these agents.

191
In this framework, the mukhtars are expected to inform community, to communicate with families and schools; to take active part in screening process; and to cooperate with other stakeholders. Indeed, findings of the quantitative research indicate that families of late enrollment children have green card (card provided by the state ensuring free health care at state hospitals). This means that these families communes to “Mukhthar’s office” for other purposes such as health insurance concerns. Taking advantage if this situation mukhtars can inform families about schooling and school age issues.
Teachers are expected to raise awareness, to communicate with other concerned individuals and institutions in regard to families, to act in coordination with other stakeholders, to encourage education and to make it more attractive and to participate in the screening process.
Local governments are expected to inform and guide people about school enrollment; to improve educational institutions; to provide financial help for parents; to work in cooperation with other stakeholders and to assume more authority and enforcement power.
When it comes to the role of NGOs, participants listed similar tasks as mentioned above. However several additional expectations are also listed such as molding public opinion to persuade families, providing both emotional and financial support, and developing projects or supporting the existing ones. There is a factor to be taken into consideration, among survey respondents that some think that NGOs have already made contributions, while others think they cannot provide any contribution in this regard. For this reason, a planned and coordinated call to NGOs via MONE officials will make a successful contribution to increasing timely enrollment.
Being in the community all the time, religious officials is considered important stakeholders with the potential to provide a number of contributions in this regard. Therefore, it is expected that they can raise public awareness through their weekly sermons. Considering their influence on people, they are expected to persuade families to enroll their children
on time. Indeed, considering the potential risks of no enrollment of girls when their enrollment in schools are late, and the traditional beliefs and attitudes of people about girls’ education, the role of religious official gain further importance. However, similar to NGOs some participants expressed reservation in terms of contributions expected from religious official. Therefore, they should be trained systematically in advance about how and what to tell people in their sermons. In other words, the contribution of the individual efforts of each religious official may not be effective and could potentially give the wrong message.
Since healthcare workers, doctors, nurses and midwives have a prestigious position in the local social hierarchy; their impact on society is significant. Therefore, we asked the participants what were their expectations of healthcare workers. The responses are quite similar to what they expect from previously mentioned stakeholders. In addition, health workers are expected to inform the community about children’s physical development, for instance, and doctors are expected to determine and intervene with growth retardation and persuade families by using their prestigious position. As with other social stakeholders, concerns are expressed about the effectiveness of doctors and nurses.
When we look at the expectations from all stakeholders as a whole, they are expected to work systematically in cooperation to enlighten and persuade people about the importance of school enrollment. In this sense, the unifying, guiding, supervisory and supportive role of the Ministry of National Education is very important.
4.19. Recommendations generated from quantitative and qualitative research findings•Teachers’homevisitsshouldbeorganizedsystematically, and should be monitored and overseen by provincial national education directorates. Connected to the Ministry of Education, this work should be done in a coordinated manner in all provinces.

192
•Inlargeandextendedfamilysettings,effortsaimedat raising awareness should target the whole family, not just mothers and fathers, and must be planned accordingly.
•Theproblemofgirlsnotregisteredontimeshouldbe discussed in connection with culture, beliefs, traditions and customs.
•Girlsinthisregioncannotexperiencetheirchildhoodas much as they want or need. Considering the potential negative outcome of this, family and teachers should be informed about it.
•Registrationfeestakenfromparentsinthenameof the donations are seen as one cause of late enrollment. Other solutions must be found to meet the needs of schools, and parents should not be charged for education.
•Thehealthstatusofallchildrenandtheirdevelopment must be monitored by the state until the end of primary school.
•Necessarymeasuresshouldbetakentopreventlate enrollment that happen because of errors in the Address Registration System.
•Thefinalyearofearlychildhoodeducation(kindergarten) should be included in compulsory education (for 60-72 months children).
•Toeliminatethecommunicationproblemsregardinglanguage issues, new courses should be opened to teach Turkish to mothers and local languages spoken more commonly in the region local language should be taught to teachers.
•Summerschoolsshouldbeorganizedinadvanceto teach Turkish language to children who will start primary school. This requirement can be met via widespread application of summer school programs as instituted by AÇEV and MONE.
•Theweekofprimaryschoolenrollmentshouldbecelebrated in a festive mood especially in areas with lower rates of enrollment.
•Article15shouldbere-statedinwaysthatpeoplecan understand, and this article must be announced via media, mukhtars, the cafes (kahvehane, populated
only by men in the region) of the villages and religious officials prior to the school enrollment period.
•Teachersandhealthpersonnelshouldworkincooperation, and the Ministry of National Education and the Ministry of Health must work in a coordinated fashion.
•Whenparentswanttousetheirlegalrighttopostpone the enrollment of their children provided by Article 15 with concerns that their children are not physically ready for school, in addition to school administrators, the opinion of healthcare personnel must be sought in determining whether the child actually needs to be out of school for a year.
•Educationalinstitutionsneedtointroducethemselves to parents in terms of their mission, vision, and activities. They should ensure the parents understand that school is a safe environment for all children regardless of their physical development.
•Thephysicalcharacteristicsofprimaryschoolsshould be reevaluated and necessary adjustments be made to allow children with disabilities to attend school.
•Theprojectsthataimtoturnelementaryschoolsinto “child friendly” schools should be accelerated.
•Inthecoursesofferedinteachertrainingprogramsof universities, various courses should be started that teach prospective teachers about the laws, regulations and rules about national education and MONE. MONE and the universities should cooperate to prepare the contents of these courses.
5. SHORT TERM STRATEGIC RECOMMENDATIONS BASED ON WORKSHOP DISCUSSIONS •DevelopmentofprotocolsbetweentheMinistryof National Education and Ministry of Health that would make cooperation between them and health personnel, school administrators and teachers possible. This should be executed by the beginning of the 2010-2011 academic year. School administrators and the personnel at the health centers need to work together on projects like “healthy schools.”

193
•Improvementofrehabilitationcentersandtheinitiation of orientation and supervisory work.
•Toinitiate“ruralstudies”thatworktoconductresearch and develop programs for the rural areas, the Ministry of National Education should increase the number of personnel working in Guidance and Research Centers or their workloads should be reduced. Further, strategic plans of rural studies for the next academic year must be prepared immediately. School administrators, teachers, academics, local authorities and experts in the Guidance and Research Centers should work together in the preparation of this strategic plan.
•BirthcontrolcampaignscarriedoutbytheMinistryof Health should continue and during these campaigns parents should be informed about the economic and social burden the number of children brings to the family. The Directorates of MONE should work cooperatively with the Health Directorates and Religious Affairs Directorate. Within the framework of this cooperation both the religious officials and medical personnel should be educated concerning the dimensions, consequences and solutions of the problem and they should be provided with necessary educational skills to have active roles in public education and awareness activities.
•Inregardtolateschoolenrollmentproblems,MONE must inform the social stakeholders about the significance of the issue by educating local governments about how to deal with the problem. For example, the families who apply for various aids and governmental supports can be informed about school enrollment during their application procedure is completed.
•Invitationlettersshouldbepreparedtobesentoutto NGOs asking for collaboration to work toward the solution of the problem. These letters should also define and explain the problem and those NGOs, who reply positively, should be offered to work towards preparing protocols for partnership. MONE can support the work started after this collaboration and carried out by NGOs by providing materials. MONE can also demand regular progress reports to follow up with the
works of NGOs and monitor their activities.
•Turkish-languagecoursesshouldbestartedassoonas possible in the regions where women cannot speak Turkish. MONE and Higher Education should merge their facilities for this purpose.
•MONEshouldcooperatewiththeMinistryofNationalDefense in order to educate young men during military service about the importance of early childhood education, on timely school enrollment registration, education of girls and various governmental aids and support provided for poor families who cannot afford to educate their children.
•MONEandtheMinistryofNationalDefensemustcooperate with the Faculties of Education to train the trainers who are going to teach these men serving their military duties. This program should be started and completed within a six months time period.
•MONE,TRT(TurkishRadioandTelevisionInstitution),privately owned media and local governments must prepare an action plan to inform families that the starting age for primary school is 72 months through the local school administrators and teachers as well as national and local media.
•Priortotheschoolenrollmentperiod,MONEmustprepare an official letter reminding parents about the enrollment of children aged 72 months. This can be sent to family’s thorough school administration and with the support of local governments and municipalities. The letters should contain the following:
•Auto-enrolled(e-enrollment,pre-registration)students need to finalize their school enrollment,
•Childrencanandshouldenrollinschoolby72months of age,
•Agecalculationisbasedontheagethatthechildcompleted,
•Schoolenrollmentinformation,
•Thattheregistrationisfree,

194
•Freedistributionoftextbooks,
•Informationaboutotherrelieforganizationsthatprovide support such as course materials, uniforms, food etc.
•FlyersexplainingArticle15toparentsandprovidingother information regarding education must be prepared by MONE and distributed to parents in various ways (as newspaper supplements, in stores, shopping malls, schools, entrances to various offices, etc.). The information in this leaflet should be announced on TV channels.
•MONEmuststarttoworkonanewmoduletoaddonto the e-school system before next year’s registration. This module should allow for the monitoring of children’s schooling activities such as enrollment and attendance.
•Inordertodeterminethequantitativeandqualitative needs of early childhood education and primary schools, MONE must request reports from principals and inspectors in the second semester of this academic year. In the framework of this report, MONE must meet the requirements of these institutions by the beginning of 2010-2011 academic year.
•MONEmustre-evaluatethestatusofRegionalBoarding Schools (YİBOs) and the school-bussing programs taking into considerations the cultural features of the region, including their expectations and sensitivities. During the registration season families should be invited to see the facilities and should spend one or two nights with their children. Legal issues should be resolved to allow for such changes.
•Inparticular,promotionaleventsshouldbeorganized in areas where parents’ education levels are low in order to introduce school activities and the school administration and teachers to local families. The primary education week in this region should be celebrated like a festival in cooperation with local people, NGO’s and local media. MONE should ensure that these festivals are advertised on national media outlets.
•Teachersshouldbetrainedoftechniquesandskillsthat help them work with disadvantaged children and families. Both pre-service and in-service training programs must be made available for the teachers. This program should be implemented in cooperation with schools, Higher Education Council, MONE and the universities.
•ThestudentsoftheFacultyofEducationandteachercandidates should have internship opportunities in villages and rural areas. For this purpose the MONE, Higher Education Council, local governments and the local people should cooperate with each other. As a result of this, teacher candidates can go to the region and better understand the issues faced in the region. Considering that these internship and practicum opportunities can be provided during summer months, the help of pre-service teachers can be used to teach Turkish to children whose native language is not Turkish.
•Inordertoincreasethecooperationbetweentheschools affiliated to MONE and faculties of education, administrators of MONE, Higher Education Council and Schools of Education should come together to prepare an efficient guideline and code of conduct that allow for and define their work together.
•Administratorsofthefacultiesofeducationshouldwork with MONE to re-design the Community Service courses in their curriculum to address the more pressing needs and problems of the underdeveloped regions of Turkey.

195
REFERENCESAl-Qudsi, S., (2003). Family Background, School Enrollments And Wastage: Evidence From Arab Countries. Economics of Education Review, 2, pp 567–580.
Amante, D., VanHouten, V. W., Grieve, J. H., Bader, C. H., & Margules, P. H. (1977). Neuropsychological Deficit, Ethnicity, and Socioeconomic Status. Journal of Consulting and Clinical Psychology, 45, 4, pp.24-35.
AB Temel Eğitimi Destekleme Programı, retrieved from http://www.meb.gov.tr- 28.11.2007 in May 2009.
Bruce H. Rankin; Aytaç, Işık (2006). Gender Inequality In Schooling: The Case Of Turkey. Sociology Of Education, Vol. 79, No.1 pp. 25-43, American Sociological Associat ion.
Buchmann, C. (2000). Family structure, parental perceptions, and child labor in Kenya: What factors determine who is enrolled in school? Social Forces, 78, pp., 1349-1379.
Bulutay, T. (1999). Türkiye’de Çalışan Çocuklar. DİE.
Case, Anne; Paxson, Christina; Ableidinger, Joseph. (2002). Orphans in Africa: Parental
Death, Poverty and School Enrollment. 2003 BREAD Conference.
Çabuk N, Soylu A, Kavukçu S, Türkmen M, Büyükgebiz B. The Relation Between Socioeconomic Level And Age Of Attendance To Primary School. ESSOP, 1999 annual Congress of the European Society for Social Pediatrics “School Health” October 1999, İstanbul
Çıngı, H.,(2009). Örnekleme Kuramı, Bizim Büro Basımevi, Ankara.
Çivi, S; Koruk İ. (2005). Konya İli Hasanköy Sağlık Ocağı Bölgesinde İlköğretim 1. Sınıf Öğrencilerinde Kronik Malnütrisyon Prevalansı. Erciyes Tıp Dergisi 27 (2), 64-69.
Çocuk Haklarına Dair Sözleşme, www.0-8.org/hukuksal/bm_cocuk_haklari_sozlesmesi.doc
Dilli, C. (2006). Zorunlu Eğitim Çağında Bulunan Kız Çocuklarının Okula Gitmeme Nedenleri. Elazığ: Fırat Üniversitesi Sosyal Bilimler Enstitüsü.
Dokuzuncu Kalkınma Planı 2007 – 2013, 2. (2006). Ankara: TBMM.
SPO, İlçelerin Sosyo-Ekonomik Gelişmişlik Sıralaması Araştırması (2004).
SPO, İllerin ve Bölgelerin Sosyo-Ekonomik Gelişmişlik Sıralaması Araştırması (2003).
SPO, AB, Hacettepe Üniversitesi. (2003). Türkiye Nüfus ve Sağlık Araştırması. Ankara.
Fazlıoğlu, A.Dersan, N, (2004). GAP Bölgesinde Yoksul Çocukları Eğitime Kazandırma Yönünde Katılımcı Proje Uygulamaları. Eğitimde Yeni Ufuklar II: “Eğitim Hakkı ve Okula Gidemeyen Çocuklar”, (s. 1-17). Ankara. Gabriele, A.,& Schettino, F. (2008). Child Malnutrition and Mortality in Developing Countries: Evidence from a CroSD-Country Analysis, Analyses of Social Issues and Public Policy, 8, 1, pp., 53 – 81
Haydi Kızlar Okula Kampanyası retrieved from http://haydikizlarokula.meb.gov.tr/uygulama_sonuclari.php
İnsan Hakları Evrensel Beyannamesi retrieved from http://www.unicef.org/turkey/pdf/_gi17.pdf
Johnson, J. S. (1992). Critical period effects in second language acquisition: The effect of written versus auditory materials on the assesment of grammatical competence. Language Learning, 42, 217-248.
Jukes, M. (2006). Early Childhood Health, Nutrition And Education. London: UNESCO.
Kavak, Y; Ergen, H., (2007). Türkiye’de İlköğretime Katılım ve Okula Gidemeyen Çocuklar. Milli Eğitim S.173, 8-26.
MONE, 2007 -2008 Eğitim Dönemi (March 2008) e-school veri tabanı.
MONE, (2006). Early Childhood Education Program (36 - 72 months of age Çocuklar İçin). Ankara: MEB Yayını.
MEB, İlköğretim Kurumları Yönetmeliği retrieved from http://mevzuat.meb.gov.tr/html/225_0.html
196
MONE. (2007-2008). National Education Statistics Formal Education. Ankara.
Miguel Urquiola, V. C. (2006). Apples and Oranges: Educational Enrollment and Attainment Across Countries in Latin America and the Caribbean. Science Direct, 572-590.
Nakip, M. (2005) Pazarlama Araştırmalarına Giriş (SPSS Destekli), (s.55). Ankara.
Neyzi, O., Furman, A., Bundak, R., Gunoz, H., Darendeliler, F., & Bas, F. (2006). Growth References for Turkish Children Aged 6 to 18 Years Acta Pædiatrica, pp., 1635-1641
Özbek, A. Miral, S. (2003). Child Ruh Sağlığı Açısından Prematürite. Child Sağlığı ve Hastalıkları Dergisi, 317-327.
Rabinowitz, G.L. (1989). School Entry Age: The Effects On School Achievement And Adjustment. Atlanta
Rena, Ravinder. (2007). Factors Affecting The Enrollment And The Retention Of Students At Primary Education In Andhra Pradesh - A Village Level Study. Essays in Education 22, 102-112.
Richardson T. L.; Montz (1985). Academic Achievement Among Early Entry Students. 28.
Slavoff, G. R. and Johnson, J. S. (1995). The effects of age on the rate of learning a second language. Studies in Second Language Acquisition, 17, 1-16.
Şimşek, Z., Koruk, İ., (Kasım 2008). İhmal Edilen Bir Grup: Şanlıurfa İl Merkezinde Göçebe Mevsimlik Tarım İşçilerinin Çocukları.7.Sokakta Çalışan ve Yaşayan Çocuklar Sempozyumu.
Temel Eğitim Programı ve Projeleri retrieved from http://web.worldbank.org
TÜİK. (2007). Adrese Dayalı Nüfus Kayıt Sistemi.
TÜİK. (2006). Çocuk İşgücü Araştırması. Ankara
Türkiye Cumhuriyeti Anayasası (1982) retrieved from http://www.tbmm.gov.tr/anayasa.html
UNESCO, (2000), Final Report, World Education Forum 26 - 28 April 2000, Dakar, Senegal.
Wils, A. (2004). Late Entrants Leave School Earlier: Evidence from Mozambique. International Review of Education. 50(1): 17–37. Netherlands.
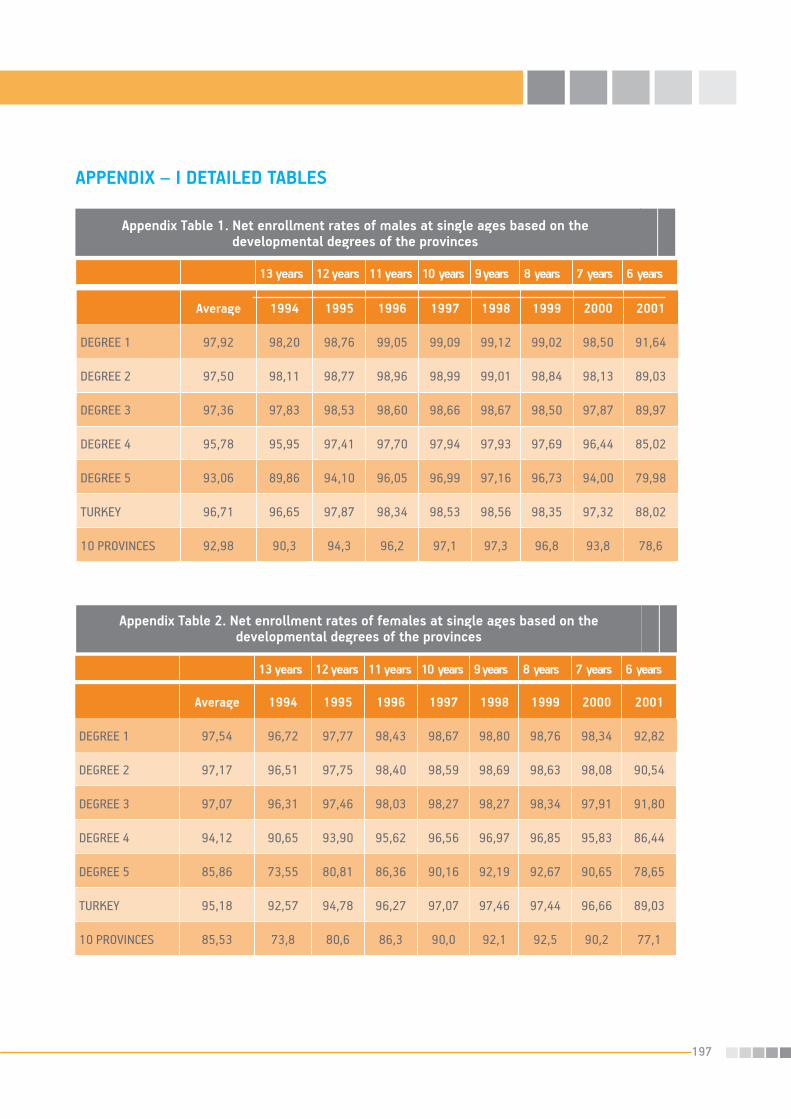
197
Appendix Table 2. Net enrollment rates of females at single ages based on the developmental degrees of the provinces
13 years 12 years 11 years 10 years 9 years 8 years 7 years 6 years
Average 1994 1995 1996 1997 1998 1999 2000 2001
DEGREE 1 97,54 96,72 97,77 98,43 98,67 98,80 98,76 98,34 92,82
DEGREE 2 97,17 96,51 97,75 98,40 98,59 98,69 98,63 98,08 90,54
DEGREE 3 97,07 96,31 97,46 98,03 98,27 98,27 98,34 97,91 91,80
DEGREE 4 94,12 90,65 93,90 95,62 96,56 96,97 96,85 95,83 86,44
DEGREE 5 85,86 73,55 80,81 86,36 90,16 92,19 92,67 90,65 78,65
TURKEY 95,18 92,57 94,78 96,27 97,07 97,46 97,44 96,66 89,03
10 PROVINCES 85,53 73,8 80,6 86,3 90,0 92,1 92,5 90,2 77,1
APPENDIX – I DETAILED TABLES
Appendix Table 1. Net enrollment rates of males at single ages based on the developmental degrees of the provinces
13 years 12 years 11 years 10 years 9 years 8 years 7 years 6 years
Average 1994 1995 1996 1997 1998 1999 2000 2001
DEGREE 1 97,92 98,20 98,76 99,05 99,09 99,12 99,02 98,50 91,64
DEGREE 2 97,50 98,11 98,77 98,96 98,99 99,01 98,84 98,13 89,03
DEGREE 3 97,36 97,83 98,53 98,60 98,66 98,67 98,50 97,87 89,97
DEGREE 4 95,78 95,95 97,41 97,70 97,94 97,93 97,69 96,44 85,02
DEGREE 5 93,06 89,86 94,10 96,05 96,99 97,16 96,73 94,00 79,98
TURKEY 96,71 96,65 97,87 98,34 98,53 98,56 98,35 97,32 88,02
10 PROVINCES 92,98 90,3 94,3 96,2 97,1 97,3 96,8 93,8 78,6

198
Appendix Table 3. Sex distribution of participants in semi-structured interviews
Frequency %
Male 78 91,8
Female 7 8,2
Total 85 100
Appendix Table 4. Distribution of participants in relation to the target child
Frequency % Frequency % Frequency %
Older sister 6 0.6 2 1.5 8 0.7
Uncle-Father’s brother 5 0.5 - - 5 0.5
Grandfather 5 0.5 - - 5 0.5
Older brother 4 0.4 - - 4 0.4
Aunt 5 0.5 - - 5 0.5
Grandmother 1 0.1 2 1.5 3 0.3
Uncle-Mother’s brother 2 0.2 - - 2 0.2
Male cousin 1 0.1 1 0.7 2 0.2
Yenge-Wife of a male relative 2 0.2 - - 2 0.2
Step mother 1 0.1 - - 1 0.1
Total 32 3.2 5 3.7 37 3.6
Late enrollment No enrollment Not enrolling on time (Total)
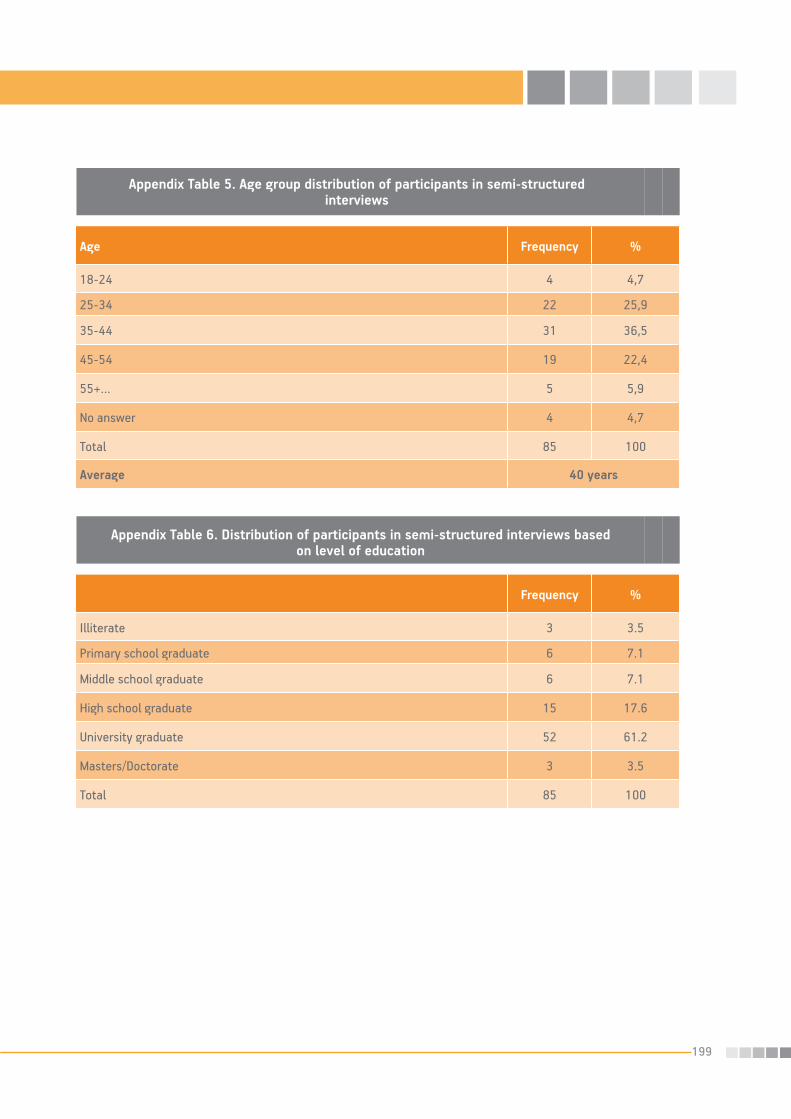
199
Appendix Table 6. Distribution of participants in semi-structured interviews based on level of education
Age Frequency %
18-24 4 4,7
25-34 22 25,9
35-44 31 36,5
45-54 19 22,4
55+… 5 5,9
No answer 4 4,7
Total 85 100
Frequency %
Illiterate 3 3.5
Primary school graduate 6 7.1
Middle school graduate 6 7.1
High school graduate 15 17.6
University graduate 52 61.2
Masters/Doctorate 3 3.5
Total 85 100
Average 40 years
Appendix Table 5. Age group distribution of participants in semi-structured interviews
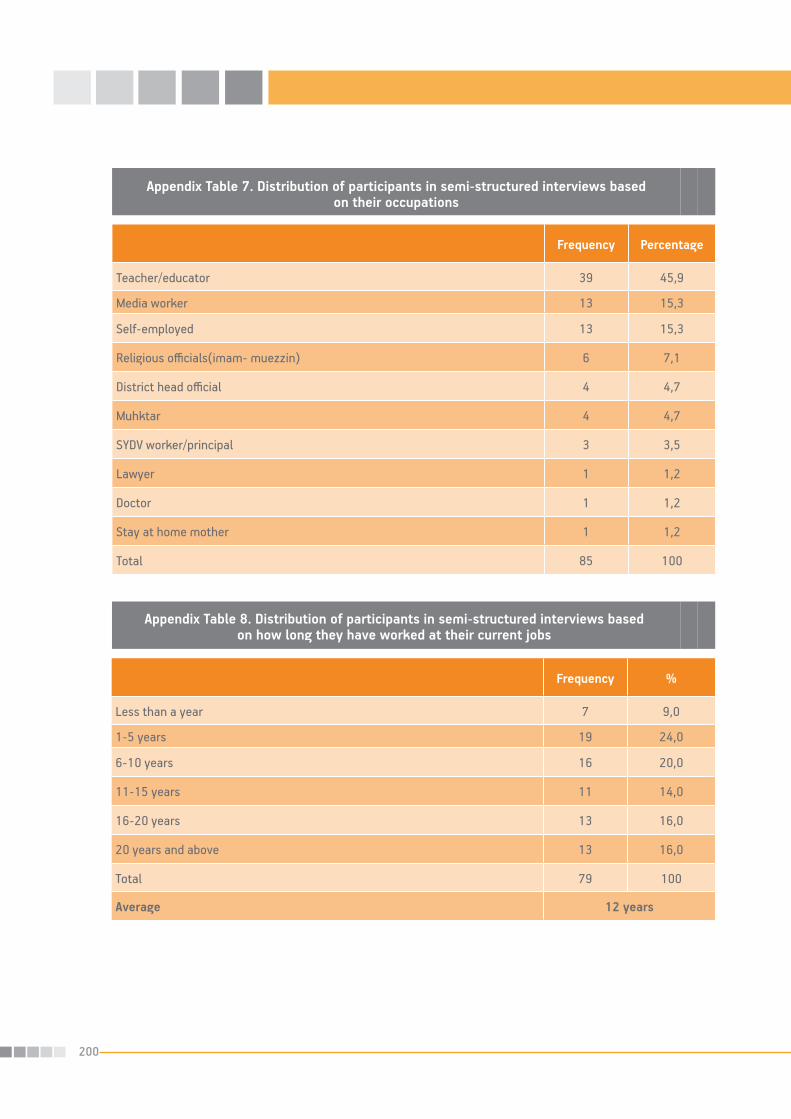
200
Appendix Table 7. Distribution of participants in semi-structured interviews based on their occupations
Appendix Table 8. Distribution of participants in semi-structured interviews based on how long they have worked at their current jobs
Frequency %
Less than a year 7 9,0
1-5 years 19 24,0
6-10 years 16 20,0
11-15 years 11 14,0
16-20 years 13 16,0
20 years and above 13 16,0
Total 79 100
Average 12 years
Frequency Percentage
Teacher/educator 39 45,9
Media worker 13 15,3
Self-employed 13 15,3
Religious officials(imam- muezzin) 6 7,1
District head official 4 4,7
Muhktar 4 4,7
SYDV worker/principal 3 3,5
Lawyer 1 1,2
Doctor 1 1,2
Stay at home mother 1 1,2
Total 85 100

201
Appendix Table 9. Distribution of household members based on their relationship to the target child who did not participate in school on time
Frequency % Frequency % Frequency %
Uncle-Father’s brother 61 0,9 12 1,1 73 0,9
Yenge-Wife of a male relative 35 0,5 10 1 45 0,6
Cousin 29 0,4 14 1,3 43 0,5
Grandfather (father’s father) 28 0,4 1 0,1 29 0,4
Grandfather (mother’s father) 18 0,3 4 0,4 22 0,3
Step mother 15 0,2 1 0,1 16 0,2
Aunt (father’s sister) 15 0,2 1 0,1 16 0,2
Grandmother (mother’s mother) 14 0,2 1 0,1 15 0,2
Aunt 4 0,1 - - 4 0
Nephew/niece 3 0 - - 3 0
Step sister/brother 3 0 - - 3 0
Uncle-Mother’s brother 2 0 - - 2 0
Brother-in-law 1 0 - - 1 0
Total 228 3,2 44 4,2 272 3,3
Late enrollment No enrollmentNot enrolling on
time (Total)

202
Appendix Table 10. Age distribution of household members*
Age groups Frequency % Frequency % Frequency %
0-4 805 11,5 120 11,5 925 11,5
5-9 1.846 26,4 276 26,4 2.122 26,4
10-14 1.231 17,6 187 17,9 1.418 17,6
15-19 686 9,8 109 10,4 795 9,9
20-24 324 4,6 49 4,7 373 4,6
25-29 370 5,3 59 5,6 429 5,3
30-34 487 7,0 57 5,4 544 6,8
35-39 497 7,1 68 6,5 565 7,0
40-44 328 4,7 50 4,8 378 4,7
45-49 188 2,7 29 2,8 217 2,7
50-54 83 1,2 18 1,7 101 1,3
55-59 57 0,8 9 0,9 66 0,8
60-64 27 0,4 4 0,4 31 0,4
65-69 26 0,4 2 0,2 28 0,3
70-74 13 0,2 7 0,7 20 0,2
75-79 13 0.2 1 0,1 14 0,2
80-84 10 0,1 1 0,1 11 0,1
85-89 3 0,0 1 0,1 4 0,0
90+... 4 0,1 - - 4 0,0
Total 6.998 100 1047 100 8.045 100
*People who did not answer this question were not included in the table.
Late enrollment No enrollmentNot enrolling on
time (Total)

203
Appendix Table 11. Age – sex distribution based on living in urban and rural living areas (Late enrollment)
Age Frequency % Frequency % Frequency % Frequency %
0-5 233 15,8 259 16,6 281 14,4 294 14,7
6-9 337 22,9 341 21,9 455 23,3 434 21,7
10-14 263 17,9 292 18,7 346 17,7 327 16,4
15-19 138 9,4 142 9,1 186 9,5 220 11,0
20-24 63 4,3 74 4,7 75 3,8 112 5,6
25-29 90 6,1 71 4,6 125 6,4 84 4,2
30-34 105 7,1 102 6,5 155 7,9 125 6,3
35-39 93 6,3 103 6,6 149 7.6 152 7,6
40-44 62 4,2 82 5,3 76 3,9 108 5,4
45-49 29 2,0 30 1,9 53 2,7 76 3,8
50-54 15 1,0 21 1,3 17 0,9 30 1,5
55-59 14 1,0 17 1,1 10 0,5 16 0,8
60-64 8 0,5 8 0,5 5 0,3 6 0,3
65-69 8 0,5 5 0,3 4 0,2 9 0,5
70-74 3 0,2 4 0,3 5 0,3 1 0,1
75-79 7 0,5 3 0,2 2 0,1 1 0,1
80-84 4 0,3 4 0,3 2 0,1 0 0,0
85-89 1 0,1 0 0,0 1 0,1 1 0,1
90+... 0 0,0 0 0,0 4 0,2 0 0,0
Total 1.473 100 1.558 100 1.951 100 1.996 100
Female MaleMale Female
Rural living areas Urban living areas

204
Appendix Table 12. Age – sex distribution based on living in urban and rural living areas (No enrollment)
Age Frequency % Frequency % Frequency % Frequency %
0-5 34 13,7 39 15,8 44 14,9 42 16,5
6-9 59 23,8 52 21,1 76 25,7 49 19,2
10-14 49 19,8 46 18,6 51 17,2 41 16,1
15-19 21 8,5 27 10,9 32 10,8 29 11,4
20-24 13 5,2 12 4,9 9 3,0 15 5,9
25-29 11 4,4 12 4,9 22 7,4 14 5,5
30-34 11 4,4 8 3,2 20 6,8 18 7,1
35-39 18 7,3 19 7,7 15 5,1 16 6,3
40-44 13 5,2 12 4,9 14 4,7 11 4,3
45-49 4 1,6 7 2,8 6 2,0 12 4,7
50-54 5 2,0 6 2,4 2 0,7 5 2,0
55-59 3 1,2 3 1,2 2 0,7 1 0,4
60-64 1 0,4 1 0,4 2 0,7 0 0,0
65-69 2 0,8 0 0,0 0 0,0 0 0,0
70-74 2 0,8 2 0,8 1 0,3 2 0,8
75-79 1 0,4 0 0,0 0 0,0 0 0,0
80-84 1 0,4 0 0,0 0 0,0 0 0,0
85-89 0 0,0 1 0,4 0 0,0 0 0,0
Total 248 100 247 100 296 100 255 100
Female MaleMale Female
Rural living areas Urban living areas

205
Appendix Table 13. Sex and education distribution of household members 15 years of age and above living in urban and rural living areas (%)
Frequency % Frequency % Frequency % Frequency %
No schooling 79 74,5 38 34,5 85 68,0 37 30,1
Can read and write 6 5,7 6 5,5 2 1,6 10 8,1
Primary school graduate 9 8,5 32 29,1 9 7,2 27 22,0
Primary school drop-out 5 4,7 13 11,8 9 7,2 12 9,8
Primary school student 1 0,9 1 0,9 3 2,4 6 4,9
Primary school graduate-(1st through 8th) 4 3,8 14 12,7 13 10,4 14 11,4
High school drop-out 0 0,0 0 0,0 0 0,0 3 2,4
High school student 0 0,0 2 1,8 3 2,4 4 3,3
High school graduate 1 0,9 4 3,6 1 0,8 5 4,1
University student 0 0,0 0 0,0 0 0,0 4 3,3
University and above 1 0,9 0 0,0 0 0,0 1 0,8
Total 106 100 110 100 125 100 123 100
No enrollment Urban living areas
Female MaleMale Female

206
Appendix Table 14. Employment status of household members based on age groups in late enrollment group (Late enrollment)
Age Not working Working Total
0-5Frequency
%803100
00,0
803100
6-9Frequency
%1.83899,6
70,4
1.845100
10-14Frequency
%1.22499,5
60,5
1.230100
15-19Frequency
%61189,7
7010,3
681100
20-24Frequency
%25278,3
7021,7
322100
25-29Frequency
%26471,9
10328,1
367100
30-34Frequency
%31264,3
17335,7
485100
35-39Frequency
%29960,2
19839,8
497100
40-44Frequency
%17653,7
15246,3
328100
45-49Frequency
%11058,8
7741,2
187100
50-54Frequency
%49
59,034
41,083
100
55-59Frequency
%48
84,29
15,857
100
60-64Frequency
%19
70,48
29,627
100
65-69Frequency
%23
88,53
11,526
100
70-74Frequency
%13
1000
0,013
100
75-79Frequency
%12
92,31
7,713
100
80-84Frequency
%7
70.03
30.010
100
85-89Frequency
%3
1000
0,03
100
90+...Frequency
%4
1000
0,04
100

207
Appendix Table 15. Occupational distribution of household members15 years of age and above
Frequency % Frequency % Frequency %
Soldier 29 0,9 7 1,5 36 1,0
State employee/civil servant 25 0,8 5 1,1 30 0,8
Seasonal worker in the city they live in 20 0,6 3 0,6 23 0,6
Retired, does not work 12 0,4 - - 12 0,3
Professional Self-employed (Doctor, Lawyer) 5 0,2 - - 5 0,1
Operates medium/large scale opera-tions, employer 3 0,1 - - 3 0,1
Administrator 3 0,1 - - 3 0,1
Total 228 3,2 44 4,2 272 3,3
Late enrollment No enrollment Not enrolling on time (Total)
Appendix Table 16. Distribution of educational backgrounds of the mothers
Frequency % Frequency % Frequency %
No schooling 683 71,8 114 85,1 797 73,5
Can read and write 57 6 1 0,7 58 5,3
Primary school graduate 134 14,1 14 10,4 148 13,6
Primary school drop-out 34 3,6 4 3 38 3,5
Primary school graduate-(1st through 8th) 28 2,9 - - 28 2,6
High school drop-out 2 0,2 - - 2 0,2
High school graduate 9 0,9 - - 9 0,8
University and above 4 0,4 1 0,7 5 0,5
Total 951 100 134 100 1.085 100
Late enrollment No enrollmentNot enrolling on
time (Total)
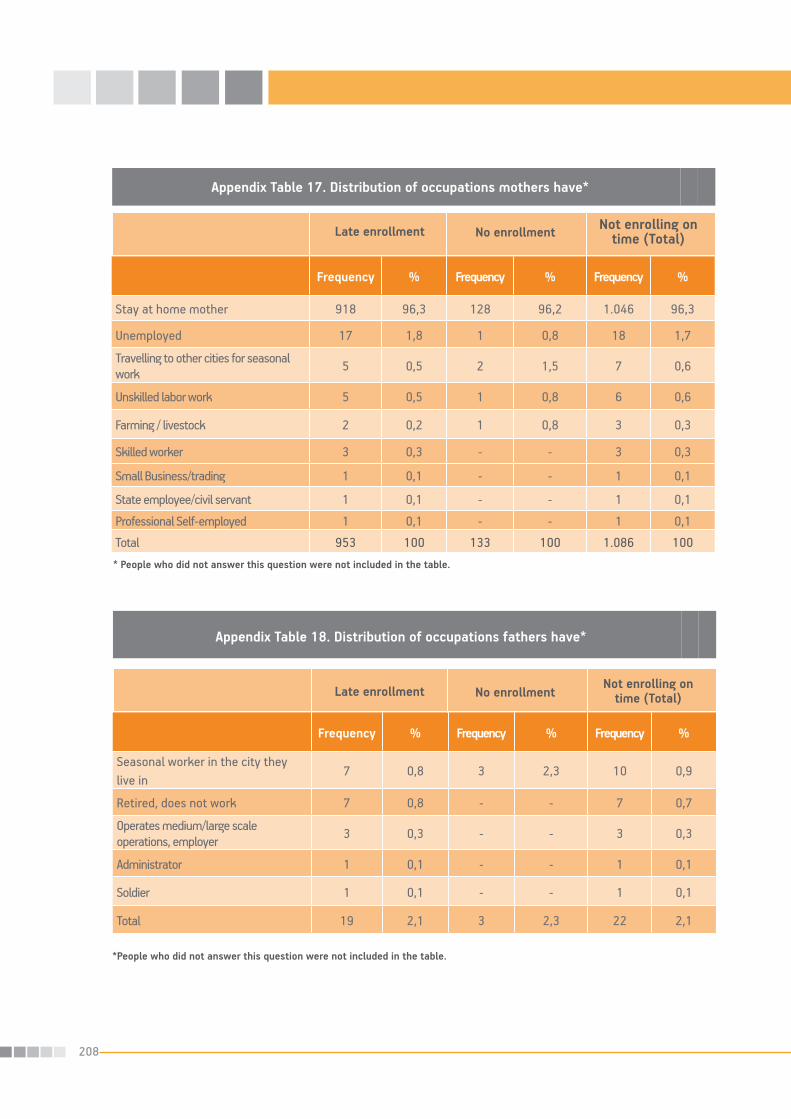
208
Appendix Table 17. Distribution of occupations mothers have*
Frequency % Frequency % Frequency %
Stay at home mother 918 96,3 128 96,2 1.046 96,3
Unemployed 17 1,8 1 0,8 18 1,7
Travelling to other cities for seasonal work 5 0,5 2 1,5 7 0,6
Unskilled labor work 5 0,5 1 0,8 6 0,6
Farming / livestock 2 0,2 1 0,8 3 0,3
Skilled worker 3 0,3 - - 3 0,3
Small Business/trading 1 0,1 - - 1 0,1
State employee/civil servant 1 0,1 - - 1 0,1
Professional Self-employed 1 0,1 - - 1 0,1
Total 953 100 133 100 1.086 100
* People who did not answer this question were not included in the table.
Late enrollment No enrollment Not enrolling on time (Total)
Appendix Table 18. Distribution of occupations fathers have*
Frekans Yüzde Frekans Yüzde Frekans Yüzde
Yaşadığı şehirde mevsimlik işçi 7 0.8 3 2.3 10 0.9
Emekli çalışmıyor 7 0.8 - - 7 0.7
Orta/büyük ölçekli işletmeci/işveren
3 0.3 - - 3 0.3
Yönetici 1 0.1 - - 1 0.1
Asker 1 0.1 - - 1 0.1
Toplam 19 2.1 3 2.3 22 2.1
Geç Kayıt Kayıtsız Zamanında kayıt olmayan (Toplam)
Frequency % Frequency % Frequency %
Seasonal worker in the city they live in
7 0,8 3 2,3 10 0,9
Retired, does not work 7 0,8 - - 7 0,7
Operates medium/large scale operations, employer 3 0,3 - - 3 0,3
Administrator 1 0,1 - - 1 0,1
Soldier 1 0,1 - - 1 0,1
Total 19 2,1 3 2,3 22 2,1
*People who did not answer this question were not included in the table.
Late enrollment No enrollmentNot enrolling on
time (Total)

209
Appendix Table 19. Rental rates*(This question was asked to those who lived in rental homes)
Frequency % Frequency % Frequency %
100 TL or less 10 6,7 1 6,3 11 6,7
10 - 150 TL 78 52,3 10 62,5 88 53,3
151 - 200 TL 32 21,5 - - 32 19,4
201 - 250 TL 16 10,7 3 18,8 19 11,5
251 TL and higher 13 8,7 2 12,5 15 9,1
Total 149 100 16 100 165 100
*People who did not answer this question were not included in the table.
Late enrollment No enrollmentNot enrolling on
time (Total)
Appendix Table 20. Distribution of the size of the residence*(Garden etc., not included for the houses)
Frequency % Frequency % Frequency %
50 m2 and less 34 4,3 7 7,6 41 4,7
5 - 100 m2 577 73,5 63 68,5 640 73,0
101 - 150 m2 144 18,3 19 20,7 163 18,6
151 - 200 m2 24 3,1 3 3,3 27 3,1
201 m2 and above 6 0,8 - - 6 0,7
Total 785 100 92 100 877 100
*People who did not answer this question were not included in the table.
Late enrollment No enrollmentNot enrolling on
time (Total)

210
Appendix Table 21. Reasons for the difference between the actual age and the age indicated in state birth certificates* (BC)
Frequency % Frequency % Frequency %
Going to the registrar’s office late (Registering the child with the citizenship bureau late)
9 69,2 1 14,3 10 50,0
Older sibling passing away around the time of the target child’s birth and using the deceased child’s ID
3 23,1 - - 3 15,0
The father decided that this was the right thing - - 2 28,6 2 10,0
Official working at the registrar’s of-fice at the citizenship bureau made a mistake
1 14,3 1 5,0
The child was a girl, so we wanted her to go to school early 1 7,7 - - 1 5,0
We wanted to enroll the child with the sibling on the same day as though they were twins
- - 1 14,3 1 5,0
We did not know the child’s actual age so we registered the child at a younger age
- - 1 14,3 1 5,0
Because the child’s dad had passed away, so registered the child later - - 1 14,3 1 5,0
Total 13 100 7 100 20 100
Late enrollment No enrollment Not enrolling on time (Total)
* More than one answer was given.

211
Appendix Table 22. Detailed description of the problems children experienced at birth *(This question was asked to those who indicated that the child had some health problems when born)
Frequency %* Frequency %* Frequency %*
Developmental problem 40 31,5 1 3,7 41 26,6
Seizures 11 8,7 3 11,1 14 9,1
Physical disability 6 4,7 3 11,1 9 5,8
Problems with the eyes 7 5,5 1 3,7 8 5,2
Bronchitis 7 5,5 - - 7 4,5
Hearing problems 3 2,4 3 11,1 6 3,9
Nasal Polyp 4 3,1 - - 4 2,6
Shortness of breath 3 2,4 1 3,7 4 2,6
Heart failure 3 2,4 - - 3 1,9
Skin Disorder 3 2,4 - - 3 1,9
Speech disorder 1 0,8 2 7,4 3 1,9
Epilepsy 1 0,8 2 7,4 3 1,9
Anemia 2 1,6 1 3,7 3 1,9
Disease of the valves of the heart 2 1,6 - - 2 1,3
Oxygen deprivation of the brain 2 1,6 - - 2 1,3
Asthma 2 1,6 - - 2 1,3
Problems with the urinary track 2 1,6 - - 2 1,3
Problems with comprehension/ slow comprehension 1 0,8 1 3,7 2 1,3
Constant fainting 2 1,6 - - 2 1,3
Undiagnosed - - 2 7,4 2 1,3
Hole in heart 2 1,6 - - 2 1,3
Swellings in the bones of hands and feet 1 0,8 - - 1 0,6
Oxygen deprivation at birth 1 0,8 - - 1 0,6
Late enrollmentBase:116 People
No enrollmentBase: 26 People
Not enrolling on time (Total) Base: 142
People

212
Frequency %* Frequency %* Frequency %*
Arteriosclerosis 1 0,8 - - 1 0,6
Hepatitis 1 0,8 - - 1 0,6
Staying in an incubator due to swallow-ing contaminated water 1 0,8 - - 1 0,6
Familial Mediterranean Fever 1 0,8 - - 1 0,6
Chickenpox 1 0,8 - - 1 0,6
Spastic - - 1 3,7 1 0,6
Premature birth 1 0,8 - - 1 0,6
Handicaps of the lower back 1 0,8 - - 1 0,6
Mute and deaf - - 1 3,7 1 0,6
Highly contagious infection - - 1 3,7 1 0,6
Mental disability - - 1 3,7 1 0,6
Sinusitis 1 0,8 - - 1 0,6
Problems with tonsils - - 1 3,7 1 0,6
Problems with lips 1 0,8 - - 1 0,6
Heart being on the right side 1 0,8 - - 1 0,6
Kidney disease - - 1 3,7 1 0,6
Lung cysts 1 0,8 - - 1 0,6
Pneumonia 1 0,8 - - 1 0,6
Staying in intensive care for a year after birth 1 0,8 - - 1 0,6
Edema of the hip - - 1 3,7 1 0,6
Disabled at birth 1 0,8 - - 1 0,6
Goiter 1 0,8 - - 1 0,6
Undergoing constant colds 1 0,8 - - 1 0,6
Late enrollmentBase:116 People
No enrollmentBase: 26 People
Not enrolling on time (Total) Base: 142
People
Appendix Table 22. Continued
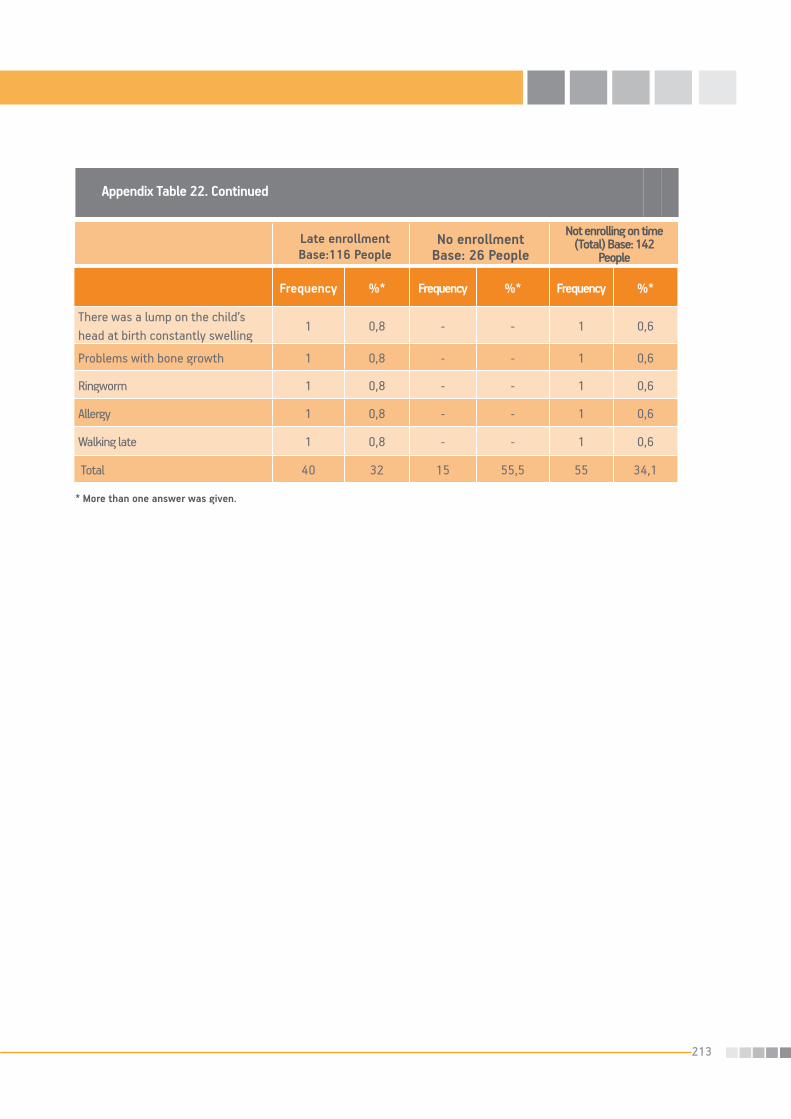
213
Frequency %* Frequency %* Frequency %*
There was a lump on the child’s head at birth constantly swelling
1 0,8 - - 1 0,6
Problems with bone growth 1 0,8 - - 1 0,6
Ringworm 1 0,8 - - 1 0,6
Allergy 1 0,8 - - 1 0,6
Walking late 1 0,8 - - 1 0,6
Total 40 32 15 55,5 55 34,1
* More than one answer was given.
Late enrollmentBase:116 People
No enrollmentBase: 26 People
Not enrolling on time (Total) Base: 142
People
Appendix Table 22. Continued

214
Appendix Table 23. Having and illness or a disability that would prevent the child from enrolling in school on time* (Not enrolling in school on time, Base: 133 People)
(This question was asked to those who reported that the child had and illness/special needthat would prevent the child from enrolling in school)
Frequency %**
Developmental problems 13 9,6
Physical disability 11 8,1
Bronchitis 9 6,7
Problems with the eyes 8 5,9
Low weight 8 5,9
Heart problems 7 5,2
Familial Mediterranean Fever 6 4,4
Epilepsy 6 4,4
Child underwent surgery 6 4,4
Hearing impaired 5 3,7
Seizures 5 3,7
Speech disorder 4 3,0
Difficulties with breathing because of nasal polyp 3 2,2
Skin disorder 3 2,2
Weakness 2 1,5
Hepatitis 2 1,5
Spastic 2 1,5
Kidney Disorder 2 1,5
Typhoid disease 2 1,5
Fainting 2 1,5
Comprehension problems 2 1,5
Hyperactivity 2 1,5
Diabetes 2 1,5
Familial Mediterranean Fever 1 0,7
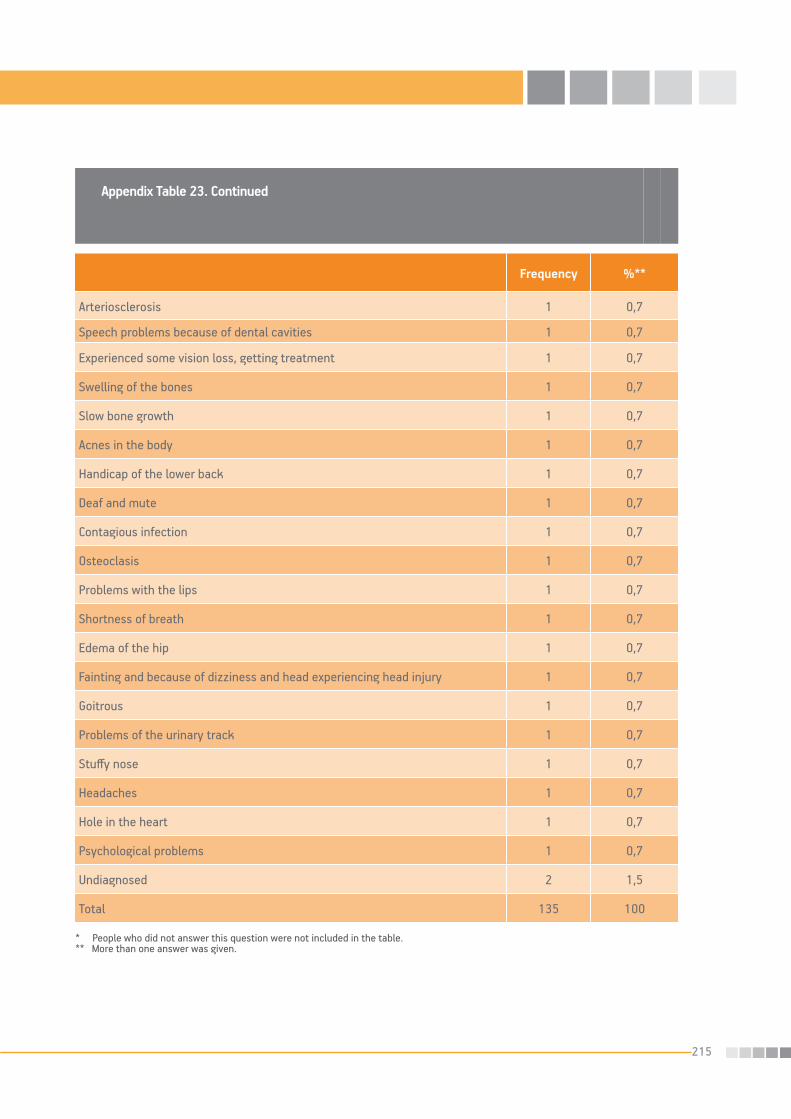
215
Frequency %**
Arteriosclerosis 1 0,7
Speech problems because of dental cavities 1 0,7
Experienced some vision loss, getting treatment 1 0,7
Swelling of the bones 1 0,7
Slow bone growth 1 0,7
Acnes in the body 1 0,7
Handicap of the lower back 1 0,7
Deaf and mute 1 0,7
Contagious infection 1 0,7
Osteoclasis 1 0,7
Problems with the lips 1 0,7
Shortness of breath 1 0,7
Edema of the hip 1 0,7
Fainting and because of dizziness and head experiencing head injury 1 0,7
Goitrous 1 0,7
Problems of the urinary track 1 0,7
Stuffy nose 1 0,7
Headaches 1 0,7
Hole in the heart 1 0,7
Psychological problems 1 0,7
Undiagnosed 2 1,5
Total 135 100
Appendix Table 23. Continued
* People who did not answer this question were not included in the table.** More than one answer was given.

216
Appendix Table 24. Height of the child who was not enrolled in school on time based on the actual year of birth
2001 20021995
Frequency %* Frequency %* Frequency %*
Late enrollment
Shorter than a meter
1.00 - 1.10 meter
1.11 - 1.20 meter
1.21 meter and above
Total
-
-
-
-
-
-
-
-
-
-
17
41
23
24
105
16,2
39,0
21,9
22,9
100
1
-
1
-
2
50
-
-
100
No enrollment
Shorter than a meter
1.00 - 1.10 meter
1.11 - 1.20 meter
1.21 meter and above
Total
-
-
-
1
1
-
-
-
100
100
2
4
2
5
13
15,4
30,8
15,4
38,5
100
-
-
-
-
-
-
-
-
-
-
Not enrolling on time (Total)
Shorter than a meter
1.00 - 1.10 meter
1.11 - 1.20 meter
1.21 meter and above
Total
-
-
-
1
1
-
-
-
100
100
19
45
25
29
118
16,1
38,1
21,2
24,6
100
1
-
1
-
2
50
-
50
-
100

217
Appendix Table 25. Weight distribution of children*(This question was asked to those who indicated to the child’s weight.)
Frequency %** Frequency %** Frequency %**
Less than 20 kilograms 55 29,9 6 37,5 61 30,5
21 - 24 kg 48 26,1 1 6,3 49 24,5
25 - 29 kg 63 34,2 6 37,5 69 34,5
30 - 34 kg 14 7,6 2 12,5 16 8,0
35 kg and above 4 2,2 1 6,3 5 2,5
Total 184 100 16 100 200 100
Late enrollment No enrollment Not enrolling on time (Total)
Appendix Table 26. Sources of information about the school enrollment age*
Frequency %** Frequency %** Frequency %**
Kindergarten teacher/teacher 7 0,5 - - 7 0,4
Principal of the school 2 0,1 - - 2 0,1
Spouse 1 0,1 1 0,5 2 0,1
Imam 1 0,1 - - 1 0,1
Students 1 0,1 - - 1 0,1
Does not remember 9 0,6 2 1,1 11 0,7
Total 21 1,5 3 1,6 24 1,5
Late enrollment No enrollment Not enrolling on time (Total)
* People who did not answer this question were not included in the table.** More than one answer was given.
* People who did not answer this question were not included in the table.** More than one answer was given.

218
Frequency % of Responses
% of Respondents**
We had just moved here last year, so we were unable to register the child to school
5 0,5 0,6
Was having a difficulty with speech 4 0,4 0,5
Because we missed the registration period 4 0,4 0,5
Wanted the child to go to school with his/her friends 4 0,4 0,5
The father did not want to 4 0,4 0,5
We sent the child to kindergarten so that the child would grow and mature
4 0,4 0,5
Because we could not pay the fee the school asked during reg-istration for the enrollment of the child
3 0,3 0,4
We were abroad 3 0,3 0,4
We wanted the child to go to school with the sibling who was a year younger
2 0,2 0,2
We could not enroll the child in school because of the child’s age being recorded younger the child actually was
2 0,2 0,2
The father was out of town 2 0,2 0,2
There was a deficit of teachers, that was the reason 2 0,2 0,2
School administration did not take the child because the child’s Turkish was not good
2 0,2 0,2
We enrolled the child in school but the teacher sent the child to kindergarten because the child was not able to write
2 0,2 0,2
There were safety problems in the route the child was going to take to go to school last year
1 0,1 0,1
Last year, around the time school started, a family member fell ill
1 0,1 0,1
Last year, a family member passed away around the time school started
1 0,1 0,1
We thought the child would develop better and be more suc-cessful in school if we waited another year
1 0,1 0,1
The child was not toilet trained last year 1 0,1 0,1
The father could not write or read, so we waited for the child’s brother to come and do it
1 0,1 0,1
Family elders did not give permission 1 0,1 0,1
The child was too shy 1 0,1 0,1
Appendix Table 27. Reasons for late enrollment* (Late enrollment, Base: 843 People)

219
Frequency Percentage of Responses
Percentage of Respond-
ents**Because of the child’s problem, we did not want the child to go to a school that was far (could not speak well)
1 0,1 0,1
Because the classrooms were overcrowded 1 0,1 0,1
Child was working as a shepherd, we could not send the child to school
1 0,1 0,1
I enrolled the child in school, but got scared of the teacher and quit school after a month
1 0,1 0,1
No reason 1 0,1 0,1
I already sent my child to school at the age of 6 1 0,1 0,1
Biological mother did not send us the child’s state birth certifi-cate, that’s why
1 0,1 0,1
We weren’t here during the registration period 1 0,1 0,1
Because the child attended kindergarten 1 0,1 0,1
Total 62 6,2 7,0
Appendix Table 27. Continued
Appendix Table 28. Reasons for late enrollment of the child who had a disability/illness* (Late enrollment, Base: 104 People)
Frequency Percentage of Responses
Percentage of Respondents**
Last year, around the time school started, a family member fell ill 1 0,7 1,0
Because we could not pay the registration fee the school asked for
1 0,7 1,0
Because we missed the registration period 1 0,7 1,0School administration did not admit the child because the child’s Turkish was not good
1 0,7 1,0
Child was getting rehabilitation, that is why 1 0,7 1,0
Total 5 3,5 5,0
* People who did not answer this question were not included in the table.** More than one answer was given.
* People who did not answer this question were not included in the table.** More than one answer was given.

220
Appendix Table 29. Reasons for no enrollment *(No enrollment, Base: 106 People)
Frequency Percentage of Responses
Percentage of Respondents**
Because we wanted the child to go to school with the sibling 1 0,8 0,9
Because the child’s sibling fell ill 1 0,8 0,9Because the child’s father did not approve the child to go to school
1 0,8 0,9
Because the actual age of the child was too old 1 0,8 0,9
Because of the death of the father 1 0,8 0,9
The child did not have a birth certificate card 1 0,8 0,9
The child was going to live in the village even after going to school 1 0,8 0,9
Because the child’s age was showing the child older than the child was
1 0,8 0,9
Principal sent the child back home claiming the child did not know anything
1 0,8 0,9
School administration did not admit the child without providing explanations
1 0,8 0,9
Schools quota was full 1 0,8 0,9
Our life style that of a nomadic one (migrant worker) 1 0,8 0,9
Total 12 9,6 10,8
* People who did not answer this question were not included in the table.** More than one answer was given.

221
Appendix Table 30. Whether they wanted to enroll the child in school in 2007-2008 academic year disaggregated by the province they lived in
(Late enrollment)
Frequency % Frequency % Frequency %
Ağrı 83 70,3 35 29,7 118 100
Bitlis 20 47,6 22 52,4 42 100
Diyarbakır 114 61,3 72 38,7 186 100
Gümüşhane 9 60,0 6 40,0 15 100
Hakkari 17 63,0 10 37,0 27 100
Muş 36 60,0 24 40,0 60 100
Osmaniye 35 61,4 22 38,6 57 100
Şanlıurfa 156 69,6 68 30,4 224 100
Şırnak 57 80,3 14 19,7 71 100
Van 108 68,8 49 31,2 157 100
No, I did not want it Yes, I wanted it Total
Appendix Table 31. Whether they wanted to enroll the child in school in 2007-2008 academic year disaggregated by fathers’ educational levels (Late enrollment)
Frequency % Frequency % Frequency %
No, I did not want it 279 67,9 298 64,5 36 65,5
Yes, I wanted it 132 32,1 164 35,5 19 34,5
Total 411 100 462 100 55 100
Has no schooling Primary/First through eighth grade graduate
Graduate of high school or higher

222
Frequency % Frequency %
200 TL and under 136 21,8 59 18,7
201 - 300 TL 94 15,0 38 12,0
301 - 400 TL 105 16,8 41 13,0
401 - 500 TL 85 13,6 53 16,8
501 - 600 TL 72 11,5 59 18,7
601 - 750 TL 55 8,8 22 7,0
751 TL and above 78 12,5 44 13,9
Total 625 100 316 100
Appendix Table 32. Whether they wanted to enroll the child in school in 2007-2008 academic year disaggregated by total household income (Late enrollment)
No, I did not want it Yes, I wanted it

223
Appendix Table 33. Reasons for children to stay out of school despite wanting to enroll the child in school during 2007-2008 academic year*
(Late enrollmentBase: 310 people) (This question was asked to those who attempted to enroll the child in school during
2007-2008 academic year.)
Frequency Percentage of Responses
Percentage of Respondents**
Took the child to be enrolled in school but was not able to because the child cried
5 1,6 1,6
Principal did not allow for the child to be enrolled because the child did not speak Turkish well
4 1,3 1,3
Could not send the child to school because the school was too far 4 1,3 1,3
I did not do anything because the family members did not want to 3 0,9 1
The child did not have a state birth certiicate 3 0,9 1
The child was ill, so I could not enroll the child in school 2 0,6 0,6
We sent the child to kindergarten because the child was underdeveloped
1 0,3 0,3
Because of our address the school did not take the child’s enrollment
1 0,3 0,3
We had just moved from the village, so the child did not speak Turkish and we enrolled the child in kindergarten for the child to mature
1 0,3 0,3
I enrolled the child in school but was afraid of the teacher so I took the child from school a month later
1 0,3 0,3
I enrolled the child in school but there was no teacher, so the child could not go to school
1 0,3 0,3
We enrolled the child in school but the teacher kicked the child out of school by saying the child was not improving***
1 0,3 0,3
Total 27 8,4 8,6
* People who did not answer this question were not included in the table.** More than one answer was given.*** Following set of events occurred for one particular child: The child was enrolled in school, but the teacher sent the child home claiming that the child was not succeeding. Then, the principle of the school recalled the child for the child to get education, but at the end of year, the child did not get’a grade report despite being enrolled in school.

224
Appendix Table 34. Attempts made to enroll the child in school previously disaggregated by the province they live in (No enrollment)
Provinces No, I did not Yes I did Total
AğrıFrequency
%3
100,00
0,03
100
BitlisFrequency
%2
66,71
33,33
100
DiyarbakırFrequency
%12
92,31
7,713
100
Hakkâri Frequency
%3
100.00
0.03
100
MuşFrequency
%11
84,62
15,413
100
OsmaniyeFrequency
%2
33,34
66,76
100
ŞanlıurfaFrequency
%39
95,12
4,941
100
ŞırnakFrequency
%1
100,00
0,01
100
VanFrequency
%41
80,410
19,651
100

225
Appendix Table 35. Reasons to enroll the children in school after a year delay*(Late enrollment, Base: 632 People)
Frequency % of Responses
% of Respond-
ents**
Because we obtained the child’s state birth certificate 7 1,0 1,1The child overcame his/her fear 6 0,9 0,9
We sent the child to school despite having financial problems 5 0,7 0,8
The child matured enough in kindergarten 5 0,7 0,8
We completed the moving process 4 0,6 0,6
People around me told me I needed to enroll the child in school 3 0,4 0,5
I wanted to enroll the child in school anyway, and we did it 3 0,4 0,5
The sibling got older, we sent them together 3 0,4 0,5
We did not want the child to be ignorant 3 0,4 0,5
Because of mandatory education 3 0,4 0,5
Principal/teachers helped out 3 0,4 0,5
Family elders decided to enroll the child in school 2 0,3 0,3
We received a written notification 2 0,3 0,3
A school was built that was close by 2 0,3 0,3
Resolved the problems with bussing the children to school 2 0,3 0,3
Came from abroad and enrolled the child 2 0,3 0,3
Sending the child to a school for the children with disabilities this year
2 0,3 0,3
Child’s brother came, and we enrolled the child in school 1 0,1 0,2
Child did not want to go to school, the teachers came convinced the child
1 0,1 0,2
We fixed the error about the child’s age on the ID card 1 0,1 0,2
Stopped working as seasonal workers 1 0,1 0,2
The child’s mother’s health problem was resolved 1 0,1 0,2
I already sent the child to school at the age of 6 1 0,1 0,2I sent the child first to kindergarten then to primary school. Teachers found the child’s progress not sufficient, then the child repeated kindergarten first, now the child finished first grade
1 0,1 0,2
Total 57 7,8 9,3
* People who did not answer this question were not included in the table.** More than one answer was given.

226
Appendix Table 36. Reasons for enrolling children in school during 2008-2009 academic year instead of enrolling children in school during 2007-2008
academic year*(Late enrollment, Base: 318 People)
Frequency Percentage of Responses
Percentage of
Respond-ents**
We got a birth certificate for the child 3 0,9 0,9
Child got over his/her fear of school 3 0,9 0,9
So that the child would go to school with the friends/peers 3 0,9 0,9
We did not want the child to be ignorant 3 0,9 0,9
Classrooms sizes allowed for the enrollment 3 0,9 0,9
Forced the child to enroll and we did it 3 0,9 0,9
People around me told me to enroll the child in school 2 0,6 0,6
We were able to pay the registration fee for the enrollment 2 0,6 0,6
Child learned a little Turkish, then the school administration ac-cepted the child
2 0,6 0,6
We finally finished moving 1 0,3 0,3
Child did not want to go to school, teacher came and convinced the child then we sent the child to school
1 0,3 0,3
We got loans 1 0,3 0,3
Family/friends helped financially 1 0,3 0,3
We received a written document for it 1 0,3 0,3
We corrected child’s age in the birth certificate card 1 0,3 0,3
Gave another address to school and had the child enroll in school 1 0,3 0,3
Because the education was mandatory 1 0,3 0,3
I convinced my spouse (the father) 1 0,3 0,3
Teacher did not want to but we did it forcefully 1 0,3 0,3

227
Frequency % of Responses
% of Respond-
ents**
Went to kindergarten and developed 1 0,3 0,3
Taught how to write and sent to school 1 0,3 0,3
The child was in school the previous year but had not received grade report, the child just repeated this year
1 0,3 0,3
We sent the child to first to kindergarten then to primary school, the teacher had not found the child’s development sufficient 1 0,3 0,3
Child was sick the second semester, the child’s record was erased, we are going to repeat the next year
1 0,3 0,3
We are sending the child to a school for children with disabilities 1 0,3 0,3
Total 40 12 12
Appendix Table 36. Continued
* People who did not answer this question were not included in the table.** More than one answer was given.

228
Appendix Table 37. Being informed of article 15 of primary schools regulations of Ministry of National Education disaggregated by the province they lived in
(Late enrollment)
Provinces I know I don’t know Total
AğrıFrequency
%18
15,499
84,6117100
BitlisFrequency
%28
66,714
33,342
100
DiyarbakırFrequency
%44
23,714276,3
186100
GümüşhaneFrequency
%4
26,711
73,315
100
Hakkâri Frequency
%0
0,027
100,027
100
MuşFrequency
%19
31,741
68,360
100
OsmaniyeFrequency
%20
35,137
64,957
100
ŞanlıurfaFrequency
%46
20,717679,3
222100
ŞırnakFrequency
%4
5,667
94,471
100
VanFrequency
%41
26,111673,9
157100
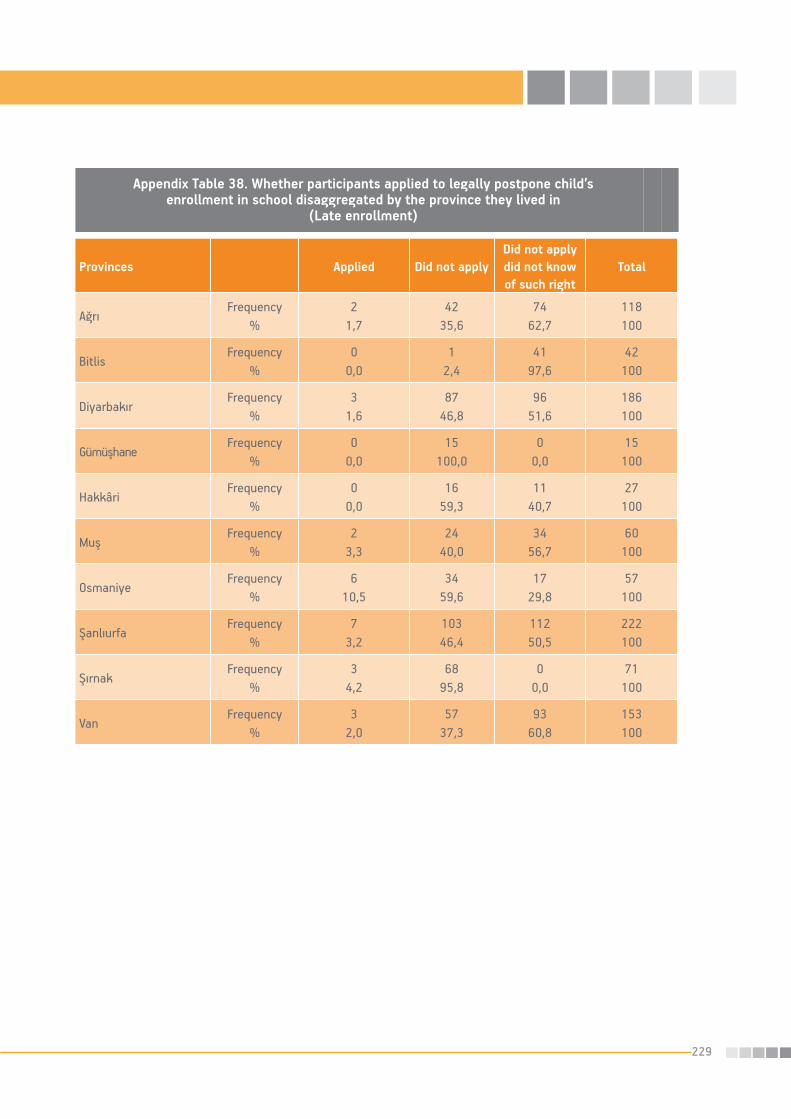
229
Appendix Table 38. Whether participants applied to legally postpone child’s enrollment in school disaggregated by the province they lived in
(Late enrollment)
Provinces Applied Did not applyDid not apply did not know of such right
Total
AğrıFrequency
%2
1,742
35,674
62,7118100
BitlisFrequency
%0
0,01
2,441
97,642
100
DiyarbakırFrequency
%3
1,687
46,896
51,6186100
GümüşhaneFrequency
%0
0,015
100,00
0,015
100
Hakkâri Frequency
%0
0,016
59,311
40,727
100
MuşFrequency
%2
3,324
40,034
56,760
100
OsmaniyeFrequency
%6
10,534
59,617
29,857
100
ŞanlıurfaFrequency
%7
3,210346,4
11250,5
222100
ŞırnakFrequency
%3
4,268
95,80
0,071
100
VanFrequency
%3
2,057
37,393
60,8153100

230
Appendix Table 39. Whether participants were informed of the school enrollment age during 2007-2008 academic year disaggregated by the province they lived in
(Late enrollment)
Provinces Not informed Informed Total
AğrıFrequency
%11598,3
21,7
117100
BitlisFrequency
%42
100,00
0,042
100
DiyarbakırFrequency
%18297,8
42,2
186100
GümüşhaneFrequency
%13
86,72
13,315
100
Hakkâri Frequency
%27
100,00
0,027
100
MuşFrequency
%55
91,75
8,360
100
OsmaniyeFrequency
%55
96,52
3,557
100
ŞanlıurfaFrequency
%22198,2
41,8
225100
ŞırnakFrequency
%62
87,39
12,771
100
VanFrequency
%15196,2
63,8
157100

231
Appendix Table 40. People who were influential in the decision to not enroll children in school during 2007-2008 academic year*
Frequency % of Responses
% of Respondents** Frequency % of
Responses% of
Respondents**
Mother - Father together 539 54,9 56,2 57 42,2 41,0
Father 309 31,5 32,2 63 46,7 45,3
Mother 78 8 8,1 11 8,1 7,9
Principle of the school 16 1,6 1,7 - - -
Teacher 14 1,4 1,5 - - -
Older brother 6 0,6 0,6 3 2,2 2,2
Uncle-Father’s brother 5 0,5 0,5 - - -
Grandfather 4 0,4 0,4 - - -
Older sister 3 0,3 0,3 1 0,7 0,7
Self decision 2 0,2 0,2 3 2,2 2,2
Step mother 1 0,1 0,1 - - -
Grandmother-Father’s mother 1 0,1 0,1 - - -
Grandfather 1 0,1 0,1 - - -
Uncle-Mother’s brother 1 0,1 0,1 - - -
Yenge-Wife of a male relative 1 0,1 0,1 - - -
School administration - - - 1 0,7 0,7
Total 981 100 102,3 139 100 103,0
Late enrollmentBase: 959 people
No enrollmentBase:135 People
* People who did not answer this question were not included in the table.** More than one answer was given.

232
Appendix Table 41. Distribution of the people who were most influential in the decision to not enroll children in school during 2007-2008 academic year*
Frequency % Frequency % Frequency %
Father 742 77,6 119 88,8 861 79,0
Mather 170 17,8 9 6,7 179 16,4
Principle of the school 17 1,8 - - 17 1,6
Teacher 13 1,4 1 0,7 14 1,3
Older Brother 3 0,3 2 1,5 5 0,5
Mother-Father Together 2 0,2 3 2,2 5 0,5
Grandfather 3 0,3 - - 3 0,3
Older Sister 2 0,2 - - 2 0,2
Grandmother-Father’s Mother’s
1 0,1 - - 1 0,1
Grandfather 1 0,1 - - 1 0,1
Uncle-Father’s brother 1 0,1 - - 1 0,1
Uncle-Mother’s brother 1 0,1 - - 1 0,1
Total 956 100 134 100 1090 100
Late Enrollment No enrollment Not enrolling on time (Total)
*People who did not answer this question were not included in the table.
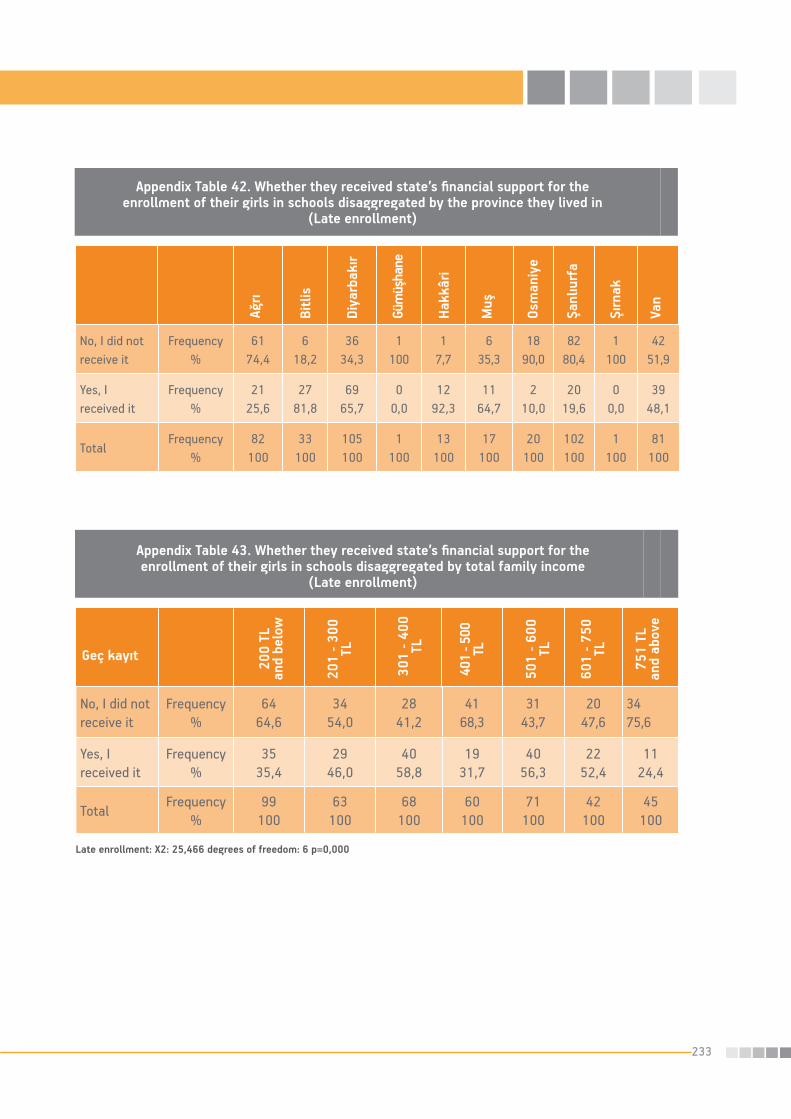
233
Appendix Table 42. Whether they received state’s financial support for the enrollment of their girls in schools disaggregated by the province they lived in
(Late enrollment)
No, I did not receive it
Frequency%
6174,4
618,2
3634,3
1100
17,7
635,3
1890,0
8280,4
1100
4251,9
Yes, I received it
Frequency%
2125,6
2781,8
6965,7
00,0
1292,3
1164,7
210,0
2019,6
00,0
3948,1
TotalFrequency
%82
10033
100105100
1100
13100
17100
20100
102100
1100
81100
Ağ
rı
Bitl
is
Diya
rbak
ır
Hakk
âri
Muş
Osm
aniy
e
Şanl
ıurf
a
Şırn
ak
Van
Güm
üşha
ne
Appendix Table 43. Whether they received state’s financial support for the enrollment of their girls in schools disaggregated by total family income
(Late enrollment)
Late enrollment: Χ2: 25,466 degrees of freedom: 6 p=0,000
No, I did not receive it
Frequency%
6464,6
3454,0
2841,2
4168,3
3143,7
2047,6
3475,6
Yes, I received it
Frequency%
3535,4
2946,0
4058,8
1931,7
4056,3
2252,4
1124,4
TotalFrequency
%99
10063
10068
10060
10071
10042
10045
100
Geç kayıt
200
TL
and
belo
w
201
- 300
TL
301
- 400
TL
501
- 600
TL
601
- 750
TL
751
TL
and
abov
e
401
- 500
TL

234
(DATA COLLECTOR, ATTENTION! IN THE QUESTIONNAIRE, “THIS YEAR” MEANS 2008-2009 EDUCATION-AL YEAR, AND “LAST YEAR” MEANS 2007-2008 EDUCATIONAL YEAR)
SECTION I. QUATA FOLLOW UP QUESTIONS
K.1. The province the participant lives in:
(DATA COLLECTOR, ATTENTION! WHEN AN ADDRESSEE IN THE “SELECTED” LIST IS NOT FOUND, DO NOT GO TO THE “REPLACEMENT” LIST WITHOUT VISITING THE SAME HOUSEHOLD A TOTAL OF THREE TIMES!)
APPENDIX – II QUESTIONNAIRES Questionnaire for quantitative data collectionHello, This is ……………………..(Data collector indicate your name here), from GENAR research company. As GENAR Research Company, we are collaborating with professors from different universities currently working as faculty in school of education to conduct a research to examine factors associated with children’s timely enrollment in elementary schools. I want to ask you some questions about this issue. No information about you, your child or family will be shared with third parties and the information you provided will be kept confidential. Moreover, the answers you gave will be used within overall findings of the research. I would appreciate your help very much. Thank you in advance for your time.
Data Collector’s name
Address control
Telephone control
SPV ControlDate of Data
CollectionStarting
TimeEnd Time
…/…/2009
1. AĞRI 3. DİYARBAKIR 5. HAKKARİ 7. OSMANİYE 9. ŞIRNAK
2. BİTLİS 4. GÜMÜŞHANE 6. MUŞ 8. ŞANLIURFA 10. VAN
Tel:(212) 212 80 52 Faks: (212) 212 38 02www.genar.com.tr
Sample Number :……………………………………………SAMPLE TYPE: 1. SELECTED 2. REPLACEMENT 1 3. REPLACEMENT 2If moved on to Replacement 1, Reasons:1. Selected participant refused to participate 2. No one was found in the selected household,
2.1. How many times was the originally selected household was visited?:………………. 3. Wrong address for the originally selected householdOther……………………………………………If moved on to Replacement 2, Reasons:4. Replacement 1 refused to participate 5. No one was found in the replacement 1 household,
5.1. How many times was the originally selected household was visited?……………….6. Wrong address for the replacement 1 householdOther……………………………………………District :……………………..……….. Avenue/Street :……………………….………..Neighborhood :…………………….……….. Building number :…………………………………Village :…………………….……….. Apartment number :…………………………………
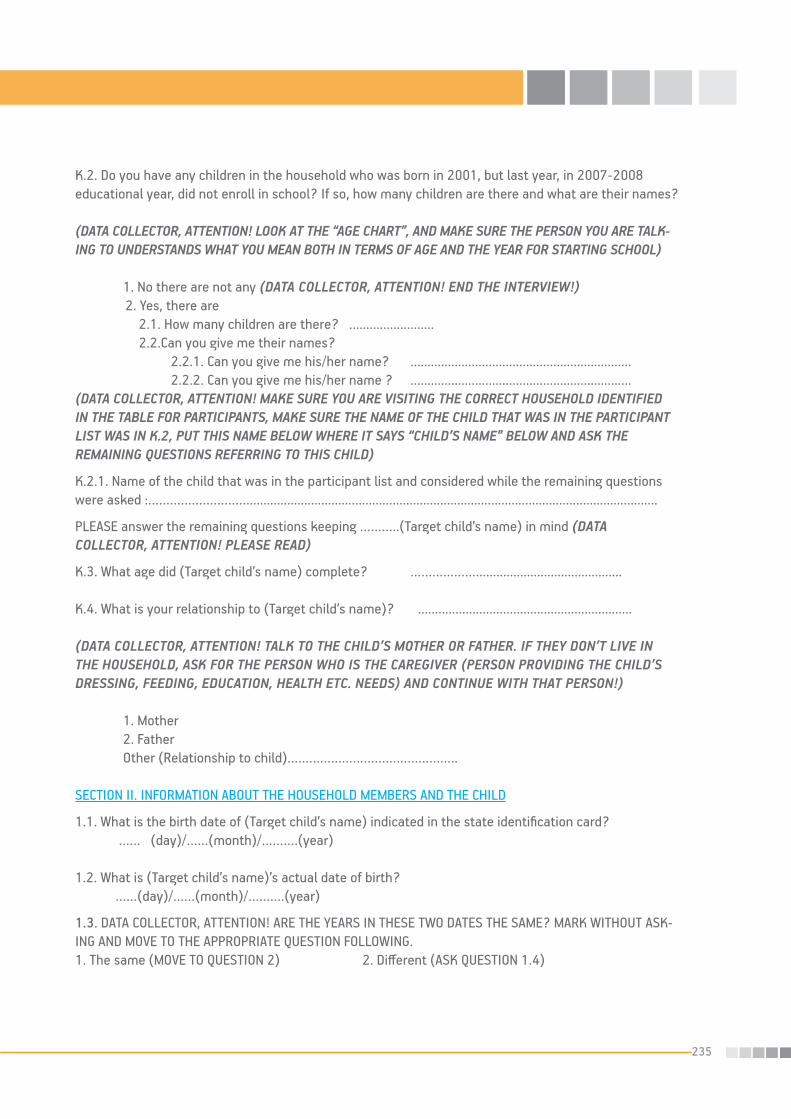
235
K.2. Do you have any children in the household who was born in 2001, but last year, in 2007-2008 educational year, did not enroll in school? If so, how many children are there and what are their names?
(DATA COLLECTOR, ATTENTION! LOOK AT THE “AGE CHART”, AND MAKE SURE THE PERSON YOU ARE TALK-ING TO UNDERSTANDS WHAT YOU MEAN BOTH IN TERMS OF AGE AND THE YEAR FOR STARTING SCHOOL)
1. No there are not any (DATA COLLECTOR, ATTENTION! END THE INTERVIEW!) 2. Yes, there are 2.1. How many children are there? ......................... 2.2.Can you give me their names? 2.2.1. Can you give me his/her name? ................................................................. 2.2.2. Can you give me his/her name ? .................................................................(DATA COLLECTOR, ATTENTION! MAKE SURE YOU ARE VISITING THE CORRECT HOUSEHOLD IDENTIFIED IN THE TABLE FOR PARTICIPANTS, MAKE SURE THE NAME OF THE CHILD THAT WAS IN THE PARTICIPANT LIST WAS IN K.2, PUT THIS NAME BELOW WHERE IT SAYS “CHILD’S NAME” BELOW AND ASK THE REMAINING QUESTIONS REFERRING TO THIS CHILD)
K.2.1. Name of the child that was in the participant list and considered while the remaining questions were asked :……………………….........................................................................................................................
PLEASE answer the remaining questions keeping ………..(Target child’s name) in mind (DATA COLLECTOR, ATTENTION! PLEASE READ)
K.3. What age did (Target child’s name) complete? ………………...........................................
K.4. What is your relationship to (Target child’s name)? ...............................................................
(DATA COLLECTOR, ATTENTION! TALK TO THE CHILD’S MOTHER OR FATHER. IF THEY DON’T LIVE IN THE HOUSEHOLD, ASK FOR THE PERSON WHO IS THE CAREGIVER (PERSON PROVIDING THE CHILD’S DRESSING, FEEDING, EDUCATION, HEALTH ETC. NEEDS) AND CONTINUE WITH THAT PERSON!)
1. Mother 2. Father Other (Relationship to child)………………………………………..
SECTION II. INFORMATION ABOUT THE HOUSEHOLD MEMBERS AND THE CHILD
1.1. What is the birth date of (Target child’s name) indicated in the state identification card? …… (day)/……(month)/……….(year)
1.2. What is (Target child’s name)’s actual date of birth? ……(day)/……(month)/……….(year)
1.3. DATA COLLECTOR, ATTENTION! ARE THE YEARS IN THESE TWO DATES THE SAME? MARK WITHOUT ASK-ING AND MOVE TO THE APPROPRIATE QUESTION FOLLOWING.1. The same (MOVE TO QUESTION 2) 2. Different (ASK QUESTION 1.4)

236
QUESTIONNAIRE FORM FOR EXAMINING THE FACTORS CONTRIBUTING TO NOT ENROLLING IN SCHOOL ON TIME
1.4. It looks like (Target child’s name)’s birth dates on his/her state identification card (ID) and what you gave me are different, Can you tell us what the reason for this discrepancy is? Why are the two dates different? (DATA COLLECTOR, ATTENTION! DON’T READ THE ANSWER SELECTIONS) 1. Older sibling died around the time he/she was born and family used the deceased child’s ID 2. Registrar’s official made an error 3. Delaying child’s registration and registering the child on the day registrar’s office was visited Other.……………………………………………………………………………………………………………………
2. Was (Target child’s name) healthy when he/she was born? How was his/her development? If there were any problems, what health problems did (Target child’s name) experience? Are these health problems still affecting (Target child’s name)s health? If so, what type of health problems? 1. Everything was normal (general health, height, weight, development) (GO TO QUESTION 3) 2. There were some problems 2.1. What types of problems? ……………………………………………………………………………………………………………………...... 2.2. Did these health problems last until now or did they get cured/ resolved/did the child get healthy?
1. Problems were only during infancy, they went away after that period (GO TO QUESTION 3) 2. Problems lasted throughout childhood 2.2.2. What were these problems? ………………………………………………………………………………………………………………
3. Does (Target child’s name) have any health problems or disabilities that would prevent him/her from going to school 1. No, the child does not have illness/special need (DATA COLLECTOR, ATTENTION! GO TO QUESTION 4) 2. Yes the child had an illness/special need 2.1. Can you specify the name of illness/disability? …………………………………………………………………………………………………………………………
(DATA COLLECTOR, ATTENTION! YOU MUST SPECIFY BY YEAR AND MONTH) 2.2. For how long does the child have an illness/disability? …………MONTH……………YEAR
4. Do you know (Target child’s name)’s height and weight? If so, can you state?
1. 2. don’t know I know 22.1. Can you tell the height/ and the weight?
1. Height1 (GO TO NEXT
LINE)2 ……….… cm
2. Weight 1 (GO TO Q.5) 2 …………. kg
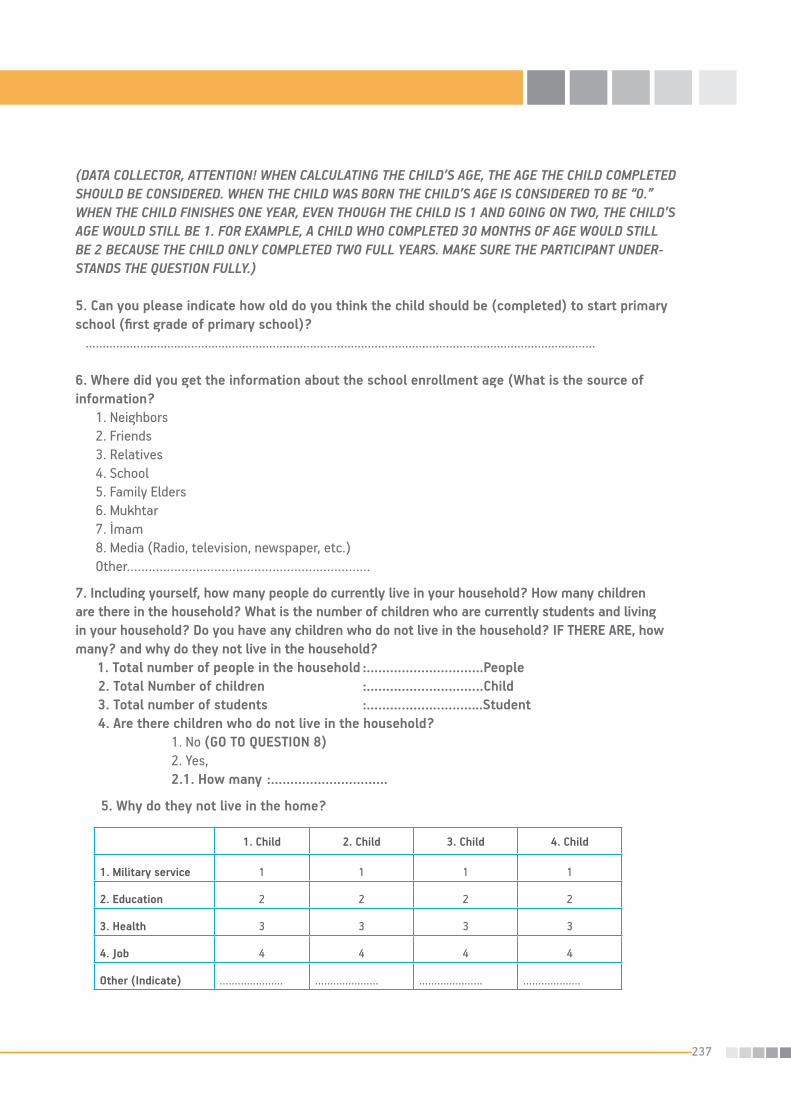
237
(DATA COLLECTOR, ATTENTION! WHEN CALCULATING THE CHILD’S AGE, THE AGE THE CHILD COMPLETED SHOULD BE CONSIDERED. WHEN THE CHILD WAS BORN THE CHILD’S AGE IS CONSIDERED TO BE “0.” WHEN THE CHILD FINISHES ONE YEAR, EVEN THOUGH THE CHILD IS 1 AND GOING ON TWO, THE CHILD’S AGE WOULD STILL BE 1. FOR EXAMPLE, A CHILD WHO COMPLETED 30 MONTHS OF AGE WOULD STILL BE 2 BECAUSE THE CHILD ONLY COMPLETED TWO FULL YEARS. MAKE SURE THE PARTICIPANT UNDER-STANDS THE QUESTION FULLY.)
5. Can you please indicate how old do you think the child should be (completed) to start primary school (first grade of primary school)? ......................................................................................................................................................
6. Where did you get the information about the school enrollment age (What is the source of information? 1. Neighbors 2. Friends 3. Relatives 4. School 5. Family Elders 6. Mukhtar 7. İmam 8. Media (Radio, television, newspaper, etc.) Other…………………………………………………………. 7. Including yourself, how many people do currently live in your household? How many children are there in the household? What is the number of children who are currently students and living in your household? Do you have any children who do not live in the household? IF THERE ARE, how many? and why do they not live in the household? 1. Total number of people in the household :…………………………People 2. Total Number of children :…………………………Child 3. Total number of students :………………………...Student 4. Are there children who do not live in the household? 1. No (GO TO QUESTION 8) 2. Yes, 2.1. How many :………………………… 5. Why do they not live in the home?
1. Child 2. Child 3. Child 4. Child
1. Military service 1 1 1 1
2. Education 2 2 2 2
3. Health 3 3 3 3
4. Job 4 4 4 4
Other (Indicate) ………………… ………………… ………………… ……………….

238
QUESTIONNAIRE FORM FOR EXAMINING THE FACTORS CONTRIBUTING TO NOT ENROLLING IN SCHOOL ON TIME
9. N
ow I
am g
oing
to a
sk y
ou q
uest
ions
abo
ut th
e ho
useh
old
mem
bers
. Ple
ase
incl
ude
hous
ehol
d m
embe
rs w
ho a
re p
art o
f the
fam
ily b
ut a
re c
urre
ntly
resi
ding
el
sew
here
(Rea
sons
for m
ilita
ry, e
duca
tion,
hea
lth, j
ob, e
tc.)
answ
er fo
r all
the
fam
ily m
embe
rs. L
et’s
sta
rt w
ith Y
OU, a
nd c
ontin
ue w
ith th
e ot
hers
(DAT
A CO
LLEC
TOR,
AT
TENT
ION!
NUM
BER
OF P
EOPL
E IN
THE
TAB
LE S
HOUL
D BE
THE
SAM
E TH
E ON
ES IN
DICA
TED
IN 7
.1. U
SE T
HE C
ODES
INDI
CATE
D BE
LOW
FOR
COD
ING.
)
CAR
D11. Person Case Number (ATTENTION! Person Interviewed needs to be “1”) MARK THE CHILD THAT WAS INCLUDED IN THE SAMPLE AS THE TARGET CHILD.
1. R
elat
ions
hip
to
(Tar
get c
hild
’s na
me)
1. M
othe
r2.
Fat
her
3. S
tep
mot
her
4. S
tep
fath
er5.
Sibl
ing
(old
er b
rot-
her o
lder
sis
ter)
6. G
rand
mot
her
(mot
her’s
sid
e)7.
Gran
dfat
her
(mot
her’s
sid
e)8.
Gran
dmot
her
9.Gr
andf
athe
r10
.Unc
le (F
athe
r’s
brot
her)
11.S
iste
r-in
-law
12.U
ncle
(Mot
her’s
br
othe
r)13
.Aun
ts14
.Bro
ther
-in-la
ws
15. C
ousi
n16
. Chi
ld h
im/h
erse
lfOt
her(
Indi
cate
)
2.AG
E OF
BI
RTH
ON
THE
ID
CARD
?
ATTE
NTI-
ON M
AKE
SURE
TO
CORR
ECTL
Y W
RITE
DO
WN
THE
DATE
OF
BIRT
H!
3. S
EX
4. W
HAT
IS T
HE E
DUCA
TION
AL S
TATU
S?1.
No
scho
olin
g (G
o to
8)
2. C
an re
ad a
nd w
rite
(Go
to 8
)3.
Ear
ly c
hild
hood
Edu
catio
n (K
inde
rgar
ten/
pres
choo
l) (G
o to
8) 4
. Prim
ary
scho
ol d
rop-
ou
t (AS
K 6.
2 an
d 7.
2) (G
o to
8)
5. P
rimar
y sc
hool
stu
dent
(ASK
5, I
) (Go
to
7.1’
)6.
Prim
ary
scho
ol g
radu
ate-
(1st
thro
ugh
8th)
(A
SK 6
.1 A
ND A
SK)
7. H
igh
scho
ol d
rop-
out (
ASK
6.2
AND
7.2
than
g
o to
8)
8. H
igh
scho
ol s
tude
nt (A
SK 5
, THE
N Go
to
7.1)
9. H
igh
scho
ol g
radu
ate
(ASK
6.1
then
Go
to 8
)10
. Uni
vers
ity d
rop-
out (
ASK
6.2
AND
7.2,
Go
to 8
)11
. Uni
vers
ity s
tude
nt (G
o to
7.1
)12
. Gra
duat
e of
uni
vers
ity a
nd a
bove
(ASK
6.
1, G
o to
8)
13. C
urre
ntly
att
endi
ng o
ccup
atio
nal t
rain
ing
(G
o to
8)
14. O
ccup
atio
nal t
rain
ing
drop
-out
(ASK
6.2
AND
7.2,
Go
to Q
UEST
ION
8)Us
e th
e co
des
give
n ab
ove.
(ASK
ON
LY F
OR
THOS
E W
HO A
RE
STU-
DENT
S5.
AT-
TEND
ING
BOAR
-DI
NG
SCHO
OL?
Thos
e w
ho
are
grad
u-at
es:
6.1.
Wha
t da
te w
as th
e gr
adua
tion
(YEA
R)?
THOS
E W
HO
ARE
DROP
-OU
TS:
6.2.
WHE
N DI
D TH
E PE
R-SO
N DR
OP
OUT?
THOS
E W
HO A
RE
CURR
ENTL
Y ST
U-DE
NTS:
7.1.
INDI
CATE
WHA
T GR
ADE?
THOS
E W
HO A
RE
DROP
-OUT
S:
7.2.
WHA
T GR
ADE
WAS
IT W
HEN
THE
PERS
ON D
ROPP
ED
OUT?
8. Indicate in detail the type of job they do(DATA COLLECTOR, ATTENTION! SHOW KARd1)Use the codes given in CARD 1 belove).
9.W
HAT
TYPE
OF
SOCI
AL
SECU
RITY
DOE
S TH
E PE
RSON
HAV
E?1.
No s
ocia
l sec
urity
2.SS
I (SD
K, B
ağ-K
ur)
3.Pr
ivat
e In
sura
nce
4.Gr
een
Card
10. M
arita
l Sta
tus
1. M
arrie
d2.
Liv
ing
t
oget
her
3. R
elig
ious
serv
ice
only
4. D
ivor
ced
5. S
epar
ated
6 .W
idow
w
idow
e7.
Sin
gle
1. Female
2.Male
1.No
2.Yes
1. P
ERSO
N1
21
2
2. P
ERSO
N1
21
2
3. P
ERSO
N1
21
2
4. P
ERSO
N1
21
2
5. P
ERSO
N1
21
2
6. P
ERSO
N1
21
2
7. P
ERSO
N1
21
2
8. P
ERSO
N1
21
2
9. P
ERSO
N1
21
2
10.P
ERSO
N1
21
2
1. H
ome
mot
her
4.Re
tired
, doe
s no
t wor
k7.
Oper
ates
med
ium
/larg
e sc
ale
oper
atio
ns, e
mpl
oyer
10.S
kille
d la
bor
13.S
easo
nal w
orke
r in
the
city
they
liv
e in
16.U
nem
ploy
ed
2.Fa
rmin
g/Li
vest
ock
5.Sm
all B
usin
ess/
tradi
ng(3
or f
ewer
em
ploy
ees l
ike
conv
enie
nt sh
op,
prod
uce
shop
, bul
k fo
od d
eale
r, tra
ding
etc
.)
8.Pr
ofes
sion
al S
elf-
empl
oyed
(Doc
tor,
Law
yer)
11.U
nski
lled
labo
r wor
k14
.Tra
velli
ng to
oth
er c
ities
for
seas
onal
wor
k17
. Not
at t
he
empl
oym
ent a
ge
3.Re
tired
, cur
rent
ly
wor
king
6.St
ate
empl
oyee
/ ser
vant
9.Se
lf-em
ploy
ed/F
reel
ance
r12
.Adm
inis
trat
or15
.Own
s est
ate (
Owns
, land
, fiel
d,
orch
ard
etc,
and
earn
s inc
ome f
rom
it)
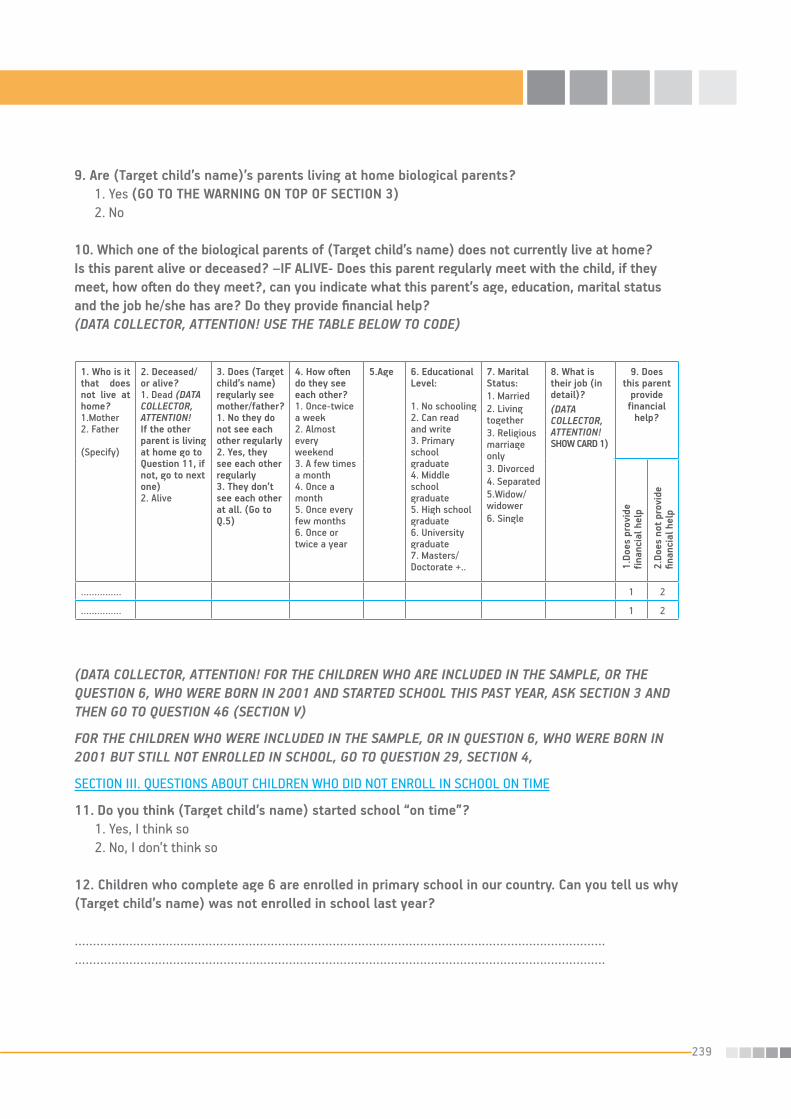
239
9. Are (Target child’s name)’s parents living at home biological parents? 1. Yes (GO TO THE WARNING ON TOP OF SECTION 3) 2. No
10. Which one of the biological parents of (Target child’s name) does not currently live at home? Is this parent alive or deceased? –IF ALIVE- Does this parent regularly meet with the child, if they meet, how often do they meet?, can you indicate what this parent’s age, education, marital status and the job he/she has are? Do they provide financial help?(DATA COLLECTOR, ATTENTION! USE THE TABLE BELOW TO CODE)
(DATA COLLECTOR, ATTENTION! FOR THE CHILDREN WHO ARE INCLUDED IN THE SAMPLE, OR THE QUESTION 6, WHO WERE BORN IN 2001 AND STARTED SCHOOL THIS PAST YEAR, ASK SECTION 3 AND THEN GO TO QUESTION 46 (SECTION V)
FOR THE CHILDREN WHO WERE INCLUDED IN THE SAMPLE, OR IN QUESTION 6, WHO WERE BORN IN 2001 BUT STILL NOT ENROLLED IN SCHOOL, GO TO QUESTION 29, SECTION 4,
SECTION III. QUESTIONS ABOUT CHILDREN WHO DID NOT ENROLL IN SCHOOL ON TIME
11. Do you think (Target child’s name) started school “on time”? 1. Yes, I think so 2. No, I don’t think so
12. Children who complete age 6 are enrolled in primary school in our country. Can you tell us why (Target child’s name) was not enrolled in school last year?
…………………………..………………………………………………………………………………………………………………………………..……………………………………………………………………………………………………
1. Who is it that does not live at home?1.Mother2. Father
(Specify)
2. Deceased/ or alive?1. Dead (DATA COLLECTOR, ATTENTION! If the other parent is living at home go to Question 11, if not, go to next one)2. Alive
3. Does (Target child’s name)regularly see mother/father?1. No they do not see each other regularly2. Yes, they see each other regularly3. They don’t see each other at all. (Go to Q.5)
4. How often do they see each other?1. Once-twice a week2. Almost every weekend3. A few times a month4. Once a month5. Once every few months6. Once or twice a year
5.Age 6. Educational Level:
1. No schooling2. Can read and write3. Primary school graduate4. Middle school graduate5. High school graduate6. University graduate7. Masters/ Doctorate +..
7. Marital Status:1. Married2. Living together3. Religious marriage only3. Divorced4. Separated5.Widow/widower6. Single
8. What is their job (in detail)?(DATA COLLECTOR, ATTENTION! SHOW CARD 1)
9. Does this parent
provide financial
help?
1.Do
es p
rovi
de
finan
cial
hel
p
2.Do
es n
ot p
rovi
de
finan
cial
hel
p
…………… 1 2
…………… 1 2
240
13. Can you tell us if you wanted to enroll (Target child’s name) in school last year? If so, what did you do to do this? 1. No, I did not want to (GO TO QUESTION 14) 2. Yes, I wanted to 2.1. What did you do?
(DATA COLLECTOR, ATTENTION! ASK THE PARTICIPANT TO EXPLAIN) …………………..…………………………………………………………………………………………………… …………………………..………………………………………………………………………………………………
14. What led you this year to enroll (Target child’s name) in school? Can you explain in detail how you decided?…………………………..………………………………………………………………………………………………………………………………..……………………………………………………………………………………………………
15. Do you know that in our country, children who are 6 years old (72 months of age) need to start school based on Ministry of National Education Regulations. 1. I know 2. I don’t know
16. In our country children who are 72 months old by 31 of December of a given academic year are eligible to enroll in elementary schools that academic year. Even though a child is eligible to enroll in school based on his or her chronological age, if a parent applies with a written request to delay entry to school, a child’s enrollment can be postponed for one year. Did you go to school to do the legal procedure to postpone enrollment?
1. Yes I did it 2. No I did not 3. I did not, but did not know we had such a right
17. Was there anybody last year who spoke to you about enrolling 6 year old children in school (mukhtar, teacher, imam etc.)? IF YES, Who were they? and what kinds of information did they provide?
1. No, there was nobody (GO TO QUESTION 19) 2. Yes, there was someone/people, 2.1.Who spoke to you? 1. Relative, Neighbor, etc., people from around 2. Mukhtar 3. Imam 4. Teachers in the neighborhood 5. Principal of the school in the neighborhood 6. District head official Other…………………………………………………. 2.2. What types of information did the person provide/what did the person say? ……………………………................................................................................................................. ……………………………………......................................................................................................

241
18. Did the person speak to you before or after the registration period? Did you do anything after getting the information to enroll the child in school? If YES, tell us what you did 1. Spoke prior to the registration period 2. Spoke after the registration period
18.2. After getting the information, did you do anything to enroll the child in school? 1. No, I did not (GO TO QUESTION 19) 2. Yes I did 2.1. Please explain what you did. ……………………………................................................................................................................. …………………………….................................................................................................................
19. WHO DECIDED TO SEND (Target child’s name) TO SCHOOL THIS YEAR? WHO WAS MORE INFLUENTIAL IN THIS DECISION? 19.1. Who decided? (DATA COLLECTOR, ATTENTION! CAN GET MORE THAN ONE ANSWERS)
19.2. Who was more influential? (DATA COLLECTOR, ATTENTION! USE THE CODES FROM THE TABLE) ………………………………........................................................................................................… 20. WHO DECIDED NOT TO SEND (Target child’s name) to school last year? Who was more influential in the decision to not to send the child to school? 20.1. Who decided? (DATA COLLECTOR, ATTENTION! CAN GET MORE THAN ONE ANSWERS)
1. Mother 8. Grandfather (father’s father)
2. Father 9. Uncle (father’s brother)
3. Step Mother 10. Older sister
4. Step Father 11. Older brother
5. Grandmother (mother’s mother) 12. Uncle (mother’s brother)
6. Grandfather (mother’s father) 13. Aunt (mother’s sister)
7. Grandmother (father’s mother) Other………………………………………………

242
20.2. Who was most influential? (DATA COLLECTOR, ATTENTION! USE THE CODES FROM THE TABLE) …………………………………
DATA COLLECTOR, ATTENTION! IF THOSE WHO DECIDED ON NOT ENROLLING CHILDREN IN SCHOOL WERE DIFFERENT THAN THE ONES LIVING AT HOME ASK ABOUT EDUCATION, RELATIONSHIP TO CHILD, SEX, AGE AND JOB.
21. Please provide age, sex, education, job information of those who decided to not enroll (target child’s name) in school. WHO DO NOT LIVE AT HOUSEOLD.
22. How did (Target child’s name) spend his/her time last year (2007-2008 academic year) when he/she was out of school? What did the child do (activities) and how often the child do these activities?
23. Last year (2007-2008 academic year), did you teach (Target child’s name) any educational activities? If YES, did you do any of the following? 1. No, we did not teach anything 2. Yes, we taught the child some things, 2.1. Which one (ones) of the following did you teach?
1. RELATIONSHIP TO CHILD
1. Sibling(older brother/older sister)2. Grandmother (mother’s mother)3. Grandfather (mother’s father)4. Grandmother (Father’s mother)5. Grandfather6. Uncle (father’s brother7. Uncle (mother’s brother)Other(Specify)……………….
2. Sex1. Female 2. Male
3. Age
4. Educational status
1. No schooling2. Can read and write, did not go to school3. Primary school graduate4. Middle school graduate5. High school graduate6. University graduate7. Masters/ Doctorate +..
5. Indicate what their job is?
(DATA COLLECTOR, ATTENTION! SHOW Card 1)
1.Who(Specify):………………. 1 2
2.Who(Specify):……………….. 1 2
1. ACTIVITY THE CHILD ENGAGED IN:
2.HOW OFTEN DID THE CHILD DO THE ACTIVITY 1. Almost everyday 2. Once-twice a week 3. Once a week 4.Once every two weeks 5. Once a month 6. Less than once a month
.………………………………………………… .…………………………………………………
.………………………………………………… .…………………………………………………
.………………………………………………… .…………………………………………………
1. Recognizing the letters in the alphabet 7. Counting from 1 to 50
2. Writing the letters in the alphabet 8. Counting from 1 to 100 or more
3. Writing his/her name 9. Recognizing the colors
4. Reading 10.Recognizing the geometrical shapes
5. Recognizing the letters 11. Simple mathematical additions and subtractions
6. Counting from 1 to 10 Other………………………………………………

243
24. Think about last year (2007-2008 academic year) when your child was out of school, HOW OFTEN did your child engage in the following activities I will list within an AVERAGE DAY? Can you please also indicate activities other than the ones listed below your child engaged in the past year? (DATA COLLECTOR, ATTENTION! SHOW CARD 2, ROTATE WHICH STATEMENT YOU BEGIN WITH, AND MARK IN THE “R” COLUMN OF THE STATEMENT YOU BEGIN WITH.)
25. Please indicate how influential were the following reasons for your child to NOT START SCHOOL the previous year. Can you please answer using the scale “1. Not influential at all 5. Very influential” and looking at the card in front of you? (DATA COLLECTOR, ATTENTION! SHOW CARD 3, ROTATE WHICH STATEMENT YOU BEGIN WITH, AND MARK IN THE “R” COLUMN OF THE STATEMENT YOU BEGIN WITH!)
R
Neve
r
Rare
ly
Som
etim
es
Often
Alw
ays
1 Looking after siblings at home 1 2 3 4 5
2 Playing at home/in the street 1 2 3 4 5
3 Playing computer games 1 2 3 4 5
4 Selling things in the streets like tissues 1 2 3 4 5
5 Help with household chores 1 2 3 4 5
6 Help with the work in the garden/field 1 2 3 4 5
7 Learning things related to school(Counting, the alphabet, etc.) 1 2 3 4 5
8 Help take care of someone sick at home 1 2 3 4 5
9 Help with the work where we go to work as seasonal workers 1 2 3 4 5
10 Attending kindergarten 1 2 3 4 5
11 Engaging in activities like art (painting), music 1 2 3 4 5
Other ……………………………………….. 1 2 3 4 5
R
Not i
nflue
ntia
l at a
ll
Not i
nflue
ntia
l
Part
ly in
fluen
tial
It w
as in
fluen
tial
Very
influ
entia
l
No o
pini
on(D
O NO
T RE
AD)
1. We had very limited financial opportunities to enroll the child in school last year
1 2 3 4 5 6
2. The child had to work and earn money last year 1 2 3 4 5 6
3. Last year there were security problems at the SCHOOL 1 2 3 4 5 6
4. Last year there were security problems in the ROAD to school 1 2 3 4 5 6
5. Last year, transportation opportunities to school were very limited
1 2 3 4 5 6
6. Child did not want to attend school the previous year 1 2 3 4 5 6

244
CONTINUED
7. We thought the child was too young to enroll in school last year 1 2 3 4 5 6
8. Last year the child needed to help at home with the housework (washing, cleaning, looking after younger siblings, etc.)
1 2 3 4 5 6
9. Last year the child was supposed to help with the work in the field / garden
1 2 3 4 5 6
10. Because the child was too skinny, small for his age and frail, we felt the child would be the downtrodden one
1 2 3 4 5 6
11. Child was uninterested in school last year 1 2 3 4 5 6
12. Child was afraid of going to school last year 1 2 3 4 5 6
13. Child was either sick last year or was getting sick too often 1 2 3 4 5 6
14. Last year, around the time school started, a family member fell ill 1 2 3 4 5 6
15. Last year, a family member passed away around the time school started
1 2 3 4 5 6
16. One of the close friends of the child passed away right around the time the schools started
1 2 3 4 5 6
17. Last year, the child had to take care of somebody sick in the house-hold
1 2 3 4 5 6
18. We migrated to somewhere else as a family to work as seasonal workers
1 2 3 4 5 6
19. We had just moved here last year, so we were unable to register the child to school
1 2 3 4 5 6
20. We wanted the child to go to school with the sibling who was a year younger
1 2 3 4 5 6
21. We thought the child would develop better and be more successful in school if we waited another year
1 2 3 4 5 6
22. Last year there was no school where we lived 1 2 3 4 5 6
23. Last year the child was not toilet trained 1 2 3 4 5 6
24. The child did not want to separate from the mother last year 1 2 3 4 5 6
(DATA COLLECTOR, ATTENTION! ASK THIS QUESTION TO THOSE WHO HAVE FEMALE CHILDREN WHO STARTED SCHOOL LATE!)25. In order for her brother to attend school first, we did not send our daughter to school
1 2 3 4 5 6
26. We did not want the teacher that was assigned last year 1 2 3 4 5 6
Other Specify…………………………………………………..

245
(DATA COLLECTOR, ATTENTION! ASK THIS QUESTION ONLY TO THOSE WHO ANSWERED THE STATEMENTS 25.26 AS “We did not want the teacher that was assigned last year” PARTLY INFLUENTIAL, INFLUENTIAL AND VERY INFLUENTIAL.
26. What are the reasons for not wanting (Target child’s name) to be taught by the teacher last year?(DATA COLLECTOR, ATTENTION! YOU CAN GET MORE THAN ONE ANSWERS) 1. Because it was female 2. Because it was male 3. We did not think the teacher was a good teacher 4. The teacher was not very understanding toward children Other………………………………………………………………………………
27. State provides financial support for those who educate their female children. Are you informed of this? 1. No, I was not informed (GO TO QUESTION 46) 2. Yes, I was informed ………………………………………………………………………………
28. Did you receive any aids? What type of aids did you receive? Did getting this aid help you with the decision to enroll your child in school 1. No, I did not get it (GO TO QUESTION 46) 2. Yes, I got it, 2.1. What type of aid?.......................................................................... 2.2. Did receiving this aid help you enroll your child in school? 1. Yes, it was influential 2. No, not influential
(DATA COLLECTOR, ATTENTION! GO TO QUESTION 46)SECTION IV. AUNT (FATHER’S SISTER) QUESTIONS FOR THE CHILDREN WHO ARE CURRENTLY UNENROLLED IN SCHOOLS
(DATA COLLECTOR, ATTENTION! ASK QUESTIONS 29 THROUGH 45(Q.45 INCLUDED) FOR CHILDREN WHO ARE INCLUDED IN THE SAMPLE BUT ARE NOT AT THE PRESENT TIME CURRENTLY ENROLLED IN SCHOOLS29. Children who complete age 6 are enrolled in school in our country. You said that (Target child’s name) was not in school. Can you tell us why you did not enroll (Target child’s name) in school?
…………………………..……………………………………………………………………………………………………
…………………………..……………………………………………………………………………………………………
30. What needs to change that is related to (Target child’s name) in the upcoming days so that you would enroll him/her (your child) in school? …………………………..……………………………………………………………………………………………………
…………………………..……………………………………………………………………………………………………
246
QUESTIONNAIRE FORM FOR EXAMINING THE FACTORS CONTRIBUTING TO NOT ENROLLING IN SCHOOL ON TIME
31. What needs to change that is related to your living conditions (such as change of financial conditions, moving somewhere new, head of the household finding a new job/changing jobs etc.) in the upcoming days so that you would enroll him/her (your child) in school?
…………………………..……………………………………………………………………………………………………
…………………………..……………………………………………………………………………………………………32. What would state need to provide for you to enroll (Target child’s name) in school? 1. Removal of getting registration fees for the enrollment children in schools 2. Providing educational scholarships 3. Having a school somewhere close-by 4. Not just providing textbooks, providing all the school materials Other……………………………………………………..
33. Are you thinking about enrolling your child in school next year?
34. Did you make any attempts to enroll (Target child’s name) in school? If you did, can you tell us what you did? 1. No, I did not 2. Yes, yes I did 2.1. Tell us what you did?………..……………………………………………………………………………………………
…………..……………………………………………………………………………………………35. Was there anybody last year who spoke to you about enrolling 6 year old children in school (mukhtar, teacher, imam etc.)? If YES, who were they? and what kinds of information did they provide? 1. No, there was nobody (GO TO QUESTION 37) 2. Yes, there was someone/people, 2.1. Who spoke to you? 1. Relative, neighbor, etc., people from around 2. Mukhtar 3. Imam 4. Teachers in the neighborhood 5. Principal of the school in the neighborhood 6. District head official Other………………………………………………….
1. Yes, we are thinking about enrolling the child in school next year:
1.2. What made you make such a decision? ………………………...………………………………………..
2. No, we are thinking about enrolling our child in school later:
2.1. How long will you wait to enroll your child in school? ………………………...………………………………………..
2.2. Why aren’t you thinking about enrolling your child in school next year? ………………………...………………………………………..
3. No, we are not thinking about enrolling he child in school at all:
3.1. Can you tell us why do you think so? ………………………...………………………………………..

247
2.2. What types of information did the person provide/what did the person say?
…………………………….................................................................................................................
……………………………………......................................................................................................
36. Did the person speak to you before or after the registration period? Did you do anything after getting the information to enroll the child in school? If YES, tell us what you did 1. Spoke prior to the registration period 2. Spoke after the registration period
36.2. After getting the information, did you do anything to enroll the child in school? 1. No, I did not (GO TO QUESTION 37) 2. Yes I did 2.1. Please explain what you did ……………………………................................................................................................................
……………………………………......................................................................................................
37. WHO DECIDED NOT TO Send (Target child’s name) to school last year? Who was more influential in the decision to not to send the child to school? 37.1. Who decided? (DATA COLLECTOR, ATTENTION! CAN GET MORE THAN ONE ANSWERS)
37.2. Who was most influential? (DATA COLLECTOR, ATTENTION! USE THE CODES FROM THE TABLE)
DATA COLLECTOR, ATTENTION! IF THOSE WHO DECIDED ON NOT ENROLLING CHILDREN IN SCHOOL WERE DIFFERENT THAN THE ONES LIVING AT HOME ASK ABOUT EDUCATION, RELATIONSHIP TO CHILD, SEX, AGE AND JOB.
1. Mother 8. Grandfather (father’s father)
2.Father 9.Uncle (father’s brother
3.Step Mother 10.Older sister
4.Step Father 11.Older brother
5.Grandmother (mother’s mother) 12.Uncle (mother’s brother)
6.Grandfather (mother’s father) 13. Aunt
7. Grandmother (father’s mother) Other………………………………………………

248
QUESTIONNAIRE FORM FOR EXAMINING THE FACTORS CONTRIBUTING TO NOT ENROLLING IN SCHOOL ON TIME
38. Please provide age, sex, education, job information of those who decided to not enroll (Target child’s name) in school WHO DO NOT LIVE AT HOME
39. How does (Target child’s name) spend most of his/her time? What does the child do (activities) and how often does the child do these activities?
40. Do you teach (Target child’s name) educational activities at home? If YES, which one of the following did you teach your child? 1. We did not teach anything.2. Yes, we taught the child some things. 2.1. Which one (ones) of the following did you teach?
1. RELATIONSHIP TO CHILD
1. Sibling(older brother/older sister)2. Grandmother (mother’s mother)3. Grandfather (mother’s father)4. Grandmother (father’s mother)5. Grandfather6. Uncle (father’s brother7. Uncle (mother’s brother)Other (Specify)……………….
2.Sex
1. Female 2. Male
3. Age
4. Educational status
1. No schooling2. Can read and write, did not go to school3. Primary school graduate4. Middle school graduate5. High school graduate6. University graduate7. Masters/ Doctorate +..
5. Indicate what their job is?
(DATA COLLECTOR, ATTENTION! SHOW Card 1)
1.Who (Specify):………………. 1 2
2.Who (Specify):……………….. 1 2
1. ACTIVITY THE CHILD ENGAGED IN
2. HOW OFTEN DID THE CHILD DO THE ACTIVITY
1. Almost everyday2. Once-twice a week3. Once a week4. Once every two weeks 5. Once a month6. Less than once a month
.………………………………………………… .…………………………………………………
.………………………………………………… .…………………………………………………
.………………………………………………… .…………………………………………………
1. Recognizing the letters in the alphabet 7. Counting from 1 to 50
2. Writing the letters in the alphabet 8. Counting from 1 to 100 or more
3. Writing his/her name 9. Recognizing the colors
4. Reading 10. Recognizing the geometrical shapes
5. Recognizing the letters 11. Simple mathematical additions and subtractions
6. Counting from 1 to 10 Other……………………………………………….

249
41. HOW OFTEN did your child engage in the following activities I will list within an AVERAGE DAY? Can you please also indicate activities other than the ones listed below your child engaged in (DATA COLLECTOR, ATTENTION! SHOW CARD 2, ROTATE WHICH STATEMENT YOU BEGIN WITH, AND MARK IN THE “R” COLUMN OF THE STATEMENT YOU BEGIN WITH.)
R
Neve
r
Rare
ly
Som
etim
es
Often
Alw
ays
1. Looking after siblings at home 1 2 3 4 5
2. Playing at home/in the street 1 2 3 4 5
3. Playing computer games 1 2 3 4 5
4. Selling things in the streets like tissues 1 2 3 4 5
5. Help with household chores 1 2 3 4 5
6. Help with the work in the garden/field 1 2 3 4 5
7. Learning things related to school (Counting, the alphabet, etc.) 1 2 3 4 5
8. Help take care of someone sick at home 1 2 3 4 5
9. Help with the work where we go to work as seasonal workers 1 2 3 4 5
10. Attending kindergarten 1 2 3 4 5
11. Engaging in activities like art (painting), music 1 2 3 4 5
Other ……………………………………….. 1 2 3 4 5
42. Please indicate how influential the following reasons were for your child to NOT START SCHOOL using the scale “1. Not influential at all 5. Very influential” and looking at the card in front of you? DATA COLLECTOR, ATTENTION! SHOW CARD 3, ROTATE WHICH STATEMENT YOU BEGIN WITH, AND MARK IN THE “R” COLUMN OF THE STATEMENT YOU BEGIN WITH.)
R
Not i
nflue
ntia
l at
all
Not i
nflue
ntia
l
Part
ly
influ
entia
l
It w
as
influ
entia
l
Very
in
fluen
tial
No o
pini
on(D
O NO
T RE
AD)
1. Our financial conditions were not sufficient 1 2 3 4 5 6
2. We thought that the child could find jobs even if the child went to school 1 2 3 4 5 6
3. Our child needed to work and earn money instead of attending school 1 2 3 4 5 6
4. It was not appropriate for the child to attend school because of family beliefs and traditions
1 2 3 4 5 6
5. According to religious beliefs of my family it was wrong for the child to attend school
1 2 3 4 5 6
6. Child was too young 1 2 3 4 5 6
7. There were safety issues at school 1 2 3 4 5 6

250
QUESTIONNAIRE FORM FOR EXAMINING THE FACTORS CONTRIBUTING TO NOT ENROLLING IN SCHOOL ON TIME
8. School was far from home 1 2 3 4 5 6
9. Transportation to school was problematic 1 2 3 4 5 6
10 Child did not want to go to school 1 2 3 4 5 6
11. Child helping around at home (doing the dishes, looking after siblings etc.) 1 2 3 4 5 6
12. Child needed to work in the field/garden 1 2 3 4 5 6
13. Could not go to school because of illness/disability 1 2 3 4 5 6
14. Other families around not sending their children to school 1 2 3 4 5 6
15. Child was physically immature, skinny and underdeveloped 1 2 3 4 5 6
16. We did not believe female children needed to go to school 1 2 3 4 5 6
17. Boys and girls go to school in mixed classrooms 1 2 3 4 5 6
18. We believe that besides learning to read and write, nothing taught at school was worthwhile 1 2 3 4 5 6
19. Even if the child went to school, the child was still going to live in the village 1 2 3 4 5 6
20. Child was going to get married anyway, there was no need for school 1 2 3 4 5 6
21. Child was not toilet trained to go by himself/herself 1 2 3 4 5 6
22. The child did not want to separate from the mother last year 1 2 3 4 5 6
23. We had just moved here last year, so we were unable to register the child to school 1 2 3 4 5 6
( DATA COLLECTOR, ATTENTION! ASK THIS QUESTION TO THOSE WHO HAVE FEMALE CHILDREN WHO ARE OUT OF SCHOOL!)24. Girls don’t need to go to school
1 2 3 4 5 6
( DATA COLLECTOR, ATTENTION! ASK THIS QUESTION TO THOSE WHO HAVE FEMALE CHILDREN WHO ARE OUT OF SCHOOL!) 25. Child had an arranged marriage (“beşik kertmesi” the promise at the cradle) and the family the child was going to marry into did not approve school
1 2 3 4 5 6
( DATA COLLECTOR, ATTENTION! ASK THIS QUESTION TO THOSE WHO HAVE FEMALE CHILDREN WHO ARE OUT OF SCHOOL!)26. In order for her brother to attend school, the female child was not send to school
1 2 3 4 5 6
( DATA COLLECTOR, ATTENTION! ASK THIS QUESTION TO THOSE WHO HAVE FEMALE CHILDREN WHO ARE OUT OF SCHOOL!) 27. The child would learn how to read and write during military service, so there was no need to attend school
28. For reasons related to teachers
Other Specify……………………………………….
CONTINUED
Not i
nflue
ntia
l at
all
Not i
nflue
ntia
l
Part
ly
influ
entia
l
It w
as
influ
entia
l
Very
in
fluen
tial
No o
pini
on(D
O NO
T RE
AD)

251
(DATA COLLECTOR, ATTENTION! ASK THIS QUESTION ONLY TO THOSE WHO ANSWERED THE STATEMENT 42.28 “We did not want the teacher that was assigned last year” AS PARTLY INFLUENTIAL, INFLUENTIAL AND VERY INFLUENTIAL .
43. (What are the reasons for not enrolling (Target child’s name) to be taught by that teacher? (DATA COLLECTOR, ATTENTION! CAN GET MORE THAN ONE ANSWERS) 1. Because it was female 2. Because it was male 3. We did not think the teacher was a good teacher 4. The teacher was not very understanding toward children Other………………………………………………………………………………44. Are you informed of the fact that state provides free textbooks for primary school children? 1. Yes, I was informed (GO TO QUESTION 45) 2. No, I was not informed 2.1. If you knew of such an information, would this influence your decision? 1. Yes, It would 2. No, it would not45. State provides financial support for those who educate their female children. Are you informed of this? 1. Yes, I was informed (GO TO QUESTION 46) 2. No, I was not informed 2.1. Would you enroll your child in school if you were informed of this? 1. Yes 2. NoDATA COLLECTOR, ATTENTION! QUESTIONS IN THIS SECTION WILL BE ASKED TO ALL THE PARTICIPANTS!
SECTION V. FINANCIAL STATUS OF THE HOUSEHOLD MEMBERS
46. What are the TOTAL expenditures of YOUR FAMILY including kitchen, education, health, etc.? 0. I don’t know/ No answer
1. 200 TL and below 7. 751 – 1000 TL 13. 2501 – 3000 TL
2. 201 – 300 TL 8. 1001 – 1250 TL 14. 3001 – 4000 TL
3. 301 – 400 TL 9. 1251 – 1500 TL 15. 4001 – 5000 TL
4. 401 – 500 TL 10. 1501 – 1750 TL 16. 5001 – 7500 TL
5. 501 – 600 TL 11. 1751 – 2000 TL 17. 7501 – 10000 TL
6. 601 – 750 TL 12. 2001 – 2500 TL 18. 10001 TL and above

252
QUESTIONNAIRE FORM FOR EXAMINING THE FACTORS CONTRIBUTING TO NOT ENROLLING IN SCHOOL ON TIME
(DATA COLLECTOR, ATTENTION! ASK THOSE WHOSE TOTAL EXPENDITURES WERE MORE THAN THEIR INCOME) 48. You just indicated that your expenditures were more than your income. How do you make up for the difference? 1. Other family members help 2. We always get loans 3. Neighbors help 4. Get loans from the bank 5. Municipality, district head office, charities, etc. provide support 6. We get a sum of payments during certain times from our jobs (harvest time, seasonal work, etc.) Other…………………………………………………………………….
49. What is the ownership status of the home you live in? 1. Home owner 2. Renter 2.1. Rental price …………….TL 3. Belongs to a relative, no rent paid 4. Housing unit, 4.1. Do you pay rent ? 1. No 2. Yes, 4.1.2.1. Rental price: ………………TL
50. How many meter square is the home you reside in? (Do not include yard, etc. when they live in a house.) …………........................................................................................................................................
51. Number of rooms (toilet, bathroom not included.) :…………............................................................
52. Does (Target child’s name) have a room of his/her own? 1. No 2. Has a room OF him/her own. 3. Shares a room with the siblings.
1. 200 TL and below 7. 751 – 1000 TL 13. 2501 – 3000 TL
2. 201 – 300 TL 8. 1001 – 1250 TL 14. 3001 – 4000 TL
3. 301 – 400 TL 9. 1251 – 1500 TL 15. 4001 – 5000 TL
4. 401 – 500 TL 10. 1501 – 1750 TL 16. 5001 – 7500 TL
5. 501 – 600 TL 11. 1751 – 2000 TL 17. 7501 – 10000 TL
6. 601 – 750 TL 12. 2001 – 2500 TL 18. 10001 TL and above
47. What is the TOTAL income of YOUR FAMILY including kitchen, education, health, etc.?

253
Interview form for the semi-structured interviews
Good afternoon sir/madame. This is .……………………..GENAR RESEARCH. As you know MONE regulations for Primary School Institutions state that, children who complete 72 months of age by December 31 of a given year are admitted into first grades of primary school that academic year. The enrollment of children, who did not develop well and who are eligible to enroll in schools in terms of their chronological age can be legally postponed if the parents give a written petition explaining the reasons for their request. Examination of the records for 2007-2008 academic year for primary school enrollment show that there are a number of children who were supposed to be in school the previous year, but were enrolled in schools the following academic year, meaning, this year. In other words, some families do not enroll their children in schools ON TIME, rather they enroll them in school a year later causing these children to have late enrollment. As GENAR research, we are conducting a “RESEARCH INVESTIGATING THE REASONS FOR CHILDREN NOT ENROLLING IN SCHOOL ON TIME TO DEVELOP STRATEGIES TO ACCOMPLISH TIMELY ENROLLMENT OF CHILDREN.” I want to ask you some questions concerning this issue. I would be delighted if you could give me some of your time and answer my questions. Thank you for your time.
Name of the participant: ………………………………………………………………………
Date of the interview: ..…./…..../2009
Start and time of the interview: …..:….. / …..:…..
The institution participant works for: ……………………………………………………………………
Position of the participant in the institution: ……………………………………………………………………
CONTACT INFORMATION
Our questionnaire is finished. Thank you. The contact information you provide will only be used for data accuracy checks. Information and your address will all be kept confidential.
PARTICIPANT’SName-Last name : ................................................................................................................Home phone number : .................................................................................................................Cell phone number : ..................................................................................................................
53. Where are you from? (DATA COLLECTOR, ATTENTION! STATE IT AS A PROVINCE!) …………................

254
Name and the last name of the participant: ………………………………………………………………………
Province the interview was conducted: ………………………………………………………………………
District of the institution: ………………………………………………………………………
Neighborhood of the institution: ………………………………………………………………………
Street of the institution: ………………………………………………………………………
Building number of the institution: ………………………………………………………………………
Apartment number of the institution: ………………………………………………………………………
Phone number of the institution: ………………………………………………………………………
Fax number of the institution: ………………………………………………………………………
Phone number of the participant: ………………………………………………………………………
GSM number of the participant: ………………………………………………………………………
Web address: ………………………………………………………………………
e-mail address: ………………………………………………………………………
PROBLEM
s.1. Article 15 of the Regulations for Primary Schools of Ministry of National Education state that “Children who are 72 months old by 31 of December of a given academic year are eligible to enroll in elementary schools that academic year. Even though a child is eligible to enroll in school based on his or her chronological age, if a parent applies with a written request to delay entry to school, a child’s enrollment can be postponed for one year.”
1. Did you know Article 15 of the Regulations for Primary Schools of Ministry of National Education? (ATTENTION DATA COLLECTOR: DO NOT ASK THIS QUESTION WHEN THE PARTICIPANT IS A TEACHER, SCHOOL PRINCIPAL, INSPECTOR, OR DISTRICT/PROVINCE DIRECTOR OF NATIONAL EDUCATION) 1. No (GO TO QUESTION 2!) 2. Yes ………………………………………………………………………………………………………………………………… …………………………………………………………………………...................................................................
2. Do you think Article 15 of the Regulations for Primary Schools of Ministry of National Education used in effect at schools? If so, can you tell us how it is in effect at schools (For example, who decides a child is not mature enough for school? What is suggested if a child is considered to be too small for his/her age, etc.)?1. Yes, it is used in effect 2. No, it is not used in effect
……………………………………………………………………………………………………………..……………............... ……………………………………………………………………………………………….……………………………………… ………………………………………………………………..………………………………………………………………………
Interview form for the semi-structured interviews

255
3. Do you think the families are misusing the Article 15 of the Regulations for Primary Schools of Ministry of National Education for one reason or the other? If YES, can you elaborate on this? (INTERVIEWER ATTENTION! DO NOT ASK THIS QUESTION WHEN THE INTERVIEWEE IS A PARENT)1. No 2. Yes
……………………………………………………………………………………………………………..………………………… …………………………………………………………………………..…………………………………………………………… ……………………………………………...............................................................................................................
s.2. As I mentioned to you earlier it came to our understanding that some children who were supposed to be enrolling in school in the 2007-2008 academic year, were not enrolled that year, but were enrolled in schools the following year, in 2008-2009 academic year (in other words, this year). This indicates that some children enrolled in school with a year delay. Did you know that there was a problem of late enrollment in Turkey? Can you talk about your views on this?
1. Yes 2. No
……………………………………………….....………………………………………………………………………………….. ……………………………………………………………………………………………………………………..………………… ………………………………………………………………………………………………………………………………………… ……………………………………………………………………………………………..………………………………………… ……………………………………………………………………………………………………………………........................
s.3. Do you know of anybody in the area you work (district, province, village) who did not enroll in school even though that child was born in 2001 and was supposed to be in school LAST YEAR (2007-2008 academic year)? If there are, can you tell us how these children spend their time during the day?
1.Knowing a child who was not enrolled in school on time:1. No there is not (GO TO QUESTION 4!) 2. I don’t know (GO TO QUESTION 4!)3. Yes, there is
2.How do these children who are not enrolled in school on time spend their times when they are not in school?
………………………………………………………………………………………………………………………………………… ………………………………………………………………………………………………………………………………………… ………………………………………………………………………………………………………………………………………… …………………………………………………………..…………………………………………………………………………… ………………………………………………………………………………………………………….....................................

256
Interview form for the semi-structured interviews
NOT ENROLLING IN SCHOOLS ON TIME AND PROVINCE/DISTRICT RELATED QUESTIONS
s.4. Why do you think children start first grade later, not when they are at the age of 6? …………………………………………………………………………………………………………………………………………… ……………………………………………………………………………………................................................................... …………………………………………………………………………………………………………………………………………… ………………………………………………………………………………… .....................................................................
s.5. In the area you live (province/district, village), what do you think are the factors contributing to children NOT ENROLLING IN SCHOOL ON TIME? When you assess each of the cultural, social, economical, environmental, institutional reasons, educational problems, and child’s own characteristics, how do you think they all contribute to the problem? Which factors do you think are contributing more to the problem? Please explain, and also make sure to speculate on the possible reasons.
1. How do cultural factors such as traditions, religious beliefs, gender discrimination, and the value families place on their children all contribute to CHILDREN NOT ENROLLING IN SCHOOL ON TIME?
……………………………………………………………………………………………………………………………................. …………………………………………………………………………………………………………………………………………… …………………………………………………………………………………………………………………………………………… …………………………………………......................................................................................................................
2. How do factors such as those related to beliefs about educational system, attitudes of other families toward education, views of family elders, number of children in the household all contribute to CHILDREN NOT ENROLLING IN SCHOOL ON TIME
…………………………………………………………………………………………………………………………….................. …………………………………………………………………………………………………………………………………………… …………………………………………………………………………………………………………………………………………… …………………………………………......................................................................................................................
3. How do factors such as family income, economical value of children such as children contributing to family income by working (working in the fields, gardens, selling items in the street such as tissues, etc.) helping families around the house (in the field, garden, household chores), high costs of educational expenditures all contribute to CHILDREN NOT ENROLLING IN SCHOOL ON TIME?
…………………………………………………………………………………………………………………………….................. …………………………………………………………………………………………………………………………………………… …………………………………………………………………………………………………………………………………………… …………………………………………......................................................................................................................

257
4. How do environmental factors such as schools being too far from where children live, conditions of living in rural areas, safety problems on roads or in the areas families live in, all contribute to CHILDREN NOT ENROLLING IN SCHOOL ON TIME?
…………………………………………………………………………………………………………………………….................. …………………………………………………………………………………………………………………………………………… …………………………………………………………………………………………………………………………………………… ………………………………………….......................................................................................................................
5. How do factors related to misinformation or misguidance of the families about the legal age for school enrollment, not having early childhood education opportunities in the region all contribute to CHILDREN NOT ENROLLING IN SCHOOL ON TIME?……………………………………………………………………………………………………………………………………………………………………………………………………………………………………………………………………………………………………………………………………………………………………………………………………………………………………………………………………………………………………………………………………………………………………………….....
6. How do factors related to general educational problems such as schools being too far, transportation problems, sizes of classrooms limited numbers of teachers and the quality of teachers all contribute to CHILDREN NOT ENROLLING IN SCHOOL ON TIME?………………………………………………………………………………………………………………………………………………………………………………………………………………………………………………………………………………………………………………………………………………………………………………………………………………………………………………………………………………………………………………………………………………………..................................
7. How do factors such as the disabilities of children at school age, having an illness, or not developing well physically compared to his/her peers, all contribute to CHILDREN NOT ENROLLING IN SCHOOL ON TIME?
…………………………………………………………………………………………………………………………….................. …………………………………………………………………………………………………………………………………………… …………………………………………………………………………………………………………………………………………… ………………………………………….......................................................................................................................
258
8. Which one of these factors do you think are more influential? Please discuss the possible reasons as well.
1. Cultural factors2. Social factors3. Economical reasons 4. Environmental conditions 5. Institutional reasons 6. Overall problems in the field of education 7. The child’s own characteristics
…………………………………………………………………………………………………………………………………………………………………………………………………………………………………………………………………………………..........
s.6. Do you think the factors that are contributing to children not enrolling in school on time and their reasons are the same for boys and girls? If they are different, talk about how by focusing on the reasons (effects of gender discrimination on not enrolling in school on time)?
1. Yes 2. No………………………………………………………………………………………………………………………………………………………………………………………………………………………………………………………………………………………………………………………………………………………………………………………………………………………………………………………………………....................................................................................................................................
s.7. Do you think families where you are currently assigned to work (districts, provinces, villages) are preparing their children for school? If they are not, in what areas do you think children are not prepared or not very mature?
1. Do families prepare their children for school? 1. Yes 2. No
2. What are the limitations of families in preparing their children for school? ……………………………………………………………………………………………………………………………………………………………………………………………………………………………………................................................................
s.8. According to the regulations for primary schools, children who are 72 months of age (6 years old) are eligible to start school. Do you think people where you work (province, district, and village) have accurate knowledge about the school enrollment age for primary schools? Why do you think so? Do you think this is contributing to children’s NOT ENROLLING IN SCHOOLS ON TIME?
……………………………………………………………………………………………………………………………………………………………………………………………………………………………………................................................................

259
1. Do parents know what the legal age for school enrollment is? 1. Yes 2. No
…………………………………………………………………………………………………………………………………………… ………………………………………………………………………………………................................................................
2. What is the basis of your opinion? Is the information you just provided based on a solid data/information or is it based on your guess/speculation?
…………………………………………………………………………………………………………………………………………… ………………………………………………………………………………………................................................................
3. Do you think this misinformation contributing to children not enrolling in school on time?1. Yes 2. No
…………………………………………………………………………………………………………………………………………… ………………………………………………………………………………………................................................................ ACTIVITIES OR WORK DONE UP TO THIS POINT TOWARD THE SOLUTION OF THIS PROBLEM
s.9. Are there families who ask you for information on enrolling children in schools, primary school enrollment age, or similar issues? Can you talk about this issue?
1. No, there are no families (GO TO QUESTION 10!) 2. Yes, there are families …………………………………………………………………………………………………………………………………………… …………………………………………………………………………………………………………………………………………… ……………………………………………………….......................................................................................................
s.10. Does the institution you work for have any ongoing activities about ENROLLING CHILDREN IN SCHOOLS ON TIME? If there are, can you talk about what types of activities they have?
(INTERVIEWER ATTENTION! PLEASE MAKE SURE THE PARTICIPANTS DON’T CONFUSE THESE ACTIVITIES WITH THE WORK DONE ABOUT ISSUES ABOUT NO ENROLLLMENT)
1. Do you have any activities? 1.No 2.Yes
2. What types of activities did you do? …………………………………………………………………………………………………………………………………………… …………………………………………………………………………………………………………………………………………… ……………………………………………………….......................................................................................................
260
s.11. Do you think these activities help contribute children enrolling in schools ON TIME? Please talk about these contributions and why you think they contribute.
…………………………………………………………………………………………………………………………………………… ……………………………………………………………………………………................................................................... …………………………………………………………………………………………………………………………………………… …………………………………………………………………………………………………………………………………………… ……………………………………………………….......................................................................................................
s.12. Do you think these efforts/work are enough to reach a solution? Can you discuss your opinions on the reasons?
1. Yes, satisfactory 2. No, not satisfactory …………………………………………………………………………………………………………………………………………… ……………………………………………………………………………………................................................................... …………………………………………………………………………………………………………………………………………… …………………………………………………………………………………………………………………………………………… ……………………………………………………….......................................................................................................
s.13. Do you have suggestions outside of what is currently done to solve the problem? If SO, can you talk about your recommendations/suggestions? If NOT, can you explain why? Is it because you find what is already done sufficient and good quality work?
1. No, there is not (GO TO QUESTION 14!) 1.1. Do you want to talk about what was done and what the reasons were?………………………………………………………………………………………………………………………………………………………………………………………………………………………………………………………………………………………………………………………………………………………………………………………………………………………………………………………………………….............................................................................................................................................
2. Yes, there is 1.2. What are the recommendations for the solution of the problem?………………………..……………………………………..................................................................................................………………………………………………………………………………………………………………………………………………………………………………………………………………………………………………………………………………………………………………………………………………………........................................................................................................
How do you think the work, the campaigns or the activities that are done to solve the problem passed down to people? Which channels do you think are more effective?

261
1. What are some of the communication channels to pass these announcements/information to people:
…………………………………………………………………………………………………………………………………………… ……………………………………………………………………………………................................................................... …………………………………………………………………………………………………………………………………………… …………………………………………………………………………………………………………………………………………… ………………………………………………………......................................................................................................
2. Most effective way to pass information/announcements to people? …………………………………………………………………………………………………………………………………………… ……………………………………………………………………………………................................................................... …………………………………………………………………………………………………………………………………………… …………………………………………………………………………………………………………………………………………… ………………………………………………………......................................................................................................
s.14. What do you think the roles and responsibilities of mukhtars, teachers, local government, NGOs, imams, religious officials, doctors or nurses for children to enrolling schools on time?
1. Mukhtars ………………………………………………………………………………………………………………………… ……………………………………………………………………………………................................................................ ……………………………………………………………………………………………………………………………………………
2. Teachers ………………………………………………………………………………………………………………………… ……………………………………………………………………………………................................................................ ……………………………………………………………………………………………………………………………………………
3. Local governments …………………………………………………………………………………………………………… ……………………………………………………………………………………................................................................ ……………………………………………………………………………………………………………………………………………
4. Non-governmental organizations ………………………………………………………………………………………… ……………………………………………………………………………………................................................................ ……………………………………………………………………………………………………………………………………………
5. Imams/religious employees ………………………………………………………………………………………………… ……………………………………………………………………………………................................................................ ………………………………………………………………………………………………………………………………………… 6. Doctors/nurses…………………………………………………………………..……………….………………................. ……………………………………………………………………………………................................................................ ………………………………………………………………………………………………………………………………………
s.15.Can you please talk about anything else you want to mention before we finish our interview?
…………………………………………………………………………………………………………………………………………… ……………………………………………………………………………………................................................................... …………………………………………………………………………………………………………………………………………… ……………………………………………………………………………………………………………………………………………
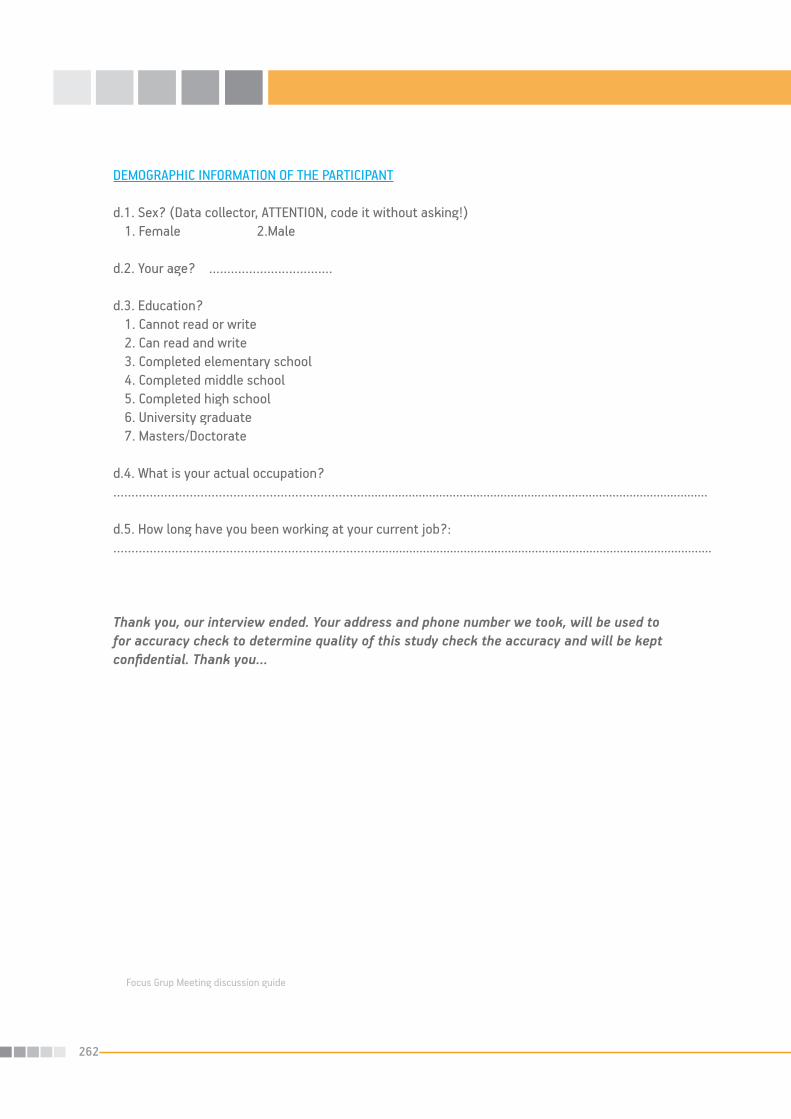
262
Focus Grup Meeting discussion guide
DEMOGRAPHIC INFORMATION OF THE PARTICIPANT d.1. Sex? (Data collector, ATTENTION, code it without asking!)
1. Female 2.Male
d.2. Your age? …………………………….
d.3. Education?1. Cannot read or write2. Can read and write3. Completed elementary school 4. Completed middle school5. Completed high school6. University graduate7. Masters/Doctorate
d.4. What is your actual occupation? …………………………………………………………….....................................................................................................
d.5. How long have you been working at your current job?:………………………………………………………………...................................................................................................
Thank you, our interview ended. Your address and phone number we took, will be used to for accuracy check to determine quality of this study check the accuracy and will be kept confidential. Thank you…

263
Focus Group Meeting Discussion Guide
Warming up-GreetingHello, we are meeting today to talk about and get your valuable input on the issue of children not enrolling school even though they are at the legal age for school enrollment
As you know, according to MONE Primary Schools Regulations, children who are at or above 72 months of age by December 31 of the year, are accepted into first grade in elementary schools. For example, children born in 2001, are supposed to enroll school in 2007-2008 academic year. However, even though these children are eligible in terms of their chronological age, if they are not mature enough physically, they can be held from school for a year if a legal guardian gives a written petition asking for it. In this project, the situation of children who are at the legal age for school, but not enrolled in examined under the issue of “not enrolling in school on time.” In other words, this project covers children who were born in 2001 and were supposed to be in school in 2008-2009 school year, but their record indicated no enrollment for that school year. It was seen that some families did not enroll their children to school when they were at the legal age for enrollment, but had enrolled their children to school the following year. As GENAR research team, we are conducting a research both “TO EXAMINE THE FACTORS ASSOCIATED WITH DELAYED SCHOOL ENROLLMENT IN THE PROVINCES THIS PROBLEM IS EXPERIENCED THE MOST, AND TO DEVELOP STRATEGIES TO PROMOTE TIMELY ENROLLMENT TO SCHOOL.” During this meeting, we are going to have a discussion on late enrollment and not enrolling children to school when legally eligible, and what can be done to solve these problems. Thank you for your time and sharing your thoughts with us.
Introduction1. Just like it was mentioned earlier, children who are at the legal age for school enrollment (at or above 72 months of age) but not enrolled in school are experiencing “not enrolling school on time.” Percentage of children who are experiencing this
problem is quite high in our country. If we are to analyze this problem in detail;
•Whatdoyouthinkthemagnitudeofthisproblemin the town/city/village you live/work in? How do you think the number of children in where you live/work who is out of school even though they are supposed to be in, compare to number of children experiencing the same problem in the country?
•Doyouthinkfamiliesseenotenrollinginschoolontime, in other words, not enrolling when a child is 72 months of age as a problem?
•DoyouthinkotherelementsofthesocietysuchasNGOs, media, local governments, are aware of the magnitude of this problem?
2. As you know children who are at or above 72 months of age on a given year are eligible to enter first grade. Do you think legal guardians are aware of this information about age eligibility to enter school?
REASONS FOR NOT ENROLLING IN SCHOOL WHEN LEGALLY ELIGIBLE3. If we wanted to specify the reasons for not enrolling children in school on time as cultural, social and economical reasons when you think about the characteristics of the region you live in, which one of these factors do you think would be more influential and how? Can you talk about this some? Please discuss these giving examples you can share here. For example…
•Canyoutalkaboutsoci-culturalfactors?
•Aretherefactorsassociatedwithwomen’splacein society? What would they be? Are there religious factors? What would they be?
•Arethereeconomicalfactors?Whatwouldtheybe?
•Arefactorsassociatedwithchildren’shealthanddevelopment significant reasons?
•Cantheimportancefamiliesplaceoneducationbeasignificant factor?
•Canschoolsbeingfarawayandhavingdifficultygoing back and forth to school be a significant factor?

264
•Doyouthinkoverallproblemswitheducationaresignificant factors here?
•Areenvironment,location,transportationsignificantfactors?
4. So, when you consider all what we have talked about, in the city / town / village where you live, what is the most important reason for not being able to start on time?
(ATTENTION! If the people in the group are focusing only on one issue, then ask question 5 as well)
5. Besides…………………..as a factor influencing why children do not enroll school when legally eligible, what is the next most important factor?
PROVINCE/REGION BASED EVALUATIONS6. What are the factors in the region associated with children not enrolling school when eligible:
•Doothereducationalproblemsin(Nameoftheprovince) cause late enrollment? If so can you talk about what these are.
•Doenvironmentalconditions,regionalclimaticconditions, or other factors influence children’s timely enrollment in schools? If so can you talk about these factors?
•Doyouthinkcultural,traditionalandreligiousbeliefsof the people living in the region as well as their language are contributing to children not enrolling in schools on time? If so, can talk about these factors?
7. What are the factors influencing familial decisions about decisions to educate children?
8. Who are the people families in the region talk to or get guidance from when they are deciding about the education of their children?
9. What is the most effective way of communicating any messages or information to the people in the revision? How should news or the information of the work done on this issue be passed on to local people?
10. According to Article 15 of Ministry of National Education Regulations for Primary Schools state that:
“Children who are 72 months old by 31 of December of a given academic year are eligible to enroll in
elementary schools that academic year. Even though a child is eligible to enroll in school based on his or her chronological age, if a parent applies with a written request to delay entry to school, a child’s enrollment can be postponed for one year.”
•Whatarethefamilies’knowledgeregardingthisarticle?
•IsArticle15usedinschools?
•HowisArticle15usedinschools?(Whodecideswhether the child is well developed, or not? If and how are the parents of children who are enrolled in early childhood institutions guided? etc…)? WHAT IS DONE UP TO THIS DAY AND RECOMMENDATIONS FOR THE RESOLUTION OF THE PROBLEM
11. As a representative of the institution or personally did you do anything up to this day to solve this problem? Are there any projects, or work done in which you participated? Can you talk about these a little?
12. What are your recommendations for the children to enroll in schools on time?
•Generalrecommendationsforthethingsneedtobedone in the entire nation?
•Recommendationsatthelevelofthedistrict/province for the solution of this problem?
13. What are the responsibilities of people and institutions to resolve this issue?
•Mukhtarandreligiousofficials
•Inspectors,principlesofschools,teachers
•Districtheadofficial,governorsetc.
•Non-governmentalorganizations
•Parents
•MONEofficials
•Localmediarepresentatives
•Eldersorthosewhoseopinionsmatteredintheprovince/district
THANK YOU…
265
APPENDIX – III REPORT OF THE “WORKSHOP ABOUT DEVELOPING STRATEGIES TO ENSURE TIMELY ENROLLMENT OF CHILDREN IN PRIMARY SCHOOLS.”
1. PARTICIPANTS OF THE WORKSHOP
Participants of the workshop were scholars specializing in education, or related fields, the provincial practitioners such as inspectors, school principals and teachers, and the representatives of non-governmental organizations.
Those attending the workshop were:
•MinistryofNationalEducation
* Deputy Director of MONE Primary Schools General Directorate Ahmet Murat ALTUĞ, Department Head Mehmet GÜRBÜZ, Branch Manager Niyazi KAYA and teachers Zeynep YILDIRIM, Hediye ATICI ARICAN, Cenk TEMEL, Nevzat ÜNSAL, Uğur KARAMAN and Nesrin ŞANLI,
•UNICEF
* Fatma ÖZDEMİR ULUÇ, Ertan KARABIYIK, Nur IŞIKLI, and Didem AKAN
•GENARResearchCompany
* Girne American University, School of Education Dean Prof. Dr. Tanju GÜRKAN, Yıldız Teknik University Faculty Assist. Prof. Dr. İbrahim DEMİR, Boğaziçi University Faculty Assist. Prof. Dr. Ayşegül METİNDOĞAN WISE, GENAR General Manager Mustafa ŞEN, Statistics expert Talin EVYAPAN, reporter Funda DEMİR, and reporter Ayhan KÖSE From GENAR Research Company
•NGOs
* Salim SAĞLAM from Education Reform Initiative
* Seda YILMAZ from Mother Child Education Foundation (MCEF, AÇEV)
* Özgür ÇETİNKAYA from Cooperative for Development Workshop
•EDUCATORSofMONE
* MONE Primary School Inspectors, school principal
and teachers: Fisun SEÇKİN, Kazım BAŞEKMEKÇİ, Ergin ZORLU, Bilal GÜR, Sibel SAKIZCI, Ercan USTA, Serap YÜKSEL, Derya GÜVEN, Meltem VURAL, Abdullah GEÇİT, Şebnem TUNA SIRKINTI, Aliye TOK, Hüseyin KARTAL,
* MONE Director of Strategy Development Board Nezir ÜNSAL,
* Branch Manager Bahattin ÖZGER from MONE General Directorate of Pre-School Education
•Academics
* Abant İzzet Baysal University Faculty Dr. Ali BABAHAN,
* Ankara University, School of Education Faculty Prof. Dr. Necla KURUL, Assocciate Prof. Dr. Fatma HAZIR BIKMAZ, Assist. Prof. Dr. Cem BABADOĞAN, and Lecturer Dürdane BAYRAM
* Boğaziçi University, School of Education Faculty, Assist. Prof. Dr. Nalan BABÜR,
* Hacettepe University Prof. Dr. Hülya ÇINGI, Associate Prof. Kasım KARATAŞ,
* Harran University Assist. Prof. Dr. İbrahim KORUK,
* Middle East Technical University, School of Education Faculty Assist. Prof. Dr. Hanife AKAR,
There were 53 invited discussants for the workshop. Of these invited discussants, 46 of them participated in the workshop including 4 of them from UNICEF, 7 from GENAR Research, 9 from General Directorate of Primary Education, 1 person from General Directorate of Strategy Development, 3 representatives from NGOs, 8 academics, 1 primary school inspector, and 12 principals and teachers. Seven invited guests were not able to participate for various excuses.
2. THE OBJECTIVE:One of the problems related to schooling in Turkey is late enrollment. In order to examine this problem from various perspectives, the Ministry of National Education and UNICEF organized a “Strategy Development Workshop for Ensuring on-time Enrollment to Primary Education” in 20-21 November 2009. The aim of this workshop was to assess the current situation, to profile families whose children did not enroll in schools on-time, and to develop

266
solutions. First, the findings of research conducted by GENAR with support of the Ministry of National Education and UNICEF were shared in the workshop. Then participants discussed the findings and exchanged their expert opinions.
3. WORKSHOP AGENDAAfter the opening on the first day of the workshop, the objective, method, implementation and problems faced during the implementation of the study were shared with workshop participants by Mustafa ŞEN and Assist. Prof. Dr. İbrahim DEMİR. The research findings were next presented by Assist. Prof. Dr. Ayşegül METİNDOĞAN WISE. Discussion about the results of the research followed the presentation. During the discussion, the workshop participants’ questions and comments were taken, and all the workshop participants evaluated the study findings and had a general discussion. After presentations and discussions, two separate workshop groups were formed under the supervision of Prof. Dr. Tanju GÜRKAN. The first group met under the moderation of Prof. Dr. Tanju GÜRKAN and discussed the issues that were covered under the title of “Strategy Development Pertaining to the Detection and Solution of Issues Related to Teachers, Educational Processes, Resources, and Applications.” The second group met under the moderation of Assist. Prof. Dr. Ayşegül METİNDOĞAN WISE and discussed the issues that were covered under the title of “Strategy Development Pertaining to the Detection of Social, Cultural and Economical Factors Contributing to the Problem, Awareness and Education of Parents and Local People, and Developing Solutions.” As a result of these discussions, group presentations were prepared by workshop groups to be shared with all the workshop participants.
On the second day, the discussions and the progress made on the first day were evaluated, followed by group presentations. Both workshop groups presented their work and participants asked question and suggested solutions. Prof. Dr. Tanju GÜRKAN summarized the results of both groups and offered some general conclusions.
4. IDENTIFICATION OF PROBLEMS AND THEIR POSSIBLE SOLUTIONS DEVELOPED BY WORKSHOP GROUPS
1. STRATEGY DEVELOPING GROUP A: STRATEGY DEVELOPMENT PERTAINING TO THE DETECTION AND SOLUTION OF ISSUES RELATED TO TEACHERS, EDUCATIONAL PROCESSES, RESOURCES, AND APPLICATIONS
1.1.PROBLEM ANALYSIS1. Article 15 is not clear enough and does not provide sufficient guidance.
2. Resources of primary schools are limited. 3. Early childhood education opportunities are limited
3. Early childhood education opportunities are limited.
4. The research on equalities-inequalities is limited.
5. Teacher training programs in universities are inadequate for preparing teachers for the realities of rural communities.
6. Due to heavy workloads, Guidance and Research Centers (GRCs) are inadequate to reach children who do not enroll in schools on time (children who enroll in schools after delaying and those who are unenrolled).
1.2. IDENTIFICATION OF ACTORS WHO CAN WORK AND STRATEGIES FOR THE SOLUTION
1.2.1. PROBLEMS WITH ARTICLE 151. The shortcomings in the implementationof Article 15.
2. The absence of a guiding policy to promote and advertise Article 15 clearly to school administrators, teachers, mukhtars (village headmen), parents and other stakeholders.
3. Lack of information to screen for identifying unenrolled children.
4. Lack of the awareness of civil administrative supervisors and other actors about the issues of unenrollment and late enrollment.
5. The abstention of teachers in bringing children back to schools in cases of unenrollment and late

267
enrollment for various reasons (communication, cooperation, lack of resources, etc.)
6. Lack of cooperation among social actors (citizenship bureaus, health directorates, governing offices, municipalities, MONE directorates, NGOs, etc.).
1.2.2. STRATEGICAL PROPOSALS FOR THE SOLUTION OF THE PROBLEMS EXPERIENCED WITH ARTICLE 15
1. Developing awareness and working toward spreading efforts for implementation.
•Improvingtheroleofschools
•Usingmediaeffectively
•Sendingletters/flyers(easytoreadandinformative) out to the parents
•Thefollowinginformationshouldbeintheletters/flyers;
* Necessity of completing the final enrollment of children after automatic registration by MONE * Implementation of 72 months as the age of starting school
* School enrollment information
* School registration is free
* Distribution of free textbooks
2. Presentation of various relief organizations (of course materials, uniforms, free nutritional aids, etc.) Current enrollment rates and late enrollment of children should be analyzed carefully and policies should be developed to ensure timely enrollment of children.
3. District officials and other actors in the districts where new school enrollment rates are low should be trained to understand realities of and factors associated with late enrollment.
•Lettersthatinviteparentstoenrolltheirchildreninschools should be prepared and sent out.
•Lettersshouldcontaininformationaboutthelawregarding the change of residence and the clarification of legal sanctions in the case of failure to inform the state of such changes.
•Organizingmeetingsforthesocialactorsthatwouldcreate synergy and allow them to share information and knowledge to develop solutions.
4. Local governments, municipalities need to be more active and involved in working towards producing solutions to identified needs
•Whenschoolsneedlandtoexpand,legalities

268
concerning expropriation issues need to be simplified and made less complicated
•Children’stransportationandaccesstoschoolsneedto be ensured.
1.2.3. ISSUES ASSOCIATED WITH THE LIMITED RESOURCES IN PRIMARY EDUCATION INSTITUTIONS
1. Lack of resources
•Lackofequipment,lackofspaceandclassrooms
•Transportationissues(transportationsecurity,the distance to school, seasonal weather related conditions/challenges)
2. The issues with educators
•Schoolbasedissues
* Overcrowded classrooms
* Lack of educational resources
* Lack of guidance and counseling teachers
* Lack of special education teachers
* Classroom teachers’ lack of knowledge and skills for the education and treatment of
children with special needs
•Student-basedissues
* Language problems
* Lack of knowledge about socio-emotional development
* Health and nutrition problems
•Issuesbasedonteachers’needs
* Teachers’ mobility in the region
* Social and economic problems of teachers
* Teachers’ need for pre-service and in-service training.
3. Issues related to Parent-teacher associations
•Communicationproblemsbetweenteachersandparents
•Lackofcommunicationwithparentsafterautomaticregistration
•Teachers’lackofcommunicationandcooperationskills
1.2.4. STRATEGY PROPOSALS FOR THE SOLUTIONS OF THE PROBLEMS ASSOCIATED WITH LIMITED RESOURCES IN PRIMARY EDUCATION INSTITUTIONS
1. Creation of standards in providing school equipment and other resources based on the needs of the people in the region.
2. During strategic planning for schools, resources needed by the schools need to be emphasized, and common needs of the actors need to be identified.
3. Investment plans of special provincial administrations should be focused on the troubled and densely populated regions.
4. Creation of a system that evaluates social and psychological development of children in order to make decisions about whether these children are ready for the demands of schools.
5. Teachers should be provided with pre-service and in service training opportunities to deal with issues concerning bringing unenrolled children back to schools, promoting student attendance, education of children with dyslexia, etc.
1.2.5. PROBLEM OF LIMITED EARLY CHILDHOOD EDUCATION OPPORTUNITIES
1. Lack of physical space and facilities (toys, cardboards, craft materials, supporting staff, etc...) in early childhood educational institutions.
2. Language problems
3. Nutritional problems that adversely affect children’s mental and physical development
4. Lack of awareness of the families concerning the importance of early childhood education
5. Lack of cooperation with health institutions about healthy development children as well as identification of at-risk children.
6. Teachers’ lack of basic skills and knowledge regarding the education of at-risk students and inclusive education.

269
1.2.6. STRATEGY PROPOSALS FOR THE SOLUTION OF THE PROBLEM OF LIMITED EARLY CHILDHOOD EDUCATION OPPORTUNITIES
1. In the short term, instead of institutional early childhood education in the areas where there is no early childhood educational institutions, new models that are addressing the unique needs of the regions must be developed and implemented.
2. Good examples, such as the AÇEV summer school, can be models for short-term solutions.
3. In the long term, compulsory early childhood education policies must be created, implemented and disseminated.
4. Two-year long early childhood education opportunities should be developed for students who cannot speak Turkish.
5. Nutritional policies that are practiced in preschools should be developed and disseminated.
6. GRCs should screen children to identify children with dyslexia and healthcare institutions must screen preschool age children to determine developmental problems and delays, nutritional deficits and mental retardation.
7. To increase GRCs performance in completing these identified duties, their workloads must be reduced and staff numbers should be increased.
1.2.7.PROBLEMS WITH LIMITED RESEARCH ON REGIONAL EQUALITY
1. Lack of research about the education of children of migrant and seasonal workers.
2. Lack of research about rural development policy, educational equality and access to education for rural children.
3. Lack of research to develop strategies to promote unenrolled or late entrant children’s attendance in schools
1.2.8. STRATEGY PROPOSALS FOR THE SOLUTION OF THE LIMITED RESEARCH ON REGIONAL EQUALITY
1. The addition of a new module to e- school system to monitor school enrollment activities of children.
2. Activities need to be started to include the participation of all actors to promote need-based, local, short and long-term solutions.
3. In the areas where seasonal agricultural worker families are found most:
•Childrenofmigrantworkersshouldbeabletostayatregional boarding schools (YİBOs) where their parents work. Because these migrant workers stay mainly in tents, various solutions that are unique in addressing their own problems such as placement of these children in schools near their family tents should be considered.
1.2.9. ISSUES WITH TEACHER TRAINING POLICIES THAT LACK PREPARATION OF TEACHERS FOR THE REALITIES OF RURAL AREAS
1. The curriculum in faculties of education seem to be insufficient in terms of preparing teacher candidates to deal with local problems and issues such as unenrollment, late enrollment and equality education.
2. Lack of cooperation between faculties of education and schools in need in terms of planning internship activities
3. Limited number of trained guidance and counseling and special education teachers
1.2.10. STRATEGY PROPOSALS FOR THE SOLUTION OF THE ISSUES WITH TEACHER TRAINING POLICIES THAT LACK PREPARATION OF TEACHERS FOR THE REALITIES OF RURAL AREAS
1. Policies should be developed to ensure cooperation between faculties of education and primary schools that are in need
•Increasinginternshipopportunitiesforprospectiveteachers in these schools

270
•CommunityServicecourseswithinthefacultiesofeducation could be used to bring service to schools and families in need
2. Training of teacher candidates that focus on how to communicate with parents in these rural regions with limited opportunities.
3. In the framework of cooperation with the Ministry of Education, faculties of education can develop programs that promote timely enrollment and attendance of children in schools. These programs can be developed for pre-service, novice and experienced teachers.
4. Training of more guidance and counseling teachers at the undergraduate level should be targeted. When appointing guidance and counseling teachers, schools in need can be given priority.
1.2.11. PROBLEMS GRCS FACE IN ACCESSING CHILDREN WITH NO ENROLLMENT AND DELAYED ENROLLMENT1. Excessive workload
2. Lack of staff
3. Lack of rural studies.
•Targetaudienceislimitedtothecenterandthevillage near to the center
•Limitedstudiesintermsoffamilyeducation. 1.2.12. STRATEGY PROPOSALS FOR THE PROBLEMS GRCS FACE IN ACCESSING CHILDREN WITH NO ENROLLMENT AND DELAYED ENROLLMENT
1. Policies should be developed to ensure the training of qualified educators to work in GRCs
2. Development of policies that make working in GRCs more attractive in order to increase employment in GRCs2. STRATEGY DEVELOPMENT GROUP B: STRATEGY DEVELOPMENT PERTAINING TO THE DETECTION OF SOCIAL, CULTURAL AND ECONOMICAL FACTORS CONTRIBUTING TO THE PROBLEM, AWARENESS AND EDUCATION OF PARENTS AND LOCAL PEOPLE, AND DEVELOPING SOLUTIONS2.1.PROBLEM ANALYSIS

271
In order to target the child, parent, social, cultural, economical factors related to the problem of late enrollment and propose possible solutions for the problem, both macro- and micro- systems and the problems within these systems need to be understood that include the embedded and interactive relationships of the people, institutions, societal norms and belief structures with the child in the center.
•Children
•Healthanddevelopment
•Mothers’education
•Fathers’education
•Teachertraining
•Earlychildhoodeducation•Educationalinstitutions
•Article15
•Committee-board-officework
•Servingtotheneedsofchildrenwhoarenotenrolledin primary schools on time
•Language
•Media
•Nationalawareness
•Beliefsystems
2.2. DEFINING ACTORS AND STRATEGIES FOR SOLUTION
2.2.1.CHILDREN AND THE ISSUE OF CHILD HEALTH AND DEVELOPMENT
1. Not having a child-centered perspective for the analysis of the problem
2. Place of children in society and perspectives about children.
3. Financial challenges/difficulties
4. Child labor
5. Birth registration problem
6. The number of children in families
7. Problems experienced in monitoring of child health and development, in improvement of child health and development and in informing families.
2.2.2 STRATEGY PROPOSALS FOR THE ISSUE OF CHILDREN, CHILD HEALTH AND DEVELOPMENT
1. Child poverty and its consequences need to be better understood and better fought against.
2. Adoption of a child-centered perspective
3. Prevention of child labor (the law that allows for the employment of 14 year old children in light work must be changed)
4. Collaboration with state registrars’ office is needed to determine the status of unregistered children
5. Emancipation and individuation of children need to be promoted
6. Reasons for why chi ldren do not want to go to school need to be understood
7. Strategies need to be developed to make schools more attractive
8. Quality of early childhood and primary education need to be improved
9. Quality child health and development monitoring systems need to be developed within the “School Health” programs
10. Informing families about the development of their children in their language at the level they understand need to be provided.
11. Health promoting schools project need to be made more effective and its quality need to be improved
12. Budget problem needs to be resolved
13. Various solutions such as having school physicians, need to be considered
14. School health project practices need to be implemented in coordination with the health centers.
15. Rehabilitation centers need to be improved. Their work need to be monitored, assessed and guided.
•Workneedstobedonetoreducethenumberofchildren in the families in favor of children
* Families should be taught about the economic and social burden of having too many children.
* Birth control campaigns should be maintained.
* Birth control methods should be easily accessible.
272
* There should be more work to fight against men having multiple wives.
•Servicesneedtobeprovidedtomeettheneedsofchildren with disabilities.
* Inclusion / quality
2.2.3. ISSUES RELATED TO PARENTS
1. Lack of educational opportunities for parents2. The illiteracy problem3. Lack of occupational skills4. Lack of parenting skills5. Difficulties in reaching and educating fathers.6. The ties between parents and other social partners that can communicate with them, are not effective2.2.4. STRATEGY PROPOSALS FOR ISSUES RELATED TO PARENTS
1. Planning of training programs about child development (children with and without disabilities) for families
2. Provision of literacy training
3. Providing courses that provide occupational training for parents
4. Ensuring the participation of both mothers and fathers
5. Programs that are designed to ensure awareness for parents should be conducted with a collaborative work of mukhtars, religious officials and health workers.
6. Developing strategies that aim at behavioral change.
7. Implementation of father support programs•Sincetheyareamoredifficulttargetgrouptoreachto train, more original and divers programs needed to be developed•Designingworkshopsforfathers:trainingandeducation of the fathers while they are taught various skills
8. Using mosques, cafes (“kahvehane” that mainly men go to in rural areas) and other areas where fathers usually go to, should be used to reach and educate fathers.
9. In the framework of father education, Ministry of National Education should cooperate with the Ministry
of National Defense in order to educate young men during their military service about the importance of early childhood education, timely enrollment of children in schools, education of girls and government support for poor families who cannot afford to educate their children.
10. Faculties of education can be consulted to get help in training the trainers who will take part in teaching military personnel
11. Faculties of education can be consulted to get help in designing of the educational materials to be used in military bases during the training of men serving in the military
2.2.5. ISSUES RELATED TO TEACHERS
1. Teachers’ lack of information about the communities and the at-risk groups they work for
2. The lack of ties they have with families
3. Not preferring to work in the region
4. Not participation in the screening work
5. Inadequate training of teachers
6. Shortage of qualified teachers to educate and train parents.
7. Difficulties in establishing bonds among parents, schools and teachers
2.2.6. STRATEGY PROPOSALS FOR ISSUES RELATED TO TEACHERS
1. Teachers need to establish cooperation with families, and they need to get familiar with the community.
2. Cohesion needs to be built between teachers and families.
3. Teachers need to stay in the region for longer periods.
•Effortsneedtobeputintodevelopingincentivesandencouragement for the teacher to stay longer in the region (for example, getting promotional payments or awards for working in the region for 5 (five) years).
4. Work more effectively in screening efforts.
5. MONE needs to put forward more effective and intensive in-service training for teachers.

273
6. Training of teachers about community service•Selectingstafffromqualifiedpeopletogiveadulttraining and education,•Lookingforthecertificatesofteachingandadulteducation in people who give training,•Trainingprogramsneedtobestandardized.
2.2.7. PROBLEMS WITH EDUCATIONAL INSTITUTIONS
1. Budget problems2. Problems related to school bussing systems and YİBOs (Regional Boarding Schools)•Quality•Accessibility/transportation•Legislation•Theirimpactsonchilddevelopment3. Problems experienced between school and family relationships4. Problems in primary schools •Quality•Accessibility/transportation•Lackofteachers•Overcrowdedclassrooms5. Lack of early childhood education 6. Problems experienced with Article 157. Lack of commissions and committees directly dealing with the late enrollment problems
2.2.8. STRATEGY PROPOSALS FOR THE PROBLEMS WITH EDUCATIONAL INSTITUTIONS
1. Food given in YİBOs and bussing system must be inspected in terms of hygiene and quality.
2. The companies that provide food services must be held responsible for the hygene of the food, where the food is served and the environment.
3. Deficit of guidance and counseling teachers who work in school-bussing program need to be eliminated. These schools that participate in school-bussing programs need to serve for the needs of both children and their families.
4. The impacts of YİBOs on children and families should be researched.
5. Legislative changes must be done in school-bussing program.
6. Clarification of criteria for schools and bringing a standardization to educational institutions (developing
and implementing minimal standards of quantity and quality).
7. Increasing parent teacher association activities
8. The job descriptions must be done for the teams that work in screening, identifying and persuasion activities.
9. Ensuring families to take part in the school process (most convenient hours devoted to such work could be guidance and social and club activity hours).
10. Schools should provide occupational and skill training.
11. MONE needs to reevaluate its policies for the use of its financial resources and how effectively its financial resources are used (reevaluation of providing every child free textbooks, and using the findings of this research for developing other effective methods).
12. Schools should be more easily accessible.
13. Early childhood education
•Enoughresourcesfromthebudgetneedtobeallocated,•Shouldbecompulsory,itshouldbewidespreadinthecountry and the quality needs to be improved,•Qualitystandardsneedstobeintroduced,•Betterqualityactivitiesneedtobeprovidedinorderfor the child to explore his or her needs and areas of interest.14. ARTICLE 15•TeachersshouldbebetterabletoexplainArticle15to families,•Studiesshouldbedonetowardeffectiveimplementation of existing regulations and laws,•Sendingmailstoparentswithinformationandanotesaying “it is time for your child to enroll in school”,•Carryingoutworkaimedatteachingparentshowtocalculate their children’s age for school (72 months),•Thefirstweekofschools(weekofprimaryeducation) to be spent like a fair or a festival,•Ensuringtheimplementationoflegislationsbycivilauthorities,15. Works of commissions, committees and boards
•Theestablishmentofcommitteesinruralareastoensure timely enrollment of children schools.
•TheboardworkscouldbestartedinMONEtoensure

274
timely enrollment of children.
•Participationofvarioussocialstakeholderstoworkin these committees need to be ensured (parents, teachers, mukhtars, religious officials, NGOs, etc.).
2.2.9. PROBLEM OF MEETING THE NEEDS OF CHILDREN WHO DO NOT ENROLL IN SCHOOLS ON TIME
1. Existing models used for the solution are ineffective in solving the problems of the target group.
2.2.10. STRATEGY PROPOSALS FOR THE PROBLEM OF MEETING THE NEEDS OF CHILDREN WHO DO NOT ENROLL IN SCHOOLS ON TIME
1. Existing models need to be re-evaluated and different models need to be considered.2. Different models to address the need to various risk groups need to be identified and developed (seasonal, migrant, agricultural labor).•Theschoolterms/semesterscanbere-evaluatedbytaking into account seasonal work/migration•Anoptionofintensiveshorter-termeducationcouldbe considered.•YİBOscanbeusedtotakethechildrenofmigrantworkers in the places families go for work.3. Providing clothing, food and stationary materials for the students in need.4. Getting support of Social Assistance and Solidarity Fund and municipalities.
2.2.11. LANGUAGE PROBLEM1. The languages spoken in some of the homes within the region are not Turkish, and families experienced difficulties in learning Turkish. 2. Children still do not speak Turkish when they start school3. Teachers cannot understand the languages spoken in the in the region other than Turkish.
2.2.12. STRATEGY SUGGESTIONS FOR THE LANGUAGE PROBLEM
1. Children need to be taught Turkish prior to starting primary schools.2. Turkish language education can be given to parents whose native languages are not Turkish.3. People who teach Turkish should be chosen from experts who are trained in teaching second language.4. Teaching Turkish to non-native speakers should be part of early childhood education programs. 5. Teachers should learn the languages spoken in the
region such as Kurdish and Arabic.
2.2.13. NATIONAL AWARENESS ISSUE
1. Lack of awareness of the problem at the national level.2. Existing of nationwide prejudices for people form various regions.3. Lack of a national perspective on the issue. 2.2.14. STRATEGY PROPOSALS FOR NATIONAL AWARENESS ISSUE
1. Efforts need to be made toward overcoming interregional differences and prejudices held toward people living in various regions of the country.2. National projects need to be coordinated and state policies need to be developed for cooperation and coordination.3. Campaigns need to be started for the people to develop feelings of ownership for the problems and for the flow country men and women.4. All the institutions and agencies that are involved in the problem need to work in solidarity.5. National campaigns need to be launched that focus on the issues of calculating and determining school enrollment age and readiness for school.
2.2.15. ISSUES WITH MEDIA
1. Media, particularly local media, is not used at sufficient levels or effectively.2. Sometimes programs broadcasted in the media support and encourage prejudices toward various groups of people.
2.2.16. STRATEGY SUGGESTIONS FOR THE ISSUES WITH MEDIA
1. National and local media should be used more for national awareness.2. The communities affected by this problem should be presented with free of biases and prejudices in the media.3. Media should be a used as a mechanism to combat prejudices and biases within society.
275
5. OVERALL ASSESSMENT In line with findings of current research, various issues and problems were discussed at the workshop. The main issues and problems discussed can be summarized as follows.
•Overall,socio-economicallevelsofthefamilieslivingin this region is low,
•Largefamiliesarecommon,
•Mothersinparticularareuneducated,
•MothersandchildrenoftendonotknowTurkish,
•Girlsareatahigherdisadvantageincasesofnotenrolling in school on time,
•Mainsourcesofincomeforthefamiliesareunskilledlabor, seasonal work and seasonal migrant work,
•Parentsusuallyarenotawareofschoolenrollmentage,
•Familiesprefertodelaytheenrollmentoftheirchildren in schools for a year for various reasons,
•Familieshavenoinformationaboutarticle15oftherelated regulations,
•Familiesarenotawareoftheassistanceandsupportstate and some other organizations provide for the families who have children attending primary school,
•Familiesdonotseemtomonitorthedevelopmentand health of their children,
•Primaryschoolsfacedeficienciesintransportingits students, number of students in classrooms, and providing appropriate educational environments,
•Therearelimitedearlychildhoodeducationopportunities for children,
•Schooladministratorsandteachersfacecommunication problems with parents and students, particularly the ones who do not speak, or speak very little Turkish,
•Teachermobilityishigherinthisregion,adverselyaffecting screening/ identification and monitoring activities,
•Thereisnosufficientandeffectivecollaborationbetween primary schools and faculties of education in the region,
•Nationalandlocalmediaareinadequateandvery limited in working to eliminate disparities and prejudices among regions and increasing levels of
education,
•Thereisnoestablishedsynergyamongpeople,local governments, schools, community leaders, and nongovernmental organizations in the region.
In line with the issues and problems discussed at the workshop, operational strategies have been developed toward solutions. These solutions can be performed in short and/or long-term.
Some of these strategies are:
•Thestategovernment,andtheMinistriesofNationalEducation, Health and Defense, universities, NGOs, local governments and media organizations should work in collaboration and prepare an emergency developmental plan to improve life standards of the people living in the region, to provide professional and occupational training for fathers and to teach Turkish to mothers.
•Aprotocolcanbepreparedandimplementedtostart a partnership between health centers and school administrators who carry on school health practices.
•Rehabilitationcentersneedtobeimprovedandtheir evaluation, inspection and guidance need to be properly carried out.
training during these campaigns need to be provided that show families when the number of children in a family increase, the economical and burden families face increase.
•Thereshouldbeagreateremphasisplacedonteaching Turkish to people living in the region, particularly mothers. Facilities of primary schools and universities in the region should be activated and used.
•Workinginapartnershipwithschools,mosques,cafes (kahvehane) and the local gathering places fathers often visit need to be used to training of fathers for various skills. During the training of fathers designed to help them develop various skills to use toesponsible for teaching these issues to young men serving in the military.
•Thefactthatlegalageforstartingschoolis72months needs to be clearly taught to parents by teachers, school administrators, and national and local media.
•Familiesneedtobeinformedabouttheirneedto
276
•RuralstudiesneedtobestartedinGRCsthataddress the specific needs of people living in rural areas. In order to have a better rural focus in GRCs, their personnel need to be increased, and their workloads need to be reduced.
find work, the fathers can also be educated about the importance of schooling, early childhood education, primary education and the importance of girls’ education.
•MinistryofNationalEducationandtheMinistryof National Defense can work together to educate young men at their military bases while they are doing their military service about these pressing issues (the importance of early childhood education, timely enrollment of children in schools, girls’ education, support state provides for the families in need who enroll their children in schools etc.)
•Facultiesofeducationwithinuniversitiesneedtobeconsulted to train the personnel who will be
•Birthcontrolcampaignsneedtobemaintained,andcomplete the final enrollment of their children in schools once their children are automatically, pre-registered in schools through e-registration system.
•Schoolsshouldprepareanddeliverinvitationlettersto families informing that it is time for them to enroll their children in school.
•Lettersandflyersneedtobepreparedanddeliveredto families that explain article.
•Anewmoduleneedstobeaddedtoe-schoolsystem that allows for monitoring student progress concerning their school enrollment and attendance.
•Childrenofseasonalmigrantworkersneedtobeeither placed in YİBOs or in schools near where their families migrate to work.
•Educationalmodelsotherthanexistinginstitutionaleducation need to be considered and possibly implemented to provide the children of the region with early childhood and primary education.
•Qualitativeandquantitativeaspectsofearlychildhood and primary education institutions need to be evaluated and improved.
•RegionalBoardingSchools(YİBOs)andschool-bussing systems need to be re-examined and
re-structured to address the needs and cultural characteristics of the people living in the region.
•Schooldistrictsintheregionshouldorganizeactivities to introduce school system to people especially in the areas where parents have low educational levels.
•Teachersmustbeprovidedwithpre-serviceandin-service training about how to work with disadvantaged families and their children.
•Studentsinschoolsofeducationshouldhaveopportunities for internship in villages.
•Collaborationbetweenschoolsandthefacultiesof education need to be established in order to use courses such as Community Service to serve the needs of the people and the schools in underdeveloped regions.

277
APPENDIX-IV. SAMPLE CARD USED DURING STRUCTURED INTERVIEWS FOR THE QUANTITATIVE RESEARCH
CARD 3 (QUESTIONS 25-42)
1. IT WAS INFLUENTIAL AT ALL2. IT WAS NOT INFLUENTIAL3. IT WAS PARTIALLY INFLUENTIAL4. IT WAS INFLUENTIAL5. IT WAS VERY INFLUENTIAL
Tel:(212) 212 80 52
Faks: (212) 212 38 02www.genar.com.tr
