lateral ph gradient between oxphos complex iv and f0f1 atp
TRANSCRIPT
ARTICLE
Received 29 Sep 2013 | Accepted 13 Dec 2013 | Published 29 Jan 2014
Lateral pH gradient between OXPHOS complex IVand F0F1 ATP-synthase in folded mitochondrialmembranesBettina Rieger1, Wolfgang Junge2 & Karin B. Busch1
Ion-driven ATP synthesis by rotary F0F1 ATP-synthase powers aerobic life. Since Mitchell’s
seminal hypothesis, this synthesis has been discussed in terms of the proton-motive force
between two bulk phases, each in equilibrium. In active mitochondria, a steady proton flow
cycles between pumps and the distant ATP synthase. Here we determine the lateral pH
profile along the p-side of cristae in situ by attaching a ratiometric fluorescent pH-sensitive
GFP variant to OXPHOS complex IV, a proton pump, and the dimeric F0F1 ATP-synthase, a
proton consumer. In respiring HeLa cells, we observe that the local pH at F0F1 dimers is 0.3
units less acidic than that at complex IV. This finding is consistent with the calculated pH
profile for steady proton diffusion from CIV to F0F1. The observed lateral variation in the
proton-motive force necessitates a modification to Peter Mitchell’s chemiosmotic proposal.
The experimental technique can be extended to other pH-dependent reactions in membrane
microcompartments.
DOI: 10.1038/ncomms4103
1 Division of Mitochondrial Dynamics, Fachbereich Biologie/Chemie, Universitat Osnabruck, D-49076 Osnabruck, Germany. 2 Niedersachsen-Professur furBiophysik, Fachbereich Biologie/Chemie, Universitat Osnabruck, D-49076 Osnabruck, Germany. Correspondence and requests for materials should beaddressed to K.B.B. (email: [email protected]).
NATURE COMMUNICATIONS | 5:3103 | DOI: 10.1038/ncomms4103 | www.nature.com/naturecommunications 1
& 2014 Macmillan Publishers Limited. All rights reserved.
In eukaryotic cells, adenosine triphosphate (ATP) is producedat the crista membrane of mitochondria. Cristae are flatinvaginations of the mitochondrial inner membrane that
extrude into the matrix space with a few tubular openings to theinter-membrane space between the inner and outer membranes1–3.The crista membrane hosts the components of the respiratoryelectron transport chain (complexes I-IV, alias CI-IV) and ATPsynthase (complex V, FOF1 alias CV). Complexes I, III and IVpump protons from the matrix (the n-side of the membrane) intothe intra-cristae space (the p-side). The proton-motive force drivesprotons back via ATP synthase and ATP is formed4,5.The proton pumps and the proton-driven ATP synthase can besegregated. Complexes I-IV are mainly found in the flat sheetmembrane6,7, whereas immuno-EM and EM-tomography haverevealed ribbons of F0F1 dimers lining the highly curved rim8–12.These ribbons seem to be involved in folding the crista membrane.Deleting certain subunits of F0F1 (termed e and g) abolishes thedimerization, and thus the high curvature of the crista membranewithout deactivating ATP synthesis13. The accumulation of ATPsynthase in the highly curved rim has recently introduced a newdimension to the classical debate over localised versus delocalized(that is, chemiosmotic) proton coupling: electrostatic guidance ofprotons into ATP synthase. One group has postulated that thecurved membrane segment concentrates protons at the concaveside of the membrane, thereby generating extra proton-motiveforce for ATP synthesis in cristae9. A related process forthe thylakoid membranes of chloroplasts has been coined‘Proton-Electrostatic Hypothesis for Localized Proton CouplingBioenergetics’14. Both proposals are based on the electrostatics atlow ionic strength where protons and hydroxyl anions were themajor charge carriers. In contrast, for a realistic situation(physiological ionic strength and steady proton flow), we expectthe local pH at the p-side of CV (the proton sink) to be morealkaline and not more acidic than the pH at CIV (the protonsource).
Here, this expectation is tested using a pH-indicating analogueof green fluorescent protein. This analogue is fused to the p-side(intermembrane/intra-cristae space) of either CIV or dimeric CV.The local pH at either CIV or the CV dimer is measured inactively respiring mitochondria of HeLa cells. To intensifyOXPHOS, the cells are cultured in galactose plus glutamine15
to circumvent ATP production by glycolysis. In contrast tohyperglycaemic conditions, these metabolic substrates force HeLacells to rely on OXPHOS and CV-dimer stabilisation16. Theseconditions result in a lateral pH difference between CIV andthe dimeric synthase in the intra-cristae space: the determinedproton concentration at the ATP synthase molecules in the dimerribbons around the perimeter of cristae differs from theconcentration predicted by the previously described electrostaticapproaches. The following treatment of diffusive proton flowunder physiological conditions provides an explanation for thisdifference.
ResultsLocal pH determination at specific OXPHOS complexes. Tomeasure local pH values, superecliptic pHluorin (sEcGFP) fusedto subunits of OXPHOS complexes IV and V was used as a localpH indicator17. SEcGFP is a double emission fluorescent protein.OXPHOS subunits were tagged at their C terminus and checkedfor correct localisation in mitochondria. SEcGFP was excited witha 405-nm laser, and the fluorescence emission was recordedsimultaneously at 454–474 nm and 508–514 nm. The local pHwas inferred from the emission ratio (Em511/464)18. In onetransiently transfected HeLa cell line, sEcGFP was fused to the Cterminus of subunit 8a of CIV, which is located at the p-side
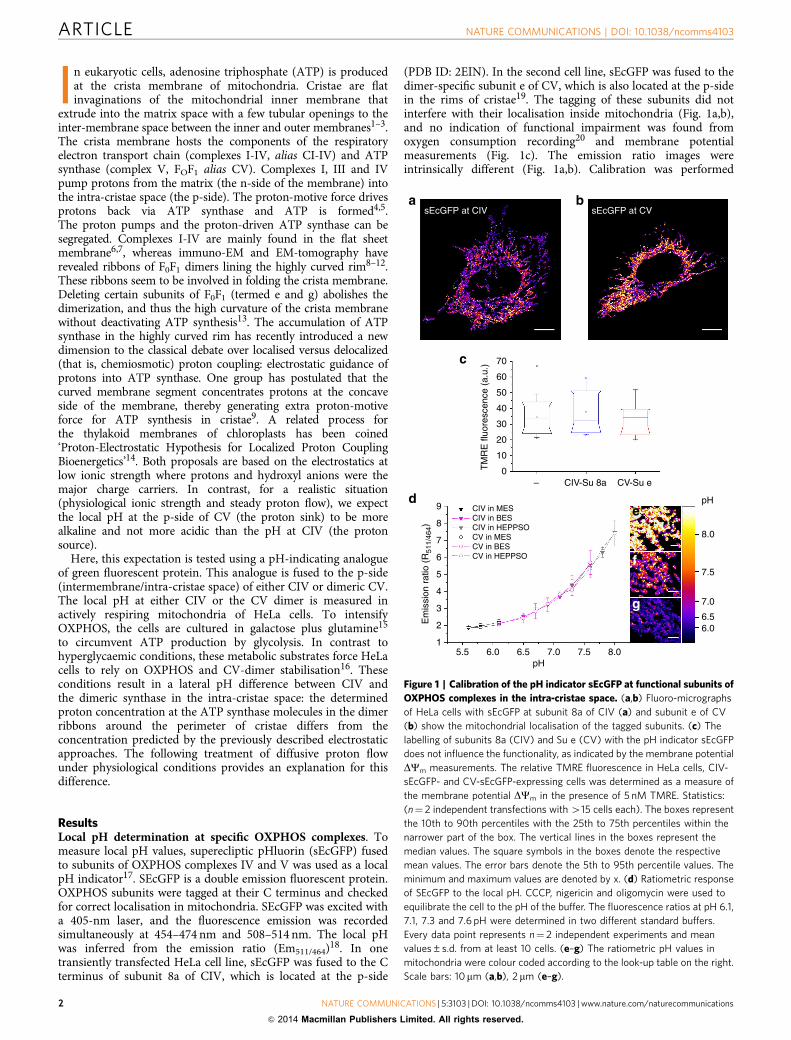
(PDB ID: 2EIN). In the second cell line, sEcGFP was fused to thedimer-specific subunit e of CV, which is also located at the p-sidein the rims of cristae19. The tagging of these subunits did notinterfere with their localisation inside mitochondria (Fig. 1a,b),and no indication of functional impairment was found fromoxygen consumption recording20 and membrane potentialmeasurements (Fig. 1c). The emission ratio images wereintrinsically different (Fig. 1a,b). Calibration was performed
sEcGFP at CIV
TM
RE
fluo
resc
ence
(a.
u.)
CIV in MESCIV in BESCIV in HEPPSO
pH
8.0
6.0
7.5
6.5
7.0
CV in BESCV in HEPPSO
CV in MES
pH5.5 6.0 6.5 7.0 7.5 8.0
– CIV-Su 8a CV-Su e
70
60
50
40
30
20
10
0
Em
issi
on r
atio
(R
511/
464)
1
2
3
4
5
6
7
8
9
sEcGFP at CV
Figure 1 | Calibration of the pH indicator sEcGFP at functional subunits of
OXPHOS complexes in the intra-cristae space. (a,b) Fluoro-micrographs
of HeLa cells with sEcGFP at subunit 8a of CIV (a) and subunit e of CV
(b) show the mitochondrial localisation of the tagged subunits. (c) The
labelling of subunits 8a (CIV) and Su e (CV) with the pH indicator sEcGFP
does not influence the functionality, as indicated by the membrane potential
DCm measurements. The relative TMRE fluorescence in HeLa cells, CIV-
sEcGFP- and CV-sEcGFP-expressing cells was determined as a measure of
the membrane potential DCm in the presence of 5 nM TMRE. Statistics:
(n¼ 2 independent transfections with 415 cells each). The boxes represent
the 10th to 90th percentiles with the 25th to 75th percentiles within the
narrower part of the box. The vertical lines in the boxes represent the
median values. The square symbols in the boxes denote the respective
mean values. The error bars denote the 5th to 95th percentile values. The
minimum and maximum values are denoted by x. (d) Ratiometric response
of SEcGFP to the local pH. CCCP, nigericin and oligomycin were used to
equilibrate the cell to the pH of the buffer. The fluorescence ratios at pH 6.1,
7.1, 7.3 and 7.6 pH were determined in two different standard buffers.
Every data point represents n¼ 2 independent experiments and mean
values±s.d. from at least 10 cells. (e–g) The ratiometric pH values in
mitochondria were colour coded according to the look-up table on the right.
Scale bars: 10mm (a,b), 2 mm (e–g).
ARTICLE NATURE COMMUNICATIONS | DOI: 10.1038/ncomms4103
2 NATURE COMMUNICATIONS | 5:3103 | DOI: 10.1038/ncomms4103 | www.nature.com/naturecommunications
& 2014 Macmillan Publishers Limited. All rights reserved.
with sEcGFP tagged to the proteins of interest in the respectivecell lines under conditions in which the membranes werepermeable to protons. The buffer pH was adjusted, and theresulting fluorescence emission ratio was recorded (Fig. 1d).
The resulting pH titration curves were congruent, indepen-dently of the location of attachment of the pH indicator andindependently of the chemical nature of the buffer. For pHdetermination, a mean titration curve was used. The fluorescenceemission ratio was correlated with the pH, and the ratio images ofthe mitochondria were accordingly colour coded (Fig. 1e–g).
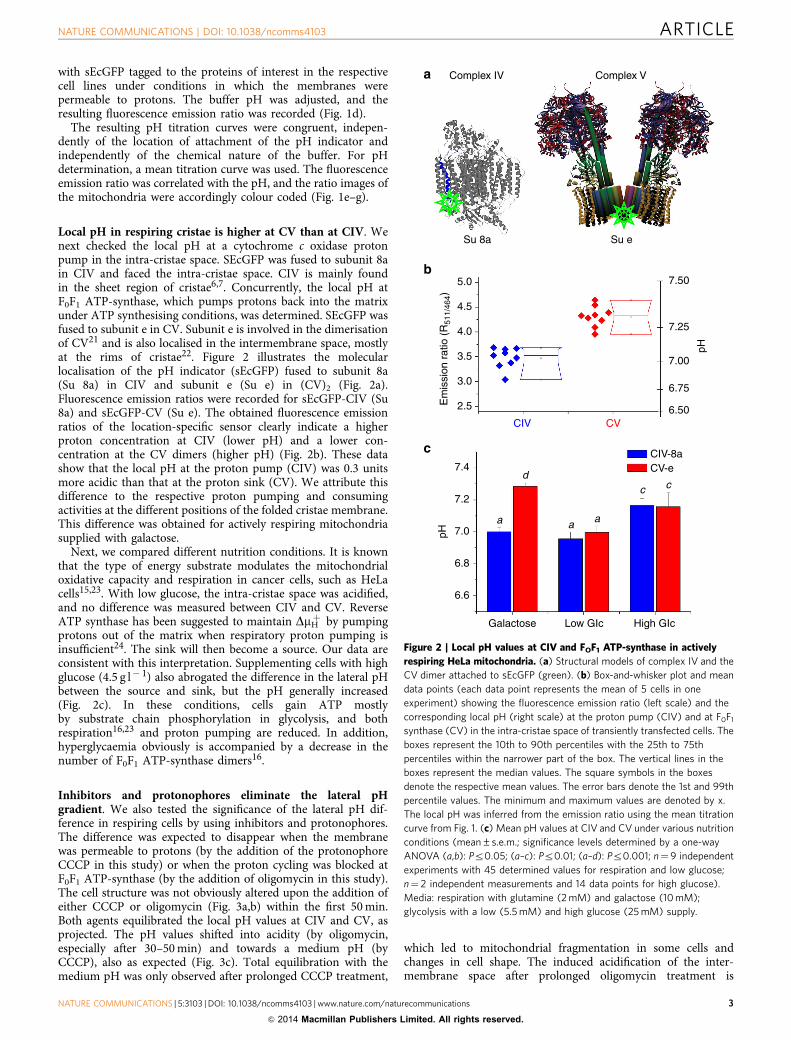
Local pH in respiring cristae is higher at CV than at CIV. Wenext checked the local pH at a cytochrome c oxidase protonpump in the intra-cristae space. SEcGFP was fused to subunit 8ain CIV and faced the intra-cristae space. CIV is mainly foundin the sheet region of cristae6,7. Concurrently, the local pH atF0F1 ATP-synthase, which pumps protons back into the matrixunder ATP synthesising conditions, was determined. SEcGFP wasfused to subunit e in CV. Subunit e is involved in the dimerisationof CV21 and is also localised in the intermembrane space, mostlyat the rims of cristae22. Figure 2 illustrates the molecularlocalisation of the pH indicator (sEcGFP) fused to subunit 8a(Su 8a) in CIV and subunit e (Su e) in (CV)2 (Fig. 2a).Fluorescence emission ratios were recorded for sEcGFP-CIV (Su8a) and sEcGFP-CV (Su e). The obtained fluorescence emissionratios of the location-specific sensor clearly indicate a higherproton concentration at CIV (lower pH) and a lower con-centration at the CV dimers (higher pH) (Fig. 2b). These datashow that the local pH at the proton pump (CIV) was 0.3 unitsmore acidic than that at the proton sink (CV). We attribute thisdifference to the respective proton pumping and consumingactivities at the different positions of the folded cristae membrane.This difference was obtained for actively respiring mitochondriasupplied with galactose.
Next, we compared different nutrition conditions. It is knownthat the type of energy substrate modulates the mitochondrialoxidative capacity and respiration in cancer cells, such as HeLacells15,23. With low glucose, the intra-cristae space was acidified,and no difference was measured between CIV and CV. ReverseATP synthase has been suggested to maintain DmH
þ by pumpingprotons out of the matrix when respiratory proton pumping isinsufficient24. The sink will then become a source. Our data areconsistent with this interpretation. Supplementing cells with highglucose (4.5 g l� 1) also abrogated the difference in the lateral pHbetween the source and sink, but the pH generally increased(Fig. 2c). In these conditions, cells gain ATP mostlyby substrate chain phosphorylation in glycolysis, and bothrespiration16,23 and proton pumping are reduced. In addition,hyperglycaemia obviously is accompanied by a decrease in thenumber of F0F1 ATP-synthase dimers16.
Inhibitors and protonophores eliminate the lateral pHgradient. We also tested the significance of the lateral pH dif-ference in respiring cells by using inhibitors and protonophores.The difference was expected to disappear when the membranewas permeable to protons (by the addition of the protonophoreCCCP in this study) or when the proton cycling was blocked atF0F1 ATP-synthase (by the addition of oligomycin in this study).The cell structure was not obviously altered upon the addition ofeither CCCP or oligomycin (Fig. 3a,b) within the first 50 min.Both agents equilibrated the local pH values at CIV and CV, asprojected. The pH values shifted into acidity (by oligomycin,especially after 30–50 min) and towards a medium pH (byCCCP), also as expected (Fig. 3c). Total equilibration with themedium pH was only observed after prolonged CCCP treatment,
which led to mitochondrial fragmentation in some cells andchanges in cell shape. The induced acidification of the inter-membrane space after prolonged oligomycin treatment is
Su 8a
a
b
c
Su e
Complex VComplex IV
7.00
7.25
7.50
6.75
6.50
pH
pH
CIV CV
CIV-8a
d7.4
7.2
7.0
6.8
6.6
Galactose Low GIc High GIc
c c
a aa
CV-e
5.0
4.5
4.0
3.5
2.5
3.0
Em
issi
on r
atio
(R
511/
464)
Figure 2 | Local pH values at CIV and FOF1 ATP-synthase in actively
respiring HeLa mitochondria. (a) Structural models of complex IV and the
CV dimer attached to sEcGFP (green). (b) Box-and-whisker plot and mean
data points (each data point represents the mean of 5 cells in one
experiment) showing the fluorescence emission ratio (left scale) and the
corresponding local pH (right scale) at the proton pump (CIV) and at F0F1
synthase (CV) in the intra-cristae space of transiently transfected cells. The
boxes represent the 10th to 90th percentiles with the 25th to 75th
percentiles within the narrower part of the box. The vertical lines in the
boxes represent the median values. The square symbols in the boxes
denote the respective mean values. The error bars denote the 1st and 99th
percentile values. The minimum and maximum values are denoted by x.
The local pH was inferred from the emission ratio using the mean titration
curve from Fig. 1. (c) Mean pH values at CIV and CV under various nutrition
conditions (mean±s.e.m.; significance levels determined by a one-way
ANOVA (a,b): Pr0.05; (a–c): Pr0.01; (a–d): Pr0.001; n¼9 independent
experiments with 45 determined values for respiration and low glucose;
n¼ 2 independent measurements and 14 data points for high glucose).
Media: respiration with glutamine (2 mM) and galactose (10 mM);
glycolysis with a low (5.5 mM) and high glucose (25 mM) supply.
NATURE COMMUNICATIONS | DOI: 10.1038/ncomms4103 ARTICLE
NATURE COMMUNICATIONS | 5:3103 | DOI: 10.1038/ncomms4103 | www.nature.com/naturecommunications 3
& 2014 Macmillan Publishers Limited. All rights reserved.
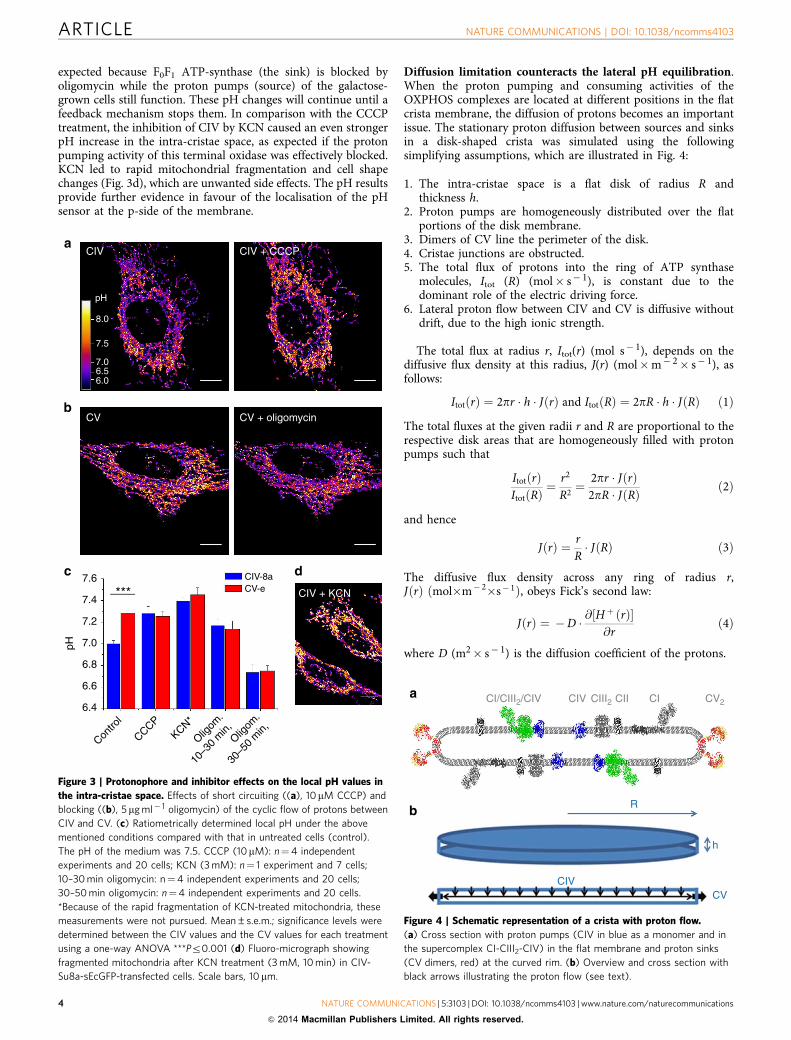
expected because F0F1 ATP-synthase (the sink) is blocked byoligomycin while the proton pumps (source) of the galactose-grown cells still function. These pH changes will continue until afeedback mechanism stops them. In comparison with the CCCPtreatment, the inhibition of CIV by KCN caused an even strongerpH increase in the intra-cristae space, as expected if the protonpumping activity of this terminal oxidase was effectively blocked.KCN led to rapid mitochondrial fragmentation and cell shapechanges (Fig. 3d), which are unwanted side effects. The pH resultsprovide further evidence in favour of the localisation of the pHsensor at the p-side of the membrane.
Diffusion limitation counteracts the lateral pH equilibration.When the proton pumping and consuming activities of theOXPHOS complexes are located at different positions in the flatcrista membrane, the diffusion of protons becomes an importantissue. The stationary proton diffusion between sources and sinksin a disk-shaped crista was simulated using the followingsimplifying assumptions, which are illustrated in Fig. 4:
1. The intra-cristae space is a flat disk of radius R andthickness h.
2. Proton pumps are homogeneously distributed over the flatportions of the disk membrane.
3. Dimers of CV line the perimeter of the disk.4. Cristae junctions are obstructed.5. The total flux of protons into the ring of ATP synthase
molecules, Itot (R) (mol� s� 1), is constant due to thedominant role of the electric driving force.
6. Lateral proton flow between CIV and CV is diffusive withoutdrift, due to the high ionic strength.
The total flux at radius r, Itot(r) (mol s� 1), depends on thediffusive flux density at this radius, J(r) (mol�m� 2� s� 1), asfollows:
ItotðrÞ ¼ 2pr � h � J rð Þ and ItotðRÞ ¼ 2pR � h � J Rð Þ ð1Þ
The total fluxes at the given radii r and R are proportional to therespective disk areas that are homogeneously filled with protonpumps such that
ItotðrÞItotðRÞ
¼ r2
R2¼ 2pr � JðrÞ
2pR � J Rð Þ ð2Þ
and hence
J rð Þ ¼ rR� J Rð Þ ð3Þ
The diffusive flux density across any ring of radius r,JðrÞ ðmol�m� 2�s� 1Þ, obeys Fick’s second law:
JðrÞ ¼ �D � @ H þ rð Þ½ �@r
ð4Þ
where D (m2� s� 1) is the diffusion coefficient of the protons.
CIV-8a
CIV + KCN
CIV
pH
8.0
7.0
6.0
7.5
6.5
CV CV + oligomycin
CIV + CCCP
CV-e***
Contro
l
CCCP
Oligom
.
10–3
0 m
in,KCN*
Oligom
.
30–5
0 m
in,
7.4
7.6
7.2
7.0
6.8
6.6
6.4
pH
Figure 3 | Protonophore and inhibitor effects on the local pH values in
the intra-cristae space. Effects of short circuiting ((a), 10mM CCCP) and
blocking ((b), 5 mg ml� 1 oligomycin) of the cyclic flow of protons between
CIV and CV. (c) Ratiometrically determined local pH under the above
mentioned conditions compared with that in untreated cells (control).
The pH of the medium was 7.5. CCCP (10mM): n¼4 independent
experiments and 20 cells; KCN (3 mM): n¼ 1 experiment and 7 cells;
10–30 min oligomycin: n¼4 independent experiments and 20 cells;
30–50 min oligomycin: n¼4 independent experiments and 20 cells.
*Because of the rapid fragmentation of KCN-treated mitochondria, these
measurements were not pursued. Mean±s.e.m.; significance levels were
determined between the CIV values and the CV values for each treatment
using a one-way ANOVA ***Pr0.001 (d) Fluoro-micrograph showing
fragmented mitochondria after KCN treatment (3 mM, 10 min) in CIV-
Su8a-sEcGFP-transfected cells. Scale bars, 10mm.
CI/CIII2/CIV CIV CIII2
R
h
CVCIV
CV2CII CI
Figure 4 | Schematic representation of a crista with proton flow.
(a) Cross section with proton pumps (CIV in blue as a monomer and in
the supercomplex CI-CIII2-CIV) in the flat membrane and proton sinks
(CV dimers, red) at the curved rim. (b) Overview and cross section with
black arrows illustrating the proton flow (see text).
ARTICLE NATURE COMMUNICATIONS | DOI: 10.1038/ncomms4103
4 NATURE COMMUNICATIONS | 5:3103 | DOI: 10.1038/ncomms4103 | www.nature.com/naturecommunications
& 2014 Macmillan Publishers Limited. All rights reserved.
With equation (2), the solution of Fick’s equation becomes thefollowing:
H þ ðrÞ½ � ¼ H þ 0ð Þ½ � � r2
R2� Itot Rð Þ
4p � h � D ð5Þ
Averaging over a homogenous distribution of CIV over the diskleads to the following solution:
H þ ðrÞ½ �h i ¼ H þ 0ð Þ½ � � 12� Itot Rð Þ
4p � h � D ð6Þ
With the given assumptions, the calculated proton concentrationdrops parabolically from the centre of the disk-shaped membranetowards the ring of CV dimers at the perimeter. Using equation(5), we calculated the drop in the proton concentration from thecentre to the perimeter of a crista (R¼ 0.5 mm) using a reasonableassumption for the total flux (Itot Rð Þ ¼ 50 � 10� 21mol�s� 1), thethickness of the intra-crista space (h¼ 10 nm), and the diffusioncoefficient of a proton (D � 5 � 10� 9m2�s� 1) in the crowdedand diffusion-obstructed intra-crista space (see ref. 25).
The calculated concentration drop was 80 nM from the centreof the crista disk (pH 6.8) to the perimeter. This drop isequivalent to a pH increase of 0.7 units from the centre (assumedpH 6.8) to the rim (calculated pH 7.5). The mean concentrationdrop was 40 nM (see equation (6)). The calculated values followthe same pattern as in the experiments; they are not meant tomatch quantitatively because the idealizations underlying theabove solution do not strictly hold. ATP synthase molecules arenot restricted to the perimeter at the rims of cristae26, the protonpumps may be non-homogeneously distributed over the flatsurfaces, and the crista junction may not be perfectly proton tight.All these complications, however, do not invalidate the findingthat the proton concentration at the inlet of the ATP synthasedimers is lower but not higher than the concentration elsewherein the intra-cristae space.
DiscussionIn the present study, we experimentally determined the lateral pHdifference between the respiratory chain complex cytochromec oxidase (proton pump) and F0F1 ATP-synthase dimers (protonconsumer). The two OXPHOS complexes are located at differentpositions in flat, hollow crista discs. CIV is mainly foundin the sheet region6,7, while F0F1 ATP-synthase dimers shapethe rim8,27–29. Under respiratory conditions, the actual pH at theF0F1 dimers at the rims of cristae was higher than the pH at theproton pump in the sheet region. Thus, the specific architectureof cristae with dimerisation and ribbon formation by ATPsynthase does not enhance but rather diminishes the localproton-motive force for ATP synthesis. This result qualifies thecontradictory claims of two other groups9,14. In his chemiosmotichypothesis4,5, Peter Mitchell considered two bulk phases, and heassumed a constant proton-motive force across the couplingmembrane. According to the data and the diffusion calculated inthe present work, this assumption does not apply for a steadyproton flow between a proton pump and a remote dimeric ATPsynthase. For mitochondria, however, the amendment toMitchell’s original concept is minor. While the entropiccontribution to the proton-motive force (� 2.3 RTDpH) varieslaterally, the electric component (FDC) is not affected due to thehigh ionic strength. Slightly lowering the transmembrane pHdifference at the ATP synthase dimers on the rim of cristae isintrinsically unfavourable to ATP production by CV dimers. Byfolding the cristae, however, dimerisation increases the packingdensity of the energy-transducing membrane and therewith theATP production per volume. Some CV molecules reside in cristaesheets7,26. In hyperglycaemic conditions, which have beenreported to decrease the number of CV dimers, the pH
difference between CIV and CV disappears, as shown here.In addition, inhibitor effects eliminated the lateral differencebetween CIV and CV, as expected. Effective inhibition of therespiratory chain electron flow due to CIV inhibition by KCNalso increased the intra-cristae space pH but was accompaniedby unwanted ultrastructural changes and mitochondrialfragmentation. In contrast, during oligomycin treatment,acidification of the IMS proceeded due to the continuingactivity of the proton pump. At the same time, the lateral pHgradient between CIV and CV vanished because of the inhibitionof the sink, which switches the system from a steady state toequilibrium. In conclusion, the intra-cristae space obviously is amicrocompartment with different structural and functionaldomains.
Recently, 10–80 s pH pulses were found in the mitochondrialmatrix30,31. The pulses should correspond to an alkalinisation ofthe intermembrane space. We cannot rule out the possibility thatsuch pulses were recorded without being recognized. It iscertainly challenging to address this possibility in the future.
The observations in the present study ought to be of interestfor ATP synthesis in all kingdoms of life. Chloroplasts haveachieved even higher packing densities in their thylakoidmembranes than found in cristae membranes. Despite its intricatefolding, the thylakoid membrane forms a simply connected sheetin which the electric potential difference is delocalised over morethan 10,000 ATP synthase molecules (see ref. 32); however, thepH difference may also vary laterally, as established formitochondria in this work. In alkaliphilic bacteria, the closeproximity of complex V to a proton pump may be essential forATP synthesis to occur with virtually zero bulk-to-bulk proton-motive force (see refs 12,27,33–36).
MethodsPlasmid constructs. For eukaryotic expression, the full-length protein-codingregion of superecliptic pHluorin (F64L/S65T/S147D/N149Q/V163A/S175G/S202F/Q204T/A206T) (a gift from Prof. Jurgen Klingauf) was inserted by PCR amplifi-cation into a modified pSEMS-26 m vector from NEB Biosciences (formerlyCovalys Biosciences) using the following primers: forward 50-GCGCGAATT-CACCATGAG TAAAGGAGAAGAACTTTTCACTGGAG-30 and reverse50-GCGCGGATCCACCGGTTTTGTATAGTTCATCCATGCCA TG-30 , with anEcoRI (forward) and a BamHI (reverse) restriction site (underlined). The respectivesubunits of OXPHOS complexes were fused with their C termini to the N terminusof sEcGFP using the following primers: 50-GCGCGATATCATGTTGGCTACCA-GGG-30 (forward) and 50-GCGCGAATTCCTTCTTCCACTCGTTCTTTTC G-30
(reverse) for CIV-Su 8a, and 50-GCGTAAGATATCATGGTGCCACCGGTGC-AGG-30 (forward) and 50-GCAATTGAATTCCTTTAATATGCTGTCATCTT-CTG-30 (reverse) for CV Su e (the EcoRV and EcoRI restriction sites are under-lined)20. PCR primers were purchased from Sigma Aldrich. Enzymes, restrictionbuffer and BSA were purchased from NEB Biosciences.
Cell culture and treatments. HeLa cells, purchased from DSMZ (DeutscheSammlung von Mikroorganismen und Zellkulturen GmbH), were cultured inminimal essential medium with Earle’s salts (MEM, PAA Lab GmbH, E15-888)with 5.5 mM glucose, 2 mM stable glutamine and sodium bicarbonate, supple-mented with 10% (v/v) fetal bovine serum (FBS) superior (Biochrom AG), 1%MEM nonessential amino acids (NEA, Biochrom AG) and 1% 4-(2-hydro-xyethyl)piperazine-1-ethanesulfonic acid (HEPES, PAA Lab GmbH) at 37 �C with5% CO2. The cells were split 2–3 times a week using trypsin/EDTA (Biochrom),supplemented with HEPES (PAA), sodium bicarbonate (PAA), penicillin/strepto-mycin (Biochrom) and PBS (Biochrom). The cells were transfected at 60–80%confluence with 5 mg DNA in 2.5 ml fresh medium. For the analysis of activelyrespiring mitochondria, the glucose medium was replaced with galactose medium(Dulbecco’s MEM¼DMEM (PAA, E15-079)) with NEA, without glucose, andsupplemented with 10 mM galactose (Sigma), 4 mM glutamine (Biochrom), 10%(v/v) fetal bovine serum (FBS) superior (Biochrom), sodium bicarbonate (PAA)and HEPES (PAA) for at least 2 days. For the analysis of hyperglycaemic mito-chondria, the glucose medium was replaced by DMEM (PAA, E15-079), supple-mented with 25 mM glucose (Sigma), 2 mM glutamine, 10% (v/v) fetal bovineserum (FBS) superior, sodium bicarbonate (PAA) and HEPES (PAA) for at least 2days. For the protonophore and inhibitor studies, the cells were additionally treatedwith 10 mM CCCP (carbonyl cyanide m-chlorophenyl hydrazone, Enzo Life) for atleast 30 min and 5 mg ml� 1 oligomycin (Enzo Life, times indicated) or 3 mM KCN(potassium cyanide, Sigma) for 10–30 min.
NATURE COMMUNICATIONS | DOI: 10.1038/ncomms4103 ARTICLE
NATURE COMMUNICATIONS | 5:3103 | DOI: 10.1038/ncomms4103 | www.nature.com/naturecommunications 5
& 2014 Macmillan Publishers Limited. All rights reserved.
Ratio imaging microscopy for pH determination. Two days after the transfectionwith sEcGFP fusion constructs, the pH of the transfected cells was recorded in situby confocal fluorescence emission ratio imaging (inverted Olympus FluoviewFV1000). The cLSM was equipped with a � 60 oil immersion objective (UPLSAPOoil, NA 1.35, N/0.17/FN26.5) and two spectral detectors. All measurements wereperformed at room temperature in fresh growth medium. Ratio images wereobtained simultaneously using the NIR laser (ex. 405 nm) of the microscope(em. 454–474 nm and 508–514 nm).
In situ pH calibration. For pH calibration, cells were perfused initially for 3–5 minwith PBS (PAA, pH 7.0–7.5 with CaCl2 and MgCl2). Then, PBS was exchanged forMES (pH 5.6–6.1), BES (pH 6.1–7.6) or HEPPSO (pH 7.1–8.0) buffer, which wasadjusted to the desired pH by 1 M HCl or NaOH, and supplemented with thefollowing compounds: 125 mM KCl, 20 mM NaCl, 0.5 mM CaCl2, 0.5 mM MgSO4,20mM CCCP, 1 mM nigericin and 5 mg ml� 1 oligomycin. Images were obtainedwithin 15-45 min of incubation. Nigericin was purchased from Enzo Life. MES waspurchased from Biomol, and BES and HEPPSO were purchased from Sigma. Othercommonly used chemicals were purchased from Roth.
Membrane potential measurements. The membrane potential was determinedwith 5 nM TMRE and without quenching after 30 min of incubation with ver-apamil (10 mM) to block the multidrug transporter. In brief, verapamil and 5 nMTMRE were added to the incubation medium for 30 min at 37 �C. Then, the cellswere mounted into a chamber with fresh incubation medium containing 5 nMTMRE and 10mM verapamil for microscopy studies. Thus, measurements wereperformed using equilibrated dye. The fluorescence of mitochondrial TMRE in themitochondrial regions of interest was then determined using the same settings(gain and fluorescence excitation power) in all samples. Because the cells weretransiently transfected, an internal control was always available. Data were analysedby using ImageJ software (NIH Image, http://rsb.info.nih.gov/nih image/index.html). The mean grey values of mitochondrial TMRE (lines along sitemitochondria B3 mm, pixel size: 1 px¼ 0.166mm site) were determined. Becausethe uncoupling of mitochondria after the addition of CCCP (10mM) led to analmost complete disappearance of the TMRE signal, we concluded that themeasurements were performed without quenching.
Data analysis. The data were analysed by using ImageJ software (NIH Image,http://rsb.info.nih.gov/nih image/index.html) according to the procedure fromMorgan et al.37 In brief, to determine intracellular pH maps, background-subtracted images were processed using the sigma filter option of the ImageJsoftware (pixel radius¼ 1, pixels used within 2 sigmas, minimum pixelfraction¼ 0.4) and scaled up to 5. Then, a threshold level for the converted 32-bitimages was determined interactively for each cell. The threshold was determinedonly for the images recorded at le¼ 508–514 nm because these images had highersignal/noise ratios and were divided by the images with the lower signal/noise ratio.The background was set to NaN. For the final image, another threshold was set to41, and the ratio was determined. All the background pixels were set to NaN inthe images; within the cells, each pixel represents the ratio of the emission at508–514 nm to that at 454–474 nm. The Boltzmann fit was chosen here for fittingthe sigmoidal curves of the calibration data, in accordance with Grynkiewicz38,who described the relation between analyte concentration and fluorescence andfluorescence ratios. The fitting was performed using Origin 6.0 (OriginLab Corp.,Northhampton, MA, USA).
References1. Mannella, C. A. et al. Topology of the mitochondrial inner membrane:
dynamics and bioenergetic implications. IUBMB Life 52, 93–100 (2001).2. You, C. et al. Self-controlled monofunctionalization of quantum dots for
multiplexed protein tracking in live cells. Angew Chem. 49, 4108–4112 (2010).3. Sun, M. G. et al. Correlated three-dimensional light and electron microscopy
reveals transformation of mitochondria during apoptosis. Nat. Cell Biol. 9,1057–1065 (2007).
4. Mitchell, P. Coupling of photophosphorylation to electron and hydrogentransfer by a chemiosmotic type of mechanism. Nature 191, 144–148 (1961).
5. Mitchell, P. Chemiosmotic coupling in oxidative and photosyntheticphosphorylation. Physiol.Rev. 41, 445–502 (1966).
6. Vogel, F., Bornhovd, C., Neupert, W. & Reichert, A. S. Dynamicsubcompartmentalization of the mitochondrial inner membrane. J. Cell Biol.175, 237–247 (2006).
7. Wilkens, V., Kohl, W. & Busch, K. Restricted diffusion of OXPHOS complexesin dynamic mitochondria delays their exchange between cristae and engendersa transitory mosaic distribution. J. Cell Sci. 126, 103–116 (2013).
8. Dudkina, N. V., Heinemeyer, J., Keegstra, W., Boekema, E. J. & Braun, H. P.Structure of dimeric ATP synthase from mitochondria: an angular associationof monomers induces the strong curvature of the inner membrane. FEBS Lett.579, 5769–5772 (2005).
9. Strauss, M., Hofhaus, G., Schroder, R. R. & Kuhlbrandt, W. Dimer ribbonsof ATP synthase shape the inner mitochondrial membrane. EMBO J. 27,1154–1160 (2008).
10. Davies, K. M. et al. Macromolecular organization of ATP synthase andcomplex I in whole mitochondria. Proc. Natl Acad. Sci. USA 108, 14121–14126(2011).
11. Rabl, R. et al. Formation of cristae and crista junctions in mitochondriadepends on antagonism between Fcj1 and Su e/g. J. Cell Biol. 185, 1047–1063(2009).
12. Allen, R. D., Schroeder, C. C. & Fok, A. K. An investigation of mitochondrialinner membranes by rapid-freeze deep-etch techniques. J. Cell Biol. 108,2233–2240 (1989).
13. Paumard, P. et al. The ATP synthase is involved in generating mitochondrialcristae morphology. EMBO J. 21, 221–230 (2002).
14. Lee, J. W. Proton-electrostatic hypothesis for localized proton couplingbioenergetics. Bioenergetics 1, 104 (2012).
15. Reitzer, L. J., Wice, B. M. & Kennell, D. Evidence that glutamine, not sugar, isthe major energy source for cultured HeLa cells. J. Biol. Chem. 254, 2669–2676(1979).
16. Domenis, R., Bisetto, E., Rossi, D., Comelli, M. & Mavelli, I. Glucose-modulatedmitochondria adaptation in tumor cells: a focus on ATP synthase and inhibitorfactor 1. Int. J. Mol. Sci. 13, 1933–1950 (2012).
17. Miesenbock, G., De Angelis, D. A. & Rothman, J. E. Visualizing secretion andsynaptic transmission with pH-sensitive green fluorescent proteins. Nature 394,192–195 (1998).
18. Narendra, D. P. & Youle, R. J. Targeting mitochondrial dysfunction: role forPINK1 and Parkin in mitochondrial quality control. Antioxid. Redox. Signal 14,1929–1938 (2011).
19. Belogrudov, G. I., Tomich, J. M. & Hatefi, Y. Membrane topography and near-neighbor relationships of the mitochondrial ATP synthase subunits e, f, and g.J. Biol. Chem. 271, 20340–20345 (1996).
20. Muster, B. et al. Respiratory chain complexes in dynamic mitochondria displaya patchy distribution in life cells. PLoS One 5, e11910 (2010).
21. Arnold, I., Pfeiffer, K., Neupert, W., Stuart, R. A. & Schagger, H. Yeastmitochondrial F1F0-ATP synthase exists as a dimer: identification of threedimer-specific subunits. EMBO J. 17, 7170–7178 (1998).
22. Davies, K. M. et al. Macromolecular organization of ATP synthase andcomplex I in whole mitochondria. Proc. Natl Acad. Sci. USA. 108, 14121–14126(2011).
23. Rossignol, R. et al. Energy substrate modulates mitochondrial structure andoxidative capacity in cancer cells. Cancer Res. 64, 985–993 (2004).
24. Campanella, M., Parker, N., Tan, C. H., Hall, A. M. & Duchen, M. R. IF(1):setting the pace of the F(1)F(o)-ATP synthase. Trends Biochem. Sci. 34,343–350 (2009).
25. Zhang, C. et al. Water at hydrophobic interfaces delays proton surface-to-bulktransfer and provides a pathway for lateral proton diffusion. Proc. Natl Acad.Sci. USA 109, 9744–9749 (2012).
26. Rabl, R. et al. Formation of cristae and crista junctions in mitochondriadepends on antagonism between Fcj1 and Su e/g. J. Cell Biol. 185, 1047–1063(2009).
27. Paumard, P. et al. The ATP synthase is involved in generating mitochondrialcristae morphology. EMBO J. 21, 221–230 (2002).
28. Giraud, M. F. et al. Is there a relationship between the supramolecularorganization of the mitochondrial ATP synthase and the formation of cristae?Biochim. Biophys. Acta 1555, 174–180 [pii] (2002).
29. Minauro-Sanmiguel, F., Wilkens, S. & Garcia, J. J. Structure of dimericmitochondrial ATP synthase: novel F0 bridging features and the structuralbasis of mitochondrial cristae biogenesis. Proc. Natl Acad. Sci. USA 102,12356–12358 (2005).
30. Azarias, G. & Chatton, J. Y. Selective ion changes during spontaneousmitochondrial transients in intact astrocytes. PLoS One 6, e28505 (2011).
31. Santo-Domingo, J., Giacomello, M., Poburko, D., Scorrano, L. & Demaurex, N.OPA1 promotes pH flashes that spread between contiguous mitochondriawithout matrix protein exchange. EMBO J. 32, 1927–1940 (2013).
32. Schonknecht, G., Althoff, G. & Junge, W. The electric unit size of thylakoidmembranes. FEBS Lett. 277, 65–68 (1990).
33. Mulkidjanian, A. Y., Heberle, J. & Cherepanov, D. A. Protons @ interfaces:implications for biological energy conversion. Biochim. Biophys. Acta 1757,913–930 (2006).
34. Cherepanov, D. A., Junge, W. & Mulkidjanian, A. Y. Proton transfer dynamicsat the membrane/water interface: dependence on the fixed and mobile pHbuffers, on the size and form of membrane particles, and on the interfacialpotential barrier. Biophys. J. 86, 665–680 (2004).
35. Mitchell, P. Coupling of phosphorylation to electron and hydrogen transfer bya chemi-osmotic type of mechanism. Nature 191, 144–148 (1961).
36. Mitchell, P. Chemiosmotic coupling in oxidative and photosyntheticphosphorylation. Biol. Rev. Camb. Philos. Soc. 41, 445–502 (1966).
ARTICLE NATURE COMMUNICATIONS | DOI: 10.1038/ncomms4103
6 NATURE COMMUNICATIONS | 5:3103 | DOI: 10.1038/ncomms4103 | www.nature.com/naturecommunications
& 2014 Macmillan Publishers Limited. All rights reserved.
37. Morgan, B., Sobotta, M. C. & Dick, T. P. Measuring E(GSH) and H2O2with roGFP2-based redox probes. Free. Radic. Biol. Med. 51, 1943–1951(2011).
38. Grynkiewicz, G., Poenie, M. & Tsien, R. Y. A new generation of Ca2þindicators with greatly improved fluorescence properties. J. Biol. Chem. 260,3440–3450 (1985).
AcknowledgementsWe thank Jacob Piehler for continuous support and Wladislaw Kohl for excellenttechnical assistance. This work was supported by a DFG grant to Karin Busch(Bu2288/1-1) and by the SFB 944. Wolfgang Junge was endowed with a post-retirementgrant (Niedersachsenprofessur) by the Government of Lower Saxony.
Author contributionsB.R. designed experiments and analysed data. W.J. and K.B.B. designed experiments,analysed data and wrote the manuscript. W.J. performed calculations. K.B.B. developedstrategies.
Additional informationCompeting financial interests: The authors declare no competing financial interests.
Reprints and permission information is available online at http://npg.nature.com/reprintsandpermissions/
How to cite this article: Rieger, B. et al. Lateral pH gradient between OXPHOS complexIV and F0F1 ATP-synthase in folded mitochondrial membranes. Nat. Commun. 5:3103doi: 10.1038/ncomms4103 (2014).
NATURE COMMUNICATIONS | DOI: 10.1038/ncomms4103 ARTICLE
NATURE COMMUNICATIONS | 5:3103 | DOI: 10.1038/ncomms4103 | www.nature.com/naturecommunications 7
& 2014 Macmillan Publishers Limited. All rights reserved.