latin american equity research sector report · consumer vs. discount play-upgrading kof,...
TRANSCRIPT

Important disclosures/certifications are in the “Important Disclosures” section of this report. U.S. investors’ inquiries should be directed to Santander Investment Securities Inc. at (212) 583-4629/ (212) 350-3918.
* Employed by a non-US affiliate of Santander Investment Securities Inc. and is not registered/qualified as a research analyst under FINRA rules.
Latin American Equity Research Sector Report
Mexico City, October 5, 2010 Mexico – Food & Beverages
FEMSA & COCA-COLA FEMSA OCTOBER 2010Consumer vs. Discount Play-Upgrading KOF, Downgrading FEMSA Luis Miranda*, CFA Berenice Muñoz*Mexico: Banco Santander, S.A. Mexico: Banco Santander, S.A.+5255 5269-1926 +5255 [email protected] [email protected]
We are introducing our YE2011 target prices for KOF and FMX. With our new estimates, we are upgrading KOF to Buy from Hold and downgrading FMX to Hold from Buy. We see KOF as a stock that should benefit from a recovery in results in Mexico in 2011 and a solid performance in Brazil, which should allow the company to maintain current valuation levels. We see FMX as a discount to its SOTP story, and we expect a narrowing of this discount to 10% from our current estimate of 25%. However, the narrowing of this discount, does not results in a return above our benchmark.
• KOF represents 72% of our estimated EBITDA for FMX in 2010, and OXXO, FMX’s retail operations, represents 25%. Although both companies should benefit from a healthier economy in Mexico in 2011 and solid consumption in Brazil, we prefer KOF, as we believe the stock will benefit from a re-rating of the sector, and an attractive geographical footprint, with 50% of its volume in Mexico and 19% in Brazil. For FMX, we also expect operating improvements, driven by KOF and the very successful retail operations. However, we believe that the holding company discount will continue to be an important variable in its valuation, which in our view, will limit the full appreciation of the stock.
• After a challenging 2010 for beverages in Mexico due to subdued consumption from consumers and heavy rainfall, we expect that the recovery in GDP in 2011 and more favorable weather should lead to volume recovery in Mexico from the expected 2% in 2010 to 4.4% in 2011. Mexico represents 42% of Coca-Cola FEMSA’s EBITDA and 55% of FEMSA’s (30% through KOF and 25% via OXXO), considering 2010 estimates.
• For Brazil (19% of Coca-Cola FEMSA’s volume in 2010E), we expect that demand will remain strong, driven by economic growth and strengthening of the C-class, which should allow growth not only in volumes, but in the sales mix, as demand for single-serve packaging should increase and the company should be able to continue increasing prices.
• KOF. We are upgrading the stock to Buy from Hold and introducing our YE11 target price of US$100.00 per ADR. We expect that the largest Coca-Cola bottler in the world will deliver EBITDA growth of 14.1% in 2011E and 12.4% in 2012E, in peso terms, which, coupled with an attractive footprint, should allow the company to maintain current valuation levels. We note that 3Q10 results could bring some weakness in volume in Mexico and Latincentro. However, our recommendation is based on a YE11 horizon. Therefore, we would see any weakness as a buying opportunity.
• FEMSA. We are downgrading the stock to Hold from Buy and introducing our YE11 target price of US$61.00/ADR. We expect the discount to its SOTP to narrow to 10%, from current levels of 25%, which would imply a 25% discount on its 20% stake in Heineken. However, this implies only 20% upside from current levels, which is below our 23% benchmark. We see the expected operating improvements in KOF and ongoing successful expansion in OXXO, as the drivers for the narrowing of the discount. We expect OXXO to reach 10,734 stores by 2012, in line with its 12,000 target for 2014.
Universe of Coverage (U.S. Dollars in Millionsa) Price Target Upside/ Net Earnings P/E FV/EBITDA Mkt.Company Ticker Rec. 10/04 Price Down 2009 2010E 2011E 2009 2010E 2011E 2009 2010E 2011E CapCoca-Cola Femsa KOF Buy 78.49 100.00 28% 631 737 861 19.2 19.7 16.8 8.9 9.5 8.2 14,493Femsa FMX Hold 51.28 61.00 20% 734 2,890 1,008 23.3 6.4 18.2 9.9 10.9 9.9 18,349aExcept ADR amounts. Sources: Company reports and Santander estimates.

Consumer vs. Discount Play-Upgrading KOF, Downgrading FEMSA
Important disclosures/certifications are in the “Important Disclosures” section of this report. U.S. investors’ inquiries should be directed to Santander Investment Securities Inc. at (212) 583-4629/ (212) 350-3918
2
TABLE OF CONTENTS FEMSA & Coca Cola FEMSA................................................................................................ 1
Recommendations and Target Prices....................................................................................... 3
Estimate Revision .................................................................................................................... 3
Mexico Challenging 2010, but Brighter 2011 ......................................................................... 5
Comparative Valuation Table ................................................................................................ 13
Coca Cola FEMSA ................................................................................................................ 15
Resuming Growth in 2010 ................................................................................................. 16
DCF Model ..................................................................................................................... 18
FV/EBITDA Multiple..................................................................................................... 19
Relative Valuation .......................................................................................................... 20
FEMSA .................................................................................................................................. 23
Outlook for OXXO ................................................................................................................ 24
Santander – Food & Beverage Research Team Analyst Name Country Email TelephoneLuis Miranda*, CFA Mexico [email protected] (5255) 5269-1926
Gabriel Vaz de Lima Brazil [email protected] (5511) 3012-6672
Carlos Herrera Chile [email protected] (562) 336-3359
Berenice Muñoz* Mexico [email protected] (5255) 5269-1900

Important disclosures/certifications are in the “Important Disclosures” section of this report. U.S. investors’ inquiries should be directed to Santander Investment Securities Inc. at (212) 583-4629/ (212) 350-3918.
3
RECOMMENDATIONS AND TARGET PRICES Figure 1. Summary of Rating and Estimate Revisions, 2010E-2011E (U.S. Dollars in Millionsa) Inv Code Target Price EBITDA 2010E** EBITDA 2011E** From To YE2010 YE2011 From To % From To %FEMSA** Buy Hold 57.00 61.00 3,088 2,208 N.C 3,407 2,383 N.CKOF Hold Buy 62.00 100.00 1,568 1,586 1.2 1,668 1,775 6.4Sources: Santander estimates N.C. * * Not comparable as previous 2010 earnings included Femsa Beer division, which was sold in 1Q10.
ESTIMATE REVISIONS We are adjusting our estimates for FEMSA and Coca-Cola FEMSA to account for several variables. First, the updated economic outlook for the region; we highlight a subdued economic environment in Mexico, but resilient and strong demand in Brazil. We are also factoring in higher-than-expected prices of raw materials, especially sweeteners, and unfavorable weather conditions in Mexico. For FEMSA, we are adjusting our figures to incorporate the 20% stake in Heineken as a passive investment, as a result of the divestiture of Femsa Cerveza at the beginning of the year. For OXXO, we are also incorporating our new estimates of store expansion to 1,100 stores in each of 2010 and 2011. Finally, we are incorporating our updated economic estimates for the region.
Figures 2 and 3 summarize our change in estimates for both companies and our new estimates for year-end 2012.
Figure 2. KOF – Estimate Revisions, 2010E-2012E and new 2012 (U.S. Dollars in Millionsa) 2010E 2011E Introducing 2012E Previous Current Change Previous Current Change New
Revenue 7,753 8,065 4.0% 8,646 8,828 2.1% 9,690Op. Profit 1,260 1,265 0.4% 1,337 1,427 6.7% 1,592Op. Margin 16.3% 15.7% (56 bps) 15.5% 16.2% 70 bps 16.4%EBITDA 1,568 1,586 1.2% 1,668 1,775 6.4% 1,963EBITDA Mrg. M i
20.2% 19.7% (56 bps) 19.3% 20.1% 81 bps 20.3%Net Majority I
711 737 3.7% 797 861 8.0% 1,012EPADR 3.85 3.99 3.7% 4.32 4.66 8.0% 5.48Sources: Company reports and Santander estimates.
Figure 3. FEMSA – Estimate Revisions, 2010E-2012E and new 2012 (U.S. Dollars in Millionsa) 2010E 2011E Introducing 2012E Previous* Current Change Previous* Current Change New
Revenue 16,507 13,270 (19.6%) 17,911 14,673 (18.1%) 16,244Op. Profit 2,252 1,709 (24.1%) 2,535 1,962 (22.6%) 2,249Op. Marg. 13.8% 12.9% (94 bps) 14.2% 13.4% (78 bps) 13.8%EBITDA 3,088 2,208 (28.5%) 3,407 2,383 (30.1%) 2,689EBITDA Mrg. 18.7% 16.6% (187 bps) 19.0% 16.2% (190 bps) 16.6%Net Income 833 2,890 246.6% 1,017 1,008 (1.1%) 1,209EPADR 2.33 8.08 246.6% 2.85 2.82 (1.1%) 3.38Sources: Company reports and Santander estimates. *Previous Estimates included Femsa Beer

Consumer vs. Discount Play-Upgrading KOF, Downgrading FEMSA
Important disclosures/certifications are in the “Important Disclosures” section of this report. U.S. investors’ inquiries should be directed to Santander Investment Securities Inc. at (212) 583-4629/ (212) 350-3918
4
Figure 4. Latam – Select Economic Projections, 2008–2011E 2008 2009 2010E 2011E
MEXICO Real GDP (Δ %) 1.5% -6.5% 4.7% 3.5%Private Consumption (Δ %) 1.9% -6.1% 3.4% 3.5%CPI Inflation (Δ %) 6.5% 3.6% 4.7% 3.9%US$ Exchange Rate (Year-End) 13.83 13.07 12.80 13.20US$ Exchange Rate (Average) 11.15 13.51 12.69 13.02Interest Rate (Year-End) 8.0% 4.5% 4.5% 5.3%Interest Rate (Average) 7.7% 5.4% 4.5% 5.0%GDP Per Capita (US$) 10,361 8,215 9,487 9,835Population (Million) 106.0 106.8 107.7 108.6BRAZIL GDP Growth 5.1% -0.2% 7.8% 4.5%IPCA-IBGE 5.9% 4.3% 5.5% 5.0%IGP-M 9.8% -1.7% 7.5% 4.7%BRL/USD - end of period 2.34 1.74 1.95 2.00BRL/USD - average 1.83 2.00 1.83 1.98ARGENTINA GDP Growth (Δ %) 6.8% 0.9% 7.0% 4.5%Inflation (Δ %) 7.2% 7.7%. 12.0% 13.0%FX rate (year end) US$ 3.45 3.80 4.15 4.70COLOMBIA GDP Growth (Δ %) 2.7% 0.8% 4.6% 5.6%Inflation (Δ %) 7.7% 2.0% 2.8% 3.1%FX rate (year end) US$ 2,244 2,046 1,900 1,900VENEZUELA GDP Growth (Δ %) 4.8% -3.3% -4.0% -2.0%Inflation (Δ %) 31.9% 28.5% 35.0% 32.0%FX rate (year end) US$ 2.15 4.30 4.30 4.30
Source: Santander historicals and forecasts.

Important disclosures/certifications are in the “Important Disclosures” section of this report. U.S. investors’ inquiries should be directed to Santander Investment Securities Inc. at (212) 583-4629/ (212) 350-3918.
5
In order to update our estimates for KOF and Femsa, we look at the consumer environment in Mexico, as it represents 42% of EBITDA for KOF (based on 2010E) and 55% for Femsa (30% from KOF’s Mexico operations and 25% from OXXO’s operations). Femsa has three assets, a 53.7% stake in KOF and a 100% stake in OXXO (retail operations), both of which are consolidated under Mexican GAAP. Additionally, the company has a 20% stake in Heineken, which is a passive investment recognized through the equity method.
In Mexico, we expect that 2010 will be a challenging year, with subdued consumption and unfavorable weather conditions. Therefore, we expect that during 2010, volumes in soft drinks should post only a meager 2% growth, returning to more normalized levels of 4.4% in 2011. On the retail side, this should not affect OXXO’s expansion program, where we expect 1,100 units in 2010 and the same number in 2011, as the company continues implementing its 12,000 stores by 2014 program. As we discuss later, we do not see risk related to saturation of the format in Mexico, which will continue to be the focus of this operations in the medium term.
The rest of Central America and South America is more relevant for KOF, with Brazil being the second most important country in terms of exposure, representing almost 19% of volume according to our estimates for 2010E. Therefore, the expected ongoing strength of this economy should have a direct impact on KOF. We expect that KOF will be able to continue benefiting from an increase in consumer spending in Brazil, which should support higher demand for single serving presentations, while allowing the company to selectively increase prices.
MEXICO, CHALLENGING THROUGH 2010, BUT BRIGHTER IN 2011
CONSUMPTION IN MEXICO RECOVERING
The outlook for domestic consumption in Mexico is for modest growth in 2010, mainly driven by the recovery in the U.S. economy, which in turn, is helping manufacturing activity in Mexico. Manufacturing activity started to recover in 4Q09 and, after underperforming the economy overall, it has outperformed in the last three quarters.
This improvement in manufacturing activity has been the main driver for the recovery in employment, while lower inflation has led to a recovery in payroll, in real terms. Our macroeconomics team expects that total payroll will grow 2.4% in 2010, a meager recovery when we consider the 2.3% decline in 2009. This expansion is expected to be driven by an improvement in unemployment of 1.5% or 150 bps and a marginal decline of 1.2% in private sector wages in real terms during 2010. So far, this seems to be the case, considering that employment in Mexico improved 3.7% YoY in August and payroll grew 3.8% YoY in the same month. For 2011, we estimate that in Mexico, payroll should grow 4%, compared to an estimated growth in GDP of 3.5%. As we can see in Figure 6, employment in manufacturing activity has been recovering at a faster speed than services and construction. In general terms, this would be good news for the northern regions of Mexico, where traditionally, the largest part of the automotive industry is located.

Consumer vs. Discount Play-Upgrading KOF, Downgrading FEMSA
Important disclosures/certifications are in the “Important Disclosures” section of this report. U.S. investors’ inquiries should be directed to Santander Investment Securities Inc. at (212) 583-4629/ (212) 350-3918
6
Figure 6. Mexico – Employment and Payroll 2008-2010
-15.0%
-10.0%
-5.0%
0.0%
5.0%
10.0%
J-08 D-08 M-09 O-09 M-10 A-10
TotalManufacturesServicesConstruction
-7.5%
-5.0%
-2.5%
0.0%
2.5%
5.0%
J-08 D-08 M-09 O-09 M-10 A-10 Source: INEGI, Banxico and Santander estimates.
A TOUGH BASE OF COMPARISON AND HEAVY RAINFALL IN MEXICO
Traditionally Coca-Cola FEMSA’s sales volumes in Mexico have grown at a higher rate than GDP, as shown in Figure 7. During 2009, the company reported a strong performance; despite the 6.5% decline in GDP, its volume grew 6.8% YoY. This growth was achieved with 6% growth in Coca-Cola and 80% growth in noncarbonated beverages. Here, the Jugos del Valle brand has been key in the development of the category. However, during the first half of 2010, volumes in Mexico have not followed the previous trend, as consumers remain cautious and weather conditions have been unfavorable.
Figure 7. Mexico GDP Growth VS Coca-Cola FEMSA Mexico and Consolidated Sales Volume Growth (MUC)
-10%-8%
-6%-4%-2%
0%2%4%6%
8%10%
4Q05
3Q06
2Q07
1Q08
4Q08
3Q09
2Q10
GDP Growth Mexico Division Growth Consolidated Growth
Source: Santander historicals and forecasts.
Based on National Water Commission data, rainfall in Mexico has been unusually high in 2010 (with the highest rainfall since 1942, when public records began). This, coupled with lower average temperatures, has led to unfavorable weather conditions in Mexico for the consumption of soft drinks. Based on National Meteorological System (SMN) data, nationwide rainfall during the first half of 2010 was 47% above, or the equivalent of 169.8 mm, the 1941-2009 average. During August 2010, we saw some sequential decline in rainfall in the northern and central regions of Mexico, but in the southern states, rainfall levels have continued to increase. During the first half of 2010, temperatures have also been a negative, as, on average, it was 1.1°C lower YoY. We must highlight that during 2009, weather conditions (rainfall and temperature), were favorable for the industry, which also make 2010 comparisons very challenging.

Important disclosures/certifications are in the “Important Disclosures” section of this report. U.S. investors’ inquiries should be directed to Santander Investment Securities Inc. at (212) 583-4629/ (212) 350-3918.
7
Figure 8. Mexico – Rainfall National Average and by Region (mm)
National Avg. Rainfall by Region
0
50
100
150
200
250Ja
n
Feb
Mar
Apr
May Ju
n
Jul
Aug
Sep Oct
Nov
Dec
2010 2009
0
50100
150
200
250300
350
400
Jan
Feb
Mar
Apr
May Jun
Jul
Aug
Center North South Source: SMN
For Coca-Cola FEMSA, this translates into a very challenging 2010, in our view, during which, growth associated with its multi-category strategy, a recovery in single-serve presentations and returnables, will be partially offset by negative weather conditions. Figure 9 summarizes rainfall in the states in which Coca-Cola FEMSA has presence, located in the central and south regions of the country.
Figure 9. Rainfall Table of Mexican Coca-Cola FEMSA’s Geographical Presence Rainfall (mm)
Jan-Aug 2009
Jan-Aug 2010 % YoY
1. Michoacán 19.92 112.04 462%2. Chiapas 24.76 237.68 860%3. Oaxaca 24.7 168.59 583%4. Tabasco 27.05 196.89 628%5. Veracruz 23.49 142.29 506%6. Morelos 22.39 106.91 378%7. Mexico City 18.14 71.95 297%8. Edo. 15.12 82.46 445%9. Puebla 18.06 114.6 535%10.Guanajuat 20.2 81.29 302%Nationwide 22.48 86.86 286%North 19.46 88.70 356% South 22.65 66.12 192% Center 25.88 155.26 500% Source: Company data,
WHILE BRAZIL AND COLOMBIA CONTINUE SUPPORTING GROWTH
BRAZIL: SOLID AND SUSTAINABLE FUNDAMENTALS
Despite the difficult environment in Mexico, where recovery in domestic consumption has been dampened by weather conditions, we believe Brazil offers solid drivers for volume growth for Coca-Cola FEMSA. After the acquisition of REMIL in 2008, Coca-Cola FEMSA’s Brazilian operations have been delivering double-digit growth, with an estimated CAGR of 12.6% in the 2008-2010E period, reaching 18% of estimated volume for 2009. As of 2Q10, volume growth in Brazil was 13%, versus a very modest 4% in Mexico. We expect that in 2010 and 2011, volumes in
4
2
3
6
7 8
10
1
4 4
4 2 3
4

Consumer vs. Discount Play-Upgrading KOF, Downgrading FEMSA
Important disclosures/certifications are in the “Important Disclosures” section of this report. U.S. investors’ inquiries should be directed to Santander Investment Securities Inc. at (212) 583-4629/ (212) 350-3918
8
Brazil will continue growing at 10.9% and 10.8%, respectively, versus the expected 2.0% and 4.4% in 2010 and 2011 in Mexico.
Figure 10. Coca-Cola FEMSA Brazil and Mexico Volume Sales Growth (MUC YoY Change)
3%8%
4% 5% 3% 2% 4% 3%7%
10% 8%
0%4%
8% 7%4%
44%36%
25%
6%
14% 13%
5%4%4%
11%
14%
8%
-9%
5%3%
4Q05
1Q06
2Q06
3Q06
4Q06
1Q07
2Q07
3Q07
4Q07
1Q08
2Q08
3Q08
4Q08
1Q09
2Q09
3Q09
4Q09
1Q10
2Q10
Mexico Brazil
Source: Coca-Cola FEMSA and Santander estimates (Distortion of Panamco acquisition and Jugos del Valle).
We expect that this compelling growth in volume in Brazil should continue to be supported by population growth and expansion in the C-class and higher disposable income. Our economics team expects that in 2010-2011E, unemployment will improve to 6.8-7.0% from 8.1% in 2009. This should result in payrolls continuing to increase by 5.5% and 2.2% in 2010 and 2011, respectively, in real terms.
According FGV IMBRE, in 2002, the A,B and C classes in Brazil represented 57% of the total population, or 100.5 million people. In 2008, they reached 127.6 million, or 67.5% of the population, which would represent a 4.06% CAGR versus the 1.17% CAGR for the total population in the same period. According to industry estimates, this trend is expected to continue, with the total population reaching almost 200 million by 2014, with 36 million people incorporated from lower-income groups into the A,B and C classes. This would imply that almost 83% of Brazil’s total population would be in the A,B and C classes, and that the DE classes would have declined from 33% to 17% in the same period. We expect that Coca-Cola FEMSA will continue to benefit from this economic environment, through several initiatives: the ongoing growth in single-serve presentations, which should allow it to strengthen the brand in the A,B, and C segments, the continued growth in the returnable presentation and the introduction of new flavors and presentations, especially in the non-cola categories.

Important disclosures/certifications are in the “Important Disclosures” section of this report. U.S. investors’ inquiries should be directed to Santander Investment Securities Inc. at (212) 583-4629/ (212) 350-3918.
9
Figure 11. Brazil – Population Growth and Economic Classes Composition
2002 2008 2014E
57%
189 200
43%
67%
33%
83%
17%
176
ABC DE
Source: FVG IMBRE.
COLOMBIA: ATTRACTIVE GROWTH POTENTIAL
With the acquisition of Brisa in August 2009, Colombia has become a significant region for Coca-Cola FEMSA’s portfolio, representing 10% of its sales volumes as in 2Q10. We believe the Colombian market represents a very attractive opportunity for the company, as it offers the potential to implement the best practices that have been successfully implemented in Mexico and Brazil, in an underpenetrated market. As we can see in Figure 12, the per capital consumption of soft drinks in Colombia is only 21% of consumption in Coca-Cola FEMSA’s territories in Mexico and 26% of that of Brazil. Although it would be too optimistic to expect a strong increase in the short term, we expect a modest increase in consumption, as the company increases its portfolio of products, with a strong emphasis in non-carbonated soft drinks, as local consumers have a strong preference for this category. In the short term, the growth in volume should also be supported by economic growth of 4.6% in 2010 and 5.6% in 2011, according to our economics team.
Figure 12. LatAm – Soft-drinks Per Capita Consumption (liters per year)
436359
214174 146
92
Mexico Argentina Brazil Venezuela CA Colombia Source: Company reports.
OUTLOOK FOR RETAIL OPERATIONS: OXXO… 12,000 BY 2014
For Femsa’s retail operations, OXXO, which is expected to represent 37% of Femsa’s estimated sales in 2010E and 25% of its EBITDA, inaugurated its 8,000 store in September 2010. With this store, we believe the company’s expansion plan is on track to reach management guidance of more than 1,000 units and our estimate of 1,100 units for 2010, when the company would reach a

Consumer vs. Discount Play-Upgrading KOF, Downgrading FEMSA
Important disclosures/certifications are in the “Important Disclosures” section of this report. U.S. investors’ inquiries should be directed to Santander Investment Securities Inc. at (212) 583-4629/ (212) 350-3918
10
total of 8,434 units. The company’s objective is to reach 12,000 stores by 2014. Although this number might look aggressive, we believe it is fairly reachable, considering that from 1995 to 2009, the company grew at a CAGR of 17.5% in units, and the expected CAGR from 2009 to 2014 to reach the objective would be 10.3%.
Figure 13. OXXO – Number of Stores (Year End in Units)
767 842 892 1,000 1,197 1,451 1,779 2,2162,798
3,4664,141
4,8475,563
6,3747,334
8,4349,534
10,73411,434
12,000
1995
1996
1997
1998
1999
2000
2001
2002
2003
2004
2005
2006
2007
2008
2009
2010
E
2011
E
2012
E
2013
E
2014
E
Source: Company reports.
Plenty of room for growth for this convenience store format in Mexico. There is no official information on the breakdown by channel of Mexico’s retail industry, there are unofficial estimates that the traditional “mom & pop” channel represents close to 45%-50% of retail sales. However, this number could be close to 80% in some categories. OXXO currently has close to an 80% market share in the convenience store format in Mexico, and should continue increasing this share, as they are expected to continue growing at faster pace than its peers. In fact, the company is one of the largest convenience store retail chains in the Americas, surpassed only by 7-Eleven stores.
Figure 14. Americas – Largest Convenience Store Chains (Number of Stores*)
7,920
5,904
4,686 4,6393,984
2,7831,898 1,776
4,144
7,334
7 Eleven Oxxo CoucheTard
BP Shell Oil Exxon Chevron Speedw ay CITGO Sunoco
Source: Company Reports. * As of December 2009, OXXO had 7,334, but on September 2010, the company inaugurated its 8,000th store.

Important disclosures/certifications are in the “Important Disclosures” section of this report. U.S. investors’ inquiries should be directed to Santander Investment Securities Inc. at (212) 583-4629/ (212) 350-3918.
11
WHILE THERE SHOULD BE RELIEF IN COSTS FOR SOFT DRINKS
At the end of 2009 and in the first half of 2010, consumer goods companies were negatively affected by higher costs for raw materials, mainly sweeteners and packaging, as well as higher marketing expenses related to the soccer World Cup in South Africa. Going forward, we expect some relief in both of these items.
SWEETENERS AND PACKAGING
Sweeteners have been a tough challenge for beverage companies worldwide and especially in Mexico because the price of sugar on the spot market started to increase in 2Q09, reaching historically high levels in January 2010 at US$0.333 a pound, which was 113% higher than in January 2009. Since then, prices have declined 24% YTD as of August, but 1H10 levels remain flat with 2H09 levels, which, in turn, were 42% higher than the 1H09. On top of this, sugar in Mexico is traditionally sold at a premium to international markets. During the last five years, the spread to international spot prices has been 18%, but at certain points, it has reached as high as a 50% premium.
Figure 15. Fructose Vs. World Sugar, Mexico & Brazil
(US$ cents per pound)
-0.16
9.84
19.84
29.84
39.84
49.84
59.84
J-09
F-09
M-0
9
A-0
9
M-0
9
J-09
J-09
A-0
9
S-0
9
O-0
9
N-0
9
D-0
9
J-10
F-10
M-1
0
A-1
0
M-1
0
J-10
J-10
A-1
0
Global Sugar Prices Fructose Mexico Bulk Sugar Brazil White Sugar Spot Source: USDA
Given that sweeteners represent approximately 20-25% of COGS for Coca-Cola FEMSA, this spike in prices is a key concern. Management has made changes in the mix of sweeteners, increasing the percentage of fructose, (which is cheaper) and, as shown in Figure 15, has even declined in the last year. Therefore, the company has increased the use of fructose in Mexico from 30% in 2009 to 50%, currently. For the second half of 2010 and 2011, the International Sugar Organization expects a modest decline in prices, as they expect a modest surplus in production. However, we believe that the relief in costs will continue to be driven by the sugar/HFCS mix, rather than by a correction in sugar prices. In recent quarters, Coca-Cola FEMSA has not been able fully pass through higher prices of sweeteners to customers in Mexico. However, we believe that due to the current mix and expected price increases, the outlook for relatively stable prices should allow the company to improve margins in 2011.

Consumer vs. Discount Play-Upgrading KOF, Downgrading FEMSA
Important disclosures/certifications are in the “Important Disclosures” section of this report. U.S. investors’ inquiries should be directed to Santander Investment Securities Inc. at (212) 583-4629/ (212) 350-3918
12
PET & ALUMINUM
Packaging accounts for 18%-23% of Coca-Cola FEMSA’s COGS and usually linked to international US$ spot prices. In the first half of 2010, prices of PET and aluminum recorded YoY increases (up 49.8% YoY for aluminum). However, we are seeing some reduction in the price of aluminum and stable prices for PET. We believe that the recent trend is sustainable, and should bring some relief on the cost side for the company, as the mix improves and selective price increases are implemented.
Figure 16. PET Bottle Grade Prices (c/lb) and US$C/lb. for Aluminum (YoY % Change)
7.7%
1.0%
1.2%2.3%
-16.5%
6.2%
65
70
75
80
85
90
2005 2006 2007 2008 2009 2010 2011-20.0%
-15.0%
-10.0%
-5.0%
0.0%
5.0%
10.0%
Prices c/lb (Pet Bottle Grade) (% YOY)
0
20
40
60
80
100
120
J-09
F-09
M-0
9M
-09
J-09
J-09
S-09
O-0
9D
-09
J-10
F-10
A-10
M-1
0J-
10A-
10J-
00
-100%-80%-60%-40%-20%0%20%40%60%80%
Alum US$C/lb YoY % Source: Bloomberg
A NOTE ON SECTOR RE-RATING During the last two years, we have seen a re-rating of the beverage sector, with valuation improving consistently after the financial crisis in 2008. As we can see in Figure 17, the forward FV/EBITDA multiple has appreciated from 6.1 times in 4Q2008 to current levels of 10.7 times, while the forward P/E has increased from 6.2 times to 15.1 times in the same period. We believe that in the medium term, valuation levels could remain high, especially in companies with exposure to high-growth emerging markets, which would be the case with KOF, with its exposure to Brazil, in addition to the expected recovery in volumes in Mexico in 2011.
Figure 17. Global Beverage Sector – Forward FV/EBITDA
4.0
5.0
6.0
7.0
8.0
9.0
10.0
11.0
07 08 09 10
Source: Bloomberg

Important disclosures/certifications are in the “Important Disclosures” section of this report. U.S. investors’ inquiries should be directed to Santander Investment Securities Inc. at (212) 583-4629/ (212) 350-3918. 13
COMPARATIVE VALUATION TABLE Figure 20. Coca-Cola Femsa – Valuation Summary, U.S. Dollars in Millions (Year-End 2011E) as of October 4, 2010 Price 4/10 TP Mkt Cap FV/EBITDA P/E Price ROIC
Ticker Rating (US$) (US$) (US$M) 09 10E 11E 09 10E 11E Book 10E Brazil AmBev (ADR) ABV US Hold 125.89 125.00 77,939 12.6 12.8 11.9 20.8 19.8 18.2 6.2 26.2% Bovespa 41,682 10.2 7.2 6.4 18.2 13.4 11.4 Chile Andina B (ADR) AKO/B US Buy 28.63 31.40 3,628 7.2 9.9 9.5 13.1 17.2 16.7 4.5 21.2% CCU (ADR) CCU US Hold 55.92 63.45 3,562 9.1 11.1 11.1 9.8 16.4 16.8 3.3 20.8% Concha y Toro (ADR) VCO US Buy 47.93 48.20 1,790 14.8 15.6 13.7 17.9 25.5 21.8 2.9 10.1% San Pedro (1000 shares) SANPED CI Hold 9.05 8.82 362 7.4 12.6 8.4 14.1 46.7 23.6 0.9 3.2% Chilean Beverage 9,342 9.6 12.3 10.7 13.7 26.4 19.7 2.9 16.9% IPSA 9.84 10.8 9.7 8.2 19.5 16.2 13.3 Mexico Arca ARCA* MM Buy 4.10 3.48 3,298 7.6 7.9 6.9 14.8 14.4 12.3 2.4 15.3% Coca-Cola Femsa (ADR) KOF US Buy 78.49 100.00 14,493 8.9 9.5 8.2 19.2 19.7 16.8 2.5 13.3% Femsa (ADR) FMX US Hold 51.28 61.00 18,349 9.9 10.9 9.9 23.3 6.4 18.2 2.2 10.4% Modelo GMODELOC MM Hold 5.64 6.40 18,250 11.8 11.3 10.3 28.2 23.0 20.9 3.0 16.1% Mexican Beverage 54,391 9.6 9.9 8.8 21.4 15.8 17.1 2.5 12.9% IPC 2,700 9.1 8.6 7.7 18.7 16.5 14.4 Latin American Beer Sector 118,100 10.9 11.5 10.8 20.5 16.4 18.5 3.7 18.6% Latin American Soft Drink 21,419 7.9 9.1 8.2 15.7 17.1 15.3 3.1 14.5% Latin American Beverage Sector (excluding wine) 139,519 9.6 10.5 9.7 18.5 16.7 17.1 3.4 17.8% International Beer Asahi Breweries 2502 JP 20.07 9,335 8.2 7.1 6.9 16.9 14.6 13.5 1.4 Carlsberg-B CARLB DC 103.50 15,788 7.8 9.0 8.3 16.7 15.8 13.7 1.4 Foster's Group (ADR) FBRWY US 5.81 11,220 14.1 12.2 10.3 28.7 18.5 15.4 4.9 Heineken (ADR) HINKY US 25.44 29,307 10.7 8.8 7.8 16.4 16.0 13.5 2.3 Anheuser-Busch InBev ABI BB 57.49 91,516 10.5 10.5 9.7 17.9 18.5 15.4 2.6 Kirin (ADR) KNBWY US 14.13 13,469 9.6 7.2 6.9 29.1 24.6 15.4 1.0 Molson Coors TAP US 47.60 8,849 15.9 9.7 8.9 11.5 13.8 12.9 1.2 SABMiller (ADR) SBMRY US 31.40 51,959 16.5 14.8 12.7 24.7 27.2 18.8 2.5 Thai Beverage THBEV SP 0.22 5,444 8.1 8.6 7.9 14.2 15.5 13.6 3.1 Tsingtao Brewery 168 HK 5.89 7,998 20.6 17.7 15.3 39.8 33.5 28.3 6.0 International Beer 244,886 12.2 10.6 9.5 21.6 19.8 16.0 2.6 International Soft-Drink Coca-Cola Amatil (ADR) CCLAY US 23.12 8,721 11.0 10.5 9.6 21.9 18.6 16.8 6.1 Coca-Cola Enterprises CCE US 22.01 11,062 5.8 7.2 8.5 9.8 12.2 11.8 8.9 Dr Pepper Snapple DPS US 34.64 8,273 7.3 8.2 7.7 13.0 14.5 12.5 2.9 Coca-Cola Hellenic EEEK GA 26.42 9,667 8.3 8.6 8.0 15.1 15.8 14.2 2.7 Hansen Natural Group HANS US 45.67 4,027 8.9 9.7 8.8 16.6 19.3 16.8 5.9 Cott Corp. BCB CN 7.77 632 5.5 4.4 3.4 7.5 10.4 8.5 1.5 International Soft-Drink 42,383 7.8 8.1 7.7 14.0 15.1 13.4 4.7 Global Beer Sector 362,986 11.8 10.8 9.9 21.3 18.8 16.7 2.9 Global Soft-Drink Sector 63,803 7.8 8.5 7.8 14.5 15.8 14.1 4.2 Global Beverage Sector 426,789 10.3 10.2 9.1 18.5 18.9 16.1 1.3
Sources: Santander and Bloomberg

Consumer vs. Discount Play-Upgrading KOF, Downgrading FEMSA
Important disclosures/certifications are in the “Important Disclosures” section of this report. U.S. investors’ inquiries should be directed to Santander Investment Securities Inc. at (212) 583-4629/ (212) 350-3918
14
NOTES
15Important disclosures/certifications are in the “Important Disclosures” section of this report. U.S. investors’ inquiries should be directed to Santander Investment Securities Inc. at (212) 583-4629/ (212) 350-3918.
COCA COLA FEMSA BUYFocusing on Volume Recovery in 2011 – Upgrading to Buy Luis Miranda*, CFA Berenice Muñoz*+5255 5269-1926 +5255 [email protected] [email protected]
(10/04/2010) CURRENT PRICE: M$98.78/US$78.49 TARGET PRICE: M$128.00/US$100.00 What’s Changed Rating Changed to Buy Price Target (US$) Introducing YE11 100.00 EBITDA Estimates ’10 to 1,586 from 1,568 (US$ Mn) ’11 to 1,775 from 1,668 ’12: 1,963
Company Statistics Bloomberg KOF / KOF US 52-Week Range (US$) 42.03 - 76.25 2010E P/E Rel to the IPC Index 1.2 2010E P/E Rel to Beverage Sector 1.1 IPC (US$) 2,717 3-Yr EPADR CAGR (09-12E) 17.0% Market Capitalization (US$ Mn) 14,493 Float (%) 14.7 3-Mth Avg Daily Vol (US$000) 6.5 Shares Outst - Mn (ADR 10:1) 1,847 Net Debt/Equity (x) 0.10x Book Value per ADR (US$) 28.13
Estimates and Valuation Ratios 2009 2010E 2011E 2012E Net Earn (Mn) 8,522 9,409 11,207 13,377 Current EPS 4.61 5.10 6.07 7.24 Net Earn (US$ Mn) 631 737 861 1,012 Current EPADR/EPS 3.42 3.99 4.66 5.48 P/E (x) 19.2 19.7 16.8 14.3 P/Sales (x) 1.6 1.8 1.6 1.5 P/CE (x) 12.2 12.7 11.1 9.7 FV/EBITDA (x) 8.9 9.5 8.2 7.0 FV/Sales (x) 1.7 1.9 1.7 1.4 FCF Yield (%) 5.0 4.5 6.2 7.2 Div per ADR (US$) 0.54 0.90 0.98 1.15 Div Yield (%) 0.7 1.1 1.2 1.5
Sources: Bloomberg, Company Reports, and Santander estimates.
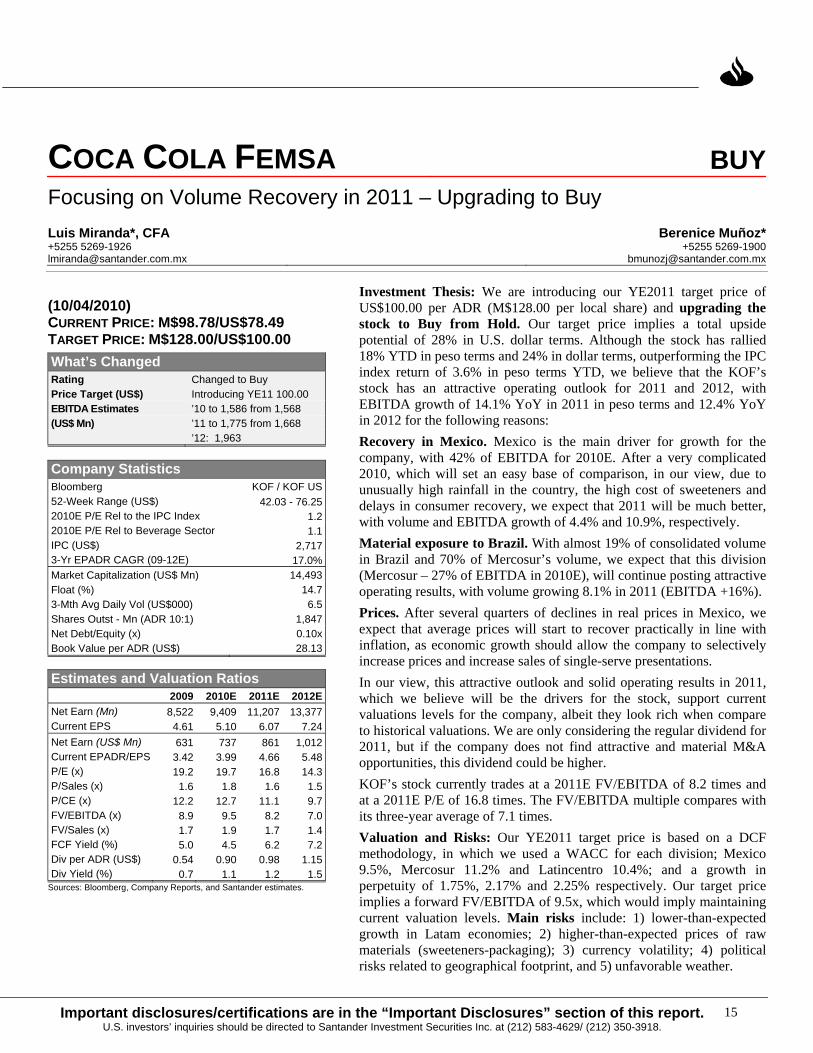
Investment Thesis: We are introducing our YE2011 target price of US$100.00 per ADR (M$128.00 per local share) and upgrading the stock to Buy from Hold. Our target price implies a total upside potential of 28% in U.S. dollar terms. Although the stock has rallied 18% YTD in peso terms and 24% in dollar terms, outperforming the IPC index return of 3.6% in peso terms YTD, we believe that the KOF’s stock has an attractive operating outlook for 2011 and 2012, with EBITDA growth of 14.1% YoY in 2011 in peso terms and 12.4% YoY in 2012 for the following reasons: Recovery in Mexico. Mexico is the main driver for growth for the company, with 42% of EBITDA for 2010E. After a very complicated 2010, which will set an easy base of comparison, in our view, due to unusually high rainfall in the country, the high cost of sweeteners and delays in consumer recovery, we expect that 2011 will be much better, with volume and EBITDA growth of 4.4% and 10.9%, respectively. Material exposure to Brazil. With almost 19% of consolidated volume in Brazil and 70% of Mercosur’s volume, we expect that this division (Mercosur – 27% of EBITDA in 2010E), will continue posting attractive operating results, with volume growing 8.1% in 2011 (EBITDA +16%). Prices. After several quarters of declines in real prices in Mexico, we expect that average prices will start to recover practically in line with inflation, as economic growth should allow the company to selectively increase prices and increase sales of single-serve presentations. In our view, this attractive outlook and solid operating results in 2011, which we believe will be the drivers for the stock, support current valuations levels for the company, albeit they look rich when compare to historical valuations. We are only considering the regular dividend for 2011, but if the company does not find attractive and material M&A opportunities, this dividend could be higher. KOF’s stock currently trades at a 2011E FV/EBITDA of 8.2 times and at a 2011E P/E of 16.8 times. The FV/EBITDA multiple compares with its three-year average of 7.1 times. Valuation and Risks: Our YE2011 target price is based on a DCF methodology, in which we used a WACC for each division; Mexico 9.5%, Mercosur 11.2% and Latincentro 10.4%; and a growth in perpetuity of 1.75%, 2.17% and 2.25% respectively. Our target price implies a forward FV/EBITDA of 9.5x, which would imply maintaining current valuation levels. Main risks include: 1) lower-than-expected growth in Latam economies; 2) higher-than-expected prices of raw materials (sweeteners-packaging); 3) currency volatility; 4) political risks related to geographical footprint, and 5) unfavorable weather.

Consumer vs. Discount Play-Upgrading KOF, Downgrading FEMSA
Important disclosures/certifications are in the “Important Disclosures” section of this report. U.S. investors’ inquiries should be directed to Santander Investment Securities Inc. at (212) 583-4629/ (212) 350-3918
16
Coca-Cola FEMSA is the largest publicly traded bottler outside of the U.S. for the Coca-Cola Company, accounting for almost 10% of the Coca-Cola Company’s global sales volume. It produces, distributes, and markets proprietary Coke brands, including non-carbonated beverages, along with bottled water, and other beverages. It operates across the Latin American region through three divisions 2010E in terms of sales volume (MUC): 50% of Mexico, the rest of LATAM through Latincentro 24% (Guatemala, Nicaragua, Costa Rica, Panama, Colombia, Venezuela) and Mercosur 26% (Argentina and 19% of Brazil).
RESUMING GROWTH IN 2011
Figure 21 summarizes our operating estimates for Coca-Cola FEMSA by division and by category. We expect that in the medium term, the Mercosur division will continue to be the main driver for the company, fueled by the solid economic and demographic drivers in Brazil, which we estimate, will represent 19% of Coca-Cola FEMSA’s consolidated volume in 2010. For 2011 and 2012, we estimate a pick-up in volume growth, as Mexico resumes normalized growth rates after the weak expected performance in 2010, due to the aforementioned weather conditions during the year.
Figure 21. Coca-Cola FEMSA – Volume Assumptions (Millions of Unit Cases), 2009-2012E 2009 2010E 2011E 2012E 09/10E 10E/11E 11E/12E
Mexico Soft Drink 901 925 964 1,001 2.6% 4.3% 3.8% Mexico Water 264 260 270 280 -1.5% 4.1% 3.5% Mexico Other * 63 68 72 76 8.3% 6.4% 5.0%Mexico – Total 1,227 1,252 1,307 1,357 2.0% 4.4% 3.8% Latincentro Soft Drink 498 500 522 547 0.3% 4.4% 4.8% Latincentro Water 61 79 85 90 31.0% 7.7% 5.2% Latincentro Other 34 35 39 42 1.5% 11.6% 7.3%Latincentro – Total 593 614 646 679 3.5% 5.2% 5.0% Mercosur Soft Drink 559.7 598.7 646.1 690.6 7.0% 7.9% 6.9% Mercosur Water 25.0 26.8 28.9 30.6 7.3% 7.8% 5.8% Mercosur Other 23.5 30.5 34.0 38.5 29.8% 11.6% 13.3%Mercosur – Total 608 656 709 760 7.9% 8.1% 7.1% Consolidated Soft Drink 1,959 2,023 2,132 2,239 3.3% 5.4% 5.0% Consolidated Water 349 366 385 400 4.8% 5.2% 4.0% Consolidated Other 121 133 145 156 10.5% 8.9% 7.6%Consolidated Volume 2,429 2,522 2,662 2,795 3.9% 5.5% 5.0%
Sources: Company reports and Santander estimates. * Others includes non-carbonated – non-alcoholic beverages.
Mexico (38% of 2010E revenues and 42% EBITDA) Mexico will continue to be Coca-Cola FEMSA’s stable contributor as a mature market in soft drinks, but with higher growth rates in the NCNA (non-alcoholic-noncarbonated) category, as the multi-category strategy continues supporting the juices, isotonics and tea-based soft drinks. However, these sub-categories represent slightly more than 5% of volumes in Mexico, therefore not enough to boost volume materially.
Regarding prices in Mexico, we expect that the lower-than- expected inflation in 2010, selective prices increases and some recovery in single-serve presentations, would lead to a slight recovery in real prices after several quarters, with a decline in average real prices in Mexico. Going forward, we would expect that in a healthier economic environment and a normalize weather in Mexico, should allow the company to continue selectively increasing prices, in an estimated range of 80%-90% of the expected inflations.

Important disclosures/certifications are in the “Important Disclosures” section of this report. U.S. investors’ inquiries should be directed to Santander Investment Securities Inc. at (212) 583-4629/ (212) 350-3918.
17
Figure 22. Coca-Cola Femsa – Real Prices in Mexico (M$/UC)
2Q-10 $31.322Q-09
$30.80
4Q07$33.40
3Q-08$31.52
$28.00
$29.00
$30.00
$31.00
$32.00
$33.00
$34.00
1Q-0
7
3Q-0
7
1Q-0
8
3Q-0
8
1Q-0
9
3Q-0
9
1Q-1
0
Source: Company reports and Santander estimates.
Mercosur (27% total revenues and 27% of EBITDA). In 2011, we are estimating consolidated volume growth of 8.1% (11.6% in NCNA). We expect this growth to be driven by a healthier growth in Brazil (72% of Mercosur volume as of 2Q10), supported by: A) an ongoing investment in coolers, B) continued investment and development of the single-serve presentations at attractive price points and C) further rollout of the 2-liter PET/returnable presentation. The latter presentation has been very successful, and has allowed the company to implement price increases in this presentation. In terms of prices, we expect that in the medium term, the company will be able to maintain prices above inflation, as single-serve presentations gain market share, and the success of the 2-liter PET/returnable continues. The attractive growth in Brazil, should more than offset the lackluster and volatile performance in Argentina.
Figure 23. Coca-Cola Femsa – Real Prices in Brazil (R$/UC)
4Q-09 $46.55
2Q-10$44.35
1Q-09 $42.35
4Q-07$43.07
$18.00
$23.00
$28.00
$33.00
$38.00
$43.00
$48.00
1Q-0
7
3Q-0
7
1Q-0
8
3Q-0
8
1Q-0
9
3Q-0
9
1Q-1
0
Source: Company reports and Santander estimates.
Latincentro (32% of revenues and 30% of EBITDA). Venezuela represents 35% of the division’s sales volume as of 2Q10 and 22% of its revenues (due to the depreciation of the Bolivar). Inflation has been close to 35% (2010E) and we expect that the company will continue increasing prices in line with inflation: However, we expect volume to be flat, slightly better than the expected GDP contaction of 2% for 2011. At the EBITDA level, Venezuela represents close to 12% of KOF’s consolidated EBITDA. While the risk related to potential nationalization of the assets is present, we believe that the significance of the brand in the operation and supply of raw

Consumer vs. Discount Play-Upgrading KOF, Downgrading FEMSA
Important disclosures/certifications are in the “Important Disclosures” section of this report. U.S. investors’ inquiries should be directed to Santander Investment Securities Inc. at (212) 583-4629/ (212) 350-3918
18
materials, mainly concentrate, would make a state-run operation tougher to implement. Therefore, we see this as a very modest risk for the company. For Colombia, 41% of volume in Latincentro, the story is much brighter, as the company, with an estimated growth of 9% in 2010 as Brisa’s operations continues to benefit from the turnaround and a stronger portfolio.
VALUATION We are setting our year-end 2011 target price for KOF at US$100.000 per ADR or M$128.00 for local shares (KOF) based on our sum-of-the-parts analysis with a DCF model for the three divisions. Our target price implies that the stock would be trading at a trailing FV/EBITDA multiple of 10.5 times and a forward multiple of 9.5 times. This forward multiple would imply a 7% appreciation from current levels. In terms of 2011E P/E, the stock currently trades at 16.8 times, and our target price implies a forward P/E of 14.3 times.
DCF MODEL We are introducing our year-end 2011 target price based on our DCF model. Figure 24 summarizes our WACC calculation for each division:
Figure 24. Coca-Cola Femsa – WACC Calculation (Year-End 2011E) Mexico Latincentro MercosurRisk-Free Rate 3.0% 3.0% 3.5%Country Risk 1.5% 4.2% 2.9% Leveraged Beta 1.15 0.86 0.86 Equity Risk Premium 5.5% 5.5% 5.5%Cost of Equity 10.8% 11.9% 11.2%Equity/Total Capital 81% 100% 100%Tax Rate 30% 31% 34%After Tax Cost of Debt 4.0% 8.5% 3.1%WACC 9.5% 10.4% 11.2%Perpetuity Growth Rate 1.75% 2.25% 2.17%
Sources: Company reports and Santander estimates.
Figure 25. Mexico – Sum of the Parts – DCF (Year-End 2021E) 11E 12E 13E 14E 15E 16E 17E 18E 19E 20E 21EEBIT 584 635 658 706 755 806 861 919 903 943 1,004EBITDA 730 786 824 884 947 1,011 1,079 1,152 1,132 1,182 1,258EBITDA Margin 22.6% 23.1% 22.8% 23.0% 23.3% 23.5% 23.7% 23.9% 24.1% 24.3% 24.5%Operating Taxes 175 190 197 212 227 242 258 276 271 283 301Chg Working Capital -27 -8 32 -5 6 13 4 8 5 7 9Capex 149 164 153 163 247 262 195 206 303 223 236FCF (to Firm) 378 424 506 505 479 519 630 678 564 683 730Perpetuity 9,569 Sum of PV 3,449 Terminal Value 3,857 Firm Value 7,306 Source: Santander estimates
Important disclosures/certifications are in the “Important Disclosures” section of this report. U.S. investors’ inquiries should be directed to Santander Investment Securities Inc. at (212) 583-4629/ (212) 350-3918.
19
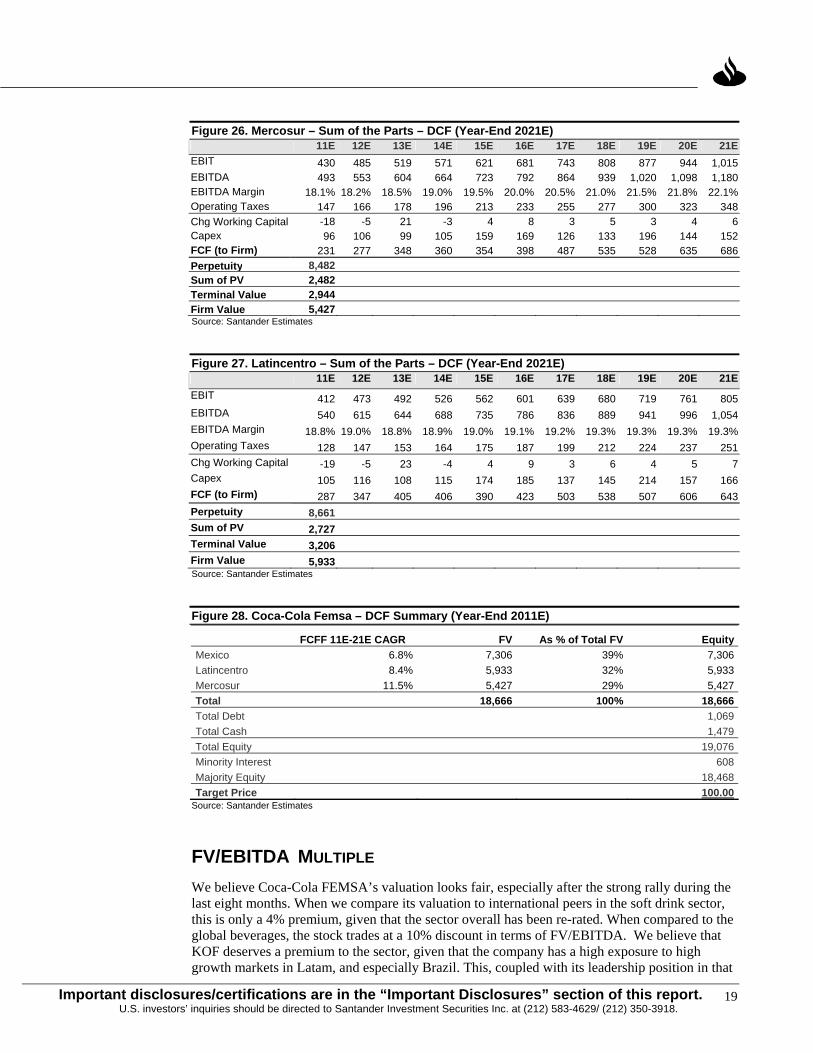
Figure 26. Mercosur – Sum of the Parts – DCF (Year-End 2021E) 11E 12E 13E 14E 15E 16E 17E 18E 19E 20E 21EEBIT 430 485 519 571 621 681 743 808 877 944 1,015EBITDA 493 553 604 664 723 792 864 939 1,020 1,098 1,180EBITDA Margin 18.1% 18.2% 18.5% 19.0% 19.5% 20.0% 20.5% 21.0% 21.5% 21.8% 22.1%Operating Taxes 147 166 178 196 213 233 255 277 300 323 348Chg Working Capital -18 -5 21 -3 4 8 3 5 3 4 6Capex 96 106 99 105 159 169 126 133 196 144 152FCF (to Firm) 231 277 348 360 354 398 487 535 528 635 686Perpetuity 8,482 Sum of PV 2,482 Terminal Value 2,944 Firm Value 5,427 Source: Santander Estimates
Figure 27. Latincentro – Sum of the Parts – DCF (Year-End 2021E) 11E 12E 13E 14E 15E 16E 17E 18E 19E 20E 21EEBIT 412 473 492 526 562 601 639 680 719 761 805EBITDA 540 615 644 688 735 786 836 889 941 996 1,054EBITDA Margin 18.8% 19.0% 18.8% 18.9% 19.0% 19.1% 19.2% 19.3% 19.3% 19.3% 19.3%Operating Taxes 128 147 153 164 175 187 199 212 224 237 251Chg Working Capital -19 -5 23 -4 4 9 3 6 4 5 7Capex 105 116 108 115 174 185 137 145 214 157 166FCF (to Firm) 287 347 405 406 390 423 503 538 507 606 643Perpetuity 8,661 Sum of PV 2,727 Terminal Value 3,206 Firm Value 5,933 Source: Santander Estimates
Figure 28. Coca-Cola Femsa – DCF Summary (Year-End 2011E)
FCFF 11E-21E CAGR FV As % of Total FV EquityMexico 6.8% 7,306 39% 7,306 Latincentro 8.4% 5,933 32% 5,933 Mercosur 11.5% 5,427 29% 5,427 Total 18,666 100% 18,666 Total Debt 1,069Total Cash 1,479Total Equity 19,076Minority Interest 608Majority Equity 18,468Target Price 100.00
Source: Santander Estimates
FV/EBITDA MULTIPLE We believe Coca-Cola FEMSA’s valuation looks fair, especially after the strong rally during the last eight months. When we compare its valuation to international peers in the soft drink sector, this is only a 4% premium, given that the sector overall has been re-rated. When compared to the global beverages, the stock trades at a 10% discount in terms of FV/EBITDA. We believe that KOF deserves a premium to the sector, given that the company has a high exposure to high growth markets in Latam, and especially Brazil. This, coupled with its leadership position in that

Consumer vs. Discount Play-Upgrading KOF, Downgrading FEMSA
Important disclosures/certifications are in the “Important Disclosures” section of this report. U.S. investors’ inquiries should be directed to Santander Investment Securities Inc. at (212) 583-4629/ (212) 350-3918
20
market, lead us to expect continued above-average returns and valuation for the company. Our target price implies that the stock would be trading at 9.5 times forward FV/EBITDA by year-end 2011, which we see as a reachable level, considering that it is basically in line with its third standard deviation and it also implies that the stock would be maintaining its current valuation levels, considering forward FV/EBITDA.
Figure 29. KOF– Valuation Summary, Million Pesos (Year-End 2011E)
8.9
8.0
7.1
6.3
5.4
4.0
5.0
6.0
7.0
8.0
9.0
06 07 08 09 10
Sources: Company reports and Santander estimates.
RELATIVE VALUATION On our 2011 estimates, the company trades at a 4% premium to international soft drink peers considering FV/EBITDA multiples and a 0.2% discount to its Latam peers. Versus our universe of Latam beverage companies, the stock trades at an 16% discount. In terms of 2011 P/E, the stock trades at a 10% premium to Latam soft drink companies, and at a 2% discount to our Latam beverage sample.
RISKS • Slower-than-expected economic growth in Latam.
• Higher-than-expected prices of raw material, mainly sweeteners and packaging.
• Currency volatility.
• Political risk associated with the company’s geographical footprint.
• Unfavorable weather conditions.

Important disclosures/certifications are in the “Important Disclosures” section of this report. U.S. investors’ inquiries should be directed to Santander Investment Securities Inc. at (212) 583-4629/ (212) 350-3918.
21
FINANCIAL STATEMENTS Figure 30. Coca-Cola Femsa – Income Statement, Balance Sheet, and CF Statement, 2009-2012E (U.S. Dollars in Millions) Income Statement 2009 % 2010E % 2011E % 2012E %Sales 7,609 100.0% 8,065 100.0% 8,828 100.0% 9,690 100.0%Cost of Sales 4,069 53.5% 4,358 54.0% 4,741 53.7% 5,170 53.4%Gross Profit 3,540 46.5% 3,707 46.0% 4,087 46.3% 4,519 46.6%Oper. and Adm. Expenses 2,368 31.1% 2,441 30.3% 2,660 30.1% 2,927 30.2%Operating Profit 1,172 15.4% 1,265 15.7% 1,427 16.2% 1,592 16.4%Depreciation 208 2.7% 223 2.8% 244 2.8% 258 2.7%EBITDA 1,462 19.2% 1,586 19.7% 1,775 20.1% 1,963 20.3% Net Interest Expense 119 1.6% 40 0.5% 32 0.4% -21 -0.2% Monetary Gain/Loss -45 -0.6% -11 -0.1% -12 -0.1% -9 -0.1% FX Gain/Loss 27 0.4% 21 0.3% 9 0.1% 0 0.0%Other Financial Operations -107 -1.4% -114 -1.4% -111 -1.3% -110 -1.1%Profit before Taxes 963 12.7% 1,102 13.7% 1,286 14.6% 1,512 15.6%Tax Provision 299 3.9% 325 4.0% 379 4.3% 446 4.6%Net Profit 631 8.3% 737 9.1% 861 9.8% 1,012 10.4%Balance Sheet 2009 % 2010E % 2011E % 2012E %Assets 8,469 100.0% 9,088 100.0% 9,690 100.0% 10,714 100.0% Short-Term Assets 1,809 21.4% 2,060 22.7% 2,816 29.1% 3,774 35.2% Cash and Equivalents 745 8.8% 929 10.2% 1,479 15.3% 2,212 20.6% Accounts Receivable 454 5.4% 463 5.1% 596 6.2% 717 6.7% Inventories 383 4.5% 413 4.5% 469 4.8% 546 5.1% Other Short-Term Assets 227 2.7% 255 2.8% 272 2.8% 299 2.8% Fixed Assets 2,391 28.2% 2,670 29.4% 2,649 27.3% 2,722 25.4% Other Long Term Assets 374 4.4% 381 4.2% 370 3.8% 369 3.4% Intangibles & Goodwill 3,895 46.0% 3,976 43.8% 3,856 39.8% 3,849 35.9%Liabilities 3,229 38.1% 3,100 34.1% 3,201 33.0% 3,384 31.6% Short-T. Liabilities 1,795 21.2% 1,680 18.5% 1,822 18.8% 2,028 18.9% Suppliers 717 8.5% 726 8.0% 805 8.3% 919 8.6% Short-Term Loans 420 5.0% 267 2.9% 267 2.8% 267 2.5% Other ST Liabilities 658 7.8% 687 7.6% 750 7.7% 842 7.9% Long-Term Loans 803 9.5% 802 8.8% 802 8.3% 802 7.5% Other Liabilities 631 7.4% 619 6.8% 577 6.0% 554 5.2%Majority Net Worth 5,065 59.8% 5,803 63.9% 6,311 65.1% 7,152 66.8%Net Worth 5,241 61.9% 5,987 65.9% 6,490 67.0% 7,331 68.4%Minority Interest 176 2.1% 179 2.0% 174 1.8% 174 1.6%Net Debt 478 5.6% 139 1.5% -410 -4.2% -1,144 -10.7%Cash Flow 2009 % 2010E % 2011E % 2012E %Net Majority Earnings 664 777 907 1,066Non-Cash Items 153 144 163 172Changes in Working Capital 255 -32 -54 -15Capital Increases/Dividends 100 167 181 212Change in Debt -354 -150 0 0Capital Expenditures -458 -500 -353 -388Net Cash Flow 141 169 586 736Beginning Treasury 553 721 932 1,499Ending Treasury 721 932 1,499 2,213Sources: Company reports and Santander estimates.

Consumer vs. Discount Play-Upgrading KOF, Downgrading FEMSA
Important disclosures/certifications are in the “Important Disclosures” section of this report. U.S. investors’ inquiries should be directed to Santander Investment Securities Inc. at (212) 583-4629/ (212) 350-3918
22
Figure 31. Coca-Cola Femsa – Income Statement, Balance Sheet, and CF Statement, 2009-2012E (Millions of pesos) Income Statement 2009 % 2010E % 2011E % 2012E %Sales 102,767 100.0% 102,904 100.0% 114,931 100.0% 128,110 100.0%Cost of Sales 54,952 53.5% 55,606 54.0% 61,722 53.7% 68,359 53.4%Gross Profit 47,815 46.5% 47,297 46.0% 53,209 46.3% 59,751 46.6%Oper. and Adm. Expenses 31,981 31.1% 31,151 30.3% 34,629 30.1% 38,700 30.2%Operating Profit 15,834 15.4% 16,146 15.7% 18,580 16.2% 21,050 16.4%Depreciation 2,810 2.7% 2,850 2.8% 3,177 2.8% 3,412 2.7%EBITDA 19,745 19.2% 20,241 19.7% 23,104 20.1% 25,959 20.3% Net Interest Expense 1,609 1.6% 512 0.5% 423 0.4% -271 -0.2% Monetary Gain/Loss -606 -0.6% -138 -0.1% -154 -0.1% -119 -0.1% FX Gain/Loss 370 0.4% 266 0.3% 119 0.1% 7 0.0%Other Financial Operations -1,448 -1.4% -1,448 -1.4% -1,448 -1.3% -1,448 -1.1%Profit before Taxes 13,012 12.7% 14,058 13.7% 16,745 14.6% 19,986 15.6%Tax Provision 4,043 3.9% 4,146 4.0% 4,938 4.3% 5,894 4.6%Net Profit 8,522 8.3% 9,409 9.1% 11,207 9.8% 13,377 10.4%Balance Sheet 2009 % 2010E % 2011E % 2012E %Assets 110,661 100.0% 116,326 100.0% 127,914 100.0% 141,676 100.0% Short-Term Assets 23,639 21.4% 26,366 22.7% 37,166 29.1% 49,897 35.2% Cash and Equivalents 9,740 8.8% 11,895 10.2% 19,517 15.3% 29,254 20.6% Accounts Receivable 5,931 5.4% 5,920 5.1% 7,872 6.2% 9,477 6.7% Inventories 5,002 4.5% 5,288 4.5% 6,188 4.8% 7,219 5.1% Other Short-Term Assets 2,966 2.7% 3,263 2.8% 3,589 2.8% 3,948 2.8% Fixed Assets 31,242 28.2% 34,180 29.4% 34,968 27.3% 35,999 25.4% Other Long Term Assets 4,882 4.4% 4,882 4.2% 4,882 3.8% 4,882 3.4% Intangible & Goodwill 50,898 46.0% 50,898 43.8% 50,898 39.8% 50,898 35.9%Liabilities 42,189 38.1% 39,686 34.1% 42,247 33.0% 44,744 31.6% Short-T. Liabilities 23,448 21.2% 21,508 18.5% 24,055 18.8% 26,821 18.9% Suppliers 9,368 8.5% 9,290 8.0% 10,630 8.3% 12,149 8.6% Short-Term Loans 5,488 5.0% 3,420 2.9% 3,527 2.8% 3,533 2.5% Other ST Liabilities 8,592 7.8% 8,798 7.6% 9,897 7.7% 11,140 7.9% Long-Term Loans 10,498 9.5% 10,260 8.8% 10,581 8.3% 10,599 7.5% Other Liabilities 8,243 7.4% 7,918 6.8% 7,612 6.0% 7,324 5.2%Majority Net Worth 66,176 59.8% 74,282 63.9% 83,308 65.1% 94,574 66.8%Net Worth 68,472 61.9% 76,640 65.9% 85,666 67.0% 96,932 68.4%Minority Interest 2,296 2.1% 2,296 2.0% 2,296 1.8% 2,296 1.6%Net Debt 6,246 5.6% 1,786 1.5% -5,409 -4.2% -15,122 -10.7%Cash Flow 2009 % 2010E % 2011E % 2012E %Net Majority Earnings 8,969 9,912 11,806 14,092Non-Cash Items 2,072 1,839 2,123 2,274Changes in Working Capital 3,451 -411 -704 -199Capital Increases/Dividends -1,344 -2,130 -2,352 -2,802Change in Debt -4,782 -1,920 0 0Capital Expenditures -6,182 -6,380 -4,597 -5,124Net Cash Flow 1.911 2,155 7,622 9,737Beginning Treasury 6,192 9,740 11,895 19,517Ending Treasury 9,740 11,895 19,517 29,254Sources: Company reports and Santander estimates.

23Important disclosures/certifications are in the “Important Disclosures” section of this report. U.S. investors’ inquiries should be directed to Santander Investment Securities Inc. at (212) 583-4629/ (212) 350-3918.
FEMSA HOLDStrong Portfolio with Modest Discount to its SOTP Luis Miranda*, CFA Berenice Muñoz*+5255 5269-1926 +5255 [email protected] [email protected]
(10/04/2010) CURRENT PRICE: M$64.60/US$51.28 TARGET PRICE: M$80.50/US$61.00 What’s Changed Rating Unchanged at Hold Price Target (US$) Introducing YE11 US$61.00 EBITDA Estimates (US$ Mn) ’10 to 2,208 from 3,088 ’11 to 2,383 from 3,407 ’12 2,689
Company Statistics Bloomberg FMX US 52-Week Range (US$) 36.40-52.46 2010E P/E Rel to the IPC Index (x) 0.4 2010E P/E Rel to Beverage (x) 0.3 Mexbol Index (US$) 2,717 3-Yr EPADR CAGR (09-12E) 24.1% Market Capitalization (US$ Mn) 18,349 Float (%) 61 3-Mth Avg Daily Vol (US$000) 35.7 Shares Outst - Mn (ADR 50:1) 17,891 Net Debt/Equity (x) NM Book Value per Share (US$) 22.98
Estimates and Valuation Ratios 2009 2010E* 2011E 2012E Net Earn (Mn) 9,908 36,870 13,125 15,981 Current EPS 0.55 2.06 0.73 0.89 Net Earn (US$ Mn) 734 2,890 1,008 1,209 Current EPADR 2.05 8.08 2.82 3.38 P/E (x) 23.3 6.4 18.2 15.3 P/Sales (x) 1.17 1.39 1.26 1.13 P/CE (x) 9.6 4.8 9.3 8.0 FV/EBITDA (x) 9.9 10.9 9.9 10.1 FV/Sales (x) 1.8 1.8 1.6 1.5 FCF Yield (%) 6.9 5.3 6.7 8.5 Div per ADR (US$) 0.47 0.60 0.86 1.07 Div Yield (%) 1.0 1.2 1.7 2.1
Sources: Bloomberg, Company Reports, and Santander estimates. * Includes the effect of Heineken transaction
Investment Thesis: In this report, we are introducing our year-end 2011 target price of US$61.00 per ADR (M$80.50 per local share) and downgrading the stock to Hold from Buy. This replaces our YE2010 target price of US$57.00/M$75.24. Our target price implies a total return of 20% in U.S. dollar terms, including a 1.7% dividend yield, which compares to our benchmark of 23%. We see FEMSA as a holding company with a very strong business portfolio of consumer-oriented companies. We believe that the company’s current discount to its SOTP of 25% (considering 2011 estimates), will narrow in the medium term, driven by improvements in operating results on its soft-drinks (Coca-Cola Femsa) and retail (OXXO) operations. We believe that the former will continue to benefit from a ongoing healthy economic growth in Brazil and both of a recovery in consumer demand in 2011, after a very challenging 2010, which we believe will be characterized by a dormant consumer demand and unfavorable weather conditions in Mexico. However, we also expect that the discount to its SOTP will continue to exist, due to the company’s holding structure and passive investment in Heineken. In our view, this discount should narrow to 10%, which would imply a discount of almost 20% on the Heineken 20% stake.
We believe that a long-term catalyst for the stock is the potential spin-off of its retail operations, OXXO. Although in our view, the company has the size to be a stand-alone operation, we understand that management is not considering this option in the short-term, which in our view also limits the short-term upside potential of the stock. Valuation: Our year-end 2011 target price is based on a SOTP model, which implies that the stock would be trading at a 10% discount to its SOTP or a discount of almost 25% on its stake in Heineken.
Main Risk Include: A) risk associated with the company’s portfolio diversification and footprint, such as currency volatility and political risk; B) capacity to continue identifying successful location sites for OXXO’s expansion program; C) volatility in raw materials, especially sweeteners and packaging materials in the soft-drinks division, D) lower-than-expected economic growth in the countries where the company has exposure, mainly Mexico, Brazil and Colombia, and E) stronger competition in the beer and soft-drinks markets.

Consumer vs. Discount Play-Upgrading KOF, Downgrading FEMSA
Important disclosures/certifications are in the “Important Disclosures” section of this report. U.S. investors’ inquiries should be directed to Santander Investment Securities Inc. at (212) 583-4629/ (212) 350-3918
24
FEMSA is Latin America´s leading consumer company with presence in nine countries. It controls an integrated beverage platform that comprises Coca-Cola FEMSA, the largest Coca Cola bottler in the region, in which, the company holds a 53.7% stake, OXXO, the largest and fastest growing operated store chain in the Americas with over 8,000 stores as of September 2010, and the second-largest shareholder in Heineken Group with a 20% economic interest.
OUTLOOK FOR OXXO As previously mentioned, OXXO will continue its expansion mode with the objective of reaching 12,000 units by 2014. We believe this growth is not only reachable, but self-sustainable and we expect that by the end of 2012, the company will reach 10,734 units, which would imply a growth of 1,100 units in 2010 and the same number in 2011 and 1,200 in 2012.
Figure 32. FEMSA – OXXO Operating Estimates (Units and Mexican Pesos in Millions) 2009 2010E 2011E 2012E 10E/09 11E/10E 12E/11EUnits (EOP) 7,334 8,434 9,534 10,734 15% 13% 13%New Stores 960 1,100 1,100 1,200 15% 0% 9%Sales 53,549 61,850 71,520 82,091 16% 16% 15%Operating Profit 4,457 5,383 6,505 8,048 21% 21% 24%EBITDA 5,787 6,875 8,077 9,704 19% 17% 20%EBITDA Margin 10.8% 11.1% 11.3% 11.8% 31 bps 18 bps 53 bpsSource: Company reports and Santander estimates.
In terms of EBITDA margin, during 2009 the company reached 10.8% of sales, an impressive 188 margin expansion YoY. Going forward, we expect that this growth will continue, driven by a higher percentage of mature stores in the mix, economies of scales, higher average ticket as a result of credit card acceptance at the store and higher support of value-added products such as their ready-to-eat merchandise “Andatti,” prepared meals and potential introduction of new categories at the store. However, this expansion should be more modest in the next year, as each year expansion will be structurally tougher to reach. We expect a modest expansion of 31 bps in 2010 and 18 bps in 2011.
We note that OXXO, considering 2010 EBITDA of US$539 million, should be the third or fourth largest retail chain in Mexico, behind Wal-Mex, Soriana and almost tied with Comerci. Also, in terms of EBITDA margin, in our sample of self-service and department stores, the average EBITDA margin is 10.2% in 2010E, which compares to the estimated margin of 11.1% for OXXO.
HEINEKEN STAKE The following figure summarizes Femsa’s operating structure, with its 20% stake in Heineken, through a 14.94% in Heineken Holding NV (HEIO) and a 12.53% in Heineken NV (HEIA). Although FEMSA will receive 29.2 million shares of HEIO in a period of not more than five years, we are considering the full exposure in our SOTP model, as Femsa will be receiving the monetary benefits (dividends) from the full amount, even if they do not have them right now. Also, if Heineken fails to deliver the shares, they face a penalty, which, in our view, will ensure the delivery of the shares.

Important disclosures/certifications are in the “Important Disclosures” section of this report. U.S. investors’ inquiries should be directed to Santander Investment Securities Inc. at (212) 583-4629/ (212) 350-3918.
25
Figure 33. FEMSA– Simplified Business Structure
Source: Company Reports and Santander
VALUATION We are setting our year-end 2011 target price for FEMSA, based on a sum-of-the-parts model (SOTP). We are using this approach for two main reasons, first the holding company nature of the company and second, due to the passive investment in Heineken limits the use of a direct FV/EBITDA relative valuation approach. Our model has the following assumptions:
- For Heineken, we are using our estimated target price for Heineken NV, set by our European Beverage Analyst, Nikolaas Faes. For further details, please see Nikolaas’ report: Beverages: Raising Spirits with Beer, published on July 16, 2010
- For KOF we are using our target price of US$100.00 per ADR, and FMX stake on the company of 53.7%. For additional information our outlook and target price on KOF, please see the specific section on this report.
- For OXXO, we are using a 12.0 FV/EBITDA multiple and the 2011 estimates. This multiple is in line with our average for the sector in Latam, and implies a 13% premium to the average of the sector in Mexico. However, we believe it’s a fair assumption, given that OXXO retail operation delivers and EBITDA margin that should be above average, when consider other retail operations in Mexico. We estimate an EBITDA margin of 11.1% for OXXO in 2010, while we estimate that the average for the publicly listed supermarket and department stores operations in Mexico is 10.3% (simple average).
- We are also factoring in our target price a 10% discount to its SOTP. In our view, this is reasonable discount, which implies that at our target price, the 20% stake at Heineken would be trading at a discount of almost 25% to its estimated fair value.
With these assumptions, we obtain a fair price for FEMSA share of US$61.00 per ADR for year-end 2011 and M$80.50 for the local shares.

Consumer vs. Discount Play-Upgrading KOF, Downgrading FEMSA
Important disclosures/certifications are in the “Important Disclosures” section of this report. U.S. investors’ inquiries should be directed to Santander Investment Securities Inc. at (212) 583-4629/ (212) 350-3918
26
Figure 34. FEMSA– Sum-of-the-Parts Model (Million of Dollars, except per share data) Company Multiple Firm Value Equity Stake (%) Stake (Amt)Beer- Heineken Stake 1.0 - 6,241 100.0 6,241 Coca-Cola FEMSA 18,685 18,468 53.7 9,917 OXXO 12.0 7,445 7,537 100.0 7,537 Others 3.0 301 301 100.0 301 Total 23,996FMX Holding Co. Net Debt (398)FMX Equity 24,394Premium / (Discount) to Market C
-24%Holding Company Discount 10%FMX Equity exHolding Disc. 21,845ADR's Outstanding 357.8Target Price 61.00Premium / (Discount) to -16%Upside 18.4%Dividend 1.7%Total Return 20.0%
Source: Santander estimates.
RISKS • Risk associated to the company’s portfolio diversification and footprint, such as currency
volatility and political risk.
• Capacity to continue identifying successful location sites for OXXO’s expansion program
• Volatility in raw materials, especially sweeteners and packaging materials in the soft-drinks division.
• Lower than expected economic growth in the countries where the company has exposure, mainly Mexico, Brazil and Colombia.
• Stronger competition in the beer and soft-drinks markets.
• Weaker-than-expected results in Heineken, which could translate into lower-than-expected operating results, dividends, and downside risk for our Heineken NV target price.

Important disclosures/certifications are in the “Important Disclosures” section of this report. U.S. investors’ inquiries should be directed to Santander Investment Securities Inc. at (212) 583-4629/ (212) 350-3918.
27
FINANCIAL STATEMENTS Figure 35. FEMSA – Income Statement, Balance Sheet, and CF Statement, 2009-2012E (U.S. Dollars in Millions) Income Statement 2009* % 2010E % 2011E % 2012E %Sales 14,588 100% 13,270 100.0% 14,673 100.0% 16,244 100.0%Cost of Sales 7,862 53.90% 7,803 58.8% 8,650 59.0% 9,503 58.5%Gross Profit 6,725 46.10% 5,466 41.2% 6,023 41.0% 6,741 41.5%Oper. and Adm. Expenses 4,726 32.39% 3,757 28.3% 4,061 27.7% 4,492 27.7%Operating Profit 2,000 13.71% 1,709 12.9% 1,962 13.4% 2,249 13.8%Depreciation 673 4.61% 498 3.8% 421 2.9% 440 2.7%EBITDA 2,673 18.32% 2,208 16.6% 2,383 16.2% 2,689 16.6% Net Interest Expense 343 2.35% 182 1.4% 97 0.7% 72 0.4% Monetary Gain/Loss 36 0.25% (29) -0.2% 0 0.0% (3) 0.0% FX Gain/Loss -29 -0.20% 29 0.2% 1 0.0% (0) 0.0%Other Financial Operations -260 -1.78% (177) -1.3% (182) -1.2% (189) -1.2%Profit before Taxes 1,406 9.64% 1,351 10.2% 1,683 11.5% 1,991 12.3%Tax Provision 289 1.98% 386 2.9% 481 3.3% 569 3.5%Minority Interest 383 2.63% 452 3.4% 553 3.8% 659 4.1%Net Profit 734 5.03% 2,890 21.8% 1,008 6.9% 1,209 7.4%Balance Sheet 2009* % 2010E % 2011E % 2012E %Assets 16,156 100% 15,870 100% 16,562 100% 17,950 100.0% Short-Term Assets 3,779 23.4% 2,992 18.9% 3,779 22.8% 4,977 27.7% Cash and Equivalents 1,188 7.4% 1,584 10.0% 2,258 13.6% 3,163 17.6% Accounts Receivable 898 5.6% 616 3.9% 674 4.1% 890 5.0% Inventories 1,137 7.0% 620 3.9% 680 4.1% 758 4.2% Other Short-Term Assets 556 3.4% 172 1.1% 167 1.0% 166 0.9% Long-Term Assets 5,946 36.8% 4,046 25.5% 4,032 24.3% 4,079 22.7% Fixed Assets 4,978 30.8% 3,343 21.1% 3,316 20.0% 3,329 18.5%Other Assets 1,453 9.0% 703 4.4% 716 4.3% 750 4.2%Liabilities 7,291 45.1% 4,911 30.9% 4,695 28.4% 4,631 25.8%Short-T. Liabilities 3,503 21.7% 2,334 14.7% 2,297 13.9% 2,403 13.4% Suppliers 1,511 9.3% 1,087 6.9% 991 6.0% 1,023 5.7% Short-Term Loans 678 4.2% 176 1.1% 166 1.0% 141 0.8% Other ST Liabilities 1,315 8.1% 1,071 6.7% 1,140 6.9% 1,239 6.9%Long-Term Loans 2,664 16.5% 1,639 10.3% 1,431 8.6% 1,207 6.7%Other Liabilities 1,124 7.0% 939 5.9% 968 5.8% 1,021 5.7%Majority Net Worth 6,248 38.7% 10,958 69.0% 11,866 71.6% 13,319 74.2%Minority Interest 2,617 16.2% 2,496 15.7% 2,844 17.2% 3,344 18.6%Net Debt 2,154 13.3% 231 1.5% -661 -4.0% -1,814 -10.1%Cash Flow 2009* % 2010E % 2011E % 2012E %Net Majority Earnings 1,117 3,342 1,561 1,867Non-Cash Items 1,803 498 421 440Changes in Working Capital -530 7 -118 -160Capital Increases/Dividends -167 -215 -307 -384Change in Debt -402 -119 -178 0Capital Expenditures -1172 -890 -686 -618Net Cash Flow 545 570 733 909Beginning Treasury 625 1,016 1,536 2,254Ending Treasury 1,188 1,584 2,258 3,163Sources: Company reports and Santander estimates. 2009 includes Femsa Beer.

Consumer vs. Discount Play-Upgrading KOF, Downgrading FEMSA
Important disclosures/certifications are in the “Important Disclosures” section of this report. U.S. investors’ inquiries should be directed to Santander Investment Securities Inc. at (212) 583-4629/ (212) 350-3918
28
Figure 36. FEMSA– Income Statement, Balance Sheet, and CF Statement, 2009-2012E (Millions of Local Currency) Income Statement 2009* % 2010E % 2011E % 2012E %Sales 197,033 100.00% 169,320 100.0% 191,018 100.0% 214,768 100.0%Cost of Sales 106,195 53.9% 99,571 58.8% 112,610 59.0% 125,649 58.5%Gross Profit 90,838 46.1% 69,750 41.2% 78,408 41.0% 89,120 41.5%Oper. and Adm. Expenses 63,826 32.4% 47,938 28.3% 52,869 27.7% 59,386 27.7%Operating Profit 27,012 13.7% 21,811 12.9% 25,539 13.4% 29,733 13.8%Depreciation 9,089 4.6% 6,352 3.8% 5,486 2.9% 5,820 2.7%EBITDA 36,101 18.3% 28,173 16.6% 31,020 16.2% 35,553 16.6% Net Interest Expenses 4,632 2.4% 2,320 1.4% 1,266 0.7% 952 0.4% Monetary Gain/Loss 487 0.2% -366 -0.2% 5 0.0% -43 0.0% FX Gain/Loss - 396 -0.2% 372 0.2% 18 0.0% -6 0.0%Other Financial Operations - 3,506 -1.8% -2,262 -1.3% -2,376 -1.2% -2,494 -1.2%Profit before Taxes 18,990 9.6% 17,235 10.2% 21,910 11.5% 26,324 12.3%Tax Provision 3,908 2.0% 4,931 2.9% 6,264 3.3% 7,527 3.5%Minority Interest 5,174 2.6% 5,773 3.4% 7,198 3.8% 8,707 4.1%Net Profit 9,908 5.0% 36,870 21.8% 13,125 6.9% 15,981 7.4%Balance Sheet 2009* % 2010E % 2011E % 2012E %Assets 211,091 100.0% 203,135 100.0% 218,613 100.0% 237,354 100.0% Short-Term Assets 49,380 23.4% 38,295 18.9% 49,881 22.8% 65,804 27.7% Cash and Equivalents 15,523 7.4% 20,271 10.0% 29,807 13.6% 41,819 17.6% Accounts Receivable 11,732 5.6% 7,886 3.9% 8,897 4.1% 11,768 5.0% Inventories 14,858 7.0% 7,938 3.9% 8,977 4.1% 10,017 4.2% Other Short-Term Assets 7,267 3.4% 2,200 1.1% 2,200 1.0% 2,200 0.9% Long-Term Assets 77,687 36.8% 51,790 25.5% 53,221 24.3% 53,940 22.7% Fixed Assets 65,038 30.8% 42,790 21.1% 43,771 20.0% 44,018 18.5% Other Assets 18,986 9.0% 9,000 4.4% 9,450 4.3% 9,923 4.2%Liabilities 95,262 45.1% 62,862 30.9% 61,979 28.4% 61,233 25.8% Short-T. Liabilities 45,767 21.7% 29,871 14.7% 30,316 13.9% 31,781 13.4% Suppliers 19,737 9.3% 13,917 6.9% 13,083 6.0% 13,533 5.7% Short-Term Loans 8,853 4.2% 1,513 0.7% 1,679 0.8% 1,418 0.6% Other ST Liabilities 17,177 8.1% 13,793 6.8% 15,133 6.9% 16,474 6.9% Long-Term Loans 34,810 16.5% 20,978 10.3% 18,890 8.6% 15,958 6.7% Other Liabilities 14,685 7.0% 9,200 4.5% 9,200 4.2% 9,200 3.9%Majority Net Worth 81,637 38.7% 140,263 69.0% 156,625 71.6% 176,112 74.2%Minority Interest 34,192 16.2% 31,944 15.7% 37,545 17.2% 44,220 18.6%Net Debt 28,140 13.3% 2,220 1.1% -9,239 -4.2% -24,443 -10.3%Cash Flow 2009* % 2010E % 2011E % 2012E %Net Majority Earnings 15,082 42,643 20,323 24,688Non-Cash Items 24,349 6,352 5,486 5,820Changes in Working Capital -7,152 96 -1,543 -2,120Capital Increases/Dividends -2,255 -2,742 -3,990 -5,081Change in Debt -5,423 -1,522 -2,321 -3,258Capital Expenditures -15,834 -11,352 -8,928 -8,165Net Cash Flow 7,362 7,271 9,536 12,012 Beginning Treasury 8,161 13,000 20,271 29,807 Ending Treasury 15,523 20,271 29,807 41,819 Sources: Company reports and Santander estimates** 2009 includes Femsa Beer. (Information is not comparable)

Important disclosures/certifications are in the “Important Disclosures” section of this report. U.S. investors’ inquiries should be directed to Santander Investment Securities Inc. at (212) 583-4629/ (212) 350-3918.
29
IMPORTANT DISCLOSURES Coca-Cola FEMSA – 12-Month Relative Performance (U.S. Dollars)
Coca-Cola Femsa
IPC
8090
100110120130140150160170180
O-09 D-09 J-10 M-10 M-10 J-10 S-10
Sources: Bloomberg and Santander.
Coca-Cola FEMSA – Three-Year Stock Performance (U.S. Dollars)
17.0
27.0
37.0
47.0
57.0
67.0
77.0
J-07 S-07 D-07 M-08 J-08 S-08 D-08 M-09 J-09 S-09 D-09 M-10 J-10500
1,000
1,500
2,000
2,500
3,000
3,500
Coca Cola Femsa (L Axis) IPC (R Axis)
UP $65.006/9/08
H $42.0012/1/08
H $50.0010/11/07
H $53.008/19/09
H $62.0012/8/09
Source: Santander.
Analyst Recommendations and Price Objectives B: Buy H: Hold UP: Underperform UR: Under Review

Consumer vs. Discount Play-Upgrading KOF, Downgrading FEMSA
Important disclosures/certifications are in the “Important Disclosures” section of this report. U.S. investors’ inquiries should be directed to Santander Investment Securities Inc. at (212) 583-4629/ (212) 350-3918
30
IMPORTANT DISCLOSURES (CONTINUED) FEMSA – 12-Month Relative Performance (U.S. Dollars)
FEMSA
IPC
80
90
100
110
120
130
140
O-09 D-09 J-10 M-10 M-10 J-10 S-10
Sources: Bloomberg and Santander.
FEMSA – Three-Year Stock Performance (U.S. Dollars)
0.0
10.0
20.0
30.0
40.0
50.0
60.0
J-07 S-07 D-07 M-08 J-08 S-08 D-08 M-09 J-09 S-09 D-09 M-10 J-10500
1,000
1,500
2,000
2,500
3,000
3,500
FEMSA (L Axis) IPC (R Axis)
H $46.0010/11/07
B $42.0012/1/08
B $50.008/19/09
B $57.0012/8/09
Source: Santander.

2010
IMPORTANT DISCLOSURES Key to Investment Codes Rating
Definition
% of Companies
Covered with This Rating
% of Companies Provided Investment Banking
Services in the Past 12 Months
Buy Expected to outperform the local market benchmark by more than 10%. 63.21% 59.09%Hold Expected to perform within a range of 0% to 10% above the local market
benchmark. 30.57% 40.91%
Underperform/Sell Expected to underperform the local market benchmark. 6.22% --Under review -- --The numbers above reflect our Latin American universe as of Thursday, September 16, 2010. For a discussion, if applicable, of the valuation methods used to determine the price targets included in this report and the risks to achieving these targets, please refer to the latest published research on these stocks. Research is available through your sales representative and other electronic systems. Target prices are 2010 year-end unless otherwise specified. Recommendations are based on a total return basis (expected share price appreciation + prospective dividend yield) unless otherwise specified. Stock price charts and rating histories for companies discussed in this report are also available by written request to Santander Investment Securities Inc., 45 East 53rd Street, 17th Floor (Attn: Research Disclosures), New York, NY 10022 USA. Ratings are established when the firm sets a target price and/or when maintaining or reiterating the rating. Ratings may not coincide with the above methodology due to price volatility. Management reserves the right to maintain or to modify ratings on any specific stock and will disclose this in the report when it occurs. Valuation methodologies vary from stock to stock, analyst to analyst, and country to country. Any investment in Latin American equities is, by its nature, risky. A full discussion of valuation methodology and risks related to achieving the target price of the subject security is included in the body of this report. The benchmark used for local market performance is the country risk of each country plus the 1-year U.S. Treasury yield plus 5.5% of equity risk premium, unless otherwise specified. The benchmark plus the 10.0% differential used to determine the rating is time adjusted to make it comparable with the total return of the stock over the same period. For additional information about our rating methodology, please call (212) 350 3974. This research report (“report”) has been prepared by Santander Investment Securities Inc. ("SIS"; SIS is a subsidiary of Santander Investment I, S.A. which is wholly owned by Banco Santander, S.A. ["Santander"]) on behalf of itself and its affiliates (collectively, Grupo Santander) and is provided for information purposes only. This report must not be considered as an offer to sell or a solicitation of an offer to buy any relevant securities (i.e., securities mentioned herein or of the same issuer and/or options, warrants, or rights with respect to or interests in any such securities). Any decision by the recipient to buy or to sell should be based on publicly available information on the related security and, where appropriate, should take into account the content of the related prospectus filed with and available from the entity governing the related market and the company issuing the security. This report is issued in Spain by Santander Investment Bolsa, Sociedad de Valores, S.A. (“Santander Investment Bolsa”) and in the United Kingdom by Banco Santander, S.A., London Branch. Santander London is authorized by the Bank of Spain. This report is not being issued to private customers. SIS, Santander London and Santander Investment Bolsa are members of Grupo Santander. The following analysts hereby certify that their views about the companies and their securities discussed in this report are accurately expressed, that their recommendations reflect solely and exclusively their personal opinions, and that such opinions were prepared in an independent and autonomous manner, including as regards the institution to which they are linked, and that they have not received and will not receive direct or indirect compensation in exchange for expressing specific recommendations or views in this report, since their compensation and the compensation system applying to Grupo Santander and any of its affiliates is not pegged to the pricing of any of the securities issued by the companies evaluated in the report, or to the income arising from the businesses and financial transactions carried out by Grupo Santander and any of its affiliates: Luis Miranda*, Berenice Munoz*. *Employed by a non-US affiliate of Santander Investment Securities Inc. and not registered/qualified as a research analyst under FINRA rules, and is not an associated person of the member firm, and, therefore, may not be subject to the FINRA Rule 2711 and Incorporated NYSE Rule 472 restrictions on communications with a subject company, public appearances, and trading securities held by a research analyst account. Grupo Santander receives non-investment banking revenue from the subject companies. Within the past 12 months, Grupo Santander has received compensation for investment banking services from Coca-Cola FEMSA The information contained within this report has been compiled from sources believed to be reliable. Although all reasonable care has been taken to ensure the information contained within these reports is not untrue or misleading, we make no representation that such information is accurate or complete and it should not be relied upon as such. All opinions and estimates included within this report constitute our judgment as of the date of the report and are subject to change without notice. From time to time, Grupo Santander and/or any of its officers or directors may have a long or short position in, or otherwise be directly or indirectly interested in, the securities, options, rights or warrants of companies mentioned herein. Any U.S. recipient of this report (other than a registered broker-dealer or a bank acting in a broker-dealer capacity) that would like to effect any transaction in any security discussed herein should contact and place orders in the United States with SIS, which, without in any way limiting the foregoing, accepts responsibility (solely for purposes of and within the meaning of Rule 15a-6 under the U.S. Securities Exchange Act of 1934) for this report and its dissemination in the United States. © 2010 by Santander Investment Securities Inc. All Rights Reserved.