lattice constant dependence on particle size for ceria
TRANSCRIPT
Journal of Physics Conference Series
OPEN ACCESS
Lattice Constant Dependence on Particle Size forCeria prepared from a Citrate Sol-GelTo cite this article V N Morris et al 2006 J Phys Conf Ser 26 119
View the article online for updates and enhancements
You may also likeColloidal Cerium Oxide NanoparticlesPreparation and Corrosion InhibitionPerformance on AA5005 Aluminum AlloyL G Ecco S Rossi F Deflorian et al
-
Insight into the structural characterizationof pure and Zr-doped hydrothermallysynthesized cerium oxide nanoparticlesMuhammad Ehsan Mazhar SamiaBakhtawar Anwar Manzoor Rana et al
-
Abrasive wear behavior of nano-ceriamodified NiCoCrAlY coatings deposited bythe high-velocity oxy-fuel processF Ghadami A Sabour Rouh Aghdam andS Ghadami
-
This content was downloaded from IP address 4211317640 on 14032022 at 0932
Lattice Constant Dependence on Particle Size for Ceria prepared from a Citrate Sol-Gel
V N Morris12 R A Farrell1 A M Sexton1 and M A Morris13 1Dimensional Solids Group Chemistry Department University College Cork Cork Ireland
2Analog Devices Raheen Business Park Raheen Limerick Ireland
3Centre for Research into Advanced Nanostructures and Nanodevices (CRANN) Trinity College Dublin Ireland
Abstract High surface area ceria nanoparticles have been prepared using a citrate sol-gel precipitation method Changes to the particle size have been made by calcining the ceria powders at different temperatures and X-ray methods used to determine their lattice parameters The particle sizes have been assessed using transmission electron microscopy (TEM) and the lattice parameter found to fall with decreasing particle size The results are discussed in the light of the role played by surface tension effects
1 Introduction Ceria (and doped ceria) has become one of the most important ceramic materials It has a number of important and varied catalysis uses (most notably as an important component of the three way automotive catalyst) [1] as an ionic conductor [2] as a gas sensor [3] and as an electrolyte material of solid oxide fuel cells [4] Ceria thin films have also found uses as high refractive index materials and insulating films on semiconductors Nanoparticles in general show higher catalytic activity better sinterability for example by comparison with coarse grained bulk materials [5]
The defect chemistry of ceria is relatively well established It is generally thought that as a trivalent cation is added to the lattice its charge is compensated by the presence of anion vacancies Such vacancies are associated with the dopant cations and are randomly distributed on anion sites within the fluorite lattice In particular whilst this maybe the thermodynamically the most important defect mechanism other defect systems are possible as minority species [6] and experimental evidence for interstitial oxygen defects has been found for nanoparticles of ceria [7] The change in lattice constant of ionic crystallites with decreasing nanoparticle size is an important issue that is not fully understood [8] Tsunekawa et al report lattice expansion with decreasing particle size for several nanosized CeO2 particle preparations [9] The results were from conventional electron diffraction performed in a TEM Usually TEM diffraction patterns cannot provide the accuracy required of lattice parameter measurements which need to be better than 05 More definitive measurements of this changing lattice constant are presented here using x-ray diffraction
Institute of Physics Publishing Journal of Physics Conference Series 26 (2006) 119ndash122doi1010881742-6596261028 EMAGndashNANO 05 Imaging Analysis and Fabrication on the Nanoscale
119copy 2006 IOP Publishing Ltd
There are numerous chemical methods for the production of nano-dimensioned particles of ceria These include precipitation sol-gel techniques micellar controlled (nanoreactors) and oxidation Most syntheses of ceria nanoparticles aim to provide spherical particles of high surface area which are either non-agglomerated or weakly agglomerated However each preparation method will produce materials with different defect densities and morphologies and it is difficult to relate any changes to variations in particle dimensions For this investigation the citrate sol-gel precipitation approach was employed which yielded high surface area ceria nanoparticles
2 Experimental Details 25ml of ammonium hydroxide is slowly added to a 1 molar solution of Ce(NO3)36H2O to precipitate out the CeO2 under constant stirring This results in a thick yellow white emulsion which is left to further stir for 30mins before being vacuum dried in a Buchner funnel The brownish purple precipitate is dried at 60degC for 24 hours The preparation of the acid-precipitated gel samples require 3g of the above bulk ceria powder to be weighed out into a sample vial 3ml of 70 citric acid is then added to the bulk ceria This mixture is allowed stir for 12 hours This is repeated for 3ml nitric acid and 3ml oxalic acid using 3g of bulk ceria powder for each for comparative purposes After stirring the acid peptised emulsions are dried at 80degC for 12 hours The precipitation samples are calcined at different temperatures up to 1000degC with dwell times of 2 hours
Powder x-ray diffraction (PXRD) profiles were recorded on a Philips 3710 PWD diffractometer (θndash2θ mode) equipped with a Cu Kα radiation source and standard scintillation detector Particle sizes were determined from x-ray results using the Scherrer equation Surface areas were measured using Nitrogen adsorptiondesorption analysis on a Micrometrics Gemini 2375 instrument at 77K Samples were degassed at 200degC for 24hrs using ultra high grade 50 nitrogen prior to each measurement TEM was used for structural characterization Each powder was dispersed onto holey carbon support grids and examined at 200kV in a JEOL 2000FX
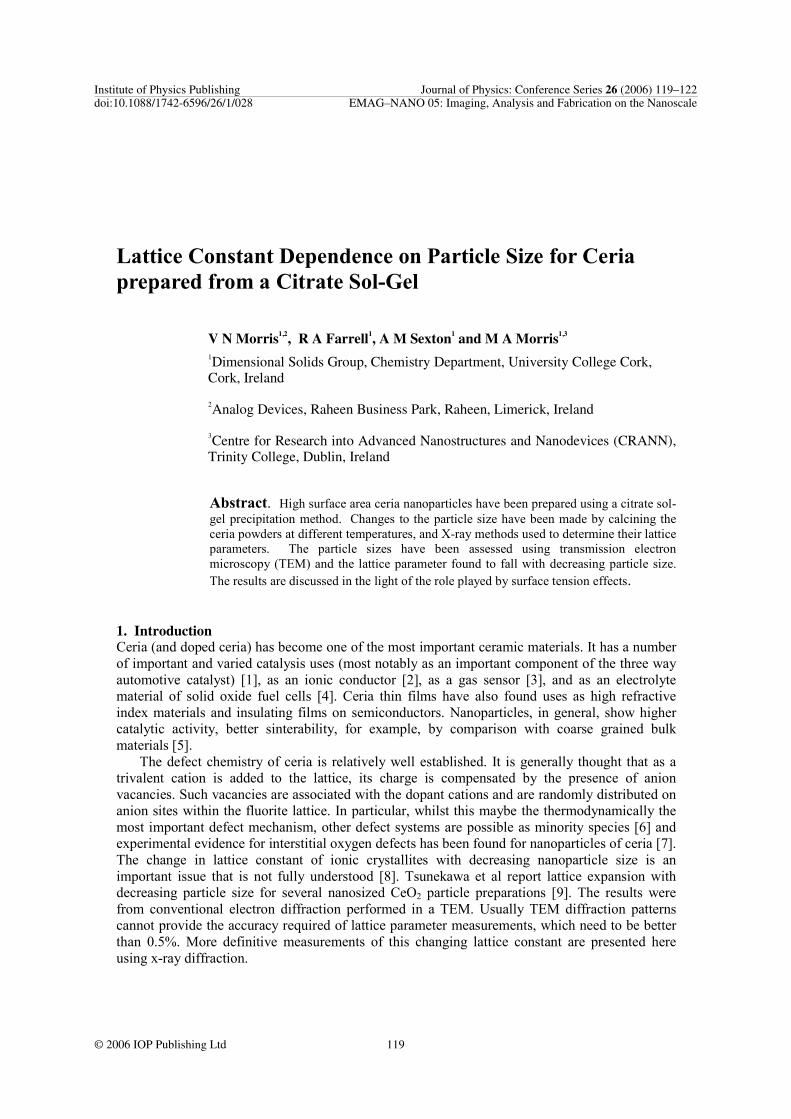
3 Results At high temperatures ceria of cubic fluorite structure is susceptible to crystalline growth Low temperature sintered ceria exhibits broad and low intensity PXRD peaks Figure 1 is a PXRD 2D comparison plot of various temperatures (350degC to 1000degC) for the citrate technique outlined above
Figure 1 2D PXRD comparison plot for the citric acid method
120
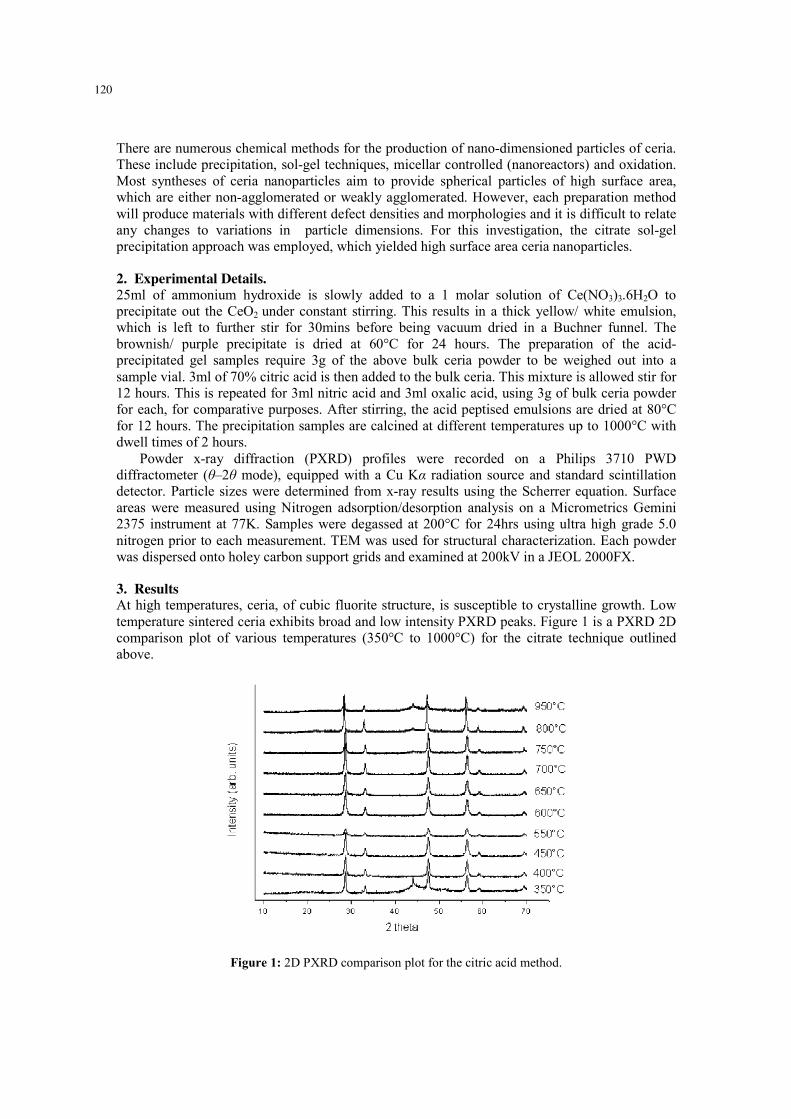
From these PXRD patterns lattice parameter and particle size approximations can be calculated The lattice parameter for the ceria fluorite structure is 0541nm Low temperature ceria tends to exhibit higher lattice parameters due to the presence of defects and impurities Such defects are introduced during sample preparation and vary according to method and reagents used Figure 2 illustrates d-spacing as a function of sintering temperature Literature suggests that lattice parameter and particle size are directly related stating that as particle size increases this causes a corresponding decrease in lattice parameter However from the experimental technique employed here particle size increases as temperature increases though lattice parameter continues to increase steadily
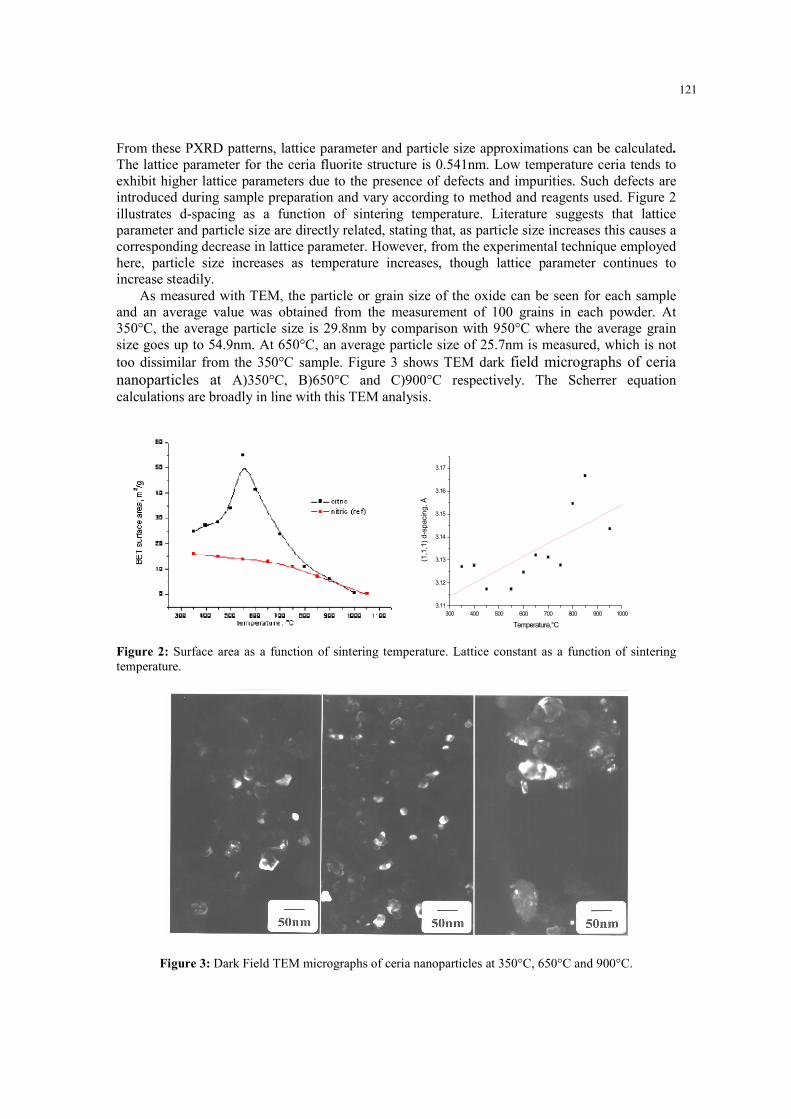
As measured with TEM the particle or grain size of the oxide can be seen for each sample and an average value was obtained from the measurement of 100 grains in each powder At 350degC the average particle size is 298nm by comparison with 950degC where the average grain size goes up to 549nm At 650degC an average particle size of 257nm is measured which is not too dissimilar from the 350degC sample Figure 3 shows TEM dark field micrographs of ceria nanoparticles at A)350degC B)650degC and C)900degC respectively The Scherrer equation calculations are broadly in line with this TEM analysis
300 400 500 600 700 800 900 1000311
312
313
314
315
316
317
(11
1) d
-spa
cing
Aring
TemperaturedegC
Figure 2 Surface area as a function of sintering temperature Lattice constant as a function of sintering temperature
Figure 3 Dark Field TEM micrographs of ceria nanoparticles at 350degC 650degC and 900degC
121
4 Discussion and Conclusions The reason for lattice contraction is considered Results obtained from PXRD analysis illustrate that since the lattice parameter and temperature range are equivalent as the lattice parameter increases as a function of the annealing temperature defects such as anion vacancies decrease
As observed by PXRD strong lattice contractions (not expansions) were measured with decreasing particle size strongly indicating surface tension plays a major role in determining the lattice parameter The data suggests that anion vacancy defects are not created to any major extent in this work This investigation of lattice parameter changes versus particle size coupled to very careful synthesis methods provides a deeper understanding of oxide particle nanoscience References [1] Trovarelli A de Leiterburg C Boaro M and Dolcetti G 1999 Catal Today 50 353 and
references therein [2] Waller D Lane J A Kilner J A and Steele B C H 1996 Solid State Ion 86 767 and
references therein [3] Stefanik T S and Tuller H L 1967 J Eur Ceram Soc 21 [4] Tsoga A Gupta A Naoumidis A and Nikolopoulos P 2000 Acta Mater 48 4709 [5] Fornasiero P di Monte R Rao G R Kaspan J Meriani S Trovarelli A Grazizni M 1995
J Catal 151 168 [6] Mirervini L Zacate M O Grimes R W 1999 Solid State Ion 116 339 [7] Mamonto E Egami T 2000 J Phys Chem Solids 61 1345 [8] Mays C W Vermaak J S Kuhlmann-Wilsdorf D 1968 Surf Sci 12 134 [9] Tsunekawa S Sahara R Kawazoe Y Ishikawa K 1999 Appl Surf Sci 152 53
Tsunekawa S Ishikawa K Li Z Q Kawazoe Y Kasuya Y 2000 Phys Rev Lett 85 3440
122
Lattice Constant Dependence on Particle Size for Ceria prepared from a Citrate Sol-Gel
V N Morris12 R A Farrell1 A M Sexton1 and M A Morris13 1Dimensional Solids Group Chemistry Department University College Cork Cork Ireland
2Analog Devices Raheen Business Park Raheen Limerick Ireland
3Centre for Research into Advanced Nanostructures and Nanodevices (CRANN) Trinity College Dublin Ireland
Abstract High surface area ceria nanoparticles have been prepared using a citrate sol-gel precipitation method Changes to the particle size have been made by calcining the ceria powders at different temperatures and X-ray methods used to determine their lattice parameters The particle sizes have been assessed using transmission electron microscopy (TEM) and the lattice parameter found to fall with decreasing particle size The results are discussed in the light of the role played by surface tension effects
1 Introduction Ceria (and doped ceria) has become one of the most important ceramic materials It has a number of important and varied catalysis uses (most notably as an important component of the three way automotive catalyst) [1] as an ionic conductor [2] as a gas sensor [3] and as an electrolyte material of solid oxide fuel cells [4] Ceria thin films have also found uses as high refractive index materials and insulating films on semiconductors Nanoparticles in general show higher catalytic activity better sinterability for example by comparison with coarse grained bulk materials [5]
The defect chemistry of ceria is relatively well established It is generally thought that as a trivalent cation is added to the lattice its charge is compensated by the presence of anion vacancies Such vacancies are associated with the dopant cations and are randomly distributed on anion sites within the fluorite lattice In particular whilst this maybe the thermodynamically the most important defect mechanism other defect systems are possible as minority species [6] and experimental evidence for interstitial oxygen defects has been found for nanoparticles of ceria [7] The change in lattice constant of ionic crystallites with decreasing nanoparticle size is an important issue that is not fully understood [8] Tsunekawa et al report lattice expansion with decreasing particle size for several nanosized CeO2 particle preparations [9] The results were from conventional electron diffraction performed in a TEM Usually TEM diffraction patterns cannot provide the accuracy required of lattice parameter measurements which need to be better than 05 More definitive measurements of this changing lattice constant are presented here using x-ray diffraction
Institute of Physics Publishing Journal of Physics Conference Series 26 (2006) 119ndash122doi1010881742-6596261028 EMAGndashNANO 05 Imaging Analysis and Fabrication on the Nanoscale
119copy 2006 IOP Publishing Ltd
There are numerous chemical methods for the production of nano-dimensioned particles of ceria These include precipitation sol-gel techniques micellar controlled (nanoreactors) and oxidation Most syntheses of ceria nanoparticles aim to provide spherical particles of high surface area which are either non-agglomerated or weakly agglomerated However each preparation method will produce materials with different defect densities and morphologies and it is difficult to relate any changes to variations in particle dimensions For this investigation the citrate sol-gel precipitation approach was employed which yielded high surface area ceria nanoparticles
2 Experimental Details 25ml of ammonium hydroxide is slowly added to a 1 molar solution of Ce(NO3)36H2O to precipitate out the CeO2 under constant stirring This results in a thick yellow white emulsion which is left to further stir for 30mins before being vacuum dried in a Buchner funnel The brownish purple precipitate is dried at 60degC for 24 hours The preparation of the acid-precipitated gel samples require 3g of the above bulk ceria powder to be weighed out into a sample vial 3ml of 70 citric acid is then added to the bulk ceria This mixture is allowed stir for 12 hours This is repeated for 3ml nitric acid and 3ml oxalic acid using 3g of bulk ceria powder for each for comparative purposes After stirring the acid peptised emulsions are dried at 80degC for 12 hours The precipitation samples are calcined at different temperatures up to 1000degC with dwell times of 2 hours
Powder x-ray diffraction (PXRD) profiles were recorded on a Philips 3710 PWD diffractometer (θndash2θ mode) equipped with a Cu Kα radiation source and standard scintillation detector Particle sizes were determined from x-ray results using the Scherrer equation Surface areas were measured using Nitrogen adsorptiondesorption analysis on a Micrometrics Gemini 2375 instrument at 77K Samples were degassed at 200degC for 24hrs using ultra high grade 50 nitrogen prior to each measurement TEM was used for structural characterization Each powder was dispersed onto holey carbon support grids and examined at 200kV in a JEOL 2000FX
3 Results At high temperatures ceria of cubic fluorite structure is susceptible to crystalline growth Low temperature sintered ceria exhibits broad and low intensity PXRD peaks Figure 1 is a PXRD 2D comparison plot of various temperatures (350degC to 1000degC) for the citrate technique outlined above
Figure 1 2D PXRD comparison plot for the citric acid method
120
From these PXRD patterns lattice parameter and particle size approximations can be calculated The lattice parameter for the ceria fluorite structure is 0541nm Low temperature ceria tends to exhibit higher lattice parameters due to the presence of defects and impurities Such defects are introduced during sample preparation and vary according to method and reagents used Figure 2 illustrates d-spacing as a function of sintering temperature Literature suggests that lattice parameter and particle size are directly related stating that as particle size increases this causes a corresponding decrease in lattice parameter However from the experimental technique employed here particle size increases as temperature increases though lattice parameter continues to increase steadily
As measured with TEM the particle or grain size of the oxide can be seen for each sample and an average value was obtained from the measurement of 100 grains in each powder At 350degC the average particle size is 298nm by comparison with 950degC where the average grain size goes up to 549nm At 650degC an average particle size of 257nm is measured which is not too dissimilar from the 350degC sample Figure 3 shows TEM dark field micrographs of ceria nanoparticles at A)350degC B)650degC and C)900degC respectively The Scherrer equation calculations are broadly in line with this TEM analysis
300 400 500 600 700 800 900 1000311
312
313
314
315
316
317
(11
1) d
-spa
cing
Aring
TemperaturedegC
Figure 2 Surface area as a function of sintering temperature Lattice constant as a function of sintering temperature
Figure 3 Dark Field TEM micrographs of ceria nanoparticles at 350degC 650degC and 900degC
121
4 Discussion and Conclusions The reason for lattice contraction is considered Results obtained from PXRD analysis illustrate that since the lattice parameter and temperature range are equivalent as the lattice parameter increases as a function of the annealing temperature defects such as anion vacancies decrease
As observed by PXRD strong lattice contractions (not expansions) were measured with decreasing particle size strongly indicating surface tension plays a major role in determining the lattice parameter The data suggests that anion vacancy defects are not created to any major extent in this work This investigation of lattice parameter changes versus particle size coupled to very careful synthesis methods provides a deeper understanding of oxide particle nanoscience References [1] Trovarelli A de Leiterburg C Boaro M and Dolcetti G 1999 Catal Today 50 353 and
references therein [2] Waller D Lane J A Kilner J A and Steele B C H 1996 Solid State Ion 86 767 and
references therein [3] Stefanik T S and Tuller H L 1967 J Eur Ceram Soc 21 [4] Tsoga A Gupta A Naoumidis A and Nikolopoulos P 2000 Acta Mater 48 4709 [5] Fornasiero P di Monte R Rao G R Kaspan J Meriani S Trovarelli A Grazizni M 1995
J Catal 151 168 [6] Mirervini L Zacate M O Grimes R W 1999 Solid State Ion 116 339 [7] Mamonto E Egami T 2000 J Phys Chem Solids 61 1345 [8] Mays C W Vermaak J S Kuhlmann-Wilsdorf D 1968 Surf Sci 12 134 [9] Tsunekawa S Sahara R Kawazoe Y Ishikawa K 1999 Appl Surf Sci 152 53
Tsunekawa S Ishikawa K Li Z Q Kawazoe Y Kasuya Y 2000 Phys Rev Lett 85 3440
122