layout, design and operation of a safe automated … design and operation of a safe automated...
TRANSCRIPT

April 1995
This work was performed as part of the California PATH Program of theUniversity of California, in cooperation with the State of California Business,Transportation, and Housing Agency, Department of Transportation; and theUnited States Department of Transportation, Federal Highway Administration.
The contents of this report reflect the views of the authors who are responsiblefor the facts and the accuracy of the data presented herein. The contents do notnecessarily reflect the official views or policies of the State of California. Thisreport does not constitute a standard, specification, or regulation.
Layout, Design and Operation of a SafeAutomated Highway System
Anthony Hitchcock
UCB-ITS-PRR-95-11California PATH Research Report
ISSN 1055-1425©1995 by the Regents of the University of California
Layout, Design and Operation of a SafeAutomated Highway System
by
Anthony Hitchcock
PATH/ITS, University of California, Berkeley

LAYOUT, DESIGN AND OPERATION OF ASAFE AUTOMATED HIGHWAY SYSTEM
ANTHONY HITCHCOCKPATH/ITS, University of California, Berkeley
Abstract
The paper is concerned with the consequences of control system failures and external intrusions toa fully Automated Highway System (AHS). A model has been developed which enables the casu-alty rates in lines of automated vehicles to be calculated, following an initial event. It is applied toseveral situations here for a variety of possible physical layouts and operational modes of an AHS.It is believed that these configurations encompass all those proposed which are economically at-tractive, and that the accident types encompass the most important ones. For all accident types,there is one system which has casualties per incident no greater than 10% of its nearest rivals. This“preferred” system is described, and the predicted casualty rate results are quoted and discussed. Ifreliability of the control systems is sufficient, the advantages of the preferred system become unim-portant. Values of reliability required are discussed.
ii

iii
Abstract ........................................................................................................... iiTable of Contents .......................................................................................... iiiIntroduction .................................................................................................... 1Description of Preferred Configuration ......................................................... 2Principles of Design ....................................................................................... 4Motion of Vehicles and Occupants................................................................. 8Results of Calculations................................................................................. 11Consequences for AHS Configuration and Operation ................................. 19Conclusions .................................................................................................. 21Acknowledgments ........................................................................................ 21References .................................................................................................... 22
List of Figures:Figure 1 Layout of preferred AHS ................................................................. 2Figure 2 Conceptual design of high barrier ................................................... 7Figure 3 Conceptual design of low barrier ..................................................... 7Figure 4 Probability distribution of coefficients of friction. Dry condition .... 9Figure 5 Casualties per 100 incidents in dry weather .................................. 12Figure 6 Casualties per 100 incidents ... point follower control ................... 13Figure 7 Casualties per 100 incidents ... AICC. Dry conditions ................... 16
List of Tables:Table 1 Capacity and casualty rates at capacity: platoons ............................ 12Table 2 Capacity and casualty rates at capacity: PFC ................................... 14Table 3 Capacity and casualty rates at capacity: AICC................................ 15Table 4 Capacity and casualty rates at capacity: CICC................................ 17Table 5 Deaths per 100 MVMT on an AL on the Santa Monica Freeway .. . 18Table 6 Casualties during merge per 100 incidents...................................... 19
Table of Contents

INTRODUCTION
In some earlier papers (Hitchcock 1993a, b, 1994) a model has been described which makesquantitative estimates of the casualty rates in particular kinds of accidents on an automated high-way system (AHS). The casualty rates depend on the way motion is organized within the AHS. Asa result of this work it becomes possible to integrate the total picture, and determine the total impactof safety constraints on acceptable physical layout and operational scheme of an AHS. In somecases, an alternative to acceptance of the constraining features described here is to ensure highreliability of vehicle control systems: in others the initial element of the danger to be guardedagainst is external to the system, and cannot be affected by system design.
We shall conclude that there is one preferred scheme among those which are economicallyviable in that they offer the prospect of those significant increases in capacity which are the raisond’être of an AHS. In the event of control system failures, the preferred scheme results in far fewercasualties per failure (by factors of at least 10 or so) than any other scheme of which the author isaware. Thus, if continued high reliability of vehicle-borne control systems can be achieved cheaply,the scheme meets safety criteria significantly more severe than its competitors.
The schemes discussed here assumes a system that has automated cars and light trucks only.Any possible preferred scheme involving heavier vehicles will not be discussed here. Further, thediscussion in this paper refers mainly to systems in which the lanes with automated vehicles (auto-mated lanes or ALs) share a structure with lanes of manual vehicles (manual lanes) and are ac-cessed from them. The conclusion, however, also applies to automated systems which are accesseddirectly from surface streets, in which vehicles become automated on the on-ramps, and resumemanual control on the off-ramps. The arguments are basically very similar, and brief explanationsof the differences will be made throughout the paper. It is apparent to the author that if there is anetwork of ALs, so that some are accessed from other ALs, the conclusions also continue to apply.However this does not seem to be transparently valid to others, and the detailed argument, whichwould be lengthy, has not yet been formulated. This extension must therefore remain speculative.
In this paper we shall first describe the preferred scheme. The reader will then be able to seewhere our argument is going. We shall then draw attention to the features it possesses which, weshall argue, are essential to a viable AHS. The model which has been described in the earlier papers,and the particular values chosen for some of the parameters, will be reviewed. We shall then turn tothe particular accident types which, we shall argue, are critical. We discuss the results of modelingthese accidents in a variety of configurations. These configurations encompass all configurationsknown to the author to have been put forward. The conclusion that only the preferred configurationmeets all the criteria will become evident.
There are conceivable accidents, such as the collision of a moving platoon with a stationaryone, that are more severe than anything considered. However, it has been shown by Hitchcock(1992) that by the choice of appropriate degraded modes of operation, the use of appropriate designtechniques and fault tree analysis, it can be assured that such catastrophes only occur if three ormore independent faults occur simultaneously. This will be very infrequent and can be ignored forthe present purpose.
1

DESCRIPTION OF PREFERRED CONFIGURATION
Figures 1 a, b & c show the preferred layout and mode operation. As explained above, thisshows an AHS which shares space with manual lanes on a freeway, and is accessed from thosemanual lanes. If the AHS were on its own structure, and accessed by ramps, figure 1a does notapply, and figure 1b requires a little modification. Figure 1c is unaltered.
Figures 1a, b & c. Layout of preferred AHS. Thic k lines indicate a high barier , dotted lines a lo w one.Thin lines are r oad markings. The “dormitory” in figure b receives vehic les rejected at entr y, andvehicles which have not resumed manual control after exit.
8'
8'
AL
AL
TL (EML)
MLs
Low Barrierwith GatesHigh BarriersCenter
Pre-platoon
12'
EntryDormitory
8'
8'
8' 2
7
6
5 4 3 1
AL
AL
TL (XML)
Low Barrier
High Barriers
Center
Exiting
8'
8'
8'
AL
AL
TL
MLs
Center
XML
12'
Entry Test
AutomaticManual
CCL
Figure 1 b
Figure 1 c
Figure 1 a
2
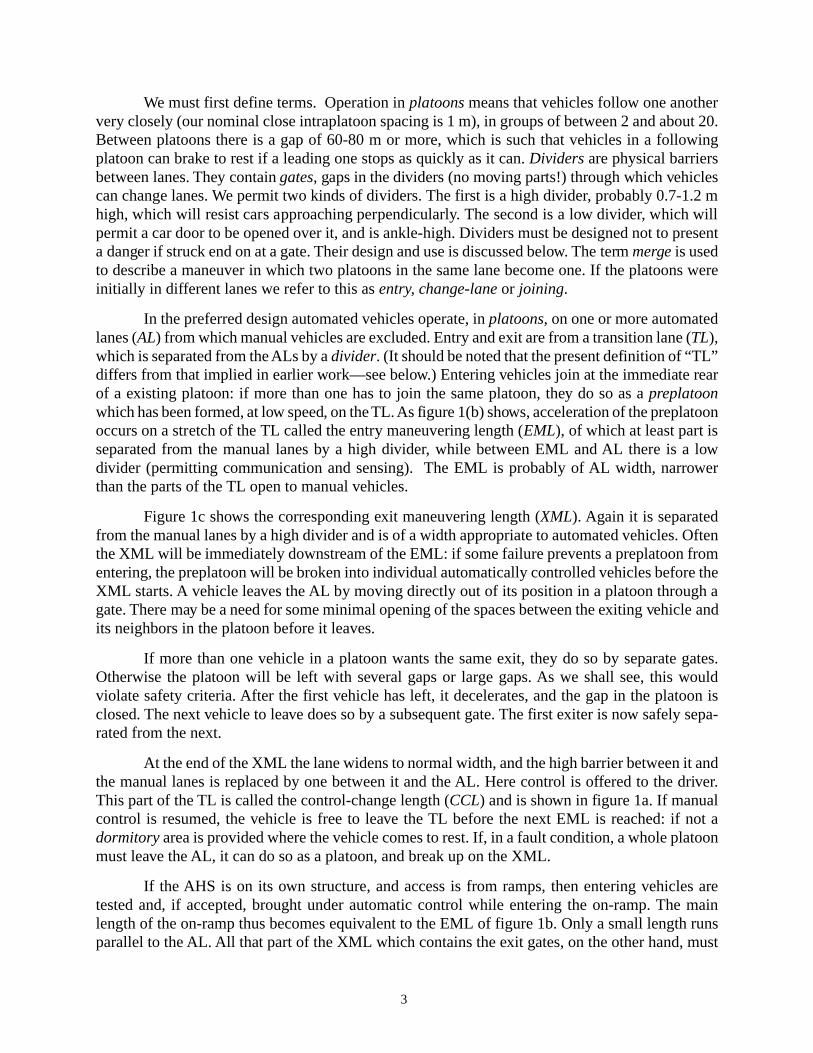
We must first define terms. Operation in platoons means that vehicles follow one anothervery closely (our nominal close intraplatoon spacing is 1 m), in groups of between 2 and about 20.Between platoons there is a gap of 60-80 m or more, which is such that vehicles in a followingplatoon can brake to rest if a leading one stops as quickly as it can. Dividers are physical barriersbetween lanes. They contain gates, gaps in the dividers (no moving parts!) through which vehiclescan change lanes. We permit two kinds of dividers. The first is a high divider, probably 0.7-1.2 mhigh, which will resist cars approaching perpendicularly. The second is a low divider, which willpermit a car door to be opened over it, and is ankle-high. Dividers must be designed not to presenta danger if struck end on at a gate. Their design and use is discussed below. The term merge is usedto describe a maneuver in which two platoons in the same lane become one. If the platoons wereinitially in different lanes we refer to this as entry, change-lane or joining.
In the preferred design automated vehicles operate, in platoons, on one or more automatedlanes (AL) from which manual vehicles are excluded. Entry and exit are from a transition lane (TL),which is separated from the ALs by a divider. (It should be noted that the present definition of “TL”differs from that implied in earlier work—see below.) Entering vehicles join at the immediate rearof a existing platoon: if more than one has to join the same platoon, they do so as a preplatoonwhich has been formed, at low speed, on the TL. As figure 1(b) shows, acceleration of the preplatoonoccurs on a stretch of the TL called the entry maneuvering length (EML), of which at least part isseparated from the manual lanes by a high divider, while between EML and AL there is a lowdivider (permitting communication and sensing). The EML is probably of AL width, narrowerthan the parts of the TL open to manual vehicles.
Figure 1c shows the corresponding exit maneuvering length (XML). Again it is separatedfrom the manual lanes by a high divider and is of a width appropriate to automated vehicles. Oftenthe XML will be immediately downstream of the EML: if some failure prevents a preplatoon fromentering, the preplatoon will be broken into individual automatically controlled vehicles before theXML starts. A vehicle leaves the AL by moving directly out of its position in a platoon through agate. There may be a need for some minimal opening of the spaces between the exiting vehicle andits neighbors in the platoon before it leaves.
If more than one vehicle in a platoon wants the same exit, they do so by separate gates.Otherwise the platoon will be left with several gaps or large gaps. As we shall see, this wouldviolate safety criteria. After the first vehicle has left, it decelerates, and the gap in the platoon isclosed. The next vehicle to leave does so by a subsequent gate. The first exiter is now safely sepa-rated from the next.
At the end of the XML the lane widens to normal width, and the high barrier between it andthe manual lanes is replaced by one between it and the AL. Here control is offered to the driver.This part of the TL is called the control-change length (CCL) and is shown in figure 1a. If manualcontrol is resumed, the vehicle is free to leave the TL before the next EML is reached: if not adormitory area is provided where the vehicle comes to rest. If, in a fault condition, a whole platoonmust leave the AL, it can do so as a platoon, and break up on the XML.
If the AHS is on its own structure, and access is from ramps, then entering vehicles aretested and, if accepted, brought under automatic control while entering the on-ramp. The mainlength of the on-ramp thus becomes equivalent to the EML of figure 1b. Only a small length runsparallel to the AL. All that part of the XML which contains the exit gates, on the other hand, must
3

clearly run parallel to the ALs, as shown in figure 1c. However, as vehicles enter the off ramp, thelane width increases to that found on manual lanes: this is where drivers are invited to resumemanual control. If they do not they are brought to rest at the further end of the off-ramp. In thisconfiguration there is no need for high barriers, but the low barriers remain necessary between ALs,if there is more than one, between ALs and XML, and at the entry end of the on-ramp.
In the preferred scheme, platoons never join or divide on an AL. This is required, as weshall see by the need to conform to safety criteria. We shall not discuss this here, but the length ofthe EML is reduced, easing constraints if the number of platoons per kilometer remains constant.We shall adopt this assumption here, though it is not a necessary part of the preferred scheme. Evenif all vehicles in one platoon leave, the gap is not closed but remains, as a “platoon of zero length”,ready to receive entering vehicles. If there is more than one AL, platoons of equal length move oneach AL side-by-side. There are continual exchanges of vehicles between platoons on parallel ALsto keep lengths equal, those leaving first being in the lane adjacent to the TL. It is easy to prove that,under the conditions described here and in the absence of congestion on the AL, the number ofplatoons per kilometer is a constant; that the distribution of platoon lengths is Poisson, and that asflow increases, so does the mean platoon length.
The reason for this scheme is that the safety criteria require that any changes of lane be-tween ALs must take place without a merge over a length greater than the headway between twoadjacent vehicles in a platoon. Thus to change between ALs, two platoons lie adjacent, a gap isopened in one opposite the vehicle which is to change lanes, and this switches lanes when a gate isreached. Since there will be one vehicle changing lanes between platoons several times in two orthree miles, it is clearly convenient that the platoons remain adjacent all the time, instead of re-aligning themselves whenever a vehicle has to change lane. This maximizes capacity. Indeed if thecriterion of Hall (1993) is applied, it appears that with this configuration, the complexities of lane-changing, entry and exit offer do not constrain the capacity of the system. This has been confirmedby unpublished work by the author.
PRINCIPLES OF DESIGN
This design has been chosen because it meets the following criteria:
Economy and safety. Even allowing for the TL, which bears little through traffic, the capacity perunit width can be made high— twice or three times that for manual lanes. The system can thus beeconomic. The casualty rates per 100 MVMT that are acceptable are not currently defined. Wesuggest that AHS must appear to be less dangerous to car occupants than the manual traffic (onfreeway) that it replaces. In fact such accidents as do occur are likely to make newsworthy photo-graphs: many will involve many vehicles, and when, as will be true in most cases, the injury rate islow, the public is more likely to ascribe this to luck than to sound engineering. When fatal accidentsdo occur, they are likely to be multi-fatality ones. Thus an AHS will appear more dangerous than itis. We suggest here that safety criteria, if they are to be publicly, politically and legally acceptablewill require that the injury rate due to any one kind of accident should be less than 10% of thepresent rate on freeways. Further, suppose there are two alternative designs, “A”, and “B”. “A”produces several times more casualties than “B” following the same initiating event. If, we suggest,it is wished to argue that the difference is unimportant, it will be required that the casualty rate of
4

“A” is less than 1% of the present rate. “A” could, however, be acceptable with a larger value ifthere are compensating advantages in air quality or capacity. In what follows we shall assume thatthis position is adopted. Ultimately the decision about what is acceptable here is for legislatures.
Separation from Manual Traffic on freeway. The requirement above that safety be increased by aconsiderable factor over the present situation implies that there be no manual traffic on the high-density ALs. Otherwise human errors will occur at the same rate as at present, and produce accidentrates which are likely to be significantly larger than at present, since speeds and densities will beincreased on ALs. This means, incidentally, that full economic advantage may be taken of automa-tion, and lane widths can be narrowed—we suggest to 2.5 m. There must be manual and automatedtraffic co-existing on the CCL, but this is at low density and reduced speed. It has sometimes beensuggested that, for example, platoon leaders might operate with manual control of interplatoonspacing. Under such conditions freedom from interplatoon collision would be lost in many faultconditions—each such event could be a multi-fatality catastrophe.
Platooned operation for least casualties in failures of longitudinal control. In Hitchcock 1994, ourmodeling technique is applied to systems with different modes of operation, with this in common,that they have the capability of supporting 6000 vehicles per hour per lane. The critical failure, it isargued, arises when a control system failure results in a vehicle applying full braking withoutwarning. Close-spaced platooning turns out to be robust against a number of variables which arediff icult or impossible to control, and to have casualty rates per incident lower by a factor of 5 - 500than the competitors. Thus our preferred system operates with platoons of minimal intra-platoonspacing.
The competing modes of operation considered here are the following. We are not aware thatany other modes of high-capacity automated operation have been proposed.
a. Platoons. Vehicles move in groups of 2-20 communicating vehicles. Intraplatoon spacing about1 m. Interplatoon spacing 60-80 m or more.
b. Point Follower Control (PFC). There is a series of “slots”, 10-20 m long, moving down theAL. Each may or may not contain one vehicle. All vehicles communicate with the infrastruc-ture.
c. Autonomous Intelligent Cruise Control (AICC). Each vehicle detects a vehicle ahead, andremains a desired distance behind it. No communication between vehicles. The slot lengthsused here are such that the capacities necessary for economic viability are achieved. It wouldbe possible operate a lane with such vehicle spacings that multiple collisions never occur, butthese would have capacities less than existing lanes.
d. Cooperative Intelligent Cruise Control (CICC). Same as AICC with communication betweenadjacent vehicles.
The mode of operation of AICC-only and CICC-only lanes will be affected by driver be-havior, and here assumptions must be made. It seems to us likely that most drivers will attempt topress forward as far as possible, just as observation indicated that they do today. This will result invery long lines of vehicles with the AICC-system-determined headway, separated by large gapsheaded by a driver who does not think it worth-while to close the gap. Clearly this will not apply at
5

very low flows, and at intermediate flows other behavior may eventuate. However, although otherbehaviors would produce results that are numerically different the changes are not so large as toaffect our conclusions.
The model, and the results of this work are described in greater detail later.
Dividers to avoid unacceptable casualty rates in secondary accidents. Anwar & Jovanis (1993)enumerated “relevant accidents” on a section of the Santa Monica freeway. These are accidents onthe manual lanes as a result of which a vehicle is projected on to the leftmost lane, where the ALswould be. Hitchcock (1993a) calculated that the death rate in automated vehicles per 100 MVMTon an AL on this freeway due to secondary collisions after a relevant accident in the absence of adivider. With platooned operation the death rate would be around 1 times the present rate due to allcauses. Work reported below indicates that with other control modes, the effect is even worse. Thefigures are given below.
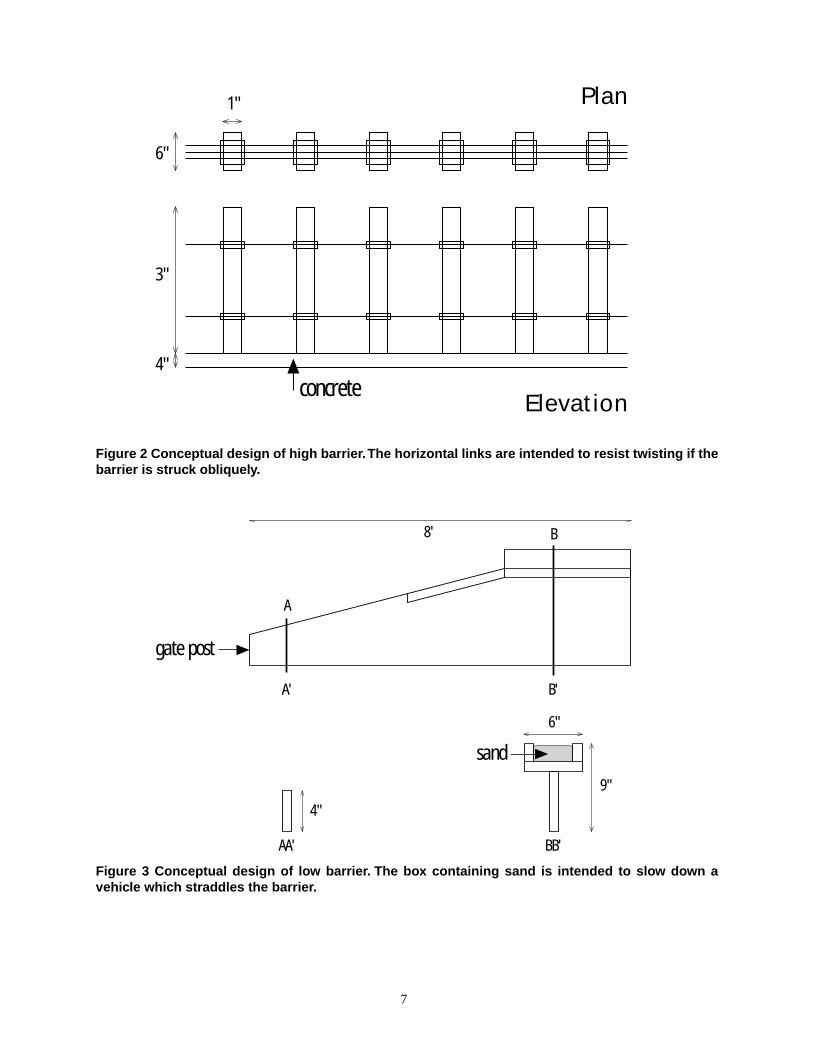
Since the death rate without AL/TL dividers is unacceptable, any system meeting safetycriteria must have them. It is not immediately apparent, however, that barriers can be made safe. Itis clearly possible for a barrier to be struck end-on by a vehicle which is changing lane through agate. If the barrier is a Jersey beam, or the familiar corrugated-metal barriers seen on freeways, thisis known to be extremely dangerous. The barrier must be designed in such a way that it will resistpenetration by a vehicle striking its side, but will yield, giving a deceleration of between 1/2 g and,say, 21/2 g when struck end-on. This can perhaps be achieved by making it of metal beams muchthicker across the barrier than parallel to it, as shown in figure 2. Another possibility applies be-tween ALs, or at the entry-gate (see figure 1b), where the barrier has only to contain vehicles to anarrow lane. Here a low barrier, which will pass under the vehicle and slow it by causing it to plowthrough sand (see figure 3) may perhaps be acceptable. Neither of these design concepts has yetbeen tested. It seems unlikely, however, that no acceptable design can be found.
Safe Mechanism of platoon formation. Hitchcock 1993b shows that if the critical failure—brakeson—occurs in the first of two platoons which are merging, the injury rate is some 10 times what itwould be if there were no merge. Such figures also apply if one vehicle is merging with a platoonfrom a great distance. The effect is present, but small, when the merge is across a separation of onecar length only, but is two or three times larger than this if the merge is over two car lengths.
We therefore need, in order to meet safety criteria, a mode of operation in which mergingover a distance anything from two car lengths to the full interplatoon separation is excluded innormal operation. This has consequences on entry and exit and on the co-ordination of movementon two or more ALs. We accept that in fault conditions it may be necessary to isolate a vehiclewhich is faulty but can still move under its own power, and, after it has left the AL, reform theplatoon by a merge. Under these conditions the merge would be prolonged by limiting the relativespeed of the two components, even though this results in a marginal increase in congestion. If suchprolonged merges were accepted as part of normal-operation lane-change, lane-changing wouldconstrain capacity very severely, according to the criterion of Hall (1993), as confirmed by unpub-lished work by the author.
6
Elevation
Plan
concrete
6"
1"
3"
4"
gate post
8'
A
A'
B
B'
AA' BB'
sand
4"
9"
6"
Figure 2 Conceptual design of high barrier . The horizontal links are intended to resist twisting if thebarrier is struck obliquely.
Figure 3 Conceptual design of lo w barrier . The bo x containing sand is intended to slo w do wn avehicle which straddles the barrier.
7

MOTION OF VEHICLES AND OCCUPANTS
“Coefficients of friction”. In the accidents we discuss, lines of vehicles respond to the initial inci-dent by braking. Nevertheless collisions occur. One of the factors affecting the severity of injuriesis the variability between vehicles. In any of the longitudinal control schemes, if vehicles were allidentical there would be fewer or no collisions. In fact, however, the maximum deceleration that avehicle can achieve depends on the condition of its brakes, and, in wet weather, on the condition ofits tires. In well maintained vehicles these do vary, but not very much. However, some vehicles arenot well-maintained. We have been able to find no data about the range of variation in practice. Wethink that worn tires are much more common than worn brakes, and observations in local car parkssuggest that one third of vehicles have tires which are sufficiently worn to affect maximum decel-eration in the wet.
In this paper the maximum deceleration that a vehicle can maintain is assumed to be inde-pendent of speed and equal to ƒg m/s/s where g(≈ 10 m/s/s) is the acceleration of gravity. ƒ is thusanalogous to a constant coefficient of friction. We assume here, that for both brakes and tires, thereare two populations. The majority have ƒ-values evenly distributed over a small range, while theminority ranges down to a small value. Figure 4 shows the distribution of ƒ-values for our standard“dry” conditions. (Higher values are not realistic with asphalt or concrete road surfaces.) Fullerdetails are in Hitchcock 1994. The results reported here and elsewhere use the standard dry and wetvalues described there.
It may or may not be technically and economically possible to ensure that all vehicles on anAHS have good tires and brakes. However, even if it is technically possible, it may be doubted if itis politically possible (witness the present laws about old vehicles which cannot meet air qualityregulations).
However, it is possible that the fraction of vehicles with poor stopping ability either is orwill be different from what is assumed here. Some sensitivity analysis has been carried out. Thenumerical results of our calculations are sensitive to the numbers chosen to describe ƒ-values. Therelative magnitudes of the results for different control modes, and the absolute values for the sec-ondary effects of relevant accidents, are less sensitive. The conclusion that the principles statedabove are necessary if safety criteria are to be met remains valid, but if the fraction of vehicles withreduced stopping power is very different than what is assumed, the reliability requirement maychange.
Equally, the effects of aerodynamic forces have been ignored, (largely because data on themis not yet available). This will affect the magnitude of the results, but seems unlikely to affectrelativities. It would be desirable to remedy this defect.
Warning of need to brake. There will be delays in initiation of braking, which vary with the mode ofoperation. The i th vehicle in line will start to brake at time
ti = a + b⋅i1. In the platooned condition, and also in CICC, a message is passed back from vehicle to vehicle
in the platoon. There is then a delay before brakes are applied.We take a = 0.09 s and b = 0.01 s.
2. With AICC, each vehicle can only detect the vehicle ahead of it. We take a = 0; b = 0.09 s. Thisis optimistic with present del. brake technology, but we are advised that it may become pos-
8

sible. Thus the generally negative conclusions we reach about AICC later are not due to pessi-mism here.
3. PFC systems are controlled from the infrastructure. We therefore take a = 0.09 s, b = 0.
P%
f-value0.30
100
0.33
0.75
Figure 4. Probability distribution of coefficients of friction. Dry condition.
In all the modes of operation except platooning, long lines of vehicles can be formed, whoselength is limited only by the size of the AHS area. If the response to the incident is in all cases fullbraking, the consequences will stretch back to a theoretical infinity of vehicles, and casualty rateswill be also infinite. One way to resolve this is to assume that driver intervention limits the spreadof the incident—this is perhaps reasonable for AICC and CICC, especially if no barriers are present,so that vehicles can steer out of trouble. We consider cases in which such intervention is supposedto limit the number of vehicles affected to 10 or 20 vehicles, and others in which a few drivers adoptinterplatoon-like spacings. Alternatively, one might assume that less than full braking is applied.One possibility in the PFC case would be to arrange that the n th vehicle will come to rest n carlengths behind where it calculates its the failed vehicle will stop. Similar criteria for what we termgraded braking can be found for AICC and CICC. This reaction requires that the n th vehicle is“aware” of the coefficients of friction and other parameters of the failed vehicle. We investigate theeffect of getting these parameters wrong.
There is another problem here: when the vehicle ahead is braking, the safest response for avehicle’s occupant is to apply the brakes fully. As we have seen, this can increase the total numberof casualties, but it reduces the risk to the individual with a choice. There are moral and legal issueswhich are not relevant here.
Model of vehicle motion. The distribution of vehicle masses and of ƒ-values is taken to be random.The calculation is a “Monte Carlo” one—that is, values of the random parameters are given fixedvalues determined by an unbiased process for each run, and the runs are repeated many times, tillthe probabilities or expected rates of death and injury in a given situation can be determined statis-
9

tically. In the cases studied here, the means of 25000 cases are taken.
The basic configuration which is modeled is a line of vehicles, each behind the next. Barri-ers are present: vehicles remain in line whatever happens. At time zero all vehicles have the samespeed: the initial incident causes messages to be sent to vehicles behind, starting braking at a maxi-mum or graded rate (if the latter is less).
The model is an event-based analytic model. The motion of each vehicle or v-mass can bedescribed by a quadratic function of time between events. A v-mass is either a free vehicle orseveral vehicles which have collided, and remain in contact. Events are of three kinds:
i. a vehicle starts to brake. ii. a vehicle or v-mass comes to rest.iii. a vehicle or v-mass strikes its predecessor.
After an event, the equation of motion of the relevant v-masses changes. In the model, atany time, the time of the next event of each kind for each v-mass is calculated. The first of theseevents will occur. After an event, the equations of motion of the affected v-masses are recalculated,and so are the times of subsequent events. The process continues until all v-masses are at rest.
When a collision occurs, the vehicle at the front of the colliding v-mass suffers its firstinstantaneous reduction in speed. All collisions are inelastic, so that v-masses, once formed, moveas a single rigid body. The value of delta-V is recorded. Delta-V is the change in speed of thevehicle on impact, and hence the relative speed of vehicle and occupants after impact.
Probability of injury. The mechanism by which an occupant may be injured by contact with theinside of a vehicle after a sudden change in speed is clearly dependent on many variables, such asthe occupant’s age and the precise position he/she assumed at the moment of impact. We cannotknow these things but if we make observations of many similar past impacts, the probabilitiesdeduced will apply in the future, since the occupants’ and vehicle’s characteristics are drawn fromthe same population. As explained above, the severity of the impact is measured by the magnitudeand direction of delta-V. Provided the passenger compartment is not breached and the occupantstays in it, no other parameter can be relevant.
The National Center for Statistics and Analysis (an office of NHTSA) provided data for allvehicles with front damage only involved in accidents recorded in the Crashworthiness Data Sys-tem (CDS) in the years 1990 and 1991. This related numbers of vehicles involved in accidents withgiven delta-V to the maximum severity of injury suffered by any occupant. Severity was measuredin the clinically-attested Abbreviated Injury Scale (AIS) (see AAAM, 1980). In what follows wemostly count what the clinicians term “moderate injuries”—AIS 2. These, very roughly are injurieswhich cause hospitalization for several days but are not life-threatening. A compound fracture, inwhich broken ends of bone are exposed to the air, is AIS 2. A simple fracture is not. AIS 2 injuriesare roughly one-seventh of injuries described as “serious” in Police Accident reports.
Further information about the treatment of the CDS data, including the formulas relatingprobabilities of death or injury at different AIS levels to delta-V is given in Hitchcock 1993a. It iswell attested, e.g. in Ricci 1980, that when the delta-V change corresponds to a blow from the rear,injuries are much less serious. Injuries arising in this way were ignored in this work.
10

RESULTS OF CALCULATIONS
Longitudinal control failure. The only failures of longitudinal control which can generate accidentsare ones in which a vehicle’s acceleration changes abruptly, or will not change when this is neces-sary. If a vehicle runs out of gas, for example, it will slow down, but so slowly that followingvehicles can also slow without collision. We have already pointed out that proper design of de-graded modes can ensure that such violent events as collision of two platoons can be discounted(Hitchcock 1992).
If then, a vehicle accelerates without warning, it may collide with the vehicle immediatelyahead. If it is in a platoon, this is not serious, since the relative speed is small. If it is a platoonleader, or otherwise well behind its predecessor, the fault detection mechanism can apply the brakes(an independent function) or switch off the engine. In no case does a serious danger arise.
If a vehicle loses the power to brake, the fault detection mechanism may turn off the engine.If, because there is no immediate effect on the vehicle motion, the fault is not detected, there willalmost inevitably be casualties in the accident on exit. It will therefore be important to detect thiscondition. If it occurs one should switch off the engine. However, the detection mechanism maywell fail until the brake is activated. It will therefore also be important to design the automaticbraking system in a “fail-safe” manner, so that the failure is dominantly to the other extreme—brakes locked on.
It thus becomes important to examine the consequences when the brakes are fully appliedwithout warning. This is the “fail-safe” mode of the longitudinal control system. As indicated above,should the vehicle accelerate uncontrollably, the failure detection and malfunction managementsystem will adopt this condition.
The results below are expressed in terms of casualty rates per vehicle, AIS ≥ 2. Where thisis meaningful we express the results as functions of flow in vehicles/hr. In the case of AICC andCICC, where long lines are formed, the casualty rates are the same at all flows with a given vehiclespacing: we then express the results as a function of capacity, which also depends on the spacing. Ifno fatalities occur we shall call the curve “green”. If the fatality rate is less than 1% of the casualtyrate, AIS ≥ 2, we shall term the curve “yellow” and otherwise “red”.
Effect of speed. The results reported in this paper are for a speed of 30 m/s (≈ 68 mph). Some valuesfor wet conditions are given in the figures but are not always included in the tables. In Hitchcock1994 results for a speed of 25 m/s (≈ 56 mph) are also reported. together with fuller results in wetconditions. The effect of speed, over the range 25 - 30 m/s is small and may be in either direction.At given capacity, if speed is reduced, the platoon size increases. This increases the number ofcollisions. The resulting increase in casualties is offset against the reduction which occurs becausedelta-V values are less.
Platoons. We consider platoons with spacings of 1 m, 4 m, and 10 m, with the numbers of platoonsper km chosen to give roughly equal capacities. For the 10 m spacing, in particular, this leads toplatoons with numbers of vehicles which are perhaps unrealistic. 6000 veh/hr is, at best, very closeto the limit of what is possible with this spacing. Figure 5 and table 1 show the results.
In all cases, the casualty rate per 100 incidents increases, roughly linearly, with flow. All thecases are insensitive to the distinction between dry and wet conditions and also to speed in the
11

range of interest. It seems that, at these speeds, the effect of increased speed in increasing delta-Vsand in reducing platoon length cancel out. As Shladover’s (1978) work suggested, both the num-bers and the severity of casualties are least at the least intraplatoon spacing.
Figure 5. Casualties, C, (AIS ≥ 2) per 100 incidents, platoons in dr y weather . The 1 m gap cur ve is“green”, the others are “yellow”.
Table 1. Capacity and casualty rates at capacity: platoons.
Spacing Plats/km* Speed Capacity Casualties (AIS ≥ 2) (m) (m/s) (Vehicles/h) per 100 incidents
dry wet 1.0 8(7.5) 30 6480 0.27 1.37 4.0 4(18.9) 30 8180 1.18 3.3410.0 2(28.0) 30 6040 1.55 6.72
The curve for 1 m spacing is green, the others yellow.* No of vehicles per platoon
PFC. Figure 6 shows the results for PFC configurations. Some of them are also shown in table 2,which gives parameters describing the different configurations. We have explained above that inthis case we assume that the system imposes “unselfish” braking behavior. Each vehicle, on hearingthat there has been heavy braking i vehicles ahead, itself brakes (if it can) with the deceleration itcalculates will bring it to rest i vehicle lengths behind the failure.
This rule implies that the control system uses an implied ƒ-values for the failed vehicle tocompute its own deceleration. Figure 6 is drawn on a logarithmic scale because of the very largedifferences that errors here can make.
(wet)1 m gap
4 m gap
10 m gap
C
Flow: vehicles/hour50000
1.0
12

50000
0.1
1.0
10.0
100.0 dry: wet cont.
dry: self cont. wet:dry cont.
wet:wet cont.
dry:dry cont.
C
Flow: vehicles/hourFigure 6. Casualties, C, (AIS ≥ 2) per 100 incidents. Point follower control, slot length 15 m. Thecross indicates capacity. See text for meaning of labels.
Again, the casualty rates per 100 failures increase roughly linearly with flow. We first con-sider the case where the conditions are “dry”, and the vehicles, in calculating their braking ratescorrectly identify the range of ƒ-values of vehicles on the road (0.3 to 0.75 in “dry” conditions).This produces casualty rates (AIS ≥ 2) less than the 1-meter platooned case. Their severity is a littlegreater, however, for this is a yellow case. In “wet” conditions the accident rate is increased four-fold, again on the basis that the control systems correctly identify the range of ƒ-values present.
If the conditions are wet, but the control system incorrectly uses the “dry” values to com-pute desired decelerations, (wet: dry cont.” in figure 6) the casualty rate is more than doubled overthe well-organized “wet” conditions—a ten-fold increase over the “dry” values. This curve is red.In the reverse condition, where conditions are in fact dry, but the control system calculates on thebasis of a “wet” range (dry: wet cont.” in figure 6), the increase in casualty rates is over 250-fold,and, again, the curve is red.
In practice, it may be difficult for the central system (and PFC is controlled from the infra-structure) to “know” just what are the appropriate conditions at every point in the network. Thelarge effects of errors here, are therefore not academic. There may be solutions based on vehicle-based observations of local conditions. We tested here the one in which each vehicle can measureits own ƒ-value, and assumes that the failed vehicle has the same value. This does not work: in dryconditions it produces a 50-fold increase in the casualty rate and a red curve (“dry: self cont.” infigure 6). There may be better solutions: we have not been able to find them.
13
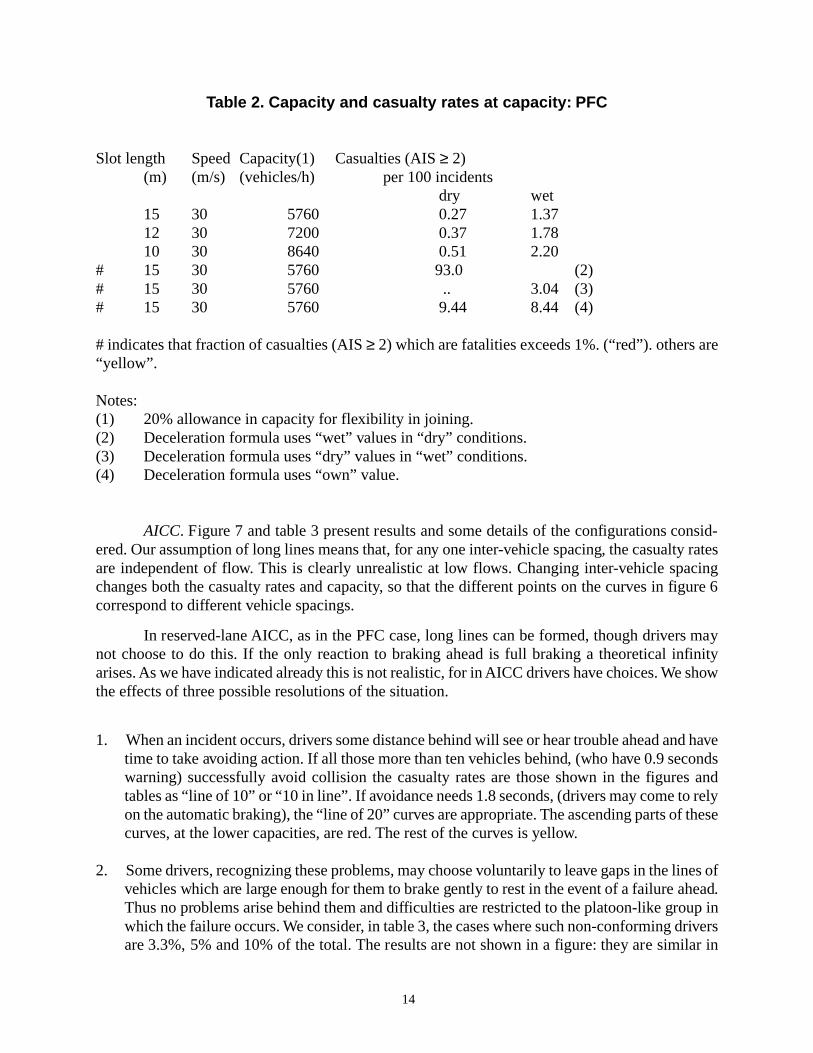
Table 2. Capacity and casualty rates at capacity: PFC
Slot length Speed Capacity(1) Casualties (AIS ≥ 2)(m) (m/s) (vehicles/h) per 100 incidents
dry wet15 30 5760 0.27 1.3712 30 7200 0.37 1.7810 30 8640 0.51 2.20
# 15 30 5760 93.0 (2)# 15 30 5760 .. 3.04 (3)# 15 30 5760 9.44 8.44 (4)
# indicates that fraction of casualties (AIS ≥ 2) which are fatalities exceeds 1%. (“red”). others are“yellow”.
Notes:(1) 20% allowance in capacity for flexibility in joining.(2) Deceleration formula uses “wet” values in “dry” conditions.(3) Deceleration formula uses “dry” values in “wet” conditions.(4) Deceleration formula uses “own” value.
AICC. Figure 7 and table 3 present results and some details of the configurations consid-ered. Our assumption of long lines means that, for any one inter-vehicle spacing, the casualty ratesare independent of flow. This is clearly unrealistic at low flows. Changing inter-vehicle spacingchanges both the casualty rates and capacity, so that the different points on the curves in figure 6correspond to different vehicle spacings.
In reserved-lane AICC, as in the PFC case, long lines can be formed, though drivers maynot choose to do this. If the only reaction to braking ahead is full braking a theoretical infinityarises. As we have indicated already this is not realistic, for in AICC drivers have choices. We showthe effects of three possible resolutions of the situation.
1. When an incident occurs, drivers some distance behind will see or hear trouble ahead and havetime to take avoiding action. If all those more than ten vehicles behind, (who have 0.9 secondswarning) successfully avoid collision the casualty rates are those shown in the figures andtables as “line of 10” or “10 in line”. If avoidance needs 1.8 seconds, (drivers may come to relyon the automatic braking), the “line of 20” curves are appropriate. The ascending parts of thesecurves, at the lower capacities, are red. The rest of the curves is yellow.
2. Some drivers, recognizing these problems, may choose voluntarily to leave gaps in the lines ofvehicles which are large enough for them to brake gently to rest in the event of a failure ahead.Thus no problems arise behind them and difficulties are restricted to the platoon-like group inwhich the failure occurs. We consider, in table 3, the cases where such non-conforming driversare 3.3%, 5% and 10% of the total. The results are not shown in a figure: they are similar in
14

shape to the line-of-10 and line-of-20 curves shown in the figures discussed above, and again,the part corresponding to spacings exceeding 20-30 meters is red, while the rest is yellow.
Table 3. Capacity and casualty rates at capacity: AICC.(These values apply at all flows.)
Veh’e Speed Cap’y(1) Casualties (AIS ≥ 2)spacing per 100 incidents
line of vehs voluntary gaps graded(m) (m/s) (veh/h) 20 10 10% 5% 3.3% brakingDry Conditions.#50 30 1570* 0.38 0.19 0.09 0.20 0.28#45 30 1730* 0.04#40 30 1920* 0.90 0.41 0.21 0.44 0.69#35 30 2160* 0.16#30 30 2470 1.80 0.76 0.40 0.88 1.35#25 30 2880 0.40 20 30 3460 2.42 1.18 0.58 1.24 1.86 15 30 4320 2.22 10 30 6480 2.41 1.16 0.58 1.23 1.86 ** 5 30 8640 4.73 2.16 1.06 3.22 3.60 **Wet Conditions#50 30 1570 1.84 0.87 0.43 0.92 1.41#45 30 1730 0.17 15 30 4320 8.00 10 30 6480 12.55 5.77 2.80 6.14 9.52 22.8 5 30 8640 11.15 4.96 2.26 5.25 8.39 **
Notes:(1) An allowance of 20% is made to allow spaces to enter.In cases marked # the fatality rate exceeds 1% of the number given (red). In other cases it is lessthan this but non-zero (yellow).* These values are less than present manual capacity.** “Infinite”—see text.
3. We also consider the possibility of an automated “graded” braking, in which each vehicle inthe 0.09 seconds before braking is supposed to detect the deceleration of the vehicle ahead ofit, and choose a deceleration which will cause it to come to rest just behind its predecessor, onthe basis that its speed does not change suddenly. As the figures show, this is an improvementover the other strategies at low capacity, but it does not contain the theoretical infinity at highercapacities. The curve is red.
There may be other automated strategies which are superior to the “graded” one chosen.Our search for one was not successful.
In all cases, but especially in “wet” conditions, casualty rates in an AICC-only configura-tion are many times more numerous, and more severe, than is the case for 1-meter spaced platoons.
15

The effect is particularly large if spacings are reduced so as to approach the capacities characteristicof platooned systems.
30 m/s25 m/s 20 in line
graded
Capacity: vehicles/hour50000
10 in line
5.0
C
CICC. CICC operation is similar to platooned operation in the form of communication, but withlarger spaces between vehicles. It is similar to AICC in the tendency to form long lines, and thedependence with long lines of casualty rates on capacity, rather than flow.
One use of CICC which is put forward from time to time is as an introductory stage toplatooning: groups of CICC vehicles, separated by within-group spaces of 10-40 m and largerinter-group spaces will run on partially automated lanes (no lateral control?). For this reason wegive below results for such configurations with mean group numbers of 10, 15 and 20 vehicles. Wealso give results for lines of 10 and 20 vehicles behind the failure, and for graded braking.
The results are given in table 4. Casualty rates are lower than with AICC, but show similartrends. In particular the range which is of interest in an introductory AHS is, regrettably, the rangeof maximum casualty rates. Unlike the AICC case, however, graded braking is effective here in thecases shown, which use dry values of coefficients of friction in the formula which uses the pre-dicted slowing of the first vehicle to compute its own deceleration rate. If an error is made inpredicting this, the results are similar to those shown in table 2.
Intruders from a relevant accident. In order to demonstrate the need for dividers, we calculate thecasualty rates due to “relevant accidents” (Anwar & Jovanis, 1993) on that 12-mile section of theSanta Monica freeway which was studied by those authors. The model used to calculate the effectswas basically the same as that discussed above for longitudinal control failures. The same correla-tions between casualty probabilities and delta-v was used as discussed above, the same distributionof coefficients of friction, and same delay times on braking in the different control modes. Theconfiguration studied was of a freeway whose manual lanes are similar in geometry and flow to theSanta Monica Freeway on 17 Sept 1992 (the date for which data was obtained) However an auto-mated lane has been added, on which there is a traffic flow equal to 40% of the manual flow, hourby hour throughout the day. We report deaths on the AL per 100 MVMT on the AL due to second-
Figure 7. Casualties, C, (AIS ≥ 2) per 100 incidents. AICC. Dry conditions.
16

ary accidents following a “relevant accident”. The calculation is for each control mode. Speed onthe AL is 30 m/s (67 mph). We allow for 20 wet days per year, which is believed to be roughlycorrect for Los Angeles. Further details are reported in Hitchcock 1993a.
Table 4. Capacity and casualty rates: CICC
Veh’e Speed Cap’y(1) Casualties (AIS ≥ 2)spacing per 100 incidents
line of vehs groups (2) graded(m) (m/s) (veh/h) 20 10 10 15 20 braking 10 30 7200 2.14 1.02 0.50 0.76 1.06 0.38 15 30 5400 2.18 1.09 0.53 0.83 1.13 0.26 20 30 4320 2.19 1.09 0.51 0.75 0.57 0.17#30 30 3090 1.40 0.69 0.37 0.57 0.79 0.10#40 30 2400 0.71 0.34 0.18 0.28 0.37 0.06
Notes:(1) No allowance for flexibility for entry: values for vehicle groups somewhat less, depending oninter-group spacing.In cases marked # the fatality rate exceeds 1% of the number given (red). In other cases it is lessthan this but non-zero (yellow).
The results are given in table 5. It will be seen that the effect of increasing the length of theline affected is not great. The initial collisions of the first and second vehicles which strike theintruder are severe, and the bulk of the deaths occur in these two. After that, the v-mass has acquireda significant speed along the line of the AL, and subsequent collisions are less often fatal. Theplatooned case has a lower casualty rate largely because there are gaps between platoons, and if theintruder enters the AL here the platoon has a chance to slow down.
It may be asked why a similar death rate is not observed now. Deaths in secondary colli-sions following a relevant accident do occur now, but in smaller numbers because:
a. Speed in the left lane of the Santa Monica freeway does not always exceed 60 mph.
b. Flow on this lane is not 6000 veh/h now.
c. A manual driver will receive earlier warning of an intrusion than the AHS. The latter canonly detect (or so we assume) intrusion on to the AL. A driver will hear the accident, andwill take avoiding action if the debris is crossing his/her path.
The intruder is taken, in the calculations, to be a car. Anwar & Jovanis do not report thenumber of intruders that were trucks. In private discussion, the authors explained that the numberwas around 5 per year: too small to be statistically satisfactory for prediction, but not zero. Calcu-lations indicate that with a 40,000 lb truck the death rate per incident increases between five- andten-fold. The increase depends on the weight of the intruder. The extent to which a barrier wouldcontain a truck, however, is uncertain, and a great deal more data about relevant accidents would beneeded to work this out.
17
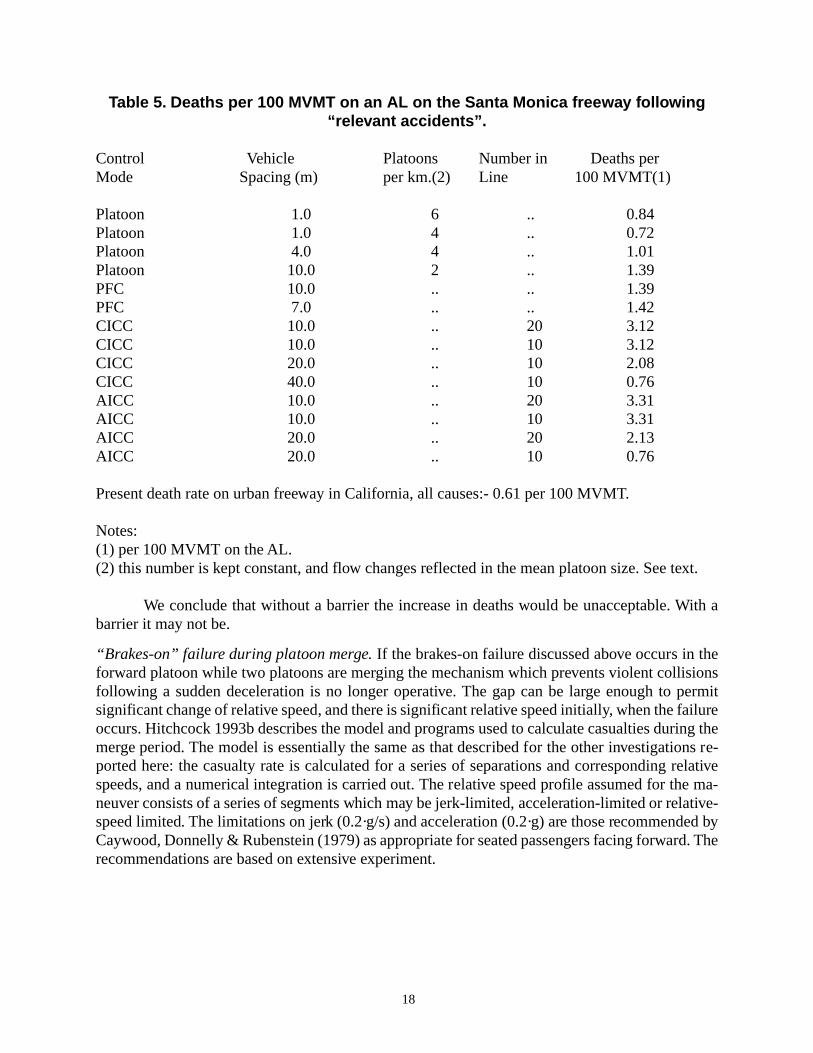
Table 5. Deaths per 100 MVMT on an AL on the Santa Monica freeway following“relevant accidents”.
Control Vehicle Platoons Number in Deaths perMode Spacing (m) per km.(2) Line 100 MVMT(1)
Platoon 1.0 6 .. 0.84Platoon 1.0 4 .. 0.72Platoon 4.0 4 .. 1.01Platoon 10.0 2 .. 1.39PFC 10.0 .. .. 1.39PFC 7.0 .. .. 1.42CICC 10.0 .. 20 3.12CICC 10.0 .. 10 3.12CICC 20.0 .. 10 2.08CICC 40.0 .. 10 0.76AICC 10.0 .. 20 3.31AICC 10.0 .. 10 3.31AICC 20.0 .. 20 2.13AICC 20.0 .. 10 0.76
Present death rate on urban freeway in California, all causes:- 0.61 per 100 MVMT.
Notes:(1) per 100 MVMT on the AL.(2) this number is kept constant, and flow changes reflected in the mean platoon size. See text.
We conclude that without a barrier the increase in deaths would be unacceptable. With abarrier it may not be.
“Brakes-on” failure during platoon merge. If the brakes-on failure discussed above occurs in theforward platoon while two platoons are merging the mechanism which prevents violent collisionsfollowing a sudden deceleration is no longer operative. The gap can be large enough to permitsignificant change of relative speed, and there is significant relative speed initially, when the failureoccurs. Hitchcock 1993b describes the model and programs used to calculate casualties during themerge period. The model is essentially the same as that described for the other investigations re-ported here: the casualty rate is calculated for a series of separations and corresponding relativespeeds, and a numerical integration is carried out. The relative speed profile assumed for the ma-neuver consists of a series of segments which may be jerk-limited, acceleration-limited or relative-speed limited. The limitations on jerk (0.2·g/s) and acceleration (0.2·g) are those recommended byCaywood, Donnelly & Rubenstein (1979) as appropriate for seated passengers facing forward. Therecommendations are based on extensive experiment.
18

Table 6. Casualties during merge per 100 incidents
Platoon Max. rel. Gap to N Merge Deaths AIS ≥ 2Speed speed. close Duration (m/s) m/s m. s30 None 80 12 13.7 0.08(0) 15.6(1.36)30 None 80 10 14.6 0.08 13.730 None 80 8 14.6 0.08(0) 11.9(1.06)30 5 80 10 19.5 0.01 3.630 2 80 10 42.0 ** 1.330 None 120 10 16.5 0.23 16.530 5 120 10 27.5 0.01 2.830 2 120 10 62.0 ** 1.230 None 6 10 4.6 0 2.730 None 12 10 6.0 0 4.310 None 48 3* 8.8 0 0.9 5 None 48 3* 8.8 0 0.2 2 None 48 3* 8.8 0 0
* one vehicle merging with two ahead.** less than 0.01.N is the total number of vehicles involved: leading and trailing platoons are each of N/2 vehicles.Number in brackets is number with no merge: for N = 10, speed = 30 m/s; Deaths = zero, AIS ≥ 2= 1.14.
Table 6 gives some selected results. In some cases a limitation has been placed on themaximum closing speed of the merging platoon. The imposition of a limitation reduces the numberof casualties per merge. If the failure can occur at any time, the risk of casualties is proportional to(casualties/merge)•(merge duration). This also decreases as the relative-speed limitation becomesmore restrictive, but less markedly.
Even if no merges take place over the normal interplatoon gap, there may still have to bemerges over one or more car lengths after a vehicle has left the platoon. The table shows that amerge over one car length is significantly superior to one over two lengths.
The last three entries, with reduced speeds, show that preplatoon formation at the entranceto the EML can indeed be made as safe as is wished by doing it at reduced speed. The precise speedprofiles and strategies for preplatoon formation require further study. The ones implied here areprobably not the best.
CONSEQUENCES FOR AHS CONFIGURATION AND OPERATION
Our preferred layout (see figure 1) has the properties that the results above demonstrate tobe necessary:
19

a. It does separate manual and automated vehicles on the high-density AL. Automated vehicleson that part of the TL to which manual vehicles have access have reduced speeds, and for thecritical maneuver of preplatoon formation, the speed is very low indeed.
b. It uses close-spaced platoons.
c. It has high barriers between AL and TL, and low ones between ALs, which are so designed thatthey will not generate severe casualties if a failure of lateral control causes a vehicle to hit themend-on. There are no “gates” (no moving parts) in the high barriers, and gates in the low barri-ers are protected from manual-vehicle accident debris by the high ones.
d. It can be operated without merging of platoons over distances exceeding one car length, as thefollowing description of the operation shows.
Maneuvers in operation. Since there is no merging of platoons over the interplatoon spacing, thenumber of platoons per unit distance is constant: variations are reflected in changes in mean pla-toon size. It would be convenient, though not necessary for safety, if platoons moved so that thedistance between platoon leaders remained almost constant. Even if a platoon happened to becomeempty there would be no changes in relative position of the leaders: entering vehicles could reformthe platoon by entering the large gap.
On the ALs, if there were more than one, speeds would be equal in both lanes. Vehicleswould move from one platoon to another which lay beside it: a gap, length one vehicle plus spac-ings, would open in the receiving platoon opposite the mover, which would transfer at a convenientgate. This process is very rapid, and, according to the criterion described by Hall 1993, (and unpub-lished work by the author) does not limit capacity, even if many changes are needed.
At exit, supposing several vehicles have to leave one platoon there is a succession of gates:the most forward of the vehicles to leave does so by the first gate. The gap is closed before the nextvehicle leaves at the second gate. Following exit, vehicles are braked to a speed suitable to the TLand separated by safe distances before leaving the narrow XML (f igure 1c), where they are offeredmanual control.
At entry, the reverse process to exit involves unsafe following distances—vehicles would beaccelerating towards each other rather than braking. Therefore as each vehicle enters it is assignedto the first platoon that it can join. Platoons are some 6-10 s apart: it is possible that more than onevehicle will be assigned to the same platoon. Each is brought to a very low speed, or to rest, andfollowing vehicles merge with it (safe at low speed) forming a preplatoon. At the right moment acontroller (this may be vehicle- or infrastructure-borne) gives the word to an appropriate number ofmembers of the preplatoon to accelerate. They coordinate with the platoon so that they arrive at anentry gate with the platoon’s speed just as the last vehicle in the platoon has passed. They join, as aplatoon, through the gate on to the rear of the AL platoon, which thus does not have to divide toaccept them.
Low barriers. The safety case for the low barrier arises only in fault conditions. If one lane has beenbrought to rest, it is desirable on capacity and fault recovery grounds that the trouble be confined toone lane, so that others can be used. Also, in the same conditions, a lateral control failure in theoperating lane would cause death and injury if it led to collision with stationary vehicles in the
20

adjacent lane. This said, it is clear that the case for these barriers is less strong than for the otherfeatures we have described.
CONCLUSIONS
The configuration of the “preferred” AHS, shown in figure 1, and the mode of operationdescribed here, conform to the safety principles which have been demonstrated to be desirable. Inthe case of the barriers, the danger which is guarded against is external, so that these are alwaysnecessary. In the case of the longitudinal control failures, high reliability of the control system is analternative. It is easily seen that a configuration which gave x casualties (AIS ≥ 2) per 100 incidentswould generate casualties at less than 1% of the current rate (and so be negligible) if the failure rateper vehicle per thousand years were less than 0.3/x. This corresponds to a mean time betweenfailures of 4·105·x hours. We have seen that for configurations other than the preferred one, whichhave acceptably high capacities, x is typically in the range 1.5 to 5. Vehicle failures of the wrongkind would have to occur less than once per 10,000 vehicle-years. That is, mean times betweenfailures of 106 operating hours should be envisaged. Given that the quality of maintenance receivedby private cars is indeterminate, this would represent a challenge to the automobile manufacturer,which could conceivably be met. Alternatively, the configuration of figure 1 diminishes the re-quired standard of reliability by a factor exceeding ten.
A note on mixed-flow AICC. Mixed-flow AICC may be a precursor to full AHS and is therefore ofinterest. In this scheme AICC vehicles and normal ones travel in the same lane, and lines of AICCvehicles form behind manually controlled ones. Brake control system failures in an AICC vehicleaffect any following AICC vehicles. If the next manual vehicle is following too closely, it, too maybe involved in any resulting collisions, but we are here concerned with accidents to automatedvehicles, and ignore this.
Mixed-flow AICC does lead to some increase in capacity which cannot approach what isultimately required unless the fraction of all vehicles in the lane which are AICC vehicles is veryhigh. Casualties per incident also depend on the fraction of all vehicles in the lane which are AICC.Up to a value of this fraction, no matter what spacing is chosen for AICC operation, the casualtyrate (AIS ≥ 2) in the automated vehicles remains below 0.4 per 100 incidents at 30 m/s. At thisvalue, if the AICC vehicles follow closely, capacities up to about 4000 veh/hr can be attained. Asthe fraction rises towards one, however, the casualty rates per incident rise rapidly. The AIS ≥ 2 ratecan exceed 1.5 per 100 incidents at a penetration of 83%.
Mixed-flow AICC therefore does not present the same dangers to its users as AICC on areserved lane. Mixed flow AICC is not compatible with dividers, and no calculations on these lineshave been made.
ACKNOWLEDGMENTS
This work was performed as part of the program of California PATH of the University ofCalifornia, in cooperation with the State of California Business, Transportation and Housing Agency’sDepartment of Transportation, and the United States Department of Transportation’s Federal High-way Administration and National Highway Traffic Safety Administration.
21

The contents of this report reflect the views of the author, who is responsible for the factsand the accuracy of the data presented herein. The contents do not necessarily reflect the officialviews or policies of the State of California. The report does not constitute a standard, specificationor regulation.
The author’s thanks are due to:
Mr. Mohammed Anwar and Professor Paul P. Jovanis, University of California (Davis) for gather-ing the data about relevant accidents on the Santa Monica Freeway. This was gathered from theState of California’s Traffic Accident Surveillance and Analysis System.
Ms. Tonya Linsey, National Highway Safety Traffic Administration, for providing, from the Crash-worthiness Data System, the data relating injuries to delta-V and for data about the masses ofvehicles involved in collisions.
REFERENCES
Anwar, M., & Jovanis, P. P., “Assessing the Safety Benefits of Automated Freeways” Draft Thesis,University of California (Davis), 1993.
AAAM (American Association for Automotive Medicine; Committee on Injury Scaling) “TheAbbreviated Injury Scale: 1980 revision”. Morton Grove, IL 1980.
Caywood, W.C., Donnelly, H.L., and Rubenstein, N “Guideline for Ride-Quality SpecificationsBased on Transpo ’72 Test Data”, John Hopkins Report APL/JHU CP-060/TPR-039, Silver Spring,MD, (1977)
Hall, R., “Longitudinal and Lateral Throughput on an Idealized Highway”, PATH Tech. Memo. 93/15, Berkeley CA 1993.
Hitchcock, A. “Methods for Analysis of IVHS Safety”, PATH Research Report UCB-ITS-PRR-92-14, Berkeley, CA, 1992.
Hitchcock, A., “An Example of Quantitative Evaluation of IVHS Safety.” Pacific Rim TransTechConference, proceedings, Vol 1, pp 380-6. Seattle, WA, 1993a.
Hitchcock, A., “Casualties in Accidents Occurring During Split and Merge Maneuvers”, PATHTech Memo 93/9 (Revised) Berkeley, CA 1993b.
Hitchcock, A., “Intelligent Vehicle/Highway System Safety: Multiple Collisions in AHS Systems.”Path Technical Report to be published, Berkeley, CA, 1994
Ricci, L. L., “NCSS Statistics: Passenger Cars” DOT HS-805 531, Springfield, VA, 1980
Shladover, S. E., “Dynamic Entrainment of Automated Guideway Transit Vehicles”. High SpeedGround Transportation Journal, Vol 12, No. 3 pp 87-113, 1978.
22