lcsa - june 8, 2012. continue the use of data for dialogue and decision-making support compliance...
TRANSCRIPT

Lenawee Data PackagesLCSA - June 8, 2012

Why do we want to offer this service?
• Continue the use of data for dialogue and decision-making
• Support compliance reporting for Comprehensive Needs Assessment and School Improvement planning

How are the packages organized?
• Major Question
• Data Representations
• Dialogue Questions– Observations
– Inferences

Data Driven Dialogue
Predictions
Observations
Inferences
Adapted from Deb Clancy, Washtenaw ISD, 2008, based upon the work of Nancy Love, “Using Data/Getting Results” (2002)

Elementary Example
• Observations– What percentage of
our students were at levels 1 and 2?
– At which level of performance do we have the most students?
• Inferences– What school processes by
adults might explain the students’ achievement?
– What next steps should be taken to address this achievement?

Secondary Example
• Observations– Which strands were our
strengths on the test? – Which strands were our
weaknesses on the test?
• Inferences– What school processes by
adults might explain the students’ achievement?
– What next steps should be taken to address this achievement?
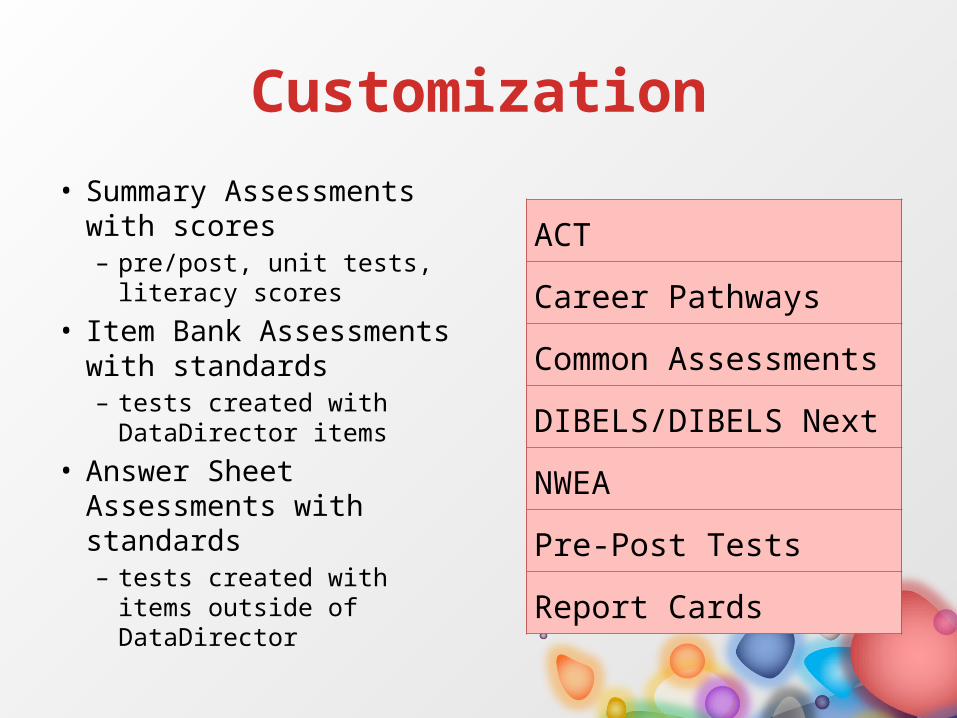
Customization
• Summary Assessments with scores– pre/post, unit tests,
literacy scores
• Item Bank Assessments with standards– tests created with
DataDirector items
• Answer Sheet Assessments with standards– tests created with items
outside of DataDirector
ACT
Career Pathways
Common Assessments
DIBELS/DIBELS Next
NWEA
Pre-Post Tests
Report Cards

EXPLORE to PLAN PredictionsUsing EXPLORE Scores to Predict Future PLAN Scores
Highest
Probability High Medium Low Lowest
Probability
10-11 Expected 10-11 Expected 10-11 Expected 10-11 Expected
EXPLORE PLAN EXPLORE PLAN EXPLORE PLAN EXPLORE PLAN
Lastname Firstname English English Reading Reading Mathematics Mathematics Science Science
19 19-23 12 13-16 16 17-20 16 17-20
12 13-16 11 12-15 16 17-20 16 17-20
20 20-24 19 19-23 17 18-21 17 18-21
20 20-24 15 16-19 15 16-19 17 18-21
18 19-23 16 17-20 19 19-23 18 19-23
15 16-19 14 15-18 17 18-21 16 17-20
12 13-16 15 16-19 18 19-23 18 19-23
8 10-13 10 11-14 10 11-14 12 13-16
11 12-15 12 13-16 7 10-13 15 16-19
9 10-13 10 11-14 13 14-17 12 13-16
13 14-17 12 13-16 16 17-20 16 17-20
11 12-15 11 12-15 14 15-18 14 15-18
12 13-16 9 10-13 14 15-18 13 14-17

Pre/Post Item Analysis
Q1 Q2 Q3 Q4 Q5 Q6 Q7 Q8 Q9Q10
Q11Q12
Q13Q14
Q15Q16
Q17Q18
Q19Q20
Q21Q22
Q23Q24
Q25Q26
Q27Q28
Q29-diviso
n
Q29-divden
d
Q29-quotient
Q30Q31
Q32Q33
0.0%
10.0%
20.0%
30.0%
40.0%
50.0%
60.0%
70.0%
80.0%
90.0%
100.0%
43.5%39.1%
56.5%
21.7%
52.2%
34.8%39.1%
8.7%
87.0%
43.5%47.8%
4.3%
26.1%
65.2%
21.7%
34.8%
52.2%47.8%
26.1%
47.8%43.5%
52.2%
4.3%
17.4%
26.1%
60.9%
30.4%
60.9%65.2%
69.6%73.9%
43.5%
52.2%56.5%
73.9%
2011-2012 Grade 3Chapter 7 Math
Pre/Post Classroom Growth, by Question

DIBELS Distribution Summary
Student Group
# Students
Nonsense Word Fluency Oral Reading FluencyPhoneme Segmentation
Fluency
All Students
63
Deficit 0 0.00% At Risk 2 3.17% Deficit 0 0.00%
Emerging 2 3.17%Some Risk 10 15.87% Emerging 1 1.59%
Established 61 96.83%Low Risk 51 80.95% Established 62 98.41%

Performance Level
Scaled Score
Understanding Statewide Reports
Domain/ Standard Score
Benchmark/ GLCE Score
Written Curriculum Alignment
Analysis of Performance
Task
Analysis of Student Learning
VALIDITY

‘Mining’ at Different Levels of Student Learning
“X” representsopportunities
Fall 2009
Fall 2010
Fall 2011
Statewide Assessment
(MEAP)X X X
Interim Assessment
(NWEA, DIBELS, DRA, STAR)
X X X X X X X X X
Classroom Assessment(Unit tests, common
writings with rubrics)
XXX
XXX
XXX
XXX
XXX
XXX
XXX
XXX
XXX

Complementing Your Data Entree

Pairings of Data
• Performance Level data with MEAP/MME– “On Track” designation
with PLAN or EXPLORE– Threshold designation
on interim assessments

3rd Grade Reading Readiness
Last FirstSTAR EOY 10-11
Grade Equivalency3.24
3.12.73.13.63.93.92.90
Fall 2011MEAP PL
3222222133
Pairings of Data
• Scaled Scores data with MEAP/MME– Scale Scores with
PLAN or EXPLORE– Scale Scores on
Interim Assessments

NWEA RIT and MEAP Math
Last FirstFall 2011MEAP SS
623644648643627632639609623601
Spring 10-11Test RIT Score
210
217
216
234
202
204
224
178
206
202

Pairings of Data
• Standards data with MEAP/MME– Subarea scores with
PLAN or EXPLORE– Goal scores on
Interim Assessments– Standards data on
local assessments

Fall PreTest and Spring MME
Fall 2011 PreTest Spring 2012 MME
MATH A1 MATH A2 MATH L2 Math A1 Math A2 Math L2
Number of Questions 5 3 5 11 5 8
First Last20% 0% 20% 18 60 3840% 100% 80% 100 60 5060% 100% 20% 82 40 500% 67% 60% 45 40 3820% 0% 0% 18 60 3840% 67% 0% 55 20 6360% 100% 20% 100 60 880% 33% 20% 45 20 3820% 0% 20% 82 80 8840% 0% 0% 64 60 5060% 67% 40% 82 80 500% 67% 20% 73 40 630% 67% 60% 82 20 380% 67% 20% 45 40 5040% 67% 80% 82 40 7540% 67% 20% 36 40 38

Pairings of Data
• Expectations data with MEAP– Item Analysis scores
with EXPLORE– Item Analysis on
local assessments

Classroom Test and MEAP GLCE
Classroom Test MEAPWHG 1.2.1
WHG 2.1.4
WHG 3.1.9
WHG 3.2.3 W1.2.1 W2.1.4 W3.1.9 W3.2.3
Q1 Q2 Q3 Q4 Q8 Q9 Q11 Q13Name
Y N N N Y N N NY Y Y Y Y N Y YY Y Y Y Y Y Y YY Y Y Y Y N Y NY Y Y Y N Y N NN N N Y Y N Y YY Y Y Y Y Y Y YY Y Y Y Y N Y YY Y Y Y Y Y Y YY Y Y Y Y Y Y NY Y Y Y Y N N NN N N N Y Y Y YY N N N Y Y N Y
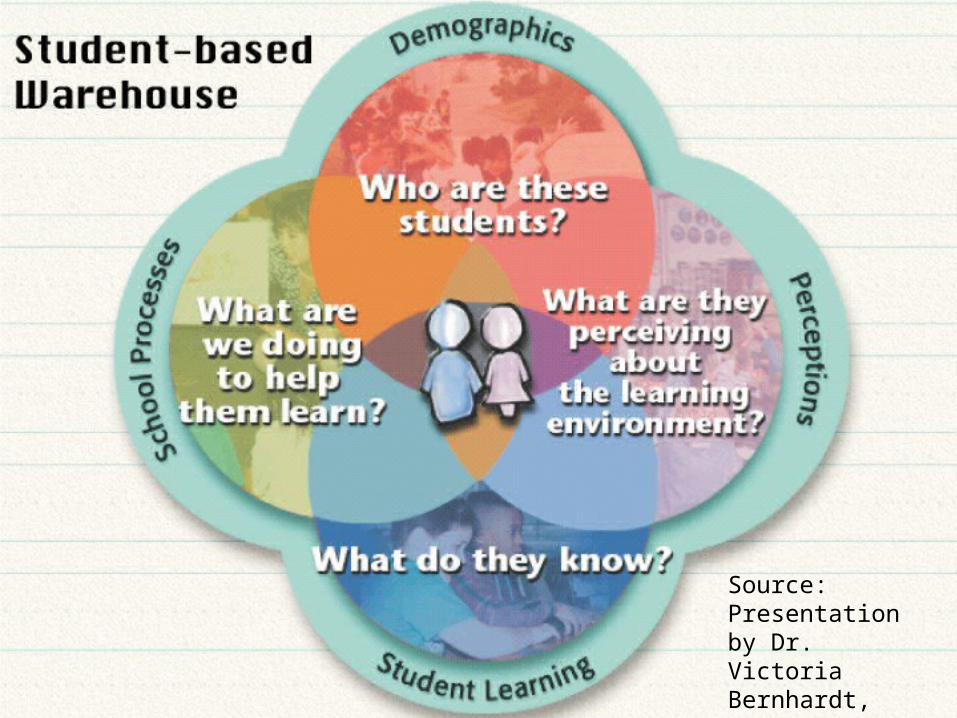
Source: Presentation by Dr. Victoria Bernhardt, April 2007