leadership change that matters: a value and momentum story
TRANSCRIPT
QUANTAMENTAL RESEARCH BRIEF JANUARY 2021
Authors
Liam Hynes
Capital Market Product Specialists
(44) 20 7176 2191
David Pope, CFA MD Quantamental Research
617.530.8112
Daniel J. Sandberg, PhD, CFA
Quantamental Research
212.438.1407
Leadership Change That Matters: A Value and Momentum Story
Markets rotate between types of stocks when investment attributes fall in and out of favor. By
at least one indicator, the rotation from momentum to value which began last summer appears
to be aging. Cheap stocks (value stocks) earned a premium over stocks with high prior returns
(momentum stocks) across the globe in the second half of 2020. Value stocks have historically
outperformed momentum stocks when the volatility of returns to momentum is elevated, a
previously documented1 relationship that has held globally.
• The volatility associated with momentum began to climb in June 2020, peaked in
November, and has declined since. Value outperformed momentum over the same
time.
• Volatility remains at elevated levels, indicating that the rotation may continue until
momentum again resumes its leadership.
• Investors should monitor how the volatility of momentum evolves as value stocks
have historically led until the volatility of returns to momentum returns to normal.
Current volatility remains at high levels, not seen since the Great Financial Crisis.
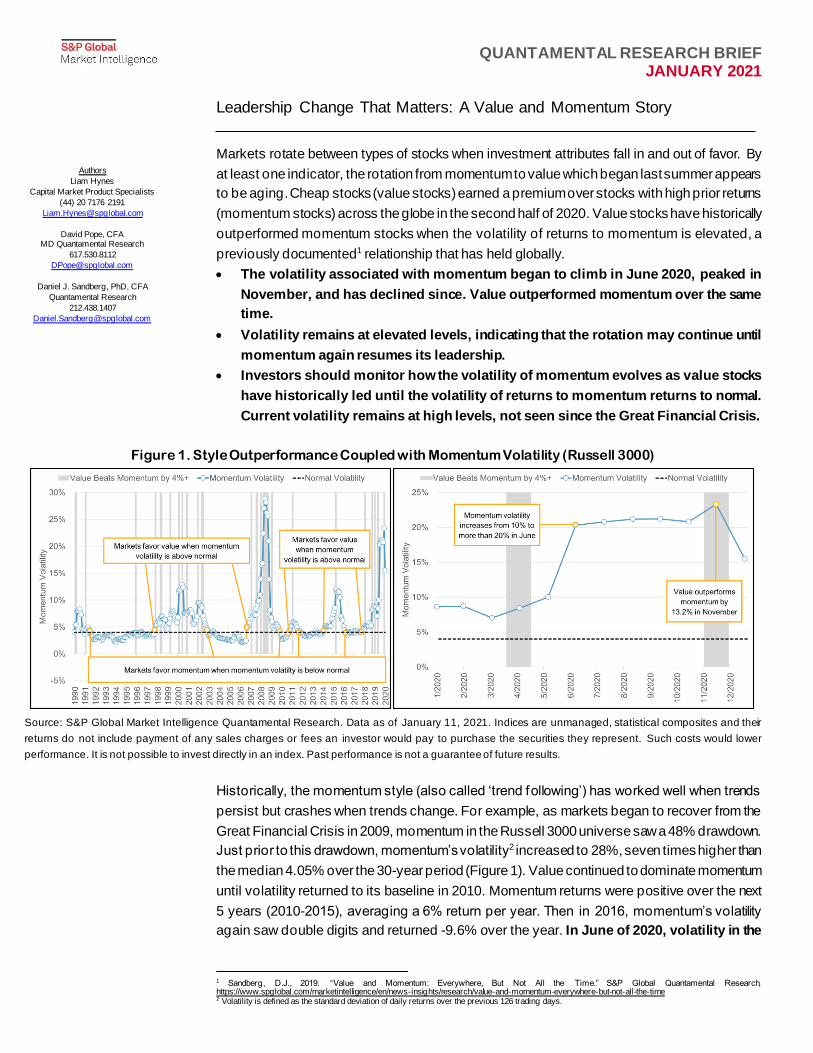
Figure 1. Style Outperformance Coupled with Momentum Volatility (Russell 3000)
Source: S&P Global Market Intelligence Quantamental Research. Data as of January 11, 2021. Indices are unmanaged, statistical composites and their
returns do not include payment of any sales charges or fees an investor would pay to purchase the securities they represent. Such costs would lower
performance. It is not possible to invest directly in an index. Past performance is not a guarantee of future results.
Historically, the momentum style (also called ‘trend following’) has worked well when trends
persist but crashes when trends change. For example, as markets began to recover from the
Great Financial Crisis in 2009, momentum in the Russell 3000 universe saw a 48% drawdown.
Just prior to this drawdown, momentum’s volatility2 increased to 28%, seven times higher than
the median 4.05% over the 30-year period (Figure 1). Value continued to dominate momentum
until volatility returned to its baseline in 2010. Momentum returns were positive over the next
5 years (2010-2015), averaging a 6% return per year. Then in 2016, momentum’s volatility
again saw double digits and returned -9.6% over the year. In June of 2020, volatility in the
1 Sandberg, D.J., 2019. “Value and Momentum: Everywhere, But Not All the Time.” S&P Global Quantamental Research, https://www.spglobal.com/marketintelligence/en/news-insights/research/value-and-momentum-everywhere-but-not-all-the-time 2 Volatility is defined as the standard deviation of daily returns over the previous 126 trading days.

QUANTAMENTAL RESEARCH BRIEF JANUARY 2021 2
WWW.SPGLOBAL.COM/MARKETINTELLIGENCE
momentum style reached levels that have not been seen since the Great Financial
Crisis. The value style outperformed the momentum style in the second half of 2020 by
more than 10%. Volatility in momentum remains near its highs as of year-end 2020,
which has historically indicated additional upside to value stocks.
Figure 2. Value and Momentum Style Performance (Left) and Momentum Volatility (Right), Global Regions
Source: S&P Global Market Intelligence Quantamental Research. Data as of January 11, 2021.
A similar rotation, favoring value stocks over momentum stocks, has been seen in most
regions of the world (Figure 2, lef t). Momentum volatility has increased globally (Figure 2,
right): in the Russell 3000 index, momentum breached 15% in June, a level not seen since
the Great Financial Crisis; in the Developed Europe BMI, volatility reached all-time highs over
the study period; in the Developed Asia (ex-Japan) BMI and in the Japan BMI, volatility
reached levels not seen since 2009; and levels in the Emerging Markets BMI and Latin
America (LATAM) BMI are at 5- and 3-year highs, respectively.
Many top momentum names (f irst quantile), such as Apple (APPL +46.01%), Alphabet
(GOOGL +23.6%), and Amazon (AMZN +18.1%), had positive double digit returns for the
second half of 2020. In the Russell 3000, the long side of the momentum style returned 28.1%
from June 30, 2020 through December 31, 2020. However, the short side did better at 47.1%,
breaking the momentum strategy. Many of the ‘momentum underdogs’ (stocks in the bottom
quantile ranked by the momentum factor) are considered top value stocks (stocks in the top
quantile ranked by the value factor). Some of these ‘high value momentum underdogs’ had
notable performance in the second half of 2020, such as home storage product provider The
Container Store (TCS +194.4%); home comfort and security solutions provider Resideo
Technologies (REZI +81.4%); financial services and car finance provider Ally Financial (ALLY
+82.8%); and non-invasive depression therapy provider Neuronetics (STIM 475.7%).
However, the rotation was driven by more than just a few names. The median 6-month return,
a measure less impacted by outliers than the average return, for stocks in the top quantile of
momentum was 17.8% whereas the bottom quantile return was 36.2%.
QUANTAMENTAL RESEARCH BRIEF JANUARY 2021 3
WWW.SPGLOBAL.COM/MARKETINTELLIGENCE
Value and Momentum Style Portfolios
The value investment style involves buying (sell) stocks that have a low (high) price relative
to some intrinsic value; whereas the momentum investment style involves buying (sell) stocks
that have performed well (poorly) over some previous period. In the implementation used here,
value stocks were scored by the ratio of the company’s book value to its market value;
momentum stocks were scored by the trailing 12-month return less the trailing one-month
return. All stocks are ranked and quantiled3 relative to the other securities in the same sector.4
A style portfolio is then formed from equally-weighted long positions in the top quantile stocks
and equally-weighted short positions in the bottom quantile stocks, rebalanced monthly. 23
Data
This research utilizes S&P Global’s Alpha Factor Library and Compustat Point-in-Time
Fundamentals. Alpha Factor Library includes 500 stock selection and industry-specific signals
spanning seminal academic literature and S&P Global’s Quantamental Research articles.
Signals cover a global universe of over 40,000 securities including both Developed and
Emerging Markets. Compustat Point-in-Time Fundamentals provides financial statement data
and common ratios with history back to 1950 and point-in-time snapshots since 1987.
Conclusion
A previously published metric that has historically signaled a rotation out of the momentum
style and into the value style, successfully signaled the momentum-to-value rotation that
occurred in the last quarter of 2020. The signal, increased volatility in the momentum style
portfolio, has been heavily favoring value since June 2020 in six geographies. Historically,
increased volatility in the momentum style preceded a decline in momentum returns. The
market participants using this indicator would have seen a signal to overweight value and
underweight momentum for the second half of 2020. This research brief details the indicator
values and timing of the rotation that occurred in 2020 and shows that the mechanics of the
rotation, i.e. outperformance of the short side of the momentum style and long side of the
value style, were consistent with previous rotations. Historically, value has continued to
outperform momentum until the volatility of returns in the momentum portfolio returns to
baseline.
3 Top (bottom) quantile represents the 20% of names in the universe with the most (least) attractive factor value after ranking within the same sector. 4 Global Industry Classification Standard (GICS) Level 1.

QUANTAMENTAL RESEARCH BRIEF JANUARY 2021 4
WWW.SPGLOBAL.COM/MARKETINTELLIGENCE
Our Recent Research
December 2020: Warranted Optimism: Sentiment vs. Supply Chains
December 2020: A Dark Winter for REITs: Trouble Brewing
October 2020: Sweet Spots in the C-Suite: Executive Best Practices for Shareholder
Friendly Firms
The Business Roundtable, an association of CEOs of America’s leading companies, published
a new statement on corporate responsibility in August 2019. The statement identifies five
important corporate stakeholders: customers, employees, suppliers, communities and
shareholders.1 This report highlights four key types of executive policy that drive value
creation for stakeholders: profitability vs. growth decisions, mergers & acquisitions policy,
return of cash to shareholders, and insider stock ownership. In it, we demonstrate empirically
those practices that increase corporate value over time, thereby rewarding shareholders,
employees, and other stakeholders. These practices also form a scorecard by which
stakeholders can evaluate whether or not management is undertaking actions likely to
increase corporate prosperity.
October 2020: Just the (Build)Fax: Property Intelligence from Building Permit Data
August 2020: The Analyst Matrix: Profiting from Sell-Side Analysts’ Coverage Networks
Sell-side analyst coverage data provides a new and rich source of establishing connections
between f irms, as analysts (given their industry expertise) are likely to cover fundamentally
related f irms. This report uses sell-side analysts’ coverage data to build a connected-firm
network (CFN) - a portfolio of companies that are covered by analyst(s) that follow a focal firm.
This network has three broad applications: measuring the “strength” of economic relationships
between companies; forecasting fundamentals of companies in the network; and as a stock
selection signal.
June 2020: The Information Supply Chain Begins Recovering From COVID
May 2020: Never Waste a Crisis: Following the Smart Money Through Beneficial
Ownership Filings
May 2020: Risky Business: Foot Traffic, Vacancy Rates and Credit Risks
May 2020: Finding the Healthy Stocks in Health Care During Lockdown
May 2020: No More Walks in the (Office) Park: Tying Foot Traffic Data to REITs
QUANTAMENTAL RESEARCH BRIEF JANUARY 2021 5
WWW.SPGLOBAL.COM/MARKETINTELLIGENCE
May 2020: Do Markets Yearn for the Dog Days of Summer: COVID, Climate and
Consternation
April 2020: Cold Turkey - Navigating Guidance Withdrawal Using Supply Chain Data
April 2020: Data North Star - Navigating Through Information Darkness
March 2020: Long Road to Recovery: Coronavirus Lessons from Supply Chain and
Financial Data
COVID-19 continues to disrupt global supply chains in unprecedented ways. Leveraging
maritime shipping data f rom Panjiva, this report includes a review of trade and f inancial data
to analyze the impact of the SARS-CoV-2 / COVID-19 coronavirus outbreak. Findings include:
• Second-order supply chain effects are also emerging with the apparel industry now seeing
a shortage of materials globally due to earlier outages in China.
• Retailers including Costco and Target are gaining f rom increased sales of health- and
personal care products. Yet, supply shortages are rapidly emerging in part due to medical
supply export restrictions in several countries.
• There is a notable, but not statistically significant, relationship with f irms with higher
exposure to Asia having seen a weaker sector neutral stock price performance.
February 2020: Ship to Shore: Mapping the Global Supply Chain with Panjiva Shipping
Data in Xpressfeed™
World merchandise trade accounted for an estimated $19.7 trillion in 2018, about 90% of
which is by sea. While financial data tells us “how a company has done in the past,” shipping
data provides a closer-to-real time indicator of “what a company is doing now.” Panjiva’s
shipping data allows investors to track trends, identify anomalies, and assess risks for
companies engaged in international trade. This paper illustrates how to f ind investment
insights in Panjiva’s US seaborne and Mexican datasets using the US auto parts industry as
a case study.
Findings include:
• Shipment trends of ten lead fundamentals: Rising shipments amid f lat or declining
fundamentals may signal future financial trend reversal
• Growth in the number of a company's suppliers and in the types of products it imports
may signal strengthening demand and/or product line diversification.
• Tracking industry-level product-line trends can help identify companies with significant
exposure to rising or declining product lines.

QUANTAMENTAL RESEARCH BRIEF JANUARY 2021 6
WWW.SPGLOBAL.COM/MARKETINTELLIGENCE
January 2020: Natural Language Processing – Part III: Feature Engineering Applying
NLP Using Domain Knowledge to Capture Alpha from Transcripts
Unstructured data is largely underexplored in equity investing due to its higher costs. One
particularly valuable unstructured data set is S&P Global Market Intelligence’s machine
readable earnings call transcripts.
• Topic Identification – Firms that referenced the most positive descriptors around their
f inancials outperformed historically.
• Transparency – Firms that provided greater call transparency exhibited by executives’
behaviors and decisions outperformed historically.
• Weighted Average Sentiment – Quantifying call sentiment using a weighted average
construct led to better returns and less volatility historically.
• Additive Forecasting Power – The newly introduced signals demonstrated additive
forecasting power above commonly used alpha and risk signals historically.
December 2019: The “Trucost” of Climate Investing: Managing Climate Risks in Equity
Portfolios
October 2019: #ChangePays: There Were More Male CEOs Named John than Female
CEOs
June 2019: Looking Beyond Dividend Yield: Finding Value in Cash Distribution
Strategies
June 2019: The Dating Game: Decrypting the Signals in Earnings Report Dates
May 2019: Bridges for Sale: Finding Value in Sell-Side Estimates, Recommendations,
and Target Prices
February 2019: U.S Stock Selection Model Performance Review
February 2019: International Small Cap Investing: Unlocking Alpha Opportunities in an
Underutilized Asset Class
January 2019: Value and Momentum: Everywhere, But Not All the Time
November 2018: Forging Stronger Links: Using Supply Chain Data in the Investing
Process
September 2018: Their Sentiment Exactly: Sentiment Signal Diversity Creates Alpha
Opportunity
QUANTAMENTAL RESEARCH BRIEF JANUARY 2021 7
WWW.SPGLOBAL.COM/MARKETINTELLIGENCE
September 2018: Natural Language Processing – Part II: Stock Selection: Alpha
Unscripted: The Message within the Message in Earnings Calls
July 2018: A Case of ‘Wag the Dog’? - ETFs and Stock-Level Liquidity
June 2018: The (Gross Profitability) Trend is Your Friend
May 2018: Buying the Dip: Did Your Portfolio Holding Go on Sale?
March 2018: In the Money: What Really Motivates Executive Performance?
February 2018: The Art of the (no) Deal: Identifying the Drivers of Canceled M&A Deals
January 2018: U.S Stock Selection Model Performance Review
September 2017: Natural Language Processing - Part I: Primer
July 2017: Natural Language Processing Literature Survey
June 2017: Research Brief: Four Important Things to Know About Banks in a Rising
Rate Environment
April 2017: Banking on Alpha: Uncovering Investing Signals Using SNL Bank Data
March 2017: Capital Market Implications of Spinoffs
January 2017: U.S. Stock Selection Model Performance Review 2016
November 2016: Electrify Stock Returns in U.S. Utilities
October 2016: A League of their Own: Batting for Returns in the REIT Industry - Part 2
September 2016: A League of their Own: Batting for Returns in the REIT Industry - Part 1
August 2016: Mergers & Acquisitions: The Good, the Bad and the Ugly (and how to tell
them apart)
July 2016: Preparing for a Slide in Oil Prices -- History May Be Your Guide
June 2016: Social Media and Stock Returns: Is There Value in Cyberspace?

QUANTAMENTAL RESEARCH BRIEF JANUARY 2021 8
WWW.SPGLOBAL.COM/MARKETINTELLIGENCE
April 2016: An IQ Test for the “Smart Money” – Is the Reputation of Institutional
Investors Warranted?
March 2016: Stock-Level Liquidity – Alpha or Risk? - Stocks with Rising Liquidity
Outperform Globally
February 2016: U.S. Stock Selection Model Performance Review - The most effective
investment strategies in 2015
January 2016: What Does Earnings Guidance Tell Us? – Listen When Management
Announces Good News
November 2015: Late to File - The Costs of Delayed 10-Q and 10-K Company Filings
October 2015: Global Country Allocation Strategies
September 2015: Research Brief: Building Smart Beta Portfolios
September 2015: Research Brief – Airline Industry Factors
August 2015: Point-In-Time vs. Lagged Fundamentals – This time i(t')s different?
August 2015: Introducing S&P Capital IQ Stock Selection Model for the Japanese
Market
July 2015: Research Brief – Liquidity Fragility
May 2015: Investing in a World with Increasing Investor Activism
April 2015: Drilling for Alpha in the Oil and Gas Industry – Insights from Industry
Specific Data & Company Financials
February 2015: U.S. Stock Selection Model Performance Review - The most effective
investment strategies in 2014
January 2015: Research Brief: Global Pension Plans - Are Fully Funded Plans a Relic
of the Past?
January 2015: Profitability: Growth-Like Strategy, Value-Like Returns - Profiting from
Companies with Large Economic Moats

QUANTAMENTAL RESEARCH BRIEF JANUARY 2021 9
WWW.SPGLOBAL.COM/MARKETINTELLIGENCE
October 2014: Lenders Lead, Owners Follow - The Relationship between Credit
Indicators and Equity Returns
July 2014: Factor Insight: Reducing the Downside of a Trend Following Strategy
May 2014: Introducing S&P Capital IQ's Fundamental China A-Share Equity Risk Model
April 2014: Riding the Coattails of Activist Investors Yields Short and Long Term
Outperformance
March 2014: Insights from Academic Literature: Corporate Character, Trading Insights,
& New Data Sources
February 2014: Obtaining an Edge in Emerging Markets
February 2014: U.S Stock Selection Model Performance Review
January 2014: Buying Outperformance: Do share repurchase announcements lead to
higher returns?
October 2013: Informative Insider Trading - The Hidden Profits in Corporate Insider
Filings
September 2013: Beggar Thy Neighbor – Research Brief: Exploring Pension Plans
August 2013: Introducing S&P Capital IQ Global Stock Selection Models for Developed
Markets: The Foundations of Outperformance
July 2013: Inspirational Papers on Innovative Topics: Asset Allocation, Insider Trading
& Event Studies
June 2013: Supply Chain Interactions Part 2: Companies – Connected Company
Returns Examined as Event Signals
June 2013: Behind the Asset Growth Anomaly – Over-promising but Under-delivering
April 2013: Complicated Firms Made Easy - Using Industry Pure-Plays to Forecast
Conglomerate Returns.
March 2013: Risk Models That Work When You Need Them - Short Term Risk Model
Enhancements

QUANTAMENTAL RESEARCH BRIEF JANUARY 2021 10
WWW.SPGLOBAL.COM/MARKETINTELLIGENCE
March 2013: Follow the Smart Money - Riding the Coattails of Activist Investors
February 2013: Stock Selection Model Performance Review: Assessing the Drivers of
Performance in 2012
January 2013: Research Brief: Exploiting the January Effect Examining Variations in
Trend Following Strategies
December 2012: Do CEO and CFO Departures Matter? - The Signal Content of CEO and
CFO Turnover
November 2012: 11 Industries, 70 Alpha Signals -The Value of Industry-Specific Metrics
October 2012: Introducing S&P Capital IQ's Fundamental Canada Equity Risk Models
September 2012: Factor Insight: Earnings Announcement Return – Is A Return Based
Surprise Superior to an Earnings Based Surprise?
August 2012: Supply Chain Interactions Part 1: Industries Profiting from Lead-Lag
Industry Relationships
July 2012: Releasing S&P Capital IQ’s Regional and Updated Global & US Equity Risk
Models
June 2012: Riding Industry Momentum – Enhancing the Residual Reversal Factor
May 2012: The Oil & Gas Industry - Drilling for Alpha Using Global Point-in-Time
Industry Data
May 2012: Case Study: S&P Capital IQ – The Platform for Investment Decisions
March 2012: Exploring Alpha from the Securities Lending Market – New Alpha
Stemming from Improved Data
January 2012: S&P Capital IQ Stock Selection Model Review – Understanding the
Drivers of Performance in 2011
January 2012: Intelligent Estimates – A Superior Model of Earnings Surprise
December 2011: Factor Insight – Residual Reversal
November 2011: Research Brief: Return Correlation and Dispersion – All or Nothing
QUANTAMENTAL RESEARCH BRIEF JANUARY 2021 11
WWW.SPGLOBAL.COM/MARKETINTELLIGENCE
October 2011: The Banking Industry
September 2011: Methods in Dynamic Weighting
September 2011: Research Brief: Return Correlation and Dispersion
July 2011: Research Brief - A Topical Digest of Investment Strategy Insights
June 2011: A Retail Industry Strategy: Does Industry Specific Data tell a different story?
May 2011: Introducing S&P Capital IQ’s Global Fundamental Equity Risk Models
May 2011: Topical Papers That Caught Our Interest
April 2011: Can Dividend Policy Changes Yield Alpha?
April 2011: CQA Spring 2011 Conference Notes
March 2011: How Much Alpha is in Preliminary Data?
February 2011: Industry Insights – Biotechnology: FDA Approval Catalyst Strategy
January 2011: US Stock Selection Models Introduction
January 2011: Variations on Minimum Variance
January 2011: Interesting and Influential Papers We Read in 2010
November 2010: Is your Bank Under Stress? Introducing our Dynamic Bank Model
October 2010: Getting the Most from Point-in-Time Data
October 2010: Another Brick in the Wall: The Historic Failure of Price Momentum
July 2010: Introducing S&P Capital IQ’s Fundamental US Equity Risk Model
Copyright © 2021 by S&P Global Market Intelligence, a division of S&P Global Inc. All
rights reserved.
These materials have been prepared solely for information purposes based upon
information generally available to the public and from sources believed to be reliable. No
content (including index data, ratings, credit-related analyses and data, research, model,

QUANTAMENTAL RESEARCH BRIEF JANUARY 2021 12
WWW.SPGLOBAL.COM/MARKETINTELLIGENCE
sof tware or other application or output therefrom) or any part thereof (Content) may be
modified, reverse engineered, reproduced or distributed in any form by any means, or
stored in a database or retrieval system, without the prior written permission of S&P
Global Market Intelligence or its affiliates (collectively, S&P Global). The Content shall not
be used for any unlawful or unauthorized purposes. S&P Global and any third -party
providers, (collectively S&P Global Parties) do not guarantee the accuracy,
completeness, timeliness or availability of the Content. S&P Global Parties are not
responsible for any errors or omissions, regardless of the cause, for the results obtained
f rom the use of the Content. THE CONTENT IS PROVIDED ON “AS IS” BASIS. S&P
GLOBAL PARTIES DISCLAIM ANY AND ALL EXPRESS OR IMPLIED WARRANTIES,
INCLUDING, BUT NOT LIMITED TO, ANY WARRANTIES OF MERCHANTABILITY OR
FITNESS FOR A PARTICULAR PURPOSE OR USE, FREEDOM FROM BUGS,
SOFTWARE ERRORS OR DEFECTS, THAT THE CONTENT’S FUNCTIONING WILL
BE UNINTERRUPTED OR THAT THE CONTENT WILL OPERATE WITH ANY
SOFTWARE OR HARDWARE CONFIGURATION. In no event shall S&P Global Parties
be liable to any party for any direct, indirect, incidental, exemplary, compensatory,
punitive, special or consequential damages, costs, expenses, legal fees, or losses
(including, without limitation, lost income or lost profits and opportunity costs or losses
caused by negligence) in connection with any use of the Content even if advised of the
possibility of such damages.
S&P Global Market Intelligence’s opinions, quotes and credit-related and other analyses
are statements of opinion as of the date they are expressed and not statements of fact
or recommendations to purchase, hold, or sell any securities or to make any investment
decisions, and do not address the suitability of any security. S&P Global Market
Intelligence may provide index data. Direct investment in an index is not possible.
Exposure to an asset class represented by an index is available through investable
instruments based on that index. S&P Global Market Intelligence assumes no obligation
to update the Content following publication in any form or format. The Content should not
be relied on and is not a substitute for the skill, judgment and experience of the user, its
management, employees, advisors and/or clients when making investment and other
business decisions. S&P Global Market Intelligence does not act as a f iduciary or an
investment advisor except where registered as such. S&P Global keeps certain activities
of its divisions separate f rom each other in order to preserve the independence and
objectivity of their respective activities. As a result, certain divisions of S&P Global may
have information that is not available to other S&P Global divisions. S&P Global has
established policies and procedures to maintain the confidentiality of certain non-public
information received in connection with each analytical process.
S&P Global may receive compensation for its ratings and certain analyses, normally from
issuers or underwriters of securities or f rom obligors. S&P Global reserves the right to
disseminate its opinions and analyses. S&P Global's public ratings and analyses are
made available on its Web sites, www.standardandpoors.com (f ree of charge) and
www.ratingsdirect.com (subscription), and may be distributed through other means,

QUANTAMENTAL RESEARCH BRIEF JANUARY 2021 13
WWW.SPGLOBAL.COM/MARKETINTELLIGENCE
including via S&P Global publications and third-party redistributors. Additional information
about our ratings fees is available at www.standardandpoors.com/usratingsfees.