leadership in collaborative governance: understanding the
TRANSCRIPT

Virginia Commonwealth University Virginia Commonwealth University
VCU Scholars Compass VCU Scholars Compass
Theses and Dissertations Graduate School
2014
Leadership in collaborative governance: Understanding the Leadership in collaborative governance: Understanding the
relationship of leadership and collaborative performance of Local relationship of leadership and collaborative performance of Local
Departments of Social Services executives Departments of Social Services executives
Jennifer Behrens Virginia Commonwealth University
Follow this and additional works at: https://scholarscompass.vcu.edu/etd
Part of the Public Affairs, Public Policy and Public Administration Commons
© The Author
Downloaded from Downloaded from https://scholarscompass.vcu.edu/etd/3341
This Dissertation is brought to you for free and open access by the Graduate School at VCU Scholars Compass. It has been accepted for inclusion in Theses and Dissertations by an authorized administrator of VCU Scholars Compass. For more information, please contact [email protected].

© Jennifer E. Behrens, MSW, PhD 2014
All Rights Reserved

LEADERSHIP IN COLLABORATIVE GOVERNANCE:
UNDERSTANDING THE RELATIONSHIP OF LEADERSHIP AND
COLLABORATIVE PERFORMANCE OF LOCAL DEPARTMENTS OF SOCIAL
SERVICES EXECUTIVES
A dissertation submitted in partial fulfillment of the requirements for the degree of
Doctor of Philosophy at Virginia Commonwealth University.
by
Jennifer Elizabeth Behrens
Bachelor of Arts, University of Virginia, 1999
Master of Social Work, Virginia Commonwealth University, 2006
Director: Dr. William C. Bosher,
Distinguished Professor
Public Policy and Education
Virginia Commonwealth University
Virginia Commonwealth University
Richmond, Virginia
April 2014

ii
Dedication
This dissertation is dedicated to my family for their unwavering support and belief in me
throughout this incredible journey – my parents, Syble Isbister & Patrick Downs and James &
Wanda Isbister; my sister, Chrissy Peterson; my brother, Shane Allen; and my children,
Rebeccah and Susannah.

iii
Acknowledgements
Accomplishing this study was not a feat of simply my own. My method of continued forward
momentum throughout my doctoral program and final dissertation was a series of four steps: put
my head down, do my homework, show up for the next class, try to act pleasant. Then, repeat.
And, repeat. And, repeat. The steps are inherently simple. However, I could never have
traveled the course of those steps (over and over again) if it were not for the guidance, inspiration
and support of several people. Therefore, I would like to acknowledge their role in my success.
Starting a doctoral program takes a great deal of belief in one’s own capacity and capability. My
parents, Syble Isbister and Patrick Downs, provided enduring support that my best was more
than enough to succeed in the doctoral program, as well as in life.
Staying in a doctoral program certainly requires well-timed doses of humor and perspective. I
am forever grateful to my sister and her husband, Chrissy and Pat Peterson, and to my brother,
Shane Allen, for providing a steady supply of both.
Finishing a doctoral program takes a significant amount of commitment and perseverance. My
parents, James and Wanda Isbister, inspired these qualities in me. And for those, I was able to
repeat the four basic steps over and over again until I crossed the finish line.
I would be remiss if I did not acknowledge the other people who inspired my walk along the
doctoral journey. First, I am forever in admiration of the Distinguished Professor Dr. William
C Bosher. I am grateful and appreciative beyond words of Dr. Bosher’s guidance, support,
occasional kick-in-the-pants, and unconditional belief in me throughout the dissertation study
process and through my doctoral degree program progress.
The additional members of my dissertation committee also need acknowledgement for their
contribution to my success. I thank Dr. Barrack for his continued expression of excitement of
the relevancy of this research to contemporary practice. His insights into the application of
collaboration as a tool of modern governance was invaluable and encouraging. I thank Dr.
Burke for his careful consideration of my presentation of the theoretical underpinnings and
framework of my study. His feedback propelled me toward a more robust study, and expanded
my scope of consideration with the topics and presentation of content. I thank Dr. Jin for his
constructive guidance and teaching of new statistical analysis methods. With his teaching, I was
able to learn additional research and statistical analysis techniques, and to incorporate them into
this study to improve the meaningfulness to the academic and practice fields.

iv
I would like to express my appreciation of the Virginia League of Social Services Executives,
for their participation in the study and for their expressed interest in learning from the results.
Notably, I sincerely appreciate the support of the VLSSE President, Carl Ayers. His ready
response to my many requests for information is as appreciated as his continued dedication to
serving the residents of the Commonwealth of Virginia.
I also want to thank Kathy Ralston, Director of Albemarle County Department of Social
Services, for her inspiring example of a successful leader within contemporary public
administration. Her knowledge, her compassion, her spirit, her risk-taking, her strength, her
empowerment and her sharing are all qualities which I admire. I hope that everyone has the
opportunity to work with such a wonderful leader in their lifetime.
And, finally, I thank several people who have time and again defined and exemplified the
meaning of friendship to me over the last several years: Cheryl Armstrong, Melicca Dunn,
Kendall Tyree, and Kevin Wasilewski. I could never have survived this process if it were not
for their friendship and love, and I am forever their friend.
Without these people in my life, and more than likely additional others I have overlooked in this
brief acknowledgement, I would never have been able to put my head down, do my homework,
show up for the next class, or try to act pleasant. For these people, I was able to (usually) make
my way through each of those simple steps and accomplish the great feat of completing the
following dissertation. Thank you.

v
Table of Contents
List of Tables ix
List of Figures xii
Abstract xiii
Introduction 1
Statement of the Problem 3
Rationale for the Study of the Problem 6
Purpose of the Study and Research Questions 7
Definitions, Assumptions, and Limitations of the Study 12
Methodology 15
Organization of the Study 16
Summary 17
Literature Review 20
Introduction 20
Theoretical Context 21
The role of collaboration in present-day government 30
Collaborative governance 33
Leadership 40
Importance of leadership within collaborative governance 47

vi
Virginia League of Social Services Executives 53
Measuring leadership within collaborative governance 55
Summary 57
Methodology 59
Introduction 59
Research Questions and Hypotheses 61
Research Design 62
Sampling 65
Measurement 68
Variables and Statistics 70
Reliability and Validity 74
Data Analysis 76
Mitigating Threats to Reliability and Validity 77
Summary 78
Results 79
Introduction 79
Demographic Data 84
Results 89
VLSSE Perception of Collaboration 90
Leadership Orientation of VLSSE 93

vii
Leadership Style of VLSSE 103
Relationship of Leadership Style and Leadership Orientation 111
Control Variables 113
Summary 116
Conclusion 135
Introduction and summary 133
Connection between literature and findings 134
Implications and recommendations for further study 136
Implications and recommendations for the VLSSE 138
Implications for field of public administration and policy 139
Conclusion 140
References 143
Appendices
Appendix A 152
Appendix B 154
Appendix C 156
Appendix D 158
Appendix E 164
Appendix F 166
Appendix G 168

viii
Appendix H 169
Appendix I 172
Appendix J 175
VITA 179

ix
List of Tables
1. Table 3.1 Survey Distribution Model 64
2. Table 3.2 Research Variables 71
3. Table 4.1 Participant Demographics 88
4. Table 4.2 VLSSE Demographics 89
5. Table 4.3 Mean Score of Perception of Collaboration 91
6. Table 4.4 Perception of Collaboration: Frequencies of Items Above and
Below Breakpoint 92
7. Table 4.5 Leadership Orientation of Respondents 93
8. Table 4.6 Factor Loadings for Principal Component Analysis of
Leadership Orientation 94
9. Table 4.7 Linear Regression Model: Leadership Orientation Factors
and Perception of Collaboration 95
10. Table 4.8 Moderated Regression Analysis of Performance Satisfaction
on Leadership Orientation and Perception of Collaboration 98
11. Table 4.9 Coefficients of Moderated Regression Analysis of
Performance Satisfaction on Leadership Orientation and
Perception of Collaboration 99
12. Table 4.10 Plot Analysis Variables and Coefficients for

x
Moderated Regression of Leadership Orientation
“Interactions with Others” and Performance Satisfaction 100
13. Table 4.11 Plot Analysis Variables and Coefficients for
Moderated Regression of Leadership Orientation
“Personal Attitude” and Performance Satisfaction 102
14. Table 4.12 Leadership Practices Inventory Frequencies 103
15. Table 4.13 LPI Frequencies of Behaviors 104
16. Table 4.14 LPI Highlight Frequencies 105
17. Table 4.15 Linear Regression Model: Leadership Style and
Perception of Collaboration 105
18. Table 4.16 Moderated Regression Analysis of Performance
Satisfaction on Leadership Style and Perception of Collaboration 106
19. Table 4.17 Coefficients of Moderated Regression Analysis
of Performance Satisfaction on Leadership Style and
Perception of Collaboration 107
20. Table 4.18 Plot Analysis Variables and Coefficients for
Moderated Regression of Leadership Style and Leadership Satisfaction 108
21. Figure 4.19 Moderated Regression Analysis of Performance
Satisfaction on Leadership Style and Perception of Collaboration 109
22. Table 4.20 Coefficients of Moderated Regression Analysis

xi
of Performance Satisfaction on Leadership Style and
Perception of Collaboration 109
23. Table 4.21 Plot Analysis Variables and Coefficients for
Moderated Regression of Leadership Style and Performance Satisfaction 110
24. Table 4.22 LPC and LPI Correlation Matrix 113
25. Table 4.23 Leadership Orientation Control Variable Analysis 115
26. Table 4.24 Leadership Style Control Variable Analysis 116
27. Table 4.25 LPC Reliability Analysis 121
28. Table 4.26 LPC Item-Total Statistics 122
29. Table 4.27 LPI – Self Reliability Analysis 123
30. Table 4.28 LPI – Self Inter-Item Correlation Matrix 124
31. Table 4.29 LPI – Self Item-Total Statistics 125
32. Table 4.30 Collaboration Audit Reliability Analysis 126
33. Table 4.31 Collaboration Audit Item-Total Statistics 127
xii
List of Figures
1. Figure 2.1 Collaboration Framework 35
2. Figure 3.1 Hypothesized Interaction of Research Question 1 Variables 72
3. Figure 3.2 Hypothesized Interaction of Research Question 2 Variables 73
4. Figure 4.1 Plot Analysis of Moderating Effect of Performance
Satisfaction on Leadership Orientation (Interactions with Others)
and Perception of Collaboration 100
5. Figure 4.2 Plot Analysis of Moderating Effect of Performance
Satisfaction on Leadership Orientation (Personal Attitude) and
Perception of Collaboration 101
6. Figure 4.3 Plot Analysis of Moderating Effect of Leadership
Satisfaction on Leadership Style and Perception of Collaboration 107
7. Figure 4.4 Plot Analysis of Moderating Effect of Performance
Satisfaction on Leadership Style and Perception of Collaboration 110

xiii
Abstract
LEADERSHIP IN COLLABORATIVE GOVERNANCE: UNDERSTANDING THE
RELATIONSHIP OF LEADERSHIP AND COLLABORATIVE PERFORMANCE OF LOCAL
DEPARTMENTS OF SOCIAL SERVICES EXECUTIVES
By Jennifer Elizabeth Behrens, MSW, Ph.D.
A dissertation submitted in partial fulfillment of the requirements for the degree to Doctor of
Philosophy at Virginia Commonwealth University.
Virginia Commonwealth University, 2014
Major Director: Dr. William C. Bosher, Jr., Ed.D.
Distinguished Professor, Public Policy and Education
L. Douglas Wilder School of Government and Public Affairs
Public administration agencies are increasingly called upon to collaborate across organizational
boundaries as a regular part of practice. Leaders in the organizations are expected to deliver
positive outcomes from collaborations. Common sense implies that good leadership leads to
successful collaboration within public administration agencies. However, the exact link between
leadership and collaboration continues to be a puzzle for both practitioners and academics in the
field. This study examines the relationship of leadership and collaborative governance within a
group of social services executives, who are specifically chartered to collaborate with one
another and across organizational boundaries for successful delivery of public welfare services.
Relationship-based leadership orientation and trust-building leadership style are evaluated for
main effects on perception of collaboration. Leadership satisfaction and performance
satisfaction were evaluated for simple effects on the relationship between leadership orientation
and leadership style on perception of collaboration. The results provide that there are no direct
effects of leadership orientation and leadership style on perception of collaboration.
Performance satisfaction moderated the association of both leadership orientation and leadership
style on perception of collaboration. Leadership satisfaction moderated the relationship of
leadership style with perception of collaboration. Implications from this study include the need
for further study into a threshold of acceptable collaborative activities for practitioners.

xiv
In economic life, the possibilities for rational social action, for planning, for reform – in
short, for solving problems – depend not upon our choice among mythical grand
alternatives but largely upon choice among particular social techniques…techniques and
not “isms” are the kernel of rational social action in the Western World.
- Robert Dahl and Charles E. Lindblom, 1953
The ever-increasing turbulence in the marketplace demands even more collaboration, not
less.
- James Kouzes and Barry Posner, 2002

1
CHAPTER 1 – INTRODUCTION
I have worked for both local governments and state governments for over 15 years. I have
experienced positive episodes of collaboration and less than productive ones. I have benefited
from supportive cooperative arrangements as well as endured faltering partnerships that fail to
accomplish any of the set tasks.
I have also witnessed inspiring leadership and just the reverse, oppressive management.
Throughout my practice, I have often seen the two concepts (leadership and collaboration) as
entwined experiences. Common sense tells me as a practitioner within administrative agencies
that successful collaboration requires good leadership and that successful leaders inspire positive
collaborations.
Academically, however, we have more of a puzzle about the relationship between leadership
and collaboration. As a student of public policy, I would like to know what successful leadership
and collaboration look like. How does leadership affect collaboration? How do they relate to
one another? This study seeks answer some of those questions by to exploring how leadership
orientation and behaviors affect collaboration efforts of a group in the era of new governance.
New governance reform in contemporary public administration reveals the challenge of
operations and performance expectations within government administrative agencies. Society is
no longer comfortable with traditionally hierarchical and rigid government bureaucracies, and
the expectation of creative problem solving, transparency and performance accountability has

2
strengthened. (Salamon, 2002). (McGuire, 2006). Examination of “collaborative governance” is
a growing topic within public administration. (Morse, 2010). (Ansell, & Gash, 2008). (O’Leary,
Gerard, & Bingham, 2006). Partnership and collaboration within and between governmental
agencies is an increasing occurrence throughout the country. (Kettl, 2006). Salamon (2002, p.2)
stated that “…crucial elements of public authority are shared with a host of nongovernmental or
other-governmental actors, frequently in complex collaborative systems that sometimes defy
comprehension, let alone effective management and control.”
Partnership exists and migrates along the spectrum of formality of arrangements, “from the
voluntary to the statutory.” (Morrison, 1996). Thus, collaborations that are derived from
partners working collectively upon a task may be developed out of organizational structure or
from political mandates. (Horwath & Morrison, 2007). Collaborations produced from codified
or legislated partnerships must overcome a series of hurdles to successfully function and achieve
the purpose of the organizational relationship due to the involuntary nature of the motivation to
work collectively. How are these barriers overcome? Are leaders playing a part in
collaboratively successful agencies?
The role of leaders in the success of collaboration provides intriguing consideration. These
public administration practitioners who navigate across organizations and throughout networks
are often called boundary spanners. Successful boundary spanners have a unique set of skills
and behaviors. Kouzes and Posner (2002) state that leaders must have two specific skills in
order to support collaboration: the ability to create a climate of trust, and the ability to facilitate

3
relationships. This type of leader is referred to as an individual catalyst. According to Morse
(2010, p.234), “…we live in a world of complex interconnections in which take-charge leaders
are less successful than individuals and groups who provide the spark or catalyst that truly makes
a difference.” (Luke, 1998). Trust and relationship building, intertwined with a sense of
entrepreneurship, are key themes within literature on individual catalysts. (Morse, 2010.). (Das
& Teng, 1998).
This research is designed to assess if leadership orientation or qualities impact perceived
levels of collaboration within a governmental group of practitioners from multiple organizations.
The research design is a non-experimental, quantitative design, utilizing components of multiple
leadership assessment instruments and a scale to capture perceived collaboration. The survey
tool created was designed to capture particular leadership qualities of leaders of governmental
partners and to assess their perceptions of the level of success of the partnership.
Statement of the Problem
Peter Orszag, Director of the Office of Management and Budget of the Executive Office
of the President, issued a memorandum in 2009 to the Heads of the Executive Departments and
Agencies underscoring the role of collaboration in contemporary government: “Collaboration
improves the effectiveness of Government by encouraging partnerships and cooperation within
the Federal Government, across levels of government, and between the Government and private
institutions.” All agencies were directed to create and submit an Open Government Plan with the

4
specific purpose of folding collaborative endeavors into regular and routine practice. The plan
was to specifically address collaboration such that it “should explain in detail how (the) agency
will improve collaboration, including steps the agency would take to revise its current practices
to further cooperation with other Federal and non-Federal governmental agencies, the public, and
non-profit and private entities in fulfilling the agency’s core mission activities.” Collaboration is
a key component of governmental action; however, consistently successful collaboration has
clearly remained elusive to all levels of government to the point of requiring a federal
memorandum dictating operational plans to achieve such. Horwath and Morrison (2007)
delineate a well-documented series of such issues with collaborations, including “lack of
ownership amongst senior managers; inflexible organizational structures; conflicting
professional ideologies; lack of budget control; communication problems; poor understanding of
roles and responsibilities and mistrust amongst professionals.” However, we know that there are
some agencies that do in fact have highly efficient and successful collaborations. If agencies
have such a chronic condition of failing to implement successful collaborations, how are there
some success stories at all? Could it be that leadership of the organizations play a role? If so,
what is that role?
What are the qualities of leaders that best suit them to successfully navigate partnerships
through to high level collaborations? Many provide vague generalizations of the outcomes of
good leadership, but even these fail to specifically delineate what behaviors are actually
conducted. Contemporary leaders in modern administration such as Swissair’s Claude Meyer,

5
assess similarly, “leadership is learning by doing, adapting to actual situations. Leaders are
constantly learning from errors and failures.” (Kouzes & Posner, 2002). Responsiveness of a
leader in a particular context is critical in the outcome of the undertaking. In the collaborative
scenario, Mary Parker Follett articulated that the leader is the one that navigates the context
toward success for the entire group. (McGuire, 2006). Bryan, Jones, and Lawson (2010)
examined the success of the Child Abuse Prevention and Treatment Act (CAPTA) results, and
attributed the results to that of “authentic collaboration.”
This quality is a dynamic quality for leaders, hired and appointed, to have or learn in their
role in this partnership. The collaborative success of the administration of this partnership may
be a function of the traits of the leaders in the agencies. If the factor of work experience
background cannot be permanently mitigated, perhaps leadership qualities can be.
Such mitigation and strategy may be of particular interest to government agencies who
are required to collaborate. The Local Departments of Social Services are such a bureaucratic
agency. The Virginia General Assembly legislated organization of social services throughout
two levels of government: state and local governments. Partnership between levels of
government provides the context for leaders within the bureaucracy of Virginia social services.
The Virginia League of Social Services Executives (VLSSE) is a deliberately formed group of
public administrative leaders from throughout the Commonwealth of Virginia Local
Departments of Social Services. The interacting group is a collection of leaders who elect

6
higher, or secondary, level leaders to steer and guide the group toward accomplishment of work.
Leaders are established by legal statute, or codified, to partner with one another to perform tasks
in daily work and strive to achieve the mission of the work. Does this group of public
administrative practitioners have a high level of collaborative success? How does their
leadership impact their level of collaboration? These questions for this group, like much of
public administration, are currently unanswered.
Rationale for the Study of the Problem
The Virginia Department of Social Services (VDSS) is an administrative agency within
the state level of government. 120 Local Departments of Social Services (LDSS’) comprise the
local government level of the bureaucracy. The government agencies are organized in a
relationship of supervision and administration; Virginia operates with a state supervised – locally
administered social services government. Operation and practice of social services programs in
Virginia is codified to occur through a bureaucratic partnership. The two agencies are mandated
to work together to perform and serve the residents of the Commonwealth. The VLSSE is the
professional group of LDSS executives collectively organized to partner as one group with the
VDSS. The group was created to foster collaboration with the state agency (VDSS) and
ancillary groups. The degree of success of the partnership, the level of collaboration between the
two governments, has changed over the course of the partnership.

7
As in the LDSS’, there are multiple processes through which a leader may attain status in
governmental agencies, which may impact the ability to successfully lead the organization.
Leadership of the governmental agencies is compounded by the method through which the
organizational leaders achieve their status. The leaders may be hired through a competitive
hiring process or they may be appointed. Leaders may be careerists or political appointees.
Their backgrounds may be immersed in the culture and mission of social services practice and
administration or may be completely irrelevant to the practice of the programs. Resolving
differences between leader origins may be complicated. Virginia’s LDSS’ have both types of
government executives as delineated by James Q. Wilson in his 1989 assessment of bureaucracy.
“Political executives are appointed by the president, governor or mayor in order to satisfy the
elected official’s political needs; career executives are appointed from within an agency (or
brought in from a comparable agency elsewhere) because it is required by law or because there
are no overriding political needs that must be served.” The VLSSE leadership (i.e., President) is
elected by the membership population. The dual methods of selection of leaders of social
services in Virginia are not likely to change. However, understanding qualities of the candidates
for leaders may provide more opportunity for improved partnership between leaders of the
agencies.
Purpose of the Study and Research Questions
The Virginia Department of Social Services and the Local Departments of Social
Services have to partner to conduct business. Required (legislative) partnership is the context of

8
the interaction between the agencies. Coordinating and integrating efforts of 120 Local
Departments of Social Services into one cohesive partnership with the Virginia Department of
Social Services through the VLSSE is paramount toward achieving success. Determining key
factors for successful collaboration between the partners is critical to performance, both
budgetary and procedural. Understanding the current context and the qualities of leaders within
the VLSSE may assist the administration of the programs and better enable the agencies in
succession planning management.
The Virginia Department of Social Services is established by Code of Virginia § 63.2-
200 that states “the Department of Social Services is hereby created in the executive branch
responsible to the Governor. The Department shall be under the supervision and management of
the Commissioner of Social Services.” §63.2-201 provides the designation of the leader of the
agency: The Commissioner of Social Services, shall be appointed by the Governor, subject to
confirmation by the General Assembly, if in session when the appointment is made, and if not in
session, then at its next succeeding session.” “The Commissioner shall establish in the
Department such divisions and regional offices as may be necessary.” (§63.2-209)
The General Assembly created the establishment of Local Boards by Local Governments
in §63.2-300: “There shall be a local board in each county and city of the Commonwealth.
However, any combination of counties and cities may establish one local board for those
jurisdictions as hereinafter provided in this article.” §63.2-324 designates the Local Department

9
of Social Services: “There shall be a local department of social services for each county or city
under the supervision and management of a local director. However, two or more counties,
cities, or any combination thereof, whether having separate local boards or a district board, may
unite to establish a local department of social services and appoint a local director of social
services to administer this title in such counties and cities, in which case such local director shall
be the local director for each such county and city and the expenses incident to such local
department shall be divided in such manner as the respective governing bodies provide by
agreement.” “The local director shall act as an agent for the Commissioner in implementing the
provisions of federal and state law and regulation,” (§63.2-333) and “…shall be the administrator
for the local department and shall serve as secretary to the local board. Under the supervision of
the local board, unless otherwise specifically stated, and in cooperation with other public and
private agencies, the local director, in addition to the function, powers and duties conferred and
imposed by other provisions of law, shall have the powers and perform the duties contained in
this title. (§63.2-332).
The Virginia League of Social Services Executives was organized in 1948 (originally
known as the Virginia League of Local Public Welfare Executives), and incorporated in
November 1979. The VLSSE was designated a tax exempt nonprofit organization in 501(c) 4
status in February 1980. Bylaws for the organization were developed and amended in 1992,
2003, 2007, 2008 and, most recently, in May 2013. Policies and procedures were developed and
amended in 2011 and in April 2013. Article II of the Bylaws defines the “object of the League

10
shall be to foster collegial relationships among its members and collaboration among agencies
and governments in the formation, implementation, and advocacy of legislation and policies
which promote the public welfare.” (VLSSE Bylaws, 2013). VLSSE facilitates informational
events for its membership, conducts advocacy measures in regards to policies and legislation,
provides professional development opportunities for it members, and establishes and maintains
cooperative agreements and arrangements with agencies with common goals. The role of this
study is to assess the impact of leadership on collaboration by the VLSSE group.
Leadership is understood in this research as a function of a contingency. F. E. Fiedler’s
seminal work, A Theory of Leadership Effectiveness (1967), details the leadership contingency
model: the characteristics of a leader associate with the context of the situation. There is a
dynamic relationship between traits of a leader and the success of the organization’s performance
in varying contexts. There is a match between the leader and the situation that leads toward
agency success. Fiedler measures the traits of a leader through the Least Preferred Co-Worker
(LPC) scale. Three major components are assessed in the Likert-type scale: leader-member
relations, task structure, and leader position power. A high score of the three components
indicates a good match between the context of the situation and the leadership qualities of the
individual.
What type of leader is well-matched with a regulated partnership and within a group
chartered to collaborate? Trust and relationship development is critical to successful leadership

11
within a collaborative effort between public agencies. (Morse, 2010). (Getha-Taylor, 2008).
(Morse, 2008). (Williams, 2002). These skills are aspects of a leadership style. Luke (1998)
details that “we live in a world of complex interconnections in which take-charge leaders are less
successful than individuals and groups who provide the spark or catalyst that truly make a
difference.” This catalytic type of leader is also known as a “boundary spanner” who “engages
in networking tasks and employs methods of coordination and task integration across
organizational boundaries.” (Alter & Hage, 1993, p.43). Boundary spanners are critical
organizational players in interagency partnerships; often success of the collaboration is
considered dependent on the quality of the boundary crosser. (Williams, 2002).
The research questions are based on wanting to explore my commonsense link between
leadership and collaboration. The hypotheses to support each research question are based upon
the review of relevant literature to leadership orientation, leadership style, and collaborative
governance.
RQ1: Are Leadership Orientation and Collaboration associated?
H1A: Relationship-oriented Leadership Orientation is positively associated with
Perception of Collaboration.
H1B: Satisfaction of Leadership moderates the association of Leadership Orientation
with Perception of Collaboration

12
H1C: Satisfaction of Performance moderates the association of Leadership Orientation
with Perception of Collaboration.
RQ2: Are Leadership Styles and Collaboration associated?
H2A: Trust-building Leadership Style is positively associated with Perception of
Collaboration
H2B: Satisfaction of Leadership moderates the association of Leadership Style with
Perception of Collaboration.
H2C: Satisfaction of Performance moderates the association of Leadership Style with
Perception of Collaboration.
Definitions, Assumptions, and Limitations of the Study
Partnership and collaboration are related but not synonymous in this study, as supported
by research. (Horwath & Morrison, 2007). (Morrison, 1996). This study examines
collaboration between leaders who are partners. Merriam-Webster defines partnership as “the
state of being a partner: participation.” (Merriam-webster.com). Partner is defined as “one
associated with another especially in action.” (Merriam-webster.com). The Code of Virginia
legislates a partnership between the Virginia Department of Social Services and the Local
Departments of Social Services by mandating cooperation between the leaders of the agencies in
13
§63.2-204: “The Commissioner shall assist and cooperate with local authorities in the
administration of this title. He shall encourage and direct the training of all personnel of local
boards and local departments in the administration of any program within the purview of this
title or Chapter 11 (§16.1-266) of Title 16.1. The Commissioner shall collect and publish
statistics and such other data as may be deemed of value in assisting the public authorities and
other social agencies of the Commonwealth in improving the care of these persons and in
correcting conditions that contribute to dependency and delinquency. The Commissioner shall
also, in his discretion, initiate and conduct conferences designed to accomplish such ends and
further coordination of effort in this field.”
Collaboration is a form of networked relationships between two or more entities, often
governmental administrative agencies. (Morse, 2010). (Weiss, Anderson, & Lasker, 2002).
Collaborative public management or governance has continuously gained in bureaucratic
popularity, and is now a common practice. (Ansell & Gash, 2007). (McGuire, 2006) (O’Leary,
Gerard, & Bingham, 2006). (Kettl, 2006). Ansell and Gash (2007) define collaborative
governance as “a governing arrangement where one or more public agencies directly engage
non-state stakeholders in a collective decision-making process that is formal, consensus oriented
and deliberative and that aims to make or implement public policy or manage programs or
assets.”
14
Contemporary literature suggests a series of graduating and developing levels of the
maturity of collaboration between agencies:
Communication → Co-operation → Co-ordination → Coalition → Integration.
(Horwath & Morrison, 2007, p. 56).
Organizations can be placed along the spectrum by considering four dimensions their
interaction and partnership, including formalization, intensity, reciprocity, and standardization of
activities and processes. Partnerships that function with a low level of collaboration operate
through means of basic communication with limited formal agreements, a lack of mutual
understanding of mission or work, a focus on the self and a lack of commitment toward joint
accountability. High level collaborative partnerships have well-integrated relationships with
formal relationships, clear and holistic values and missions and partnership accountability.
(Horwath & Morrison, 2007, 56). In this model, integration is the epitome of high-level
collaboration between partners. (Morse, 2010).
Leadership is the ability of an individual to guide others to participate in a collective
action. (Howell & Costley, 2006). There are a set of innate and stable behaviors displayed by a
leader to manage followers. (Kark, Waismel-Manor, & Shamir, 2012). (Eagly & Johannesen-
Schmidt, 2001). This study refers to this as leadership orientation. Leadership orientation does
not evolve or change. However, leaders may utilize various behaviors within different contexts
to successfully manage the group. These behaviors are collectively referred to as leadership
15
style in this study. Kouzes and Posner (2002) offered that “effective leadership is not an inborn
skill available to a select few. Rather it is a set of observable behaviors that, with deliberate
practice, can help everyone be more effective and make more of a positive difference in the
workplace, in the community, in the world”. Further, effective leadership is situational to the
context of the behaviors, and may be interdependent upon the follower characteristics.
Methodology
This study seeks to contribute information to the consideration of the impact of
leadership style upon inter-governmental collaboration. There is a substantial body of literature
and research surrounding collaboration between partners, and there is a growing empirical
interest in the role of individual leaders as vehicles or motivators for successful collaboration.
Contribution to contemporary research upon characteristics of leaders sparking successful
collaboration between partners in public administration is needed.
The study was a non-experimental, quantitative design utilizing survey research. The
sample consisted of identified leaders in all 120 Local Departments of Social Services who had
active membership in VLSSE. Each member had the opportunity to participate in the survey.
The number of participants was 141, as some LDSS have more than one representative in the
VLSSE membership population.
The survey instrument was an integrated assessment tool which utilized questions from
multiple established instruments. The questions used from each instrument assess the leadership

16
orientation and leadership style (of trust-building), as well as the context of the situation (the
partnership).
1. Least Preferred Co-worker (LPC) Scale – Fiedler developed this instrument with 18 pairs
of bipolar adjectives assessed on a Likert-type scale to determine a person’s leadership
orientation. The scale evaluates a leader’s motivation to form relationships, and
orientation toward trust in relationships with colleagues.
2. Leadership Practices Inventory (LPI) Self – Kouzes and Posner (2002) developed this
self-perception, 30 item scale that assesses the perception of frequency of particular
leadership behaviors. Statements from one of the five practice domains are utilized for
this purpose of this study.
3. Collaboration Audit - The researcher utilized a tool developed by Kouzes and Posner
(2002) to assess frequency of collaborative behaviors by a group. The audit aligns with
the framework of collaboration offered by Horwath and Morrison to assess the perceived
level of collaboration between the agencies.
The data analysis involved descriptive statistics (measures of central tendency: mean,
median, mode, range) and inferential statistics.
Organization of the Study
This dissertation is represented in five distinct chapters. Chapter 1 is the Introduction,
which is comprised of the statement of the problem, the rationale for the study, the purpose of
the study and research questions, the definitions, assumptions and limitations of the study, the

17
research methodology, the organization of the study and a summary. Chapter 2 is a literature
review of seminal and contemporary research on leadership and collaboration, including
literature on Fiedler’s Contingency Model and the Least Preferred Co-worker scale, on the
Leadership Personality Inventory, on the framework of collaboration, and summary of the
literature. Chapter 3 details the research design and methodology, including an introduction, the
research design, the sample population, the instruments, the data collection procedures, the data
analysis, assessment of limitations, and a summary of the methodology. Chapter 4 provides the
analysis of the data, results and findings, including an introduction, descriptive statistics and
inferential statistics, results of each of the research questions, and a summary of the results and
findings. Chapter 5 represents the conclusion of the dissertation and recommendations for future
research. Chapter 5 is comprised of an introduction and summary of the study, an assessment of
relevancy of literature and the research conducted, implications for additional research,
implications for practice and a conclusion about the study.
Summary
Collaboration, as a common tool in the era of “new governance,” is understandably both
intriguing and challenging to comprehend. The nature of collaboration is the interaction of
multiple actors for a blended or co-joined purpose that cannot be achieved alone or from one
event or action. Realizing the key to successful collaboration is complex and requires analysis of
many separate factors. Broad study into successful collaboration has consistently identified the
role of the leader in the group as paramount to the success of the group performance. Research

18
has pointed to particular practices and behaviors of the leaders who are capable of spanning the
boundaries required of successful collaboration by establishing trust between members of the
group. The theoretical underpinning of this study, Fiedler’s Theory of Leadership Effectiveness,
provides a contingency model of navigating leadership orientation and situational context of
administration. This study examined the association of leadership orientation and practices to
the context of collaborative governance in a contemporary interacting group of leaders within the
human services field. The group studied was comprised of Local Departments of Social
Services’ Directors and Assistant Directors, and was chartered to enhance collaborative practices
through network management across boundaries of government and ancillary groups.
This study was designed with the intent to provide public administrators with
contemporary research about successfully enhancing the ability to successfully collaborate in
today’s bureaucratic environment. If the role of collaboration in new governance is not
diminishing, then public officials and leaders could be better informed about how to place better
suited leaders in the role of network management based on assessment of leadership style and
practices. Public administration practitioners could use the results of the study to better assess
and match the orientation of leaders (task or relationship-building) with the nature of the
management tasks (hierarchical or collaborative). Further, this study may assist in succession
planning management of leaders in the human services field, as higher officials may be able to
plan role succession for their agencies with the understanding that staff with particular leadership

19
orientation who display specific leadership practices may more successfully span boundaries and
improve collaborative performance.

20
CHAPTER 2 – REVIEW OF THE LITERATURE
“…different group situations require different leadership styles.”
- Fred Fiedler, 1967
Introduction
This study on association of leadership behaviors upon collaboration between
government agencies is presented in five chapters. Chapter 1 introduced the topic, and included
the statement of the problem, the rationale for the study, the purpose of the study and research
questions, the definitions, assumptions and limitations of the study, the research methodology,
the organization of the study and a summary. Chapter 2 will provide a review of relevant
literature and the instruments used to measure leadership and collaboration in prior research.
Chapter 3 will delineate the research design and methodology. Chapter 4 will present the
analysis of the data, and the results and findings. Chapter 5 represents the conclusion of the
dissertation and recommendations for future research.
This chapter opens with the theory that frames the research. The literature review will
focus on the role of collaboration and then on leadership in public administration. The rationale
for studying the identified population will be provided as well as review of the instruments used
in the survey tool created for this study. The chapter will close with an assessment in literature
of the importance of leadership in collaborative governance.

21
Theoretical Context
Fiedler (1967) proposed a theory of leadership effectiveness framed on the effect of a
leader’s personality attributes upon group success. The Contingency Theory of Leadership
Effectiveness “…provides a conceptual framework and a preliminary set of guidelines for
determining how to match the leadership situation and the man.” (Fielder, 1967, 248.) The
situational marriage of the leader’s style and behaviors with the group environment is paramount
to the success of the task. “A “good” system of classification would then be based on the crucial
factors which determine whether a given situation is favorable or unfavorable for the leader.”
Fielder (1967, p. 247) describes leadership:
One style of leadership is not in itself better than the other or is one type of leadership
behavior appropriate for all conditions. Hence almost everyone should be able to succeed
as a leader in some situations and almost everyone is likely to fail in others. If we want
to improve organizational performance we must deal not only with the leader’s style but
also with the factors in the situation which provide him with influence.
The success of task accomplishment by a group is based on the interaction between the leader
and the group members. A leader well-matched with the situation will yield more successful
task accomplishment. Conversely, if the characteristics of the situation do not match or integrate
well with the style of the leader, the goals of the group will not be met easily or at all.

22
The interdependent factors in Fiedler’s leadership theory are the situational components
and the leadership predisposition. A group must be formed in order for there to exist a leader.
The two entities are intrinsically linked by how they are established. As the existence of the two
is coupled, so is the success of each. The performance of the leader impacts the performance of
the group; the performance of the group impacts the performance of the leader.
Fiedler (1967, p.247) stated that “leadership effectiveness depends upon the appropriate
matching of the individual’s leadership style of interacting and the influence which the group
situation provides.” Fiedler developed an inventory that is used to measure the leader’s
emotional reaction to a group member thwarting the accomplishment of the group’s mission and
tasks. (Howell & Costley, 2006).
There are three situational components, according to Fiedler, which impact leader
influence upon a group: the leader’s personal relations with group members (leadership
orientation); the legitimacy of power of the leader’s role within the group; and the degree of
structure of the task for the group.
Leadership orientation falls into three categories – the task motivated leader, the
relationship oriented leader and the socioindependent leader. The task motivated leader has a
high threshold for task accomplishment, recognition and reward. A relationship oriented leader
is more tolerant of a high-needs or challenging group member, and the leader is more motivated
to form motivating relationships with the members. Socioindependent leaders are both task and

23
relationship oriented, and fall between the ranges of behaviors displayed by task or relationship
motivated leaders. (Fiedler, F., 1967).
Fiedler posits that leadership is predisposed, and therefore the style is consistent and
cannot be changed. (Howell & Costley, 2006). According to Fiedler (1967, p.262), “…the
relationship between the leader and his members is in part a function of the leader’s own
personality and interpersonal behavior. We need to learn what determines a good or a poor
leader-member relationship, and to what extent this is a product of the leader’s personality and
behavior, on the one hand, and a product of the situational context, on the other.” Contemporary
research supports contingency models of leadership effectiveness. Further, literature articulates
that successful interaction between group members can be dependent on the conditions in which
the group begins work. (Ansell & Gash., 2008).
The second situational component in Fiedler’s theory is the group. There are three types
of groups identified by Fiedler, which are relevant to this study: interacting groups, coacting
groups, and counteracting groups. A group is defined as a set of individuals who…have
proximity, similarity, and share a “common fate” on task-relevant events. The specific concern
with groups of interdependent members is with the ability of the group to collectively achieve a
common goal. (Fiedler, F., 1967).
Group types are determined by assessing them on three criteria: position power, task
structure and the personal relationship between the leader and the group members. In interacting

24
groups, the position power is “the degree to which the position itself enables the leader to get his
group members to comply with and accept his direction and leadership.” (p. 22) Position power
affects the role relationship between the leader and members. Fiedler (1967, p. 25) stated that
“the leader who has rank and power can get his group members to perform their tasks more
readily than would a leader who has little power.”
Interacting groups “require close coordination of several team members in the performance
of the primary task.” (Fiedler, 1967, p. 18). Fiedler (1967, p. 19) described the role of the leader
in this type of group as the one who is responsible for
coordinating the various task functions or the group’s activities so that the work flows
smoothly and without interruption, or so that men working together can do so
harmoniously and without getting into each other’s way. The leader’s job is one of
directing, channeling, guiding, refereeing, timing, and coordinating the group members’
work…The hallmark of the interacting group is the interdependence of group
members….Each man must do his part if the team is to be successful, and the group is
generally rewarded as a group or else the leader alone is rewarded.
Coacting groups are structured differently. “Each group member is on his own, and his
performance depends on his own ability, skill, and motivation. His reward, not infrequently, is
computed on a piecework basis in a production job or on a commission basis in sale work. The
group product is typically the sum of the individual performance scores.” (Fielder, 1967, p. 19).

25
Effectiveness of group performance is sum of individual performances; individual performances
are not dependent upon one another which may lead to rivalry and competition. A leader’s
function: develop individual member motivation and training to facilitate the individual member
to fulfill their potential; suppress rivalries if they are not conducive toward achieving a higher
level of collective performances
Fiedler’s (1967, p.20) counteracting groups include “…individuals who are working
together for the purpose of negotiating and reconciling conflicting opinions and purposes. These
groups are typically engaged in negotiation and bargaining processes, with some members
representing one point of view and others an opposing or, at least, divergent point of view. Each
individual member, to a greater or lesser extent, works toward achieving his own or his party’s
ends at the expense of the other.” A leader’s function is to act as moderator or negotiator;
“maintain the group, facilitate communication and mutual understanding, and to establish a
climate conducive to the development of creative solutions to the conflict, namely, to influence
the group toward effective performance.” (Fiedler, 1967, p. 21).
The third aspect to the situational leadership theory is the task. A leader’s effectiveness is
based on the group’s performance on the group’s primary assigned task, even though the group’s
output is not entirely the function of the leader’s skill. Task structure is the backbone of the
group; a group forms in order to accomplish a task. Fiedler (1967, p.26) emphasizes the
importance of a task as the “one important element in the situation which faces the leader...the

26
task constitutes in almost all cases the reason for establishing a task group in the first place, and
the group’s existence depends, therefore, on the satisfactory performance of the task.” The task
represents an order from the larger (hierarchical) organization; the leader is responsible for
carrying out the order successfully. Fiedler (1967) stated that “the nature of the task determines
leader influence to a considerable extent,” (p. 27) and that “the structured task is enforceable
while the unstructured, ambiguous task is difficult or impossible to enforce.” (p. 28).
Scholars across industry have utilized Fiedler’s theory of matching leadership orientation
and the situation of the task is key to successful performance of groups as a basis for
understanding practice. Leaders of public administration need to be well suited to fit the context
of modern government which requires leadership of collaboration. As collaborative governance
becomes the norm in modern bureaucracy, public administration leaders must adequately both
plan succession management or prepare for political appointment of candidates to align
leadership styles of with the expectation of collaboration as normal governance practice.
(O’Leary, Gerard, & Bingham, 2006). (McGuire, 2006). (Morse, 2010) (Follett, 1918).
Fiedler’s Contingency Theory of Leadership Effectiveness is a well-established resource
for study of leaders and public administration to impact leadership effectiveness. A quick search
on Google Scholar reveals that Fiedler’s 1967 seminal book on the topic, A Theory of
Leadership Effectiveness, has been cited by 5,169 authors across books, articles, case law and
presentation materials. The areas of evaluation utilizing Fiedler’s contingency theory as a

27
resource span multiple related and continuous dimensions of leadership within public
administration across all decades of the latter twentieth century and into the twenty-first century.
Scholars, researchers and practitioners from the fields of psychology, public administration and
organizational development have all utilized Fiedler’s theory and leadership assessment design
in their work.
Robert J. House (1971) utilized Fiedler’s research in 1967 as a building block toward
developing a path goal theory of leadership effectiveness. House outlined multiple hypotheses
within his consideration of situational components of effectiveness of leader behaviors as a
function of a path-goal theory of motivation. He specifically used Fiedler’s research to support
the hypothesis surrounding task-oriented leadership behaviors as associated with challenging
situational contexts. While the results of the study articulated in the 1971 article were mixed,
House did accomplish broadening the scope of theories of leadership, in part by building from
Fiedler’s research. House continued to expand on the path-goal theory in work with other
researchers, as in the 1974 article co-written with Mitchell in the Journal of Contemporary
Business. Path-goal theory of leadership has continued to be utilized by both researchers and
practitioners throughout the last four decades. (Howell & Costley, 2006).
Conger and Kanungo (1987) proposed a theory of a specific leadership style using
Fiedler’s contingency theory as the theoretical underpinning to their examination of charismatic
leadership style. The researchers examined charismatic leadership within the context of an
organizational setting. The attribute of charisma is considered a leadership behavior; Conger and

28
Kanungo (1987) examine the attribute in the same manner as Fiedler examined behaviors of
leaders. Two hypotheses were developed in regards to the context of charismatic leadership.
The authors provided implications for their theory, including that matching leadership style and
organizational development may be a preferred state for public administration. This is similar to
Fiedler’s precipice that the match of leadership orientation and organizational context is critical
to leadership, and ultimately group, effectiveness.
Eagly and Johnson (1990) conducted a meta-analysis of the role of gender upon
leadership style. The study used the frame of Fiedler’s leadership orientation in the design of
their evaluation. The authors recognized that the bi-polar leadership orientations of task-oriented
and relationship-oriented as outlined by Fiedler were commonly accepted in the research
community. As such, the constructed variables for the meta-analysis included gender-role
requirements of task-oriented ability and relationship-oriented orientation. Ultimately, Eagly and
Johnson (1990) compared 29 studies referencing Fiedler’s assessment tool of leadership
orientation, the Least Preferred Coworker (LPC) scale. The researchers found that leadership
style is associated with gender role, but is modified by the perception of whether the position of
management was largely thought to be a masculine position or a feminine position. These
findings continued to support the situational contingency component to Fiedler’s theory of
leadership effectiveness, especially related to the leader’s positional and accepted level of
authority over a group.

29
Fiedler’s theory has also been cited in contemporary texts regarding public administration
and management. Rainey (2003) used the theory in “Understanding and Managing Public
Organizations” as an example of a comprehensive theory of contextual leadership success. The
text outlines the frame of Fiedler’s theory, and describes the rationale of the LPC design.
Fiedler’s position that organizational development is best managed by matching leaders to the
setting of the organization is highlighted. Rainey takes the stance that greatest success of
Fielder’s theory was not the actual application of the theory to practice but that it instead has
acted as a developmental position for progressive academic leadership theories.
Howell and Costley (2006) also highlighted Fiedler’s impact on understanding leadership
effectiveness in business, organizations and society. Their text is used in graduate level classes
in business schools across the United States (including Virginia Commonwealth University).
Fiedler’s Contingency Theory of Leadership is emphasized as a basic leadership concept in the
text, and the LPC is described. Further, Howell and Costley also underscore the path-goal theory
of leadership as developed by Robert House. House used Fiedler’s theory of leadership
effectiveness as one of the building blocks for his theory. (1971).
To that end, the National Academy of Public Administration issued a series of essays on
the qualities and skills of an effective government leader in the 21st century. Subsequently, the
National Academy of Public Administration partnered with Human Capital Solutions to facilitate
a symposium in 2005 to address particular behaviors, skills and competencies and criteria expert
academics and practitioners identified as key to effective public administration leadership.

30
Network management was a critical competency recognized and discussed by expert panel
members. “We need to develop a cadre of leaders that can operate across department missions
and that gray stage others have called networking. Governing, leading and managing by network
are a dimension that has emerged in DoD (the Department of Defense) in the last few years as its
organizations need to work together.” (www.napawash.org/wp-content/uploads/2006/06-01.pdf,
2006).
Application of Fiedler’s theory in this study requires comprehension both of
collaboration and of the leader. Collaboration is the frame of the contextual governance
paradigm in which leadership orientation is evaluated by this study. This study examines
leadership effectiveness in the context of interacting groups. The next two sections of this
chapter will review collaboration in public administration, as well as leadership. The population
studied will be discussed, and the relevancy of the sample to leadership in collaborative
governance. A review of survey instruments used to assess leadership in collaborative
governance will be provided as well.
The role of collaboration in present-day government
Forty years ago, Rittel and Webber articulated one of the premises for the perpetual
evolution of public administration in society. Rittel and Webber (1973) stated that “planning
problems are inherently wicked. As distinguished from problems in the natural sciences, which
are definable and separable and may have solutions that are findable, the problems of

31
governmental planning – and especially those of social or policy planning – are ill-defined; and
they rely on elusive political judgment for resolution.” The elusiveness of resolving public
problems has not changed in the last four decades. (Williams, 2002). Salamon (2002)
contributed that
stimulated by popular frustrations with the cost and effectiveness of government
programs and by a newfound faith in liberal economic theories, serious questions are
being raised about the capabilities, and even the motivations of public-sector
institutions….As a consequence, governments from the United States and Canada to
Malaysia and New Zealand are being challenged to be reinvented, downsized, privatized,
devolved, deregulated, delayered, subjected to performance tests and contracted out.
Indirect government, or set of tools used by bureaucrats in management of public
administration, is one of the emerging robust techniques used by agencies in the delicate art of
contemporary governance. These indirect methods of public administration are known as “an
elaborate system of third-party government in which crucial elements of public authority are
shared with a host of nongovernmental or other-governmental actors, frequently in complex
collaborative systems that sometimes defy comprehension, let alone effective management and
control.” (Salamon, 2002). New skills and methods of public governance are topics of national
symposiums paneled by leaders in public administration; a key theme of the 2005 National
Academy of Public Administration was identified as the need for leaders of today and tomorrow

32
to develop and master new competencies, including “managing a multi-sector workforce,
network management skills, globalization, and a high tolerance for ambiguity.”
Leadership qualities are not evolving, rather the context the leaders are placed within
government is changing. (Kouzes & Posner, 2002). Government managers are expected to
collaborate more frequently with one another and with stakeholders; this is now assumed to be a
part of normal public administration practice. Collaboration is perceived as a critical method in
resolving the “wicked” problems that have plagued governance. (Salamon, 2002.) (Getha-
Taylor, 2008). (Morse, 2007). (Horwath & Morrison, 2007). There is a call from public
administration to yield more leaders in collaborative governance to resolve the complicated and
enduring problems of practice through successful network management. This type of leader is
specifically sought to act as a catalyst to affect change and propel forward momentum. (Morse,
2010). (Luke, 1998). Poxton (1999, p. 3) states “a new policy environment and new
organizational arrangements should make co-operation and collaboration easier than it has been
in the past. But real success will depend as much on the determination and creativity of
practitioners and managers as it will on Government edict and structural change.”
What does it mean for public administrators to use collaboration as a tool for achieving
tasks? What is collaboration? What does collaboration look like in day to day government
activities? Is collaboration just working or partnering with another organization or group? Or is
there something more to it in order to get to the place of actual collaborative governance?

33
Collaborative Governance
Collaboration
First, comprehending collaboration is a prerequisite to understanding collaborative
governance. Partnership and collaboration within and between governmental agencies is an
increasing occurrence throughout the country. Collaboration is a partnership between groups.
Partnership is a form of the relationship between two organizations. The partnership exits and
migrates along the spectrum of formality of arrangements, “from the voluntary to the statutory.”
(Morrison, T., 1996). The collaborations may be developed out of organizational structure or
from political mandates. (Horwath & Morrison, 2007). Collaborations produced from codified
or legislated partnerships must overcome a series of hurdles to successfully function and achieve
the purpose of the organizational relationship.
Collaboration is a form of networked relationships between two or more entities, often
governmental administrative agencies. Different perspectives are united to form mutual
comprehension of a greater or singular goal of collaborative action. The study of collaboration
within bureaucracy is not new (Mary Parker Follett examined integration as a social process as a
“collective idea” in the 1910’s and 1920’s. (Morse, 2010).) However, the expectation for
routine governance to be based upon collaborative partnerships is emerging as a pre-requisite
method of leadership and not just an alternative or occasional isolated activity. As agencies are
expected to collaborate, then they are expected to do so successfully. This implicates a
performance evaluation method needed to determine collaborative performance.

34
As such, contemporary literature suggests a series of developmental levels of successful
collaboration between agencies:
1. “Communication – individuals from different disciplines talking together;
2. Co-operation – low key joint working on a case-by-case basis;
3. Co-ordination – more formalized joint working, but no sanctions for non-
compliance;
4. Coalition – joint structures sacrificing some autonomy; and
5. Integration – organizations merge to create new joint identity.” (Horwath &
Morrison, 2007, p. 56). (Figure 2.1. Collaboration Framework)
Organizations can be assessed across four dimensions to determine where the group is
performing along the collaboration spectrum. These dimensions include formalization, intensity,
reciprocity, and standardization. The levels and dimensions of collaborations may be considered
together when examining a collaborative partnership. Partnerships that function with a low level
of collaboration operate through means of basic communication with limited formal agreements,
a lack of mutual understanding of mission or work, a focus on the self and a lack of commitment
toward joint accountability. High level collaborative partnerships have well-integrated
relationships with formal relationships, clear and holistic values and missions and partnership
accountability. (Horwath & Morrison, 2007, 56). Integration is seen as the ideal of the
collaborative process. Subsequently, successful leadership for collaborative endeavors may be

35
also called integrative public leadership, in which leaders exemplify boundary-spanning and
relationship building capabilities across organizations and throughout groups. (Morse, 2010).
(Perrone, Zaheer & McEvily, 2003).
Figure 2.1. Collaboration Framework
Note: Figure 2.1. Diagram of collaboration framework that provides the spectrum of five
developmental levels of collaboration and dimensions of analysis to determine level of
collaboration. Adapted from Horwath, J., & Morrison, T. (2007). Collaboration, integration and
change in children's services: Critical issues and key ingredients. Child Abuse & Neglect, 31(1),
55-69.

36
What is collaborative governance?
If collaboration is now expected in regular public administration, what does the
governance of collaboration in administrative agencies look like? Not surprisingly, the study of
the role of collaboration within bureaucracy demonstrates both longevity and a point of intrigue
for both public administration practitioners and scholars.
However, emphasis of collaborative governance as a primary tool of modern-day
administrative agencies is growing. “The ever-increasing turbulence in the marketplace demands
even more collaboration, not less.” (Kouzes & Posner, 2002, p. 224). Salamon (2002) details
the shift in public administration from traditional methods of hierarchical, direct management
techniques to a framework of indirect application of a host of tools called “new governance.”
“New governance” is defined by two distinct features according to Salamon: governance is “an
emphasis on what is perhaps the central reality of public problem solving for the foreseeable
future – namely, its collaborative nature, its reliance on a wide array of third parties in addition
to government to address public problems and pursue public purposes…the second feature…is a
recognition that these collaborative approaches, while hardly novel, must now be approached by
a new, more coherent way, one that more explicitly acknowledges the significant challenges that
they pose as well as the important opportunities they create.” (p.8) Kettl (1996) posits that the
one of the most important shifts in bureaucracy over the last century is the emphasis on
interagency dependency which in turn has reorganized the role of the public manager to one of
networking and spanning bridges of difference between organizations and through groups.

37
Stoker (1998, p.17) reported that “the essence of governance is its focus on governing
mechanisms which do not rest on recourse to the authority and sanctions of government. ‘The
governance concept points to the creation of a structure or an order which cannot be externally
imposed but is the result of the interaction of a multiplicity of governing and each other’s
influencing actors.’” The complexity of today’s public administrative agencies requires non-
traditional hierarchical strategies, including the ability to work in partnerships and
collaborations. (McGuire, 2006).
O’Leary, Gerard and Bingham (2006) define collaborative governance as “a concept that
describes the process of facilitating and operating in multiorganizational arrangements to solve
problems that cannot be solved or easily solved by single organizations. Collaborative means to
co-labor, to cooperate to achieve common goals, working across boundaries in multisector
relationships. Cooperation is based on the value of reciprocity.” Examination of “collaborative
governance” is a growing topic within public administration. (Morse, 2010). Stoker (1998, p.
22) stated that “governance as an interactive process involves various forms of partnership.”
Governance involves multiple organizations that are interconnected to conduct business, and the
level of performance success of a partnership is determined by the governance of the
collaboration. (Lasker, Weiss, & Miller, 2001). (Agranoff & McGuire, 2003). Collaborative
governance is the administration of integration of roles and organizations for a common purpose
for the public. New Public Management (a trend in public administration) is centered upon
collaboration, with an increased focus on the networks and partnerships through which

38
collaborative efforts arise. There is a shift in “paradigms” from a strictly hierarchical to more of
a reliance on networking and collaboration across multiple agencies and organizations. Different
perspectives are united to form mutual comprehension of a greater or singular goal of
collaborative action. (Morse, 2007). (Kettl, 2005).
Just as collaboration in government can be successful, so can it fail. Governmental
collaborations can be beset by barriers. Often, the path to successful collaboration is riddled
with the proverbial pot-holes, and the intended outcomes of the actual collaboration either
underperform or are not realized. (Morrison, 1996). There are five main barriers, as described
by Stevenson (1989):
1. Structures and systems – administrative agencies come into partnership with unique
cultures, hierarchical organizations, and expectations of management and supervision;
Huxham and Vangen (2005, p. 204) state that structure “determine(s) such key factors as
who may have influence on shaping a partnership agenda, who may have power to act
and what resources may be tapped;” the organizational structures may be rigid and
unable to yield to an interactive process (Horwath & Morrison, 2007);
2. Communication – information sharing between agencies may be complicated and bound
by varying standards and practice of confidentiality, which may foster an environment of
mistrust and misunderstanding (Horwath & Morrison, 2007);

39
3. Status and perceived power – professional development, cultural context and
bureaucratic hierarchy may be inherently different between agencies; power may be
strongly associated with the structural arrangements of the organization;
4. Professional and organizational priorities – the purpose of the collaboration may be at
odds with or have less importance to the mission of the partner agencies or conflict with
the ideologies or values of those in the group (Horwath & Morrison, 2007); or
5. Perception of benefit to agencies – the collaboration may be motivated by various
factors, which may support or hinder the outcome of the collaboration. Collaboration
may not always be designed for the benefit of both or all agencies, and may take on the
effect of domination or suppression. (Horwath & Morrison, 2007); There may be
transactional costs associated with full integration of groups, against which the group
members may fear or defend. (Kalu, K., 2012).
Horwath and Morrison (2007) describe a series of well-documented issues of government
collaborations, including “lack of ownership amongst senior managers; inflexible organizational
structures; conflicting professional ideologies; lack of budget control; communication problems;
poor understanding of roles and responsibilities and mistrust amongst professionals.” Trust and
relationship development are critical to successful leadership within a collaborative effort
between public agencies. (Morse, 2010). (Williams, 2002). There is a need for public
administration to overcome barriers for successful collaborative governance; this often falls to

40
the leaders of the groups that are brought together to mitigate government hierarchy or complex
relationship structures.
Leadership
Similarly to the intrigue around collaboration in public administration, there is considerable
attention given to leaders and leadership within bureaucracy. Fiedler opens his book on
leadership acknowledging the general fascination of leadership, and the quality of a leader is the
source of interest by both theorists and practitioners. What does qualities make up a professional
leader? Fiedler’s (1967, p.8) leader is “…the individual in the group given the task of directing
and coordinating task-relevant group activities or who, in the absence of a designated leader,
carries the primary responsibility of performing these functions in the group.” Accordingly,
Fiedler delineates that a leader meets on of the following criteria:
Is appointed as leader, supervisor, chairman, etc… by a representative of the larger
organization of which the group is a part;
Is elected by the group; or
If there is neither an elected nor an appointed leader, or if such a leader is clearly only a
figurehead, he is the individual who can be identified as most influential by task-relevant
questions on a sociometric preference questionnaire.
However, leading a group is more than appropriating the top position. What are the
components to leading a group of people? “Leadership is generally thought of as an

41
interpersonal situation in which one individual in the group wields influence over others for the
purpose of performing an assigned task.” (Fiedler, F., 1964). Scholars distinguish between
leadership orientation and leadership practices. Leadership style is defined by Fiedler as “the
particular acts in which a leader engages in the course of directing and coordinating the work of
his group members.” (1967, p. 36). Kouzes and Posner align their definition of leadership with
Fiedler’s leadership behaviors: “Leadership is an identifiable set of skills and abilities that are
available to all of us.” (2002, p. 23). Alternatively, leadership orientation is articulated by
Fiedler as “the underlying need-structure of the individual which motivates his behavior in
various leadership situations.” (1967, p. 36). These distinctions were used as the premise
between leadership orientation (underlying need-structure) and leadership style (sets of behaviors
or practices) through this study.
There is an underlying assumption in Fiedler’s leadership effectiveness theory that the
“measure of personality or behavior which correlates with group performance provides one
indication of the leader’s influence over group performance” (p. 237) Second level managers are
removed from day to day operations of work group. Their relationship based-leadership style is
more effective in group performance. Fiedler emphasizes the critical differentiation between
leadership behavior and style as “important leadership behaviors of the same individual differ
from situation to situation, while the need-structure which motivates those behaviors may be
seen as constant.” (1967, p. 36). “The higher the manager climbs in the organizational hierarchy
the less the technology and organizational controls influence his behavior and the more will job

42
objectives and interpersonal factors influence his effectiveness. The second-level management
position may, therefore, require not only different skills and task-relevant knowledge but also
relations with subordinates that differ from those required by first-level supervision…Since the
leadership of the second-level manager has to be mediated by the first-level supervisor, it is of
considerable theoretical interest as well as of practical consequence to determine the relative
contribution of the second-level manager to the performance of the operating group.” (1967, p.
236)
Manager higher than first-level can exert control in two ways:
1. Select subordinates who will perform their leadership and supervisory functions in
accordance with his/her implicit or explicit expectations, or
2. Influence by his/her own style of leadership the leadership style and administrative
behavior of his/her subordinate supervisors.
So, we are aware of leadership behaviors. But, why are some leaders more successful
than others? What makes a great leader? David Walker, Comptroller General of the United
States, described great leaders as “individuals who help to create the future and strive for
continuous improvement, with and through others while also discharging their stewardship
responsibilities.” (National Academy of Public Administration, 2005). Leaders enable others to
act by fostering collective group action, integrated toward a common good. (Kouzes & Posner,
2002). (Follett, 1918). McLarney and Rhyno (1999) studied Mary Parker Follett’s work on

43
leaders and group management with a lens of leadership and strategic management. Follett
believed that “leadership involved understanding the whole group and each individual member.
She felt that the leader must be able to see the potentialities of each group member, must be able
to coax them out, and then integrate each member’s capabilities to create a coherent whole. The
leader must unite the group and bring out their common purpose. They must then guide the
group to that common goal. At the same time, the leader is also a group member, so they have a
responsibility and obligation to group membership as well.” (McLarney & Rhyno, 1999, p. 294).
Leading in a World of Collaboration Governance
How does one achieve great leadership by collaborating? What behaviors does that
professional need demonstrate or implement? We know that managing networks and
partnerships between organizations is increasingly a skill demonstrated by successful
government leaders. (National Academy of Public Administration, 2005). There is an increasing
emphasis on the “merging of missions and more and more gray stage in what used to be black
and white.” Mary Lacy, a National Academy of Public Symposium Panel Member (2005),
stated that “it’s no longer win/lose. It’s work together, lead together to accomplish a greater
good. I’ve seen organizations that have been at each other’s throats for decades that in the last
couple of years that started to emerge as partners, strategic partners, as they align for more
complex missions. We can’t go it alone anymore.”

44
Contemporary research is now breaking down the role of leaders in the success of
collaboration so we can figure out how to replicate it, and perhaps train and plan for it. The
ability of the leader of an interagency group impacts the performance of the group. (Horwath &
Morrison, 2007). (Kouzes & Posner, 2002). Leaders must have two specific skills in order to
support collaboration: ability to create a climate of trust, and the ability to facilitate relationships.
Leaders in collaborative governance must be able to navigate across organizations and
throughout levels of government; they must be able to overcome barriers and boundaries. These
leaders are called boundary spanners. Boundary spanners serve as the catalyst for affecting
change or collaboration within and across groups more successfully than autocratic or highly
directive types of leaders. (Morse, 2010). These persons, sometimes recognized as
“collaboration champions” or “boundary spanners” are “committed, energized individuals who
have high levels of credibility, influence, charisma and integrity, acknowledged both internally
and externally by other agencies. They possess high quality interpersonal and networking skills,
which enable them to negotiate the interfaces, ambiguities, tensions and turf issues, which exist
between and within agencies. They provide the confidence and reassurance that is required for
the kinds of innovation and risk-taking without which collaboration may add little or no value.”
(Horwath & Morrison, 2007) (McGuire, 2006) (Perrone, Zaheer, & McEvily, 2003).
Trust and relationship building, intertwined with a sense of entrepreneurship, are key themes
within literature on these individual catalysts. (Morse, 2010.). (Perrone, Zaheer, & McEvily,
2003). Morse calls these the “sense of mutuality and connectedness,” and highlights the ability to

45
relate to others with compassion and understanding as a building block of collaboration (2007, p.
6). As the relationship is established, the leader consistently applies the practice of relationship-
building. The cross-boundary efforts to maintain personal relationships are critical to
collaboration. The leader operates to establish trust between organizations and to support
relationships based on cooperation and mitigation of barriers; the leader must network across
organizations for the common goal of the practice. (Williams, 2002). (Webb, 1991). (Morse,
2007).
Highly synergistic collaborations as having strong relationships amongst partners sustained
by trust. Boundary-spanners are those leaders who can overcome differences between
stakeholders and foster a collective sense of purpose while appreciating organizational
differences and resources. (William, 2002). (Perrone, Zaheer, & McEvily, 2003). (Lasker, Weiss
& Miller. 2001).
Practices of a Boundary Spanner (Horwath & Morrison, 2007). (Williams, 2002).
According to Kouzes and Posner (2002, p.25), “success in leading will be wholly
dependent upon the capacity to build and sustain those human relationships that enable people to
get extraordinary things done on a regular basis.” What do boundary spanners actually do?
Boundary spanners must have experience and knowledge of the group and of the context in
which the group operates (the internal and the external contexts). (Follett, 1930). The
boundary-spanner leader must be able to integrate the purpose and interests of his/her own

46
organization and of other agencies into one common vision for the group. This includes
spanning not always clearly defined or codified government boundaries, organizational
boundaries, and public-private boundaries (McLarney & Rhyno, 1999, p. 295). (Perrone,
Zaheer, and McEvily, 2003). (McGuire, 2006).
As relationships are bridged, successful leaders inspired trust and teamwork amongst the
group members. They are reliable and act in accordance with social equity practices (just, fair
and right) (Perrone, Zaheer, and McEvily, 2003, p., 423). (Kouzes & Posner, 2002). (Bosher, W.,
personal communication, Spring 2013). Kouzes and Posner (2002, p.18) reported that “when
leadership is a relationship founded on trust and confidence, people take risks, make changes,
keep organizations and movements alive.” Communication is key to establishing trust between
leaders and followers. Subsequently trust is a factor of cooperation between partners. (Horwath
& Morrison, 2007). (Das & Teng, 1998).
The leader is the “energizing force (in the) progressing enterprise.” (Follett, 1930, p. 57).
The personal relationship between leader and group members is a function of the leader’s
personality. Fiedler (1967, p.30) proposed that “the most important aspect of the good leader-
member relationship is of course that the leader, because he is liked and trusted, is able to obtain
his men’s compliance with a minimum of effort.” The “art of boundary spanning” as “building
sustainable relationships; managing through influencing and negotiation; managing complexity
and interdependencies; and managing roles, accountabilities, and motivations. The skills that

47
make up these competencies include communicating to create shared meaning, understanding,
empathy, conflict resolution, networking, creativity, innovation, empowerment, and building
trust as the “lubricant.” (McGuire, 2006, p. 38). This type of leader is referred to have a “trust-
based” leadership style in this research study.
Importance of Leadership within Collaborative Governance
We know leadership is important in government. We know collaboration is increasingly a
part of expected practice. What we do not know yet with certainty is how the two are important
to each other. Are they related? Or, are they just unrelated components of public administration
practice, and therefore success cannot be predicted? Is organizational success just happenstance
and there is no association of leadership orientation and practices within the collaborative
governance context? Or, as literature is collecting around evidence suggesting there is a
relationship for which organizational success can be accounted, is the role of leadership in
collaborative governance a specific practice that should be examined as deliberately important to
today’s practice of public administration?
Salamon (2002) details the shift in public administration from traditional methods of
hierarchical, direct management techniques to a framework of indirect application of a host of
tools called “new governance.” “New governance” is defined by two distinct features according
to Salamon: governance is “an emphasis on what is perhaps the central reality of public problem
solving for the foreseeable future – namely, its collaborative nature, its reliance on a wide array
of third parties in addition to government to address public problems and pursue public

48
purposes…the second feature…is a recognition that these collaborative approaches, while hardly
novel, must now be approached by a new, more coherent way, one that more explicitly
acknowledges the significant challenges that they pose as well as the important opportunities
they create.” (p. 8). Accomplishing the action of the collective has increasingly resulted in a
“blurring of boundaries,” between organizations. Governance is the structure that is formed
around the actions that cross those group boundaries. (Stoker, 1998, p. 21). (Williams, 2002).
Public administrators believe in the importance of the relationship when establishing
relationship with agents, and actively work to understand the motivations leading to performance
of goal attainment. Trust by group members in the leader is paramount to collective success, and
is not an overnight process. The leader must commit to engaging particular behaviors and
practices day in and day out to gain the trust of the group members. Communication, fulfilling
promises, active engagement and interaction, and feedback cycles are all behaviors that support
trust-building. (Van Slyke, 2007). (Morse, 2007). (Kouzes & Posner, 2002). The leadership
style of the administrator may impact conveyance and subsequent achievement of goals upon by
the group. Morse (2007, p. 13) states that “in an age of collaborative governance, where shared
problems and shared-power is the norm, the public leader must truly become the kind of person
with whom others can trust and respect. A focus on skills or tools will be useless if the personal
attributes are not in alignment. The attributes must come first.”

49
Fiedler’s theory of contingency-based leadership effectiveness provides a lesson for
public administrators to prepare for organizational success:
Leadership performance depends then as much on the organization as it depends upon the
leader’s own attributes. Except perhaps for the unusual case, it is simply not meaningful
to speak of an effective leader or of an ineffective leader; we can only speak of a leader
who tends to be effective in one situation and ineffective in another. If we wish to
increase organizational and group effectiveness we must learn not only how to train
leaders more effectively but also how to build an organizational environment in which
the leader can perform well. (1967, p. 261).
There is now a plea for application of this theory in practice. Contemporary scholars in
public administration reinforce the importance of leadership effectiveness in the collaborative
structure of current bureaucratic governance. The National Academy of Public Administration
published a five volume series of essays on the need for government to strengthen leadership
development and succession planning in bureaucracy, which were presented in a 2005
symposium. Panelists of the symposium articulated the skills and behaviors needed for leaders
to emerge as successful and further, to guide their organization to performance success.
“Working partnerships” was a characteristic panelist members emphasized as a role of successful
leaders. The field of public administration is called upon to develop a “cadre of leaders that can
operate across department missions and that gray stage others have called networking.

50
Governing, leading and managing by networking are a dimension that has emerged…in the last
few years as … organizations need to work together.” (National Academy of Public
Administration, 2005). However, there is an “enormous gap between what is expected of
[government] leaders and what they are capable of delivering.” Public administrators in
leadership positions now must be able to lead internally as well as within the context of
collaborative groups. Leaders must be able to achieve successful vertical performance within
their own agency as well as across multiple agencies who come together to accomplish common
goals. (Morse, 2007). (Agranoff & McGuire, 2003). These leaders perform “integrative public
leadership” which Morse (2010, p 231) defines as “a broad umbrella term to describe boundary-
crossing leadership.”
Research delineated the importance of the relationship building and the fostering of trust
within the group as paramount to successful collaboration. (Horwath & Morrison, 2007).
(Johnson, Wistow, Schulz, & Hardy, 2003). (Perrone, Zaheer, & McEvily, 2003). (Williams,
2002). (Morse, 2010). (Lasker, Weiss, & Miller, 2001). Merging academic appreciation of
leadership within collaboration with the practice of leadership in current public administrative
agencies is highlighted in modern government. The Final Report and Recommendations from
the 21st Century Manager Series reported that “closing this gap is essential of effective
government programs and overall fundamental well-being of the United States.” This study
examines the leadership effectiveness of one field of public administration, social work, in
navigating the collaborative governance structure of the interdependent group of leaders within

51
Local Departments of Social Services (LDSS’). Social work is one of the fastest growing career
fields in the United States. The practice of this public administration is expected to “grow by
25% between 2010 and 2020.” (NASW, 9/9/2013). NASW is the “largest membership
organization of professional social workers in the world, with 140,000 members. NASW works
to enhance the professional growth and development of its members, to create and maintain
standards for the profession, and to advance sound social policies. NASW also contributes to the
well-being of individuals, families and communities through its work and advocacy.” (NASW,
9/9/2013). Dr. Angelo McClain is the new Chief Executive Officer of NASW as of May 2013.
Dr. McClain articulated his vision for NASW and the social work practice in an August 28, 2013
interview:
Our profession, and our society, is at a unique juncture. The world has changed a great
deal…these times call for an ambitious grand vision. Our grand vision revolves around
strengthening America’s social safety net, by ensuring that all individuals have the
opportunity to improve their human well-being and are able to live free from social
injustice. We will do this by supporting social workers, advocating for the profession,
and ultimately serving the millions of clients helped by social workers each day…
“collaboration with all of our stakeholders and allies is critically important to our grand
vision. I firmly believe that in order for us to provide the best services, products, and
advocacy for our members, and social workers throughout the country, we must partner
and collaborate whenever possible…so that we can collectively represent the breadth of

52
the profession as well as to cater to the professional needs of each and every social
worker…to determine how we can build on our collective strengths and work together in
positive and meaningful ways.” (Waller, 2013).
Dr. McClain further stresses that “the NASW Code of Ethics outlines our primary
mission as working to enhance human well-being and helping to meet the basic human needs of
all people. We cannot realize that mission without an “all-hands-on-deck” approach to working
together.” (Waller, 2013).
Fiedler’s theory provides a framework for examining the current context of today’s
leadership in governance, and implications for practitioners of public administration to consider
in management of organizational performance which is increasingly dependent upon successful
collaboration by groups. According to Fiedler (1967, p.247), “…if leadership performance is in
fact a product of both the individual’s leadership style and the leadership situation then it is
logically impossible that one leadership style could serve in every context. On the other hand, it
also follows from this theory that we can improve group or organizational performance either by
changing the leader to fit the situation or by changing the situation to fit the leader.” Fiedler
posits that collaborative governance can be successful if public administrators successfully
architect leadership development and appropriately matching the leader with the corresponding
bureaucratic structure. Leadership recruitment and selection is “only effective when we can also
specify the relevant components of the situation for which the leader is being recruited” (p. 250)
Therefore, leadership training “should focus on providing the individual with methods for

53
diagnosing the favorableness of the leadership situation and for adapting the leadership situations
to the individual’s style of leadership so that he can perform effectively.” Further, organizational
engineering “should be possible to train the higher level manager to diagnose the leadership
situation of his subordinates and, knowing his subordinates’ leadership style, to modify the task,
the position power, or the group relations in a way which will make it compatible with the
leadership style of the executive.” (Fiedler, 1967, p. 260). This theory is used as a framework to
assess leadership of a professional group chartered to collaborate (the Virginia League of Social
Services Executives).
Virginia League of Social Services Executives
The Virginia League of Social Services Executives, Incorporated (VLSSE) is the
interacting group in this study. VLSSE is comprised of “any local department of social services
established pursuant to Section 63.2-324 of the Code of Virginia.” (Bylaws of the Virginia
League of Social Services Executives, Incorporated). The Local Departments of Social Services
are codified into existence, and the Local Director “shall act as an agent for the Commissioner in
implementing the provisions of federal and state law and regulation.” (§63.2-333) Partnership
with the Virginia State Department of Social Services is a requirement of the Code of Virginia;
collaboration amongst Local Directors of the 120 Local Departments of Social Services is
voluntary. Each LDSS makes a deliberate decision in regards to participating in the
collaborative group by joining and paying the annual membership dues. “Upon payment in full
of the local department of social service’s annual dues, the local department shall become a

54
member agency of the League. Each member agency shall have at least one representative. The
following individuals may serve as member agency representatives…” individuals designated as
directors or assistant directors; individuals who carry other titles but who function as directors or
assistant directors or who are designated as acting directors or acting assistant directors; and
individuals who are designated by the local governing body as directors/coordinators of
departments of human services for their locality and carry responsibility for the department of
social services.”
VLSSE elects a population of officers, including a president, a first vice-president, a
second vice-president, and third vice-president, a fourth vice-president, a secretary, a treasurer,
and one district representative elected from each of the five (5) regional districts.
The explicit purpose of the existence of VLSSE is to collaborate for accomplishing tasks:
“the object of the League shall be to foster collegial relationships among its members and
collaboration among agencies and governments in the formulation, implementation, and
advocacy of legislation and policies which promote the public welfare.” (Bylaws of the Virginia
League of Social Services Executives, Incorporated). Article II of the Bylaws additionally
delineates that relationship building amongst the VLSSE members is a main objective of the
group. The dual purposes of the group are to form positive relationships with one another and to
collaborate to accomplish common tasks.
The Virginia League of Social Services Executives satisfies the criteria of Fiedler’s
interacting group. Fiedler’s interacting group is designed to have multiple members working

55
collectively together toward a common task. Further, the leader is to coordinate the work of the
members in a “harmonious” manner, and the “hallmark of the interacting group is the
interdependence of group members.” (Fiedler, 1967, p 19). Leaders are clearly designated,
primarily through official electoral means. There is an elected leadership within the VLSSE
group.
Measuring Leadership within Collaborative Governance
This study utilized a compilation of three instruments that collectively assess leadership
and perception of collaborative success within a bureaucratic group. Demographic and control
variables supplemented the survey tool. The first two sections of the survey collected data both
on the leadership orientation (or relationship-need structure of the leader) and on the leadership
style (or behaviors). These sections focused on the orientation of the leader in regards to
relationship-building with members of the group and upon the behaviors leaders display to build
trust and foster collaborative efforts amongst the groups. The third section of the survey
assessed the perceived level of collaboration of the group leaders and followers.
Fiedler’s Least-Preferred Coworker (LPC) scale was the first of the instruments
incorporated into the survey instrument. The LPC was designed by Fiedler and his associates to
assess the interpersonal relationships between a leader and a follower that impact team
effectiveness, specifically the interaction between a leader and the person with whom he least
enjoys working. A high LPC “score seems to indicate relationship orientation and motivation to
achieve personal recognition and prominence.” A low LPC score “appears to indicate task

56
orientation. The self-esteem and adjustment of the high-LPC person tends to come from
relationships with others in his social environment, while the self-esteem and adjustment of the
low-LPC person tends to be derived from the intrinsic satisfaction of working on a task.”
(Fiedler, 1967, p. 60).
One subset of the Leadership Practices Inventory – Self (LPI – Self) was utilized for the
purposes of this study. Kouzes and Posner (2002) developed the LPI to assess leadership
behaviors along five dimensions, including Model the Way, Inspire a Shared Vision, Challenge
the Process, Enable Others to Act, and Encourage the Heart. The one dimension used in the
instrument developed for this study was Enable Others to Act. The researchers assessed
behaviors of fostering collaboration and building trust in the domain of Enable Others to Act.
Kouzes and Posner (2002, p.21) provided that “exemplary leaders strengthen everyone’s
capacity to deliver on the promises they make…Authentic leadership is founded on trust, and the
more people trust their leader, and each other, the more they take risks, make changes, and keep
organizations and movements alive.”
The third component of the survey instrument designed for this study is the Collaboration
Audit, as designed by Kouzes and Posner. (2002). This tool assessed the perceived success of
collaboration of the group by its members. Specifically, the instrument assessed the perceived
incidence of the group displaying successful collaborative behaviors including the “three
essentials of collaboration:” create a climate of trust, facilitate positive interdependence, and
support face-to-fact interactions. This audit scale is a five (5)-point Likert-type scale, which

57
aligns with the five levels of performance of collaboration as framed by Horwath and Morrison.
(2007). Both assess a score of four (4) on the Likert-type scale as indication of collaborative
success.
Two questions were added to the survey to assess the impact of any moderating variables
on the effects of the Independent Variables on Perception of Collaboration. Specifically, the one
question asked the satisfaction of the leadership of the VLSSE; one question asked the
satisfaction of the performance of the VLSSE. Research has demonstrated that leadership
satisfaction does moderate the main effect of leadership orientation in studies. (Bass & Bass,
2000). Bass and Bass (2009) identified multiple studies in which group satisfaction with
leadership moderated the impact of the leadership orientation. Additionally, the moderated
impact of satisfaction with leadership was greater upon relationship-oriented leaders.
Summary
Fiedler’s Theory of Leadership Effectiveness is a contingency model of leadership.
Leaders are successful if they are appropriately matched with the situation in which they perform
as a leader. There are three components to this model, which if in alignment and fully matched,
should yield positive performance of the groups of which the higher level managers lead. These
components are the orientation of the leader, the legitimacy of the leader’s power and the
structure of the group. The leader may be relationship-oriented or task-oriented. The power for
the manager to act as the group leader may be informal or formal and may originate from

58
varying sources. Further, the group may be organized to perform interdependent talks or may be
a sum of the parts and not require contact or regular interaction.
This study examines the context of contemporary government as one necessitating
collaboration as the rule and not the exception. Issues and problems facing today’s
administrative agencies are maturing and evolving into more complex and nuanced matters
involving multiple layers of actors and competitors. Collaborative governance is becoming
standard practice amongst governmental agencies, and is practiced across boundaries of levels of
government, public and private organizations and ancillary groups. Barriers to achieving
successful collaboration among partners are inevitable, and range from systemic ingrained
problems to manageable issues that may be mitigated.
Leadership is frequently cited as one of the keys to successful collaborative endeavors.
Practices and behaviors commonly utilized by leaders of successful collaborative enterprises
include a commitment to relationship-building and the capacity to build trust across boundaries.
These specific practices are common to leaders with the relationship-orientation leadership style.
This leadership propensity toward building and sustaining relationship and trust between group
members and across organizations is paramount in the practice of collaborative governance.
This study examines the association of leadership orientation and practices of leaders within the
Virginia League of Social Services Executives with the perceived collaborative performance of
the group.

59
CHAPTER 3 – RESEARCH METHODOLOGY
Introduction
This study was designed to assess association of perception of collaboration of an
interacting group of bureaucrats within a government organization. The purpose of the study
was to see if leadership orientation or behaviors of leaders (particularly trust-building) affect
perceived collaborative success of the group. The findings will contribute to expanding literature
on the role of trust-building as a leadership skill public administrators need in order to find
success in the modern expectation of collaborative governance and group performance. This
study assisted public administrators, academics and practitioners, in understanding the
importance of matching leadership style of group members with the context of collaborative
governance. This was relevant both for voluntary and for legislated collaboration within
bureaucracies.
Chapter 1 introduced the topic, and included the statement of the problem, the rationale
for the study, and the purpose of the study and research questions. Chapter 2 provided a review
of literature on collaboration, collaborative governance, and leadership in public administration
including examinations of leadership behaviors upon collaborations. The second chapter
reviewed the instruments used to measure leadership and collaboration in this dissertation.
Chapter 3 will delineate the research design and methodology, including an introduction, the
research design, the sample population, the instruments, the data collection procedures, the data
analysis, assessment of limitations, and a summary of the methodology. Chapter 4 will present

60
the analysis of the data, and the results and findings. Chapter 5 represents the conclusion of the
dissertation and recommendations for future research.
The researcher gathered data from members of the Virginia League of Social Services
Executives via an on-line survey, utilizing Survey Monkey. Survey Monkey is a popular web-
based survey platform which VLSSE currently uses to survey membership on various topics. A
cover letter explaining the purpose of the survey, with the link for the survey in the body of the
letter content, was electronically provided to the President of the VLSSE. The President then
forwarded the e-mail cover letter and link to current members of the VLSSE. This is standard
protocol for survey distribution to VLSSE members for survey material. The instrument utilized
is a compilation of survey questions from the Least Preferred Coworker Scale, the Leadership
Practices Inventory (LPI) and a Collaboration Audit. The Least Preferred Coworker Scale (LPC)
was designed by Fred Fiedler (1967) to assess the orientation of leaders toward relationship-
building in groups. The survey has been used and cited in a vast array of empirical studies and
validity and reliability have been well established. The Leadership Practices Inventory – Self was
designed by Kouzes and Posner (2002). This survey is to collect data on the behaviors displayed
by the members of the VLSSE, and also has been utilized in both academic study and practice.
Validity and reliability have been achieved for the LPI – Self. The Collaboration Audit was
designed by Kouzes and Posner (2002) as a supplemental tool to support agency assessment of
the level of collaboration within an organization. The audit aligns directly with Horwath and
Morrison’s (2007) framework of collaboration, which is the foundation of the levels of

61
collaboration used for this study. Demographic information was also collected in the survey
instrument. The survey included questions satisfaction with the VLSSE leadership and overall
satisfaction with the VLSSE group performance.
Research Questions and Hypotheses
Do characteristics of leaders impact the level of collaboration between local and state
governments? Particular leaders have been called catalysts to successful collaboration. (Morse,
2010.) What qualities do leaders have that spark high functioning collaborations? A framework
for collaboration identified by Horwath and Morrison (2007) was used to assess partnership
within the interacting group of primary and secondary level leaders.
The hypotheses developed from the research questions and the literature review are
below. One Dependent Variable was identified to study the Independent Variables within the
constructs in this study. Current research supports the assessment of “the effects of several
independent variables on one or more dependent variables.” (Frankfort-Nachmias & Nachmias,
2000, p. 50). The Dependent Variable is the perceived level of collaboration of VLSSE. The
two Moderating Variables are 1) satisfaction with VLSS performance, and 2) satisfaction with
the VLSSE leadership. The research questions and hypotheses were developed based upon the
review of the literature, and are as follows:
RQ1: Are Leadership Orientation and Collaboration associated?
H1A: Relationship-oriented Leadership Orientation is positively associated with

62
Perception of Collaboration.
H1B: Satisfaction of Leadership moderates the association of Leadership Orientation
with Perception of Collaboration
H1C: Satisfaction of Performance moderates the association of Leadership Orientation
with Perception of Collaboration.
RQ2: Are Leadership Styles and Collaboration associated?
H2A: Trust-building Leadership Style is positively associated with Perception of
Collaboration
H2B: Satisfaction of Leadership moderates the association of Leadership Style with
Perception of Collaboration.
H2C: Satisfaction of Performance moderates the association of Leadership Style with
Perception of Collaboration.
Research Design
This study seeks to contribute information to answering the question of the impact of
leadership style upon inter-governmental collaboration. There is a substantial body of literature
and research surrounding collaboration between partners, and there is a growing empirical

63
interest in the role of individual leaders as vehicles or motivators for successful collaboration.
Contribution to contemporary research upon characteristics of leaders sparking successful
collaboration between partners is needed.
This study is a non-experimental, quantitative design utilizing survey research methods.
The unit of measurement is the individual member of VLSSE. The survey will be self-
administered by VLSSE members. The instrument is designed to collect data in regards to
leadership (or followership) position in VLSSE, leadership style and behaviors, and perceptions
of success of the collaboration of the group as well as perceptions of group performance. The
purpose is to analyze data gathered from the survey of leaders in an interacting group to inform
public administration practitioners about matching leadership styles of government leaders with
the situation of collaborative governance for overall success.
This is a one-time survey questionnaire deployed utilizing electronic mail. The survey
method is utilized as a cost-efficient and time-efficient technique in collecting data across the
entire Commonwealth of Virginia. The adapted Dillman, Tortora, and Bowker (1998) method
for increasing e-mail and web-based survey questionnaire utilization and response rate shall be
applied with modifications as detailed in Table 3.1 Survey Distribution Method.
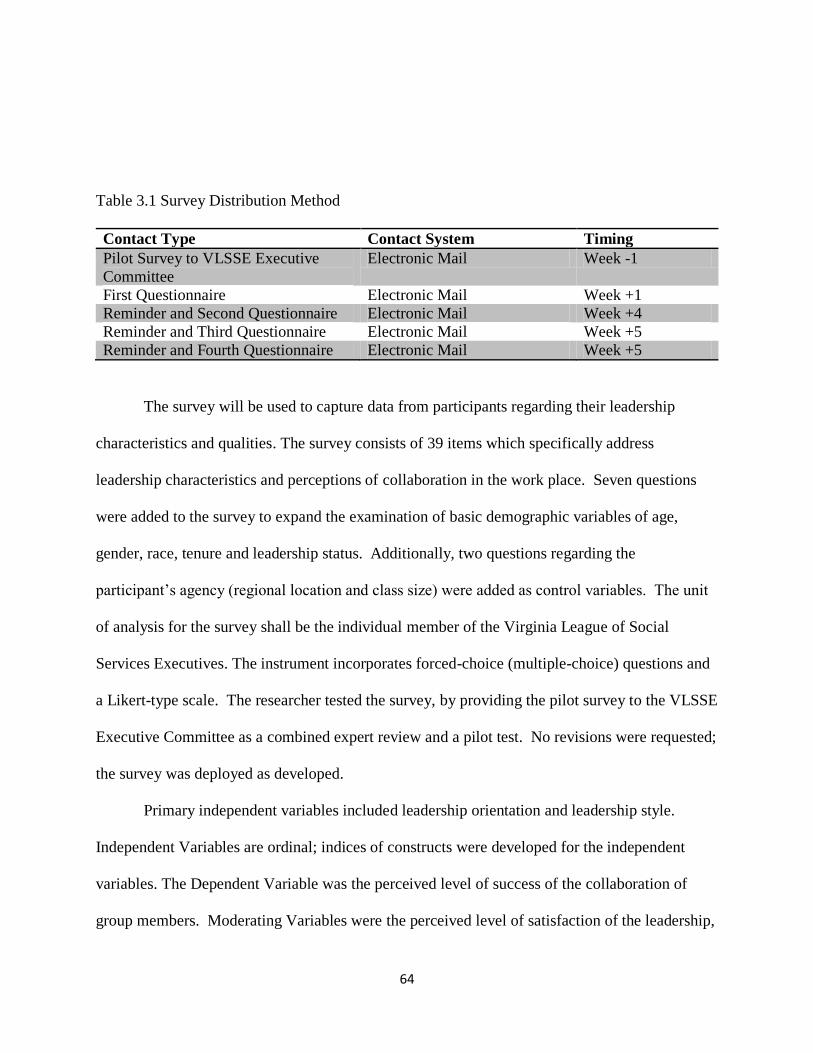
64
Table 3.1 Survey Distribution Method
Contact Type Contact System Timing
Pilot Survey to VLSSE Executive
Committee
Electronic Mail Week -1
First Questionnaire Electronic Mail Week +1
Reminder and Second Questionnaire Electronic Mail Week +4
Reminder and Third Questionnaire Electronic Mail Week +5
Reminder and Fourth Questionnaire Electronic Mail Week +5
The survey will be used to capture data from participants regarding their leadership
characteristics and qualities. The survey consists of 39 items which specifically address
leadership characteristics and perceptions of collaboration in the work place. Seven questions
were added to the survey to expand the examination of basic demographic variables of age,
gender, race, tenure and leadership status. Additionally, two questions regarding the
participant’s agency (regional location and class size) were added as control variables. The unit
of analysis for the survey shall be the individual member of the Virginia League of Social
Services Executives. The instrument incorporates forced-choice (multiple-choice) questions and
a Likert-type scale. The researcher tested the survey, by providing the pilot survey to the VLSSE
Executive Committee as a combined expert review and a pilot test. No revisions were requested;
the survey was deployed as developed.
Primary independent variables included leadership orientation and leadership style.
Independent Variables are ordinal; indices of constructs were developed for the independent
variables. The Dependent Variable was the perceived level of success of the collaboration of
group members. Moderating Variables were the perceived level of satisfaction of the leadership,

65
and the perceived level of satisfaction with the group performance. Dependent Variable has
ordinal level of measurement; construct index was developed for the broad concept of
collaboration as assessed by the Collaboration Audit. Control Variables included basic
demographic information as well as leadership status within the group.
The Dillman, Tortora, and Bowker (1998) approach to electronic mail and web-based
survey utilization was adapted to promote the highest response rate as possible while mitigating
survey dissemination validity issues. Coverage error of dissemination was minimized by the
nonprobability, purposive sampling method of requesting every identified professional
occupying a membership position in the Virginia League of Social Services Executives.
The research methodology was formally submitted to the Virginia Commonwealth
University Institutional Review Board for consideration and approval of study. The VCU IRB
Approval of the study methodology by the VCU IRB was approved through an exempt review
protocol given there was no identified risk to study participants. The researcher holds a current
CITI certification in IRB evaluation.
Sampling
The sample design for this study is single-stage. The unit of measurement is the leader of
a local government agency who serves as a member of the VLSSE. The population studied is a
purposeful, convenience, nonprobability sample and includes professionals currently in
identified membership roles within the Virginia League of Social Services Executives (VLSSE).
The study participants were identified from the VLSSE current membership roster.

66
Leaders within VLSSE will be determined through survey participant self-identification
as an elected leadership position. Those positions include:
o President
o First Vice President
o Second Vice President
o Third Vice President
o Fourth Vice President
o Treasurer
o Secretary
o District 1 Representative
o District 2 Representative
o District 3 Representative
o District 4 Representative
o District 5 Representative
Followers (non-elected leaders) within VLSSE were determined by self-identification as
not holding one of the above elected positions. Important to note is that several non-elected
members of VLSSE serve as Chairs of various collaborative committees, panels and workgroups.
This study focused on elected leadership within the interacting group, as in alignment with
Fiedler’s definition of leaders.

67
There are 120 agencies represented by members in the VLSSE. Some agencies have
more than one leader representative serve as a member in the VLSSE. For example, some an
agency may have both the Director and the Assistant Director of the Local Department of Social
Service be accepted members in the VLSSE. Therefore, the sample population consists of 141
Local Department of Social Services leadership representatives to VLSSE. The criteria for
participation in VLSSE includes “individuals designated as directors or assistant directors;
individuals who carry other titles but who function as directors or assistant directors or who are
designated as acting directors or acting assistant directors; and individuals who are designated by
the local governing body as directors/coordinators of departments of human services for their
locality and carry responsibility for the department of social services.”
VLSSE is an interacting bureaucratic group of leaders designed specifically to build trust
amongst the membership and to collaborate in order to achieve success in activities and tasks.
The elected leadership within VLSSE meets Fiedler’s description of second level management
which may “require not only different skills and task-relevant knowledge but also relations with
subordinates that differ from those required by first-level supervision.” (Fiedler, F., 1967, p.
236). This study will examine Fiedler’s assumption that “a measure of personality or behavior
which correlates with group performance provides one indication of the leader’s influence over
group performance.” (Fiedler, F., 1967, p. 237).
The researcher created an up-to-date list of every Local Department of Social Services
with current representation in VLSSE. (Refer to Appendix A. Sample Frame of Local

68
Departments of Social Services.) This is called the sampling frame, and is the actual population
sampled for the study. This sampling frame was used to ensure that each member of VLSSE was
given the opportunity to participate in the research study as a survey participant.
Participation in the survey is voluntary, and a cover letter accompanying the survey
delineated the purpose of the study as well as consent. The consent information delineated that
the information shared would be kept confidential and that they were free to withdraw from the
completing the survey at any time. Participants were be compensated for their participation.
Participants were provided contact information in the cover letter for the researcher, as well as
for the dissertation committee chair. The cover letter stated that the researcher can be contacted
after the close of the study for a debriefing of data analysis and results.
Measurement
The first part of the instrument included the Least Preferred Co-worker Scale from
Fiedler’s research on the Contingency Model of Leadership. This tool was designed to examine
the perception of the role of trust by a manager within the work place. There were 18 questions,
which use a Likert-type scale, utilizing a one (1) to eight (8) point distribution. This portion of
the questionnaire should take approximately six (6) minutes.
The second part of the survey included elements from particular domains of the
Leadership Practices Inventory – Self (LPI - Self). This is a 30 item survey designed to capture
self-identification of leadership behaviors in an organization. The items are designed to measure
the Kouzes and Posner identified “five key practices of exemplary leaders.” These leadership

69
practices include: “model the way, inspire a shared vision, challenge the process, enable others to
act, and encourage the heart.” (Kouzes & Posner, 2002, p. 13). The instrument captures self-
perceived frequency of the particular behavior on a 10-point scale: 1 (Almost never do what is
described in the statement); 2 (Rarely); 3 (Seldom); 4 (Once in a while); 5 (Occasionally); 6
(Sometimes); 7 (Fairly Often); 8 (Usually); 9 (Very Frequently); 10 (Almost always do what is
described in the statement). The domain utilized in this study are relevant to leadership
practices associated in the literature with collaborative governance: “enable others to act.” This
subsection has 6 questions. The questions are non-consecutively placed in the original LPI-Self;
this placement strategy was maintained for this study to reduce content validity issues. The
section of the survey should take approximately five (5) minutes to complete.
The third part of the survey instrument is a Collaboration Audit, as designed by Kouzes
and Posner (2002, p. 287). The survey utilized a 5-point Likert scale to assess how much the
participant agrees with particular aspects of collaboration by the organization (or group). The
scale includes the following items: 1 (Strongly Disagree), 2 (Disagree), 3 (Neither Disagree nor
Agree), 4 (Agree) and 5 (Strongly Agree). This section of the survey should take approximately
five (5) minutes.
The final part of the survey instrument assessed overall group satisfaction with the
VLSSE leadership and perception of the group VLSSE performance. Items also captured
demographic information, including gender, age, race, and leader/follower position in VLSSE.

70
The region location (Northern, Eastern, Central, Piedmont, Southwest) and class size (1, 2 or 3)
of each LDSS from the study participant was collected in this section.
Variables and Statistics
There was one Dependent Variable. This was the perceived success of the VLSSE
collaboration (Perception of Collaboration). The two Moderating Variables were the reported
satisfaction with the VLSSE leadership (Leadership Satisfaction) and the reported satisfaction
with the VLSSE group performance (Performance Satisfaction).
There were two independent variable constructs. An index may be constructed when
research is examining broad concepts, and is an accepted statistical method when evaluating a set
of responses that reflect the attitude of the study participant. This is referred to as an attitude
index. (Frankfort-Nachmias & Nachmias, 2000). These constructs are the leadership orientation
of the VLSSE leaders and the frequency of the leadership practice of “enable others to act” by
the VLSSE leaders.
Individual variables are ordinal. Constructs of variables are at the index level of
measurement. Refer to Table 3.2 for operationalization of the variables, including the level of
measurement. Refer to Figure 3.1 and Figure 3.2 for representation of the hypothesized effect of
the moderating variables on the relationship between the Independent Variables and the
Dependent Variable.

71
Table 3.2 ResearchVariables
Variable Definition Indicator Level of
Measurement
Dependent
Variable1
Perceived success
of collaboration
Mean score of
III.A.
Collaboration
Audit
Index
Moderating
Variable1
Satisfaction of
VLSSE leadership
Mean score of
Question III.B.1.
Ordinal
Moderating
Variable2
Satisfaction with
VLSSE
performance
Mean score of
Question III.B.2.
Ordinal
Independent
Variable1
Leadership
Orientation of
VLSSE leaders
Mean score of
Least Preferred
Co-Worker Scale
Index
Independent
Variable2
Leadership Style
(Enable Others to
Act) of Leader
Mean score of
Enable domain of
Part II.
Index

72
Figure 3.1 Hypothesized Interaction of Research Question 1 Variables
Research Question 1 (RQ1): Are Leadership Orientation and Collaboration associated?
Hypothesis 1A (H1A): Relationship-oriented Leadership Orientation is positively associated with
Perception of Collaboration.
Hypothesis 1B (H1B): Leadership Satisfaction moderates the association of Leadership
Orientation with Perception of Collaboration.
Hypothesis 1C (H1C): Performance Satisfaction moderates the association of Leadership
Orientation with Perception of Collaboration.
No moderating effect of Satisfaction of Leadership
between Leadership Orientation and Perception of
Collaboration
Moderating effect of Leadership Satisfaction on
Leadership Orientation and Perception of
Collaboration
Moderating effect of Performance Satisfaction
on Leadership Orientation and Perception of
Collaboration
Pleasant
Friendly
Rejecting
Tense
Distant
Cold
Supportive
Boring
Quarrelsome
Gloomy
Backbiting
Untrustworthy
Considerate
Nasty
Agreeable
Insincere
Kind
Independent Variable (Attitude Index: Leadership Orientation)
I am satisfied with the leadership of the VLSSE
I am satisfied withe performance of VLSSE.
Moderating VariableAct in a trustworthy and trusting manner.
Ask others for help and assistance when needed.
Treat others with dignity and respect.
Talk openly about their feelings.
Listen attentively to the opinions of others.
Express clarity about the group’s goal.
Make personal sacrifices to meet the larger group goal.
Can rely on each other.
Pitch in to help when others are busy or running behind.
Give credit to others for their contributions.
Interact with each other on a regular basis.
Treat every relationship as if it will last for a lifetime, even if it won’t.
Make it their business to introduce their colleagues to people who can help them succeed.
Freely pass along information that might be useful to others.
Relate will to people of diverse backgrounds and interests.
Dependent Variable (Attidude Index: Perception of Collaboration)

73
Figure 3.2 Hypothesized Interaction of Research Question 2 Variables
Research Question 2 (RQ2): Are Leadership Styles and Collaboration associated?
Hypothesis 2A (H2A): Trust-building Leadership Style is positively associated with Perception of
Collaboration.
Hypothesis 2B (H2B): Leadership Satisfaction moderates the association of Leadership Style
with Perception of Collaboration.
Hypothesis 2C (H2C): Performance Satisfaction moderates the association of Leadership Style
with Perception of Collaboration.
No moderating effect of Satisfaction of Leadership
between Leadership Style and Perception of
Collaboration
Moderating effect of Leadership
Satisfaction on Leadership Style and
Perception of Collaboration
Moderating effect of Performance
Satisfaction on Leadership Style and
Perception of Collaboration
I develop cooperative relationships among the people with work with.
I actively listen to diverse points of view.
I treat others with dignity and respect.
I support the decisions that people make on their own.
I give people a great deal of freedom and choice in deciding how to do their work.
I ensure that people grow in their jobs by learning new skills and developing themselves.
Independent Variable (Attitude Index: Leadership Style [Enable Others to Act])
I am satisfied with the leadership of the VLSSE
I am satisfied with the performance of the VLSSE.
Moderating VariableAct in a trustworthy and trusting manner.
Ask others for help and assistance when needed.
Treat others with dignity and respect.
Talk openly about their feelings.
Listen attentively to the opinions of others.
Express clarity about the group’s goal.
Make personal sacrifices to meet the larger group goal.
Can rely on each other.
Pitch in to help when others are busy or running behind.
Give credit to others for their contributions.
Interact with each other on a regular basis.
Treat every relationship as if it will last for a lifetime, even if it won’t.
Make it their business to introduce their colleagues to people who can help them succeed.
Freely pass along information that might be useful to others.
Relate will to people of diverse backgrounds and interests.
Dependent Variable (Attidude Index: Perception of Collaboration)

74
Reliability and Validity
Reliability is the measure that indicates the success a measure has in measuring the same
variable time and again. “Reliability refers to the accuracy (consistency and stability) of
measurement by a test.” (Isaac & Michael, 1995, p. 134). A reliability coefficient is used to
assess the amount of error in variability of the instrument or item. Cronbach Alpha is one
accepted statistical measure of a reliability coefficient. A Cronbach Alpha above 0.70 is a
generally acceptable level of reliability in an instrument or item.
Least Preferred Coworker Scale
Rice (1979, p. 291)) found the “internal consistency of the LPC scale is high.”
Coefficient alpha for multiple assessments of the LCP scale were in the 0.90 and 0.91 range.
(Rice, 1979). This is an acceptable coefficient alpha. Further, “test-retest reliability of LPC is
generally acceptable when based on data from adult populations functioning in their normal
environment during the test-retest interval.” (Rice, 1979, p. 292). The study participants
completed the survey instrument during the course of their normal duties without any
experimentally intervening change-oriented experiences.
Leadership Practices Inventory (Self)
Kouzes and Posner examined the means, standard deviations and Cronbach Alpha
of the LPI-Self (2002). The domain “Enable Others to Act,” was assessed to have an excellent
level of reliability in past research efforts (Cronbach Alpha = 0.75). Gender, race/ethnicity, and
level of leadership have not been found to be relevant to the reliability of the LPI-Self.

75
Collaboration Audit
The Collaboration Audit is a tool developed by Kouzes and Posner (2002) based on their
extensive research and experience with organizations performing collaborative tasks. The tool
has been used for more than a decade in various leadership and management arenas, and has
consistently been applied and analyzed for organizational performance with collaborative
endeavors. Kouzes and Posner developed the Collaboration Audit to directly assess several
indicators of the statistically reliable Leadership Practices Inventory – Self. This alignment
supports the reliability of the instrument. Kouzes and Posner have not realized any empirical
rationale for concern over reliability of the audit, and have maintained the same content of the
tool over the years.
Validity
Validity is the level of assurance that an instrument or item actually assesses the aspect
intended for assessment.
Least Preferred Coworker Scale
The Least Preferred Coworker Scale’s Cronbach’s alpha was displayed at a 0.91 level,
indicating good reliability of this part of the questionnaire. Validity of the LPC has been
contested by scholars, but construct validity of leadership as value-related attitudes was found to
be sound. (Rice, R., 1978.) To reduce threats for validity, the LPC was used within that context
in instructions and analysis.

76
Leadership Practices Inventory Self
Face validity was found to be excellent of the LPI-Self (Kouzes & Posner, 2002, p 14),
and factor analysis revealed that the items within each of the five practices of leadership relate
more to each other than across the other practices.
Collaboration Audit
Kouzes’ and Posner’s 2002 Collaboration Audit aligns directly with the Horwath and
Morrison framework of collaboration. This alignment supports the level of content validity of
the collaboration assessment tool, as Horwath’s and Morrison’s 2007 framework is grounded in
significant research surrounding partnership, collaboration and integration. Further, Kouzes and
Posner (2002) developed the Collaboration Audit to directly assess several indicators of the
statistically valid Leadership Practices Inventory – Self. This alignment supports the construct
validity of the instrument.
Data Analysis
Survey Monkey provides the ability to upload the collected data directly into SPSS. The
data was loaded into SPSS. SPSS was be utilized to perform statistics, both descriptive and
inferential. The individual data have ordinal level of measurement; attitude indexes were be
constructed. The data cannot be considered interval level data given there is no evidence that the
distance between rank in the scales is consistent between ranks or between study participants.
Frequencies, ranges, means and modes were performed for descriptive statistics. Factor
analysis was performed to assess the Leadership Orientation construct. Linear Regression was

77
performed on the data, including a moderated regression analysis. Control variables were
assessed for spurious relations with the Independent Variables. Reliability and validity analyses
of the questionnaire were used to confirm the assessment.
Mitigating Threats to Reliability and Validity
Validity and reliability were enhanced by pre-testing the interview questions with a
sample of the study population. This sample consisted of members of VLSSE who serve on the
Executive Committee. The Executive Committee is comprised of both elected leaders and non-
leaders (followers) within VLSSE, all of whom are recognized by their fellow members as
experts in the practice of leadership for Local Departments of Social Services. This sample of
the greater study population provided feedback on the survey (no edits or adjustments were
required.
Limitations
Limitations of this research effort included the sampling methodology. The sample was a
small, purposeful population within one government agency partnership (social services).
Results were not able to be generalized to all government partnerships, although provided
opportunities for further consideration for different groups within similar fields (i.e., within the
Health and Human Services Secretariat). The survey combined three separate questionnaires,
which may have impact the validity of the independent scales, as well as contributed to survey
fatigue from the length of the survey. While the LPC Scale and the LPI – Self assessment both
have significant empirical review of validity and reliability, the Collaboration Audit has not had

78
the depth or array of study. There is alignment of the tool with the collaboration framework used
as a foundation in this study, and the tool is closely linked with statistically valid and reliable
measurement tools (i.e., LPI – Self). However, independent scholarly assessments have not been
conducted.
Summary
This study examined the association of leadership orientation and practices to success of
collaboration within a group of leaders in the Commonwealth of Virginia’s Local Departments
of Social Services. The interacting group was specifically formed to foster collaboration and
enhance collective performance toward improving network management for the betterment of
public welfare. The sample consisted of every member of the Virginia League of Social Services
Executives. Data was collected through a survey research design methodology. Results of this
study will contribute to the expanding body of literature on the role of boundary spanners in
scenarios of collaborative governance. Public administration practitioners could use the results
of the study to better assess and match the orientation of leaders (task or relationship-building)
with the nature of the management tasks (hierarchical or collaborative). Implications of this
study may be used to enhance succession planning management of leaders in the human services
field, and other public administration arenas that increasingly utilize collaboration as a backbone
of the administrative management of agencies.

79
CHAPTER 4 – ANALYSIS OF THE DATA, RESULTS, AND FINDINGS
Introduction
This purpose of this study was to evaluate association of Perception of Collaboration
within a professional group of leaders within an administrative agency with their leadership
orientation. Additionally, the particular leadership style of trust-building, was examined for
association with perceived collaborative success. Active members of the Virginia League of
Social Services Executives (VLSSE) were surveyed for this research. Three instruments were
integrated into one survey tool, including:
1. the Least Preferred Co-worker Scale (LPC) by Fred E. Fiedler (1967),
2. the Leadership Practices Inventory (Self) Domain 4 (Enable Others to Act) by James
Kouzes and Barry Posner (2002), and
3. the Collaboration Audit by James Kouzes and Barry Posner (2002).
Participants were also asked about their satisfaction with VLSSE performance (Performance
Satisfaction) and with VLSSE leadership (Leadership Satisfaction), in addition to items from
each of the three instruments as described above. Basic demographic questions were presented
at the end of the survey, including whether the participant currently held an elected leadership
position within the VLSSE group. Information about the agency which the respondent
represented in the VLSSE (size and geographic region of the agency) was also collected.

80
The instrument was delivered to the members of VLSSE according to the normative process
established by the VLSSE Executive Committee. VLSSE utilizes Survey Monkey as the method
to seek feedback and opinion upon issues and topics before the group. Survey Monkey
(www.surveymonkey.com) is a web-based survey platform which facilitates survey development
and deployment, as well as acts as a vehicle for data collection. The researcher provided the
pilot survey (in Survey Monkey), and accompanying cover letter, to the President of the VLSSE,
for distribution, review and feedback by the Executive Committee. (Refer to Appendix D.
Leadership in Collaborative Governance Survey.) (Refer to Appendix C. Leadership in
Collaborative Governance Cover Letter.) The Executive Committee had no comments or points
for editing, and approved distribution of the survey.
The VLSSE Executive Committee then released the survey, with accompanying cover letter,
to the active membership of the group on February 3, 2014. The survey was closed on March 9,
2014. The survey was distributed to 141 VLSSE members. The researcher provided reminder
notices for participation to the VLSSE President throughout the period of time the survey
remained open. The VLSSE President facilitated the delivery of these reminder notices to the
members on the following dates:
February 24, 2014 (Refer to Appendix E. First Survey Reminder Letter),
March 4, 2014 (Refer to Appendix F. Second Survey Reminder Letter), and
March 7, 2014 (Refer to Appendix G. Third Survey Reminder Letter).

81
The Least Preferred Co-worker Scale portion of the survey consisted of 18 questions for
respondents to assess their perception of the person with whom they least enjoyed working in a
professional setting. (Fielder, F., 1967). The LPC was designed to capture the Leadership
Orientation of the respondent through the exercise of considering others. Low scores indicate a
task-based leadership orientation; high scores indicate relationship-based leadership orientation.
The Leadership Practices Inventory (Self) was an instrument developed by Kouzes and
Posner to determine frequency in which leaders engaged in particular behaviors. (2002). The
researchers organized the assessed behaviors across five domains, as validated by factor analysis
in prior studies. (CITE) The current study utilized the fourth domain (Enable Others to Act).
This domain represented the Leadership Style practices leaders utilize in relationship- and trust-
building with colleagues and staff. This domain was chosen as relationship and trust-building is
considered a critical component in the relationship-based leadership orientation. (Howell and
Costley, 2006). The six questions from this domain were utilized in the survey instrument
delivered to the membership of the VLSSE. The original Kouzes and Posner sequential ordering
of the questions was maintained in this section of the instrument for this research study.
The Collaboration Audit was a tool developed by Kouzes and Posner (2002) to assess the
level of collaboration throughout an organization or group. The incorporated tool consisted of
15 statements to be considered across a Likert-type scale by respondents. Kouzes and Posner
direct respondents to consider that items that have scores less than a four (4) on the scale should

82
be considered to have room for improvement and should be closely considered as not using
successful collaborative practices in the group.
The Virginia League of Social Services Executives is a professional group of leaders from
the 120 Local Departments of Social Services (LDSS) across the Commonwealth of Virginia.
Active members may hold a Director or Assistant Director (or equivalent) position within their
respective LDSS agency. Therefore, the number of VLSSE members may exceed the number of
LDSS within the Commonwealth. The number of VLSSE active members fluctuates year to
year. There were 141 active VLSSE members upon release of the survey to the group. The
results reported in this study were based upon the responses of 53 VLSSE members who
participated in the survey in February and March 2014. This represents a 38% response rate of
potential survey respondents. The responses were exported to IBM SPSS Statistics 22 (SPSS),
which is a statistical software program originally designed for utilization in the social sciences
realm. Descriptive and statistical analytics were performed by the researcher upon the data
within SPSS.
The next section of Chapter 4 will provide the demographic information regarding the
respondents to the survey. The second section will present the statistical analysis of the data
collected in regards to Leadership Orientation, Leadership Style and Perception of Collaboration.
The research questions will be reviewed. The respective hypotheses for each research question
shall be accepted or rejected based upon the findings of the data analysis. The final section of

83
the chapter will present the summary findings of the research, and address limitations of the
research.
The research questions and relevant hypotheses, framed on Fiedler’s leadership effectiveness
theoretical foundation and based on the review of literature, were:
RQ1: Are Leadership Orientation and Collaboration associated?
H1A: Relationship-oriented Leadership Orientation is positively associated with
Perception of Collaboration.
H1B: Satisfaction of Leadership moderates the association of Leadership Orientation
with Perception of Collaboration
H1C: Satisfaction of Performance moderates the association of Leadership Orientation
with Perception of Collaboration.
RQ2: Are Leadership Styles and Collaboration associated?
H2A: Trust-building Leadership Style is positively associated with Perception of
Collaboration
H2B: Satisfaction of Leadership moderates the association of Leadership Style with
Perception of Collaboration.

84
H2C: Satisfaction of Performance moderates the association of Leadership Style with
Perception of Collaboration.
Demographic Data
The third section of the survey tool was designed to collect demographic data in regards
to the participant, as well as geographic and size data about the agency of which the participant
represented in the VLSSE. This includes gender, age, race/ethnicity, number of years in current
LDSS position, and leadership status within the VLSSE. Questions in regards to the represented
agency included geographical region and class size of the LDSS.
Gender of Respondent
The majority of respondents identified themselves as female (71.2%) as opposed to male
(28.8%). (Refer to Table 4.1.) The current actual frequencies of gender distribution amongst
active VLSSE members is similar to the response distribution from survey participants. (Refer
to Table 4.2.) This data was utilized as a control variable to assess for spurious relations upon
Independent Variable association with the Dependent Variable. No relations were determined.
(Refer to Table 4.23 and Table 4.24).
Age of Respondent
Nearly half of survey participants identified themselves as between the ages of 55 years
and 64 years (46.2%). The second highest age grouping of participants were between 35 and 44

85
years-old (25%). (Refer to Table 4.1) This data was not utilized as a control variable due to the
wide distribution for the small sample size. (Refer to Table 4.23 and Table 4.24).
Race/Ethnicity of Respondent
The majority of survey participants identified themselves as White (88.2%).
Respondents identified themselves in equal distribution between two other race/ethnicity
categories (Black, Other). No respondents identified themselves in the remaining categories of
this survey question (Asian, Hispanic). (Refer to Table 4.1.)
This variable was recoded into a different variable in order to organize the data into two
binary variables to be utilized as a Control Variable. The recoded race variable (White or Non-
white) was found to have no restricting effect upon the Independent Variables. (Refer to Table
4.23 and Table 4.24).
Years in Current Local Department of Social Services Position
Over half of respondents to the survey identified they were relatively new to their
position within the LDSS; 59.6% of participants have held their current leadership position
within their agency for 6 years or less. Participants with 13 or more years occupying their
current position within their agency were the third most frequent responder to this question.
(Refer to Table 4.1.) This variable was not assessed as a control variable due to the wide
distribution across several response options for the small response population.

86
VLSSE Position
Eight survey participants identified themselves as holding an elected position of
leadership with the VLSSE. There are twelve leadership positions within the VLSSE (President,
First Vice President, Second Vice President, Third Vice President, Fourth Vice President,
Treasurer, Secretary, District 1 Representative, District 2 Representative, District 3
Representative, District 4 Representative, and District 5 Representative). 67% of elected leaders
with the VLSSE participated in and identified themselves as such in this research survey. (Refer
to Table 4.1.) This variable was utilized as a control variable. No spurious relations between
VLSSE position and any of the Independent Variables was determined. (Refer to Table 4.23 and
Table 4.24).
Geographic Region of Local Department of Social Services
Survey participants were well distributed across the Commonwealth of Virginia, which
closely modeled the actual distribution of number of agencies per region. (Refer to Table 4.1.)
(Refer to Table 4.2.) Given the small sample size and considerable distribution over five (5)
geographic options, this variable was not assessed as a control variable.
Class Size of Local Department of Social Services
Survey participants identified themselves largely as representative of the actual
distribution of agencies across the Commonwealth. (Refer to Table 4.1.) (Refer to Table 4.2.)

87
This variable was utilized as a control variable, but not found to have any spurious relation.
(Refer to Table 4.23 and Table 4.24).

88
Table 4.1 Participant Demographics
Variable Frequency
Valid
Percent
Gender
Female 37 71.2%
Male 15 28.8%
Age
25-34 1 1.9%
35-44 13 25.0%
45-54 10 19.2%
55-64 24 46.2%
65-74 4 7.7%
Race/Ethnicity
White 45 88.2%
Black 3 5.9%
Other 3 5.9%
Years in Position
1-3 Years 17 32.7%
4-6 Years 14 26.9%
7-10 Years 7 13.5%
10-12 Years 3 5.8%
13 Years or More 11 21.2%
Position Status
Elected 8 15.4%
Member, Non-
elected 44 84.6%
Geographic Region
Northern 10 19.6%
Eastern 10 19.6%
Central 11 21.6%
Piedmont 10 19.6%
Southwest 10 19.6%
Class Size
Class 1 11 21.6%
Class 2 28 54.9%
Class 3 12 23.5%

89
Table 4.2 VLSSE Demographics
Variable Frequency
Valid
Percent
Gender
Female 103 73.0%
Male 38 27.0%
Geographic Region
Northern 25 21%
Eastern 23 19%
Central 26 22%
Piedmont 24 20%
Southwest 22 18%
Class Size
Class 1 34 28%
Class 2 60 50%
Class 3 26 22%
Results
This section will open with the presentation of the respondents’ overall perception of
VLSSE success of collaboration as a group. The data of the two primary Independent Variables
will then be presented, including the factor loading of the Independent Variable Leadership
Orientation. The results of statistical analysis of Leadership Orientation and Perception of
Collaboration will be presented. The results of statistical analysis of Leadership Style and
Perception of Collaboration will then be presented. The effects of Moderating Variables upon
the relationship of the Independent Variables and the Dependent Variable will be presented. The
researcher will then present the results of correlation analysis of Leadership Orientation and

90
Leadership Style, as prior empirical research findings reveal that trust-building is a critical
component of relationship-based leadership orientation. The Leadership Style as assessed in this
research is specifically the trust-building domain, and according to literature, be positively
associated with the Leadership Orientation of relationship-building. The section will close with
consideration of the restrictions identified Control Variables have upon the Independent
Variables.
VLSSE Perception of Collaboration
Kouzes and Posner (2002) established their Collaboration Audit for groups to assess how
collaborative their organization as demonstrated to perception of frequency of behaviors
indicative of collaborative agencies. The authors developed a fifteen item Likert-type survey of
collaborative behaviors. Kouzes and Posner conclude that an item that does not receive a level
of agreement by the respondent (equivalent to a score of 4) should be reviewed by the
organization as an unsuccessful collaborative effort. “If you rate any items in the “Collaboration
Audit” below a 4, take a look at what you can do to develop a more collaborative approach
among your constituents (Kouzes & Posner, 2002, p. 266). Thus, the “breakpoint” for
organizational or group success with collaboration as assessed in their Collaboration Audit is a
score of 4 (Agree).
Survey respondents indicated differing levels of agreement with items in the
Collaborative Audit. The overall mean average score of the Collaboration Audit was 3.85, with

91
a standard deviation of 0.66. (Refer to Table 4.3.) This puts the overall assessment of
collaboration near or around Kouzes’ and Posner’s breakpoint for successful collaboration.
Table 4.3 Mean Score of Perception of Collaboration
Variable n M SD Minimum Maximum
Perception of
Collaboration 50 3.85 0.66 1.80 5.00
A level of positive agreement (“Agree” or “Strongly Agree”) was assessed by survey
respondents with six items in the Collaboration Audit. (Refer to Table 4.4.) (Refer to Appendix
I. Frequencies of Collaboration Audit Positive Agreement Items.)
Respondents indicated their perception of nine of the fifteen items in the Collaboration
Audit as below the breakpoint of four (4) or successful collaboration by the group. These items
should be considered as not successfully collaborative by the VLSSE group, and could use closer
examination for improvement, according to the audit instructions from Kouzes and Posner
(2002). (Refer to Table 4.4.) (Refer to Appendix J. Frequencies of Collaboration Audit
Disagreement or No Agreement Items.)

92
Table 4.4 Perception of Collaboration: Frequencies of Items Above and Below Breakpoint
Variable Mean Median SD Minimum Maximum
Positive
Act in a trustworthy and trusting
manner. 4.19 4.00 0.79 1.00 5.00
Ask others for help and assistance
when needed. 4.37 4.00 0.56 3.00 5.00
Treat others with dignity and respect. 4.09 4.00 0.71 2.00 5.00
Can rely on each other. 4.04 4.00 0.88 1.00 5.00
Interact with each other on a regular
basis. 4.06 4.00 0.79 2.00 5.00
Freely pass along information that
might be useful to others. 4.08 4.00 0.98 2.00 5.00
Negative
Talk openly about their feelings. 3.70 4.00 0.95 1.00 5.00
Listen attentively to the opinions of
others. 3.75 4.00 0.98 1.00 5.00
Make personal sacrifices to meet the
larger group goal. 3.70 4.00 1.07 1.00 5.00
Pitch in to help when others are busy
or running behind. 3.85 4.00 0.79 2.00 5.00
Give credit to others for their
contributions. 3.88 4.00 0.98 1.00 5.00
Treat every relationship as if it will
last for a lifetime, even if it won't. 3.10 4.00 0.91 1.00 5.00
Make it their business to introduce
their colleagues to people who can
help them succeed. 3.62 4.00 1.02 1.00 5.00
Relate well to people of diverse
backgrounds and interests. 3.90 4.00 1.00 1.00 5.00

93
Leadership Orientation of VLSSE
Leadership Orientation was assessed using the Least-Preferred Coworker (LPC) Scale.
Leadership Orientation falls along the spectrum of task-based or relationship-based. (Fiedler, F.,
1967.) Respondents indicated their perception of the person with whom they least preferred to
work along a spectrum between two bi-polar adjectives or descriptors of that person. The total
score of this section of the survey was applied as Fiedler indicates for assessment of leadership
orientation: lower scores indicate orientation toward task-based leadership; higher scores indicate
orientation toward relationship-based leadership. The researcher recoded the variables into
different variables to collapse the distribution into binary variables: task-oriented and
relationship-oriented. Nearly three-quarters of the population were assessed to have relationship-
based leadership orientation.
Table 4.5 Leadership Orientation of Respondents
Variable Frequency Valid Percent
Task Oriented 9 25.7
Relationship Oriented 26 74.3%
The researcher conducted factor analysis to determine loading of the bi-polar descriptives
for the study population. The variable items loaded onto four factors in the model. Refer to
Table 4.6.

94
Table 4.6 Factor Loadings for Principal Component Analysis of Leadership Orientation
Item
Interactions
with Others
Closeness
toward
Others
Reception
of Others
Personal
Attitude
Unpleasant/Pleasant 0.744 0.141 -0.174 -0.272
Unfriendly/Friendly 0.679 0.255 0.01 -0.515
Rejecting/Accepting 0.817 0.16 -0.125 -0.082
Tense/Relaxed 0.498 0.533 0.01 0.338
Distant/Close 0.529 0.69 0.221 -0.167
Cold/Warm 0.713 0.521 0.01 -0.182
Hostile/Supportive 0.739 -0.048 -0.43 -0.062
Boring/Interesting 0.249 0.182 0.599 0.344
Quarrelsome/Harmonious 0.637 -0.279 -0.407 0.358
Gloomy/Cheerful 0.499 0.188 -0.176 0.543
Guarded/Open 0.485 0.309 0.561 0.226
Backbiting/Loyal 0.8 -0.226 0.226 -0.07
Untrustworthy/Trustworthy 0.6 -0.523 0.359 -0.196
Inconsiderate/Considerate 0.742 -0.444 0.055 0.258
Nasty/Nice 0.795 -0.225 -0.219 -0.205
Disagreeable/Agreeable 0.773 -0.007 -0.311 0.244
Insincere/Sincere 0.516 -0.504 0.561 -0.058
Unkind/Kind 0.794 -0.274 0.035 0.01
The researcher identified each of the factors based upon representation of certain
qualities. Factor 1 represents the dimension of “Interactions with Others” (Interactions) of
Leadership Orientation. Factor 2 represents the dimension of “Closeness toward Others”
(Closeness) of Leadership Orientation. Factor 3 represents “Reception of Others” (Reception) of
Leadership Orientation. Factor 4 represents “Personal Attitude” (Attitude).
The researcher performed a linear regression ANOVA model with the four Factors
selected as Independent Variables and Perception of Collaboration (as operationalized by the

95
Collaboration Audit Score) as the Dependent Variable. The analysis failed to reveal any
statistical significance between any of the Leadership Orientation Factors and Perception of
Collaboration. (Refer to Table 4.7.) As such, the correlation coefficients were not interpretable.
Table 4.7. Linear Regression Model: Leadership Orientation Factors and Perception of
Collaboration.)
Sum of
Squares df F
Mean
Squares R R2
Adjusted
R2 p
Between Groups 2.698 4 2.031 0.647 0.439 0.193 0.98 0.112b
Within Groups 11.288 34 0.332
Total 13.986 38
a. Dependent Variable: Perception of Collaboration; Predictors: (Constant); LPC Factor
1, LPC Factor 2, LPC Factor 3, LPC Factor 4
b. p < 0.05.
The researcher included two items in the survey to capture moderating effects of
satisfaction with the leadership of the VLSSE and/or satisfaction with the performance of the
VLSSE upon the relationship of Leadership Orientation or Leadership Style on the group’s
perceived level of collaborative success. Are any of the main effects of any Independent
Leadership Orientation Variables moderated on the Dependent Variable by either of the
Moderating Variables?
The first Moderating Variable (MV) is satisfaction of the group with VLSSE leadership
(Leadership Satisfaction). The researcher computed five new variables, including the Intercept

96
Variable and four (4) Interaction Variables. Interaction Variables are an arithmetic expression of
multiplying the Independent Variable by the Moderating Variable. The Intercept Variable
(Intercept) value was held constant at 1.0. The four Interaction Variables were computed by the
following numeric expressions:
Factor 1 Independent Variable (aka, Interactions) x Moderating Variable 1 (aka, VLSSE
Leadership Satisfaction) = Interacting Variable 1 (Interactions_LeadershipSatisfaction)
Factor 2 Independent Variable (aka, Closeness) x Moderating Variable 1 (aka, VLSSE
Leadership Satisfaction) = Interacting Variable 2 (Closeness_LeadershipSatisfaction)
Factor 3 Independent Variable (aka, Reception) x Moderating Variable 1 (aka, VLSSE
Leadership Satisfaction) = Interacting Variable 3 (Reception_LeadershipSatisfaction)
Factor 4 Independent Variable (aka, Attitude) x Moderating Variable 1 (aka, VLSSE
Leadership Satisfaction) = Interacting Variable 4 (Attitude_LeadershipSatisfaction)
The researcher performed a moderated regression analysis with a model of the computed
Interaction Variables, the original Independent Variables (Factors 1, 2, 3, and 4), the Moderating
Variable (Leadership Satisfaction), and the Intercept as Independent Variables and the
Perception of Collaboration as the Dependent Variable. Covariance for value of the Intercept
was included in the model; the constant in the equation was excluded; pairwise cases were
excluded due to the small sample size.

97
The analysis determined that there were not any effects of the Moderating Variable
(Leadership Satisfaction) with the Independent Variables upon the Dependent Variable.
The second Moderating Variable is satisfaction of VLSSE members with VLSSE
performance (Performance Satisfaction). The researcher computed five new variables, including
the Intercept Variable and four (4) Interaction Variables. The Intercept Variable (Intercept)
value was held constant at 1.0. The four Interaction Variables were computed by the following
numeric expressions:
Factor 1 Independent Variable (aka, Interactions) x Moderating Variable 2 (aka, VLSSE
Performance Satisfaction) = Interacting Variable 1 (Interactions_PerformanceSatisfaction)
Factor 2 Independent Variable (aka, Closeness) x Moderating Variable 2 (aka, VLSSE
Performance Satisfaction) = Interacting Variable 2 (Closeness_PerformanceSatisfaction)
Factor 3 Independent Variable (aka, Reception) x Moderating Variable 2 (aka, VLSSE
Performance Satisfaction) = Interacting Variable 3 (Reception_PerformanceSatisfaction)
Factor 4 Independent Variable (aka, Attitude) x Moderating Variable 2 (aka, VLSSE
Performance Satisfaction) = Interacting Variable 4 (Attitude_PerformanceSatisfaction)
The researcher performed a moderated regression analysis with model of the computed
Interaction Variables, the original Independent Variables (Factors 1, 2, 3, and 4), the Moderating
Variable (Performance Satisfaction, and the Intercept as Independent Variables and the
Perception of Collaboration as the Dependent Variable. Covariance for value of the Intercept

98
was included in the model; the constant in the equation was excluded; pairwise cases were
excluded due to the small sample size.
The analysis resulted in significant effects of the Moderating Variable (Performance
Satisfaction) upon the relationship between two Independent Variables and the Dependent
Variable. There was a simple effect of the Factor 1 Independent Variable “Interaction” and the
Dependent Variable (Perception of Collaboration) when moderated by the variable “Performance
Satisfaction”. (Refer to Table 4.8 & 4.9.) The interaction effects between the variables were
plotted to show the differences between slopes of the interactions. (Refer to Figure 4.1 & Table
4.10.)
Table 4.8. Moderated Regression Analysis of Performance Satisfaction on Leadership
Orientation and Perception of Collaboration
Sum of
Squares df F
Mean
Squares R R2
Adjusted
R2 p
Between Groups 651.91 9 459.859 72.434 0.996 0.992 0.99 0.000c
Within Groups 5.355 34 0.158
Total 657.266 43
a. Dependent Variable: Perception of Collaboration; Predictors: (Constant); LPC Factor 1,
LPC Factor 2, LPC Factor 3, LPC Factor 4
b. Moderating Variable: Performance Satisfaction
c. p < 0.01.
Note: Moderated Regression Model: DV (Perception of Collaboration) = IV (Leadership
Orientation) + MV (Performance Satisfaction)

99
Table 4.9 Coefficients of Moderated Regression Analysis of Performance Satisfaction on
Leadership Orientation and Perception of Collaboration
Unstandardized
Coefficients
Standardized
Coefficients
Variable β
Std.
Error Beta t p
IV1 (LPC Factor 1 (Interactions))
-1.578 0.26
6 -1.372
-
5.93
1
0.00
0
IV 3 (LPC Factor 3 (Reception)) 0.471
0.27
2 0.443
1.72
9
0.09
3
IV 4 (LPC Factor 4 (Attitude))
-1.011 0.21
4 -1.032
-
4.71
7
0.00
0
IVxMV 1 (Interactions * Performance Satisfaction) 0.422 0.07 1.461
5.99
6
0.00
0
IVxMV 2 (Closeness*Performance Satisfaction)
-0.28 0.01
3 -0.11
-
2.18
1
0.03
6
IVxMV 3 (Reception*Performance Satisfaction)
-0.035 0.06
9 -0.134
-
0.50
2
0.61
9
IVxMV 4 (Attitude*Performance Satisfaction) 0.233
0.04
9 0.967
4.73
9
0.00
0
Intercept 8.905
1.57
2 2.278
5.66
5
0.00
0
MV (Performance Satisfaction)
-1.446 0.41 -1.527
-
3.52
4
0.00
1
a. Dependent Variable: Perception of Collaboration; Predictors: (Constant); LPC Factor 1, LPC Factor
2, LPC Factor 3, LPC Factor 4
b. Moderating Variable: Performance Satisfaction
c. IV 2 (LPC Factor 2 (Closeness) excluded; Collinearity Statistics Tolerance = -.003
d. p < 0.001

100
Figure 4.1. Plot Analysis of Moderating Effect of Performance Satisfaction on Leadership
Orientation (Factor 1) and Perception of Collaboration
Table 4.10 Plot Analysis Variables and Coefficients for Moderated Regression of Leadership
Orientation “Interactions with Others” and Performance Satisfaction
Variable Names
Name of Independent Variable Interactions
Name of Moderator
Performance
Satisfaction
Unstandardized Regression Coefficients
Independent Variable -1.578
Moderator -1.446
Interaction 0.422
Intercept/Constant 8.905
Note: Moderated regression analysis variables and coefficients for Leadership Orientation Factor
1 (Interactions with Others) and Performance Satisfaction.
0
2
4
6
8
10
12
14
Low Interactions High Interactions
Pe
rce
pti
on
of
Coll
ab
ora
tion
Low VLSSEPerformanceSatisfaction
High VLSSEPerformanceSatisfaction

101
Additionally, there was a simple effect of “Performance Satisfaction” on the relationship
between Factor 4 (Attitude) and Perception of Collaboration; Performance Satisfaction
moderated the relationship between Factor 4 (Attitude) and Perception of Collaboration. (Refer
to Table 4.8 & 4.9.) The interaction effects between the variables were plotted to show the
differences between slopes of the interactions. (Refer to Figure 4.2 & Table 4.11.)
Figure 4.2. Plot Analysis of Moderating Effect of Performance Satisfaction on Leadership
Orientation (Factor 4) and Perception of Collaboration
0
2
4
6
8
10
12
14
Low Attitude High Attitude
Pe
rce
pti
on
of
Coll
ab
ora
tion
Low VLSSE
Performance
Satisfaction
High VLSSE
Performance
Satisfaction

102
Table 4.11 Plot Analysis Variables and Coefficients for Moderated Regression of Leadership
Orientation “Personal Attitude” and Performance Satisfaction
Variable Names
Name of Independent Variable Attitude
Name of Moderator
Performance
Satisfaction
Unstandardized Regression Coefficients
Independent Variable -1.011
Moderator -1.446
Interaction 0.422
Intercept/Constant 8.905
Note: Moderated regression analysis variables and coefficients for Leadership Orientation Factor
4 (Personal Attitude) and Performance Satisfaction.
The first research question of this study asks if Leadership Orientation and Collaboration
are associated. Hypotheses were proposed based upon the literature to answer this question. The
findings of the data reveal the following in regards to the hypotheses:
H1A: Relationship-oriented Leadership Orientation is positively associated with
Perception of Collaboration.
H1A is Rejected.
H1B: Satisfaction of Leadership moderates the association of Leadership Orientation
with Perception of Collaboration
H1B is Rejected.

103
H1C: Satisfaction of Performance moderates the association of Leadership Orientation
with Perception of Collaboration.
H1C is Accepted.
Leadership Style of VLSSE
Leadership Style was assessed by respondents’ indication of engagement in leadership
practices in the “Enable Others to Act” Domain of the Kouzes and Posner Leadership Practices
Inventory (Self). (2002). All respondents indicated that they usually, frequently or almost always
engaged in the leadership practices identified within the Leadership Practices Inventory - Self.
(Refer to Table 4.12.) The distribution of scores for each of the six questions of this provides the
detail of this overall tendency of the group.
Table 4.12 Leadership Practices Inventory Frequencies
Variable Mean Median SD Minimum Maximum
I develop cooperative relationships among the
people I work with. 9.245 10.000 0.979 6.00 10.00
I actively listen to diverse points of view. 9.019 9.000 0.980 7.00 10.00
I treat others with dignity and respect. 9.528 10.000 0.668 8.00 10.00
I support the decisions that people make on
their own. 8.596 9.000 0.823 6.00 10.00
I give people a great deal of freedom and
choice in deciding how to do their work. 8.736 9.000 0.944 7.00 10.00
I ensure that people grow in their jobs by
learning new skills and developing themselves. 9.057 9.000 1.027 6.00 10.00

104
All of the survey participants identified their frequency of practicing the leadership
behaviors associated with the Domain Enable Others to Act as “Usually,” “Very Frequently,” or
“Almost Always.” (Refer to Appendix H for each question frequency distribution.) (Refer to
Table 4.13.)
Table 4.13. LPI Frequencies of Behaviors
Mean
Score Frequency
Valid
Percent
7.17 1 2.0%
8.00 3 5.9%
8.33 2 3.9%
8.50 7 13.7%
8.67 3 5.9%
8.83 5 9.8%
9.00 7 13.7%
9.17 4 7.8%
9.33 3 5.9%
9.50 8 15.7%
9.67 4 7.8%
9.83 1 2.0%
10.00 3 5.9%
The researcher recoded the Leadership Practices Inventory (Self) variables into different
variables to emphasize the difference in frequency within this higher level of behavior
engagement. (Refer to Table 4.24.) This variable was coded “LPIHighCloseUp” and was
referred to as the LPI Highlight Frequencies (or scores).
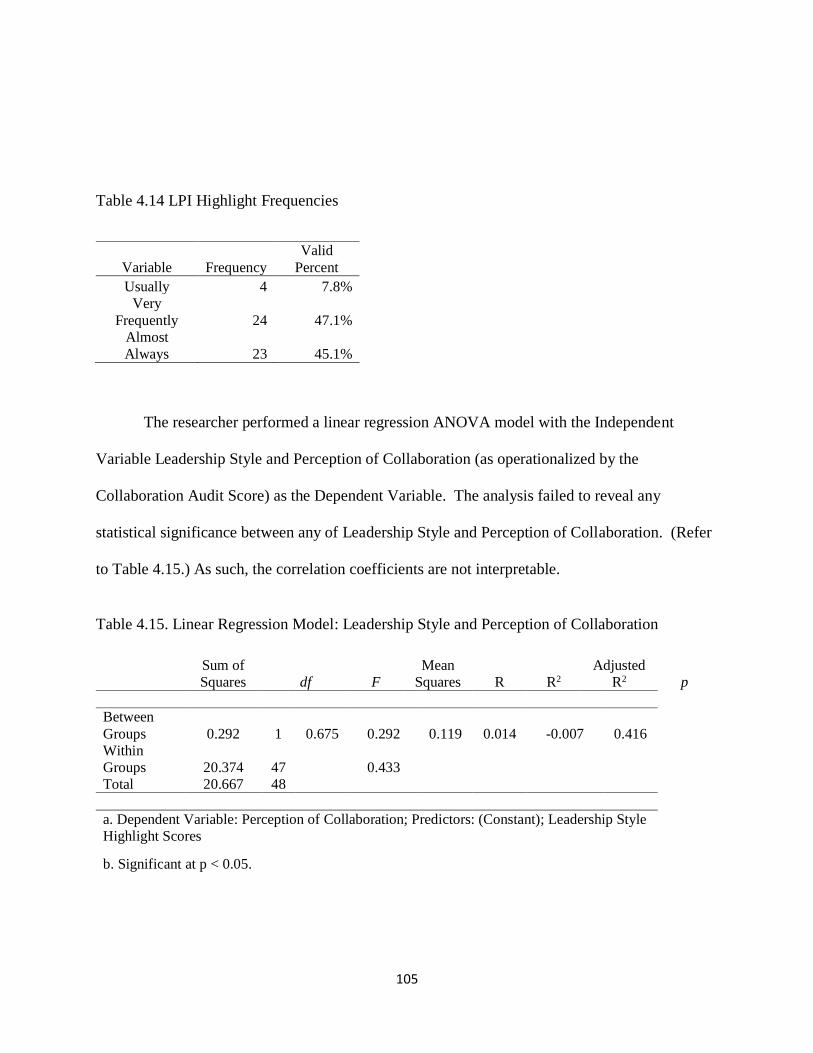
105
Table 4.14 LPI Highlight Frequencies
Variable Frequency
Valid
Percent
Usually 4 7.8%
Very
Frequently 24 47.1%
Almost
Always 23 45.1%
The researcher performed a linear regression ANOVA model with the Independent
Variable Leadership Style and Perception of Collaboration (as operationalized by the
Collaboration Audit Score) as the Dependent Variable. The analysis failed to reveal any
statistical significance between any of Leadership Style and Perception of Collaboration. (Refer
to Table 4.15.) As such, the correlation coefficients are not interpretable.
Table 4.15. Linear Regression Model: Leadership Style and Perception of Collaboration
Sum of
Squares df F
Mean
Squares R R2
Adjusted
R2 p
Between
Groups 0.292 1 0.675 0.292 0.119 0.014 -0.007 0.416
Within
Groups 20.374 47 0.433
Total 20.667 48
a. Dependent Variable: Perception of Collaboration; Predictors: (Constant); Leadership Style
Highlight Scores
b. Significant at p < 0.05.

106
The ANOVA tests performed with both the Moderating Variables (Leadership
Satisfaction and Performance Satisfaction) reveal significant moderating effects on the
Independent Variable Leadership Style. Therefore, the coefficients table of the moderated
regression analysis of leadership style for both satisfaction with leadership and satisfaction of
group performance are interpretable.
The main effect of Leadership Style upon Perception of Collaboration was significantly
moderated by the Moderating Variable Leadership Satisfaction (p < 0.01). (Refer to Table 4.16).
The interaction effects between the variables were plotted to pictorially demonstrate the
differences between the slopes of the interactions. (Refer to Figure 4.3. & Table 4.17.)
Table 4.16. Moderated Regression Analysis of Leadership Satisfaction on Leadership Style and
Perception of Collaboration
Sum of Squares df F
Mean
Squares R R2
Adjusted
R2 p
Between
Groups 735.729 4 624.76 183.932 0.991 0.982 0.981 0.000c
Within
Groups 13.248 45 0.294
Total 748.977 49
a. Dependent Variable: Perception of Collaboration; Predictors: (Constant); LPI Highlight
Scores
b. Moderating Variable: Leadership Satisfaction
c. p < 0.01.
Note: Moderated Regression Model: DV (Perception of Collaboration) = IV (Leadership Style) +
MV (Leadership Satisfaction)

107
Figure 4.3. Plot Analysis of Moderated Regression Model Slope Differences on Leadership Style
and Leadership Satisfaction
Table 4. 17 Coefficients of Moderated ANOVA for Leadership Satisfaction on Leadership Style
and Perception of Collaboration a,b
Variable β
Std.
Error Beta t p
IV (LPI Highlight Score) 0.02 1.081 0.013 0.019 0.985
Intercept 1.865 2.706 0.477 0.689 0.494
IV x MV (LPI Highlight Score * Leadership
Satisfaction) 0.033 0.234 0.89 0.14 0.890
MV (Leadership Satisfaction) 0.367 0.585 0.42 0.643 0.524
a. Dependent Variable: Perception of Collaboration; Predictors: (Constant); LPI Highlight
Scores
b. Moderating Variable: Leadership Satisfaction
0
0.5
1
1.5
2
2.5
Low Leadership Style High Leadership Style
Perc
ep
tion
of
Coll
ab
orati
on
Low VLSSE
Leadership
Satisfaction
High VLSSE
Leadership
Satisfaction

108
Table 4.18 Plot Analysis Variables and Coefficients for Moderated Regression of Leadership
Style by Leadership Satisfaction
Variable Names
Name of Independent Variable Leadership Style
Name of Moderator Leadership Satisfaction
Unstandardized Regression
Coefficients
Independent Variable 0.02
Moderator 0.376
Interaction 0.033
Intercept/Constant 1.865
The main effect of Leadership Style upon Perception of Collaboration was also
significantly moderated by the Moderating Variable Performance Satisfaction (p < 0.01). (Refer
to Table 4.19.) The interaction effects between the variables were plotted to pictorially
demonstrate the differences between the slopes of the interactions. (Refer to Figure 4.4. &
Table 4.21.)

109
Table 4.19. Moderated Regression Analysis of Leadership Satisfaction on Leadership Style and
Perception of Collaboration
Sum of Squares df F
Mean
Squares R R2
Adjusted
R2 p
Between
Groups 730.277 4 439.336 182.569 0.987 0.975 0.973 0.000c
Within Groups 18.700 45 0.416
Total 748.977 49
a. Dependent Variable: Perception of Collaboration; Predictors: (Constant); LPI Highlight
Scores
b. Moderating Variable: Performance Satisfaction
c. p < 0.01.
Note: Moderated Regression Model: DV (Perception of Collaboration) = IV (Leadership Style) +
MV (Performance Satisfaction).
Table 4.20 Coefficients of Moderated ANOVA for Performance Satisfaction on Leadership Style
and Perception of Collaboration a,b
Unstandardized
Coefficients
Standardized
Coefficients
Variable β Std. Error Beta t p
IV (LPI Highlight Score) 0.255 1.052 0.160 0.243 0.809
Intercept 2.366 2.762 0.605 0.857 0.396
IV x MV (LPI Highlight
Score * Performance
Satisfaction)
0.283 0.630 0.299 0.45 0.655
MV (Performance
Satisfaction) -0.027 0.240 -0.070 -0.113 0.911
a. Dependent Variable: Perception of Collaboration; Predictors: (Constant); LPI Highlight Scores
b. Moderating Variable:
Performance Satisfaction

110
Figure 4.4. Moderated Regression Model Slope Differences in Leadership Style and
Performance Satisfaction.
Table 4.21 Plot Analysis Variables and Coefficients for Moderated Regression of Leadership
Style by Performance Satisfaction
Variable Names
Name of Independent Variable Leadership Style
Name of Moderator
Performance
Satisfaction
Unstandardized Regression
Coefficients
Independent Variable 0.255
Moderator 0.283
Interaction -0.027
Intercept/Constant 2.366
0
0.5
1
1.5
2
2.5
3
3.5
Low Leadership Style High Leadership Style
Perc
ep
tion
of
Coll
ab
orati
on
Low VLSSE
Performance
Satisfaction
High VLSSE
Performance
Satisfaction

111
The second research question asks if Leadership Style is associated with Collaboration.
Three hypotheses were generated to examine this research question, based upon review of
literature of leadership orientation and leadership style. The findings of each hypothesis are
presented below.
H2A: Trust-building Leadership Style is positively associated with Perception of
Collaboration
H2A is Rejected.
H2B: Satisfaction of Leadership moderates the association of Leadership Style with
Perception of Collaboration.
H2B is Accepted.
H2C: Satisfaction of Performance moderates the association of Leadership Style with
Perception of Collaboration.
H2C is Accepted.
Relationship of Leadership Style and Leadership Orientation
The researcher performed a two-tail bivariate Pearson Correlation analysis with the four
Least Preferred Co-worker Scale factors and the Leadership Practices Inventory (Self) average

112
score of the VLSSE group. (Refer to Table 4.22.) Leadership Style was found to be correlated
with two of the four factor of Leadership Orientation. Specifically, as Leadership Style of trust-
building was assessed as increasing, the Leadership Orientation Factors of Interactions with
Other and Closeness with Others both decreased. The LPI was statistically significantly
negatively associated with the LPC Factor 1 and LPC Factor 2 (p < 0.05).
The Leadership Orientation Factors themselves were found to be correlated to one
another, as one would suspect. Factor 1 was statistically significantly associated with Factor 2,
Factor 3, and Factor 4 (r = 0.537 , p < 0.01; r = 0.380, p < 0.01; r = 0.502, p < 0.01). Factor 2
was positively associated with Factor 1 (r = 0.537, p < 0.01), Factor 3 (r = 0.488, p < 0.01) and
Factor 4 (r = 0.286, p < 0.05).

113
Table 4.22 Correlation Matrix of Leadership Orientation and Leadership Style
LPIAvg LPCFactor1Avg LPCFactor2Avg LPCFactor3Avg LPCFactor4Avg
LPIAvg
Pearson
Correlation 1 -.433** -.402** -0.214 -0.052
Sig. (2-
tailed) 0.003 0.004 0.139 0.726
N 51 45 49 49 48
LPCFactor1Avg
Pearson
Correlation -.433** 1 .537** .380* .502**
Sig. (2-
tailed) 0.003 0 0.01 0.001
N 45 46 45 45 44
LPCFactor2Avg
Pearson
Correlation -.402** .537** 1 .488** .286*
Sig. (2-
tailed) 0.004 0 0 0.049
N 49 45 51 49 48
LPCFactor3Avg
Pearson
Correlation -0.214 .380* .488** 1 0.158
Sig. (2-
tailed) 0.139 0.01 0 0.287
N 49 45 49 50 47
LPCFactor4Avg
Pearson
Correlation -0.052 .502** .286* 0.158 1
Sig. (2-
tailed) 0.726 0.001 0.049 0.287
N 48 44 48 47 50
**. Correlation is significant at the 0.01 level (2-tailed).
*. Correlation is significant at the 0.05 level (2-tailed).
Control Variables
Control Variables are considered in accounting for the likelihood of alternative impacts
upon the Dependent Variable other than the Independent Variables. (Piquero & Weisburd,
2010). This impact is called a “spurious relation.” (Frankfort-Nachmias & Nachmias, 2000).
The demographic variables of gender and race of participants were utilized as control variables

114
in the analysis of the data. The race variable was recoded into “White” and “Non-White” given
the respondent distribution across original options and in order to provide for a binary variable.
Class size of the agency represented by each participant was also utilized as there were three
response options. The position of the respondent (elected leader member or non-elected
member) within the group was also controlled for in the model. Age and geographic region of
the represented agencies were not included as control variables due to the number of response
options within each variable and the relatively low sample size.
The researcher performed a hierarchical multiple regression to specify analysis of control
variables in the model to account for any impact, or spurious relations, on the association
between the Leadership Orientation Independent Variables and the Dependent Variable. (Refer
to Table 4.23.) A percent of variability (R2) in the Dependent Variable that can be attributed for
the Leadership Orientation Independent Variables and for the Independent Variables with the
accounting of the Control Variables was noted (from 12.7% to 28.2%). However, the results of
the ANOVA indicates that this variance was not statistically significant. There was no spurious
relationship between the Control Variables and the Leadership Orientation Independent Variable.

115
Table 4.23 Leadership Orientation Control Variable Analysis
Sum of
Squares df F
Mean
Squares R R2
Adjusted
R2
Std.
Error of
Estimate p
Step 1 0.356 0.127 0.021 0.602 0.329b
Within Groups 1.740 4 1.200 0.435
Between Groups 11.959 33 0.362
Total 13.699 37
Step 2 0.531 0.282 0.085 0.582 0.227c
Within Groups 3.870 8 1.427 0.484
Between Groups 9.830 29 0.339
Total 13.699 37
a. Dependent Variable: Perception of Collaboration
b. Predictors: (Constant), Class size, Race/Ethnicity, Position, Gender
c. Predictors: (Constant), Class size, Race/Ethnicity, Position, Gender, Leadership Orientation
The researcher performed a hierarchical multiple regression to specify analysis of Control
Variables in the model to account for any impact, or spurious relations, on the association
between the second primary Independent Variable (Leadership Style) and the Dependent
Variable. (Refer to Table 4.24.) The percent of variability (R2) in the Dependent Variable that
can be attributed for the Independent Variables and for the Independent Variables with the
accounting of the Control Variables was very small (from 13.1% to 13.4%). The results of the
ANOVA supports that this variance was not statistically significant. There was no spurious
relationship between the Control Variables and the Leadership Style Independent Variable.

116
Table 4.24 Leadership Style Control Variable Analysis
Sum of
Squares df F
Mean
Squares R R2
Adjusted
R2
Std.
Error of
Estimate p
Step 1 0.362 0.131 0.048 0.630 0.196b
Within Groups 2.518 4 1.585 0.629
Between Groups 16.686 42 0.397
Total 19.204 46
Step 2 0.365 0.134 0.028 0.637 0.298c
Within Groups 2.565 5 1.264 0.513
Between Groups 16.639 41 0.406
Total 19.204 46
a. Dependent Variable: Perception of Collaboration; Predictors: (Constant); Leadership Style Highlight
Scores
b. Predictors: (Constant), Class size, Race/Ethnicity, Position, Gender
c. Predictors: (Constant), Class size, Race/Ethnicity, Position, Gender, Leadership Style Highlight
Scores
Summary
A descriptive assessment of the Virginia League of Social Services group based upon
responses to the survey instrument is that the organization has an overall relationship-based
leadership orientation and frequently engages in the leadership style practice of trust-building.
The respondents had an overall perception of collaborative success of the group within the
moderate range. This result indicates that the VLSSE are perceived to have achieved nearly a
level of coalition in partnership by the group, but do have some features of a coordinating group.
(Horwath & Morrison, 2007). The analysis of the relationships between these variables of the
Virginia League of Social Services Executives reveals interesting points for consideration.

117
Analysis of the data in this research survey support the link between the leadership style
practice of trust-building with relationship-based leadership orientation. However, the direction
of the correlation is particularly interesting in this research as two of the factors of leadership
orientation are negatively correlated with the leadership style practice of trust-building, as
measured through the “Enabling Others to Act” Domain of the Leadership Practices Inventory
(Self) instrument. The direction of this correlation counters previous empirical research
association trends, which detail a positive correlation.
This leads the researcher to wonder about the relationship of the two primary
Independent Variables upon the Dependent Variable. Are there discernable main effects
between the Independent Variables and the Dependent Variable? And if so, are they aligned with
prior research efforts unlike the findings in regards to the engagement of the two Independent
Variables? Direct regression analysis of relationship or association between Leadership
Orientation and Perception of Collaboration did not reveal any significant relationship. Neither
did linear regression of Leadership Style and Perception of Collaboration.
However, both of the Independent Variables were found to be moderated, in at least part,
by one or both of the Moderating Variables. The main effects of Factor 1 and Factor 4 of the
Leadership Orientation Independent Variable upon Perception of Collaboration were found to be
moderated by Performance Satisfaction. Prior research efforts were supported in the result of
satisfaction of leadership having a moderating effect upon the role of leadership orientation.

118
Bass and Bass (2009) identified multiple studies in which group satisfaction with leadership
moderated the impact of the leadership orientation. Further, the authors highlighted a study by
WW Burke that detailed the moderated impact of satisfaction with leadership was greater upon
relationship-oriented leaders. The VLSSE group was overwhelming identified as a relationship-
oriented population of leaders (75%) versus task-oriented leadership. Interestingly, this simple
effect of the Moderator Variable Performance Satisfaction is again contrary to the direction
suggested by prior research efforts. Performance Satisfaction negatively moderates the effect of
Leadership Orientation (Factors 1 and 4) on Perception of Collaboration. The more the group
indicated their satisfaction with VLSSE performance, the more negatively the leadership
orientation was related to the perceived collaborative success of the group. The degree of
orientation toward relationship-based leadership had a stronger negative impact on the
perception of collaborative success of the VLSSE group when the respondents rated a higher
level of satisfaction with the VLSSE performance.
This result opens an interesting opportunity for interpretative consideration by the
researcher. Why is it that perception of collaborative success decreases by relationship-oriented
leaders when they are more satisfied with the performance of the organization? This seems to
run counter to the common wisdom of collaboration and group performance. Or does it? New
research is starting to highlight the transactional costs of collaborative endeavors between and
amongst groups. Particularly, contemporary literature is highlighting the defensive posture some
organizations are taking to stave off losing their autonomy and independence through the

119
penultimate developmental stage of collaboration, integration. Practicing a certain level of
collaborative processes is beneficial; however, capitulating one’s own organizational identity for
the common cause is not seen as the most beneficial goal. As a result, there continues to exist a
tension between group members to prevent the full integration of organizations. Group members
may then prefer this tension persisting and preventing organizational capitulation, and ultimately
may be more satisfied with the overall group performance. (Kalu., 2013). Is the Virginia
League of Social Services Executives representative of this type of dynamic?
The second primary Independent Variable (Leadership Style) was found to be moderated
by both Moderating Variables (Leadership Satisfaction and Performance Satisfaction). Unlike
the simple effect of the Moderating Variable Performance Satisfaction upon the association
between Leadership Orientation and Perception of Collaboration, the main effect of Leadership
Style upon Perception of Collaboration was positively moderated by both Leadership
Satisfaction and Performance Satisfaction. The level of frequency of engaging in trust-building
leadership style behaviors had a stronger positive impact on the perception of collaborative
success of the VLSSE group when the respondents rated a higher level of satisfaction with the
VLSSE leadership. Similarly, the level of frequency of engaging in trust-building leadership
style behaviors had a stronger positive impact on the perception of collaborative success of the
group when survey participants rated a higher level of overall performance satisfaction with the
VLSSE group. The direction of these results is not unexpected, and supports previous literature.
Trust-building is a single component, or practice, of a relationship-oriented leader. Could it be

120
that this leadership style component is not as complex as leadership orientation, and therefore
may not be affected by the transactional costs of collaboration?
Demographic data about the respondent and of the respondent’s represented agency were
controlled for in step-wise linear regression models. Only variables that were suitable for
analysis with the small sample size were included in the models. There were no identified
spurious relations of any of the Control Variables upon the Independent Variables. Of note, in a
study on leadership, the leader position of the group members did not have a spurious
relationship on the outcomes.
Limitations of the Research: Reliability and Validity
Reliability
Least Preferred Coworker Scale
To assess reliability that the items in the Least Preferred Coworker Scale did maintain the
reliability threshold as previous determined in prior research (Cronbach’s Alpha ≥ 0.90 ), the
researcher performed analysis on the items. The researcher performed scale analysis to
determine reliability of the items in this survey. The model was run as Alpha; an Item Scale was
selected, and given the possibility of a missing response, the items were scaled if there were
deletions; correlations were also performed.

121
The overall reliability of the items was assessed at the excellent level (0.91), which was
similar to the reliability of Rice’s 1979 Cronbach’s alpha assessment. If items were deleted, the
Cronbach’s Alpha level was adjusted down but remained within an excellent range (0.91 – 0.92).
(Refer to Table 4.25 & 4.26).
Table 4.25 LPC Reliability Analysis
Cronbach's
Alpha
Cronbach's
Alpha Based
on
Standardized
Items
N of Items
0.914 0.919 18

122
Table 4.26 LPC Item-Total Statistics
Scale
Mean
if Item
Deleted
Scale
Variance
if Item
Deleted
Corrected
Item-Total
Correlation
Squared
Multiple
Correlation
Cronbach's
Alpha if
Item
Deleted
Unpleasant 51.714 314.746 0.685 0.732 0.907
Unfriendly 50.714 313.429 0.615 0.753 0.909
Rejecting 52.095 323.600 0.774 0.814 0.906
Tense 51.571 329.714 0.458 0.635 0.913
Distant 51.571 331.958 0.508 0.850 0.912
Cold 51.452 318.156 0.682 0.872 0.907
Hostile 51.929 320.848 0.645 0.754 0.908
Boring 50.786 340.904 0.246 0.406 0.920
Quarrelsome 52.000 330.537 0.546 0.680 0.911
Gloomy 51.571 330.787 0.444 0.616 0.914
Guarded 51.619 330.876 0.474 0.724 0.913
Backbiting 52.548 318.205 0.756 0.797 0.905
Unstrustworthy 52.333 324.179 0.537 0.809 0.911
Inconsiderate 52.310 322.268 0.684 0.829 0.907
Nasty 51.833 317.411 0.712 0.765 0.906
Disagreeable 52.071 322.507 0.716 0.795 0.907
Insincere 52.000 329.659 0.470 0.783 0.913
Unkind 51.643 319.455 0.733 0.833 0.906
Leadership Practices Inventory (Self)
The integrated survey instrument included the Enable Others to Act Domain items from
the Leadership Practices Inventory (Self) survey tool. Although the same sequence of items was
maintained, there is recognition that only six items were applied from the original 30 item
assessment tool. To assess reliability that the domain items did maintain the reliability threshold
as previous determined in prior research by Kouzes and Posner (2002) (Cronbach’s Alpha =

123
0.75), the researcher performed analysis on the items. The researcher performed scale analysis
to determine reliability of the items in this survey. The model was run as Alpha; an Item Scale
was selected, and given the possibility of a missing response, the items were scaled if there were
deletions; correlations were also performed.
The overall reliability of the items was assessed at the acceptable level (0.72), which was
similar to the reliability of the 2002 Cronbach’s Alpha assessment. If items were deleted, the
Cronbach’s Alpha level was adjusted down but remained within an acceptable range (0.65-0.71).
(Refer to Table 4.27 & 4.28.) A Cronbach’s Alpha score of 0.60 is considered questionable. The
adjusted Cronbach’s Alpha of some items if items were deleted therefore needs to be part of the
limitation of this study research effort.
Table 4.27. LPI – Self Reliability Analysis
Cronbach's
Alpha
Cronbach's
Alpha Based on
Standardized
Items
N of
Items
0.719 0.729 6

124
Table 4.28 LPI – Self Inter-Item Correlation Matrix
I develop cooperative
relationships
among the
people I work with.
I actively listen to
diverse
points of
view.
I treat others
with
dignity
and respect.
I support the
decisions
that people
make on their own.
I give
people a great deal of
freedom and
choice in
deciding how to do
their work.
I ensure that
people grow in their jobs
by learning
new skills
and developing
themselves.
I develop cooperative
relationships among the people I
work with.
1.000 0.497 0.306 0.258 0.130 0.094
I actively listen to diverse points
of view. 0.497 1.000 0.333 0.197 0.174 0.139
I treat others with dignity and
respect. 0.306 0.333 1.000 0.434 0.360 0.100
I support the decisions that people
make on their own. 0.258 0.197 0.434 1.000 0.520 0.478
I give people a great deal of freedom and choice in deciding
how to do their work.
0.130 0.174 0.360 0.520 1.000 0.626
I ensure that people grow in their
jobs by learning new skills and developing themselves.
0.094 0.139 0.100 0.478 0.626 1.000

125
Table 4.29 LPI – Self Item Total Statistics
Scale
Mean if
Item
Deleted
Scale
Variance
if Item
Deleted
Corrected
Item-Total
Correlation
Squared
Multiple
Correlation
Cronbach's
Alpha if
Item
Deleted
I develop cooperative
relationships among the
people I work with.
44.8627 9.321 0.369 0.285 0.708
I actively listen to
diverse points of view. 45.0784 9.234 0.39 0.291 0.701
I treat others with dignity
and respect. 44.549 10.133 0.449 0.335 0.687
I support the decisions
that people make on their
own.
45.4902 8.975 0.574 0.413 0.647
I give people a great deal
of freedom and choice in
deciding how to do their
work.
45.3529 8.593 0.551 0.5 0.649
I ensure that people grow
in their jobs by learning
new skills and
developing themselves.
45.0588 8.816 0.431 0.468 0.689
Collaboration Audit
This study did not examine prior efforts to evaluate reliability of the Collaboration Audit
items. However, analysis of the reliability of the items used within this study was conducted to
support the reliability of the entire integrated tool. The researcher performed scale analysis to
determine reliability of the items in this survey. The model was run as Alpha; an Item Scale was

126
selected, and given the possibility of a missing response, the items were scaled if there were
deletions; correlations were also performed.
The overall reliability of the items was assessed at the excellent level (0.94). If items
were deleted, the Cronbach’s Alpha level was adjusted down but remained within an excellent
range (0.93-0.94). (Refer to Table 4.30 & Table 4.31.)
Table 4.30. Collaboration Audit Reliability Analysis
Cronbach's
Alpha
Cronbach's
Alpha Based
on
Standardized
Items
N of
Items
0.937 0.936 15

127
Table 4.31 Collaboration Audit Item-Total Statistics
Scale
Mean if
Item
Deleted
Scale
Variance if
Item
Deleted
Corrected
Item-Total
Correlation
Squared
Multiple
Correlation
Cronbach's
Alpha if Item
Deleted
Act in a trustworthy and
trusting manner. 53.64 87.256 0.675 0.68 0.933
Ask others for help and
assistance when needed. 53.44 92.986 0.428 0.468 0.938
Treat others with dignity
and respect. 53.72 88.41 0.653 0.596 0.934
Talk openly about their
feelings. 54.18 86.967 0.576 0.512 0.936
Listen attentively to the
opinions of others. 54.1 83.112 0.769 0.765 0.93
Express clarity about the
group’s goal. 54.08 85.014 0.713 0.722 0.932
Make personal sacrifices
to meet the larger group
goal.
54.12 83.291 0.691 0.588 0.933
Can rely on each other. 53.82 83.089 0.88 0.884 0.928
Pitch in to help when
others are busy or running
behind.
53.98 86.469 0.74 0.813 0.932
Give credit to others for
their contributions. 53.94 81.527 0.853 0.794 0.928
Interact with each other
on a regular basis. 53.78 90.542 0.442 0.482 0.939
Treat every relationship
as if it will last for a
lifetime, even if it won’t.
54.76 86.431 0.65 0.668 0.934
Make it their business to
introduce their colleagues
to people who can help
them succeed.
54.24 82.349 0.778 0.814 0.93
Freely pass along
information that might be
useful to others.
53.78 83.032 0.776 0.862 0.93
Relate well to people of
diverse backgrounds and
interests.
53.9 85.643 0.608 0.603 0.935

128
The data collected from the survey respondents supports the prior research findings of
consistently acceptable coefficient alphas for the instrument components. The Leadership
Orientation items had an excellent Cronbach Alpha (0.91). The Leadership Style items had an
acceptable Cronbach Alpha (0.72). The adjusted down Cronbach Alpha was above the
questionable level, but should be accounted for in restricting the generalizability of this
component of the survey. This therefore impacts the reliability of the entire survey findings.
The Collaboration Audit had an excellent Cronbach Alpha (0.94). This survey should be
cautiously considered as a reliable tool.
Validity of Current Research Survey Instrument
Least Preferred Coworker Scale
The researcher assessed the validity of the questionnaire items through validation of the
data in SPSS. The LPC items were selected as analysis variables. The maximum percentage of
missing values was applied at 70%; the minimum coefficient of variation of 0.001 was applied to
scale variables; the minimum standard deviation of scale variables was applied at 0. Variables
that failed any of those checks were set to be flagged. Empty cases were to be flagged as well.
All cases, variables and data values passed the requested checks.

129
Leadership Practices Inventory (Self)
The researcher assessed the validity of the Leadership Style component of the
questionnaire items through validation of the data in SPSS. The LPI (Self) items were selected
as analysis variables. The maximum percentage of missing values was applied at 70%; the
minimum coefficient of variation of 0.001 was applied to scale variables; the minimum standard
deviation of scale variables was applied at 0. Variables that failed any of those checks were set
to be flagged. Empty cases were to be flagged as well. All cases, variables and data values
passed the requested checks.
Collaboration Audit
The researcher assessed the validity of collaboration section of the questionnaire items
through validation of the data in SPSS. The Collaboration Audit items were selected as analysis
variables. The maximum percentage of missing values was applied at 70%; the minimum
coefficient of variation of 0.001 was applied to scale variables; the minimum standard deviation
of scale variables was applied at 0. Variables that failed any of those checks were set to be
flagged. Empty cases were to be flagged as well. All cases, variables and data values passed the
requested checks.

130
Integrated Leadership in Collaborative Governance Survey Tool
The researcher then performed a validity assessment of all items from the LPC, the LPI
(Self) and the Collaboration Audit with the two Moderating Variable items included additionally
selected as analysis variables. The maximum percentage of missing values was applied at 70%;
the minimum coefficient of variation of 0.001 was applied to scale variables; the minimum
standard deviation of scale variables was applied at 0. Variables that failed any of those checks
were set to be flagged. Empty cases were to be flagged as well. All cases, variables and data
values passed the requested checks. As such, the survey instrument as utilized in this research
has satisfactory validity as a tool to assess the intended constructs.
Validity of the research may have been affected by the sample size. This study sample
size was restricted by the total population of active members within the VLSSE group. At the
time of the survey, the total population was 141 members. The response rate was 38% (n = 53).
The response rate was low, but acceptable for multiple regression analysis. Response rate
acceptability in public administration research continues to be considered; an identified
minimum acceptable response rate has not been agreed upon by the field. (Miller & Yang,
2007). While a response rate of 50% has been found to be quite adequate for analysis (Babbie &
Mouton, 1998), lower response rates have also been found to be acceptable. A return rate as low
as 21% has been found as acceptable within the public administration survey methodology
practice. (Miller & Yang, 2007.) Multiple studies have demonstrated that a lower response rate

131
(at 20%) is more predictive of outcomes than in studies with higher response rates (at 60%) or
that higher response rates do not impact the findings of studies. (Kissner, 1999). (Visser,
Krosnick, Marquette, & Curtain, 1996).
The ultimate sample size of participants in this survey is further supported as valid in
research literature by consideration of the number of Independent Variables and analysis
performed upon the survey data. Cohen and Cohen (1983) articulated the sample size required
for statistical significance at the 0.05 alpha level for analysis with two Independent Variables as
50 participants. The study conducted by this researcher included 53 participants, with four
primary Independent Variables as determined by the factor analysis performed on the first
section of the survey. A second primary Independent Variable (Leadership Style) accompanied
the first primary Independent Variable (Leadership Orientation).
Additional research in regards to identifying valid minimum sample sizes required for
multiple regression analysis identifies that a sample size as low as 50 participants is acceptable
using a four-variable least-squares predictions. Thus, this survey satisfies the sample size validity
question as the number of participants surpasses the minimum as well as exceeds the number of
Independent Variables needed to perform multiple regression analysis.
However, the researcher accept that the study had both a small sample size and a low-
moderate response rate. There exists the possibility of this impact to the validity and reliability

132
of the study. Generalizability of the findings is limited. Any conclusions about other groups
based upon the findings of this study should be cautiously considered and restricted in nature.
133
CHAPTER 5 – CONCLUSIONS AND RECOMMENDATIONS
Introduction and Summary
The purpose of this study was to determine if there was a relationship between leadership
orientation, or leadership style, with perception of collaborative success within a group of
professional leaders of the Local Departments of Social Services. To assess the presence of
those relationships, the researcher collected data from the Virginia League of Social Services
Executives via an integrated survey tool, which had several components:
Least Preferred Coworker Scale (to assess Leadership Orientation),
Leadership Practices Inventory (Self) (to assess Leadership Style),
Collaboration Audit (to assess Perception of Collaboration),
Leadership and Performance Satisfaction questions (to assess simple effects
upon any relationship between Leadership Orientation or Leadership Style
upon Perception of Collaboration), and
Demographic information items (to assess for spurious relations on the
Independent Variables).
The researcher deployed the survey for data collection to the VLSSE, following IRB
approval from the Virginia Commonwealth University, utilizing the established method of
survey launch and data collection by the VLSSE. The survey was distributed to 141 active
members of the VLSSE. At the close of five weeks, the researcher closed the survey to

134
participation. 53 members of the VLSSE participate in the survey, which represents a 38%
response rate.
Connection between Literature and Findings
The data and findings of this study are very intriguing, and support some of the prior
research as covered in the literature review of Chapter 2. The common sense understanding that
leadership style of trust-building is correlated with relationship-based leadership orientation is
well supported by the results. Interestingly, a direct relationship between leadership style and
perception of collaboration was not supported by the results of this data. However, a moderated
regression analysis revealed that both satisfaction with VLSSE leadership and satisfaction with
VLSE performance positively impacted the relationship between leadership style and perception
of collaboration. These findings that the impact of the frequency of engaging in trust-building
leadership behaviors is stronger on the perception of collaboration when satisfaction with the
group (leadership and performance) is higher supports prior research.
Similarly, a direct relationship between leadership orientation and perception of
collaboration was not supported by this data. However, the main effect of that relationship was
moderated by performance satisfaction of VLSSE. This moderating effect may be the most
intriguing finding of this study as the results suggest that as more relationship-oriented group
members grow more satisfied with the performance of the group, their perception of
collaboration decreases. There may be a tipping point along the collaboration spectrum in which

135
transaction costs of the group members negatively impacts the performance. The cost of
complete collaboration may be perceived as unsatisfactory.
Another interesting note from results of the data is the lack of spurious relations from any
of the Control Variables. While the instruments had been previously been assessed for validity
and reliability for basic demographic information (gender, age, race, etc…), the researcher
controlled for leader-follower status in the analysis of the data. The position of the member did
not impact or restrict the Independent Variables. This suggests that the collective identity of the
group may have been more relevant to the analysis than the status of the individuals within the
group.
This study used a contingency model of leadership effectiveness as the basis for framing
the research questions and hypotheses. The results align with a contingency model as the
success of the group performance was relational to the leadership orientation and style and the
degree of collaborative success.
Limitations of the Study
This study is inherently limited by the sample population. The total population count was
small, and the findings of the research are restricted by the response rate. Although the response
rate is supported by current acceptable public administration response rate ranges, a higher
response rate was desired given the originally small sample size. Further, this study is limited by
the nature of the group studied. The Virginia League of Social Services Executives is a very
specific collection of individuals who are tasked with the broad objective of collaborating.

136
Given the breadth of possible definitions of collaboration in contemporary public administration,
let alone concrete operationalization of successful collaboration, pinning down the exact level of
collaboration for a specific goal by this group that can be aligned directly with other groups
could prove challenging.
Reliability and validity of the survey tools incorporated into this study were assessed as
acceptable. However, alternative assessment mechanisms may have provided more robust
analysis of leadership behaviors utilized. Such instruments could include the Myers-Briggs Type
Indicator personality inventory or the California Personality Inventory. Future research should
consider substituting these scales for the Kouzes and Posner LPI –Self for reliability and validity
analysis with comparative groups or groups from alternate industries.
Implications and Recommendations for Further Study
There are several areas that could benefit from further research and contribute in a
meaningful way to public administration theory and practice:
Leadership Orientation loaded onto four factors. This could indicate a model
of components upon which leadership orientation can be organized for future
research or practical assessment. Additional study into how the factors loaded
and the link between items within each factor could be further explored.
Performance Satisfaction and Leadership Satisfaction moderated both the
relationships between Leadership Orientation with Collaboration and
Leadership Style with Collaboration. This moderating effect is supported by

137
research, but could benefit from more targeted and purposeful examination to
fully understand the simple effects.
Perhaps the hallmark result of this study is that Performance Satisfaction
negatively moderated the relationship between Leadership Orientation and
Perception of Collaboration. At face value, this seems contrary to existing
evidence surrounding this relationship. However, this effect may provide
insight into a relatively new consideration in public administration about the
negative impact of too much collaboration. Can agencies “over-collaborate”
and fall over the ideal of integration into more of a state of capitulation or
consumption of one another? Are agencies therefore more successful when
complete collaboration is defended against and the relationship-based leaders
focus more upon internal task accomplishment than collaborative practices
once they surpass a certain frequency of engagement? Further studies should
factor transactional costs into the research, and continue the examination of
the negative moderating effects.
This negative moderating effect also highlights the need for expansion of the
currently accepted framework of collaboration within the academics of public
administration. Practitioners may be defending against something or some
level of collaboration. Theoretical consideration of the existence of a

138
threshold of acceptable collaboration or a tipping point after which
collaboration yields negative outcomes should be explored.
This study should be replicated within additional similar professional
organizations within public administration, especially within the Health and
Human Services Secretariat, to see if similar findings surface.
Implications and Recommendations for the Virginia League of Social Services Executives
The research provides several findings which provide implications for the members of the
Virginia League of Social Services Executives:
Despite a low-moderate response rate to the survey, several of the participants
directly contacted the researcher for the results of the study upon completion
of the research. This indicates actual practical interest in the role of leadership
upon collaborative governance within the leaders of the Local Departments of
Social Services. The VLSSE Executive Committee has an opportunity to
build upon this interest by following up with its memberships to continue
exploring the impact of leadership and the ability to satisfy its charter
objective to collaborate. Exploration could take multiple and varied forms
from additional quantitative or qualitative research to focus groups to
workshops on leadership and collaborative governance.
There may be a tipping point or threshold over which collaboration is
defended against or seen as not ideal by members of the VLSSE. This

139
threshold should be given attention in light of the group’s specific chartered
objective to collaborate. Consideration to defining when collaboration is
deemed successful or when it has surpassed the point of benefit to group
members is likely warranted given the potential for literal interpretation of
bylaws. Future conflict over the level of intended VLSSE collaboration may
be mitigated by doing so.
Implications for the Field of Public Administration and Policy
The results of this study provided valuable information in regards to the need for further
consideration of leadership within the context of collaborative governance. Additionally, the
results yielded information that may provide insight into a relatively new consideration by the
field of public administration: there may be a level of engagement in collaborative behaviors that
supersedes the practitioner’s threshold of tolerance. The survey methodology used in this study
may have revealed just this tipping point.
The survey methodology used in this study should be utilized by additional public
administration agencies as a template for assessment of organizational leadership within
the context of collaborative governance; and
The survey methodology used in this study should be utilized by additional public
administration agencies as a template for exploration of the agency’s tipping point over
the threshold of collaborative success.

140
Conclusion
Public administration agencies are increasingly called upon to collaborate across
organizational boundaries to provide services for the public. The activity of collaboration has
been folded into the framework of governmental action, and is now a critical component of
accomplishing tasks. Leaders of organizations are now expected to enact collaborative
governance in their management of agencies. However, the evolution of collaborative
governance as a component of contemporary leadership has provided as many questions as
suggestions for implementation. The study of leadership is rich, spanning centuries and crossing
industries. The academic study of collaboration is relatively new, and understandably has left
the practice of collaboration with gaps to fill-in by both those that are forced into it and those that
actively seeks out collaborative experiences.
This study was designed to collect some information and provide analysis of the
existence and role of leadership in collaborative governance within today’s public administration
practice. Theoretical frameworks of contingency theory of effective leadership provided that
successful leadership was interdependent upon appropriate matching of the leader and the group
situation. Prior research addressed that leaders practicing trust-building behaviors with a
relationship-based orientation were more likely to successfully span boundaries within and
across organizations, and therefore lead successful collaborations. Based upon the review of the
literature, the researcher hypothesized that leadership orientation and leadership style were both
positively associated with perception of group collaboration. Moderating impacts of satisfaction

141
of the group’s performance and satisfaction of the group’s leadership were also hypothesized to
impact the relationship of leadership and collaboration.
The researcher collected data from the Virginia League of Social Services Executives
which had a specific objective to collaborate with a partner agency to successfully provide
services for the public. While direct association between Leadership Orientation and Leadership
Style were not realized by analysis of the collected data, there were interesting moderating
effects of the Performance Satisfaction and Leadership Satisfaction identified. Not surprisingly,
the relationship between Leadership Style and Perception of Collaboration was positively
moderated. However, the particularly interesting outcome of this survey research is that
Performance Satisfaction of the group statistically significantly negatively moderated the
relationship between Leadership Orientation and Perception of Collaboration.
This counter-intuitive result provides insight into a burgeoning area of study of
collaboration. Scholars are beginning to realize that the spectrum of collaboration may not
terminate at a completely positive and beneficial end point. Perhaps, the full continuum of
developmental levels of collaboration continue past harmonious integration through to negatively
perceived agency capitulation and collapse. The members of the Virginia League of Social
Services Executives who participated in this study may have reflected this defensive positioning
against completely realized group collaboration.

142
Public administration could benefit in multiple ways from this research. The results of
this study suggest the need to reconsider the theoretical underpinnings of collaboration,
particularly in the spectrum framework as currently offered in public administration literature.
The model could benefit from expansion and exploration of the “tipping point” effect that may
be suggested by the results of this research. Further, public administration practice may benefit
from this research by realizing the need to clearly operationalize collaboration as a goal or as an
objective for groups. Clarity should be offered in definitions of performance metrics of
collaboration in order to maximize beneficial outcomes and mitigate the risk of crossing the
threshold of an advantageous or mutually desired level of collaboration for the group.
The outcomes of this research are both complex and complicate. There are certainly very
interesting avenues of continued and additional research. Both theoretical implications and
practical applications of the consideration of this research are encouraged by these results.

143
References

144
References
Agranoff , R. , and McGuire, M. (2003). Collaborative public management: New strategies for
local governments. Washington, DC: Georgetown University Press
Alter, C., & Hage, J. (1993). Organizations working together. Newbury Park, CA: Sage
Publications.
Ansell, C., & Gash, A. (2008). Collaborative governance in theory and practice. Journal of
public administration research and theory, 18(4), 543-571.
Babbie, E., & Mouton, J. (1998). The practice of social science research.
Bass, B., & Bass, R. (2009). The Bass handbook of leadership: Theory, research, and
managerial applications. Simon and Schuster.
Bryan, V., Jones, B., & Lawson, E. (2010). Key features of effective citizen–state child welfare
partnerships: Findings from a national study of citizen review panels. Children and Youth
Services Review, 32(4), 595-603.
Bylaws of the Virginia League of Social Services Executives, Incorporated. 2013.
Code of Virginia: §63.2 Welfare (Social Services); http://leg1.state.va.us/cgi-
bin/legp504.exe?000+cod+TOC6302000 (3/10/13)
Cohen, J. (84). Cohen. P. (1983). Applied multiple regression/correlation analysis for the
behavioral sciences. Hillsdale, NJ: Erlbaum.

145
Conger, J. and Kanungo, R. (1987). Toward a behavioral theory of charismatic leadership in
organizational settings. The Academy of Management Review, 12 (4), p. 637-647.
Dahl, R. and Lindblom, C. (1953) Politics, economics, and welfare: Planning and politico-
economic systems resolved into basic social processes. New York: Harper and Row
Publishers.
Das, T., & Teng, B. (1998). Between trust and control: Developing confidence in partner
cooperation in alliances. Academy of Management review, 23(3), 491-512.
Dillman, D., Tortora, R., & Bowker, D. (1998). Principles for constructing web surveys. In Joint
Meetings of the American Statistical Association.
Eagly, A., & Johannesen‐Schmidt, M. (2001). The leadership styles of women and men.
Journal of Social Issues, 57(4), 781-797.
Eagly, A. and Johnson, B. (1990). Gender and leadership-style: A meta-analysis. Psychological
Bulletin, 108 (2), p. 233 – 256.
Fiedler, F. (1964). A contingency model of leadership effectiveness. In L. Berkowitz (Ed.),
Advances in experimental social psychology. New York: Academic Press, 1964.
Fiedler, F. (1967). A theory of leadership effectiveness. New York: McGraw-Hill.
Fiedler, F. (1971). Validation and extension of the contingency model of leadership
effectiveness: A review of empirical findings. Psychological Bulletin, 76 (2), 128-148.
Follett, M. (1918). The new state: Group organization the solution of popular government. Penn
State Press.

146
Follett, M. (1930). Some discrepancies in leadership theory and practice. Business Leadership.
Frankfort-Nachmias, C. and Nachmias, D. (2000). Research methods in the social sciences (6th
Edition). New York, NY: Worth Publishers.
Getha-Taylor, H. (2008). Identifying collaborative competencies. Review of Public Personnel
Administration, 28(2), 103-119.
Gough, H. (1969). A leadership index on the California Psychological Inventory. Journal of
Counseling Psychology, 16(4), 283.
Hierarchical regression. Retrieved from
http://www.ucdenver.edu/academics/colleges/nursing/Documents/PDF/HierarchicalRegre
ssionHowTo.pdf on 3/28/2014.
Horwath, J., & Morrison, T. (2007). Collaboration, integration and change in children's services:
Critical issues and key ingredients. Child Abuse & Neglect, 31(1), 55-69.
House, R. (1971). A path goal theory of leader effectiveness. Administrative Science Quarterly,
16 (3), p. 321-339.
House, R. and Mitchell, T. (1974). Path-goal theory of leadership. Journal of Contemporary
Business, (3), p. 81- 97.
Howell, J. and Costley, D. (2006). Understanding behaviors for effective leadership: 2nd Edition.
Upper Saddle River, NJ: Pearson – Prentice Hall.
Huxham, C. (2003). Theorizing collaboration practice. Public management review, 5(3), 401-
423.

147
Huxham, C., & Vangen, S. (2005). Managing to collaborate: The theory and practice of
collaborative advantage. Psychology Press.
Isaac, S. and Michael, W. (1995). Handbook in research and evaluation: A collection of
principles, methods, and strategies useful in the planning, design, and evaluation of
studies in education and the behavioral sciences (3rd Edition). San Diego, CA:
Educational and Industrial Testing Services.
Johnson, P., Wistow, G., Schulz, R., & Hardy, B. (2003). Interagency and interprofessional
collaboration in community care: the interdependence of structures and values. Journal of
Interprofessional care, 17(1), 70-83.
Kalu, K. (2012). All that glitters: Competing narratives and transaction costs in complex
collaborative environments. Administration and Society, 45(4), 420-442.
Kark, R., Waismel-Manor, R., & Shamir, B. (2012). Does valuing androgyny and femininity lead
to a female advantage? The relationship between gender-role, transformational leadership
and identification. The Leadership Quarterly, 23(3), 620-640.
Kettl, D. (2005). The global public management revolution. Brookings Institution Press.
Kettl, D. (2006). Managing boundaries in American administration: The collaboration
imperative. Public Administration Review, 66(s1), 10-19.
Kouzes, J. & Posner, B. (2002). The leadership challenge (Vol. 3). San Francisco, CA:
Jossey-Bass.
Krosnick, J. (1999). Survey research. Annual review of psychology, 50(1), 537-567.

148
Lasker, R., Weiss, E., & Miller, R. (2001). Partnership synergy: A practical framework for
studying and strengthening the collaborative advantage. Milbank quarterly, 79(2), 179-
205.
Luke, J. (1998). Catalytic Leadership: Strategies for an Interconnected World. San Francisco,
CA 94104: Jossey-Bass, Inc., Publishers.
McGuire, M. (2006). Collaborative public management: Assessing what we know and how we
know it. Public administration review, 66(s1), 33-43.
McGuire, M., & Silvia, C. (2009). Does Leadership in Networks Matter?. Public Performance &
Management Review, 33(1), 34-62.
McLarney, C. and Rhyno, S. (1999). Mary Parker Follett: Visionary leadership and strategic
management. Women in Management Review, 14(7), 292-302.
Miller, G. & Yang, K. (Eds.). (2007). Handbook of research methods in public
administration. CRC press.
Morrison, T. (1996). Partnership and collaboration: rhetoric and reality. Child Abuse &
Neglect, 20(2), 127-140.
Morse, R. (2008). Developing public leaders in an age of collaborative governance. Innovations
in public leadership development, 79-100.
Morse, R. (2010). Integrative public leadership: Catalyzing collaboration to create public value.
The Leadership Quarterly, 21(2), 231-245.

149
National Academy of Public Administration. (2005). Results of a symposium conducted by the
National Academy of Public Administration and Human Capital Solutions.
National Association of Social Workers. Retrieved from http://www.socialworkers.org/ on
September 9, 2013.
Office of Management and Budget of the Executive Office of the President. (2009).
Memorandum for the heads of executive departments and agencies: Open government
directive (M-10-06). Washington, D.C.
O‘Leary, R., Gerard, C., & Bingham, L. (2006). Introduction to the symposium on collaborative
public management. Public Administration Review, 66(s1), 6-9.
Partner. In Merriam-webster.com.
Partnership. In Merriam-webster.com.
Perrone, V., Zaheer, A., & McEvily, B. (2003). Free to be trusted? Organizational constraints on
trust in boundary spanners. Organization Science, 14(4), 422-439.
Piquero, A. and Weisburd, D. 2010. Handbook of quantitative criminology. New York: Springer-
Verlag LLC.
Poxton, R. (Ed.). (1999). Working across the boundaries: Experiences of primary health and
social care partnerships in practice. King's Fund.
Rainey, H. (2003). Understanding and Managing Public Organizations. San Francisco, CA:
Jossey-Bass.

150
Rittel, H. and Webber, M. (1973). Dilemmas in a general theory of planning. Policy Sciences,
4(2), 155-169.
Salamon, L. 2002. The new governance and the tools of public action: An introduction. The
Tools of Government: A Guide to the New Governance. New York, NY: Oxford
University Press.
Sawyer, R. (1984). Determining minimum sample sizes for multiple regression grade prediction
equations for colleges. Research and Development Division, American College Testing
Program.
Silvia, C., & McGuire, M. (2010). Leading public sector networks: An empirical examination of
integrative leadership behaviors. The Leadership Quarterly, 21(2), 264-277.
Stevenson, O. (1989). Child abuse: Public policy and professional practice. London: Harvester
Wheatsheaf.
Stoker, G. (1998). Public-private partnerships and urban governance. In, Pierre,
Jon (ed.) Partnerships in Urban Governance: European and American
Experience. London, UK: Macmillan, 34-51.
Van Slyke, D. (2007). Agents or stewards: Using theory to understand the government-nonprofit
social service contracting relationship. Journal of Public Administration Research and
Theory, 17(2), 157-187.
Waller, G. (2013). NASW Hires New CEO to Lead Fast Growing Social Work Profession.

151
Retrieved from http://www.socialworkers.org/pressroom/2013/030713.asp on September
9, 2013.
Webb, A. (1991). Coordination: A problem in public sector management. Policy and Politics,
19(4), 229-241.
Weiss, E., Anderson, R., & Lasker, R. (2002). Making the most of collaboration: exploring the
relationship between partnership synergy and partnership functioning. Health Education
& Behavior, 29(6), 683-698.
Williams, P. (2002). The competent boundary spanner. Public administration, 80(1), 103-124.
Wilson, J. (1989). Bureaucracy: What government agencies do and why they do it. Basic Books,
Inc.
Visser, P., Krosnick, J., Marquette, J., & Curtin, M. (1996). Mail surveys for election
forecasting? An evaluation of the Columbus Dispatch poll. Public Opinion
Quarterly, 60(2), 181-227.

152
APPENDIX A
SAMPLE FRAME OF LOCAL DEPARTMENTS OF SOCIAL SERVICES
1. Campbell
2. Caroline
3. Carroll
4. Charles City
5. Charlotte
6. Chesterfield/Colonial Heights
7. Clarke
8. Craig
9. Culpeper
10. Cumberland
11. Dickenson
12. Dinwiddie
13. Essex
14. Fairfax Co.-City/Falls Church
15. Fauquier
16. Floyd
17. Fluvanna
18. Franklin Co.
19. Frederick
20. Giles
21. Gloucester
22. Goochland
23. Grayson
24. Greene
25. Greensville/Emporia
26. Halifax/South Boston
27. Hanover
28. Henrico
29. Henry/Martinsville
30. Highland
31. Isle Of Wight
32. James City
33. King & Queen
34. King George
35. King William
36. Lancaster
37. Lee
38. Loudoun
39. Louisa
40. Lunenburg
41. Madison
42. Mathews
43. Mecklenburg
44. Middlesex
45. Montgomery
46. Nelson
47. New Kent
48. Northampton
49. Northumberland
50. Nottoway
51. Orange
52. Page
53. Patrick
54. Pittsylvania
55. Powhatan
56. Prince Edward
57. Prince George
58. Prince William
59. Pulaski
60. Rappahannock
61. Richmond Co.
62. Roanoke Co./Salem
63. Rockbridge/Buena Vista/Lexington
64. Rockingham/Harrisonburg
65. Russell
66. Scott
67. Shenandoah
68. Smyth
69. Southampton
70. Spotsylvania
71. Stafford
72. Surry

153
73. Sussex
74. Tazewell
75. Warren
76. Washington
77. Westmoreland
78. Wise
79. Wythe
80. York/Poquoson
81. Alexandria
82. Bristol
83. Charlottesville
84. Chesapeake
85. Danville
86. Franklin
87. Fredericksburg
88. Galax
89. Hampton
90. Hopewell
91. Lynchburg
92. Manassas
93. Manassas Park
94. Newport News
95. Norfolk
96. Norton
97. Petersburg
98. Portsmouth
99. Radford
100. Richmond
101. Roanoke
102. Suffolk
103. Virginia Beach
104. Williamsburg
105. Winchester

154
APPENDIX B
PERMISSION TO USE THE LEADERSHIP PRACTICES INVENTORY (SELF)
October 18, 2013
Jennifer Behrens
45 Stonewall Road
Palmyra, VA 22963
Dear Ms Behrens:
Thank you for your request to use the LPI®: Leadership Practices Inventory® in your
dissertation.
This letter grants the applicant permission to utilize either the print or electronic LPI instrument
in your research. We are willing to allow you to reproduce the instrument in printed form at no
charge beyond the discounted one-time fee. If you prefer to use the electronic distribution of the
LPI (vs. making copies of the print materials) you will need to separately contact Ryan Noll
([email protected]) directly for further details regarding product access and payment. Please be
sure to review the product information resources before reaching out with pricing questions.
Permission to use either the written or electronic versions requires the following agreement:
(1) That the LPI is used only for research purposes and is not sold or used in conjunction
with any compensated management development activities;
(2) That copyright of the LPI, or any derivation of the instrument, is retained by James
M. Kouzes and Barry Z. Posner, and that the following copyright statement is included
on all copies of the instrument; "Copyright © 2013 James M. Kouzes and Barry Z.
Posner. All rights reserved. Used with permission";(3) That one (1) electronic copy of
your dissertation and one (1) copy of all papers, reports, articles, and the like which make
use of the LPI data be sent promptly to our attention; and,
(4) That you agree to allow us to include an abstract of your study and any other
published papers utilizing the LPI on our various websites.
If the terms outlined above are acceptable, would you indicate so by signing one (1) copy of this
letter and returning it to me either via email or by post to; 1548 Camino Monde San Jose, CA
95125. Best wishes for every success with your research project.


156
APPENDIX C
COVER LETTER TO VIRGINIA LEAGUE OF SOCIAL SERVICES EXECUTIVES
January 2014
Virginia League of Social Services Executives:
I am a doctoral student at Virginia Commonwealth University under the direction of Dr. William
C. Bosher, Distinguished Professor of Public Policy and Education in the Wilder School of
Government. My research will study the perceptions of Virginia Local Departments of Social
Services executives regarding collaboration and leadership behaviors within the Virginia League
of Social Services Executives group.
I understand your time is valuable and limited. However, I would greatly appreciate it if you
would take a few minutes (less than 20 minutes) to complete the survey accessible via the
provided link (https://www.surveymonkey.com/s/5K5R6VC). The instrument will be used for
the sole purpose of gathering data. Your participation is completely voluntary, and you may
withdraw your responses at any time during the survey. All responses will be confidential. No
identifiable data, such as e-mail address or IP address, will be collected or tracked through this
survey. Individual participants will not be identified when analyzing or reporting this data.
Completing the survey will indicate your permission for the data you submit to be used in this
study.
You have the option of receiving the results of the study and the instructions on how to do so are
given at the end of the questionnaire. Your input is essential to the success of this study.
You may feel free to contact me or Dr. Bosher if you have any questions or would like
clarification of aspects of this study. My phone number is 434-906-1171; my e-mail address is
[email protected]. Dr. Bosher’s phone number is 804-827-3290.
Thank you for taking the time to participate in this study; I greatly appreciate your service and
effort.
Sincerely,

157
Jennifer E. Behrens, MSW
Doctoral Candidate
William C. Bosher, Ed.D.
Distinguished Professor

158
APPENDIX D
SURVEY INSTRUMENT
PARTICIPATION IN THIS STUDY IS VOLUNTARY. ALL RESPONSES WILL REMAIN STRICTLY
CONFIDENTIAL.
Part I. Least Preferred Coworker Scale. (1967. Fred. E. Fiedler.)
Instructions. Think of all the different people with whom you have ever worked…in jobs, in
social clubs, in student projects, or whatever. Next think of the one person with whom you could
work least well, that is, the person with whom you had the most difficulty getting job done. This
is the one person (a peer, boss, or subordinate) with whom you would least want to work.
Describe this person by circling numbers at the appropriate points on each of the following pairs
of bipolar activities. Work rapidly. There are no right or wrong answers.
Pleasant 8 7 6 5 4 3 2 1 Unpleasant
Friendly 8 7 6 5 4 3 2 1 Unfriendly
Rejecting 1 2 3 4 5 6 7 8 Accepting
Tense 1 2 3 4 5 6 7 8 Relaxed
Distant 1 2 3 4 5 6 7 8 Close
Cold 1 2 3 4 5 6 7 8 Warm
Supportive 8 7 6 5 4 3 2 1 Hostile
Boring 1 2 3 4 5 6 7 8 Interesting

159
Quarrelsome 1 2 3 4 5 6 7 8 Harmonious
Gloomy 1 2 3 4 5 6 7 8 Cheerful
Open 8 7 6 5 4 3 2 1 Guarded
Backbiting 1 2 3 4 5 6 7 8 Loyal
Untrustworthy 1 2 3 4 5 6 7 8 Trustworthy
Considerate 8 7 6 5 4 3 2 1 Inconsiderate
Nasty 1 2 3 4 5 6 7 8 Nice
Agreeable 8 7 6 5 4 3 2 1 Disagreeable
Insincere 1 2 3 4 5 6 7 8 Sincere
Kind 8 7 6 5 4 3 2 1 Unkind
Part II. Leadership Practices Inventory – Self (Select domains; Copyright © 2003 James M.
Kouzes and Barry Z. Posner. All rights reserved. Used with permission.)
Instructions. Choose the response number that best applies to the statement.
1 – Almost never 2 – Rarely 3 – Seldom 4 – Once in a while 5 – Occasionally
6 – Sometimes 7 – Fairly Often 8 – Usually 9 – Very Frequently 10 – Almost always
1. I develop cooperative relationships among the people with work with.
2. I actively listen to diverse points of view.
3. I treat others with dignity and respect.

160
4. I support the decisions that people make on their own.
5. I give people a great deal of freedom and choice in deciding how to do their work.
6. I ensure that people grow in their jobs by learning new skills and developing themselves.
Part III. Collaboration Audit (Copyright © 2003 James M. Kouzes and Barry Z. Posner. All
rights reserved. Used with permission.)
IIIA. Instructions: Rate the extent to which you agree or disagree that each statement describes
the actions of people in the Virginia League of Social Services Executives. Use the following
scale to indicate your level of agreement or disagreement.
(1) Strongly Disagree (2) Disagree (3) Neither Disagree nor Agree (4) Agree (5) Strongly Agree
Around here, people…
____ 1. Act in a trustworthy and trusting manner.
____ 2. Ask others for help and assistance when needed.
____ 3. Treat others with dignity and respect.
____ 4. Talk openly about their feelings.
____ 5. Listen attentively to the opinions of others.
____ 6. Express clarity about the group’s goal.
____ 7. Make personal sacrifices to meet the larger group goal.
____ 8. Can rely on each other.
____ 9. Pitch in to help when others are busy or running behind.

161
____ 10. Give credit to others for their contributions.
____ 11. Interact with each other on a regular basis.
____ 12. Treat every relationship as if it will last for a lifetime, even if it won’t.
____ 13. Make it their business to introduce their colleagues to people who can help them
succeed.
____ 14. Freely pass along information that might be useful to others.
____ 15. Relate will to people of diverse backgrounds and interests.
IIIB. Instructions: Rate the extent to which you agree or disagree that following statement
describes the actions of the Virginia League of Social Services Executives. Use the following
scale to indicate your level of agreement or disagreement.
(1) Strongly Disagree (2) Disagree (3) Neither Disagree nor Agree (4) Agree (5) Strongly Agree
1. I am satisfied with the leadership of the VLSSE.
2. I am satisfied with the performance of the VLSSE.
Part IV. Demographic Information.
Instructions. Please mark the appropriate box. Please remember that all of your responses will
be considered confidential and will be anonymous. Your confidentiality is guaranteed.
1. Gender
a. Male

162
b. Female
2. Age
a. < 30
b. 30-40
c. 40-50
d. 50-60
e. < 60
3. Race/Ethnicity
a. White
b. Black
c. Asian
d. Hispanic
e. Other
4. Number of years in current position with your Local Department of Social Services
a. 1-3 years
b. 4-6 years
c. 7-10 years
d. 10-12 years
e. 13 or more years
5. Position with the Virginia League of Social Services Executives (VLSSE)

163
a. Elected position (including President, Vice-President, Secretary, Treasurer,
Regional Representative)
b. Member, non-elected position
6. Region of your Local Department of Social Services
a. Northern
b. Eastern
c. Central
d. Piedmont
e. Southwest
7. Class size of your Local Department of Social Services
a. Class 1 (< 20 authorized to fill, permanent, full-time equivalent positions)
b. Class 2 ( 21 – 80 authorized to fill, permanent, full-time equivalent positions)
c. Class 3 (> 81 authorized to fill, permanent, full-time equivalent positions)
THANK YOU FOR YOUR PARTICIPATION IN THIS STUDY!
If you would like a copy of the results, please provide your contact information following this
screen.

164
APPENDIX E
FIRST SURVEY REMINDER LETTER
February 2014
Virginia League of Social Services Executives:
I want to take the time to express my appreciation of your participation in the survey if you have
taken the brief amount of time to complete it – thank you!
If you have not yet completed the survey, I respectfully request your participation in this survey.
I am a doctoral student at Virginia Commonwealth University under the direction of Dr. William
C. Bosher, Distinguished Professor of Public Policy and Education in the Wilder School of
Government. My research will study the perceptions of Virginia Local Departments of Social
Services executives regarding collaboration and leadership behaviors within the Virginia League
of Social Services Executives group.
I understand your time is valuable and limited. However, I would greatly appreciate it if you
would take a few minutes (less than 20 minutes) to complete the survey accessible via the
provided link (https://www.surveymonkey.com/s/5K5R6VC). The instrument will be used for
the sole purpose of gathering data. Your participation is completely voluntary, and you may
withdraw your responses at any time during the survey. All responses will be confidential. No
identifiable data, such as e-mail address or IP address, will be collected or tracked through this
survey. Individual participants will not be identified when analyzing or reporting this data.
Completing the survey will indicate your permission for the data you submit to be used in this
study.
You have the option of receiving the results of the study and the instructions on how to do so are
given at the end of the questionnaire. Your input is essential to the success of this study.
You may feel free to contact me or Dr. Bosher if you have any questions or would like
clarification of aspects of this study. My phone number is 434-906-1171; my e-mail address is
[email protected]. Dr. Bosher’s phone number is 804-827-3290.
Thank you for taking the time to participate in this study; I greatly appreciate your service and
effort.
Sincerely,

165
Jennifer E. Behrens, MSW
Doctoral Candidate
William C. Bosher, Ed.D.
Distinguished Professor

166
APPENDIX F
SECOND SURVEY REMINDER LETTER
March 2014
Virginia League of Social Services Executives:
I want to take the time to express my appreciation of your participation in the survey if you have
taken the brief amount of time to complete it – thank you!
If you have not yet completed the survey, I respectfully request your participation in this survey.
The survey will close at 5 PM (EST) on Friday, March 7, 2014. I am a doctoral student at
Virginia Commonwealth University under the direction of Dr. William C. Bosher, Distinguished
Professor of Public Policy and Education in the Wilder School of Government. My research will
study the perceptions of Virginia Local Departments of Social Services executives regarding
collaboration and leadership behaviors within the Virginia League of Social Services Executives
group.
I understand your time is valuable and limited. However, I would greatly appreciate it if you
would take a few minutes (less than 20 minutes) to complete the survey accessible via the
provided link (https://www.surveymonkey.com/s/5K5R6VC). The instrument will be used for
the sole purpose of gathering data. Your participation is completely voluntary, and you may
withdraw your responses at any time during the survey. All responses will be confidential. No
identifiable data, such as e-mail address or IP address, will be collected or tracked through this
survey. Individual participants will not be identified when analyzing or reporting this data.
Completing the survey will indicate your permission for the data you submit to be used in this
study.
You have the option of receiving the results of the study and the instructions on how to do so are
given at the end of the questionnaire. Your input is essential to the success of this study.
You may feel free to contact me or Dr. Bosher if you have any questions or would like
clarification of aspects of this study. My phone number is 434-906-1171; my e-mail address is
[email protected]. Dr. Bosher’s phone number is 804-827-3290.
Thank you for taking the time to participate in this study; I greatly appreciate your service and
effort.

167
Sincerely,
Jennifer E. Behrens, MSW
Doctoral Candidate
William C. Bosher, Ed.D.
Distinguished Professor

168
APPENDIX G
THIRD SURVEY REMINDER LETTER
March 7, 2014
Virginia League of Social Services Executives:
I want to take the time to express my appreciation of your participation in the survey if you have
taken the brief amount of time to complete it – thank you!
Please take a few minutes to take the survey if you have not yet. The survey will close tonight
(Friday, March 7th) at 5 PM. You will help make the results of this survey mean something to
your group by completing this.
You can find the survey at https://www.surveymonkey.com/s/5K5R6VC. Your participation is
completely voluntary, and you may withdraw your responses at any time during the survey. All
responses will be confidential.
Sincerely,
Jennifer E. Behrens, MSW
Doctoral Candidate
William C. Bosher, Ed.D.
Distinguished Professor

169
APPENDIX H
FREQUENCIES OF LEADERSHIP PRACTICES INVENTORY (SELF) ITEMS
I develop cooperative relationships among the people I work with.
Frequency Percent Valid Percent
Cumulative
Percent
Valid Sometimes 1 1.9 1.9 1.9
Fairly often 2 3.8 3.8 5.7
Usually 8 15.1 15.1 20.8
Very frequently 14 26.4 26.4 47.2
Almost always 28 52.8 52.8 100.0
Total 53 100.0 100.0
I actively listen to diverse points of view.
Frequency Percent Valid Percent
Cumulative
Percent
Valid Fairly often 4 7.5 7.7 7.7
Usually 12 22.6 23.1 30.8
Very frequently 15 28.3 28.8 59.6
Almost always 21 39.6 40.4 100.0
Total 52 98.1 100.0
Missing System 1 1.9
Total 53 100.0

170
I treat others with dignity and respect.
Frequency Percent Valid Percent
Cumulative
Percent
Valid Usually 5 9.4 9.4 9.4
Very frequently 15 28.3 28.3 37.7
Almost always 33 62.3 62.3 100.0
Total 53 100.0 100.0
I support the decisions that people make on their own.
Frequency Percent Valid Percent
Cumulative
Percent
Valid Sometimes 1 1.9 1.9 1.9
Fairly often 2 3.8 3.8 5.8
Usually 20 37.7 38.5 44.2
Very frequently 23 43.4 44.2 88.5
Almost always 6 11.3 11.5 100.0
Total 52 98.1 100.0
Missing System 1 1.9
Total 53 100.0
I give people a great deal of freedom and choice in deciding how to do their work.
Frequency Percent Valid Percent
Cumulative
Percent
Valid Fairly often 5 9.4 9.4 9.4
Usually 17 32.1 32.1 41.5
Very frequently 18 34.0 34.0 75.5
Almost always 13 24.5 24.5 100.0
Total 53 100.0 100.0

171
I ensure that people grow in their jobs by learning new skills and developing
themselves.
Frequency Percent Valid Percent
Cumulative
Percent
Valid Sometimes 1 1.9 1.9 1.9
Fairly often 4 7.5 7.5 9.4
Usually 8 15.1 15.1 24.5
Very frequently 18 34.0 34.0 58.5
Almost always 22 41.5 41.5 100.0
Total 53 100.0 100.0

172
APPENDIX I
FREQUENCIES OF COLLABORATION AUDIT SUCCESSFUL COLLABORATIVE BEHAVIOR ITEMS
Act in a trustworthy and trusting manner.
Frequency Percent Valid Percent
Cumulative
Percent
Valid Strongly disagree 1 1.9 1.9 1.9
Disagree 1 1.9 1.9 3.8
Neither disagree nor agree 3 5.7 5.7 9.4
Agree 30 56.6 56.6 66.0
Strongly agree 18 34.0 34.0 100.0
Total 53 100.0 100.0
Ask others for help and assistance when needed.
Frequency Percent Valid Percent
Cumulative
Percent
Valid Neither disagree nor agree 2 3.8 3.8 3.8
Agree 29 54.7 55.8 59.6
Strongly agree 21 39.6 40.4 100.0
Total 52 98.1 100.0
Missing System 1 1.9
Total 53 100.0

173
Treat others with dignity and respect.
Frequency Percent Valid Percent
Cumulative
Percent
Valid Disagree 2 3.8 3.8 3.8
Neither disagree nor agree 5 9.4 9.4 13.2
Agree 32 60.4 60.4 73.6
Strongly agree 14 26.4 26.4 100.0
Total 53 100.0 100.0
Can rely on each other.
Frequency Percent Valid Percent
Cumulative
Percent
Valid Strongly disagree 1 1.9 1.9 1.9
Disagree 2 3.8 3.8 5.7
Neither disagree nor agree 7 13.2 13.2 18.9
Agree 27 50.9 50.9 69.8
Strongly agree 16 30.2 30.2 100.0
Total 53 100.0 100.0
Interact with each other on a regular basis.
Frequency Percent Valid Percent
Cumulative
Percent
Valid Disagree 3 5.7 5.7 5.7
Neither disagree nor agree 6 11.3 11.3 17.0
Agree 29 54.7 54.7 71.7
Strongly agree 15 28.3 28.3 100.0
Total 53 100.0 100.0

174
Freely pass along information that might be useful to others.
Frequency Percent Valid Percent
Cumulative
Percent
Valid Disagree 6 11.3 11.3 11.3
Neither disagree nor agree 5 9.4 9.4 20.8
Agree 21 39.6 39.6 60.4
Strongly agree 21 39.6 39.6 100.0
Total 53 100.0 100.0

175
APPENDIX J
FREQUENCIES OF COLLABORATION AUDIT DISAGREEMENT OR NO AGREEMENT ITEMS
Talk openly about their feelings.
Frequency Percent Valid Percent
Cumulative
Percent
Valid Strongly disagree 1 1.9 1.9 1.9
Disagree 5 9.4 9.4 11.3
Neither disagree nor agree 13 24.5 24.5 35.8
Agree 24 45.3 45.3 81.1
Strongly agree 10 18.9 18.9 100.0
Total 53 100.0 100.0
Listen attentively to the opinions of others.
Frequency Percent Valid Percent
Cumulative
Percent
Valid Strongly disagree 2 3.8 3.8 3.8
Disagree 5 9.4 9.4 13.2
Neither disagree nor agree 6 11.3 11.3 24.5
Agree 31 58.5 58.5 83.0
Strongly agree 9 17.0 17.0 100.0
Total 53 100.0 100.0

176
Make personal sacrifices to meet the larger group goal.
Frequency Percent Valid Percent
Cumulative
Percent
Valid Strongly disagree 2 3.8 3.8 3.8
Disagree 5 9.4 9.4 13.2
Neither disagree nor agree 13 24.5 24.5 37.7
Agree 20 37.7 37.7 75.5
Strongly agree 13 24.5 24.5 100.0
Total 53 100.0 100.0
Pitch in to help when others are busy or running behind.
Frequency Percent Valid Percent
Cumulative
Percent
Valid Disagree 3 5.7 5.7 5.7
Neither disagree nor agree 12 22.6 22.6 28.3
Agree 28 52.8 52.8 81.1
Strongly agree 10 18.9 18.9 100.0
Total 53 100.0 100.0
Give credit to others for their contributions.
Frequency Percent Valid Percent
Cumulative
Percent
Valid Strongly disagree 2 3.8 3.8 3.8
Disagree 3 5.7 5.8 9.6
Neither disagree nor agree 7 13.2 13.5 23.1
Agree 27 50.9 51.9 75.0
Strongly agree 13 24.5 25.0 100.0
Total 52 98.1 100.0
Missing System 1 1.9
Total 53 100.0

177
Treat every relationship as if it will last for a lifetime, even if it won’t.
Frequency Percent Valid Percent
Cumulative
Percent
Valid Strongly disagree 2 3.8 3.8 3.8
Disagree 10 18.9 19.2 23.1
Neither disagree nor agree 24 45.3 46.2 69.2
Agree 13 24.5 25.0 94.2
Strongly agree 3 5.7 5.8 100.0
Total 52 98.1 100.0
Missing System 1 1.9
Total 53 100.0
Make it their business to introduce their colleagues to people who can help them succeed.
Frequency Percent Valid Percent
Cumulative
Percent
Valid Strongly disagree 1 1.9 1.9 1.9
Disagree 8 15.1 15.1 17.0
Neither disagree nor agree 11 20.8 20.8 37.7
Agree 23 43.4 43.4 81.1
Strongly agree 10 18.9 18.9 100.0
Total 53 100.0 100.0

178
Relate well to people of diverse backgrounds and interests.
Frequency Percent Valid Percent
Cumulative
Percent
Valid Strongly disagree 2 3.8 3.8 3.8
Disagree 3 5.7 5.8 9.6
Neither disagree nor agree 7 13.2 13.5 23.1
Agree 26 49.1 50.0 73.1
Strongly agree 14 26.4 26.9 100.0
Total 52 98.1 100.0
Missing System 1 1.9
Total 53 100.0

179
VITA
JENNIFER E. BEHRENS, MSW, PHD
EDUCATION
PhD, Public Policy and Administration. Virginia Commonwealth University, Richmond,
VA. August 2008 – May 2014. L. Douglas Wilder School of Government and Public Affairs.
Political Processes and Institutions
Law and Public Policy
Economic Policy Analysis
Public Policy and Administration
Research Methods & Statistical Analysis
Legislation Impact Analysis
Policy Analysis Position Statements
PK-20 Initiatives – Policy and Practice
Master of Social Work. Virginia Commonwealth University, Richmond, VA. August 2006. Concentration:
Social Work Administration, Planning and Policy Practice.
Evidence-based Decision-making through Clinical Foundation Curriculum
Advanced Research, Administration, Planning, & Policy Practice Concentration Curriculum
o Social and Economic Justice
o Differential Advocacy Strategies
o Organizational Development
o Qualitative and Quantitative
Research Methods
o Formative and Summative
Evaluations
o Budget Management
o Legislative Briefs
Bachelor of Arts (Psychology). University of Virginia, Charlottesville, VA. May 1999.
Research Assistant.
EXPERIENCE
Senior Consultant, International Consulting Services, LLC. May 2013 – Present.
Operations Manager, Cross Sector Digital Identity Initiative. May 2013 – Present.
Serves as Operations Lead for the pilot identity ecosystem project, coordinating a
consortium of professionals from industry leading public and private sector
organizations. Develop and implement a trust framework governance structure of
federated ecosystems, including business, legal and technical specifications. Develop
and implement administrative and technical onboarding implementation guides and

180
certifications. Manage application process, onboarding, and production lifecycles of
Users, Relying Parties, Identity Providers, Attribute Verifiers, Attribute Providers,
Credential Service Providers and Privacy Enhancing Technology Providers in ecosystem.
Act as chief administrative officer to serve CSDII Governing Board Chair. Oversee
operations of core pilot team, including management of events, press releases, meeting
scheduling and work processes. Coordinate long-term strategic asset development and
business development, including delineation of use cases and participant-specific value
propositions and cost models developed by sound econometric methodology.
Data Governance IT Strategist, Commonwealth Data Governance, Virginia Information Technologies Agency. May 2013 – Present. Liaise with Commonwealth
Data Governance Service Lead and Enterprise Data Management team in regards to data
governance structure including trust framework documentation and administrative and
technical onboarding implementation processes.
Program Manager, Outcome Based Reporting and Analysis Unit, Office of Research and
Planning, Virginia Department of Social Services. Richmond, VA. February 2012 – May 2013.
Supervise and lead information and performance management for Division, including
management of advanced statistical analysis for regular and ad hoc local, state and
federal reporting and presentations to VDSS Leadership, State Board of Social Services,
and internal and external stakeholders, including public and media audiences
Project management integrating data across Departments and Secretariats (OCS, DOE, VDH, DMAS, VSP), including facilitation of program staff to obtain GIS certification to
enhance Division skills and capacity using statistical software and platforms including
SPSS, ArcGIS, ESRI
Lead information systems development, including guiding business requirement development, coordination of scope assessment, oversight of business liaising with
programming, testing, implementation and evaluation, and business administration of
maintenance of legacy systems integration with contemporary iLog business rules
engines, including eHHR initiatives
Supervise management of contract/grant administration, performance-based contracting, FFATA requirements, sub-recipient monitoring, and APA requirements, initiate program
staff to obtain VCA certification to enhance Division skills and capacity
Acting Quality Assurance and Accountability Manager, Division of Family Services,
Virginia Department of Social Services. Richmond, VA. April 2012 – March 2013. Leadership
of four unit team for quality assurance and business management of information systems for

181
Division, additionally leading administrative policy/practice recommendations and project
management for Secretary, Commissioner, Deputy Commissioners, Division Directors and staff,
and collaborating with ancillary agencies, establishing vendor relationships, and maintaining
inter- and intra-HHR systems and data interoperability efforts:
Outcome Based Reporting and Analysis Unit (1 Program Manager, 6 Program Staff)
o Supervise and lead information management, including Investment Board and
Information Technology Oversight and Compliance Office representation, project
management and information systems development, asset development and
budget management, and management of business administration of complex
architecture requirements and systems development, implementation, testing and
production focused on data interoperability, increased systems efficiency,
comprehensive operationalization and standardization of units of data and
consideration of statistical and financial modeling integrated within case
management systems
o Supervise and lead procurement and contract/grant administration including
business requirement development, initiating RFI/RFP projects, scope assessment,
budget management according to legal and procurement standards; initiated
standard MOU/MOA document for DFS accepted by VDSS Director of
Procurement
o Lead and manage staff advanced analytics efforts and compliance with data
management standards; co-initiated standard data sharing agreement accepted by
VDSS Chief Information Security Officer
o Manage DFS Program Managers and staff on sub-recipient monitoring, including
FFATA requirements
Title IV-E Compliance Review Unit (1 Supervisor, 12 Program Staff, 1 Administrative Assistant)
o Project Manager for Health and Human Resources Secretariat for Title IV-E
Automation and Quality Assurance Project, requiring weekly Project Status
Reports submitted to HHR Secretary and regular meetings with Directors, Deputy
Commissioners, Commissioner, HHR Information Services Advisors; leadership
of multiple oversight and automation workgroups and committees
o Supervise management of compliance reviews, including payment error
accountability
o Supervise policy development, guidance, training and evaluation
o Oversight of DFS coordination with Division of Finance on financial and
statistical data analysis
Adoption Assistance Review Unit (1 Supervisor, 4 Program Staff)

182
o Supervise management of compliance reviews, including payment error
accountability
o Supervise payment training and evaluation
o Oversight of DFS coordination with Division of Finance on financial and
statistical data analysis
CQI Unit (1 Program Manager, 5 Program Staff) o Liaise directly and provide guidance to Program Manager of unit that performs
quality assurance evaluation of performance of services staff in local agencies,
through mechanisms including VDSS Quality Service Reviews and Federal
Children and Family Services Reviews
Manager, Office of Program Accountability, Albemarle County Department of Social
Services. Charlottesville, VA. July 2007-February 2012.
Supervise and lead information management for Department
o Data analysis, including methodology, outcome measurement, performance
management
o Report development and presentation
2011 United States Senate Productivity and Quality Award for Virginia
(SPQA); Primary author; Steering Committee and workgroup membership
o Policy evaluation and analysis
Develop and implement performance management strategies, strategic planning efforts, and continuous quality improvement assessments and plans
Supervise Office of Program Accountability and Front Office staff, interns and volunteers
Budget preparation participation
Identify, facilitate intra-/inter-agency efforts upon, author and submit grant proposals
Provide expert advice, consultation, assistance and training to local and state managers and directors
Lead teams, managers, Albemarle County, stakeholders, state and federal government entities in data analysis, policy evaluation and performance management
Strategic Plan leadership, including ongoing workgroup membership as well as lead on
performance management and development of data book to support development of
triennial plans
Implementation of innovative web-based performance management information system, including developing business requirements, program design, testing, implementation and
County-promotion
o Awarded presentation at 2010 Northeast Conference on Public Administration @
Rutgers University

183
Facilitate focus groups for County feedback loops and continuous quality improvement efforts, including sampling methodology, logistics oversight, topic area question
consultation/development, convening and guiding focus group discussion, report
development and submission
o Performance management system – public leaders convened for evaluation of
performance management system
o Internal-department process and performance – internal stakeholders convened for
evaluation of process and performance work efforts and opportunities for
improvement
o Executive-level – County Executive’s Office and Management and Budget
leaders convened for evaluation of annual budget development process
Senior Social Worker, Substance Abuse Liaison, Charlottesville Department of Social
Services. Charlottesville, VA. July 2002 – June 2007. Foster care case management, Family
Treatment Court Eligibility Committee, Family Treatment Court Board, Task Supervisor, 2004-
07 State Best Practices Team.
Social Worker, DePaul Family Services. Charlottesville, VA. September 2000 – July 2002.
Case management services for children placed in therapeutic foster care, including home
visitation, assessment of needs/strengths, management of/counsel to foster families,
documentation of progress/impediments, collaboration with contracting DSS
agencies/community resources, participation in court hearings, utilization of knowledge of
familial pathologies and dynamics, supervision of DFS mentors.
Family Support Worker, Healthy Families, Crossroads Community Services Board. Farmville,
VA. August 1999 – September 2000. Provision of intensive home visitation services to at-risk
families, including case management, collaboration with agencies, transportation of clients,
promotion of positive parenting skills, maintenance of medical homes, facilitation of support
groups and community forums.
Community Attention Staff, Community Attention. Charlottesville, VA. June 1998 – August
1999. Service provision in Attention Home group home, Teens G.I.V.E experiential learning
program, and Electronic Monitoring juvenile delinquent monitoring program.
Program Director, Big Sibling Program, Madison House. Charlottesville, VA. 1997- 1999.
Operations Program Director, Site Program Director, Volunteer.

184
MANAGEMENT & LEADERSHIP SKILLS
Project Management of stakeholders in
collaborations across Secretariats, Departments
and with multiple private agencies
Management Information Systems development, testing, implementation, evaluation
Development of Performance Management System
Commitment to legal Procurement standards
and protocols with successful contract initiation,
development and management experience
Successful development and implementation of standard data sharing agreement in compliance
with all state and federal codes
Successful team facilitation & leadership
Proactive assessment and negotiation capabilities
Data analysis, including statistical software
package expertise (SPSS, Excel) and social
science data bases
Customer service focus and delivery
Strategic Planning development and
endorsement expertise
Scholarly research, evidence-based decision-making
Policy development, analysis and evaluation
Legislative brief development and dissemination
Knowledge Management System expertise
IRB Certified & VDSS IRB Committee member
Data integrity consultation and direction
Continuous Quality Improvement concentration
Promotes and inspires others to embrace values, mission and vision of organization
Consistently plans and executes goals and objectives
Expert focus group facilitation
Grant development and submission
Oversight of sub-recipient monitoring
Management of contract and grant
administration, including administration of
performance-based contracting
AGENCY LEADERSHIP
Virginia Department of Social Services (February 2012 – May 2013)
HHR Title IV-E Project Manager: Automation and Quality Assurance
DFS Leadership Team
Strengthening Families Initiative Data
Workgroup
DFS Managing By Data Team Facilitator
IRB Committee Member
SharePoint 2010 Committee Member
CommonHelp Customer Portal Customer Evaluation Committee Member

185
Albemarle County Government (July 2007 – February 2012)
Innovative Leadership Institute
Member
Performance Management Team
Climate Survey Team
DSS Information Management
Functional Team
DSS Managers’ Team
DSS Strategic Plan Data Team
DSS Limited English Proficiency Workgroup
DSS Leadership Team
DSS 2011 Senate Productivity and
Quality Award (SPQA) Steering
Committee
COMMUNITY & ORGANIZATIONAL INVOLVEMENT
Charlottesville/Albemarle Adult Drug Court Board (2005-present)
Virginia Department of Social Services Business Intelligence Steering Committee (2007-2009)
Virginia League of Social Services Executives Information Management Team (2007-2008)
Charlottesville/Albemarle Commission on Children and Families Partnership For Children Data Team (2008-2012)
Charlottesville/Albemarle Smart Beginnings – United Way Thomas Jefferson Area Measuring
School Readiness Committee (2009-2012)
DePaul Community Resources Community Advisory Board (2010 – 2012)
VDSS Managing By Data Team (Family Services, Adult Services) (2007 – present)
VDSS Executive Managing by Data Committee (2012)
Virginia Homeless Data and Coordination Committee (2011-2012)
Thomas Jefferson Health District Community Health Assessment Team (2011-2012)
Albemarle County Learn Local Faculty (2007-2012)
Virginia Commonwealth University PhD Public Policy and Administration Program Mentor
(2011-2012)
Virginia Department of Social Services Data Shared Learning Collaborative Team (2011-2013)

186
AWARDS AND RECOGNITIONS
2013 Pi Alpha Alpha National Honor Society for Public Affairs and Administration
2012 Advanced Analytics for Child Welfare Administration course graduate, Chapin Hall,
University of Chicago.
2011 United States Senate Productivity and Quality Award for Virginia (SPQA) Certificate for
Commitment to Performance Excellence award winner– Albemarle County Department of Social
Services lead author & SPQA Steering Committee member
2011Virginia Commonwealth University L. Douglas Wilder School of Government and Public
Affairs Leigh Grosenick Award - awarded for writing the best paper in the PhD Public Policy and
Administration Program
2011 Innovative Leadership Institute Outstanding Dedication and Performance Award;
Albemarle County, Virginia
2011 Innovative Leadership Institute “If You Build It They Will Come” Award; Albemarle
County, Virginia – SharePoint Capstone Team
2010 Northeast Conference on Public Administration @ Rutgers University Presentation -
Results During Time of Fiscal Stress: University Students Join Practitioners to Create County’s
First Web-based Performance Management System
vLeader 2007 Experience Level One Certification
Employee Recognition (Total Rewards); Albemarle County
October 2010 June 2011 October 2011