lean healthcare concepts for process improvement …€¢ appendix a –process improvement...
TRANSCRIPT

Lean Healthcare Concepts for
Process Improvement
Rick Murrow
Healthcare Business Academy Fellows
(September 30, 2016) Copyright, 2016
Air Academy Associates

Copyright, 2016
Thank You
2
• Thank you to Linda Becker and the Healthcare
Business Academy for this opportunity
• Air Academy Associates has partnered with NorthStar
Network and the Healthcare Business Academy for a number
of years
• This provides an opportunity to share proven techniques and
methods we’ve used to strengthen various private and public
healthcare systems
Thanks to each of you as Fellows in this learning
process for your participation

Copyright, 2016
COURSE INFORMATION
3
• Materials
• Cell phones
• Stop time
• Breaks
• Active participation – questions are good/
discussion is great/involvement is wonderful

Copyright, 2016
EXPECTATIONS
• Expectations?
4

Copyright, 2016
Agenda
CONCEPTS for LEADERS
5
• Strategic View• Strategic Drilldown• Planning Model
• Lean • Lean Principles• Value Stream• 8 Wastes• Value Stream Mapping• Input-Process-Output• Measurements • Variation and Process Capability• Efficiency• DMAIC Methodology• Improvement Tools
• PF/IPO/SOP• Standard Work• Visual Management• 5S• Huddle Meetings
Copyright, 2016
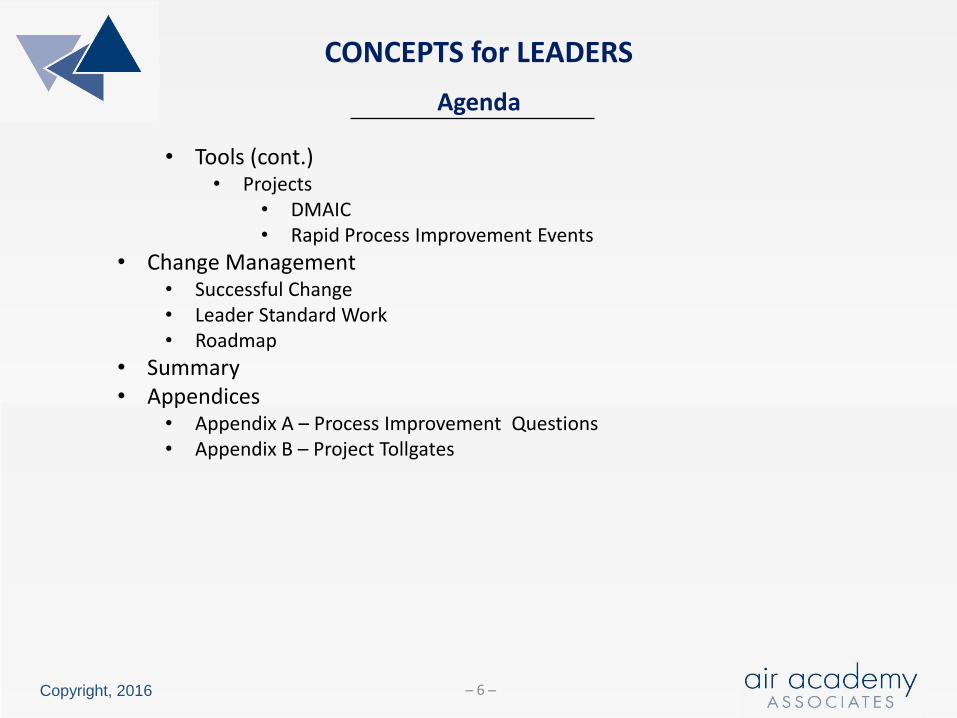
Agenda
CONCEPTS for LEADERS
6
• Tools (cont.)• Projects
• DMAIC• Rapid Process Improvement Events
• Change Management• Successful Change• Leader Standard Work• Roadmap
• Summary• Appendices
• Appendix A – Process Improvement Questions• Appendix B – Project Tollgates

Copyright, 2016
Leaders, Society, Customers, Business Motivation Creates the Vision
IF THERE IS A NEED …
7
One of the main ways the Affordable Care Act seeks to reduce health care costs is by encouraging doctors, hospitals and other health care providers to form networks that coordinate patient care and become eligible for bonuses when they deliver that care more efficiently.
The law takes a carrot-and-stick approach by encouraging the formation of accountable care organizations (ACOs). Providers make more if they keep their patients healthy.
Accountable Care Act

Copyright, 2016
LEADERS SET GOALS – ACO Goals
8

Copyright, 2016
Not Always Clear – Can assume Multiple Roles
WHERE DO YOU FIT IN THE HEALTHCARE SYSTEM?
9
• Patient or other end user of a HC product/service?• Patient advocate?• Direct Service Provider:
• Physician / Nurse• Medical Center Staff• Medical Officers• Pharmacist• Care provider
• In-direct Service Provider:• Health Insurance Providers• Provider of Supplies, Drugs, Facilities, Equipment?
• Government Entity• Society / Community• Shareholders

Copyright, 2016
Reality Check
SELF-ASSESSMENT
10
• What are you doing to support improvement in healthcare quality, cost, patient safety, access, and delivery?
• What measurements are you currently tracking?
• What are your top 3 issues?

Copyright, 2016
Reality Check
SELF-ASSESSMENT (cont.)
11
• What have you done in the last 6 months to address the issues?
• Is there a need to improve?
• What is your vision of the future?
• What is your plan to get there?

Copyright, 2016
Improvement Efforts Should Link
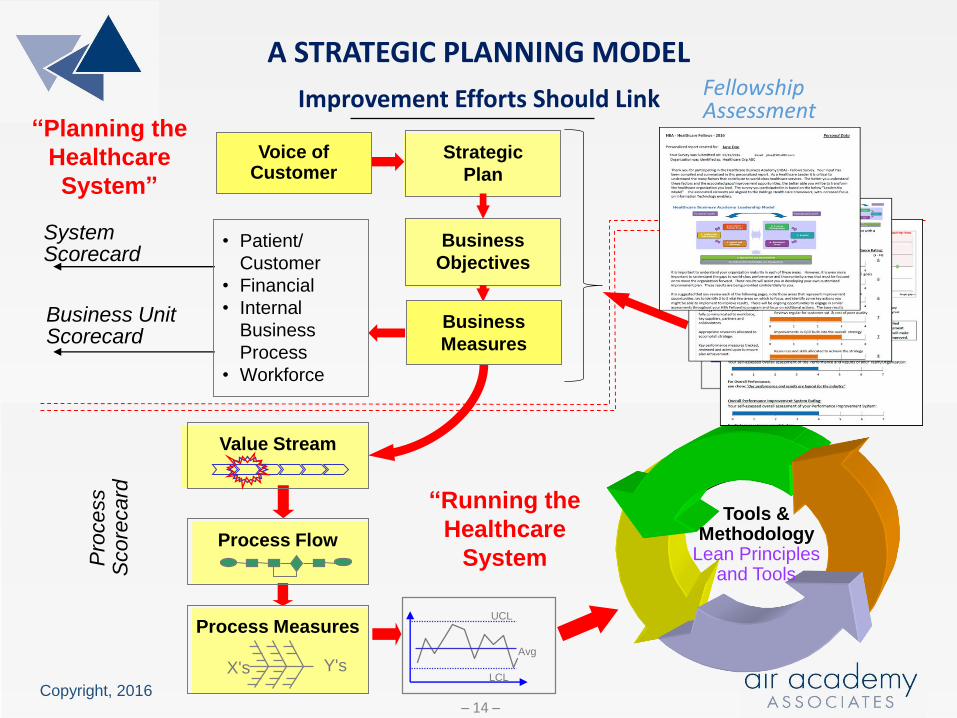
A STRATEGIC PLANNING MODEL
12
UCL
LCL
Avg
Pro
cess
Score
card
Business Unit Scorecard
System Scorecard
Tools &Methodology
Lean Principles and Tools
UCL
LCL
Avg
Y'sX's
Voice of Customer
Strategic
Plan
Business
Objectives
• Patient/
Customer
• Financial
• Internal
Business
Process
• Workforce
Value Stream
Process Flow
Process Measures
“Planning the
Healthcare
System”
“Running the
Healthcare
System
Business
Measures
Healthcare Business Academy – Leadership Model1. Leadership and Culture2. Customer / Patient Focus3. Vision and Strategy 4. Innovation and Improvement4a. Information Technology and Management5. Process Management6. Workforce Focus7. Results

Copyright, 2016
Healthcare Leadership Model
FELLOWSHIP PROGRAM
13
Copyright, 2016
Improvement Efforts Should Link
A STRATEGIC PLANNING MODEL
14
UCL
LCL
Avg
Pro
cess
Score
card
Business Unit Scorecard
System Scorecard
Tools &Methodology
Lean Principles and Tools
UCL
LCL
Avg
Y'sX's
Voice of Customer
Strategic
Plan
Business
Objectives
• Patient/
Customer
• Financial
• Internal
Business
Process
• Workforce
Value Stream
Process Flow
Process Measures
“Planning the
Healthcare
System”
“Running the
Healthcare
System
Business
Measures
FellowshipAssessment

Copyright, 2016
Personalized Report to Help Guide Next Steps
ONLINE ASSESSMENT BUILT ON HBA MODEL
15
Online Assessment Personalized Report

Copyright, 2016
In a “Chaotic” Organization
TIME ALLOCATION
16
Source: George Hanson - Empire State Advantage

Copyright, 2016
In a “Conventional ” Organization
TIME ALLOCATION (cont.)
17
Source: George Hanson - Empire State Advantage

Copyright, 2016
In a “World Class” Organization
TIME ALLOCATION (cont.)
18
Source: George Hanson - Empire State Advantage

Copyright, 2016
Promote Performance Improvement
LEAN PRINCIPLES
19
• Specify value in the eyes of the Customer
• Learn to see your processes from the perspective of your customer
• Identify the value stream and eliminate waste/variation
• Look at the combination of processes, not just a single process in
isolation
• Make value flow at the pull of the customer
• Wait until you know what the customer wants before you start
• Involve, align, and empower employees
• Develop solutions using the people who are currently working in the
process
• Continuously improve knowledge in pursuit of perfection
• Constantly challenge the organization to continue removing waste from
processes

Copyright, 2016
The Impact Zones
LEAN PRINCIPLES (cont.)
20
CustomersDefine Value
CultureValues, Leadership,
“The Way We Work”
CapabilityKnowledge, Tools and
Methodology
High
Results

Copyright, 2016
Provides Value to the Customer
VALUE STREAM
21
The VALUE STREAM is the entire set of activities performed to transform
the products and services into what is required by the customer.
The VALUE STREAM
A Primary Focus is TIME
Product and / or Service Flow
Information Flow: Quickly In All Directions
Follow-up CustomersSuppliers ServicePrepareProcure

Copyright, 2016
Types of Activities
VALUE STREAM (cont.)
22
Value Added
Activities
• Activities where
the product or
service is
transformed into
a state required
by the
customer.
• Activities which,
when asked, the
customer is
willing to pay
for.
Non-Value Added
But Required
• Activities
causing no
value to be
created but
which cannot be
eliminated
based on
current state of
technology or
thinking.
Non-Value Added
Activities
• Activities which
consume
resources but
create no value
in the eyes of
the customer.
• Pure Waste.
(VA) (NVA-R) (NVA)

Copyright, 2016
WHERE WASTE (MUDA) EXISTS
23
1. Defects
8. Extra processing
7. Motion
6. Incorrect inventory
5. Transportation
4. Not utilizing employee ideas or
initiative
3. Waiting
2. Over-production
D-O-W-N-T-I-M-E

Copyright, 2016
EIGHT WASTES
24
Type of Waste Description Examples
Defects Processes not performed correctly resulting in defects and/or rework
Surgical cart missing an item; wrong medication; incorrect patient/client information
Over-production Doing more than what is needed by the customer
Unnecessary diagnostic tests; data fields larger than necessary; too many reports; too many meetings
Waiting Waiting for the next event or next work activity to occur
Waiting for equipment; waiting tomove a patient to their room; waiting for approval
Non-productive use of people and ideas
Not utilizing employee talent or ideas “properly”
Burning high-talented workers out; putting people in “wrong” job positions; ignoring sound ideas

Copyright, 2016
EIGHT WASTES (cont.)
25
Type of Waste Description Examples
Transportation Excess movement of materials, equipment, supplies, and patients
Poor ED layout resulting in the patient being moved from room to room; nurse station far from patients
Incorrect Inventory
Excessive inventory or inadequate inventory
Expired supplies; equipment parts obsolete; out-of-stock medications
Motion Unnecessary movement and excessive walking of staff
Technicians walking miles per day due to location in facility; nurses walking miles per day looking for equipment or records
Extra Processing Required work that is not of value
Asking for information on forms that is never used; same information required on multiple forms; collecting data never used

Copyright, 2016
Connection of Processes
VALUE STREAM MAPPING
26
• Helps to visualize the entire system
• Links the flow of activities with the flow of information (how
the system is controlled)
• Points out sources of waste
• Highlights which steps are pacemakers (holding up other
activities)
• Allows selection and coordination of multiple improvement
efforts in the same value stream

Copyright, 2016
Manual Mapping Example
VALUE STREAM MAPPING (cont.)
27

Copyright, 2016
Surgery
VALUE STREAM MAPPING (cont.)
28
Value Stream: Inpatient Surgery
AdmissionPre-Op
CareOR Prep Surgery
Post-OP Recovery
Hospital Stay
Discharge
So . . . What is a Process?

Copyright, 2016
Components of a Process
INPUT-PROCESS-OUTPUT (IPO)
29
OUTPUTS *
(Measures of Performance) Accuracy
Timeliness
Cost Cost
INPUTS
(Sources of Variation)
People
Material
Policies
Equipment
Procedures
Complete a Task
Environment
Perform a Service
Produce a Product
Methods
A blending of
inputs to
achieve the
desired outputs
PROCESS
(Activity)
* = Critical-to-Customer (CTC)
X’s Y’s

Copyright, 2016 30
Input OutputProcess
Admissions
Process
Status of Patient
Patient Info Requirements
Healthcare Insurance
Reason for Admission
Availability
Attending Physician
Bar Coding System
Documentation
Staff Member
Software
Forms
Policies
Timely Patient Admission
Admission Cost per Patient
Patient Satisfied
Bar Code Bracelet
Patient Information Errors
Performance Measures(Quality, Timeliness, Cost)
Q
Q
T
C
Q, T
Value Stream: Inpatient Surgery
AdmissionPre-Op
CareOR Prep Surgery
Post-OP Recovery
Hospital Stay
Discharge

Copyright, 2016
Patient Safety Process
INPUT-PROCESS-OUTPUT (IPO)
31
Patient Safety
Incidents/staff
Incidents/100 patients
Cost / Incident
Patient (Demographics,
health, etc.)
Audit Program
Regulations
Reporting System
Equipment
Staff
Patient Safety
Organization Alignment
Facility
Safety Training
Time Between Incidents
Incidents/department
Safety Report

Copyright, 2016
Food Service Process
INPUT-PROCESS-OUTPUT (IPO)
32
Food
Service
Patient Requirements
Patient Input
Dietician
Physician Instructions
Documentation
Suppliers
Equipment
Food Preparers
Outsourcing
Satisfy Requirements
Delivered Timely
Cost / Meal

Copyright, 2016
OR Preparation Process
INPUT-PROCESS-OUTPUT (IPO)
33
OR
Preparation
Type Procedure
Pick List
Requested Room Layout
Operating Table
Nursing
Surgeon
Operation Schedule
Room Schedule % Deviations from Scheduled
Time (as scheduled/as doctor
needed)
Waste ($)
% Deviations from
Required Equipment and
Instruments
% Deviations from
Required Supplies
% Support Team Not Fully
Functional and Ready
Patient (family)
Equipment Status (availability
and sterilization)
Anesthesiologist
Suppliers
Policies/Regulations
Location/Facility
Pharmacy
Central Supply
Copyright, 2016
Claims Process
INPUT-PROCESS-OUTPUT (IPO)
34
Patient/Satisfaction Rate
Time to process
Cost to process claim
Claims
Claim
Claims Agent
Notification
Regulations
Submitter
Patient
Processed Accurately
Timely “Explanation of
Benefits”
Accurate “Explanation of
Benefits”
% Appealed Claims

Copyright, 2016
Prescription Filling Process
INPUT-PROCESS-OUTPUT (IPO)
35
Prescription
Filling
Patient Rx
Patient Data
Health Allergy and
Medication Questionnaire
Data entry mechanism
Pharmaceutical Care
Principles
Policy
Pharmacists
Location
MedicationPrescription filled accurately
% PC Principles not followed
Medication errors reported
accurately and timely
Prescription filled timely
Order
Entry Customer
Service Pharmacist Medication
Administration
Support
Process

Copyright, 2016
Your Process
INPUT-PROCESS-OUTPUT (IPO)
36
Your
Process
• The class will be divided into teams• Each team will select a process that belongs to one of the team members• Each team will complete the IPO for that process with the “owner” of the
process leading the effort• Team members will ask the “appropriate” questions that will allow
completion of the outputs, measures of performance, and input• One team member will present the IPO to the rest of the class

Copyright, 2016
IPO + Suppliers + Customers
SIPOC
37
• A SIPOC diagram is an extension of a simple IPO diagram
• It includes information about suppliers and customers
• To create a SIPOC diagram:
• Name the process
• Identify the outputs and customers
• Identify the inputs and suppliers
SS II PP OO CC
Suppliers Inputs Process Outputs Customers
Who provides the inputs to your process?
Who receives the outputs
of the process?
Materials, methods, people, etc. required for the process
Any activity that takes inputs and creates outputs
Measurable outcomes of the process
SS II PP OO CC
Suppliers Inputs Process Outputs Customers
Who provides the inputs to your process?
Who receives the outputs
of the process?
Materials, methods, people, etc. required for the process
Any activity that takes inputs and creates outputs
Measurable outcomes of the process

Copyright, 2016
Beginning of Process Improvement
IMPORTANCE OF MEASUREMENTS
38
• To assist good decision making
• To identify/verify problem areas
• To baseline a value stream or process
• To characterize our processes (to know how inputs
and outputs are related)
• To see if our value streams and processes are
improving
• To determine if the patient care and improvement
objectives are being realized

Copyright, 2016
Three Types
IMPORTANCE OF MEASUREMENTS (cont.)
39
1. One-Time Measures
- To answer a question
- To solve a problem
2. Measures that Track Progress Towards
a Desired Outcome
- Customer
- Employee
3. Measures used to Monitor a Process
- Baseline the process
- Determine improvement
- Financial
- Internal Business Process

Copyright, 2016
Examples
IMPORTANCE OF MEASUREMENTS (cont.)
40
• Average time to turnover ward room
• % billing code errors
• % medication errors
• % adverse clinical events (lab errors, needle sticks, surgery
delays, etc.)
• Average time to get a Primary Care appointment
• Patient complaint rate
• Average # of adverse events/ICU day
• % adverse events contributing to death
• % ICU patients with defects on ID band
• % harmful drug-disease interactions in the elderly
• % insurance claims handled incorrectly

Copyright, 2016
Examples
IMPORTANCE OF MEASUREMENTS (cont.)
41
• % CT Scan effectiveness or requiring redo
• % deviations from estimated Length of Stay (LOS)
• % incorrect surgeries
• % complications resulting from hip / knee replacement
• % depression readmission rate
• # hospital-acquired infections / 100 patient admissions
• % services performed not authorized
• # admittance errors / 100 patient admissions
• Avg wait time for first pediatric appointment
• % breast cancer screening false positives

Copyright, 2016
Drives Process Improvement
MEASUREMENT FLOWDOWN
42
Value Stream: Inpatient Surgery
AdmissionPre-Op
CareOR Prep Surgery
Post-OP Recovery
Hospital Stay
Discharge
• % Surgical Site Infections• % Blood Stream Infections• % Pneumonia• % UTIs
Top Level Indicator –Readmission Rate
Domain - Avoidable Adverse Events
Process - Healthcare Associated Infections
Process: Hospital Stay
Hospital
Stay
Physician
Nursing Staff
Pharmacy
Facility
Patient
OMELOS
% Healthcare Associated Infections
Patient Satisfaction
Equipment
Supplies

Copyright, 2016
= Standard Deviation (variation)
10 20 30 50
y (CTC performance measure)
Concave Up
Concave Down
Inflection PointInflection Point
_y ≈ 27
y = Average (mean, balance point)
σ
σ ≈ 37 – 27 = 10
σ ≈ distance from the centerline to the inflection point
THE VOICE OF THE PROCESSTwo Parameters
400
43

Copyright, 2016
Voice of the Process (VOP)
AVERAGE and VARIATION
44
68.27%
95.45%
99.73%
+4σ +5σ +6σ+1σ +2σ +3σ-2σ -1σ-4σ -3σ-6σ -5σ 0
±3σ : Natural Tolerances of the Process
_y ±1σ = ±1(10) = (17-37) 27_y ±2σ = ±2(10) = (7-47) 27_y ±3σ = ±3(10) = (0-57) 27
From example on previous page:_y= 27 σ= 10

Copyright, 2016
Lead Time for Appointments
RUN CHART
45
Patient
# D
ays
Avg = 27.0
Run Charts Highlight Variation

Copyright, 2016
VOC vs VOP
VARIATION IMPACTS PROCESS CAPABILITY
46
The capability of a process is determined by comparing Voice of the Process (VOP) with the Voice of the Customer (VOC).
Lower
Requirement
Upper
Requirement
Determined by
the customer
-6
Determined by
the customer
+5 +6+4+1 +2 +3-2 -1-4 -3-5
WASTE
-6 0
WASTE
+4+5+6+1 +2+3-2 -1-4 -3-6 -5 0
Patients feel the VARIATION!
Reducing VARIATION improves process performance

Copyright, 2016
Yield Rate - Efficiency
QUALITY PERFORMANCE MEASURES
47
Every Time a Defect is Created During a Process (Step), it Takes Additional Cycle Time
to analyze and fix.
* These Non-Value Added Activities Typically Require Additional Floor Space, Capital
Equipment, Material, and People.
Desired End
State
. .
Fix *
LS US
No Defect
Analyze
DefectDefect
Step 1
*
Analyze
Fix
DefectDefect
Step 2
Start
LS US
No Defect
(.80)
(.20) (.10)
(.90)
(.72)
Waste

Copyright, 2016
Four Step Process Example – “Go Northeast”
PROCESS EFFICIENCY and EFFECTIVENESS
48
Step3
Step1
Step2
Step4
1
2
3
4
# of steps
95%50% 60% 70% 80% 90% Yield of each step
Overall Process Yield
6% 24% 66% 81%
49% 90%
For Best Outcomes“Go Northeast”

Copyright, 2016
SYNERGY of LEAN and SIX SIGMA
49
CUSTOMERVALUE STREAM
Future State
Current State
CUSTOMERVALUE
STREAM
Six Sigma: The reduction in variation in remaining critical step
CUSTOMERVALUE STREAM
Future State
(to-be)
Current State
(as-is)
CUSTOMERVALUE
STREAM
Lean: The elimination of non-value added steps
and the reduction of cycle times and
lead times

Copyright, 2016
Systematic Approach to Improvement
LEAN METHODOLOGY
50
MeasureDefine ImproveAnalyze Control
What is important
to the customer:
Project Selection
Team Formation
Establish Goal
How well we are doing:
Collect Data
Construct Process Flow
Validate Measurement System
The process:
Analyze Data
Identify Root Causes
The process
gains:
Ensure Solution
is Sustained
The process performance measures:
Prioritize root causes
Innovate pilot solutions
Validate the improvement

Copyright, 2016
PROCESS FLOW (PF) OR PROCESS MAP
MeasureDefine Analyze ControlImprove
IMPROVEMENT TOOLSReduce Variation, Defects, and Times
STANDARD OPERATING
PROCEDURES (SOP)
How What Who___________
___________
___________
INPUT - PROCESS - OUTPUT
51

Copyright, 2016
Improves Performance
PROCESS FLOW
52
Patient calls
hospital
main number
Is an open
line available?
Patient told to
hold for 1st
available operator
Patient describes
type of care
required
Operator
transfers patient
to appropriate office
OptometryAcute Minor
Illness Clinic
Family
Practice
Emergency
Room
(E.R.)
Appointment
made
Appointment
made
Appointment
made
E.R. personnel
consult patient
No
Yes
Hospital Appointment Process

Copyright, 2016
Improves Performance
INPUT – PROCESS - OUTPUT
53
Medical
Equipment
Install
Customer (Clinic, Lab, etc.)
Requirements
Location
Equipment (Devices)
Budget
Current Lead Time
Policies
Supplier
3rd Party Vendor
Staff
% Exceeding Estimated
Delivery Date
Avg Time to Install (each
type of equipment)
% Exceeding Estimated
Install Time
% Installs Requiring Revisit
Cost/Install (each type of
equipment)

Copyright, 2016
Improve Performance
STANDARD OPERATING PROCEDURES (SOPs)
54
• Define the interaction of people and their environment when
performing a service
• Detail the action and work sequence of the worker
• Provide a routine to achieve consistency within the process
• Specify the best process we currently know and understand for
controlling variation
• Provide a basis for future improvements
• Validate mistake proofing in the process

Copyright, 2016
Improves Efficiency
STANDARD WORK
55
• Method for improving work efficiency by:
• Designing the best method to complete a work task
• Documenting the method
• Training operators, technicians, nurses, etc. to do the same
work task using the same method
• Steps to develop standard work routines:
Step 1: Involve those performing the process to analyze the
work task by breaking it down into work components …
understand the current process
Step 2: Sequence the steps in a logical and efficient order
… use good ergonomic principles of human motion

Copyright, 2016
Improves Efficiency
STANDARD WORK (cont.)
56
• Steps to develop standard work routines (cont.):
Step 3: Capture appropriate times for the completion of the steps
Step 4: Document with procedures, diagrams, and layouts
• Use visual methods such as photographs, Powerpoint, and schematics
whenever possible
• Keep task descriptions clear and simple
• Present the work steps in the sequential order in which they must be
performed
• Develop using a team approach combining the best practices in a safe
and efficient way to complete the task at a sustainable pace

Copyright, 2016
Improves Efficiency
STANDARD WORK (cont.)
57
• Steps to develop standard work routines (cont.):
Step 5: Review the procedures with all who perform the process and
revise as necessary
• Standard Work is not permanent and should be reviewed regularly for
improvement
Step 6: Train those who work the process by demonstration with the
documents as aids
• Follow up with “hands-on” training and a review for competency
Step 7: “Audit” at all levels regularly and ensure standard work is
current

Copyright, 2016
Needed At All Levels
STANDARD WORK (cont.)
58
Copyright, 2016
Benefits
STANDARD WORK (cont.)
59
• Standard Work:
• Predictable quality and predictable cycle time for the task
• Efficiency gains with reduction in variability
• Expands beyond standard operating procedures (SOPs)
• Enhances competencies
• Enhances problem solving
• Strengthens multi-skilling
• Details the interactions between the people (nurses, technicians, etc.)
and the equipment/computers used for the process

Copyright, 2016
Standard Work Template
STANDARD WORK (cont.)
60

Copyright, 2016
Benefits
VISUAL MANAGEMENT
61
• Used to:
• Support Leadership and Management
• Displays work priorities
• Daily process performance
• Enhances communication
• Provide current status/information
• Standardize
• Error Proof
• Prevents process omissions
• Supports correct process step
completion

Copyright, 2016
Benefits
VISUAL MANAGEMENT (cont.)
62
• Promotes:
• Better patient outcomes
• Safety
• Training and standards
• Better job performance
• Good process control (less variation)

Copyright, 2016
From Shop Floor to Office
5S
63
Organize the workplace …5S
1. Sort - Identify what forms, equipment, parts,
etc. are needed (keep) and what is
not (remove)
2. Set in Order - Determine a place for needed
items … identify the storage
place with clear markings
3. Shine - “Clean” the office/room/station and
maintain the equipment
4. Standardize - Work procedures, systems, and
policies
5. Sustain - Review regularly the SOPs, processes,
regulations, etc. and ensure
compliance
Provide documentation so that the work environment is
clearly defined, self-regulating, and self-improving
S
A
F
E
T
Y

Copyright, 2016
Sort
5S
64
GuidelinesHow often is it used? Storage Location
Hourly Within arm’s reach
Every Shift Within a short walk
Daily Further away (but convenient)
Monthly Department storage
Annually Facility storage
Never Get rid of it

Copyright, 2016
Set in Order
5S
65
• Physically reconfigure the area
for optimization
• Mark locations for carts, big
equipment, unit storage, etc.
• Designate location for
paperwork, medications,
materials, and supplies
• Build racks, containers or
shadow boards for frequently
used items
• Place frequently used items
near primary work locations

Copyright, 2016
Shine
5S
66
• Clean floors, walls, tools, and
equipment
• Repair/replace items that could
cause future cleanliness problems
• Repair faulty electrical outlets,
cracks, items with excessive wear,
etc.
• Paint areas if necessary
• Provide proper cleaning tools and
procedures to maintain the
improved condition
• Ensure that proper collection
methods exist for debris and trash

Copyright, 2016
Standardize
5S
67
• Document the process and procedures with
checklists, guidelines, flowcharts, diagrams,
photographs, etc.
• Implement visual management …color
coding, checklists, labeling, etc.
• Ensure that everyone is properly trained on
the current process and standard operating
procedures
• Determine and document responsibility
towards achieving this step
• Communicate the necessity to embrace 5S
and provide any necessary 5S training

Copyright, 2016
Sustain
5S
68
• Develop a 5S audit capability
• Identify roles and responsibilities
• Review regularly the SOPs, processes,
regulations, etc. for currency and
compliance
• Develop a process to ensure
compliance (audit, frequency, etc.)
• Utilize standard written procedures and
check sheets
• Reward and recognize success

Copyright, 2016
List Common Characteristics
WHAT’S HAPPENING HERE?
69
1
2 3
4
5
6

Copyright, 2016
A Powerful Tool for Leaders/Managers
HUDDLE BOARD MEETINGS
70
Attended by:
• Leaders/managers (typically, leads the meeting)
• Team members/staff/process workers (responsibility for leading or
facilitating the huddle can be rotated)
Promotes:
• Efficient use of meeting time (normally limited to 15 minutes)
Provides:
• Current status
• Daily direction
• Strategic alignment
Facilitates:
• Quick and accurate communication
• Performance and process improvement

Copyright, 2016
A Powerful Tool for Leaders/Managers
HUDDLE BOARD MEETINGS
71
Facilitates (cont.):
• Prioritization of effort
• Self-management
• Making adjustments and improvements to daily work practices
Topics discussed:
• Selected by leaders/managers
• Related to organizational strategy and priorities
Candidate topics include:
• Hot issues
• Metrics and goals
• Current plan to meet goals
• Day’s top priorities

Copyright, 2016
A Powerful Tool for Leaders/Managers
HUDDLE BOARD MEETINGS (cont.)
72
Candidate topics include (cont.):
• Problems faced
• Help needed
• Safety issues
• Performance issues
• Potential improvement efforts/events
• Training on updated/new processes
Fosters:
• Recognition
• Communication
• Efficiency
• Culture of unity
• Trust and respect

Copyright, 2016
A Powerful Tool for Leaders/Managers
HUDDLE BOARD MEETINGS (cont.)
73
Success enhanced by:
• Starting on time
• Ending on time
• Holding regularly (even if it’s a busy day)
• Sticking to the agenda or format
• Not turning the huddle into just a “status report”
• Leadership/management direction

Copyright, 2016
Standard Elements
HUDDLE BOARD MEETINGS (cont.)
74
Huddle Board’s standard elements
• Patient or work requirements for the unit
• Improvement ideas for the staff to consider
• Status of the improvement ideas that the unit is working
on including current actions/countermeasures.
• Data for the improvement area
• Alignment to Top Level Indicators
• Space to celebrate
• As the unit determines may be appropriate
Copyright, 2016
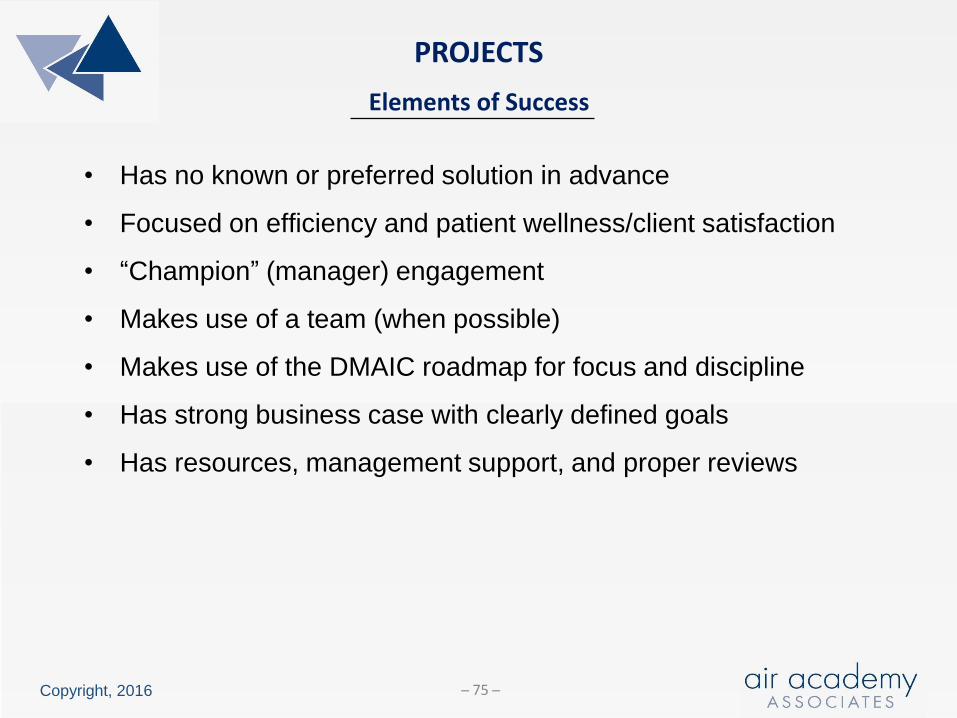
Elements of Success
PROJECTS
75
• Has no known or preferred solution in advance
• Focused on efficiency and patient wellness/client satisfaction
• “Champion” (manager) engagement
• Makes use of a team (when possible)
• Makes use of the DMAIC roadmap for focus and discipline
• Has strong business case with clearly defined goals
• Has resources, management support, and proper reviews

Copyright, 2016
Getting Started …Defining the Project
DMAIC PROJECTS
76
Include:
• A description of the process you are working to improve and a
clear problem statement
• A description of the impact the project will have
• A clear definition of the goals and objectives of the project
• Core team members, their roles, and expected time commitment
• Specific metrics that will be tracked and improved
• Who are the customers and suppliers for the process and what are their critical requirements

Copyright, 2016
VISN 1 Project Charter
DMAIC PROJECTS (cont.)
77
Project description
Problem description
Process and Scope
Impact on Patient and Business
Goals and Measures
Project Team Members
Customers and Suppliers

Copyright, 2016
Keep Projects on Track
PROJECT TOLLGATES
78
MeasureDefine ImproveAnalyze Control
Tollgate Review
Tollgate Review
Tollgate Review
Tollgate Review
Tollgate Review
Managers/supervisors conduct tollgate
reviews for transitioning between DMAIC
phases (see Appendix B)

Copyright, 2016
Kaizen
RAPID PROCESS IMPROVEMENT
79
• Process improvement includes daily continuous improvement,
Rapid Process Improvement (RPI), and multi-month DMAIC
projects
• RPIs engage teams to analyze and improve processes of
varying levels of complexity
• RPIs may benefit from an intensive 3-5 day focused “Kaizen
event” that enables rapid change in a short period of time
• Pre-work and post-work support the event
• Results oriented … quick process improvements
• Outcomes enhanced when supported by leadership and
management … decision making and resource prioritization

Copyright, 2016
Five-Step Process
RAPID PROCESS IMPROVEMENT (cont.)
80
IDENTIFY
OPPORTUNITY1
PRE-WORK
2
PREP AND
DATA REVIEW3
2 –
4 W
eeks
• Complete current state Value Stream Map
• Leadership/management selects opportunities
or problems that need solving
• Confirm “candidate” project supports
organizational goals and is important to
the customer/patient
• Scope the effort (not too small, not too large)
• Select team members (skills, time availability)
• Train the team in basic tools (process
observation, process mapping, waste, etc.)
• Complete a SIPOC
• Complete process flow chart
• Perform a stakeholder analysis
• Review baseline data for identified key metrics
• Establish the “Management Center”
• Gather materials and complete objectives form
and RPI charter

Copyright, 2016
Objectives Form
RAPID PROCESS IMPROVEMENT (cont.)
81
KAIZEN FOCUS Event Dates
GOAL
TEAM MEMBERS
SPONSOR LeanSigma Master
METRIC BASELINE OBJECTIVE EXPECTED ACHIEVED IMPROVEMENT
Team Goals
LEAN BELT

Copyright, 2016
Five-Step Process
RAPID PROCESS IMPROVEMENT EVENT
82
RAPID PROCESS IMPROVEMENT
EVENT
4
Introduce team
Review event
goals; outline; and
baseline
Review roles and
“build” the team
Validate mapping
Complete time
studies
Out brief:
Current state
Plan of action
Monday Analysis:
Process evaluation
Facility evaluation
Time observation
Standard work
Look for waste and variation
Team engages in problem
solving
Generate improvement ideas
and patterns of solutions
and then prioritize
Out brief:
Status of event
Plan of action
Tuesday
Train staff and
support personnel
Generate action list
Create “newspaper”
Final presentation:
Accomplishments
The plan
Communicate
Celebrate
Implement the
changes
Run new process
Refine and
standardize
Summarize
changes made
Out brief:
Preliminary
results
Review potential
solutions
Select solution
trial runs
Develop
implementation
plan
Out brief:
Solution buy-in
Begin
implementation
Wednesday Thursday Friday
FOLLOW-ON
ACTIONS5
3-5 Days
1-3 Months
•Complete all open actions
•Verify results
•Validate and standardize new process flow
•Develop a plan for sustainability and create SOPs
•Capture lessons learned

Copyright, 2016
A Normal Distribution
READINESS FOR CHANGE
83
CAVE People:Nothing in the world will empower
these. Seal off the cave so none
of the 80% drift in.
CAVE People
Pioneers:Training alone can
empower these.
.10
.80
Settlers:Training alone will not empower these.
.10
To move an organization forward, management must
act on these, setting/declaring expectations and
aligning the rewards and recognition strategy with
accountability and expectations.

Copyright, 2016
Key Ingredients
SUCCESSFUL CHANGE
84
DD + VF + FS > R *
DD =
VF =
FS =
R = Resistance to Change
Degree of Dissatisfaction (Need)
Vision for the Future (Vision)
First Step (Plan)
* Change Model used with permission from Kelly and Frank Petrock.

Copyright, 2016
What Leaders Do
LEADER STANDARD WORK
85
1. Leaders relentlessly upgrade their team, using every encounter as an opportunity to observe capability, coach, and build confidence.
2. Leaders make sure people not only see the vision, they live and breathe it.
3. Leaders exude positive energy and optimism.
4. Leaders establish trust with candor, transparency, and credit.
5. Leaders have the courage to make unpopular decisions and “gut” calls.
6. Leaders probe and push with a curiosity that promotes action.
7. Leaders inspire risk taking and learning by setting the example.
8. Leaders determine how to “operationalize” quality/improvement.
9. Leaders create a “can-do” attitude and an atmosphere of recognition.
Reference: The book “Winning” by Jack Welch

Copyright, 2016
Organizational Deployment
ROADMAP
86
• What is the need for Lean?
• What is the vision for the future?• Short-term (1 year)• Long-term (1-3 year)
• What is the plan to achieve the vision?• Review Time Allocation Chart
• How can our Lean deployment/efforts fail?
• VSM• Process Flow• Measurements• Standard Work• Visual Mgmt• 5S• Huddle Mtgs• Projects

Copyright, 2016
Lean Transforms
IMPROVEMENT REQUIRES BEHAVORIAL CHANGE
87
• Lean Challenges Us To:
• Think Differently
• Work Differently
• Ask Questions and Challenge the Status Quo
• Make Decisions With Facts and Data
• Use New Principles, Tools and Methodologies
When Culture and Need for Change Compete …
Real Leaders and Managers are Needed

Copyright, 2016
Thank You – For More Information, Please Contact:
Air Academy Associates, LLC
1650 Telstar Drive, Suite 110
Colorado Springs, CO 80920 USA
Call: (800) 748-1277 or (719) 531-0777
Facsimile: (719) 531-0778
Email: [email protected]
Website: www.airacad.com
88
www.airacad.com
16-LSSHealth

Copyright, 2016
APPENDIX A
Process Improvement Questions
89

Copyright, 2016
PROCESS IMPROVEMENT QUESTIONSQuestions Leaders/Managers Need to Answer
1) How important are waste and quality issues to your healthcare organization? Which ones are a priority and why are they so important?
2) Do you thoroughly understand your organization’s current level of quality and performance? What are your patient/customer concerns? Are current improvement efforts addressing them? How do you know?
3) What are your products and services and who are your customers? How do you know the value created for each customer? How do you solicit feedback from your customers? What do you do with the feedback?
4) What factors drive the quality and cost of patient procedures and services and of the supporting processes and infrastructure? How do you know?
5) How can improvement efforts assist you in providing better care and reducing costs? Have you explored opportunities?
90

Copyright, 2016
PROCESS IMPROVEMENT QUESTIONS (cont.)Questions Leaders/Managers Need to Answer
6) Within your organization are you actively pursuing process improvement that links to patient care? How? Does this include a balance of both breakthrough, as well as continuous improvements? Do you have standard procedures for documenting the improvement efforts and results?
7) What portion of your time is devoted to improving patient care, removing waste and reducing cost? Is this time reactive (firefighting) or proactive?
8) How often do you solicit feedback from the people in your healthcare organization? What kind of feedback do you solicit? What do you do with the feedback?
9) What kind of improvement-oriented or knowledge-generating questions do you ask the people who work for/with you? What methods or tools can be used to answer them?
91

Copyright, 2016
PROCESS IMPROVEMENT QUESTIONS (cont.)Questions Leaders/Managers Need to Answer
10) Have you implemented an improvement strategy with structured methodology, toolset and support infrastructure to predictably provide better care and reduce cost?
11) How do you assure that your workforce is properly trained to successfully use the latest and best improvement methodologies and tools? Do you understand your Return on Investment (ROI) from training? Are improvement successes documented and communicated?
12) What barriers do the people in your organization face when trying to provide better care and reduced cost? How are you removing these barriers?
13) What performance measures are you using to evaluate your progress in providing better care and reducing cost? How are you held accountable for these? How do you hold the people in your organization accountable?
92

Copyright, 2016
PROCESS IMPROVEMENT QUESTIONSQuestions Leaders/Managers Need to Answer
14) How much waste does your healthcare organization have? Do you understand the total “Cost of Waste” or “Cost of Poor Quality/Patient Outcomes”? Is it improving, staying the same or getting worse?
15) Do you have a plan for your healthcare organization that will, one year from now, show evidence that you made a difference? What do you predict that evidence will show?
93

Copyright, 2016
APPENDIX B
Project Tollgates
94

Copyright, 2016
TOLLGATEDefine Phase
Has the process to improve been selected?
Are the customers identified? What are their requirements?
Are the team members identified?
What is the problem statement – detailing the problem (what),
(when) was the problem first seen, (where) was it seen, and what is
the magnitude or extent of the problem?
Do the project goals pass the “S.M.A.R.T.” (Specific, Measurable,
Achievable, Relevant, Timely) Test?
Is the primary project measure identified (Quality, time, efficiency
cost)? Is there a secondary measure?
95

Copyright, 2016
TOLLGATEDefine Phase (cont.)
Is the project properly scoped? Have constraints and key
assumptions been identified?
Have key stakeholders been identified? What are the main
concerns? How will they be involved in the project?
What kind of barriers/obstacles will need assistance to be removed?
Have potential risks been identified and a risk mitigation plan
developed?
Is the project documented?
96

Copyright, 2016
TOLLGATEMeasure Phase
Is the value stream mapped (VSM)?
Is the current “as-is” process mapped and understood (PF)?
Have measures been clearly defined?
Is there a data-collection plan? Has the team identified the specific
input (x), process (x), and output (y) measures needed to be
collected.
Are all CTCs clearly defined and understood?
Has a Supplier-Input-Process-Output-Customer (SIPOC) diagram
been created?
Has the team developed and tested data collection forms or check
sheets that are easy to use and provide consistent and complete
data gathering?
97

Copyright, 2016
TOLLGATEMeasure Phase (cont.)
Has the current process capability been assessed?
How large is the gap between current performance and the
customer (or project) requirements?
Have opportunities to conduct Rapid Improvement Event projects
been identified to accelerate momentum and results?
Have any new risks to project success been identified, added to the
Risk Mitigation Plan, and a mitigation strategy put in place?
Has project documentation been updated?
98

Copyright, 2016
TOLLGATEAnalyze Phase
Was the current PF reviewed to identify waste, non-value activity,
bottlenecks, sequencing problems, and sources of variation?
Has the team analyzed the data relating to the process and its
performance to help stratify the problem, understand reasons for
variation in the process, and generate hypothesis as to the root causes
of the current gap?
Was data used to determine the focus?
Were all potential causes of the problem considered?
Has root-cause been determined versus homing-in on a symptom
Does the team understand why the problem (Quality, time, or cost
efficiency issue) exists?
Has project documentation been updated?
99

Copyright, 2016
TOLLGATEImprove Phase
What alternative solutions were explored? What techniques and tools
were used to generate ideas for potential solutions?
How did the team decide upon the best solution? What evaluation
criteria were used to select a recommended solution?
Do the proposed solutions address all of the identified root causes, or at
least the most critical?
Was the solution piloted, tested, and evaluated to confirm improvement
in primary measures (CTCs)?
How was the improvement measured (tools used)?
Has the team considered potential problems and unintended
consequences if the solution is implemented?
100

Copyright, 2016
TOLLGATEImprove Phase (cont.)
Does the improved process have a new process map and new SOPs and
is it mistake-proofed?
Has an implementation plan been developed?
What physical changes were made?
Has project documentation been updated?
Have changes been communicated to all the appropriate
people/functions?
101

Copyright, 2016
TOLLGATEControl Phase
Has all essential documentation for the improved process been
prepared … new Process flow/map, new SOPs, a training plan, and a
control plan?
Has the necessary training for process owners/staffers been
performed?
Is there a plan in place to sustain the gain and ensure long-term
accountability?
Has the solution been effectively implemented?
What types of control have been implemented (visual, electronic, etc.)?
What was put in place to manage the work flow?
Has project documentation been updated?
102

Copyright, 2016
TOLLGATEControl Phase (cont.)
Have lessons learned and results been communicated?
Is the customer satisfied with the improved process? What proof do
you have?
Have the hard work of the team and its successful efforts been
celebrated?
103

Copyright, 2016
COURSE EVALUATION SHEET
WORKSHOP NAME: Lean Healthcare Concepts for PI DATE: ________________________
NAME: ________________________________ JOB TITLE: _____________________
1. What did you like most about this course?
2. What did you like least about this course?
3. Please rate the following areas:
4. Do you have suggestions that would make the course more effective?
5. To whom would you recommend this workshop? (Please include name, address, and phone number.
We will notify these people of future offerings.)
6. Any other comments:
POOR EXCELLENT
A. COURSE OBJECTIVES 1 2 3 4 5
B. INSTRUCTOR 1 2 3 4 5
C. INTERACTION AND DISCUSSION 1 2 3 4 5
D. TOPICS COVERED 1 2 3 4 5
E. PARTICIPANT'S GUIDE 1 2 3 4 5
F. GROUP EXERCISES 1 2 3 4 5
G. MEETING ROOM ACCOMMODATIONS 1 2 3 4 5
1 2 3 4 5
TOO LONG OK TOO SHORT
I. OVERALL COURSE RATING 1 2 3 4 5
H. WORKSHOP DURATION
104