lean production: introduction and implementation …
TRANSCRIPT
LEAN PRODUCTION: INTRODUCTION
AND IMPLEMENTATION BARRIERS
WITH SMEs IN SWEDEN
Pedram Mirzaei
THESIS WORK 2011
PRODUCTION SYSTEMS
Postal Address: Visiting Address: Telephone:
Box 1026 Gjuterigatan 5 036-10 10 00
551 11 Jönköping
LEAN PRODUCTION: INTRODUCTION
AND IMPLEMENTATION BARRIERS
WITH SMEs IN SWEDEN
Pedram Mirzaei
This thesis work is performed at the School of Engineering in Jönköping within
the subject area of Production Systems. The work is part of the Master Level
Education. The author is responsible for the given opinions, conclusions and
results.
Examiner: Glenn Johansson
Supervisor: Mikael Thulin
Credit points: 30 points
Date: 17-02-2011
Archive number:
Abstract
This research is a cross sectional study which is conducted as an email survey. Accordingly, 22 companies have been surveyed to investigate the tendency and barriers for SMEs in Sweden regarding implementation of lean production. For that, barriers are categorized into two categories. The first category includes the ones which prevent SMEs from starting lean production (introduction barriers). The second category encompasses the ones which SMEs face while they are implementing lean production (implementation barriers).
Moreover, to obtain a better view about problematic areas in lean transformation for SMEs, improvements and achievements of the investigated companies in their lean implementation processes have been assessed. However, it was not a detailed or in depth analysis, since the main purpose of this research was not to assess SMEs progress, rather it was to identify the hindrances in SMEs‟ path to become lean.
The results from this survey showed that most of the lean principles are applicable in SMEs. However, SMEs have problem with lack of time, management support, finance, resistance to change, change process, and training. In addition lack of skilled employees for implementation of lean production was found as the biggest introduction barrier for SMEs. Moreover, the result of this research shows that small companies do not show tendency to implement lean production.
Key Words
Lean implementation, lean transformation, SMEs, change process, barriers, lean production, and tendency to lean production.
Table of Contents
Table of Contents
1 Introduction ............................................................................. 1
1.1 BACKGROUND ............................................................................................................................. 1 1.2 PURPOSE AND AIMS ..................................................................................................................... 1 1.3 DELIMITS .................................................................................................................................... 2 1.4 OUTLINE ..................................................................................................................................... 2
2 Theoretical background .......................................................... 5
2.1 EMERGING OF LEAN PRODUCTION .............................................................................................. 5 2.2 LEAN PRODUCTION ..................................................................................................................... 5
2.2.1 Lean principles ................................................................................................................. 7 2.2.2 Advantages of Lean production ...................................................................................... 11 2.2.3 Implementation of Lean productions .............................................................................. 12 2.2.4 Lean Production and SMEs ............................................................................................ 14
3 Methodology ........................................................................... 17
3.1 LITERATURE REVIEW ................................................................................................................ 17 3.2 SURVEY .................................................................................................................................... 17
3.2.1 Target companies ........................................................................................................... 18 3.2.2 Design ............................................................................................................................. 19 3.2.3 Translation...................................................................................................................... 21 3.2.4 Test ................................................................................................................................. 21 3.2.5 Sending process .............................................................................................................. 21
3.3 DATA ANALYSIS ........................................................................................................................ 22
4 Results ..................................................................................... 23
5 Analysis ................................................................................... 33
5.1 SIZE AND LEAN IMPLEMENTATION ............................................................................................ 33 5.2 LEAN IMPLEMENTATION IN SMES ............................................................................................. 34 5.3 IMPLEMENTATION BARRIERS WITH SMES ................................................................................. 36 5.4 INTRODUCTION BARRIERS WITH SMES ..................................................................................... 37 5.5 CORRELATION ANALYSIS .......................................................................................................... 38
6 Discussions and conclusions .................................................. 41
6.1 DISCUSSION OF METHOD ........................................................................................................... 41 6.1.1 Validity of research ............................................................................................................ 41 6.1.2 Reliability of research ..................................................................................................... 42 6.1.3 Findings .......................................................................................................................... 42
6.2 CONCLUSION ............................................................................................................................. 42 6.3 FURTHER RESEARCH ................................................................................................................. 43
7 References .............................................................................. 45
8 Appendices ............................................................................. 51

Table of Contents
Introduction
1
1 Introduction
The global market has dramatically changed during the past years. Consequently, products with low quality, long lead time, and limited variety are no longer acceptable among customers. Customers‟ demands are increasing by time and traditional production systems cannot meet this new level of demand. Hence, applying new production methods in order to produce high quality product, in short time, with low price becomes essential for survival in current competitive global market.
Lean production is one of the approaches which has been used by many companies around the world to achieve these competitive advantages. However, lean production was developed by large companies and based on their characteristics. Large companies are not the only important enterprises and Small and Medium sized Enterprises (SMEs) have a large share in the world economy: for example 55.5% of all the added value in Europe comes from SMEs (European Commission, 2005). Therefore, it is important to find out; whether or not SMEs can also enjoy the advantages caused by applying lean production. Since lean production is not tailored for SMEs and their characteristics, these companies may face some difficulties with implementation of it in their organizations. This report is part of a final master thesis work for assessing the Swedish SMEs‟ tendency to applying lean production, as well as the their problems concerning transformation to lean production.
1.1 Background
Lean production has been created by large companies and used by them to increase production productivity and performance since the beginning of the 1990s. Since then, many companies around the globe, mostly large ones, have been enjoying advantages resulted by implementation of lean production in their organizations. However, despite the possible competitive advantages caused by lean production, SMEs have not implemented lean as extensive as large companies. Few researchers have been investigating implementation of lean in SMEs and tried to realize whether lean production suits this specific type of company. The results from Womack et al. (1990) showed that lean production is applicable in every organization. Some of the studies revealed that there are some hindrances to implementation of lean by SMEs. In addition, some other studies showed that some of the contextual factors such as culture, country of origin, and employees‟ contract can also affect lean implementation.
1.2 Purpose and aims
According to Womack et al. (1990), lean production is applicable in all companies despite their size. However, does really SMEs have the same tendency to apply lean as the large companies have?
This master thesis investigates the tendency to lean implementation among Swedish SMEs. Moreover, the problems which SMEs encounter regarding implementation of lean production in their organizations are assessed.
Introduction
2
The main purpose of this master thesis is to identify the barriers which hinder Swedish SMEs from applying lean production. Respectively, based on whether the companies have implemented lean or not, barriers fall into two categories. The first category concerns the companies which have not implemented lean production. The barriers in this category are the ones which prevent companies from implementing lean in their organizations. Therefore, investigation of this group, can ultimately lead to finding out the reasons for lack of tendency to implement lean production among SMEs.
The second category concerns the companies which have already started the lean implementation in their organizations. This group encompasses the barriers which hinders companies during their transformation to lean. Identifying these barriers for SMEs can clarify the SMEs‟ problems with lean production implementation. Moreover, it is the first step for helping SMEs to enjoy consequent advantages of lean by removing those barriers.
Therefore, the research question for this thesis can be defined as follow:
Evaluate the SMEs‟ tendency to implement lean production
Identify the barriers which prevent companies from implementing lean production (introduction barriers)
Identifying the barriers which companies encounter during their lean implementation process (implementation barriers)
1.3 Delimits
The major limitation in this work was that some of the lean indicators for assessing lean implementation progress in surveyed companies had to be eliminated or at least combined together as a more general indicator. Two reasons can be identified for this. The first was the limitation in number of questions in the questionnaires, and the second was inappropriateness of survey method for evaluation of some indicators. However, since the main purpose of the research was not to assess lean implementation progress in SMEs, it was not affect validity of the work that much.
Moreover, scope and time of this thesis work, which corresponds to a single person master thesis, put further constraints on the purpose of the work.
1.4 Outline
The first chapter of the report starts with a brief introduction and background to
the thesis project. The thesis problem is tried to be formulated as well. Then
purpose of the thesis work is clarified. The chapter ends with the delimits.
The second chapter provides a theoretical background about to the work. This
chapter starts with a short historical background about lean production and is
continued by lean philosophy and its principles. Then theory regarding lean
implementation is presented. Further in this chapter, previous studies and their
results concerning lean implementation in SMEs and related barriers are
presented.
Introduction
3
Chapter 3, of this report explains the methodology for the work.
Chapter 4 contains obtained results from the survey.
Chapter 5 presents analysis of the achieved results in chapter 4.
Chapter 6 comprises discussion about the findings of the research and ends
with the conclusion.

Theoretical background
4
Theoretical background
5
2 Theoretical background
2.1 Emerging of Lean production
No new idea emerges unless all the conventional ideas and solutions are no longer useful. This was mentioned by Womack et al. (1990); who introduced “Lean production” as a western version of Toyota Production System (TPS), regarding realization of Toyota production system. TPS, by itself, arose while there was a need for industrial development in Japan, while due to specific economic conditions (down time) in Japan at that time, conventional methods did not work. Therefore, in the spring of 1950 Eiji Toyoda, top man of Toyota at that time, traveled to USA to conduct the second Toyoda family‟s visit of cast Rouge, which was known as the largest and most efficient factory of the world at that time. As a result of this visit and his discussion with Taiichi Ohno, genius production engineer of the Toyota at that time, Eiji concluded that they cannot exactly copy the Ford production system (mass production), yet there are some possibilities for improvements and establishing a tailor made production system. This later led to Toyota Production System (TPS), which later on the western version of it was introduced as Lean production (Womack et al., 1990).
2.2 Lean production
Waste
Lewis (2000, p.962) described Lean production as follows:
“Lean production is a reduced level of input resources in the system for a given level of output. This is achieved by removing waste (muda) from the system. This is primarily waste in the form of resources (raw material, WIP etc) that are transformed in manufacturing but also includes transforming resources such as people, process technology, facilities etc.”
As can be seen from the explanation above, elimination of waste is the main goal of lean production. The point is what is exactly considered as waste (muda) in this definition?
Womack and Jones (2003, p.15) provided a clear definition of waste: “any human activity which absorbs resources but create no value”. Accordingly seven groups of activities were identified by Womack and Jones (2003, p.352) as waste (muda):
1. “Overproduction
2. Waiting (for the next process step)
3. Transport (unnecessary movement of materials)
4. Over Processing (rework and reprocessing)
5. Inventory (excess inventory not directly required for current orders)
6. Movements(unnecessary movements by employees during course of their work)
Theoretical background
6
7. Defects”
As mentioned before the main purpose of lean production is to eliminate these waste (muda). Waste (muda) is categorized in two types concerning their avoidance possibility. The first type encompasses the activities which produce no value however it is impossible to eliminate them by means of current available technologies and production resources. The second type includes activities which create no value and can be eliminated from the system right away (Womack and Jones, 2003).
To eliminate waste in Lean production, the first step is to identify the value. When value is defined, the next step is to choose a proper sequence of value creating actions to form a flow without any interruption. Each action should be initiated exactly when it is required by its following action and ultimately by customer. Moreover, all these actions should be performed by as minimum amount of resources (material, equipment, time, space and people) as possible (Womack and Jones 2003). This process of waste elimination and creation of flow in lean production will be explained in more details further in this chapter.
Value
As mentioned the starting point for lean production and lean thinking model is to identify the value. Value can only be defined by the final customer. In this sense, value can be seen as a product; a good, a service or both, which meets the customer demands at a specific time with a specific price. Hence it should be defined particularly through a constant communication with ultimate customer (Womack and Jones 2003).
Once the value is defined, it is time to identify the value stream. Value stream includes all the steps needed to take to bring a product (a good, a service or a combination of both) to realization. This includes all the activities which are done to transform row materials to a product. In any business this process involves three main groups of tasks. One group consists of the problem solving tasks which include all the steps from concept to detail design of the product up to the production launch. Secondly are the physical transformation tasks which encompass all activities needed to transform raw materials to finished product. Thirdly are the information management tasks which consist of all scheduling and organizing activities needed to deliver a taken order. These groups together include all the tasks from taking order to delivery including organizing the transformation and problems solving tasks. Identifying value stream is one of the critical steps in lean production which usually is neglected by most of the companies and actually is the place that always large amount of waste (muda) can be found. Mapping the entire value stream enables companies to identify these waste and eliminate the ones which are possible to eliminate (Womack and Jones 2003).
One point concerning value stream is that the company should have a holistic view to its value stream. This means that entire activities involved in producing a specific product, even the ones beyond the firm border, should be considered when value stream is to be defined (Womack and Jones 2003).
Theoretical background
7
Flow
Once value is defined and the value stream is mapped for a specific product, lean enterprises can identify value adding steps and remove the wasteful ones. Then, the challenge for the next step in lean production transformation is how to put the remaining value adding activities together to get the most out of it (Womack and Jones, 2003).
The conventional approach which usually can be seen in mass production is to arrange all the production steps in functions and departments. It means that activities are grouped according to their type and performed in batches. In this approach people and equipments in each group are working at their maximum speed all the time to produce batches that are used by other departments and steps. However, since products stay in the batches for long time large amount of waste, such as waste of time, over production, and hiding possible errors exist in this approach (Womack and Jones 2003).
Lean production presents another approach for placing value adding steps together. It is proved that higher efficiency can be achieved by creating continuous flow of value adding steps along the value stream rather than departmental arrangement with batches (Womack and Jones 2003).
In lean production this happens by creating the lean enterprise for each product as well as reconsidering of conventional firms, functions, and careers according to lean strategies. This enables firms to redesigning functions and departments within the firms in a way to be effective in value creation and also meet the employees‟ need to make them more enthusiasm in creating value (Womack and Jones 2003).
Pull
According to Womack and Jones (2003) the next step for becoming lean is to pull material. Pulling means that no production, of any product, should be initiated unless there is a demand for it by a customer. Therefore, in an ideal situation every product‟s production is started exactly at the time that a customer asks for it. Moreover, this pulling of material should be implemented through the whole value stream and between each step of it which means that there should be no batches in the system.
2.2.1 Lean principles
In this section principles and practices in lean production which have been mentioned in the lean production literature are discussed. It should be mentioned that these principles were used as cornerstones to assess the leanness of the surveyed factories in the survey. These principles are listed in Table 3 as well.
The elimination of waste
As mentioned before, elimination of waste is the main goal of lean production. Waste and non-value adding activities can be identified through definition of the value stream for each product. Since non-value adding actions are indicated they should be eliminated.
One of the main sources of waste is inventory. The critical issue, which has to be addressed first, concerning inventory reduction, is to remove the causes for
Theoretical background
8
holding inventor (Karlsson and Åhlström, 1996). In the literature many approaches have been suggested for this. One of them is to reduce the machines‟ down times and breakdowns by implementing preventive maintenance (Suzuki1, 1995; Karlsson and Åhlström, 1996). The second way that can lead to inventory reduction is to decrease the lot size and the number of parts that are waiting in buffers between the different steps of a value stream (Karlsson and Åhlström, 1996; Sanchez and Perez, 2001). The third approach is to reduce the setup times to decrease the waiting time (Shingo2, 1990 A3; Karlsson and Åhlström, 1996). The last technique, mentioned here, is to increase the number of common parts shared between different products which can lead to a reduction of inventory and lead time (Shen3 and Wacker, 1997).
Another major source of waste, mentioned before, is transportation of part and people which is not adding any value. The solution for this can be changing of the layout in a way that, parts and people do not have to move when it is not necessary. For example, investing on proper material handling system can be a solution for this (Dominguez4, 1995).
Continuous improvement
One of the important features of lean production is continuous improvement (Womack et al., 1990). According to Karlsson and Åhlström, (1996a); and Sanchez and Perez, (2001), involvement of all employees and strong management support are essential for continuous improvement. Involvement of employees is achievable through techniques such as quality circles. Quality circles are the activities in which employees gather in groups and discuss about existing problems and possible solution and improvements.
Moreover, transferring more responsibilities; such as responsibility for quality checking, to operators and providing them with a possibility to stop the line in case of defective part are essential for continuous improvement (Sanchez and Perez, 2001).
Enabling employees to think proactively also helps to achieve continuous development (Womack et al., 1990).
Zero defects
One of the other essential features of having a lean production system is reaching quality and zero defects (Monden5, 1983). Having error free parts from the very beginning of the value stream is a critical requirement for achieving high productivity (Hayes and Clark6, 1986).
1 In Sanchez and Perez (2001)
2 In Sanchez and Perez (2001)
3 In Sanchez and Perez (2001)
4 In Sanchez and Perez (2001)
5 In Karlsson and Åhlström (1996a)
6 In Karlsson and Åhlström (1996a)
Theoretical background
9
In lean production instead of controlling parts to detect the defects, focus should be more on controlling the process to find the errors that can cause the defective parts and consequently prevent the defects from happening (Oakland7, J.S., 1993).
Another issue concerning quality and zero defects is that the task of finding defective parts is the responsibility of everyone and not only the quality control personnel. Respectively, identifying and fixing the errors is a responsibility of all workers (or actually the one who causes the error). This means that in lean production less quality control people are needed (Karlsson and Åhlström, 1996a).
Just-in-time delivery
One of the main practices in lean production is just-in-time (JIT). Just-in-time means that each step of value stream should be provided with the right part at the right quantity just when it is needed. The ideal situation here is to provide only one part exactly at the time it is needed for each step (Shingo8, 1981).
To achieve just-in-time some critical changes need to be made. Just-in-time is tightly depended on the zero defect practices. Reduction of lead time is also necessary (Karlsson and Åhlström, 1996). In addition, reduction of setup time is one of the factors which is essential for implementing just-in-time (Karlsson and Åhlström, 1996 a; Gilmore and Smith9, 1996). Decrease of lot size between steps is another perquisite for just-in-time (Karlsson and Åhlström, 1996; Sanchez and Perez, 2001).
Pull of material
One of the important issues in lean production, which actually is in a close relation with just-in-time, is how material flow (Karlsson and Åhlström, 1996a)
In a pull based supply chain, production and distribution are based on real customer demand rather than forecasted demand (build to order). This can cause a decrease in the lead time and inventory levels. However, a pull system is difficult to implement when lead time is long. In addition, applying pull system makes it difficult to take advantages of economics of scale. Hence, the combination of push and pull (push-pull system) can be used instead. This means that some stages of the supply chain remain push-based while the rest are pull-based (Simchi-Levi et al., 2008).
Almost all supply chains are push-pull systems. It means that the amount of raw materials that should be held in inventory is defined through forecasting; while the final assembly is triggered by real customer demand. The point in which push and pull system meet each other, is known as the push-pull boundary which usually is at the beginning of the final assembly line (Harrison et al., 2003). The purpose of lean production is to move this push-pull boundary as closer as possible to the start of the material flow (Karlsson and Åhlström, 1996).
Multifunctional teams
7 In Sanchez and Perez (2001)
8 In Karlsson and Åhlström (1996a)
9 In Sanchez and Perez (2001)

Theoretical background
10
Having multifunctional teams is one of the essentials of lean organization. A multifunctional team is a group of employees, with capability of doing different tasks, working together. In lean production the responsibility for a part of the production process is delegated to each team (production cell) (Karlsson and Åhlström, 1996; Isa and Tsuru, 2002). It means that each team is responsible for variety of tasks which demands multi-skilled workers to perform them. Since the workers are multi skill, tasks can be rotated between them and higher flexibility in production can be achieved (Karlsson and Åhlström, 1996; Isa and Tsuru, 2002). According to Forza10 (1996), in lean companies workers are able to perform different tasks and more problems are solved by teams comprised of these multi-skilled workers.
However, having employees with ability to perform different tasks, demands sufficient training to provide them with the skills that they need (Sanchez and Perez, 2001; Womack et al. 1990; Karlsson and Åhlström, 1996). As Womack et al. (1990) argue, pushing more responsibility on workers can increase their stress at work. However, if employees are provided with sufficient skills which they need to control their jobs, by proper training, this stress can change into creative tension and a positive challenge for the workers. Moreover, there is always a resistance from employees against increasing the number of tasks they have to perform. Training can also reduce this resistance (Sanchez and Perez, 2001).
From all this, it can be concluded that training is really a critical issue in lean production implementation, especially for handling resistance to change which is coherent in any improvement activity.
Decentralization and integrated functions
One of the key features in lean organization is to transfer as much responsibility as possible to workers who are actually adding value (Womack et al., 1990). In addition, more functions should be integrated in teams and more responsibilities should be delegated to multifunctional teams as well as some of the supervisory tasks. As a consequence, the levels of hierarchy in an organization can be reduced (Karlsson and Åhlström, 1996). This is known as decentralization.
As mentioned in the multifunctional teams section, to be able to transfer more responsibilities down to teams, proper training is essential.
Vertical information systems
To perform according to the companies objectives, the teams should be provided with proper information at the right time. This means that information should be shared timely through the organization (Karlsson and Åhlström, 1996a).
According to Karlsson and Åhlström, (1996a), information can be distinguished by content into two types:
Strategic type: this type concerns the overall performance and objectives of the company
10
In Sanchez and Perez (2001)
Theoretical background
11
Operational type: information in this type is about performance of the company such as quality, productivity, and lead time.
Both of these two types should be communicated through the organization.
Vertical information allows a company to provide decision makers (here are workers) with direct essential information at the right time. This information system makes the quick feedbacks and proper corrective actions possible (Åhlström,, 1998).
Supplier integration
Suppliers have an important role in product development. According to Dyer11 (1994), increase in information sharing, cooperation, and face to face contact between the engineers of a manufacturer and its suppliers can lead to decrease in the number of defects as well as reduction in product development time. Moreover, shorter lead time enhances competitive advantages and increases the market share (Sanchez and Perez, 2001). In addition, if suppliers are not involved in the design process then they will produce the parts that they did not design. This means they will encounter more problems which are needed to be anticipated by the manufacturer during the design of the parts. Hence, supplier involvement in the design process will eliminate the need for allocating resources and time from the manufacturer to anticipate and solve the problems that suppliers may face later in production (Sanchez and Perez, 2001).
Another issue concerning integration of suppliers is a reduction in number of suppliers with longer contracts instead. This demands closer relationship based on trust rather than price between the manufacturer and its suppliers (Womack and Jones, 1990). Longer contracts give suppliers time and motivation for improvements such as higher quality, reduction in lot size, and Just-In-Time delivery (Dyer12, 1996).
2.2.2 Advantages of Lean production
"To not implement lean bundles is likely to put plants at a performance disadvantages compared to plants that do implement, regardless of size, age or level of unionization of the plant in question." (Shah and Ward, 2003, p. 146)
There are also some other literature argued that all companies regardless of their size can enjoy performance advantages achieved by implementation of lean production ( Womack et al., 1990; White et al., 1999).
Cusumano, (1994) categorized advantages that can be gain by lean production in to production related product development related advantages.
Concerning production, higher productivity, quality, and flexibility as well as reduction in costs can be achieved by implementation of lean production (Womack et al., 1990; Sriparavastu, and Gupa 131997; Cusumano, 1994).
11
In Sanchez and Perez (2001) 12
In Sanchez and Perez (2001) 13
In Sanchez and Perez (2001)
Theoretical background
12
Concerning product development, applying cross functional approach, which involves teams with people from different functions and department, as well as heavy weight management to manage product development process, leads to shorter product development time and ultimately shorter lead time (Womack et al., 1990; Cusumano, 1994).
Consequently, lean production increase competitiveness of company (Sanchez and Perez, 2001).
2.2.3 Implementation of Lean productions
As Womack et al. (1990, p. 7) mentioned: “…the principles of lean production can be applied equally in every industry across the globe and that the conversion to lean production will have a profound effect on human society…”
It means that it is possible to implement lean production in all kind of companies. However there are many arguments about how to successfully implement lean. In following some of them are presented.
The first important point regarding implementation of lean principles is that lean production cannot simply be added to the existing organization and work properly. There is a need for change in structure, habits, performance evaluation system and in
total change in the organization, to be able to adapt to lean. (Safayeni et al., 1991)
According to (Shah and Ward, 2003) there are some issues concerning lean implementation in various companies. Contextual factors such as employees‟ contracts, company‟s age and size are some of them which size factor has a substantial affect.
Another issue concerning lean production implementation is whether lean principles should be implemented in parallel or in sequence? This becomes more critical when it comes to allocation of management efforts and resources to lean implementation, since they usually are limited in an organization (Åhlström, 1998).
Åhlström (1998) concluded that there are sequences for implementing lean production principles, and there are some principles that are needed to be implemented simultaneously and in parallel.
According to Hayes et al.14,(1988) since there are close interrelations between some principles of lean production, for instance between pull scheduling system and setup time reduction, it is essential to implement them simultaneously. On the other hand, Ferdows and De Meyer15, (1990) argued that efforts and resources that manager can dedicate to implementation of lean in an organization is usually limited. It means that manager usually has to prioritize some of the practices and implement them sequentially in order to be able to cope with other important ongoing tasks within the business. Further Roos16, (1990) argued that achieving just-in-time is a sequential path; therefore, it first requires the change in employees‟ attitude toward quality and establishment a flow with only value added
14
In Åhlström (1998) 15
In Åhlström (1998) 16
In Åhlström (1998)
Theoretical background
13
operation. Then implementations of techniques such as kanban and flow layouts are essential for implementing just-in-time.
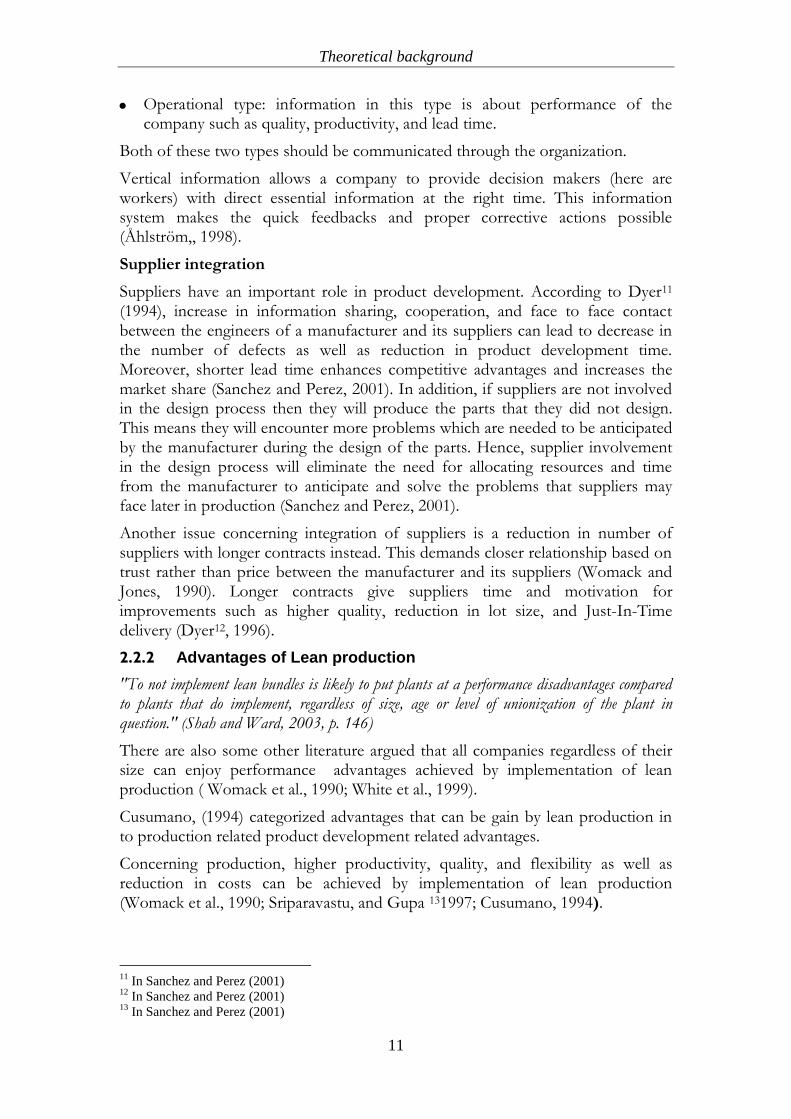
Later, Åhlström (1998) presented a sequence for implementation of lean principles. According to him, zero defects and delayering (decentralization and integration of functions) should be first steps in implementation of lean. Moreover, he introduced elimination of waste, multifunctional teams, and pull scheduling as three core principles which are needed to be conducted simultaneously throughout the implementation time. Vertical information system and team leaders are considered as supporting principles. Those, like the three core principles, should be considered by managers during the whole implementation time, however they need less efforts and resources than three core principles. Finally, when the essential bases are established through implementing pervious principles, continuous improvement should be implemented.
Figure 1- Sequences for implementation of lean principles (Åhlström, 1998, p333)
By surveying 125 companies in Italy, Japan, and USA, Filippini et al. 17(1998) came to a conclusion that order of sequences can differ according to the manufacturing context and country in which companies are located.
Many literatures have stated the critical issues and factors regarding successful implementation of lean production. Some of these success factors are presented in
following.
Success factors
Management involvement and support: is one of the essential factors for successful implementation of any improvement project as well as of lean production (Antony and Banuelas, 182001; Coronado and Antony19, 2002; Eckes20, 2000; Henderson and Evans21, 2000; Achanga et al., 2006).
Finance: is one of the critical issues for any improvement project since it is a key for other necessary elements such as consultants and proper trainings (Achanga et al., 2006).
17
In Åhlström (1998) 18
In Achanga et al. (2006) 19
In Achanga et al. (2006) 20
In Achanga et al. (2006) 21
In Achanga et al. (2006)
Theoretical background
14
Full authority of implementation coordinator: according to Womack et al. (1990), full power of coordinator and heavy weight management is one of the necessities for success in lean implementation.
All employees involvement: effective implementation of lean production needs involvement of all employees as well as management (Lee and Ebrahimpour22, 1984; Helms et al.23, 1990; Bandyopadhyay and Jayaram24, 1995; Germain and Droge25, 1997; McLachlin26, 1997).
Proper planning before implementation: detail planning is another critical issue concerning implementing lean (Hayes27, 2000).
Training: is another important factor concerning successful implementation of lean implementation (Davis28, 1997; Achanga et al., 2006). Proper training can reduce resistance to change which always exist in development projects like lean implementation (Womack et al. 1990; Karlsson and Åhlström, 1996; Sanchez and Perez, 2001).
Organizational Culture: according to Achanga et al., (2006) creating a sustainable and proactive improvement culture is one of the essential factors for success in lean implementation project.
Becoming lean is a progress: lean production should be seen as long time development progress. It should not be considered as a short time solutions for current problems (Karlsson and Åhlström, 1996; Bamber, et al., 1999; Forrester and Sorina-meier, 2002).
Performance measurement: proper performance measurement system is required for successful implementation of lean production. Performance measurement allows managers to make their decisions based on facts rather than vague guesses (Maskell29, 1994; Deming, 1986; Tenner and DeToro30, 1992; Spenley31, 1992).
Proper sequence of implementation of lean principles: as explained before proper sequence for implementation of principles can help the effective implementation of lean production.
2.2.4 Lean Production and SMEs
SMEs’ definition
European Commission (1996) provided a definition for SMEs in a recommendation in 1996 (96/280/EC). Later on, it was replaced by another
22
In White et al. (1999) 23
In White et al. (1999) 24
In White et al. (1999) 25
In White et al. (1999) 26
In White et al. (1999)
27
In Achanga et al. (2006) 28
In Bamber et al. (1999) 29
In Bamber et al. (1999) 30
In Bamber et al. (1999) 31
In Bamber et al. (1999)
Theoretical background
15
recommendation in 2003 (2003/361/EC) which it has been applied since 2005 (European Commission, 2003). This classification is based on number of employees and either the turn over or the balance sheet.
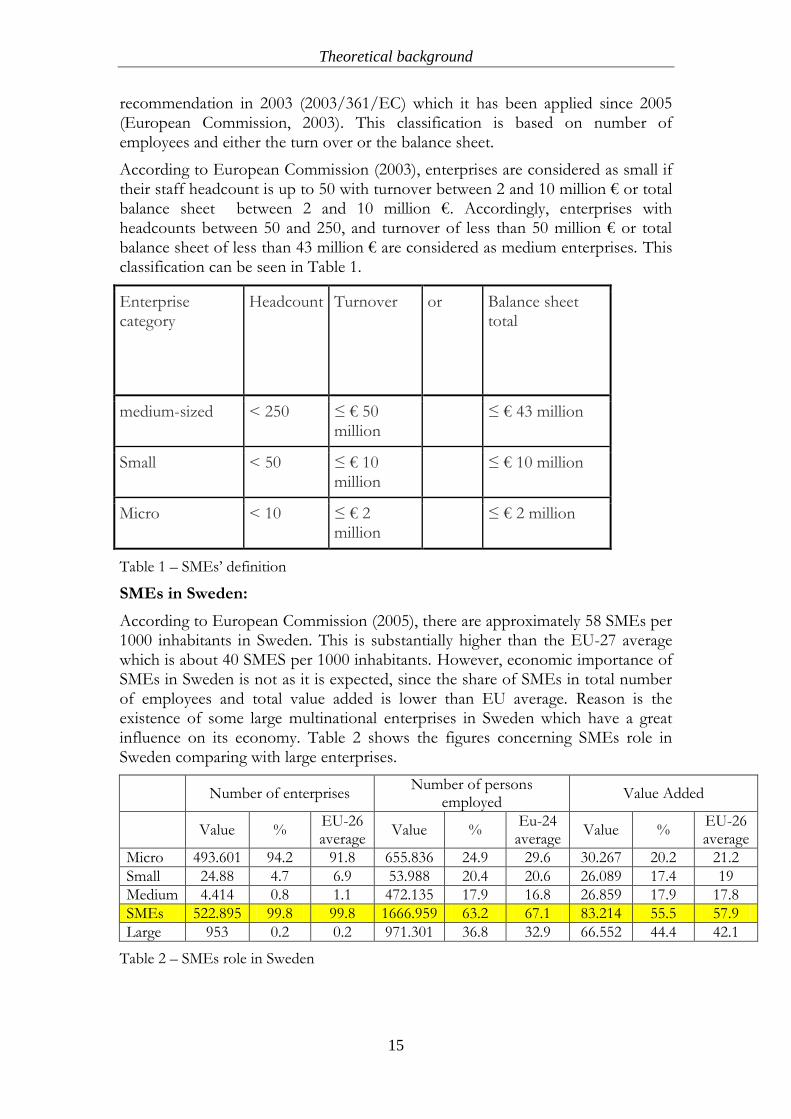
According to European Commission (2003), enterprises are considered as small if their staff headcount is up to 50 with turnover between 2 and 10 million € or total balance sheet between 2 and 10 million €. Accordingly, enterprises with headcounts between 50 and 250, and turnover of less than 50 million € or total balance sheet of less than 43 million € are considered as medium enterprises. This classification can be seen in Table 1.
Enterprise category
Headcount Turnover or Balance sheet total
medium-sized < 250 ≤ € 50 million
≤ € 43 million
Small < 50 ≤ € 10 million
≤ € 10 million
Micro < 10 ≤ € 2 million
≤ € 2 million
Table 1 – SMEs‟ definition
SMEs in Sweden:
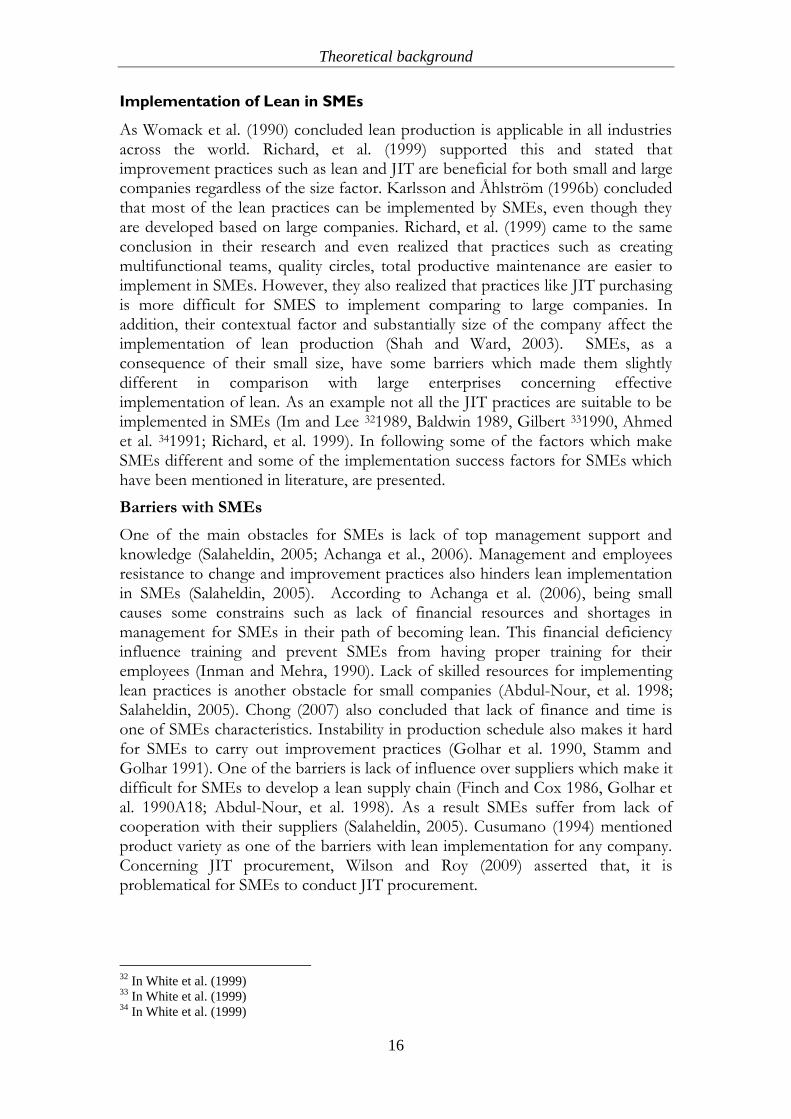
According to European Commission (2005), there are approximately 58 SMEs per 1000 inhabitants in Sweden. This is substantially higher than the EU-27 average which is about 40 SMES per 1000 inhabitants. However, economic importance of SMEs in Sweden is not as it is expected, since the share of SMEs in total number of employees and total value added is lower than EU average. Reason is the existence of some large multinational enterprises in Sweden which have a great influence on its economy. Table 2 shows the figures concerning SMEs role in Sweden comparing with large enterprises.
Number of enterprises
Number of persons employed
Value Added
Value %
EU-26 average
Value % Eu-24 average
Value % EU-26 average
Micro 493.601 94.2 91.8 655.836 24.9 29.6 30.267 20.2 21.2
Small 24.88 4.7 6.9 53.988 20.4 20.6 26.089 17.4 19
Medium 4.414 0.8 1.1 472.135 17.9 16.8 26.859 17.9 17.8
SMEs 522.895 99.8 99.8 1666.959 63.2 67.1 83.214 55.5 57.9
Large 953 0.2 0.2 971.301 36.8 32.9 66.552 44.4 42.1
Table 2 – SMEs role in Sweden
Theoretical background
16
Implementation of Lean in SMEs
As Womack et al. (1990) concluded lean production is applicable in all industries across the world. Richard, et al. (1999) supported this and stated that improvement practices such as lean and JIT are beneficial for both small and large companies regardless of the size factor. Karlsson and Åhlström (1996b) concluded that most of the lean practices can be implemented by SMEs, even though they are developed based on large companies. Richard, et al. (1999) came to the same conclusion in their research and even realized that practices such as creating multifunctional teams, quality circles, total productive maintenance are easier to implement in SMEs. However, they also realized that practices like JIT purchasing is more difficult for SMES to implement comparing to large companies. In addition, their contextual factor and substantially size of the company affect the implementation of lean production (Shah and Ward, 2003). SMEs, as a consequence of their small size, have some barriers which made them slightly different in comparison with large enterprises concerning effective implementation of lean. As an example not all the JIT practices are suitable to be implemented in SMEs (Im and Lee 321989, Baldwin 1989, Gilbert 331990, Ahmed et al. 341991; Richard, et al. 1999). In following some of the factors which make SMEs different and some of the implementation success factors for SMEs which have been mentioned in literature, are presented.
Barriers with SMEs
One of the main obstacles for SMEs is lack of top management support and knowledge (Salaheldin, 2005; Achanga et al., 2006). Management and employees resistance to change and improvement practices also hinders lean implementation in SMEs (Salaheldin, 2005). According to Achanga et al. (2006), being small causes some constrains such as lack of financial resources and shortages in management for SMEs in their path of becoming lean. This financial deficiency influence training and prevent SMEs from having proper training for their employees (Inman and Mehra, 1990). Lack of skilled resources for implementing lean practices is another obstacle for small companies (Abdul-Nour, et al. 1998; Salaheldin, 2005). Chong (2007) also concluded that lack of finance and time is one of SMEs characteristics. Instability in production schedule also makes it hard for SMEs to carry out improvement practices (Golhar et al. 1990, Stamm and Golhar 1991). One of the barriers is lack of influence over suppliers which make it difficult for SMEs to develop a lean supply chain (Finch and Cox 1986, Golhar et al. 1990A18; Abdul-Nour, et al. 1998). As a result SMEs suffer from lack of cooperation with their suppliers (Salaheldin, 2005). Cusumano (1994) mentioned product variety as one of the barriers with lean implementation for any company. Concerning JIT procurement, Wilson and Roy (2009) asserted that, it is problematical for SMEs to conduct JIT procurement.
32
In White et al. (1999) 33
In White et al. (1999) 34
In White et al. (1999)
Methodology
17
3 Methodology
This project was designed as an email-survey to evaluate the barriers with SMEs concerning both introduction and implementation of lean production. For that, two different questionnaires prepared, one for companies which already implemented lean and one for companies which have not implemented lean or any other improvement practices like that. Then they were sent to 110 companies through email. In fact, questionnaires were sent to email addresses correspondent to 125 companies. However, 15 of the emails were not delivered which can be because of wrong address, address change or etc. After almost one and a half month of sending questionnaires repeatedly to companies (at least once per week), 25 responses were received; 11 from companies which have implemented lean, 11 from ones which have not and 3 from companies which did not want to contribute in this project.
After wards, analysis carried out on collected data to identify the obstacles and barriers in Swedish SMEs‟ path to lean production.
3.1 Literature review
Sources for lean production philosophy and principles were mostly two books: “The Machine that changed the world” by Womack et al. (1990) and “Lean thinking” by Womack and Johns (2003) as well as some articles. However, scientific articles were the main sources for lean production implementation issues presented in literature review of this report. The main source for books were University library and for articles, university library‟s data bases and Google scholar were used the most. In addition some of the material from the master program course such as course books and articles were used during this research. First part of literature review was about lean production philosophy and lean principles. During this part the main idea behind lean production and how it can make changes in companies‟ performance to create competitive advantages were investigated. Moreover, practices and principles within lean production were identified to be used later on in questionnaires for mapping current state of companies which have implemented lean.
Next part of the literature review was devoted to implementation of lean production. In this part some implementation issues as well as some success factors for both large and SMEs gathered together form various articles. Ultimately, list of barriers with SMEs for implementing lean production based on previous studies in other countries were created.
3.2 Survey
This survey is a cross sectional study which was conducted as an email survey. It means that various companies have been asked about the same things and measures. Moreover, data collection only conducted through sending questionnaire by email.
Methodology
18
Questionnaires have sent along with a cover letter which contained purpose of the thesis, link to the survey website and also instruction for filling up the questionnaires. Moreover, to motivate companies to contribute in survey sharing the results of this research were promised to all respondents.
Both questionnaires and cover letter were in Swedish.
3.2.1 Target companies
In this research target companies were categorized based on two factors. The first factor is size which is defined by number of employees and company‟s turnover regarding European commission definition for SMEs. The second factor is the status of companies concerning implementation of lean production.
Target companies concerning implementation of lean in this survey are fall in to two groups. First group comprises companies which are implementing lean production or already have been implemented it. Second group includes companies which have not implemented lean production or any other similar improvement practices. Consequently for each of these target groups, one specific questionnaire was prepared.
Companies which have been surveyed in this project are in different industries.
Since proper data base is not available which sorts companies according to implementation of lean production , finding equal sample group for each of these two groups was challenging.
However, concerning first group, there were an available list of 43 companies which have been in cooperation with Jönköping University regarding lean implementation. Hence, this list used as guarantied samples for first group. Questionnaires were sent to all of these 43 companies. However 11 emails did not reach the targeted companies.
Then sample of 82 SMEs have been gathered from Affärsdata database which, actually, enabled the author to filter companies concerning their size and their location. Hence, small and medium sized enterprises in Jönköping län were searched. These companies are mostly located in Småland. In addition, since there is a higher chance that small companies have not implemented lean, more small companies have been chosen than medium ones to receive almost equal sample sizes regarding implementing lean later. Moreover, those 43 companies which implemented lean were all medium sized enterprises. Hence, 15 medium and 67 small size enterprises have been selected from that data base. As a consequence, 4 emails were not delivered which 3 of them were from small and 1of them from medium size companies.
In total, 110 companies received the emails, which 64 of them were small sized and 46 were medium sized enterprises.
Methodology
19
3.2.2 Design
Questionnaires were made on the personal website of the author (www.freeconsultancy.net/survey). Survey is started with a first welcoming page, in which, respondent can choose his/her belonging group (whether have implemented lean production or not). Then he/she will be linked to the questionnaire‟s page correspondent to selected target group. Questionnaires designed in a way that once a respondent fills and submits a questionnaire, all the answers with the date of registration, name, and email address of the respondent will be saved in a data base which made for this survey on the website. This data base is used later for analysis of collected data. In both questionnaires first questions are devoted to get the respondents information such as name, email address, position, study filed and etc as well as company information such as size, type of management and etc.
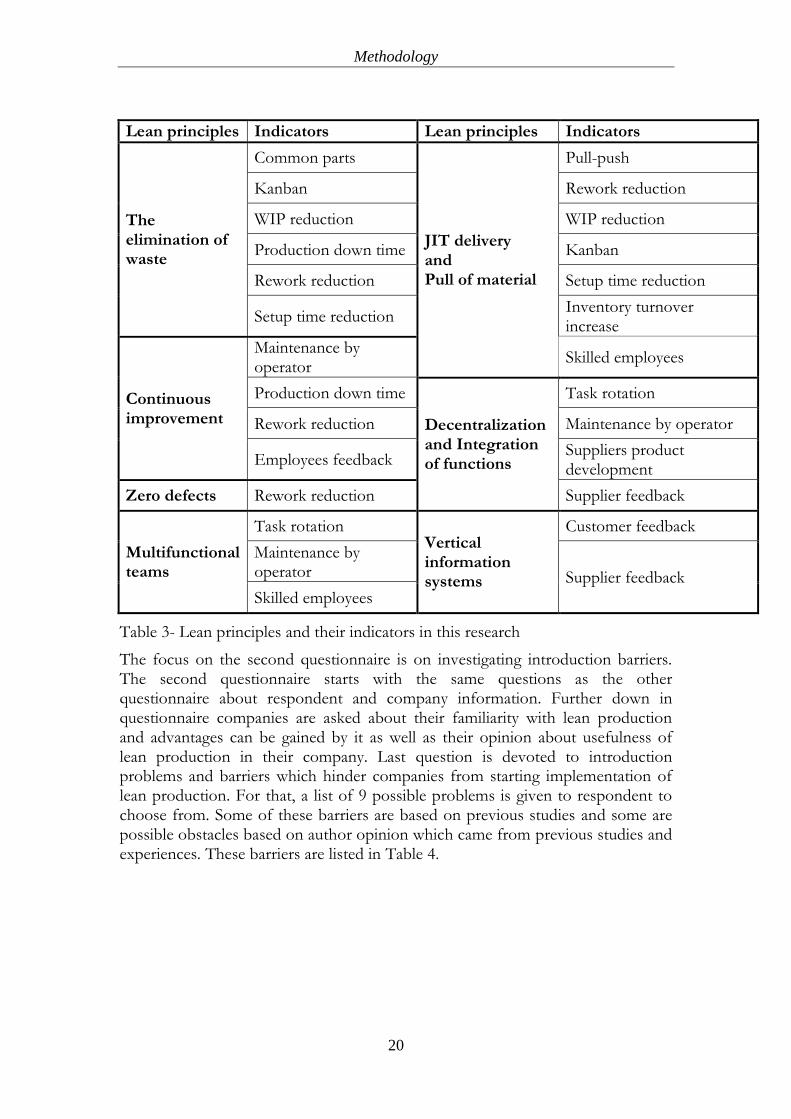
Focus of the questionnaires varies in each group. In the first questionnaire focus is on identifying hindrances for SMEs in their way to become lean; implementation barriers. However, to achieve better view about the lean transformation and its consequent problems for SMEs, current status and progress in implementation of lean are needed to be assessed. The first questionnaire was designed in a way to assess and map the current state of the companies concerning implementation of lean production as well as problematic areas for implementing lean. To assess lean implementation, success in accomplishment of each lean principle should be evaluated. For that, Sanchez and Perez (2001) identified list of indicators which can be used for this purpose. Some of these defined indicators by Sanchez and Perez (2001) are used in this research work for mapping current state of companies and their transformation process to lean production. These indicators can be seen in Table 3. Accordingly, some questions were prepared based on lean principles and their corresponding indicators. Further in questionnaire respondents are asked to select problems they have been faced during their implementation from the list of 18 problematic areas in lean production for SMEs based on previous literature, Table 4.
Methodology
20
Lean principles Indicators Lean principles Indicators
The elimination of waste
Common parts
JIT delivery and Pull of material
Pull-push
Kanban Rework reduction
WIP reduction WIP reduction
Production down time Kanban
Rework reduction Setup time reduction
Setup time reduction Inventory turnover increase
Continuous improvement
Maintenance by operator
Skilled employees
Production down time
Decentralization and Integration of functions
Task rotation
Rework reduction Maintenance by operator
Employees feedback Suppliers product development
Zero defects Rework reduction Supplier feedback
Multifunctional teams
Task rotation Vertical information systems
Customer feedback
Maintenance by operator Supplier feedback
Skilled employees
Table 3- Lean principles and their indicators in this research
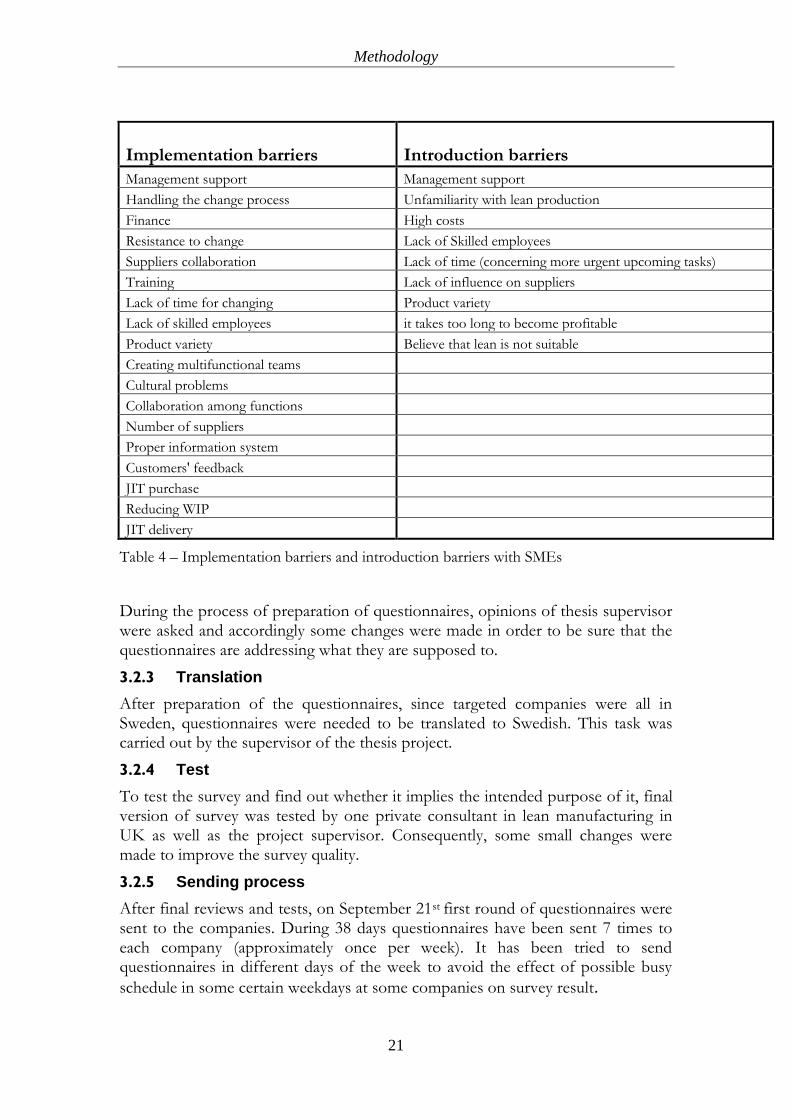
The focus on the second questionnaire is on investigating introduction barriers. The second questionnaire starts with the same questions as the other questionnaire about respondent and company information. Further down in questionnaire companies are asked about their familiarity with lean production and advantages can be gained by it as well as their opinion about usefulness of lean production in their company. Last question is devoted to introduction problems and barriers which hinder companies from starting implementation of lean production. For that, a list of 9 possible problems is given to respondent to choose from. Some of these barriers are based on previous studies and some are possible obstacles based on author opinion which came from previous studies and experiences. These barriers are listed in Table 4.
Methodology
21
Implementation barriers Introduction barriers
Management support Management support
Handling the change process Unfamiliarity with lean production
Finance High costs
Resistance to change Lack of Skilled employees
Suppliers collaboration Lack of time (concerning more urgent upcoming tasks)
Training Lack of influence on suppliers
Lack of time for changing Product variety
Lack of skilled employees it takes too long to become profitable
Product variety Believe that lean is not suitable
Creating multifunctional teams
Cultural problems
Collaboration among functions
Number of suppliers
Proper information system
Customers' feedback
JIT purchase
Reducing WIP
JIT delivery
Table 4 – Implementation barriers and introduction barriers with SMEs
During the process of preparation of questionnaires, opinions of thesis supervisor were asked and accordingly some changes were made in order to be sure that the questionnaires are addressing what they are supposed to.
3.2.3 Translation
After preparation of the questionnaires, since targeted companies were all in Sweden, questionnaires were needed to be translated to Swedish. This task was carried out by the supervisor of the thesis project.
3.2.4 Test
To test the survey and find out whether it implies the intended purpose of it, final version of survey was tested by one private consultant in lean manufacturing in UK as well as the project supervisor. Consequently, some small changes were made to improve the survey quality.
3.2.5 Sending process
After final reviews and tests, on September 21st first round of questionnaires were sent to the companies. During 38 days questionnaires have been sent 7 times to each company (approximately once per week). It has been tried to send questionnaires in different days of the week to avoid the effect of possible busy
schedule in some certain weekdays at some companies on survey result.

Methodology
22
3.3 Data analysis
To analyse the received data all the data from data base has been exported in to Microsoft Excel. For analysing data in hand, average, variance, and correlation functions from Excel have been used. Correlation function in Excel calculates the Correlation Coefficient for every two data sets which is base on regression analysis. Formula for calculating correlation coefficient is:
Correlation coefficient is a number between -1 and +1. According to the sample size of 11 for each data set in this research, correlation coefficient with an absolute value higher than 0.6, implies existence of correlation between corresponding two data sets.
Results
23
4 Results
After more than one and a half month process of sending and following up the questionnaires, 22 answers have been received in total. 11 of these responses were related to companies which have implemented lean and another 11 responses were related to the ones which have not implemented lean. The presented results in this section are based on the obtained information from these responses.
Concerning respondents‟ role and involvement in lean implementation, it should be mentioned that in the case of the companies which have implemented lean most of the respondents are responsible or somehow involved in the lean implementation in their organization. However, they are mainly production managers or second level managers. Regarding the companies which have not implemented lean, most of the respondents were CEOs of the companies.
Current state
To briefly assess the success and progress of the surveyed companies in their transformation to lean, their current state concerning their organizational structure and their progress in implementation of various lean principles were investigated. The obtained data regarding this investigation is shown in Table 5. This table provides an overall view about the surveyed companies‟ current situation and their achievements in their lean implementation process until now.

Results
24
% % % % %
Management type
Owner 20.00 management group 80.00
Implementation coordinator Authority
Average=3.82
Variance=1.36
Range: 1 to 5
Lean importance
Average=5.18
Variance=1.16
Range: 0 to 6
Product variety Average=3.09
Variance=2.09
Range: 1 to 5
Push Pull Pull 18.18 Push-Pull 63.64 Push 18.18
Employee contract
Permanent 18.18 mixed 81.82
Operator maintenance
No maintenance
9.09 Take care of machines
18.18
Take care of machines and Solve minor errors
72.73
Employee feedback
No feedback 27.27 using feedback 72.73
Task rotation Yes 54.55 No 45.45
Kanban through all value stream
45.45 inside company 9.09 Not want to 18.18 Not tried
27.27
Supplier product development
Yes 81.82 No 18.18
Supplier feedback
Yes 45.45 Have but does not work
36.36 Supplier not want to
9.09 Can not
9.09
Customer feedback
Average=3.36
Variance=0.65
Range: 1 to 5
Skilled employees
Available 9.09 Consultant 72.73 Training 18.18
Common parts Yes 9.09 Not as much as expected
27.27 Not want to 45.45 Can not
9.09 Not tried
9.09
Setup time reduction
Yes 36.36 Not as much as expected
54.55 Not tried
9.09
Inventory turn increase
Yes 54.55 Not as much as expected
9.09 Can not
9.09 Not tried
27.27
Production downtime reduction
Yes 30.00 Not as much as expected
70.00
Rework reduction
Yes 18.18 Not as much as expected
72.73 Can not
9.09
WIP reduction Yes 36.36 Not as much as expected
27.27 Can not
9.09 Not tried
27.27
Table 5-Current state of surveyed companies
Implementation barriers
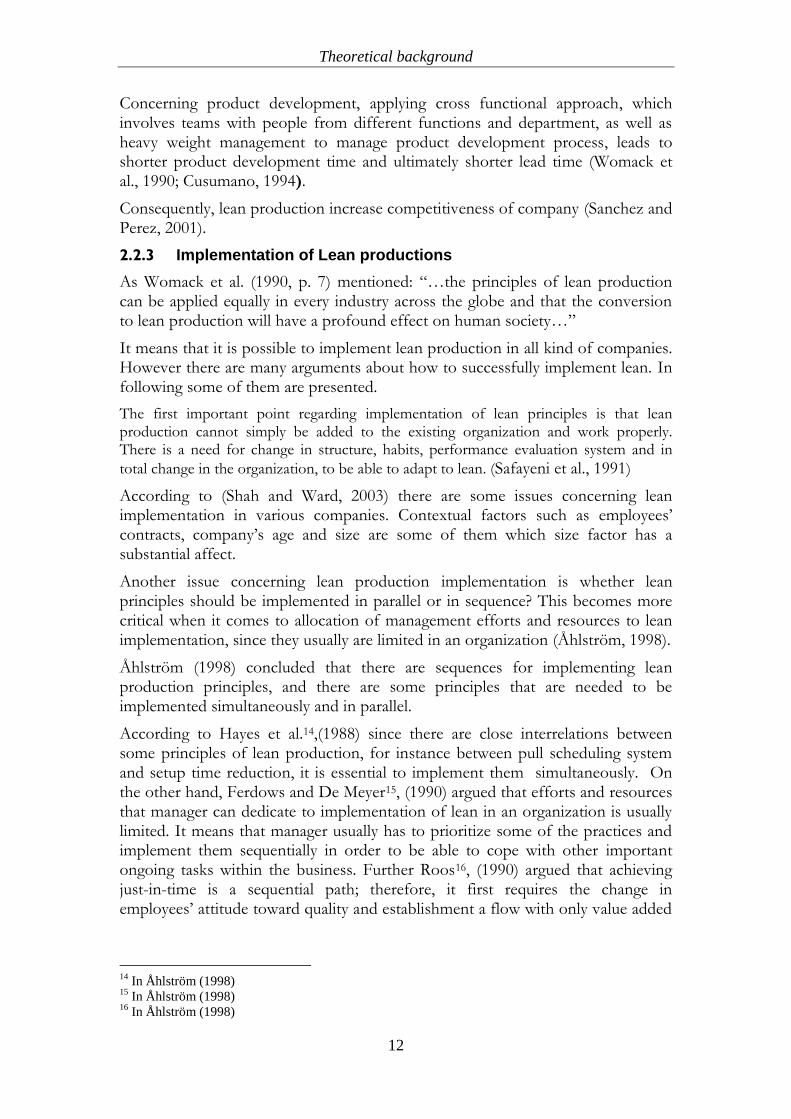
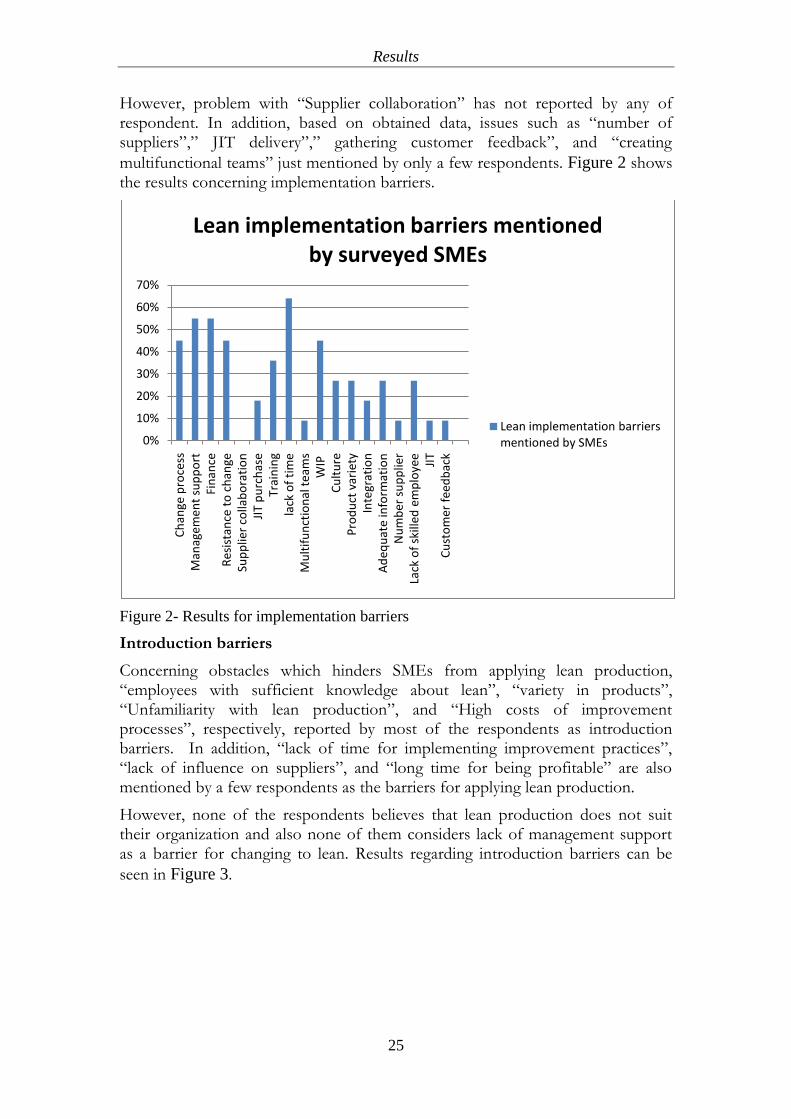
Obtained data regarding implementation barriers with SMEs shows that, “lack of time”, “management support”, and “financial problems” are the most common barriers for SMEs in Sweden. That is because more than half of the respondents announced that they have problem with them. In addition, “employees‟ resistance to change”,” reduction of work in process inventory”, and “training” were mentioned by almost half of the respondent as problematic issues concerning implementation of lean production.
Results
25
However, problem with “Supplier collaboration” has not reported by any of respondent. In addition, based on obtained data, issues such as “number of suppliers”,” JIT delivery”,” gathering customer feedback”, and “creating
multifunctional teams” just mentioned by only a few respondents. Figure 2 shows the results concerning implementation barriers.
Figure 2- Results for implementation barriers
Introduction barriers
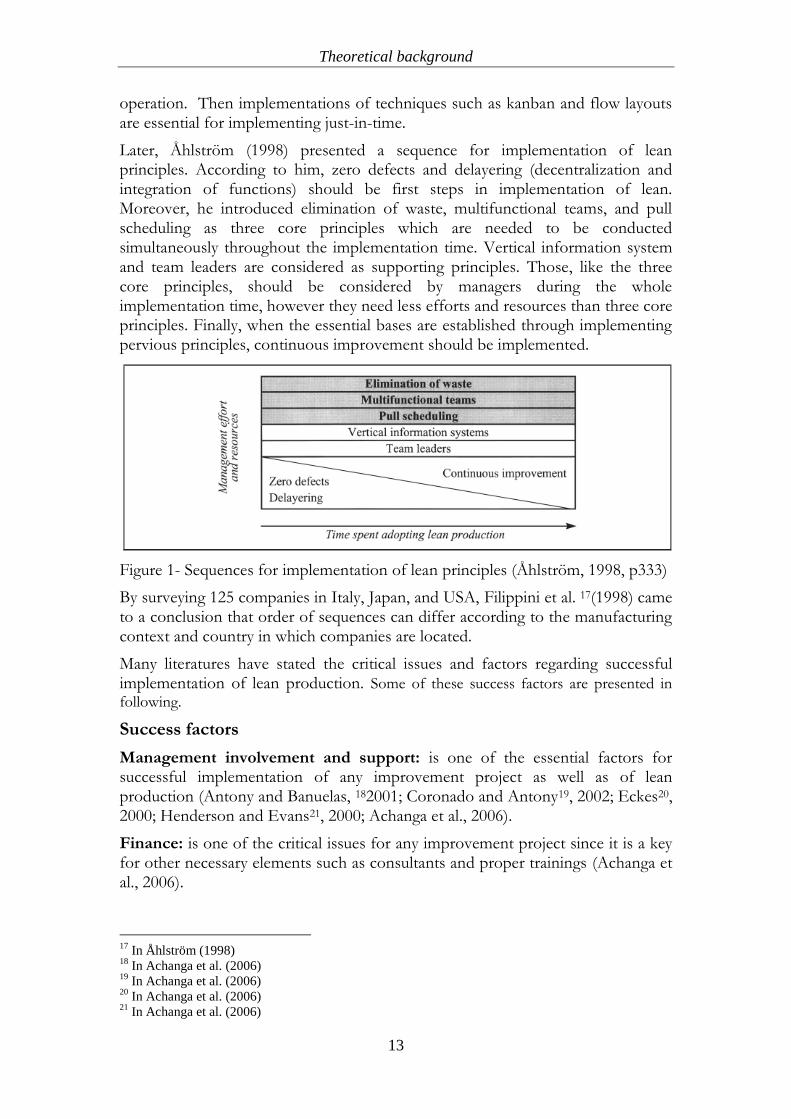
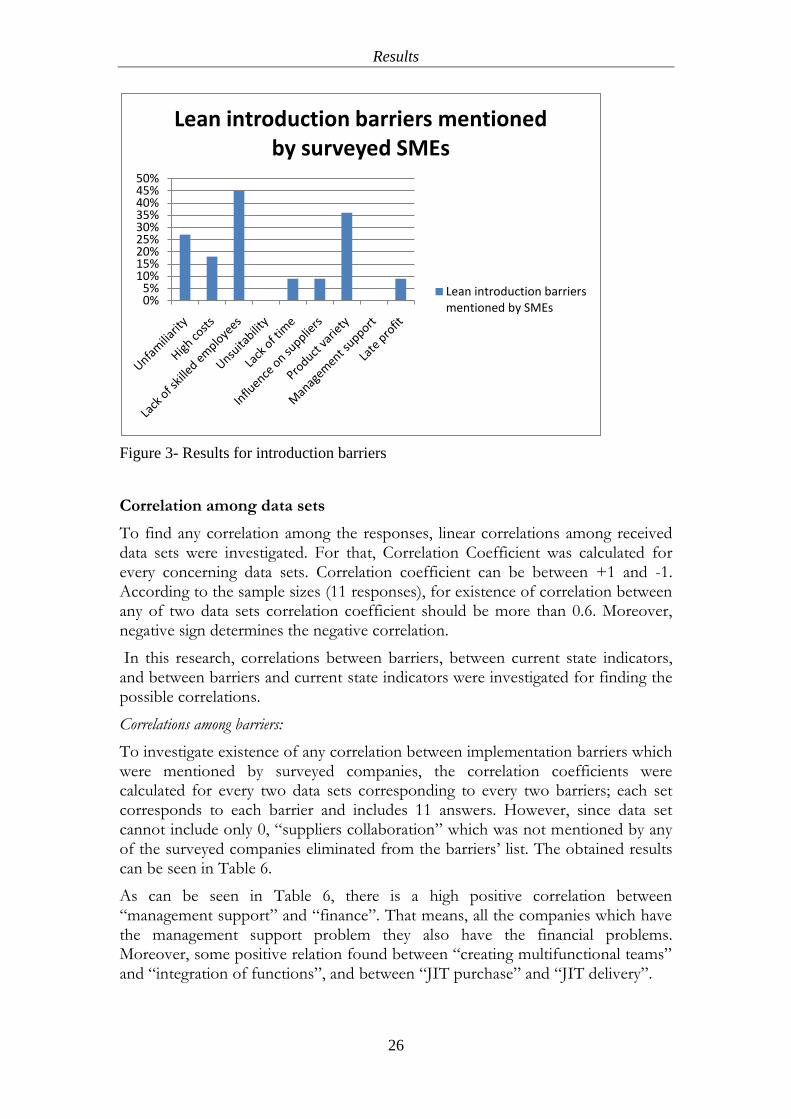
Concerning obstacles which hinders SMEs from applying lean production, “employees with sufficient knowledge about lean”, “variety in products”, “Unfamiliarity with lean production”, and “High costs of improvement processes”, respectively, reported by most of the respondents as introduction barriers. In addition, “lack of time for implementing improvement practices”, “lack of influence on suppliers”, and “long time for being profitable” are also mentioned by a few respondents as the barriers for applying lean production.
However, none of the respondents believes that lean production does not suit their organization and also none of them considers lack of management support as a barrier for changing to lean. Results regarding introduction barriers can be
seen in Figure 3.
0%
10%
20%
30%
40%
50%
60%
70%
Ch
ange
pro
cess
Man
agem
ent
sup
po
rtFi
nan
ceR
esis
tan
ce t
o c
han
geSu
pp
lier
colla
bo
rati
on
JIT
pu
rch
ase
Trai
nin
gla
ck o
f ti
me
Mu
ltif
un
ctio
nal
tea
ms
WIP
C
ult
ure
Pro
du
ct v
arie
tyIn
tegr
atio
nA
deq
uat
e in
form
atio
nN
um
ber
su
pp
lier
Lack
of
skill
ed e
mp
loye
eJI
TC
ust
om
er f
eed
bac
k
Lean implementation barriers mentioned by surveyed SMEs
Lean implementation barriers mentioned by SMEs
Results
26
Figure 3- Results for introduction barriers
Correlation among data sets
To find any correlation among the responses, linear correlations among received data sets were investigated. For that, Correlation Coefficient was calculated for every concerning data sets. Correlation coefficient can be between +1 and -1. According to the sample sizes (11 responses), for existence of correlation between any of two data sets correlation coefficient should be more than 0.6. Moreover, negative sign determines the negative correlation.
In this research, correlations between barriers, between current state indicators, and between barriers and current state indicators were investigated for finding the possible correlations.
Correlations among barriers:
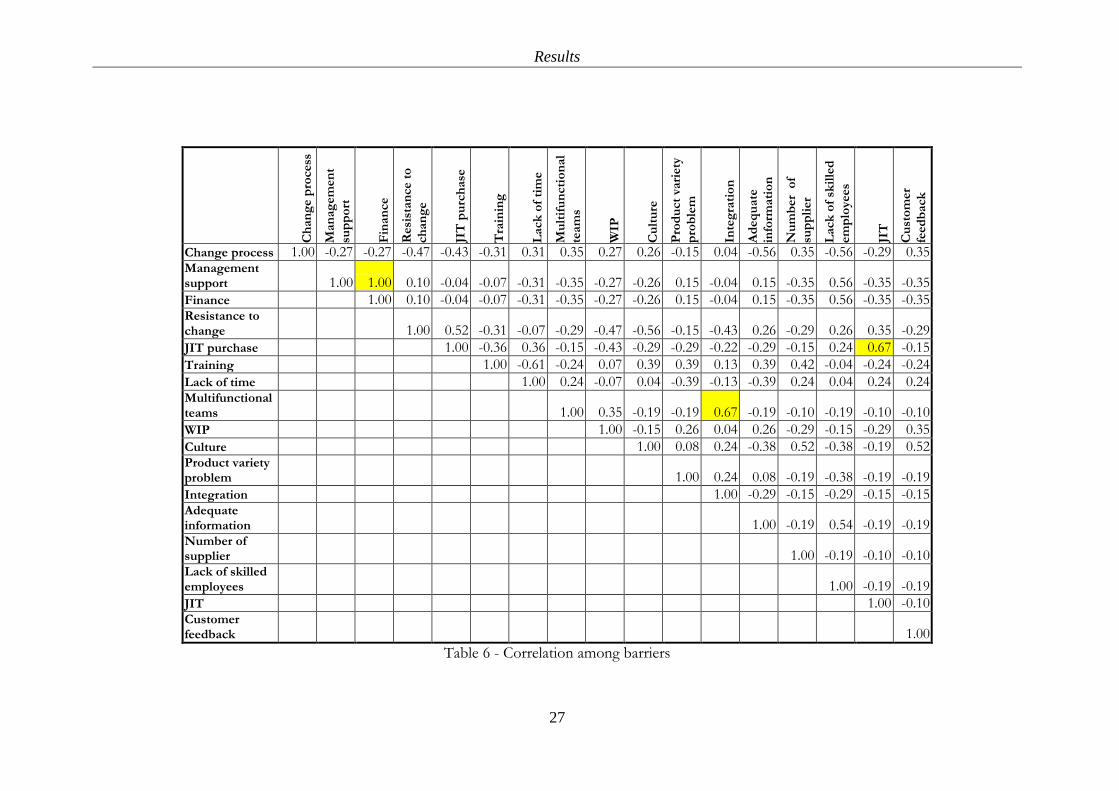
To investigate existence of any correlation between implementation barriers which were mentioned by surveyed companies, the correlation coefficients were calculated for every two data sets corresponding to every two barriers; each set corresponds to each barrier and includes 11 answers. However, since data set cannot include only 0, “suppliers collaboration” which was not mentioned by any of the surveyed companies eliminated from the barriers‟ list. The obtained results can be seen in Table 6.
As can be seen in Table 6, there is a high positive correlation between “management support” and “finance”. That means, all the companies which have the management support problem they also have the financial problems. Moreover, some positive relation found between “creating multifunctional teams” and “integration of functions”, and between “JIT purchase” and “JIT delivery”.
0%5%
10%15%20%25%30%35%40%45%50%
Lean introduction barriers mentioned by surveyed SMEs
Lean introduction barriers mentioned by SMEs
Results
27
Ch
an
ge p
rocess
Man
ag
em
en
t
sup
po
rt
Fin
an
ce
Resi
stan
ce t
o
ch
an
ge
JIT
pu
rch
ase
Tra
inin
g
Lack
of
tim
e
Mu
ltif
un
cti
on
al
team
s
WIP
Cu
ltu
re
Pro
du
ct
vari
ety
pro
ble
m
Inte
gra
tio
n
Ad
eq
uate
info
rmati
on
Nu
mb
er
of
sup
pli
er
Lack
of
skil
led
em
plo
yees
JIT
Cu
sto
mer
feed
back
Change process 1.00 -0.27 -0.27 -0.47 -0.43 -0.31 0.31 0.35 0.27 0.26 -0.15 0.04 -0.56 0.35 -0.56 -0.29 0.35 Management support 1.00 1.00 0.10 -0.04 -0.07 -0.31 -0.35 -0.27 -0.26 0.15 -0.04 0.15 -0.35 0.56 -0.35 -0.35
Finance 1.00 0.10 -0.04 -0.07 -0.31 -0.35 -0.27 -0.26 0.15 -0.04 0.15 -0.35 0.56 -0.35 -0.35 Resistance to change 1.00 0.52 -0.31 -0.07 -0.29 -0.47 -0.56 -0.15 -0.43 0.26 -0.29 0.26 0.35 -0.29
JIT purchase 1.00 -0.36 0.36 -0.15 -0.43 -0.29 -0.29 -0.22 -0.29 -0.15 0.24 0.67 -0.15
Training 1.00 -0.61 -0.24 0.07 0.39 0.39 0.13 0.39 0.42 -0.04 -0.24 -0.24
Lack of time 1.00 0.24 -0.07 0.04 -0.39 -0.13 -0.39 0.24 0.04 0.24 0.24 Multifunctional teams 1.00 0.35 -0.19 -0.19 0.67 -0.19 -0.10 -0.19 -0.10 -0.10
WIP 1.00 -0.15 0.26 0.04 0.26 -0.29 -0.15 -0.29 0.35
Culture 1.00 0.08 0.24 -0.38 0.52 -0.38 -0.19 0.52 Product variety problem 1.00 0.24 0.08 -0.19 -0.38 -0.19 -0.19
Integration 1.00 -0.29 -0.15 -0.29 -0.15 -0.15 Adequate information 1.00 -0.19 0.54 -0.19 -0.19 Number of supplier 1.00 -0.19 -0.10 -0.10 Lack of skilled employees 1.00 -0.19 -0.19
JIT 1.00 -0.10 Customer feedback 1.00
Table 6 - Correlation among barriers

Results
28
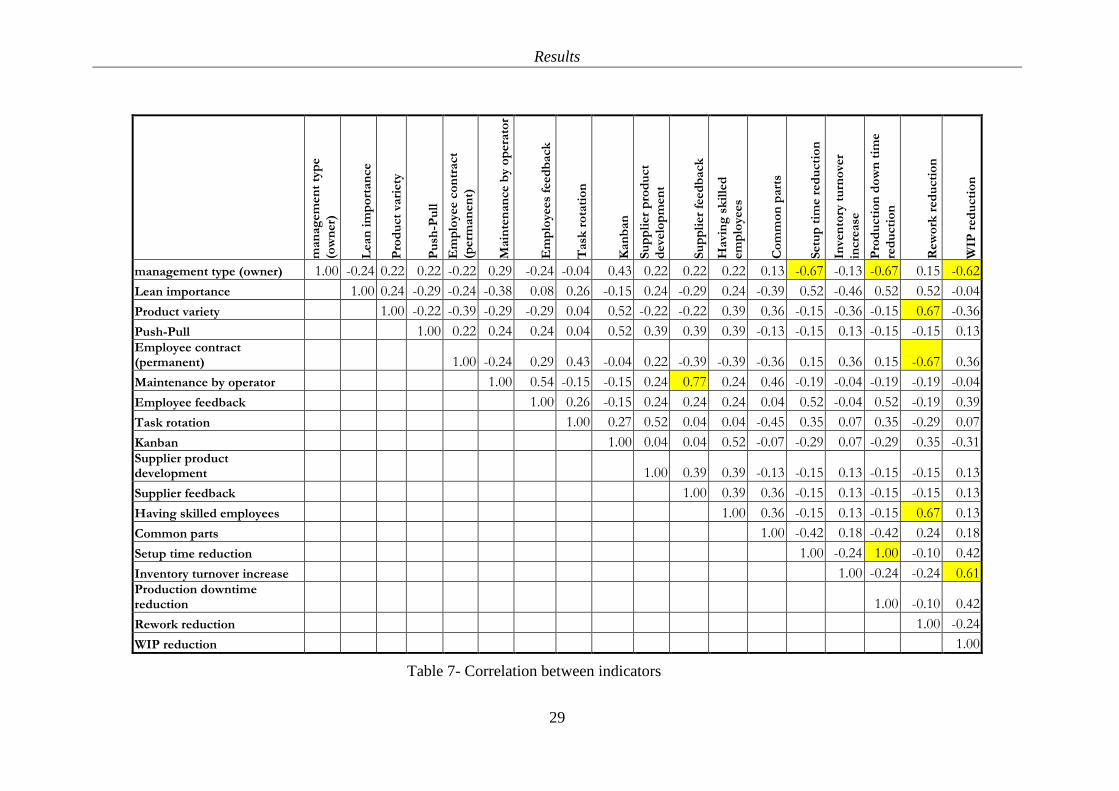
Correlations among indicators: The same calculation was conducted for every two indicators‟ obtained data. However, since some of the indicators were measured by scales in the survey, they were excluded from correlation evaluation. Therefore, the correlation between the reset of the indicators were calculated. The results of the investigation for finding correlations between indicators are shown in Table 7.
Results
29
man
ag
em
en
t ty
pe
(ow
ner)
Lean
im
po
rtan
ce
Pro
du
ct
vari
ety
Pu
sh-P
ull
Em
plo
yee c
on
tract
(perm
an
en
t)
Main
ten
an
ce b
y o
pera
tor
Em
plo
yees
feed
back
Task
ro
tati
on
Kan
ban
Su
pp
lier
pro
du
ct
deve
lop
men
t
Su
pp
lier
feed
back
Havi
ng
sk
ille
d
em
plo
yees
Co
mm
on
part
s
Setu
p t
ime r
ed
ucti
on
Inve
nto
ry t
urn
ove
r
incre
ase
Pro
du
cti
on
do
wn
tim
e
red
ucti
on
Rew
ork
red
ucti
on
WIP
red
ucti
on
management type (owner) 1.00 -0.24 0.22 0.22 -0.22 0.29 -0.24 -0.04 0.43 0.22 0.22 0.22 0.13 -0.67 -0.13 -0.67 0.15 -0.62
Lean importance 1.00 0.24 -0.29 -0.24 -0.38 0.08 0.26 -0.15 0.24 -0.29 0.24 -0.39 0.52 -0.46 0.52 0.52 -0.04
Product variety 1.00 -0.22 -0.39 -0.29 -0.29 0.04 0.52 -0.22 -0.22 0.39 0.36 -0.15 -0.36 -0.15 0.67 -0.36
Push-Pull 1.00 0.22 0.24 0.24 0.04 0.52 0.39 0.39 0.39 -0.13 -0.15 0.13 -0.15 -0.15 0.13 Employee contract (permanent) 1.00 -0.24 0.29 0.43 -0.04 0.22 -0.39 -0.39 -0.36 0.15 0.36 0.15 -0.67 0.36
Maintenance by operator 1.00 0.54 -0.15 -0.15 0.24 0.77 0.24 0.46 -0.19 -0.04 -0.19 -0.19 -0.04
Employee feedback 1.00 0.26 -0.15 0.24 0.24 0.24 0.04 0.52 -0.04 0.52 -0.19 0.39
Task rotation 1.00 0.27 0.52 0.04 0.04 -0.45 0.35 0.07 0.35 -0.29 0.07
Kanban 1.00 0.04 0.04 0.52 -0.07 -0.29 0.07 -0.29 0.35 -0.31 Supplier product development 1.00 0.39 0.39 -0.13 -0.15 0.13 -0.15 -0.15 0.13
Supplier feedback 1.00 0.39 0.36 -0.15 0.13 -0.15 -0.15 0.13
Having skilled employees 1.00 0.36 -0.15 0.13 -0.15 0.67 0.13
Common parts 1.00 -0.42 0.18 -0.42 0.24 0.18
Setup time reduction 1.00 -0.24 1.00 -0.10 0.42
Inventory turnover increase 1.00 -0.24 -0.24 0.61 Production downtime reduction 1.00 -0.10 0.42
Rework reduction 1.00 -0.24
WIP reduction 1.00
Table 7- Correlation between indicators
Results
30
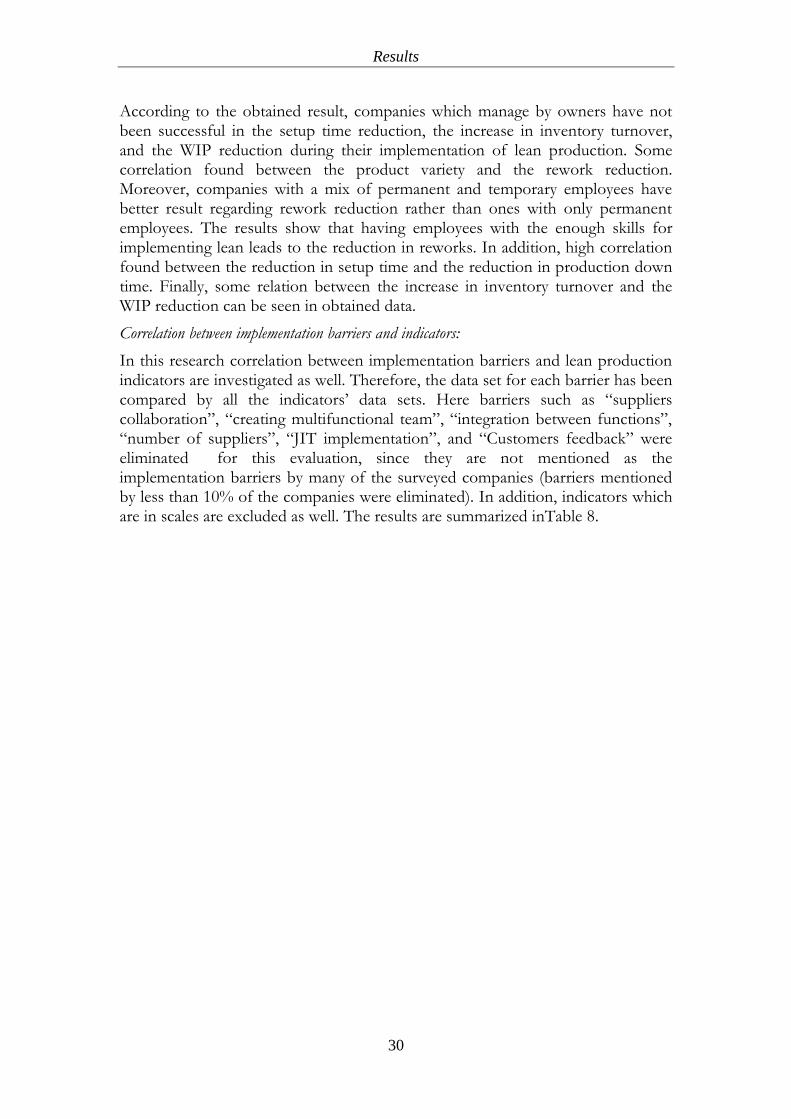
According to the obtained result, companies which manage by owners have not been successful in the setup time reduction, the increase in inventory turnover, and the WIP reduction during their implementation of lean production. Some correlation found between the product variety and the rework reduction. Moreover, companies with a mix of permanent and temporary employees have better result regarding rework reduction rather than ones with only permanent employees. The results show that having employees with the enough skills for implementing lean leads to the reduction in reworks. In addition, high correlation found between the reduction in setup time and the reduction in production down time. Finally, some relation between the increase in inventory turnover and the WIP reduction can be seen in obtained data.
Correlation between implementation barriers and indicators:
In this research correlation between implementation barriers and lean production indicators are investigated as well. Therefore, the data set for each barrier has been compared by all the indicators‟ data sets. Here barriers such as “suppliers collaboration”, “creating multifunctional team”, “integration between functions”, “number of suppliers”, “JIT implementation”, and “Customers feedback” were eliminated for this evaluation, since they are not mentioned as the implementation barriers by many of the surveyed companies (barriers mentioned by less than 10% of the companies were eliminated). In addition, indicators which are in scales are excluded as well. The results are summarized inTable 8.
Results
31
Ch
an
ge p
rocess
Man
ag
em
en
t
sup
po
rt
Fin
an
ce
Resi
stan
ce t
o
ch
an
ge
JIT
pu
rch
ase
Tra
inin
g
Lack
of
tim
e
WIP
Cu
ltu
re
Pro
du
ct
vari
ety
pro
ble
m
Ad
eq
uate
info
rmati
on
Lack
of
skil
led
em
plo
yee
s
Management (owner) 0.04 0.43 0.43 0.04 -0.22 0.13 -0.62 -0.43 0.24 0.24 -0.29 -0.29
Product variety 0.43 0.04 0.04 -0.52 -0.39 0.36 -0.36 0.43 0.29 0.29 -0.24 -0.24
Push-Pull -0.04 0.04 0.04 -0.04 -0.39 -0.13 -0.36 0.43 -0.24 0.29 0.29 -0.24 Employee contract (permanent) 0.04 -0.04 -0.04 0.04 -0.22 -0.36 0.36 0.04 0.24 -0.29 0.24 0.24
Maintenance by operator -0.26 0.26 0.26 0.15 -0.24 0.46 -0.46 -0.26 -0.08 0.38 0.38 -0.08
Employee feedback -0.26 -0.15 -0.15 -0.26 -0.24 0.46 -0.04 0.15 0.38 0.38 0.38 -0.08
Task rotation 0.10 -0.10 -0.10 -0.63 -0.52 0.31 0.07 0.10 0.56 -0.26 0.15 0.15
Kanban 0.10 -0.10 -0.10 -0.27 -0.52 0.31 -0.69 0.47 0.15 0.15 0.15 -0.26 Supplier product development 0.43 0.04 0.04 -0.52 -0.39 -0.13 0.13 -0.04 0.29 -0.24 -0.24 -0.24
Supplier feedback -0.04 0.04 0.04 -0.04 -0.39 0.36 -0.36 -0.04 -0.24 0.29 0.29 -0.24
Having skilled employees 0.43 -0.43 -0.43 -0.52 -0.39 0.36 -0.36 0.43 0.29 0.29 -0.24 -0.77
Common parts 0.45 -0.07 -0.07 0.07 -0.36 0.21 -0.21 0.07 -0.04 0.39 -0.04 -0.46
Setup time reduction -0.35 -0.29 -0.29 -0.35 0.15 0.24 0.42 0.29 0.19 0.19 0.19 0.19
Inventory turn increase 0.31 -0.69 -0.69 0.31 -0.13 -0.21 0.21 -0.07 0.04 -0.39 0.04 -0.39 Production down time reduction -0.35 -0.29 -0.29 -0.35 0.15 0.24 0.42 0.29 0.19 0.19 0.19 0.19
Rework reduction 0.29 -0.29 -0.29 -0.35 0.15 0.24 -0.24 0.29 0.19 0.19 -0.52 -0.52
WIP reduction 0.31 -0.69 -0.69 -0.17 -0.13 -0.21 0.61 0.31 0.04 0.04 0.04 -0.39
Table 8- Correlation between indicators and implementation barriers
Results
32
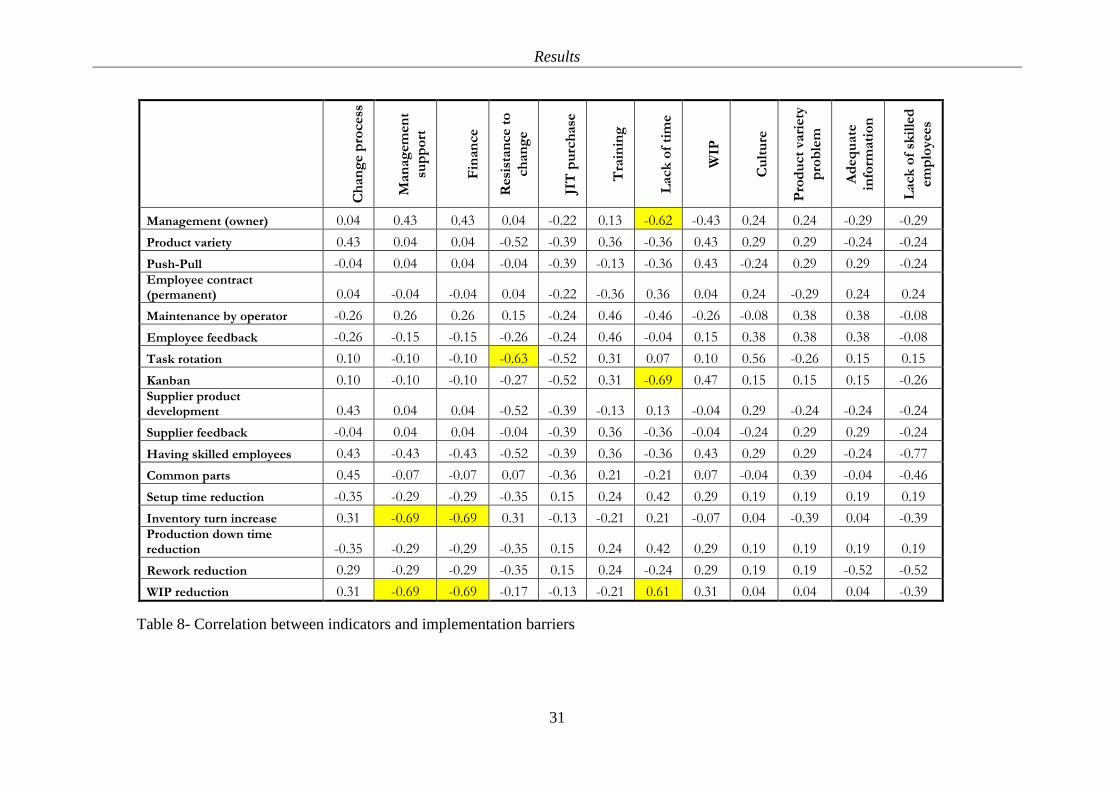
Correlation among introduction barriers:
These correlations were evaluated by the same approach as previous section. Therefore, barriers such as “usability” and “management support” which have not mentioned by any of the surveyed companies are eliminated. The results for this evaluation are presented in Table 9.
Unfamiliarity
High costs
Lack of skilled
employees
Lack of time
Influence on suppliers
Product variety
Late profit
Unfamiliarity 1.00 -0.29 -0.15 -0.19 -0.19 -0.04 -0.19
High costs
1.00 0.04 -0.15 -0.15 0.13 0.67
Lack of skilled employees
1.00 0.35 -0.29 -0.31 -0.29
Lack of time
1.00 -0.10 -0.24 -0.10
Influence on suppliers
1.00 0.42 -0.10
Product variety
1.00 0.42
Late profit
1.00
Table 9 - Correlation among introduction barriers
Results shows that companies which believe high costs of implementation hinders them from becoming lean, also believe that lean production will become profitable in long run.
Analysis
33
5 Analysis
In this section of the report analysis of achieved results are presented based on previous literature and secondary data.
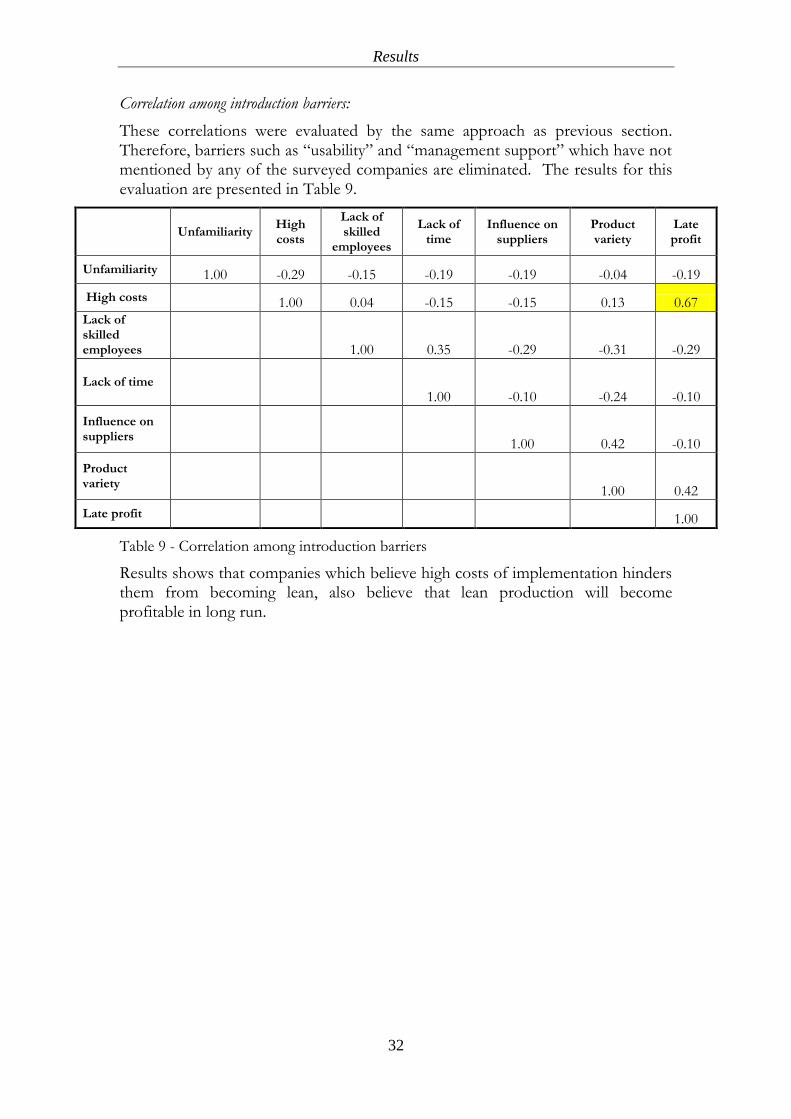
5.1 Size and lean implementation
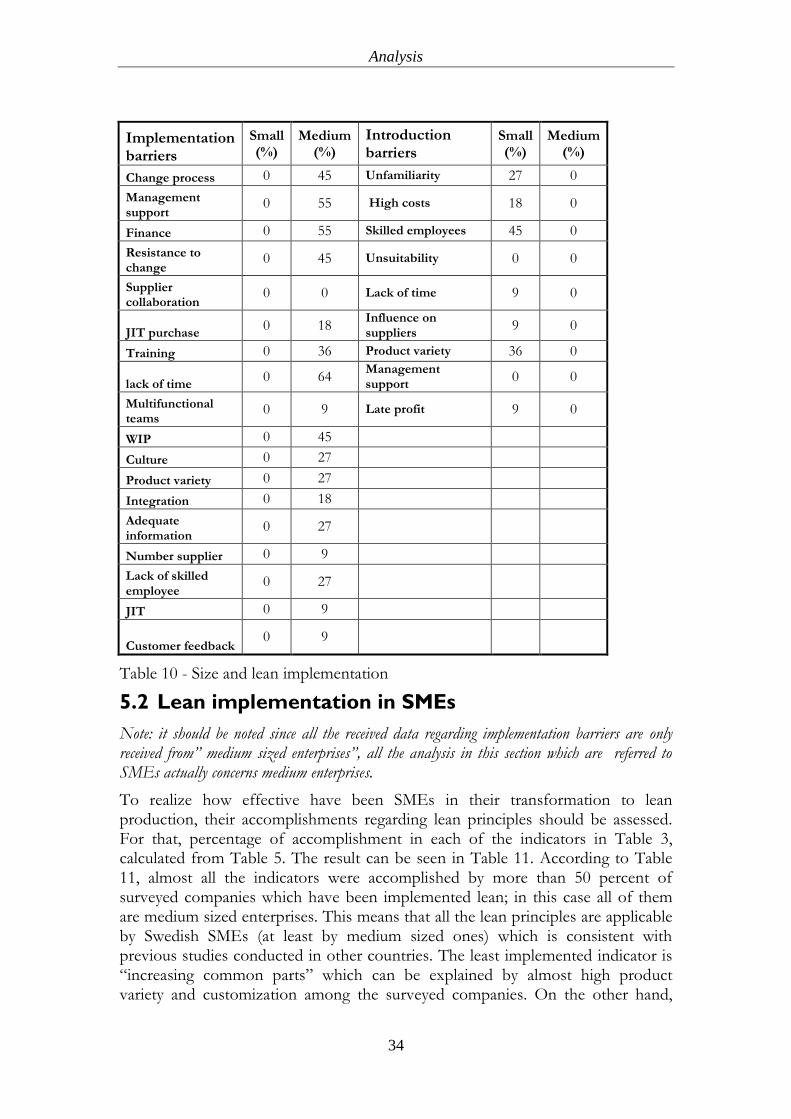
Influence of the size on SMEs‟ tendency to lean production is one of the results which can be concluded from obtained data. Interestingly, all the companies which have implementation barriers are medium sized and all the ones with introduction barriers are small ones. It means that all the respondents who have implemented lean production are medium companies and all the respondents which have not, are small companies. Hence, it can be concluded that medium sized enterprises have more tendency to implement lean production in their organization than small ones (Table 10). However, this founding is in contrast with Womack et al. (1990) which concluded that lean production is applicable in all the companies around the globe regardless of their size. This can be justified by their specific characteristics and limitations such as lack of skilled employees and lack of finance. Moreover, many of the small companies are producing customized products and have a high product variety, which makes it hard to implement lean production within them. Therefore, more detail and in depth future studies are demanded in this area to clarify the exact reasons behind the lack of tendency to apply lean.
Analysis
34
Implementation barriers
Small (%)
Medium (%)
Introduction barriers
Small (%)
Medium (%)
Change process 0 45 Unfamiliarity 27 0
Management support
0 55 High costs 18 0
Finance 0 55 Skilled employees 45 0
Resistance to change
0 45 Unsuitability 0 0
Supplier collaboration
0 0 Lack of time 9 0
JIT purchase 0 18
Influence on suppliers
9 0
Training 0 36 Product variety 36 0
lack of time 0 64
Management support
0 0
Multifunctional teams
0 9 Late profit 9 0
WIP 0 45
Culture 0 27
Product variety 0 27
Integration 0 18
Adequate information
0 27
Number supplier 0 9
Lack of skilled employee
0 27
JIT 0 9
Customer feedback 0 9
Table 10 - Size and lean implementation
5.2 Lean implementation in SMEs
Note: it should be noted since all the received data regarding implementation barriers are only received from” medium sized enterprises”, all the analysis in this section which are referred to SMEs actually concerns medium enterprises.
To realize how effective have been SMEs in their transformation to lean production, their accomplishments regarding lean principles should be assessed. For that, percentage of accomplishment in each of the indicators in Table 3, calculated from Table 5. The result can be seen in Table 11. According to Table 11, almost all the indicators were accomplished by more than 50 percent of surveyed companies which have been implemented lean; in this case all of them are medium sized enterprises. This means that all the lean principles are applicable by Swedish SMEs (at least by medium sized ones) which is consistent with previous studies conducted in other countries. The least implemented indicator is “increasing common parts” which can be explained by almost high product variety and customization among the surveyed companies. On the other hand,
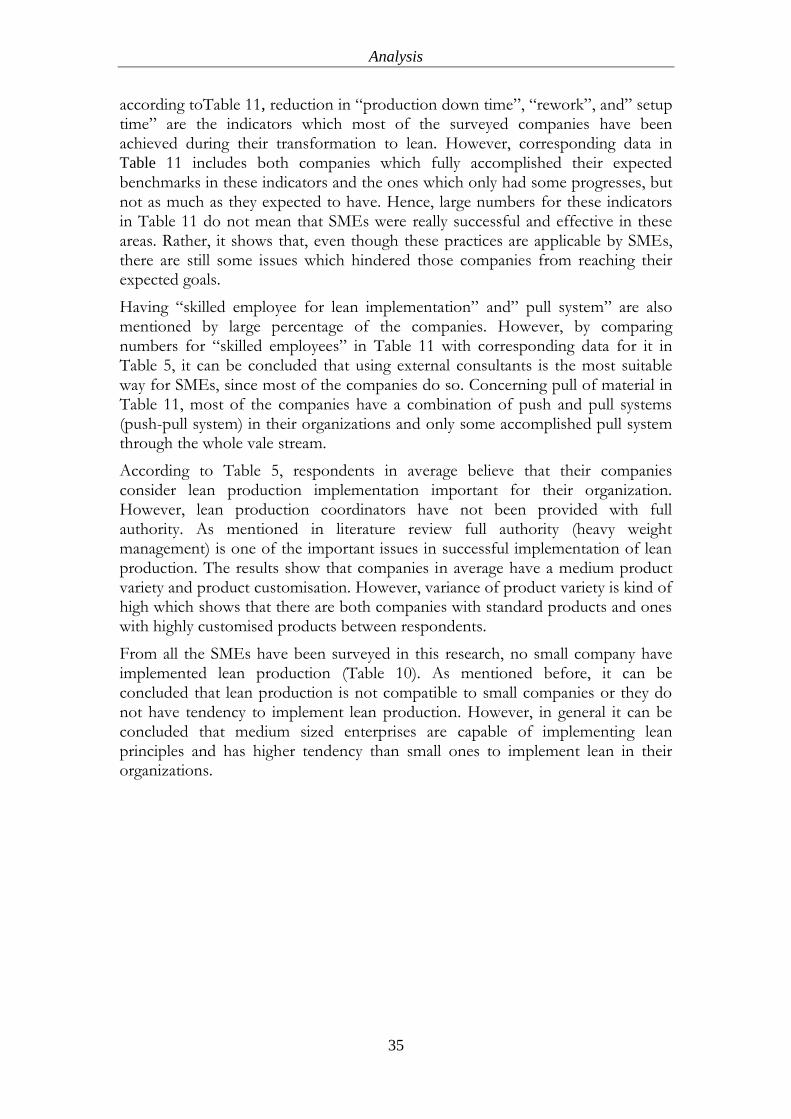
Analysis
35
according toTable 11, reduction in “production down time”, “rework”, and” setup time” are the indicators which most of the surveyed companies have been achieved during their transformation to lean. However, corresponding data in Table 11 includes both companies which fully accomplished their expected benchmarks in these indicators and the ones which only had some progresses, but not as much as they expected to have. Hence, large numbers for these indicators in Table 11 do not mean that SMEs were really successful and effective in these areas. Rather, it shows that, even though these practices are applicable by SMEs, there are still some issues which hindered those companies from reaching their expected goals.
Having “skilled employee for lean implementation” and” pull system” are also mentioned by large percentage of the companies. However, by comparing numbers for “skilled employees” in Table 11 with corresponding data for it in Table 5, it can be concluded that using external consultants is the most suitable way for SMEs, since most of the companies do so. Concerning pull of material in Table 11, most of the companies have a combination of push and pull systems (push-pull system) in their organizations and only some accomplished pull system through the whole vale stream.
According to Table 5, respondents in average believe that their companies consider lean production implementation important for their organization. However, lean production coordinators have not been provided with full authority. As mentioned in literature review full authority (heavy weight management) is one of the important issues in successful implementation of lean production. The results show that companies in average have a medium product variety and product customisation. However, variance of product variety is kind of high which shows that there are both companies with standard products and ones with highly customised products between respondents.
From all the SMEs have been surveyed in this research, no small company have implemented lean production (Table 10). As mentioned before, it can be concluded that lean production is not compatible to small companies or they do not have tendency to implement lean production. However, in general it can be concluded that medium sized enterprises are capable of implementing lean principles and has higher tendency than small ones to implement lean in their organizations.
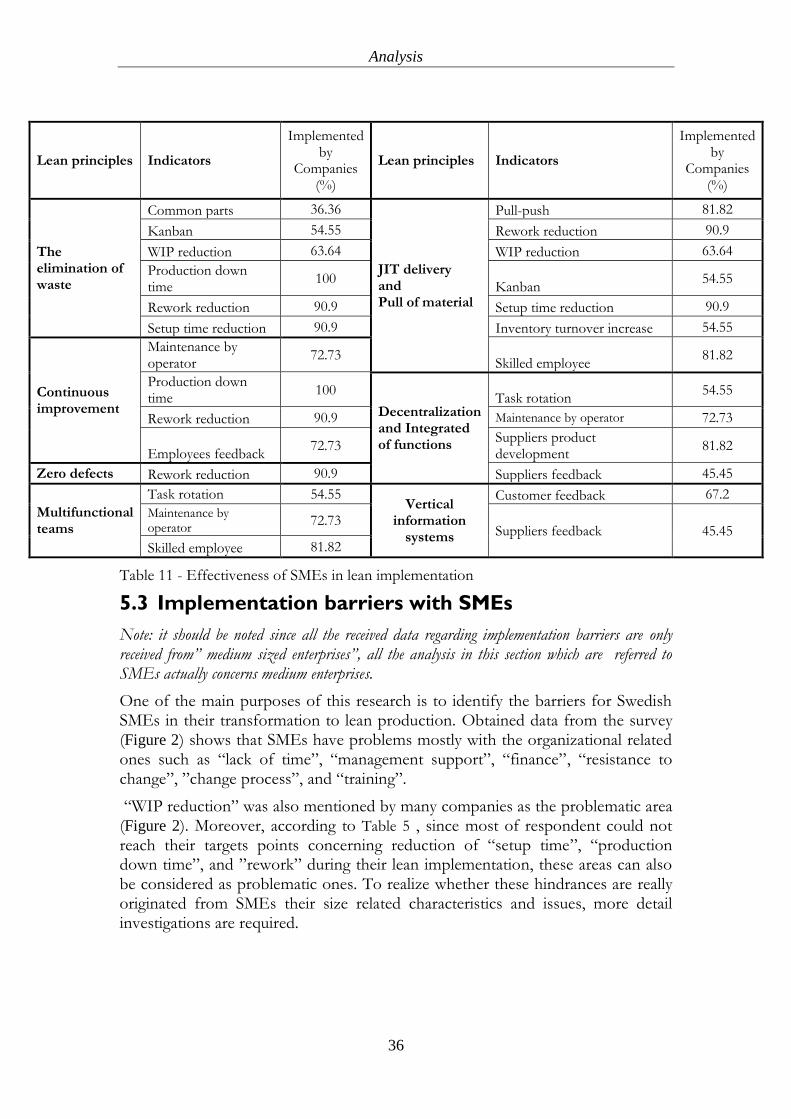
Analysis
36
Lean principles Indicators
Implemented by
Companies (%)
Lean principles Indicators
Implemented by
Companies (%)
The elimination of waste
Common parts 36.36
JIT delivery and Pull of material
Pull-push 81.82
Kanban 54.55 Rework reduction 90.9
WIP reduction 63.64 WIP reduction 63.64
Production down time
100 Kanban
54.55
Rework reduction 90.9 Setup time reduction 90.9
Setup time reduction 90.9 Inventory turnover increase 54.55
Continuous improvement
Maintenance by operator
72.73 Skilled employee
81.82
Production down time
100
Decentralization and Integrated of functions
Task rotation 54.55
Rework reduction 90.9 Maintenance by operator 72.73
Employees feedback 72.73
Suppliers product development
81.82
Zero defects Rework reduction 90.9 Suppliers feedback 45.45
Multifunctional teams
Task rotation 54.55 Vertical
information systems
Customer feedback 67.2
Maintenance by operator
72.73 Suppliers feedback 45.45
Skilled employee 81.82
Table 11 - Effectiveness of SMEs in lean implementation
5.3 Implementation barriers with SMEs
Note: it should be noted since all the received data regarding implementation barriers are only received from” medium sized enterprises”, all the analysis in this section which are referred to SMEs actually concerns medium enterprises.
One of the main purposes of this research is to identify the barriers for Swedish SMEs in their transformation to lean production. Obtained data from the survey (Figure 2) shows that SMEs have problems mostly with the organizational related ones such as “lack of time”, “management support”, “finance”, “resistance to change”, ”change process”, and “training”.
“WIP reduction” was also mentioned by many companies as the problematic area (Figure 2). Moreover, according to Table 5 , since most of respondent could not reach their targets points concerning reduction of “setup time”, “production down time”, and ”rework” during their lean implementation, these areas can also be considered as problematic ones. To realize whether these hindrances are really originated from SMEs their size related characteristics and issues, more detail investigations are required.
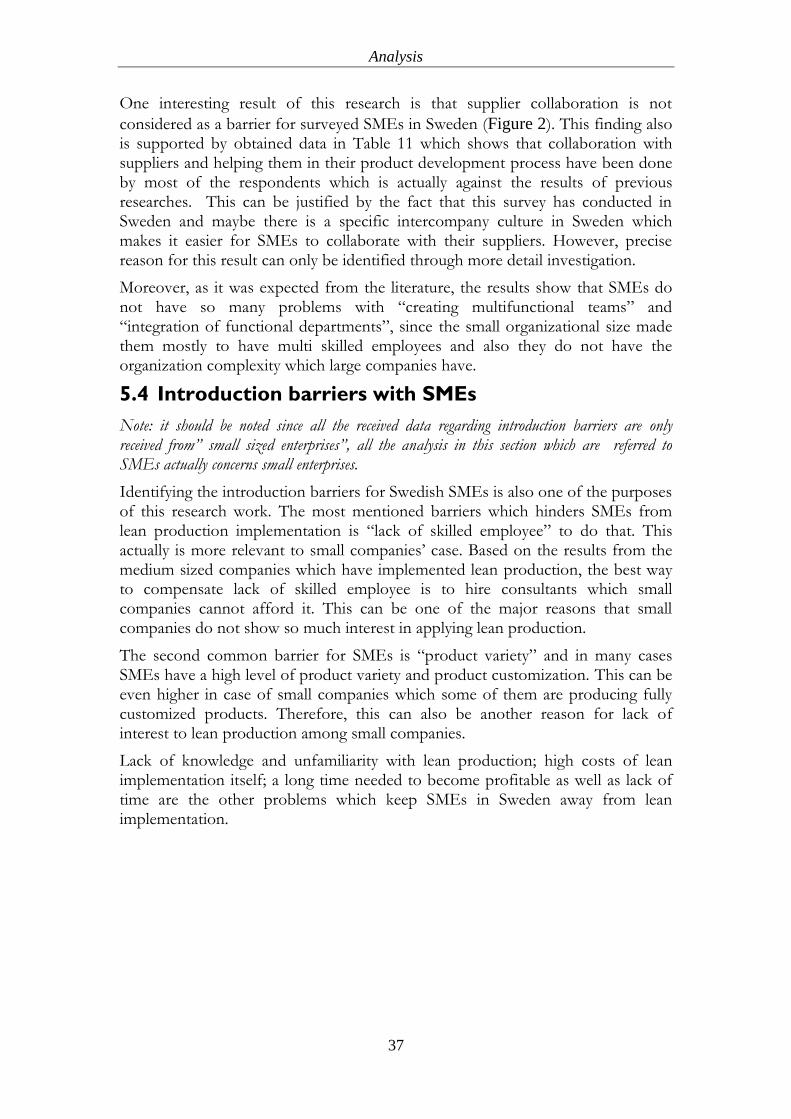
Analysis
37
One interesting result of this research is that supplier collaboration is not
considered as a barrier for surveyed SMEs in Sweden (Figure 2). This finding also is supported by obtained data in Table 11 which shows that collaboration with suppliers and helping them in their product development process have been done by most of the respondents which is actually against the results of previous researches. This can be justified by the fact that this survey has conducted in Sweden and maybe there is a specific intercompany culture in Sweden which makes it easier for SMEs to collaborate with their suppliers. However, precise reason for this result can only be identified through more detail investigation.
Moreover, as it was expected from the literature, the results show that SMEs do not have so many problems with “creating multifunctional teams” and “integration of functional departments”, since the small organizational size made them mostly to have multi skilled employees and also they do not have the organization complexity which large companies have.
5.4 Introduction barriers with SMEs
Note: it should be noted since all the received data regarding introduction barriers are only received from” small sized enterprises”, all the analysis in this section which are referred to SMEs actually concerns small enterprises.
Identifying the introduction barriers for Swedish SMEs is also one of the purposes of this research work. The most mentioned barriers which hinders SMEs from lean production implementation is “lack of skilled employee” to do that. This actually is more relevant to small companies‟ case. Based on the results from the medium sized companies which have implemented lean production, the best way to compensate lack of skilled employee is to hire consultants which small companies cannot afford it. This can be one of the major reasons that small companies do not show so much interest in applying lean production.
The second common barrier for SMEs is “product variety” and in many cases SMEs have a high level of product variety and product customization. This can be even higher in case of small companies which some of them are producing fully customized products. Therefore, this can also be another reason for lack of interest to lean production among small companies.
Lack of knowledge and unfamiliarity with lean production; high costs of lean implementation itself; a long time needed to become profitable as well as lack of time are the other problems which keep SMEs in Sweden away from lean implementation.
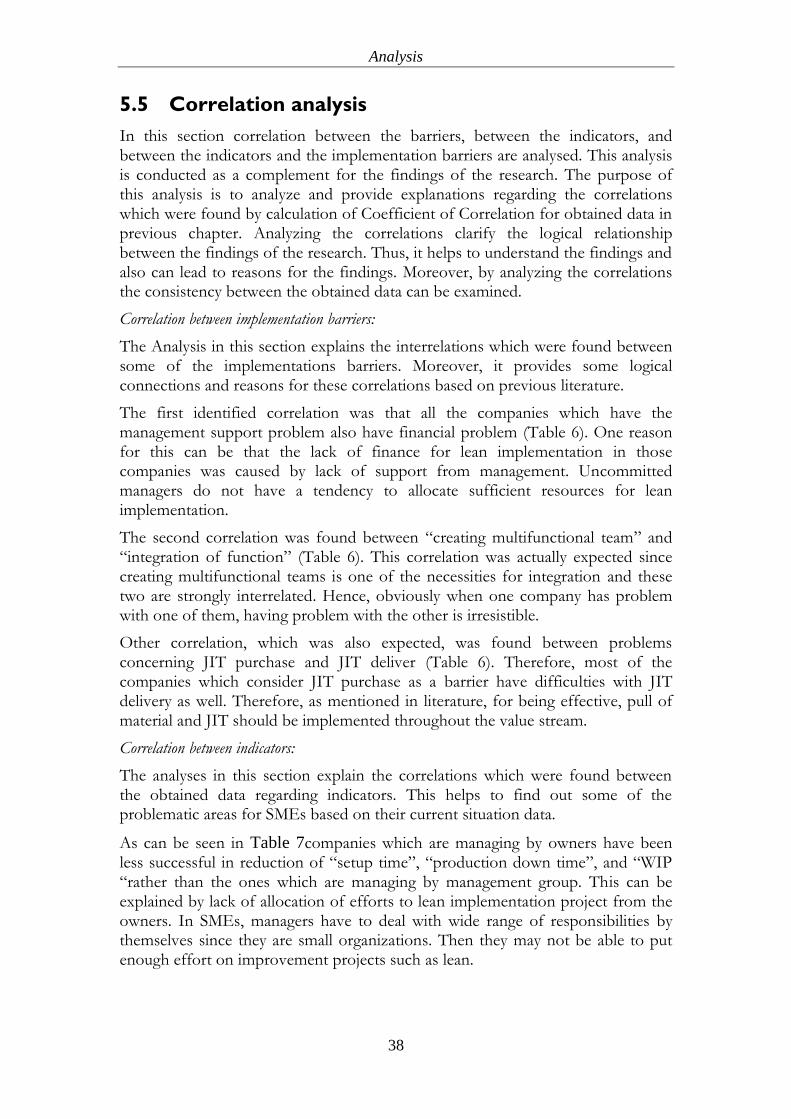
Analysis
38
5.5 Correlation analysis
In this section correlation between the barriers, between the indicators, and between the indicators and the implementation barriers are analysed. This analysis is conducted as a complement for the findings of the research. The purpose of this analysis is to analyze and provide explanations regarding the correlations which were found by calculation of Coefficient of Correlation for obtained data in previous chapter. Analyzing the correlations clarify the logical relationship between the findings of the research. Thus, it helps to understand the findings and also can lead to reasons for the findings. Moreover, by analyzing the correlations the consistency between the obtained data can be examined.
Correlation between implementation barriers:
The Analysis in this section explains the interrelations which were found between some of the implementations barriers. Moreover, it provides some logical connections and reasons for these correlations based on previous literature.
The first identified correlation was that all the companies which have the management support problem also have financial problem (Table 6). One reason for this can be that the lack of finance for lean implementation in those companies was caused by lack of support from management. Uncommitted managers do not have a tendency to allocate sufficient resources for lean implementation.
The second correlation was found between “creating multifunctional team” and “integration of function” (Table 6). This correlation was actually expected since creating multifunctional teams is one of the necessities for integration and these two are strongly interrelated. Hence, obviously when one company has problem with one of them, having problem with the other is irresistible.
Other correlation, which was also expected, was found between problems concerning JIT purchase and JIT deliver (Table 6). Therefore, most of the companies which consider JIT purchase as a barrier have difficulties with JIT delivery as well. Therefore, as mentioned in literature, for being effective, pull of material and JIT should be implemented throughout the value stream.
Correlation between indicators:
The analyses in this section explain the correlations which were found between the obtained data regarding indicators. This helps to find out some of the problematic areas for SMEs based on their current situation data.
As can be seen in Table 7companies which are managing by owners have been less successful in reduction of “setup time”, “production down time”, and “WIP “rather than the ones which are managing by management group. This can be explained by lack of allocation of efforts to lean implementation project from the owners. In SMEs, managers have to deal with wide range of responsibilities by themselves since they are small organizations. Then they may not be able to put enough effort on improvement projects such as lean.
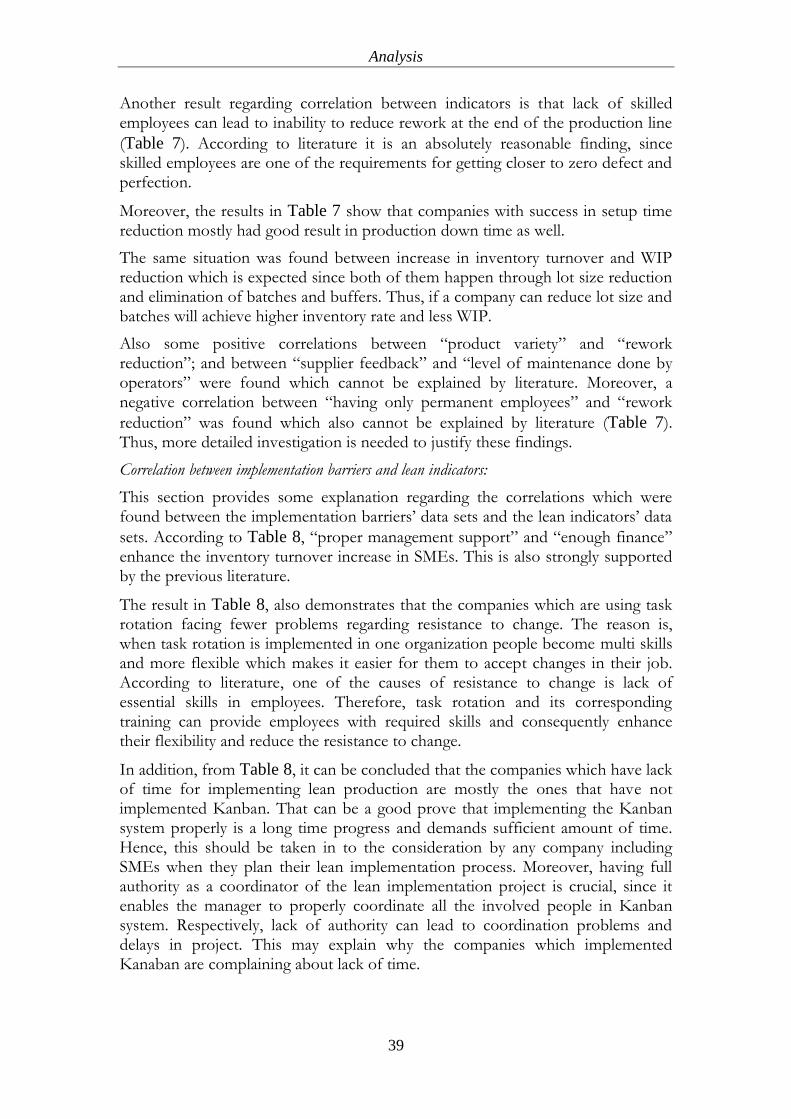
Analysis
39
Another result regarding correlation between indicators is that lack of skilled employees can lead to inability to reduce rework at the end of the production line
(Table 7). According to literature it is an absolutely reasonable finding, since skilled employees are one of the requirements for getting closer to zero defect and perfection.
Moreover, the results in Table 7 show that companies with success in setup time reduction mostly had good result in production down time as well.
The same situation was found between increase in inventory turnover and WIP reduction which is expected since both of them happen through lot size reduction and elimination of batches and buffers. Thus, if a company can reduce lot size and batches will achieve higher inventory rate and less WIP.
Also some positive correlations between “product variety” and “rework reduction”; and between “supplier feedback” and “level of maintenance done by operators” were found which cannot be explained by literature. Moreover, a negative correlation between “having only permanent employees” and “rework
reduction” was found which also cannot be explained by literature (Table 7). Thus, more detailed investigation is needed to justify these findings.
Correlation between implementation barriers and lean indicators:
This section provides some explanation regarding the correlations which were found between the implementation barriers‟ data sets and the lean indicators‟ data
sets. According to Table 8, “proper management support” and “enough finance” enhance the inventory turnover increase in SMEs. This is also strongly supported by the previous literature.
The result in Table 8, also demonstrates that the companies which are using task rotation facing fewer problems regarding resistance to change. The reason is, when task rotation is implemented in one organization people become multi skills and more flexible which makes it easier for them to accept changes in their job. According to literature, one of the causes of resistance to change is lack of essential skills in employees. Therefore, task rotation and its corresponding training can provide employees with required skills and consequently enhance their flexibility and reduce the resistance to change.
In addition, from Table 8, it can be concluded that the companies which have lack of time for implementing lean production are mostly the ones that have not implemented Kanban. That can be a good prove that implementing the Kanban system properly is a long time progress and demands sufficient amount of time. Hence, this should be taken in to the consideration by any company including SMEs when they plan their lean implementation process. Moreover, having full authority as a coordinator of the lean implementation project is crucial, since it enables the manager to properly coordinate all the involved people in Kanban system. Respectively, lack of authority can lead to coordination problems and delays in project. This may explain why the companies which implemented Kanaban are complaining about lack of time.
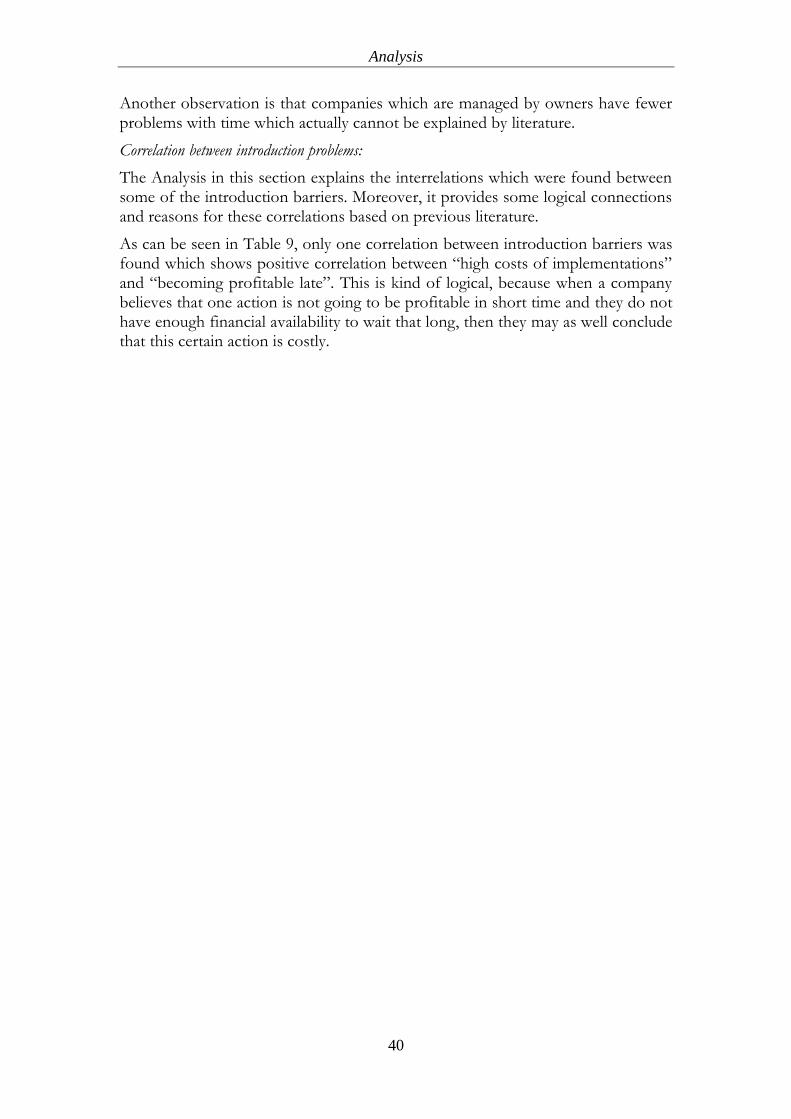
Analysis
40
Another observation is that companies which are managed by owners have fewer problems with time which actually cannot be explained by literature.
Correlation between introduction problems:
The Analysis in this section explains the interrelations which were found between some of the introduction barriers. Moreover, it provides some logical connections and reasons for these correlations based on previous literature.
As can be seen in Table 9, only one correlation between introduction barriers was found which shows positive correlation between “high costs of implementations” and “becoming profitable late”. This is kind of logical, because when a company believes that one action is not going to be profitable in short time and they do not have enough financial availability to wait that long, then they may as well conclude that this certain action is costly.
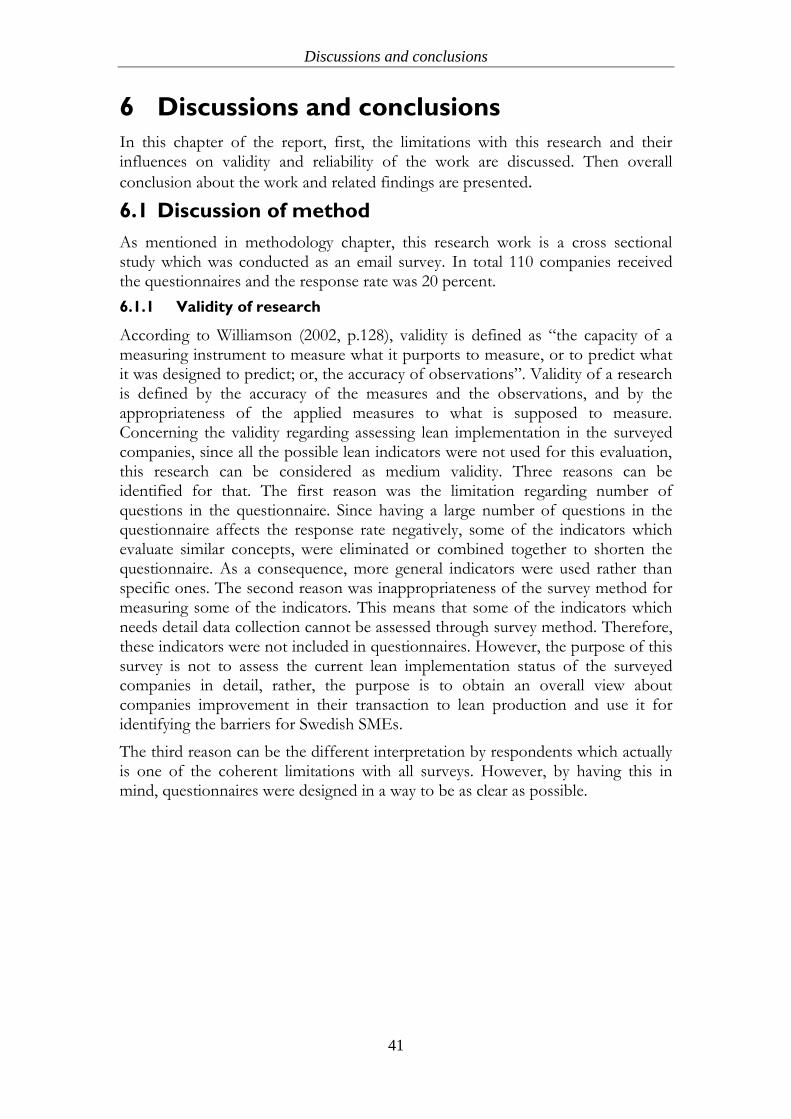
Discussions and conclusions
41
6 Discussions and conclusions
In this chapter of the report, first, the limitations with this research and their influences on validity and reliability of the work are discussed. Then overall
conclusion about the work and related findings are presented.
6.1 Discussion of method
As mentioned in methodology chapter, this research work is a cross sectional study which was conducted as an email survey. In total 110 companies received the questionnaires and the response rate was 20 percent.
6.1.1 Validity of research
According to Williamson (2002, p.128), validity is defined as “the capacity of a measuring instrument to measure what it purports to measure, or to predict what it was designed to predict; or, the accuracy of observations”. Validity of a research is defined by the accuracy of the measures and the observations, and by the appropriateness of the applied measures to what is supposed to measure. Concerning the validity regarding assessing lean implementation in the surveyed companies, since all the possible lean indicators were not used for this evaluation, this research can be considered as medium validity. Three reasons can be identified for that. The first reason was the limitation regarding number of questions in the questionnaire. Since having a large number of questions in the questionnaire affects the response rate negatively, some of the indicators which evaluate similar concepts, were eliminated or combined together to shorten the questionnaire. As a consequence, more general indicators were used rather than specific ones. The second reason was inappropriateness of the survey method for measuring some of the indicators. This means that some of the indicators which needs detail data collection cannot be assessed through survey method. Therefore, these indicators were not included in questionnaires. However, the purpose of this survey is not to assess the current lean implementation status of the surveyed companies in detail, rather, the purpose is to obtain an overall view about companies improvement in their transaction to lean production and use it for identifying the barriers for Swedish SMEs.
The third reason can be the different interpretation by respondents which actually is one of the coherent limitations with all surveys. However, by having this in mind, questionnaires were designed in a way to be as clear as possible.
Discussions and conclusions
42
6.1.2 Reliability of research
According to Williamson (2002, p.128) reliability is defined as ”the stability, consistency and dependability of measures” which implies that the research and its method should be in a way that if someone else try it more times, the same result should be achieved. Accordingly, the reliability of this research was affected by small sample sizes (low response rates) which affect the accuracy of obtained results. This means that if this research work will be implemented in a same way but with more effective approaches concerning attracting respondents, it may result in not exactly the same results as this work. However, gathering more responses needs more effective approaches to motivate the respondents rather than only promising them to share the result with them. This was out of the power and potential of the author (as a student) to offer more interesting and effective motives. Consequently reliability of this research is not high.
Moreover, since all the responses which have implemented lean production were only from medium sized companies, no rigid conclusion can be made about small companies in this part, except that they do not have so much tendency to lean production. This is one of the areas which demands further detail investigation.
Responses regarding the companies which have not implemented lean have the same situation. In this case, all the respondents are small companies, so no concrete conclusion can be made about medium companies concerning introduction barriers and more detail future research is needed to be able to generalize the results of this part for medium sized enterprises as well.
6.1.3 Findings
As mentioned since the reliability of this research is not high, generalization for all Swedish SMEs based on the findings of this research may not be appropriate. However, since 22 Swedish SMEs were surveyed the result of this research can provide a good perspective about the tendency of Swedish SMEs to implementation of lean production and their problems in the path to becoming lean. Moreover, this research can be considered as the first step for more detailed researches in future which the findings of this research can be used as their guide line. Therefore, more focused surveys (with high validity) can be designed and be conducted with stronger authority to offer more interesting motives to achieve higher reliability.
6.2 Conclusion
The first conclusion from this survey study was that almost all the lean production principles are applicable by medium sized companies. However, as results show, small companies do not have the tendency to implement lean and that is not because they do not want or do not know about lean production advantages, rather it is because they cannot do that. The lack of skilled employees is concluded as the most hindering barrier for small companies. Since they are small, they are not able to have or train a lean specialist inside their organization. On the other hand the solution with external consultants; which is mostly used by medium sized companies, is not an option for the small companies, since they cannot afford it. Moreover, many of the small companies are producing customized products
Discussions and conclusions
43
which make it hard for them to standardize their products by creating product families. Hence implementing lean production may not really be beneficial for them.
Concerning the companies which already have implemented lean, Most of them believed that lean production is considered important for their companies. However, project managers are not provided with sufficient authority and executive power. Obtained results showed that almost all of them were successful to reduced production down time, rework, setup time, and WIP, and increase inventory turnover by implementing lean production in their organization.
The findings of this research regarding implementation barriers show that , “lack of time”, “lack of management support”, “lack of finance ”,“ resistance to change”, “change process”, and “training” are the most common barriers for the surveyed Swedish SMEs. However, it should be mentioned that these barriers only valid for the medium sized enterprises.
6.3 Further research
This research work was mainly intended to identify problematic areas concerning lean production transformation for SMEs as well as the tendency of Swedish SMEs to apply lean production. Moreover, the purpose is not to go deep in each of the identified barriers, rather, the purpose is to just identify the barriers for SMEs and prepare the foundation for future research to analyze the barriers in depth. Therefore, more detail investigations are needed to define the root causes of these barriers.
One of the results of this research is that almost all the lean principles are applicable at medium sized enterprises. However even though they implemented all the lean‟s principles, they could not go as far as they expected in implementation of these principles. Therefore, this area also can be the subject for future researches.
During analysis some contradictions with the findings of the previous literature were found. As mentioned in analysis part, these cases of contradictions need more detailed researches to finding an explanation for them.
Moreover, implementing a research in the same methodology as this research but by possibility of applying more effective approaches to motivate the respondents can be an option for future research. This can increase response rate and ultimately reliability of the work.
According to obtained result in this research, the small companies have almost no tendency to implement lean production. This can be by itself a topic for future research works to examine the correctness of this result through extensive and detail investigations. Then if it confirms this research‟s results, the causes and the possible solutions should be investigated.

Discussions and conclusions
44
References
45
7 References
Abdul-Nour, G. ; Lambert, S. ; Drolet, J. (1998), Adaptation of JIT philosophy and technique to a small-sized manufacturing firms; A project management approach", Computers and Industrial Engineering, Vol. 35, No. 3, pp. 419-422.
Achanga, P.; Shehab, E.; Roy, R.; Nelder, G. (2006),"Critical success factors for lean implementation within SMEs", Journal of Manufacturing Technology Management, Vol. 17 No. 4, pp. 460-471.
Ahmed, N.U., Tun, E.A.c; Montagno, R.V. (1991), "A comparative study of U.S. manufacturing firms at various stages of just-in- time implementation", International Journal of Production Research, Vol. 29, pp. 787-802.
Antony, J.; Banuelas, R. (2001), “A strategy for survival”, Manufacturing Engineer, Vol. 80 No. 3, pp. 119-21.
Bamber,C.J.; Sharp, J.M.; Hides, M.T. (1999), "Factors affecting successful implementation of total productive maintenance: A UK manufacturing case study perspective", Journal of Quality in Maintenance Engineering, Vol. 5 No. 3, pp. 162-181.
Bandyopadhyay, J.K.; Jayaram, M. J. (1995), "Implementing just-in- time production and procurement strategies", International Journal of Operations and Production Management, Vol. 12 No.1, pp. 83-90.
Chong, S. (2007), "Business process management for SMEs: an exploratory study of implementation factors for the Australian wine industry", Journal of Information Systems and Small Business Chong, vol. 1, no. 1-2, pp. 41-58.
Coronado, R.B. and Antony, J. (2002), “Critical success factors for the successful implementation of six sigma projects in organizations”, The TQM Magazine, Vol. 14 No. 2, pp. 92-9.
Cusumano, M. (1994), "The limits of lean", Sloan Management Review, Vol. 35 No. 4, pp. 27-32.
Davis, R. (1997), „„Making TPM a part of factory life‟‟, TPM Experience (Project EU 1190, Sponsored by the DTI), Findlay.
Dominguez, J. (1995), Direccion de operaciones - aspectos estrategicos en la produccion y los servicios, McGrew-Hill, Madrid.
Dyer, J. (1994), "dedicated assets: Japan's manufacturing edge", Harvard Business Review, Vol. 72 No. 6, pp.174-178.
Dyer, J. (1996), "Specialized supplier network as a source of competitive advantage: evidence from the auto industry", Strategic Managemnt Journal, Vol. 17 No.3, pp. 271-291.
Eckes, G. (2000), The Six Sigma Revolution, Wiley, New York, NY.
European commission (1996), "96/280/EC: Commission Recommendation of 3 April 1996 concerning the definition of small and medium-sized enterprises", Official Journal of the European Union, L 107, p. 4-9
References
46
European commission (2003), "2003/361/EC: Commission Recommendation of 6 May 2003 concerning the definition of micro, small and medium-sized enterprises", Official Journal of the European Union, L 124, p. 36-41
European Commission (2005), SME country fact sheet for Sweden. Available at:<
http://ec.europa.eu/enterprise/policies/sme/files/craft/sme_perf_review/doc_08/spr08_
fact_sheet_se_en.pdf> [Accessed 21 July 2011].
Ferdows, K.; De Meyer, A. (1990), "Lasting improvements in manufacturing performance: in search of a new theory", Journal of Operations Management, Vol. 3, pp. 168–184.
Filippini, R., Forza, C. and Vinelli, A. (1998), "Sequences of improvement in operations", International Journal of Operations and Production Management, Vol. 18, p. 2.
Forza, C. (1996), "Work Organization in lean production and traditional plants, what are the differences?", International journal of Operation and Management, Vol. 16 No. 2, pp. 42-62.
Forrester, P.L.; Hassard, J.S. ; Lilley, S. (1996), "Pulling it together and pushing it out: people and practices in 'post-modern' production", Proceeding of 2nd International Managing Innovative Manufacturing Conference, Licester.
Germain, R.; Droge, C. (1997), "An empirical study of the impact of just-in-time task scope versus just-in-time workflow integration on organizational design", Decision Sciences, Vol. 28 No. 3, pp. 615-635.
Gilbert, J.P. (1990), "The state of JIT implementation and development in the USA",
International Journal of Production Research, Vol. 28, pp.1099-1109.
Gilmore, M.; Smith, D. (1996), "Set-up reduction in pharmaceutical manufacturing in an action research study", International journal of Operation and Management, Vol. 16 No. 3, pp. 4-17.
Harrison, T. P., Lee, H. L. and Neale, J. J. (2003), The practice of supply chain management: where theory and application converge, Kluwer Academic Publisher, Massachusetts.
Hayes, B.J. (2000), “Assessing for lean six sigma implementation and success”, Six Sigma
Advantage.
Hayes, R.H. and Clark, K.B. (1986), “Why some factories are more productive than others”, Harvard Business Review, pp. 66-73.
Hayes, R.H.; Wheelwright, S.C.; Clark, K.B. (1988), Dynamic Manufacturing: Creating the Learning Organization, Free Press, New York.
Helms, M.M.; Thibadoux, G.M. ; Haynes, P.J.; Pauley, P.(1990), "Meeting the human resource challenges of JIT through management development", Journal of Management Development, Vol. 9 No. 3, pp. 28-34.

References
47
Henderson, K. and Evans, J. (2000), “Successful implementation of six sigma: benchmarking general electric company”, Benchmarking: An International Journal, Vol. 7 No. 4, pp. 260-81.
Im, J.H.; Lee, S.M. (1989), "Implementation of just-in-time systems in U.S. manufacturing firms", International Journal of Operations and Production Management, Vol. 9 No. 1, pp. 5-14.
Isa, K. and Tsuru, T. (2002), "Cell Production and Workplace Innovation in Japan: Toward a New Model for Japanese Manufacturing?", Industrial Relations, Vol. 41, No. 4, pp. 548-578.
Karlsson, Ch.; Åhlström, P. (1996a), "Assessing change towards lean production", International Journal of Operations & Production Management, Vol. 16 No. 2, pp. 24-41.
Karlsson, Ch.; Åhlström, P. (1996b), "Change processes towards lean production; The role of the management accounting system", International Journal of Operations & Production Management, Vol. 16 No. 11, pp. 42-56.
Lee, S.M.; Ebrahimpour, M. (1984), "Just-in-time production system: some requirements for implementation", International Journal of Operations and Production Management, Vol. 4 No. 4, pp. 3-15.
Lewis, M.A. (2000), "Lean production and sustainable competitive advantage", International Journal of Operations & Production Management, Vol. 20 No. 8, pp. 959-978.
Maskell, B. H. (1994), New Performance Measures, Productivity Press, Cambridge, MA.
McLachlin, R. (1997), "Management initiatives and just-in-time manufacturing", Journal of Operations Management, Vol. 15 No. 4, pp.271-292.
Monden, Y. (1983), Toyota Production System – Practical Approach to Production Management, Industrial Engineering and Management Press, Atlanta, GA.
Oakland, J. (1993), Total Quality Management: The Route to Improving Performance, Butterworth-Heinemann, Oxford.
Richard E. White, John N. Pearson, Jeffrey R. Wilson (1999), "A Survey of Implementations in Small and Large U.S. Manufacturers", Management Science, Vol. 45 No. 1, pp. 1-15
Roos, L.-U. (1990) "Japanisering inom produktionssystem: Några fallstudier av Total Quality Management i brittisk tillverkningsindustri , (Japanisation in Production Systems: Some Case Studies of Total Quality Management in British Manufacturing Industry. in Swedish)", Handelshögskolan vid Göteborgs Universitet, Göteborg.
Safayeni, F.; Purdy, L. ; Engelen, R. V. ; Pal, S. (1991), "Difficulties of Just-in-Time Implementation: A Classification Scheme", International Journal of Operations & Production Management, Vol.11 No. 7, pp. 27-36.
References
48
Salaheldin, S.I. (2005), "JIT implementation in Egyptian manufacturing firms: some empirical evidence", International Journal of Operations & Production Management, Vol. 25 No. 4, pp. 354-370
Sanchez, A.M. ; Perez, M.P. (2001), "Lean indicators and manufacturing strategies", International Journal of operation & Production Management; Vol.21 No. 11, pp. 1433-1451, © MCB University Press, 0144-3577.
Shah, R. and Ward, P.T. (2003),"Lean manufacturing: context, practice bundles, and performance", Journal of Operations Management, Vol 21 No.3, pp. 129-149.
Shen, C.H. and Wacker, J. (1997), "The effects of purchased parts commonality on manufacturing lead time", International journal of Operation and Management, Vol. 16 No.4, pp.88-111.
Simchi-Levi, D., P., Kaminsky, E., Simchi-Levi (2008), Design and Managing the Supply Chain: Concepts, Strategies and Case Studies, 3rd edition, McGraw-Hill/Irwin.
Shingo, S. (1981), A Study of the Toyota Production System from an Industrial Engineering
Viewpoint, Productivity Press, Cambridge, MA.
Shingo, S. (1990), Tecnologias para el cero defectos, Productivity Press, Cambridge, MA.
Spenley, P. (1992), World Class Performance Through Total Quality, Chapman and Hall, London.
Sriparavastu, L. and Gupa, T. (1997), "An emperical study of just-in-time and total quality management principle implementation in manufacturing firms in the USA", International Journal of Operation & Production Management, Vol.17 No. 12, pp. 1215-1232.
Suzuki, T. (1995), TPM en industrias de proceso, TPG-Hoshin, Madrid.
Tenner, A.R. and DeToro, I.J. (1992), Total Quality Management: Three Steps to Continuous Improvement, Addison-Wesley Publishing Co, Reading, MA.
White, R. W.; Pearson, J. N. ; Wilson, J. W. (1999), "A Survey of Implementations in Small and Large U.S. Manufacturers", Management Science, Vol. 45, No. 1 , pp. 1-15.
Williamson, K. (2002) Research methods for students, academics and professionals :information management and systems, Centre for Information Studies, Charles Sturt University, Wagga Wagga, Australia, ISBN 1876938420
Wilson, M.M.J.; Roy, R.N. (2009), "Enabling lean procurement: a consolidation model for small- and medium-sized enterprises", Journal of Manufacturing Technology Management, Vol. 20 No. 6, pp. 817-833.
Womack, J. P.; Jones, D. T.; Roos, D. (1990), The machine that changed the world, Rawson Associates, New York, USA, ISBN 0892563508
Womack, J.P.; Jones, D. T. (2003), Lean Thinking: Banish Waste and Create Wealth in Your Corporation, Free Press, ISBN 9780743249270
Åhlström, P., (1998), "Sequences in the implementation of lean production",
European Management Journal, Vol. 16 No. 3, pp.327-334.

Search words
49

References
50
Appendices
51
8 Appendices
Appendix 1
Questionnaire form 1: concerning companies which implemented lean
Appendix 2
Questionnaire form 2: concerning companies which have not implemented lean
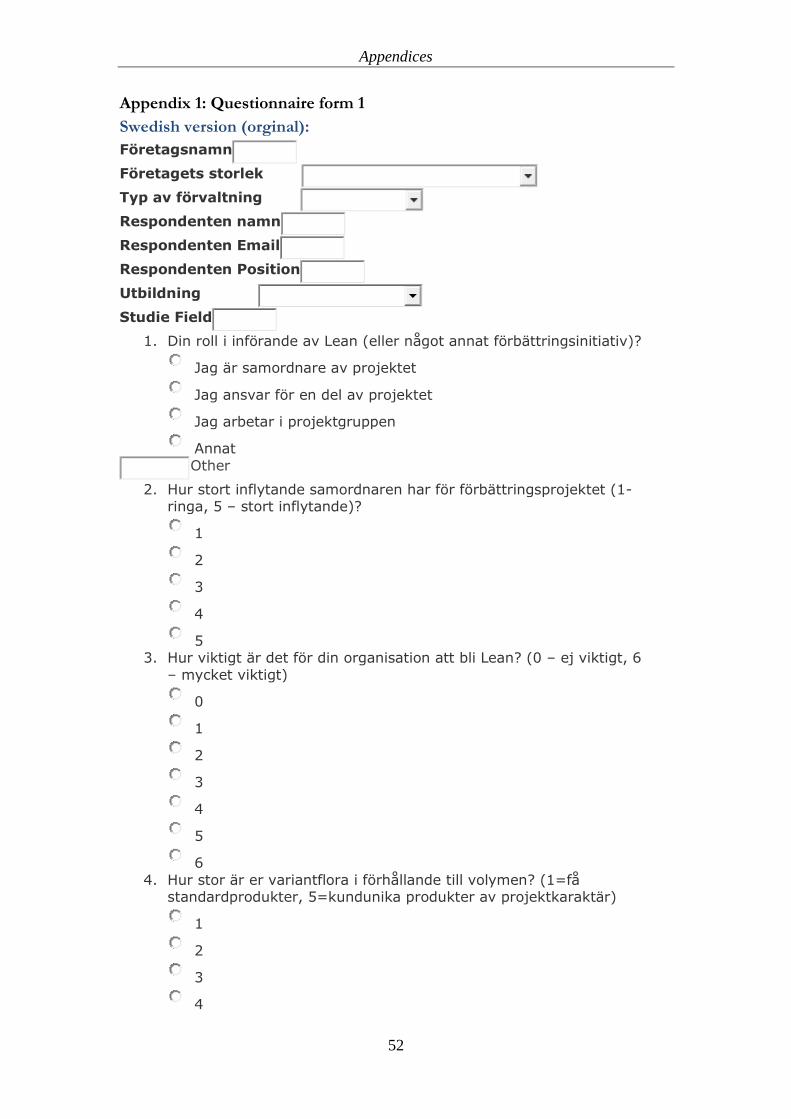
Appendices
52
Appendix 1: Questionnaire form 1
Swedish version (orginal):
Företagsnamn
Företagets storlek
Typ av förvaltning
Respondenten namn
Respondenten Email
Respondenten Position
Utbildning
Studie Field
1. Din roll i införande av Lean (eller något annat förbättringsinitiativ)?
Jag är samordnare av projektet
Jag ansvar för en del av projektet
Jag arbetar i projektgruppen
Annat
Other
2. Hur stort inflytande samordnaren har för förbättringsprojektet (1-ringa, 5 – stort inflytande)?
1
2
3
4
5 3. Hur viktigt är det för din organisation att bli Lean? (0 – ej viktigt, 6
– mycket viktigt)
0
1
2
3
4
5
6
4. Hur stor är er variantflora i förhållande till volymen? (1=få standardprodukter, 5=kundunika produkter av projektkaraktär)
1
2
3
4
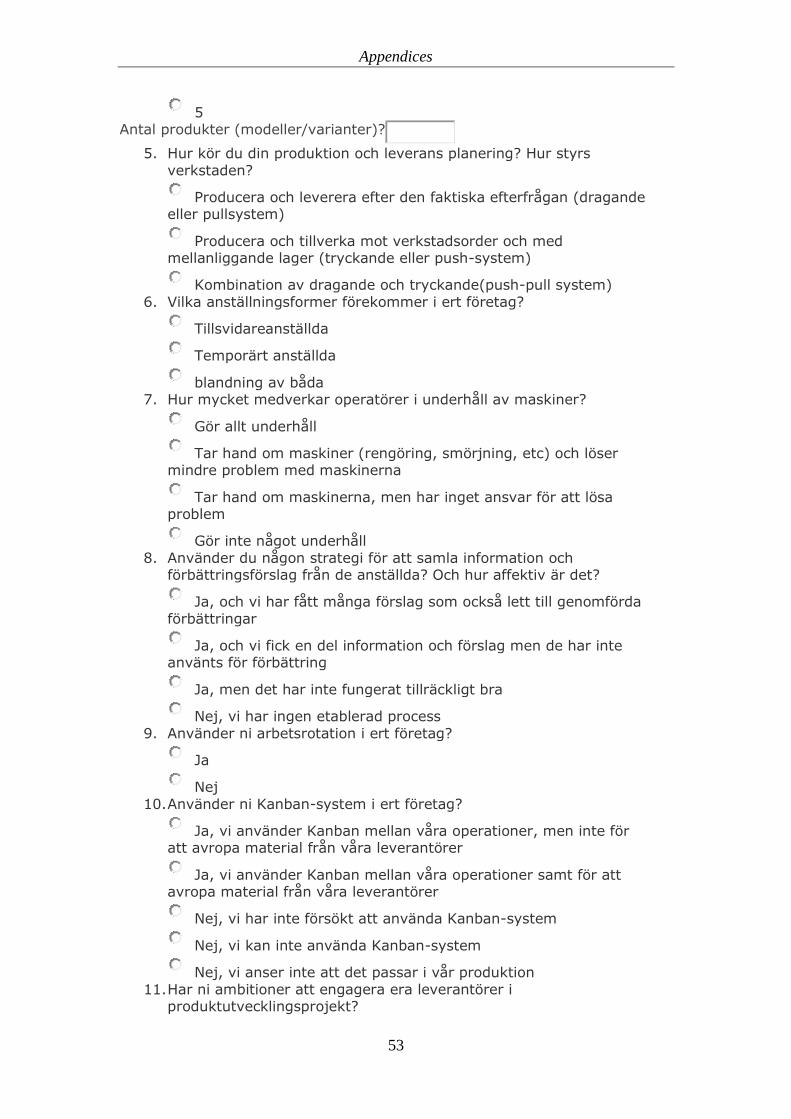
Appendices
53
5 Antal produkter (modeller/varianter)?
5. Hur kör du din produktion och leverans planering? Hur styrs
verkstaden?
Producera och leverera efter den faktiska efterfrågan (dragande eller pullsystem)
Producera och tillverka mot verkstadsorder och med mellanliggande lager (tryckande eller push-system)
Kombination av dragande och tryckande(push-pull system)
6. Vilka anställningsformer förekommer i ert företag?
Tillsvidareanställda
Temporärt anställda
blandning av båda 7. Hur mycket medverkar operatörer i underhåll av maskiner?
Gör allt underhåll
Tar hand om maskiner (rengöring, smörjning, etc) och löser mindre problem med maskinerna
Tar hand om maskinerna, men har inget ansvar för att lösa problem
Gör inte något underhåll
8. Använder du någon strategi för att samla information och förbättringsförslag från de anställda? Och hur affektiv är det?
Ja, och vi har fått många förslag som också lett till genomförda
förbättringar
Ja, och vi fick en del information och förslag men de har inte använts för förbättring
Ja, men det har inte fungerat tillräckligt bra
Nej, vi har ingen etablerad process
9. Använder ni arbetsrotation i ert företag?
Ja
Nej
10. Använder ni Kanban-system i ert företag?
Ja, vi använder Kanban mellan våra operationer, men inte för att avropa material från våra leverantörer
Ja, vi använder Kanban mellan våra operationer samt för att avropa material från våra leverantörer
Nej, vi har inte försökt att använda Kanban-system
Nej, vi kan inte använda Kanban-system
Nej, vi anser inte att det passar i vår produktion
11. Har ni ambitioner att engagera era leverantörer i produktutvecklingsprojekt?
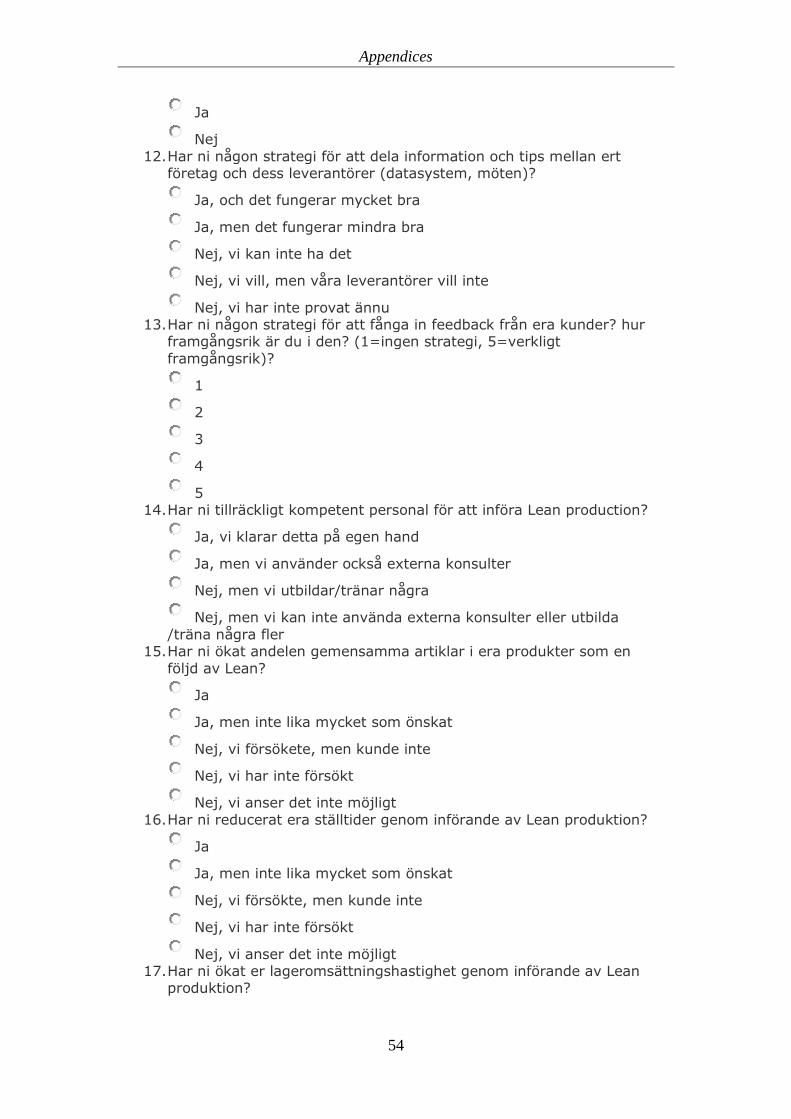
Appendices
54
Ja
Nej
12. Har ni någon strategi för att dela information och tips mellan ert företag och dess leverantörer (datasystem, möten)?
Ja, och det fungerar mycket bra
Ja, men det fungerar mindra bra
Nej, vi kan inte ha det
Nej, vi vill, men våra leverantörer vill inte
Nej, vi har inte provat ännu 13. Har ni någon strategi för att fånga in feedback från era kunder? hur
framgångsrik är du i den? (1=ingen strategi, 5=verkligt
framgångsrik)?
1
2
3
4
5 14. Har ni tillräckligt kompetent personal för att införa Lean production?
Ja, vi klarar detta på egen hand
Ja, men vi använder också externa konsulter
Nej, men vi utbildar/tränar några
Nej, men vi kan inte använda externa konsulter eller utbilda
/träna några fler 15. Har ni ökat andelen gemensamma artiklar i era produkter som en
följd av Lean?
Ja
Ja, men inte lika mycket som önskat
Nej, vi försökete, men kunde inte
Nej, vi har inte försökt
Nej, vi anser det inte möjligt
16. Har ni reducerat era ställtider genom införande av Lean produktion?
Ja
Ja, men inte lika mycket som önskat
Nej, vi försökte, men kunde inte
Nej, vi har inte försökt
Nej, vi anser det inte möjligt 17. Har ni ökat er lageromsättningshastighet genom införande av Lean
produktion?
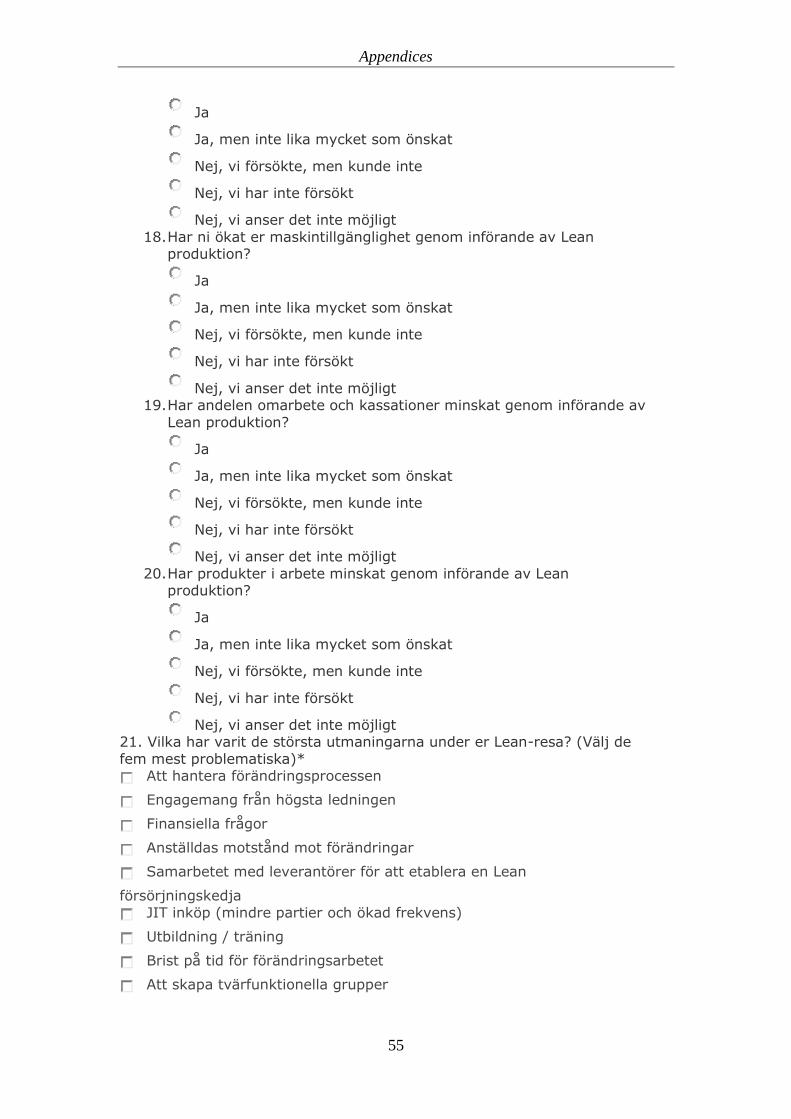
Appendices
55
Ja
Ja, men inte lika mycket som önskat
Nej, vi försökte, men kunde inte
Nej, vi har inte försökt
Nej, vi anser det inte möjligt
18. Har ni ökat er maskintillgänglighet genom införande av Lean produktion?
Ja
Ja, men inte lika mycket som önskat
Nej, vi försökte, men kunde inte
Nej, vi har inte försökt
Nej, vi anser det inte möjligt 19. Har andelen omarbete och kassationer minskat genom införande av
Lean produktion?
Ja
Ja, men inte lika mycket som önskat
Nej, vi försökte, men kunde inte
Nej, vi har inte försökt
Nej, vi anser det inte möjligt
20. Har produkter i arbete minskat genom införande av Lean produktion?
Ja
Ja, men inte lika mycket som önskat
Nej, vi försökte, men kunde inte
Nej, vi har inte försökt
Nej, vi anser det inte möjligt 21. Vilka har varit de största utmaningarna under er Lean-resa? (Välj de
fem mest problematiska)* Att hantera förändringsprocessen
Engagemang från högsta ledningen
Finansiella frågor
Anställdas motstånd mot förändringar
Samarbetet med leverantörer för att etablera en Lean
försörjningskedja
JIT inköp (mindre partier och ökad frekvens)
Utbildning / träning
Brist på tid för förändringsarbetet
Att skapa tvärfunktionella grupper
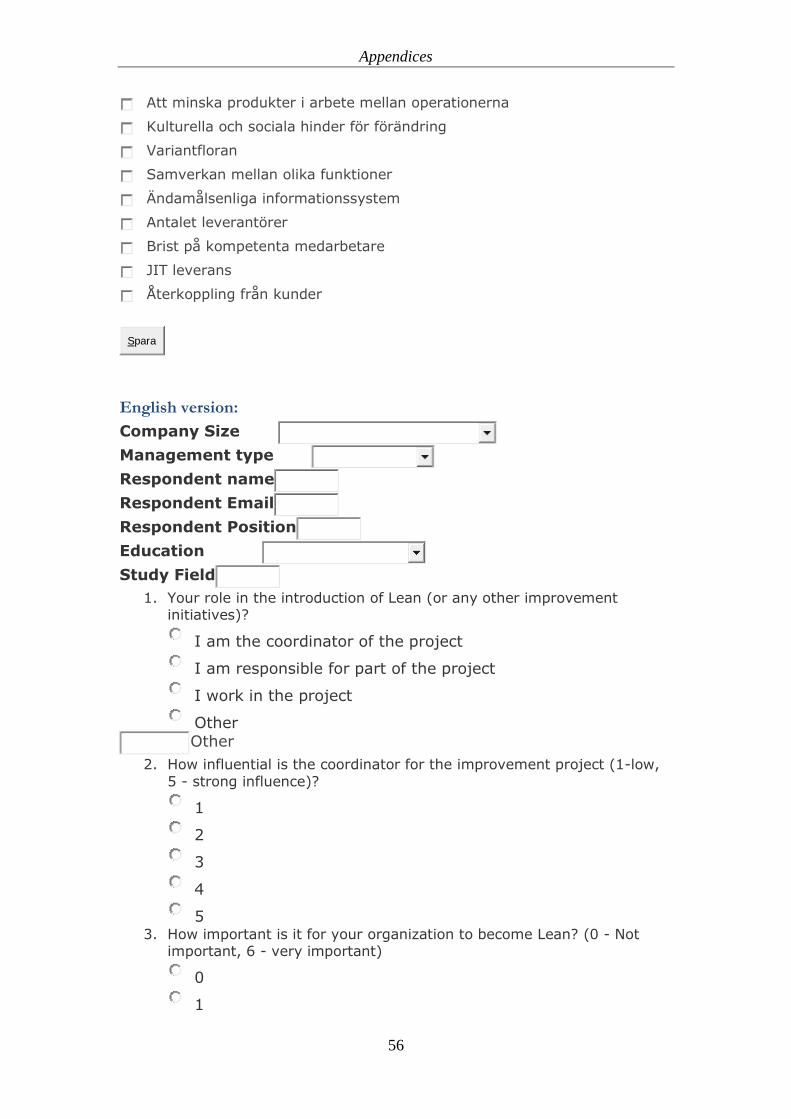
Appendices
56
Att minska produkter i arbete mellan operationerna
Kulturella och sociala hinder för förändring
Variantfloran
Samverkan mellan olika funktioner
Ändamålsenliga informationssystem
Antalet leverantörer
Brist på kompetenta medarbetare
JIT leverans
Återkoppling från kunder
Spara
English version:
Company Size
Management type
Respondent name
Respondent Email
Respondent Position
Education
Study Field
1. Your role in the introduction of Lean (or any other improvement initiatives)?
I am the coordinator of the project
I am responsible for part of the project
I work in the project
Other
Other
2. How influential is the coordinator for the improvement project (1-low,
5 - strong influence)?
1
2
3
4
5 3. How important is it for your organization to become Lean? (0 - Not
important, 6 - very important)
0
1
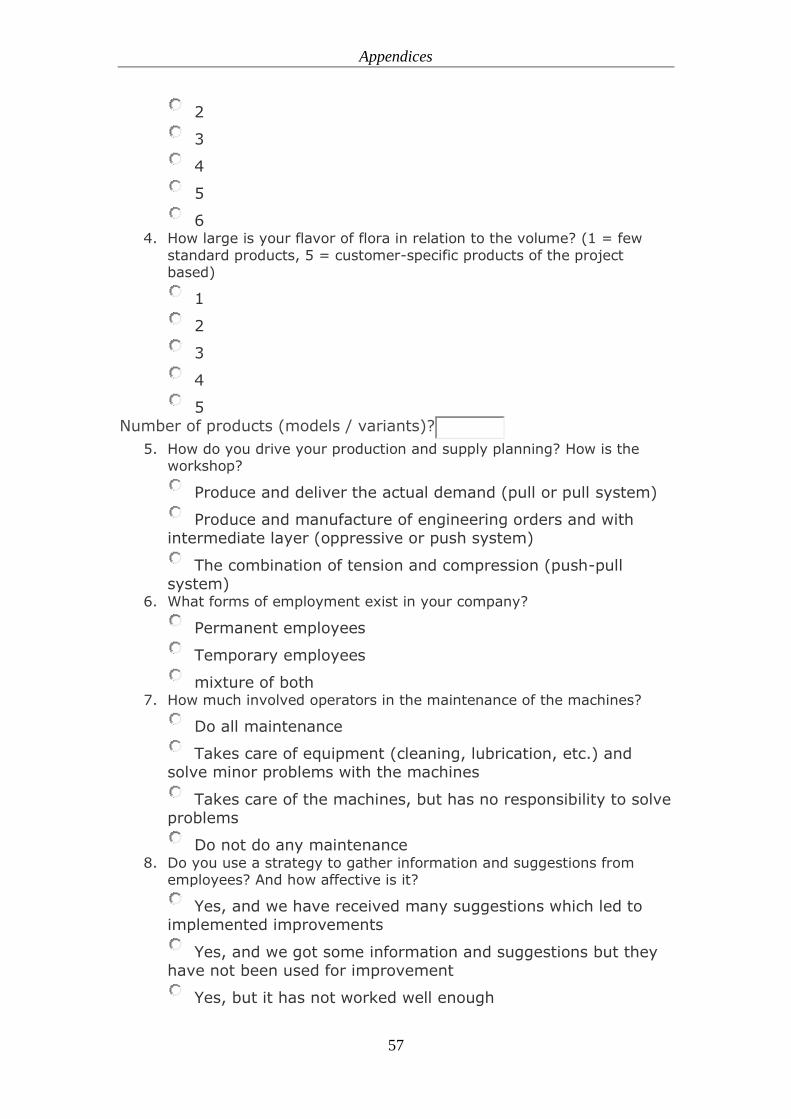
Appendices
57
2
3
4
5
6 4. How large is your flavor of flora in relation to the volume? (1 = few
standard products, 5 = customer-specific products of the project based)
1
2
3
4
5
Number of products (models / variants)?
5. How do you drive your production and supply planning? How is the workshop?
Produce and deliver the actual demand (pull or pull system)
Produce and manufacture of engineering orders and with intermediate layer (oppressive or push system)
The combination of tension and compression (push-pull system)
6. What forms of employment exist in your company?
Permanent employees
Temporary employees
mixture of both 7. How much involved operators in the maintenance of the machines?
Do all maintenance
Takes care of equipment (cleaning, lubrication, etc.) and solve minor problems with the machines
Takes care of the machines, but has no responsibility to solve problems
Do not do any maintenance 8. Do you use a strategy to gather information and suggestions from
employees? And how affective is it?
Yes, and we have received many suggestions which led to implemented improvements
Yes, and we got some information and suggestions but they have not been used for improvement
Yes, but it has not worked well enough
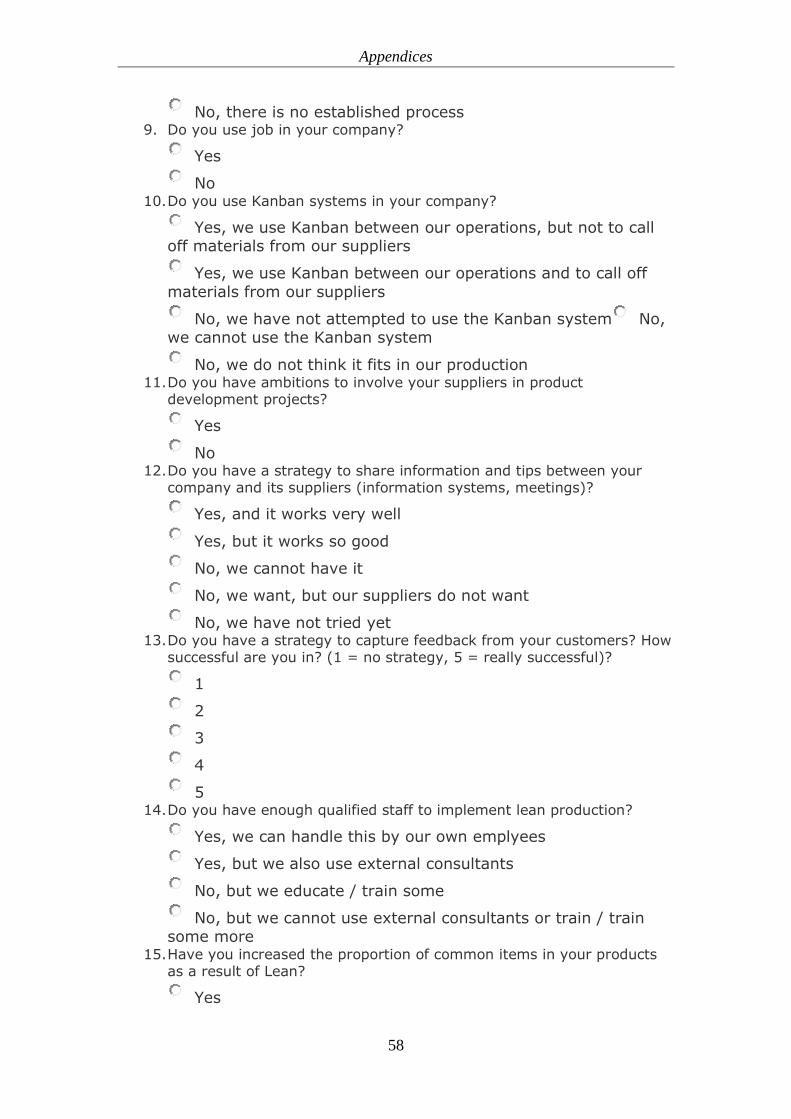
Appendices
58
No, there is no established process 9. Do you use job in your company?
Yes
No 10. Do you use Kanban systems in your company?
Yes, we use Kanban between our operations, but not to call off materials from our suppliers
Yes, we use Kanban between our operations and to call off
materials from our suppliers
No, we have not attempted to use the Kanban system No, we cannot use the Kanban system
No, we do not think it fits in our production 11. Do you have ambitions to involve your suppliers in product
development projects?
Yes
No 12. Do you have a strategy to share information and tips between your
company and its suppliers (information systems, meetings)?
Yes, and it works very well
Yes, but it works so good
No, we cannot have it
No, we want, but our suppliers do not want
No, we have not tried yet 13. Do you have a strategy to capture feedback from your customers? How
successful are you in? (1 = no strategy, 5 = really successful)?
1
2
3
4
5 14. Do you have enough qualified staff to implement lean production?
Yes, we can handle this by our own emplyees
Yes, but we also use external consultants
No, but we educate / train some
No, but we cannot use external consultants or train / train some more
15. Have you increased the proportion of common items in your products as a result of Lean?
Yes
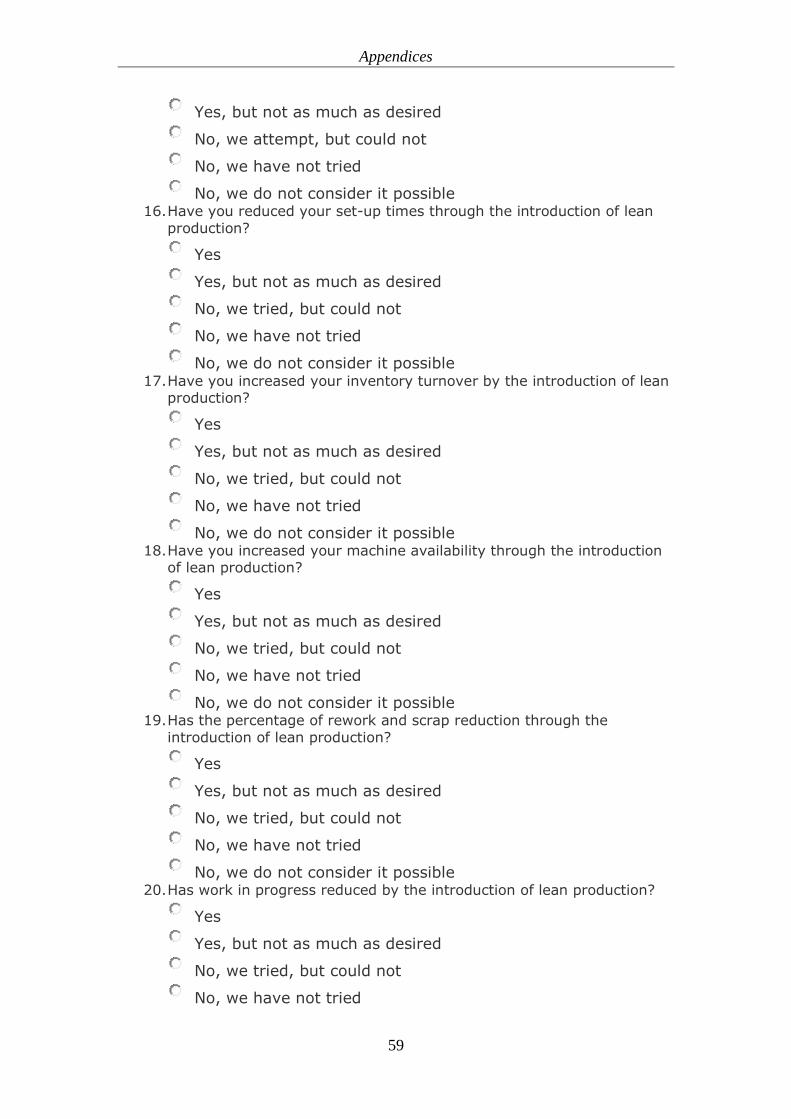
Appendices
59
Yes, but not as much as desired
No, we attempt, but could not
No, we have not tried
No, we do not consider it possible 16. Have you reduced your set-up times through the introduction of lean
production?
Yes
Yes, but not as much as desired
No, we tried, but could not
No, we have not tried
No, we do not consider it possible 17. Have you increased your inventory turnover by the introduction of lean
production?
Yes
Yes, but not as much as desired
No, we tried, but could not
No, we have not tried
No, we do not consider it possible 18. Have you increased your machine availability through the introduction
of lean production?
Yes
Yes, but not as much as desired
No, we tried, but could not
No, we have not tried
No, we do not consider it possible 19. Has the percentage of rework and scrap reduction through the
introduction of lean production?
Yes
Yes, but not as much as desired
No, we tried, but could not
No, we have not tried
No, we do not consider it possible 20. Has work in progress reduced by the introduction of lean production?
Yes
Yes, but not as much as desired
No, we tried, but could not
No, we have not tried
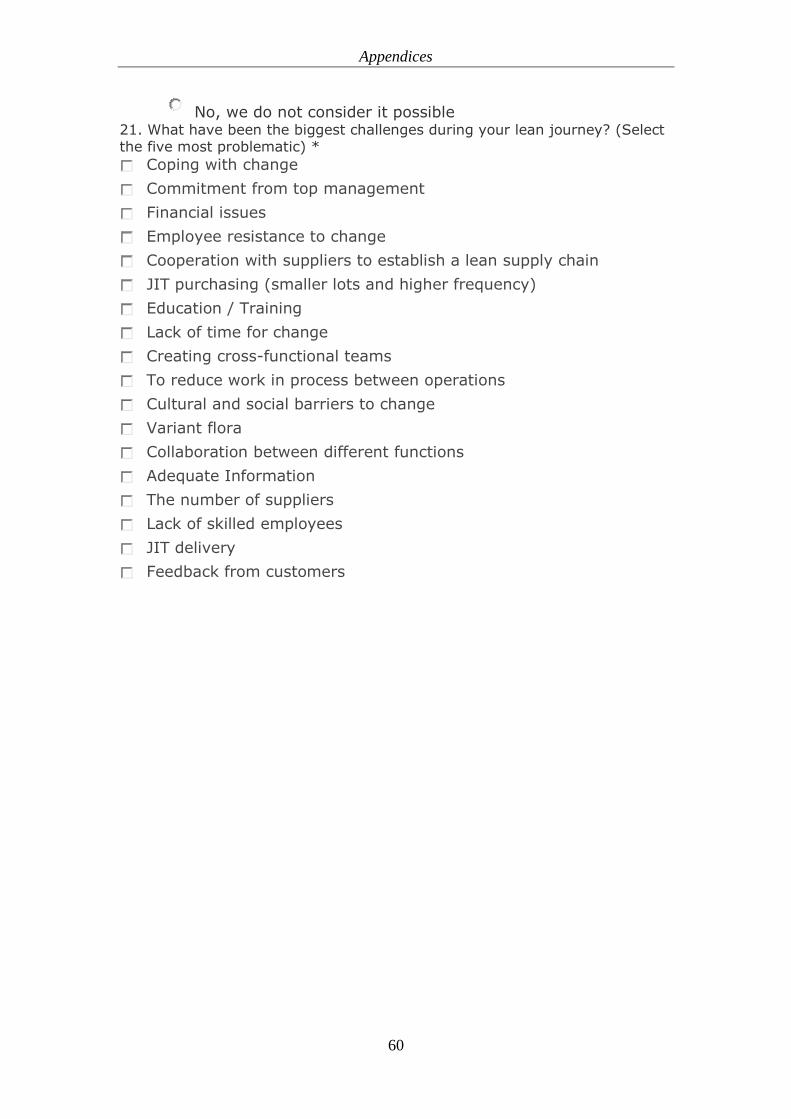
Appendices
60
No, we do not consider it possible 21. What have been the biggest challenges during your lean journey? (Select the five most problematic) *
Coping with change
Commitment from top management
Financial issues
Employee resistance to change
Cooperation with suppliers to establish a lean supply chain
JIT purchasing (smaller lots and higher frequency)
Education / Training
Lack of time for change
Creating cross-functional teams
To reduce work in process between operations
Cultural and social barriers to change
Variant flora
Collaboration between different functions
Adequate Information
The number of suppliers
Lack of skilled employees
JIT delivery
Feedback from customers

Appendices
61
Appendix 2: Questionnaire form 2
Swedish (original version):
1. Anser ni att Lean (eller något annat förbättringsinitiativ, såsom Sex
Sigma eller TQM kan öka er konkurrensförmåga?
Ja
Nej
Vi känner inte till något om dessa metoder
2. Vilka fördelar tror du att ni skulle kunna vinna genom Lean produktion, eller något annat förbättringsprogram? *
Lägre kostnader
Högre kvalitet
Högre produktivitet
Flexibilitet
Kortare ledtider
Bättre leveransprecision
Kortare utvecklingsledtider
3. Vilket (vilka) av följande alternativ utgör de viktigaste hindren för att införa något av ovanstående förbättringsmetoder? *
Vi känner inte till dessa metoder
Metoderna kostar för mycket att införa
Vi saknar medarbetare med tillräcklig kunskap om dessa metoder
Vi anser inte att dessa metoder passar oss
Vi har inte tid för att arbeta med förbättringar
Det är svårt för oss att samarbeta med våra leverantörer för att etablera
en lean försörjningskedja Många varianter i små volymer gör att Lean produktion inte passar oss
Högsta ledningen stödjer inte denna typ av förändringar
Denna typ av förändringar behöver allför lång tid för att bli lönsamma
English:
1. Do you think that Lean (or any other improvement initiatives, such as Six Sigma or TQM can enhance your competitiveness?
Yes
No
We do not know anything about these practices 2. What advantages do you think you could gain through Lean production or any other improvement programs? *
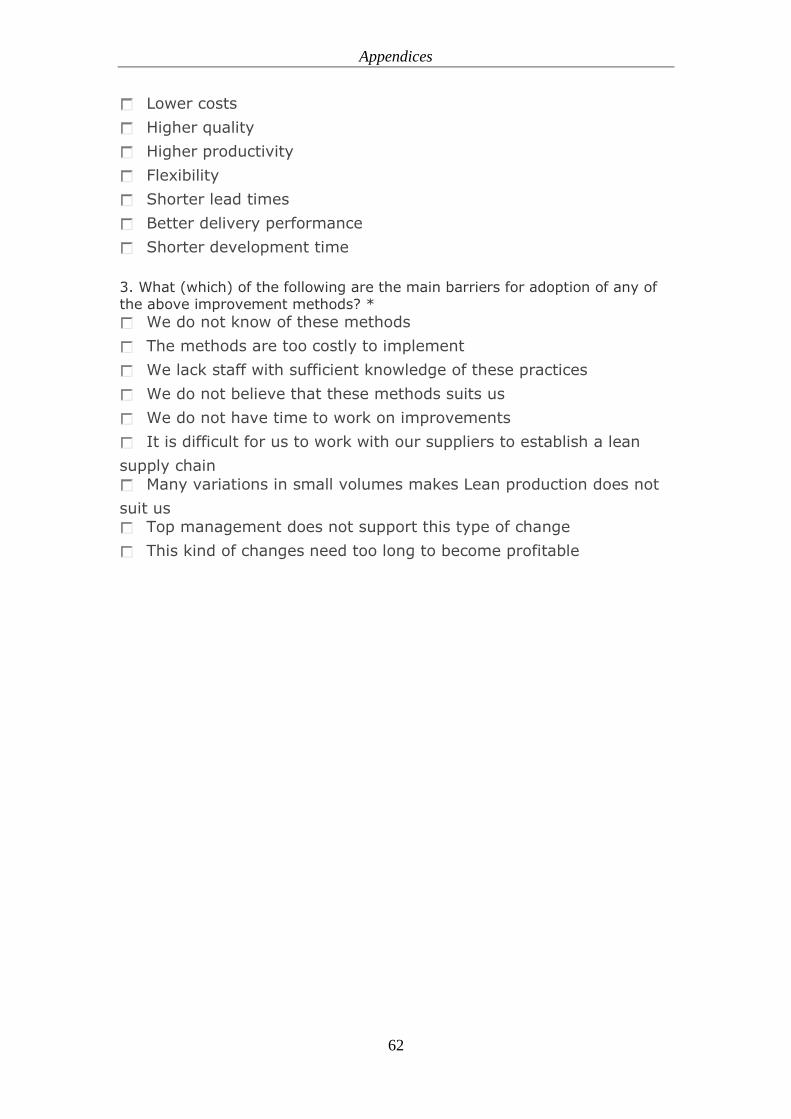
Appendices
62
Lower costs
Higher quality
Higher productivity
Flexibility
Shorter lead times
Better delivery performance
Shorter development time
3. What (which) of the following are the main barriers for adoption of any of
the above improvement methods? *
We do not know of these methods
The methods are too costly to implement
We lack staff with sufficient knowledge of these practices
We do not believe that these methods suits us
We do not have time to work on improvements
It is difficult for us to work with our suppliers to establish a lean
supply chain
Many variations in small volumes makes Lean production does not
suit us
Top management does not support this type of change
This kind of changes need too long to become profitable

Appendices
63