leapfrog hospital rewards program tm selecting clinical areas and performance measures barbara...
TRANSCRIPT

Leapfrog Hospital Rewards ProgramTM
Selecting Clinical Areas and Performance Measures
Barbara Rudolph, Ph.D.
Director, Leaps and Measures
February 6, 2006

LFHRP Pre-Conference Sessions• Clinical areas & performance measures (9:00 am)
• Data collection & scoring methodology (9:30 am)
• Program Implementation: Data and Program Licensing (10:15 am)
• Rewards Principles and Efficiency Process (10:30 am)
• LFHRP Implementation (11:00-Noon)
– Case Study I: Memphis Business Group on Health
– Case Study II: Capital District (General Electric Verizon and Hannaford Bros.)
1
Selecting Clinical Areas and Performance Measures
2

Selecting Clinical Areas: Criteria
• Relevance to commercial population• Opportunity for quality improvement• Potential dollar savings as quality improves• Availability of nationally endorsed and
collected performance measures
3
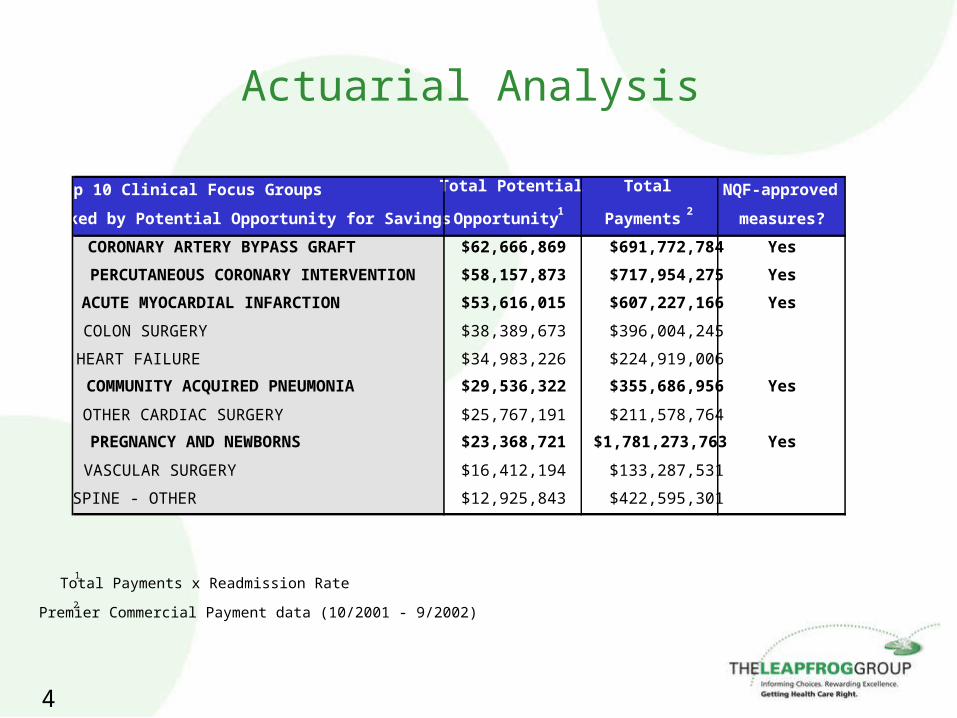
Actuarial Analysis
Top 10 Clinical Focus Groups
Ranked by Potential Opportunity for Savings
Total Potential
Opportunity 1
Total
Payments 2
NQF-approved
measures?
CORONARY ARTERY BYPASS GRAFT $62,666,869 $691,772,784 Yes
PERCUTANEOUS CORONARY INTERVENTION $58,157,873 $717,954,275 Yes
ACUTE MYOCARDIAL INFARCTION $53,616,015 $607,227,166 Yes
COLON SURGERY $38,389,673 $396,004,245
HEART FAILURE $34,983,226 $224,919,006
COMMUNITY ACQUIRED PNEUMONIA $29,536,322 $355,686,956 Yes
OTHER CARDIAC SURGERY $25,767,191 $211,578,764
PREGNANCY AND NEWBORNS $23,368,721 $1,781,273,763 Yes
VASCULAR SURGERY $16,412,194 $133,287,531
SPINE - OTHER $12,925,843 $422,595,301
1 Total Payments x Readmission Rate
2 Premier Commercial Payment data (10/2001 - 9/2002)
4

Measure selection criteria
• Capacity for rapid adoption• Nationally endorsed • Leverages actuarial/clinical research
– Actuarial impact for commercial market sufficient to exceed cost of implementation
– Consistent with clinical research findings
• Available data collection mechanism• Consistent with current Leapfrog patient safety
measures• Meaningful to purchasers
5

Quality measures consistent with current Leapfrog hospital measures
• Leapfrog Hospital Quality and Safety Survey data must contribute to the program
• When available, use Leapfrog process measures versus JCAHO measures– Some LF measures had a higher standard; and,– Ongoing process of alignment between Leapfrog
measures and the NQF endorsed measure sets, CMS and JCAHO measures
6

CABG measures by sourceMetric Source
Prophylactic antibiotic received within 1 hour prior to surgical incision
JCAHO (3Q04 SIP)
Prophylactic antibiotics discontinued within 24 hours after surgery end time
JCAHO (3Q04 SIP)
CABG mortality Leapfrog Survey
CABG volume Leapfrog Survey
Prophylactic antibiotic selection for surgical patients JCAHO (3Q04)
Computer Physician Order Entry Leapfrog Survey
ICU Physician Staffing (IPS) Leapfrog Survey
Leapfrog Safety Index (NQF Safe Practices) Leapfrog Survey
CABG using internal mammary artery Leapfrog Survey
Use of beta-blockers within 24 hours after surgery Leapfrog Survey
Beta-blockers prescribed at discharge Leapfrog Survey
Lipid lowering therapy at discharge Leapfrog Survey
Aspirin prescribed at discharge Leapfrog Survey
Early extubation for certain populations Leapfrog Survey
7

AMI measures by sourceMetric Source
Aspirin at arrival for AMI JCAHO
Aspirin prescribed at discharge for AMI JCAHO
Beta Blocker at arrival for AMI JCAHO
Beta Blocker prescribed at discharge for AMI JCAHO
AMI Inpatient Mortality JCAHO
Angiotensin converting enzyme inhibitor (ACEI) for left ventricular systolic dysfunction
JCAHO
Time to Thombolysis JCAHO
First balloon inflation within 90 minutes of hospital arrival Leapfrog Survey
Smoking Cessation Counseling JCAHO
Computerized Physician Order Entry Leapfrog Survey
ICU Physician Staffing (IPS) Leapfrog Survey
Leapfrog Safety Index (NQF Safe Practices) Leapfrog Survey
8

PCI measures by sourceMetric Source
PCI mortality Leapfrog Survey
PCI volume Leapfrog Survey
Aspirin for PCI patients Leapfrog Survey
First balloon inflation within 90 minutes of hospital arrival
Leapfrog Survey
Computer Physician Order Entry Leapfrog Survey
ICU Physician Staffing (IPS) Leapfrog Survey
Leapfrog Safety Index (NQF Safe Practices) Leapfrog Survey
9
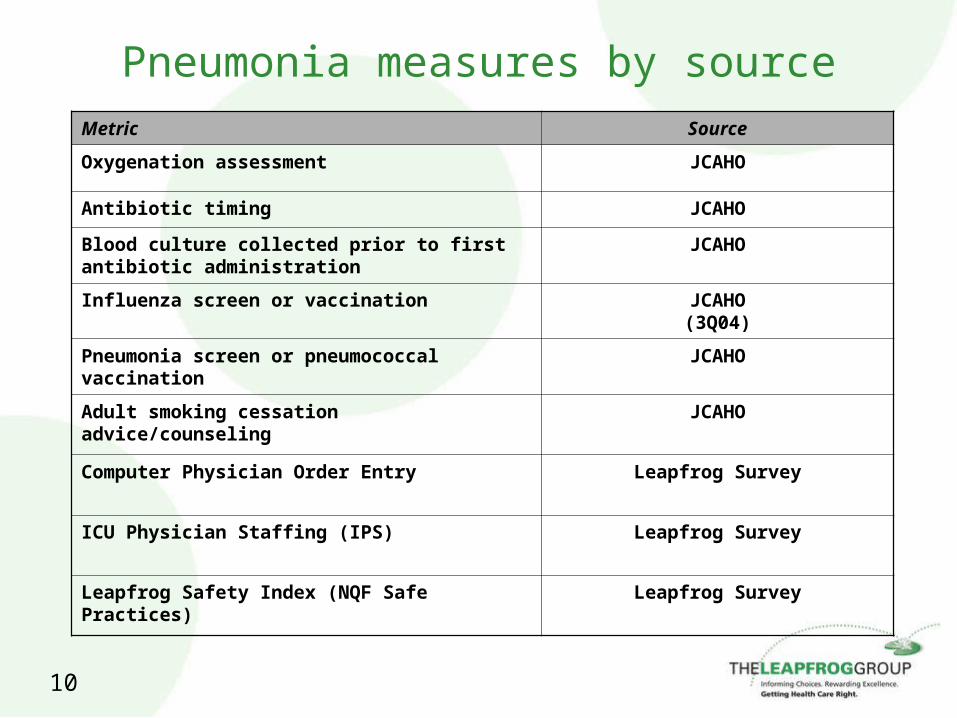
Pneumonia measures by sourceMetric Source
Oxygenation assessment JCAHO
Antibiotic timing JCAHO
Blood culture collected prior to first antibiotic administration
JCAHO
Influenza screen or vaccination JCAHO(3Q04)
Pneumonia screen or pneumococcal vaccination JCAHO
Adult smoking cessation advice/counseling JCAHO
Computer Physician Order Entry Leapfrog Survey
ICU Physician Staffing (IPS) Leapfrog Survey
Leapfrog Safety Index (NQF Safe Practices) Leapfrog Survey
10

Deliveries/Complicated Newborns measures by source
Metric Source
Third or fourth degree laceration JCAHO
Neonatal mortality JCAHO
Antenatal steroids for certain high-risk deliveries
Leapfrog Survey
NICU daily census Leapfrog Survey
Computer Physician Order Entry Leapfrog Survey
Leapfrog Safety Index (NQF Safe Practices) Leapfrog Survey
11

Effectiveness Measure Assignment and Weighting within Condition
• First stage of weighting*—outcomes within a condition assigned as follows:
46% for mortality29% for serious morbidity25% for complications
• Second stage—measures within an outcome weighted according to impact (when evidence available)
*Pauly, M.V., Brailer, D.J., Kroch, E., and O. Even-Shoshan. "Measuring Hospital Outcomes from a Buyer's Perspective." American Journal of Medical Quality, Vol. 11(8):112-122, Fall 1996.
12
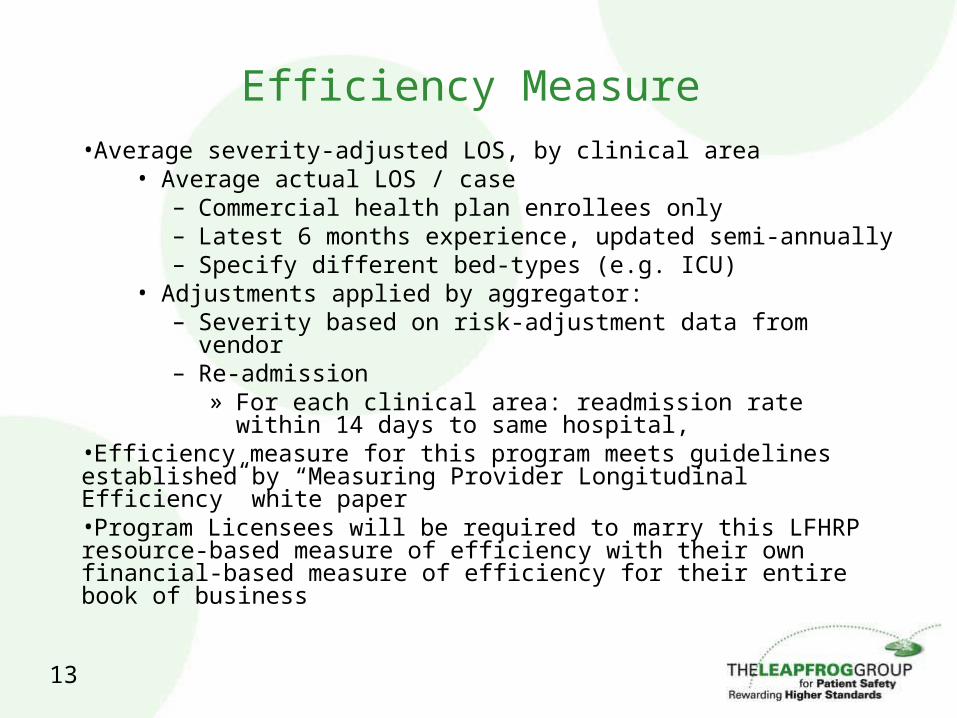
Efficiency Measure•Average severity-adjusted LOS, by clinical area
• Average actual LOS / case– Commercial health plan enrollees only– Latest 6 months experience, updated semi-annually– Specify different bed-types (e.g. ICU)
• Adjustments applied by aggregator:– Severity based on risk-adjustment data from vendor– Re-admission
» For each clinical area: readmission rate within 14 days to same hospital,
•Efficiency measure for this program meets guidelines established by “Measuring Provider Longitudinal Efficiency” white paper•Program Licensees will be required to marry this LFHRP resource-based measure of efficiency with their own financial-based measure of efficiency for their entire book of business
13

Efficiency and Quality Statistics
• Hospitals will be relatively ranked within condition based on their final weighted score for that condition
• The “bottom performer” in the top 25% on quality and efficiency will be used to determine placement in each of the remaining three cohorts.
• Hospitals in the top cohort are in the top quartile on both quality and efficiency (results in < than 25%)
• Hospitals in the bottom cohort will have efficiency and quality scores that are significantly worse by p=.05 than the bottom performer in the “top performing” cohort
14

Statistical Method
• Suggested by Tom Cook, Northwestern University• Uses the bottom performer in the relatively ranked
top quartile to serve as the benchmark for the remaining three cohorts
• Provides greater variation than is found in typical hospital public reporting; assures that cost savings will result in order for purchasers to recoup costs
• Assures that payments are made to top performers – Method results in 5% to 8% of hospitals in Top Performance
cohort (Cohort 1) (see next slide) • average payments 25% to 35% lower than average
– 25% to 30% of hospitals fall into Cohort 4 average payments 20% to 25% above average
15
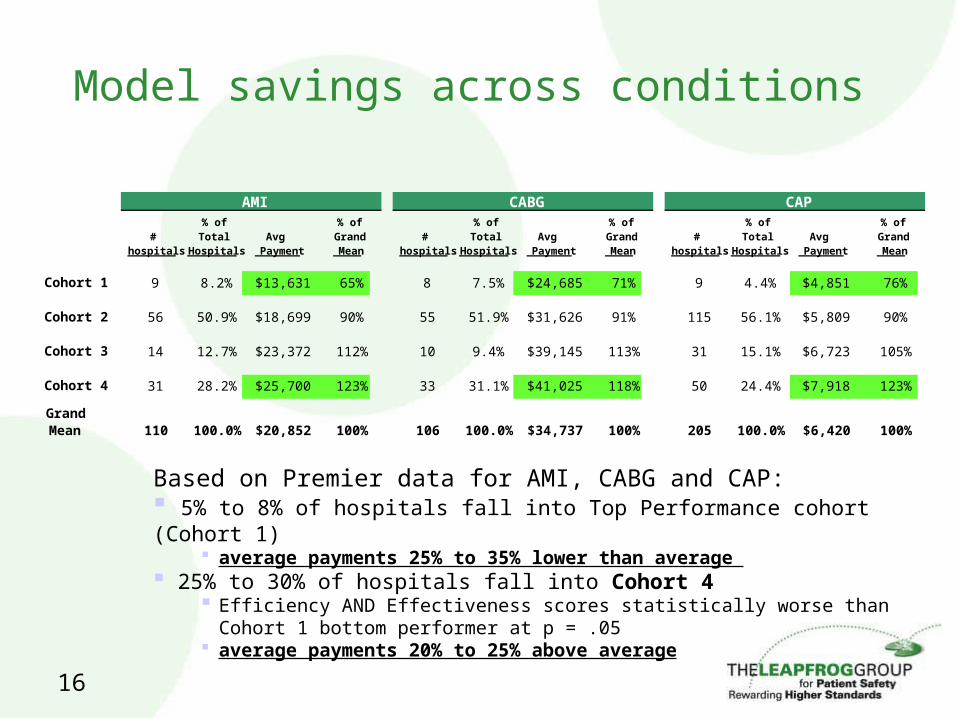
Model savings across conditions
Based on Premier data for AMI, CABG and CAP: 5% to 8% of hospitals fall into Top Performance cohort (Cohort 1)
average payments 25% to 35% lower than average 25% to 30% of hospitals fall into Cohort 4
Efficiency AND Effectiveness scores statistically worse than Cohort 1 bottom performer at p = .05
average payments 20% to 25% above average
# hospitals
% of Total
HospitalsAvg
Payment
% of Grand Mean
# hospitals
% of Total
HospitalsAvg
Payment
% of Grand Mean
# hospitals
% of Total
HospitalsAvg
Payment
% of Grand Mean
Cohort 1 9 8.2% $13,631 65% 8 7.5% 9 4.4%
Cohort 2 56 50.9% $18,699 90% 55 51.9% $31,626 91% 115 56.1% $5,809 90%
Cohort 3 14 12.7% $23,372 112% 10 9.4% $39,145 113% 31 15.1% $6,723 105%
33 31.1% 50 24.4%
110 100.0% $20,852 100% 106 100.0% $34,737 100% 205 100.0% $6,420 100%
CAPAMI CABG
Grand Mean
Cohort 4 31 28.2% $25,700 123%
$24,685 71%
$41,025 118%
$4,851 76%
$7,918 123%
16

Summary
• Cost savings related to both conditions selected and statistical approach
• Measures selected and weighted based on evidence of reductions in mortality and morbidity
• Effectiveness and Efficiency measured and contribute equally to performance incentive
• Methods vetted with many stakeholders
17