learning numerical action models from noisy input data
TRANSCRIPT

arX
iv:2
111.
0499
7v1
[cs
.AI]
9 N
ov 2
021
Learning Numerical Action Models from Noisy Input
Data
Segura-Muros, Jose A.a,∗, Fernandez-Olivares, Juana, Perez, Raula
aUniversidad de Granada, Campus Universitario de Cartuja, C. Prof. Vicente Callao,3, Granada, 18011, Andalusia, Spain
Abstract
This paper presents the PlanMiner-N algorithm, a domain learning tech-nique based on the PlanMiner domain learning algorithm. The algorithmpresented here improves the learning capabilities of PlanMiner when usingnoisy data as input. The PlanMiner algorithm is able to infer arithmeticand logical expressions to learn numerical planning domains from the inputdata, but it was designed to work under situations of incompleteness mak-ing it unreliable when facing noisy input data. In this paper, we propose aseries of enhancements to the learning process of PlanMiner to expand itscapabilities to learn from noisy data. These methods preprocess the inputdata by detecting noise and filtering it and study the learned action modelslearned to find erroneous preconditions/effects in them. The methods pro-posed in this paper were tested using a set of domains from the InternationalPlanning Competition (IPC). The results obtained indicate that PlanMiner-N improves the performance of PlanMiner greatly when facing noisy inputdata.
Keywords: Knowledge Engineering, Knowledge Acquisition, Action ModelLearning, Automated Planning, Machine Learning, StatisticalClassification, Classification Rule Learning, Regression Analysis, SymbolicRegression, Clustering, K-means
∗Corresponding author
Email addresses: [email protected] (Segura-Muros, Jose A.),[email protected] (Fernandez-Olivares, Juan), [email protected] (Perez, Raul)
Preprint submitted to Knowledge-Based Systems November 10, 2021

1. Introduction
In recent years, automated planning field has been greatly improved withvery fine solutions. These solutions have been enhanced the planners’ perfor-mance, its ability to face more complex problems or its flexibility to deal withuncertainty. But, even with these improvements, the idea of differentiatingthe planning engine from the problem representation is still present. Thisidea differentiates the planning engine from the problem being approached.Making the planning engines independent from the problems help to designgeneric planning techniques at the expense of the need for writing the on-tology of the given problem before trying to solve it. These ontologies arerepresented using planning domains that are, usually, handcrafted. The mainissue when writing planning domains is that is a lengthy process that requiresboth, extensive knowledge about the problem to be modelled, as well as alot of time and effort. Model acquisition techniques have been developedover the years, trying to alleviate this. By defining a series of techniquesto learn planning domains automatically from existing processes, model do-main learning techniques lessen the requirements to write a planning domainlessen.
Among all the proposals presented in the model acquisition techniquesarea in the last years, PlanMiner [1], a domain learner based on various ma-chine learning techniques, presented itself as an algorithm capable of learningthe most expressive numerical domains possible from a set of plan traces. Foran action of a numerical planning domain, PlanMiner is able to learn STRIPS[2] preconditions and effects enriched with arithmetic and logical PDDL [3]expressions. PlanMiner is able to achieve this by defining a methodologythat integrates classification [4] and regression [5] techniques to process theinput data –formatted as Plan Traces–and generate new information fromscratch. With this new information, PlanMiner is capable of inferring thenumerical preconditions and effects with a higher level of expressiveness toenrich the output PDDL action models. PlanMiner also was designed todeal with incompleteness and is able to learn planning domains with a cer-tain level of missing predicates in the input plan traces, but its performancedrops when some noise is included in the input data. The different proce-dures implemented in PlanMiner are adapted to work with lack of data, sothey take a series of assumptions that make the learning process difficultunder noise situations. This issue hinders the implementation of PlanMinerin more complex learning problems.
2

In the literature, [6] very good solutions can be found that, like Plan-Miner, are able to learn planning domains under levels of incompleteness.Among these approaches, we can find ARMS [7] and LAMP [8] which ob-tain planning domains reducing the learning problem to a Max-Sat problem.FAMA [9] that implements a hybrid learning-planning process able to learndomain models by feeding the input with new information on the fly. TheLOCM [10] family of algorithms uses finite state machines to learn domainsfrom a single set of plans. Among these algorithms, NLOCM [11] improvesLOCM and allows the learning of fixed action’s costs. And LC M [12] en-hances the LOCM algorithm to be able to learn using traces of noisy plans.Among the solutions that can learn planning domains from noisy input, wecan find the proposal of Rodriges et al. [13] present a STRIPS planningdomain learning algorithm that learns a preliminary model from an initialinput data. Then, the algorithm tests and updates the models by addingnew input data incrementally. If a new input example contradicts a modelthe algorithm modifies it to accommodate the new data. Mourao et al. [14]learn effects of planning actions by fitting a collection of models using sup-port vector machines [15] and combining them in a single model. This modelis used to generate the output STRIPS planning domain. Finally, Pasula etal. [16] considers every example of the input data as noisy and fits a proba-bilistic planning domain for them. This domain quantifies the actions’ effectsin order to detect noisy behaviour.
Few of these solutions are capable of learning under noisy situations, andnone of them can learn numerical planning domains. Seeking to fill thisgap, in this paper the authors propose a series of improvements to the Plan-Miner learning algorithm to expand its capabilities to learn planning domainscorrectly under certain noise levels. These methods add new functionalityto some of PlanMiner’s components to increase their noise tolerance. Thisis achieved by including several improvements for pre-processing and post-processing the data in the learning process. These improvements (a) studythe input data and filter those anomalous elements detected, and (b) try tofind incongruencies between the learned models. (a) The study of the datahelps PlanMiner to eliminate noisy values, as well as grouping similar Non-CRISP values using discretisation techniques. (b) Finally, in the last stageof the learning process, PlanMiner learns a set of classification models andinfers the PDDL action models from them. This process has been enhancedto post-process the models and detect mismatches between them in order toimprove the output models.
3

The different processes implemented in this paper were tested with a setof planning domains from the International Planning Competition (IPC).These domains were used to obtain a collection of plan traces that were pop-ulated with random noise. Using these plan traces as input our experimentstried to reproduce the original IPC domains, measuring the similarity usingvarious quality metrics from the literature. The results showed a promisingimprovement in the results of PlanMiner dealing with noise.
Next lines will describe the PlanMiner algorithm (Section 2), the inputdata needed to make it work and the characteristics of the planning domainslearned. In section 3 the methods implemented to improve PlanMiner’s per-formance when dealing with noisy input data will be explained. Section 4will present the experimental setup used to test these new methods, it’s re-sults and a discussion of them. Finally, section 5 will conclude this documentpresenting the conclusions drawn from the experimentation process and thefuture work to further improve our proposal.
Listing 1: Extract from an input plan trace from a Rovers planning problem
#Actions[ start ] [ end ] (action )[0 ] [ 1 ] (goto rov1 wp1 wp2)[1 ] [ 2 ] (goto rov1 wp2 wp3)
#States[ index ] (predicates )[0 ] (at rov1 wp1) ∧ (¬ (at rov1 wp2)) ∧
(¬ (at rov1 wp3)) ∧ (¬ (scanned wp3)) ∧(= (bat usage rov1) 3) ∧ (= (energy rov1) 450) ∧(= (dist wp1 wp2) 50) ∧ (= (dist wp2 wp3) 80)
[1 ] (¬ (at rov1 wp1)) ∧ (at rov1 wp2) ∧(¬ (at rov1 wp3)) ∧ (¬ (scanned wp3)) ∧(= (bat usage rov1) 3) ∧ (= (energy rov1) 300) ∧(= (dist wp1 wp2) 50) ∧ (= (dist wp2 wp3) 80)
[2 ] (at rov1 wp3) ∧ (¬ (at rov1 wp1)) ∧(¬ (at rov1 wp2)) ∧ (¬ (scanned wp3)) ∧(= (bat usage rov1) 3) ∧ (= (energy rov1) 60) ∧(= (dist wp1 wp2) 50) ∧ (= (dist wp2 wp3) 80)
2. The PlanMiner algorithm
The PlanMiner [1] algorithm was designed to learn numerical planningdomains under situations of incompleteness. For this purpose, PlanMiner
4

Algorithm 1 PlanMiner algorithm overview
Input PT: Set of Plan TracesOutput AM: Set of Action Models
1: Initializes stDict as dictionary2: for all Plan trace pt in PTs do3: for all Different action act in the pt do4: Extract state transitions st of act in pt5: stDict [act ] ← stDict [act ] ∪ st6: end for7: end for8: for all key act in stDict do9: dat ← dataset created using stDict [act ]10: Infer new knowledge from dat and add it11: Fit a classification model cModel using dat as input12: Generate action model am from cModel13: AM ← AM ∪ am14: end for15: return AM
defines a methodology that concatenates a series of Machine Learning tech-niques to, starting from a set of plan traces (Listing 1) learn a collection ofPDDL action models with relational and arithmetic expressions in its effectsand preconditions (Listing 2).
An overview of PlanMiner’s workflow can be observed in Algorithm 1.Summarising, PlanMiner’s input is transformed into a set of datasets (one foreach action to be modelled in the output domain) and applies a collection oftechniques to them to discover new information and use it to learn relationaland arithmetic expressions. Input plan traces are decomposed in a collectionof state transition (s1, a, s2)., while s1 is a snapshot of the world just beforeexecuting the action (a pre-state), s2 is a observation of the world just afterexecuting the action (a post-state), and a and action of a plan trace. Thestate transitions are grouped by the name of its actions a, so, given thoseactions, their related states are used to create a dataset. These datasetsdisplay the pre-states and post-states as their instances, with its predicates asthe datasets’ attributes. Finally, to each instance of the dataset, PlanMinerassigns a class label according to its relation with the action associated withit (either pre-state or post-state).
5

PlanMiner takes the datasets and enriches them with new informationin order to let the learning process to infer a set of numerical and logicalexpressions. To achieve this, PlanMiner makes use of symbolic regressiontechniques [17] as the core of the process. These techniques allow PlanMinerto search in the space of arithmetic expressions for the one that best fits a setof target values. PlanMiner detects which numerical predicates evolve whena given action is executed, and then, using a symbolic regressor tries to fit anarithmetic expression that explains these changes. This arithmetic expressionuses the rest of numerical predicates of the dataset as variables and a finite setof integers. PlanMiner implements the symbolic regressor as an algorithm ofinformed graph search [18]. The symbolic regression algorithm codes as statesthe arithmetic expressions and incrementally constructs new expressions fromthem. PlanMiner creates relational expressions from the numerical predicatesof the dataset by selecting a pair of numerical predicates and studying howthey behave. Using some expert knowledge PlanMiner is able to detect whena relation between two predicates may be useful, filtering spurious relations.Finally, once a suitable expression (arithmetic or relational) for an action isfound, it is included in the given dataset.
Once the datasets have been enriched with new information they are in-troduced in a classification [4] algorithm to extract from them a series offeatures that models the states assigned to a classification label. These fea-tures represent a meta-state for the pre-state and for the post-states. Themeta-states contains the minimum information to define every pre-state orpost-state of a given action. PlanMiner uses a rule-based classification algo-rithm named NSLV [19]. NSLV is based on a steady-state genetic algorithmto build the set of classification rules that bests fits a set of input instances.The structure of the rules learned by NSLV is:
IF C1 and C2 and . . . and Cm THEN Class is B
with weight w
where Ci is a statement ”Xn is A”, with A a value of the domain of theattribute Xn . Each Ci is a feature of the examples that model the B . Thevalues A of each variable depends on the type of attribute: True or False forlogical attributes or a real number for numerical attributes. The rules areweighted by counting the percentage of instances of the dataset covered byit. In a noise-free environment, NLSV would output two rules: one to modelthe pre-states and other to model the post-states.
6

From these meta-states, is trivial to PlanMiner the task of code the pre-conditions and effects of the actions. First, the preconditions of the actionsare extracted directly by translating the characteristics of the rule that mod-els the ”pre-state” class to the PDDL format. Second, the effects of theactions are calculated by comparing the metamodels of the before and af-ter state and extracting their differences. These differences are taken asthe necessary steps to transform the pre-state meta-model into a post-statemeta-model, that is, the effects of the action.
Action :GOTO (? arg 0 − rover ? arg 1 ? arg 2 − wp)
Precondi t ion :( at ? arg 0 ? arg 1 )(>= ( energy ? arg 0 )
(*( d i s t ? arg1 ? arg2 ) ( bat usage ? arg0 ) ))
E f f e c t s :(¬ ( at ? arg 0 ? arg 1 ) )( at ? arg 0 ? arg 2 )( dec r ea s e ( energy ? arg 0 )
(*( d i s t ? arg1 ? arg2 ) ( bat usage ? arg0 ) ))
Listing 2: Example of learned action by PlanMiner
3. PlanMiner-N
PlanMiner-N includes two new processes to the pipeline presented in theprevious section. These processes presented extend the PlanMiner algorithmto improve its resilience against noise. Such methods were designed withthe philosophy of enriching the learning pipeline without modifying its keyparts. These new steps developed are the filtering of the noisy input dataand the refinement of the meta-states. In the following lines, we will explainthese steps in detail, illustrating the whole process with examples taken fromdomain Rovers (defined in Listing 3). This plan traces is a modified noisytrace from the example trace of Listing 1. In this example noisy trace, theerroneous elements are highlighted in bold.
3.1. PlanMiner-N OverviewAlgorithm 2 shows PlanMiners-N’s general workflow, highlighting the
changes introduced to PlanMiner’s original workflow. PlanMiner-N modi-fies PlanMiner original contribution to enable the latter to operate under
7

Algorithm 2 PlanMiner-N Algorithm overview
Input: PT: Set of Plan TracesOutput: AM: Set of Action Models
1: Initializes stDict as an empty dictionary2: for all Plan trace pt in PTs do3: for all Different action act in the pt do4: Extract state transitions st of act in pt5: stDict [act ] ← stDict [act ] ∪ st6: end for7: end for8: for all key act in stDict do9: dat ← dataset created using stDict [act ]10: Filter noise from dat #Step added in PlanMiner-N
11: Detect new features from dat and extend dat with them12: Fit a classification model cModel using dat as input13: Refine cModel #Step added in PlanMiner-N
14: Generate action model am from cModel15: AM ← AM ∪ am16: end for17: return AM
noisy input data situations. As said earlier, PlanMiner-N implements twonew steps in the original pipeline of PlanMiner, performing in each one thefollowing tasks:
1. Plan traces noise filtering. Just after storing the information of theplan traces in a dictionary whose keys are the action names and theirvalues a set of associated state transitions, this process is applied. Thisprocedure (step 10 of Algorithm 2) aims to clean the input information.Depending on the type of data found in a dataset being addressed(either predicates or numerical fluents), a different process is applied.A noise filter based on statistical filtering is applied to the predicates,which depends on a frequency threshold that determines whether apredicate is noisy or not. Regarding numerical fluents, we assume thatthe noise produced is random, so they are discretised and smoothed toreduce fluctuations in their values. This must be done so that the othercomponents of the learning pipeline can perform their work to preventthe influence of the noisy values in its output.
8

2. Meta-state refinement. As explained above, a meta-state is a char-acterisation of the predicates/fluents that can be found in either thepre-state or the post-state of an action. In the case of informationwithout noise, each characterisation is directly obtained and repre-sented as the antecedent of a single rule. However, when addressingnoisy datasets, the classification model initially obtained (step 12 ofAlgorithm 2) may contain several characterisations (i.e. it can foundseveral rules) for either the pre-state or post-state of an action. TheMeta-state refinement (step 13 of Algorithm 2) solves this, enforcingthe constraint that only two meta-states are needed, by combining theelements of the rules intially learned.
3.2. Plan traces noise filtering
The noise filtering process of PlanMiner-N aims to detect and deleteanomalous erroneous information from the input data. The original Plan-Miner algorithm takes the input data and preprocesses it to adjust the formatof the data (i.e. dataset extraction) and to enrich it (i.e. discovery of newknowledge), PlanMiner-N introduces a new element to that preprocessingwith the filtering of the input data. This new element is included betweenthe two previous ones, and, as previously mentioned, its purpose is to reduceor alleviate as much as possible the noise problems that the input data mayhave.
Due to the nature of the information contained in the input data, weneed to apply different techniques to it, since the noise treatment for thenominal values of the predicates is different from the noise treatment of thereal values of the fluents. The only type of noise that affects predicates isoutliers, while fluents are also affected by random noise. In the examplenoisy trace of Listing 3 we can see an outlier in the logical predicates inpredicate (at rov1 wp2 ) of state [0], an example of random noise in thenumerical predicates in fluent (= (at rov1 ) 3 .25 ) of the same state, and anexample of outlier in the fluents in element (= (dist wp2 wp3 ) 380 ) of state[2]. This problem with the different types of noise conditions the techniquesdefined in PlanMiner-N, causing the input data preprocessing step to beapplied differently for each type of input data, as there is no jack-of-all-tradespreprocessing technique to deal with noise.
On the one hand, for noise in the logical predicates, PlanMiner-N imple-ments statistical filtering in order to detect outliers and eliminate them. This
9

filtering studies the distribution of the different truth values of each predi-cate along the traces, counting their frequency of occurrence. Then, if a truthvalue has an anomalously low frequency of occurrence, it is marked as noisyand removed. This process can be implemented because there are no con-ditional or stochastic behaviours in the learned actions. If such behavioursexisted, we would not be able to discern between those outlier truth val-ues or those that are related to an infrequent, but correct, non-deterministicbehaviour.
#Actions[0 ] [ 1 ] (goto rov1 wp1 wp2)[1 ] [ 2 ] (goto rov1 wp2 wp3)
#States[0 ] (at rov1 wp1) ∧ (at rov1 wp2) ∧
(¬ (at rov1 wp3)) ∧ (¬ (scanned wp3)) ∧(= (bat usage rov1) 3.25) ∧ (= (energy rov1) 450) ∧(= (dist wp1 wp2) 50) ∧ (= (dist wp2 wp3) 80)
[1 ] (¬ (at rov1 wp1)) ∧ (at rov1 wp2) ∧(¬ (at rov1 wp3)) ∧ (scanned wp3) ∧(= (bat usage rov1) 3) ∧ (= (energy rov1) 299) ∧(= (dist wp1 wp2) 50) ∧ (= (dist wp2 wp3) 80)
[2 ] (¬ (at rov1 wp3)) ∧ (¬ (at rov1 wp1)) ∧(¬ (at rov1 wp2)) ∧ (¬ (scanned wp3)) ∧(= (bat usage rov1) 3) ∧ (= (energy rov1) 60) ∧(= (dist wp1 wp2) 50) ∧ (= (dist wp2 wp3) -8000)
Listing 3: Example of a noisy plan trace
On the other hand, for numerical predicates, PlanMiner-N bases the noisefiltering on a discretisation technique [20] that groups the different elementsof a fluent under a series of discrete labels that replace them. In ML, discreti-sation is the process by which a set of continuous variables is transformed intoa finite set of discrete variables. The benefits of discretisation [21] includecategorising data for the sake of understandability, reducing the number ofpossible values of an attribute to improve the performance of ML algorithms,or, most relevant to the solution presented in this section, “smoothing” thediscretised data. This smoothing process reduces fluctuations in the inputdata caused by random noise. By gathering similar elements under a singlelabel, we do not only reduce the random noise of the data, but we can alsoisolate those data that are not similar to any other, i.e., the outliers.
10

(at ?arg1 ?arg2) (at ?arg1 ?arg3) (bat usage ?arg1) (energy ?arg1) (dist ?arg2 ?arg3) (scanned ?arg3) ClassTrue True 3.25 450 50 MV pre− state
False True 3 299 50 MV post− state
True False 3 300 -8000 True pre− state
False False 3 6000 86 False post− state
True False 3 230 75 MV pre− state
False True 3 5 75 MV post− state
True True 2.97 400 35 True pre− state
False True 3 295 33 False post− state
True False 5 400 75 False pre− state
False True 5.05 -50 75 True post− state
True False 5 500 50 False pre− state
True True 5 250 50 False post− state
True False 3 315 1005 True pre− state
False True 3 -0.5 105 True post− state
True False -4 500 80 MV pre− state
False True 5 100 80 MV post− state
True False 3 46 15 False pre− state
False True 3 10001 15 False post− state
Table 1: Noisy dataset associated with the (goto ?arg1 ?arg2 ?arg3) action.
This new preprocessing step is a powerful tool that can improve greatlythe performance of the whole learning process, but, its major drawback isthat it directly affects the execution of PlanMiner-N, increasing the amountof time that it requires to work. The preprocessing step is applied directlyto the datasets extracted from the plan traces. The examples designed toillustrate the new methods start from the dataset of Table 1, a dataset createdfrom the plan trace presented in Listing 3. In this table, in the (bat usage?arg1) attribute, examples of outliers (-4) or random noise (5.05) can beobserved.
3.2.1. Logical values noise treatment
Once the datasets have been created, the first action done by PlanMiner-N is to tackle noise in the logical attributes in the dataset. This is performedby PlanMiner-N by implementing a statistical filter to detect anomalies inthe data. This filter is implemented over a collection of frequency tables thatsurvey how the information is distributed in the dataset. These frequencytables measure the importance that each value has in a given attribute. Inthe case of finding an anomaly in these measures, it is filtered out and erasedfrom the dataset. An anomaly is a value with an abnormally low importance.
The filter (Algorithm 3) implemented in PlanMiner-N operates as follows:Starting from a single dataset, the filter fixes a class label (either pre-stateor post-state) and creates a sub-dataset with only the information of thefixed label. Using this sub-dataset, the filter creates a frequency table for
11

Algorithm 3 Statistical noise filter overview
Input dat: DatasetOutput dat: Dataset
1: for all Class label cLabel in dat do2: Initializes subDat as empty Dataset3: for all Instance i in dat whose class is cLabel do4: Include i in subDat5: end for6: for all Instance i in subDat do7: for all attribute attr in subDat do8: tCount → count number of True values of attr9: fCount → count number of False values of attr10: if tCount
tCount+fCount< threshold then
11: Erase all True values in attr12: end if13: if fCount
tCount+fCount< threshold then
14: Erase all False values in attr15: end if16: end for17: end for18: Update dat with the information of subDat19: end for20: return dat
each different logical attribute. These frequency tables measure the numberof times a given attribute takes a certain value. For a certain attribute, ifthe relative number of times a value appears is below a threshold, then it isconsidered irrelevant. Irrelevant attributes are considered as there is no usefulinformation to be extracted from it, thus they are counted as noise. Thedeletion of a value is realised by selecting its appearances in the attribute’scolumn and replacing them for missing values tokens. Since internally thepipeline components follow the Open World Assumption, the inclusion of anon-determined missing value does not influence the method of operationof the algorithm. Once a sub-dataset has been processed, the other classlabel is selected and the procedure is repeated. Figure 1 presents an examplewith the frequencies of the predicates from the example dataset presented inTable 1. In this example, it can be seen graphically the frequency rate of their
12

0 0.2 0.4 0.6 0.8 1
Post-state
Pre-state
Frequency rate
(at?arg1?arg2)
TrueFalse
0 0.2 0.4 0.6 0.8 1
Post-state
Pre-state
Frequency rate
(at?arg1?arg2)
TrueFalse
0 0.2 0.4 0.6 0.8 1
Post-state
Pre-state
Frequency rate
(at?arg1?arg2)
TrueFalse
Figure 1: Frequency rates of the values of each predicate of the dataset presented in Table1. Each graph represent a predicate and its values. The green line represents the thresholdthat determines whether a value is considered noisy.
values. Those values that do not exceed the threshold set by PlanMiner-N(defined by the green bar) will be eliminated.
The threshold set to filter noisy elements of the dataset can impact heav-ily on the performance of the process. In case of dealing with a situationwhere an attribute displays a non-noisy value with a low appearance rate, avery high threshold value may lead to detecting it as noise, and, therefore,erasing it. The absence of this value may hinder the later learning processes,including, in fact, an artificial extra noise. On the other side, a low thresholdvalue may work the other way around, setting as “uncommon examples”,noisy values. This issue would make the filtering process useless.
3.2.2. Numerical values noise treatment
After filtering the logical outliers, PlanMiner-N proceeds to process thenumerical information in the input data. The variety of data contained in anoisy numerical attribute makes the use of a filter process like the one shownbefore inviable.
Even in a noise-free environment, a numerical continuous attribute maydisplay wide range of different values. A statistical filter would not workcorrectly in this kind of situation, marking as noise the majority of values.PlanMiner-N implements an alternative filtering process (Algorithm 4) todeal with the noise in the numerical values. This filter takes as input adataset, selects a numerical attribute, and extracts every element from it.The values extracted are then used as input of a discretisation algorithmthat processes and groups them. Finally, the discretised values substitutethe original values of the attribute.
The discretisation algorithm must produce a set of finite discrete elementsfrom the collection of values used as input. PlanMiner-N achieves this using
13

Algorithm 4 Numerical noise filter overview
Input dat: DatasetOutput dat: Dataset
1: Initializes elems as empty list of numbers2: for all attribute attr in dat do3: elems ← elems ∪ values list of attr4: end for5: newAttr ← discretize elems6: Update dat with the information of newAttr7: return dat
a clustering technique. The discretisation process groups the input elementsinto a set of clusters, and calculates the output discrete set of values as themean element of each cluster. Given that the characteristics of the data areunknown a priori (the number of data points, their distribution, ...), the al-gorithm can not use a predefined number of clusters to fit the data. Thisprovokes that PlanMiner-N must find the best number of clusters automat-ically. PlanMiner-N implements a top-down divisive hierarchical clusteringtechnique [22] to achieve this. This type of clustering methodology startsfrom every value in a single cluster and divides it recursively into smallerclusters. The principle on which these techniques are based is to incremen-tally create a larger number of clusters that better fit the data.
The clustering technique defined in PlanMiner-N (see Algorithm 5) fol-lows a hierarchical, recursive divide-and-conquer strategy that works as fol-lows:
1. Taking a single cluster with every element, the discretisation techniquemeasures its quality.
2. If the quality of the cluster does not meet a certain acceptance criterion,the cluster is split into two new smaller clusters.
3. Then, the process of measuring and splitting of the clusters is appliedto the new clusters.
This process is repeated recursively until there’s no more clusters to split.If, during the process a cluster with a single element is found, the processmarks it as outlier, and thus, the algorithm discards it. Cluster splittingis realised using a classical clustering algorithm. This algorithm will try to
14

Algorithm 5 Discretization algorithm overview
Input Dat: Set of data points, AC: acceptance criterionOutput C: Set of Clusters
1: split ← Halve Dat using K means algorithm2: C ← {}3: for all cluster in split do4: if Quality(cluster) >= AC then5: if |cluster | > 1 then6: C ← C ∪ cluster7: end if8: else9: C ← C ∪ divide cluster calling the discretisation process recursively10: end if11: end for12: return C
separate the elements of the cluster in two different groups. This task isrealised in PlanMiner-N with the K-means clustering algorithm.
The K-means algorithm [23] was originally proposed by James MacQueenof the University of California in 1967. From the start, this clustering al-gorithm stood out in the literature due to its popularity and simplicity.K-means partitions a dataset passed as input into k groups, so that eachelement is assigned to the group whose mean value is closest.
Algorithm 6 Pseudocode of K-means algorithm
Input T : Training input data, k : number of desired clustersOutput K : Set of clusters
1: K ← Initialize k clusters2: while ¬ Convergence criterion is met do3: Assign every element of T to the closest cluster in K4: Recalculate the mean value of each cluster in K5: end while6: return K
K-means iteratively distributes the different elements Ti of T among theclusters in K . In each run of the algorithm (see Algorithm 6), K-meansselects each data point Ti and calculates its distance to the centre of each
15

cluster in K , assigning it to the nearest cluster. The centre of each cluster iscalled the centroid and is calculated as the average value of all the elementsassigned to it. In other words, each element Ti is grouped with those elementsclosest to it. This concept of closeness between two points is computed asthe Euclidean distance between them. Once all the data points have beenassigned, K-means updates the centroids of each cluster with the informationfrom the new points assigned to them. This process is repeated until theconvergence criterion of the algorithm is met, which is that, after one run,all clusters have stabilised. A stable cluster is one where, after one run, noelement assigned in the previous run has been added or removed. Finally,it should be noted that the set of clusters K must be initialised at the startbefore entering the main loop of the algorithm. This can be done randomly(the approach used in this work) or by following a greedy strategy.
The quality of a cluster quality(cluster) measures how cohesive the valuesof a cluster are, as well as the size of the clusters. Cluster’s quality is definedas the weighted arithmetic mean of both metrics:
quality(Ci) = α ∗ silI(Ci) + β ∗ nSTD(Ci)
where silI is the index of the silhouette of the cluster Ci [24], and nSTDis the normalised standard deviation of Ci . These metrics, taken from thestate-of-the-art of the field in question, and, summarising:
• The silhouette index of a cluster measures how close the elements ofa cluster are among themselves and how far they are to the elementsof the other clusters. A cluster with a good silhouette index containswell-matched elements which would be bad matches for the elementsof the rest of the clusters.
• The normalised standard deviation quantifies how “wide” a givencluster is. A very wide cluster implies that its elements are dispersedin it; thus, its centre is not representative of them. On the other hand,a very tight cluster would imply that its elements are near the centroidand thus they are well represented by it.
On the one hand, the silhouette index of a cluster is computed as theaverage silhouette index of every data point assigned to it. For a givenelement Ti, its silhouette index is calculated as:
s(Ti) =
{
b(Ti)−a(Ti)max(a(Ti),b(Ti))
if |k| > 1
0 if |k| = 1
16

where a(Ti) is the average distance from the element Ti to the rest of theelements of the cluster:
a(Ti) =1
|k| − 1
∑
i,j∈k,i 6=j
distance(Ti, Tj)
and b(Ti) is the average distance from Ti to the nearest element of the otherclusters.
b(Ti) = mink 6=k′
1
|k′|
∑
j∈k′
distance(Ti, Tj)
with k and k ′ being elements of the set of clusters K .The distance between two points is calculated by using the Euclidean
distance (as in K-Means). The metric s(Ti) ranges from -1 to 1. A valueof 1 means that the i -th element is perfectly grouped in its assigned cluster;conversely, a value of -1 implies that the element is wrongly classified. Theaverage silhouette score of all points indicates how well grouped the data arein their clusters.
On the other hand, a cluster’s normalised standard deviation is calculatedas:
nSTD(k) =
√
1|k|
∑
Ti∈k(Ti − µ)2
µ
where k is a cluster of K and µ its centroid. A cluster’s normalised standarddeviation quantifies how disperse the elements of the cluster are in relation tothe cluster’s centroid. The nSTD(k) score has a range of [0,∞). The higherthe value of nSTD(k), the wider the cluster, and hence, the more separatedthe data points are from the centre of the cluster.
These two metrics separately provide useful information about the qualityof a cluster, but using them alone would be counterproductive. On the onehand, the silhouette index tends to benefit evenly distributed clusters. Forexample, when dealing with data that is homogeneously distributed, focusingonly on the silhouette index would make our process to promote fit a set ofwide clusters covering the entire range of data, but, that would representpoorly the data assigned to them. On the other hand, the single use ofthe standard deviation would lead to the generation of a large set of verytight clusters, which, taken to the extreme, could generate a cluster for eachdifferent value passed as input. These clusters would represent perfectlythe datapoint assigned to them but would make the whole discretisation
17

process useless too. Finally, α and β are weights for the measures. Theseweights allow the fine-tuning of the quality function, giving more asymmetricimportance to the measures when calculating the quality of a given cluster.
The combination of both metrics allows PlanMiner-N to obtain the bestpossible clusters, avoiding the problems described above. The main impedi-ment to this combination of metrics is that there are differences between thebehaviour of the metrics and their values ranges. Cluster standard deviationis a metric whose scores range in the interval (0,∞], while the silhouette in-dex is bounded in the interval [−1, 1]. In addition, the best values of Clusterstandard deviation are the values close to zero, this is opposite to silhouetteindex where the highest values are the bests scores. Given the behaviour ofthe metrics, a slightly worse score in the cluster’s standard deviation mayoverride a much better silhouette index. In order to lessen this issue andcombine both metrics, PlanMiner-N adjusts the silhouette index by takingthe opposite of the score obtained, and adding 1 to it. This transformationchanges silhouette index results to the interval [0, 2] where zero is the bestpossible value. This makes both indexes combinable in a single metric whoserange is [0,∞], where Zero is the best result. Figure 2 shows the data pointsand clusters of the (bat usage ?arg1 ) fluent. This example presents graph-ically how the values closer to “3” are grouped in the same cluster, whilethose closer to “5” are grouped in another different cluster. The value near“-3” is marked as an outlier and therefore is ignored in the next stages ofPlanMiner-N’s execution.
3.3. Meta-states refinement
As we have stated before, when dealing with noisy data, we cannot besure that after extracting a classification model for a given dataset we willget a unique characterisation for the pre-states and another for the post-states (i.e. a rule set with two rules, one for each meta-state). Given thecharacteristics of the AML process presented in this paper, it is necessarythat this condition is always fulfilled. This is because a deterministic actionmodel has only one rule for pre-state and one for post-state. In order to fulfilthis constraint, PlanMiner-N implements this classification model refinementprocess, which merges a ruleset obtained from a classification algorithm, thatcharacterises a single action, into a a pair of rules (one for the pre-state andother for the post-state). This process is performed before attempting to ex-tract the preconditions and effects of the actions of the domain being learned.In addition, it presents an extra difficulty, as the multiple rules that can be
18

C1
C2
−4 −3 −2 −1 0 1 2 3 4 5 60
0.2
0.4
0.6
Figure 2: Example of discretisation. The x-axis shows the different values taken by(bat usage ?arg1 ) in the dataset presented in Table 1, while the y-axis shows the fre-quency of occurrence of these values.
learned by classification algorithms for each action may present inconsisten-cies between them. This is because the classification algorithms may haveadjusted elements of some of the rules to noisy information, detecting this isparamount for the correct learning of the planning domains.
The process implemented in PlanMiner-N to deal with this issue aimsto (i) obtain the number of meta-states needed by PlanMiner to functioncorrectly and (ii) detect inconsistencies in them. Prior to the applicationof said process, PlanMiner-N divides the ruleset in two sets, separating therules that represent the meta-states of the pre-state from those that modelthe post-state. It then applies the refinement process to each collection ofrules separately, obtaining a single rule for each.
This procedure decomposes the model (the ruleset obtained by the classifi-cation algorithm) to evaluate its elements (which are rules) using a statisticalmethod. Once decomposed the rulesets, PlanMiner-N creates a repositorywith elements obtained, and evaluates them, allowing the detection of strangeelements that can be considered noise and detecting inconsistencies betweenthese elements. The Meta-state refinement method implements a set of pro-cedures to study and resolve these issues automatically.
The evaluation method is implemented a as a two-step strategy that:
1. An anomaly detection strategy is applied to the elements of the rules’antecedents of a given ruleset, filtering those atypical elements found.
2. The remaining elements are studied in order to detect conflict between
19

Algorithm 7 Irrelevant features filtering Algorithm
Input: rules: RulesetOutput: rules feat: Ordered set of features
1: rules feat ← {}2: for all Rule rule in rules do3: for all Features elem in the antecedent of rule do4: rules feat ← rules feat ∪ elem5: end for6: end for7: Filter(rules feat)8: Short(rules feat)9: return rules feat
them, combining them in a single rule in the process.
Finally, to clarify that, in the end, the meta-state refinement methodgenerates only the rules necessary for the learning process to proceed (i.e.two rules).
3.3.1. Filtering of irrelevant features
The main objective of the filtering procedure (Algorithm 7) is to detectthose elements of the rule antecedents that have an anomalously low fre-quency of occurrence. Marking them as noisy and discarding them for therest of the procedure. Briefly recalling, each rule in the ruleset is defined asa conjunction of features < attr, val > that has a weight associated with it.This weight indicates the percentage of examples of a given class covered bythe rule in question.
That said, the implemented in PlanMiner-N to filter irrelevant featuresof the rules works as follows: Starting from a ruleset that contains severalrules, it decompose the antecedents of each rule by separating the featuresthat define them and computing its support value. The support of a featureis calculated by adding the weight of every rule in which it appears.
Once each feature has been extracted, all those that do not exceed acertain threshold are filtered out. Filter(rules feat) marks and discards thosefeatures that are considered irrelevant. The criterion for marking a featureas irrelevant is given by the feature whose support value is higher, which istaken as the reference value. Finally, the filtering process sorts the set offeatures from highest to lowest according to their support value.
20

Algorithm 8 Meta-state Refinement Algorithm
Input: rules feat: Ordered set of featuresOutput: rule: Rule
1: rule ← {}2: while rules feat is not empty do3: elem ← Top feature of rules feat4: Delete elem from rules feat5: if stat does not conflicts with some element of rule then6: Add elem to rule antecedent7: else8: SolveConflict(rule,elem)9: end if10: end while11: return rule
3.3.2. Conflict resolution
Once the irrelevant attributes have been filtered and ordered out, therest of them are combined in a single rule (Algorithm 8). This is done bytaking the features in descending order and including them in an emptyrule incrementally. During this process, PlanMiner-N may find a situationwhere a feature being included shares the attribute attr with another featurealready included in the rule, but with a different value val .
This is called a feature conflict and occurs when the classification algo-rithms fits a rule to a specific set of data that is inconsistent with otherrule. When a conflict is found, PlanMiner-N may face two course of actions:delete the feature with the lowest support (by considering that feature noisy)or delete both features (as considering that the whole feature is irrelevant tomodel the meta-state).
SolveConflict(rule,elem) determines said course of action by calculatinga confidence interval and checking how the difference between the features’support value –namely ∆(s1 , s2 ) –interact with it. The confidence interval iscalculated as:
[−0.1 ∗ S, 0.1 ∗ S]
where S as the mean support value between s1 and s2 .If ∆(s1 , s2 ) is within that interval the difference is considered significant,
and then, PlanMiner-N can conclude that the feature with the less support
21
2 4 6 8
(at arg1 arg3) = True
(at arg1 arg2) = False
(scanned arg3) = False
(scanned arg3) = True
(at arg1 arg3) = False
(at arg1 arg2) = True
(energy arg1) > ∆(energy arg1)
11
33
88
9
Support value
Predicates
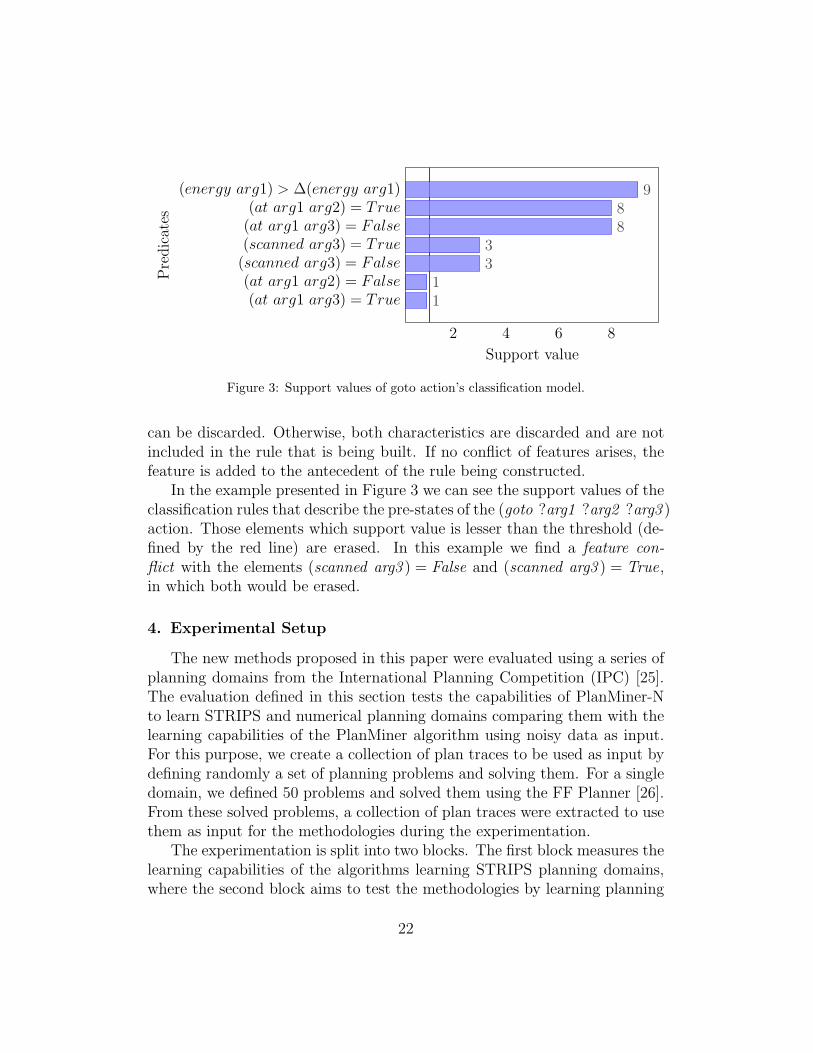
Figure 3: Support values of goto action’s classification model.
can be discarded. Otherwise, both characteristics are discarded and are notincluded in the rule that is being built. If no conflict of features arises, thefeature is added to the antecedent of the rule being constructed.
In the example presented in Figure 3 we can see the support values of theclassification rules that describe the pre-states of the (goto ?arg1 ?arg2 ?arg3 )action. Those elements which support value is lesser than the threshold (de-fined by the red line) are erased. In this example we find a feature con-flict with the elements (scanned arg3 ) = False and (scanned arg3 ) = True,in which both would be erased.
4. Experimental Setup
The new methods proposed in this paper were evaluated using a series ofplanning domains from the International Planning Competition (IPC) [25].The evaluation defined in this section tests the capabilities of PlanMiner-Nto learn STRIPS and numerical planning domains comparing them with thelearning capabilities of the PlanMiner algorithm using noisy data as input.For this purpose, we create a collection of plan traces to be used as input bydefining randomly a set of planning problems and solving them. For a singledomain, we defined 50 problems and solved them using the FF Planner [26].From these solved problems, a collection of plan traces were extracted to usethem as input for the methodologies during the experimentation.
The experimentation is split into two blocks. The first block measures thelearning capabilities of the algorithms learning STRIPS planning domains,where the second block aims to test the methodologies by learning planning
22

Domain |Actions| max action |logical| max predicatearity |predicates| arity
BlocksWorld 4 2 5 2Depots 5 4 6 2
DriverLog 6 4 6 2ZenoTravel 5 3 4 2
(a) STRIPS domains.
Domain |Actions| max action |logical | |numerical| max predicatearity |predicates| | predicates| arity
Depots 5 4 6 4 2DriverLog 6 4 6 4 2Rovers 10 4 26 2 3Satellite 5 4 8 6 2
ZenoTravel 5 3 2 8 2
(b) Numerical domains.
Table 2: Input domains characteristics. This Table shows the domains used in the secondpart of the experimentation. Domains characteristics (from left to right) are the numberof actions of the domains, the number of parameters of the actions, the number of logicpredicates, the number of numerical predicates (if any), and the maximum number ofparameters of the predicates.
domains with numerical information. For each block, we use a different setof planning domains. Table 2 lists these domains and shows their character-istics.
As the plan traces obtained from a set of solved planning problems arenoise-free, in order to experiment with the capabilities of the approacheslearning from noisy input information, artificial noise is included in them.The noise was included by selecting randomly a certain percentage of thepredicates of the plan traces’ states and changing their values. Noise in-clusion follows two different strategies: a) outliers inclusion ie. change thevalues of the logical predicates and the numerical predicates by arbitrarynumbers, and b) modifying the values of the numerical predicates with ran-dom noise ie. making them non-CRISP. In each experimentation block, wehave defined several different experiments by applying different types of noiseto the plan traces. When learning STRIPS-only planning domains, we onlyinclude outliers in the plan traces. On the other hand, when learning numer-ical domains, we define three different experiments: i) including outliers, ii)
23

including CRISP values, and iii) including both outliers and CRISP values.Finally, tolerance to noise is tested in the experimentation by defining a setof the experiments with different percentages of noise in the input plan tracesand obtaining a planning domain from them.
From these learned domains, we measure certain aspects of them in orderto test the learning capabilities of the algorithms. The measures evaluatethe quality of the learned domains and, therefore, the quality of the method-ologies used to obtain them. The quality measures used to evaluate theresults of the new methods are precision, recall, F-Score [9] and validity [27].Precision and recall measure the number of missing and surplus elements inthe preconditions and effects of the measured domain’s actions. For a givenaction in a domain, its precision is measured as:
Precision =tp
tp + fp
and its recall as:
Recall =tp
tp+ fn
where tp is is the number of true positives (correct elements in its precondi-tions and effects), fn is the number of false negatives (missing elements in itspreconditions and effects), and fp is the number of false positives (extra ele-ments in its preconditions and effects). F-Score is a measure of the action’soverall quality, and is defined as the harmonic mean between precision andrecall. F-Score is calculated as:
F -Score = 2 ∗Precision ∗Recall
P recision+Recall
The quality of a planning domain is calculated as the average quality mea-sured of every action contained in it.
The validation of a planning domain measures the ability of the domainto solve planning problems. This is calculated by trying to solve planningproblems with the learned domain, and checking if the obtained plans arecorrect. To check if a plan obtained is correct, we start from the initial stateof the problem and apply the actions of the plan until we obtain the finalstate. Then, if the final state is equal to the objective state, then the planis correct. A domain is valid if it is able to obtain valid plans for all theproblems in a set of validation problems. The task of validating a plan isperformed with the VAL tool used in the IPC.
24

Finally, in order to present reliable results and avoid the influence of therandomness of the inclusion of noise, each different experiment is carried onusing a 5 fold cross-validation technique. Using this technique, we split theinput plan traces into five subsets (or folds), selecting four of them as trainingdata and the remaining set as test data. The plan traces in the training dataare used to learn planning domains, where the plan traces in the test dataare used to validate them. Each experiment is executed five times, selectinga different fold as test data in each run. The results of the experiment arethe average result of every run.
4.1. Algorithms used
During the experimental process, different versions of PlanMiner andPlanMiner-N have been evaluated, where each one of the versions uses adifferent algorithm for generating the classification models. The aim of thisis to test the feasibility and robustness of the learning pipeline regardlessof the learning engine used in it. The classification algorithms used in thisexperimentation are ID3 [28], C4.5 [29], RIPPER [30] and NSLV [31]. A fulldescription of these algorithms can be found in the referenced papers.
In addition to classification algorithms, a set of state-of-the-art AMLalgorithms was selected as reference algorithms for the experimental process.These algorithms are ARMS [7], AMAN [32], OpMaker2 [33] and FAMA[9]. Due to the limitations of these algorithms for learning planning domainswith numerical information, they are only used during experimentation withSTRIPS domains.
In these experiments, the parameters of PlanMiner, PlanMiner-N, FF-Metric, VAL and the reference algorithms are set as default as noted by itsauthors in its reference works. Table 3 displays these parameters and theirimpact on a given algorithm’s performance. If an algorithm does not appearin the mentioned table it is because it has not any parameter to set beforeits execution. With regard to the different parameter settings, we include abrief description of them and their impact on the performance of the givenalgorithms (except for PlanMiner-N, as this information has already beengiven in the relevant sections above). PlanMiner-N uses the same parametersettings as PlanMiner in addition to its particular parameters setting. Thatsaid, for each algorithm the parameter’s settings are:
• Metric-FF parameters setting. MetricFF’s parameters weight thecomponents of the heuristic that governs the internal search process of
25

the planner. This weights change the importance that MetricFF givesto the estimated cost to the goal (h) and the cost of the current pathexplored (g) when guiding the search process. These parameters havebeen set as 1 to avoid interfere with the search process, giving the sameweight to both elements of the heuristic.
• ARMS parameters setting. The probability threshold of ARMS isused to filter which information contained in the input plan traces isconsidered as a constraint when building the logic formulas used tolearn action models. The lower the threshold, more information isconsidered. This increases the computation time of ARMS, but it mayconsider in the learning process information with a low appearance ratein the input data, but that can be useful. The probability thresholdvalue (0.7) is recommended by the authors of ARMS as is the best valuethat balances the amount of information processed and the results ofthe algorithm.
• AMAN parameters setting. AMAN builds iteratively a set of ac-tion models from a partial set data extracted from the input plan traces.Increasing the number of iterations leads to an increase in the numberof the set of action models generated. This increases the probabilityof finding the best set of action models possible at the cost of a big-ger computation time. The authors recommend the given number ofiterations (1500 iterations) as they are the most efficient way to obtaingood results.
4.2. Learning STRIPS domains
4.2.1. Classification algorithms comparison.
The experimental process begins by studying how the selected classifica-tion algorithm affects the performance of PlanMiner. Figure 4 shows theseperformances in terms of F-Score, while Table 4 shows the validity results ofthe battery of experiments. The Figure 4 fixes in X-axis the incompletenessdegree of the plan traces, and Tables are shorted by domains in order toimprove their readability. For the sake of readibility, this section presentsa summary version of the results, showing only the F-Score and Validitymetrics of the domains learned.
If we look closely at the results the figure 4 we can see the following:
26

PlanMiner parameters ValueSymbolic Regression acceptance threshold 0.02
Symbolic Regression timeout 300PlanMiner-N parameters Value
Statistical noise filtering threshold 5%Cluster’s quality alpha 0.6Cluster’s quality beta 0.4
Cluster’s acceptance criterion 0.05Irrelevant features detection threshold 0.05
MetricFF parametersH weight 1G weight 1
ARMS parametersProbability threshold 0.7AMAN parametersNumber of iterations 1500
Table 3: Settings of the different algorithms during the experimentation process.
0 3 5 10 20
0.4
0.5
0.6
0.7
0.8
0.9
1
Noise
F-Score
PM (ID3)PM-N (ID3)PM (C45)
PM-N (C45)PM (RIPPER)
PM-N (RIPPER)PM (NSLV)
PM-N (NSLV)
BlocksWorld
0 3 5 10 20
0.4
0.5
0.6
0.7
0.8
0.9
1
Noise
F-Score
PM (ID3)PM-N (ID3)PM (C45)
PM-N (C45)PM (RIPPER)
PM-N (RIPPER)PM (NSLV)
PM-N (NSLV)
Depots
0 3 5 10 20
0.4
0.5
0.6
0.7
0.8
0.9
1
Noise
F-Score
PM (ID3)PM-N (ID3)PM (C45)
PM-N (C45)PM (RIPPER)
PM-N (RIPPER)PM (NSLV)
PM-N (NSLV)
DriverLog
0 3 5 10 20
0.4
0.5
0.6
0.7
0.8
0.9
1
Noise
F-Score
PM (ID3)PM-N (ID3)PM (C45)
PM-N (C45)PM (RIPPER)
PM-N (RIPPER)PM (NSLV)
PM-N (NSLV)
ZenoTravel
Figure 4: Performance comparison of PlanMiner-N using different classification algorithmson STRIPS domains.
27

• BlocksWorld. PlanMiner-N (NSLV) shows perfect results throughoutthe whole experimentation and is impervious to the effects of noise.Compared to PlanMiner (NSLV), PlanMiner-N (NSLV) shows almost25% higher F-Score in the noisiest experiment. These differences alsooccur between PlanMiner-N (ID3) and PlanMiner (ID3), PlanMiner-N(C45) and PlanMiner (C45), and between PlanMiner-N (RIPPER) andPlanMiner (RIPPER), with an average variation of 10% throughout theexperimentation. In the most complex experiments, NSLV performsbetter than ID3, C45 and RIPPER.
• Depots. As with BlocksWorld, PlanMiner-N (NSLV) has a high re-sistance to noise, which is unchanged throughout the experimentation.PlanMiner (NSLV), on the other hand, suffers a severe drop in perfor-mance when some noise is included, which puts its F-Score almost 30points below PlanMiner-N. The rest of the algorithms have similar be-haviour to PlanMiner (NSLV), suffering from a performance drop whennoise is included in the plan traces. PlanMiner-N shows values around15-20% higher than PlanMiner using the same classification algorithm.
• DriverLog. The difference between PlanMiner-N (NSLV) and Plan-Miner (NSLV) when dealing with some noise is 15% F-Score, a dif-ference that increases to 30% using data with 20% noisy elements.PlanMiner-N (ID3) and PlanMiner(ID3) suffer an initial drop in perfor-mance (more pronounced in PlanMiner), but then stabilise and remainunchanged even at the highest noise levels. Using the C45 and RIP-PER classification algorithms, similar behaviour to NSLV is observed,but not as marked with PlanMiner-N showing unchanged in the initialexperiments, but dropping slightly in the final ones. Even so, the dropsare much smaller than those seen with PlanMiner.
• ZenoTravel. PlanMiner-N (NSLV) obtains perfect results until it en-counters 10% and 20% noise, where it drops to 98% and 96% F-Scorerespectively. PlanMiner (NSLV) drops from 100% F-Score to 74% whenencountering some noise, this drop continues (although somewhat morecontrolled) throughout the experimentation, presenting results below77% F-Score in the more complex experimental assumptions. The re-sults of PlanMiner-N with ID3, C45 and RIPPER behave similarly toPlanMiner-N (NSLV), showing some noise resilience compared to their
28

PlanMiner counterparts which lose a lot of performance when encoun-tering some noise.
In general, all algorithms exhibit identical behaviour with a large dropin performance when noise is included in the plan traces with the exceptionof PlanMiner-n (NSLV). Since the PlanMiner algorithm is not designed towork with noisy information, severe performance losses are to be expectedfor it. On the other hand, PlanMiner-N, the approach tested in this ex-perimentation, presents far better results than PlanMiner as expected too.PlanMiner-N shows some resistance to noise, but, its performance is highlydependent on the classification algorithm used in the learning pipeline. Thisdifference in the performance of PlanMiner-N can be seen in that, while ex-periments performed with NSLV remain somewhat stable throughout theexperiment, those using the ID3 classifier, for example, show a drop of 10-12points when noise is included in the plan strokes. This is due to the factthat, because of NSLV’s ability to obtain descriptive rules from the datasets(i.e. rules that contain all the information necessary to represent a set ofexamples), the algorithm is able to generate sets of rules that fully explainthe input information (including noisy examples). What is a priori a lossof generalisation of the algorithm is a blessing for PlanMiner-N, as it givesit extensive knowledge about the data, helping it to filter out the noise inthe data. The other algorithms do not enjoy this advantage, providing lessinformation to the learning algorithm. This means that PlanMiner is notable to correctly refine the models obtained with them. Nevertheless, if wecompare PlanMiner and PlanMiner-N using the same classifier, we see theclear superiority of the latter over the former regardless of the classificationalgorithm used. Using the ID3 classification algorithm, PlanMiner showsF-Score values below 30% in some experiments, while PlanMiner-N obtains15 points more F-Score in the same experiments. With C.45 and RIPPER,PlanMiner-N shows an improvement of around 20% over PlanMiner through-out the experimental process. Although the biggest difference in performancecan be observed with NSLV, since while PlanMiner obtains 58% F-Score re-sults, PlanMiner-N obtains perfect results. This indicates that the changesmade in PlanMiner-N are effective in addressing the learning problem usingnoisy input data.
In the experiments without noisy elements, those algorithms able to ob-tain valid planning domains with complete data can learn planning domainswith noise-free data. This is because without noise and incompleteness the
29

Domain NoiseAlgorithm
PM (ID3) PM-N (ID3) PM (C45) PM-N (C45) PM (RIPPER) PM-N (RIPPER) PM (NSLV) PM-N (NSLV)
Blocksworld
0% ✗ ✗ ✗ ✗ ✗ ✗ ✓ ✓
3% ✗ ✗ ✗ ✗ ✗ ✗ ✗ ✓
5% ✗ ✗ ✗ ✗ ✗ ✗ ✗ ✓
10% ✗ ✗ ✗ ✗ ✗ ✗ ✗ ✓
20% ✗ ✗ ✗ ✗ ✗ ✗ ✗ ✓
Depots
0% ✗ ✗ ✓ ✓ ✗ ✗ ✓ ✓
3% ✗ ✗ ✗ ✗ ✗ ✗ ✗ ✓
5% ✗ ✗ ✗ ✗ ✗ ✗ ✗ ✓
10% ✗ ✗ ✗ ✗ ✗ ✗ ✗ ✓
20% ✗ ✗ ✗ ✗ ✗ ✗ ✗ ✓
DriverLog
0% ✗ ✗ ✗ ✗ ✗ ✗ ✓ ✓
3% ✗ ✗ ✗ ✗ ✗ ✗ ✗ ✓
5% ✗ ✗ ✗ ✗ ✗ ✗ ✗ ✓
10% ✗ ✗ ✗ ✗ ✗ ✗ ✗ ✓
20% ✗ ✗ ✗ ✗ ✗ ✗ ✗ ✗
ZenoTravel
0% ✗ ✗ ✗ ✗ ✗ ✗ ✓ ✓
3% ✗ ✗ ✗ ✗ ✗ ✗ ✗ ✓
5% ✗ ✗ ✗ ✗ ✗ ✗ ✗ ✓
10% ✗ ✗ ✗ ✗ ✗ ✗ ✗ ✗
20% ✗ ✗ ✗ ✗ ✗ ✗ ✗ ✓
Table 4: Validity Results
input data are essentially the same, and PlanMiner-N performs the identi-cally as PlanMiner in the absence of noise in the plan traces. It is whennoise is included in the input data that these results begin to diverge, assteep performance drops cause the invalidity of the domains learned by thebulk of the learning algorithms. As a reminder, validity is very sensitiveto some domain deficiencies. The lack of a single effect renders the do-main totally invalid, and the performance drops of the algorithms are sopronounced that these shortcomings arise everywhere. The exception to thisrule is PlanMiner-N (NSLV) which demonstrates its supremacy over all otherapproaches by learning valid planning domains even in the most complex ex-periments. PlanMiner-N (NSLV) only fails to obtain valid domains withDriverLog and ZenoTravel in the experiments with the highest percentageof noise. In the case of the DriverLog domain, the invalidity is caused bythe creation of a series of spurious preconditions that prevent the correctreplication of the test problems, while in the case of ZenoTravel the problemthat causes the invalidity is the lack of an effect with a low occurrence rate,which is erroneously detected as noisy by the algorithm and eliminated.
Finally, in terms of time efficiency, PlanMiner-N is around 10-20% slowerthan PlanMiner. This is due to the need to study and apply the noise filterto all predicates, which consumes computational resources.
4.2.2. State-of-the-art algorithms comparison.
Next, the experimental process is going to study how PlanMiner (NSLV)–the version of PlanMiner with the highest performance– performs in com-parison to the reference algorithms. Figure 5 presents a comparative graph
30

0 3 5 10 20
0.4
0.5
0.6
0.7
0.8
0.9
1
Noise
F-Score
ARMSFAMA
Opmaker2AMAN
PM-N (NSLV)
BlocksWorld
0 3 5 10 20
0.4
0.5
0.6
0.7
0.8
0.9
1
Noise
F-Score
ARMSFAMA
Opmaker2AMAN
PM-N (NSLV)
Depots
0 3 5 10 20
0.4
0.5
0.6
0.7
0.8
0.9
1
Noise
F-Score
ARMSFAMA
Opmaker2AMAN
PM-N (NSLV)
DriverLog
0 3 5 10 20
0.4
0.5
0.6
0.7
0.8
0.9
1
Noise
F-Score
ARMSFAMA
Opmaker2AMAN
PM-N (NSLV)
ZenoTravel
Figure 5: Performance comparison of between PlanMiner-N and state-of-the-art algo-rithms on STRIPS domains.
that displays the F-Score of these algorithms. Additionally, in Table 5 thevalidity results of the battery of experiments are shown. For the sake ofreadability, to say that the X-axis of the Figure 5 represents the degree ofincompleteness of the input plan traces and that the Tables group the datadisplayed by the planning domain being learned. For the sake of readibility,the next lines are a summarised version of the experimental result, includingonly the F-Score and Validity results.
If we look closely at the results the figure 5 we can see the following:
• BlocksWorld. The benchmark algorithms suffer a steep drop through-out the experimentation, with results 20 to 30 points below the initialvalues with noise-free data. Of these, OPMaker2 is the worst performer,while ARMS and AMAN maintain similar performance. FAMA, on theother hand, suffers the least from the initial performance drop, but itsresults worsen severely as the complexity of the experiments increases.PlanMiner-N (NSLV), on the other hand, performs better than all ofthem, obtaining 100% F-Score results regardless of the experiment per-formed.
31

• Depots. Starting from similar initial results, when including noisydata in the input data, the performance of the benchmark algorithmsdrops by almost 25 points. FAMA and AMAN show some stabilityin subsequent experiments, while the rest of the state-of-the-art al-gorithms continue to lose performance down to around 50% F-Score.In contrast, PlanMiner-N (NSLV) suffers a negligible drop in F-Scorethroughout the experimentation, maintaining a much higher perfor-mance than the benchmark algorithms.
• DriverLog. The benchmark algorithms show differences of up to 50points between their initial results and those obtained in the more com-plex experiments. As usual, the steepest drops are found in the firstexperiments, when noise is included in the plan traces. In these exper-iments, the benchmark algorithms lose 20-25% F-Score. PlanMiner-N(NSLV) maintains a clear superiority over all benchmark algorithms.
• ZenoTravel. The benchmark algorithms present behaviour with largeinitial drops and constant, but more controlled drops as the experimen-tal conditions are tightened. Of these, AMAN maintains a somewhatmore stable behaviour, with more constant drops than the other bench-mark algorithms. In the experiments with a higher percentage of noisyelements in the input data, the benchmark algorithms show resultsclose to 50% F-Score, with the exception of AMAN, whose final resultsare around 70 points. However, PlanMiner-N (NSLV) shows resultsalmost 30 points higher than AMAN.
The benchmark algorithms perform poorly when faced with noise in theinput data. This behaviour was to be expected, since, with the exception ofAMAN, none of these algorithms was expressly designed to work under noisysituations. Therefore, PlanMiner-N (NSLV) outperforms these algorithms inall experiments. The difference in performance between PlanMiner-N (NSLV)and the reference algorithms ranges from 10-30 points in the experimentswith the lowest percentage of noise, to 30-60 points in the experiments withthe highest percentage of noise. In terms of performance, second place isheld by FAMA and AMAN. When faced with noise, both algorithms suffera significant loss in performance. AMAN maintains a certain resilience tonoise from that point on, showing little variability in results since then, whileFAMA does not enjoy this benefit, but its initial performance loss is smaller
32

Domain NoiseAlgorithm
ARMS FAMA OpMaker2 AMAN PM-N (NSLV)
Blocksworld
0% ✓ ✓ ✓ ✓ ✓
3% ✗ ✗ ✗ ✗ ✓
5% ✗ ✗ ✗ ✗ ✓
10% ✗ ✗ ✗ ✗ ✓
20% ✗ ✗ ✗ ✗ ✓
Depots
0% ✓ ✓ ✓ ✓ ✓
3% ✗ ✗ ✗ ✗ ✓
5% ✗ ✗ ✗ ✗ ✓
10% ✗ ✗ ✗ ✗ ✓
20% ✗ ✗ ✗ ✗ ✓
DriverLog
0% ✓ ✗ ✓ ✓ ✓
3% ✗ ✗ ✗ ✗ ✓
5% ✗ ✗ ✗ ✗ ✓
10% ✗ ✗ ✗ ✗ ✓
20% ✗ ✗ ✗ ✗ ✗
ZenoTravel
0% ✓ ✓ ✗ ✓ ✓
3% ✗ ✗ ✗ ✗ ✓
5% ✗ ✗ ✗ ✗ ✓
10% ✗ ✗ ✗ ✗ ✗
20% ✗ ✗ ✗ ✗ ✓
Table 5: Validity Results
than AMAN’s. This causes FAMA to show slightly better average results.This causes FAMA to show somewhat better average results than AMAN.
As in the previous experimentation with the different versions of Plan-Miner, the generalised loss of performance of the algorithms when noise isincluded has a negative impact on the validity results of the domains learnedwith them. Without noise, the benchmark algorithms perform similarly towhat we saw in the experimentation presented in the PlanMiner’s paper [1],but when noise is included, this is no longer true, as the multiple errors inthe planning domains negatively affect the validity of the domains.
4.3. Learning Numerical domains
Finally, the experimental process studies how the selected classificationalgorithm affects the performance of PlanMiner-N when learning planningdomains with numerical information. The classification algorithms used inthis experimentation are the same used in the last experimental process,except for ID3. The results of this experimentation are divided between the
33

0 3 5 10 200.2
0.3
0.4
0.5
0.6
0.7
0.8
0.9
1
Noise
F-Score
PM (C45)PM-N (C45)
PM (RIPPER)PM-N (RIPPER)
PM (NSLV)PM-N (NSLV)
Depots
0 3 5 10 200.2
0.3
0.4
0.5
0.6
0.7
0.8
0.9
1
Noise
F-Score
PM (C45)PM-N (C45)
PM (RIPPER)PM-N (RIPPER)
PM (NSLV)PM-N (NSLV)
DriverLog
0 3 5 10 200.2
0.3
0.4
0.5
0.6
0.7
0.8
0.9
1
Noise
F-Score
PM (C45)PM-N (C45)
PM (RIPPER)PM-N (RIPPER)
PM (NSLV)PM-N (NSLV)
Rovers
0 3 5 10 200.2
0.3
0.4
0.5
0.6
0.7
0.8
0.9
1
Noise
F-Score
PM (C45)PM-N (C45)
PM (RIPPER)PM-N (RIPPER)
PM (NSLV)PM-N (NSLV)
Satellite
0 3 5 10 200.2
0.3
0.4
0.5
0.6
0.7
0.8
0.9
1
Noise
F-Score
PM (C45)PM-N (C45)
PM (RIPPER)PM-N (RIPPER)
PM (NSLV)PM-N (NSLV)
ZenoTravel
Figure 6: Performance comparison of PlanMiner-N using different classification algorithmson Numerical domains.
Figure 6 and the Table 6. First, Figure 6 contains a graph that compares thealgorithms in terms of F-Score, while, Table 6 contains the validity results ofPlanMiner with the different classification algorithms. In order to improvethe readability of the results, Figure 6 set the incompleteness degree of theplan traces in the X-axis, and Table 6 shorts the results given the domainfrom which they were obtained. As with the experimental blocks presentedabove, this section presents a summary version of the results.
If we look closely at the results in Figure 6 we can see the following:
• Depots. PlanMiner-N (NSLV) maintains 88% F-Score levels even inthe complex experiments, losing less than 10% F-Score compared to the
34

noiseless results. PlanMiner (NSLV) on the other hand suffers a dropof 20 using 3% of noisy elements, its final performance is below 70%F-Score in the experiments with 20% of noisy information. PlanMiner-N (C45) suffers a large F-Score loss of 13 points in the experimentwith 5% noisy data, which stabilises somewhat in the following exper-iments. PlanMiner (C45), on the other hand, suffers a steady drop inperformance, bringing its final F-Score below 40 points. PlanMiner-N(RIPPER) and PlanMiner (RIPPER) show the biggest difference of allthe algorithms, since, where PlanMiner-N (RIPPER) remains constantthroughout the experimentation, suffering only F-Score losses in themore complex experiments, PlanMiner (RIPPER) drops steadily.
• DriverLog. The results of PlanMiner-N (C45), PlanMiner-N (RIP-PER) and PlanMiner-N (NSLV) is similar regardless of the classifi-cation algorithm used. All approaches show a slight drop in F-Scorethroughout the experimentation, with intervals where the F-Score lossis zero. In general, these approximations lose on average 6 F-Scorepoints between the experimentation without noisy data and the onewith more noisy data. On the other hand, the experimentation onPlanMiner (C45), PlanMiner (RIPPER) and PlanMiner (NSLV) showsa steep F-Score drop of more than 20 points when noise is included.PlanMiner (C45) and PlanMiner (NSLV) moderate this tendency alittle to reach an F-Score of around 55% in the final experiments, Plan-Miner (RIPPER) on the other hand does not, reaching values below 40F-Score points.
• Rovers. PlanMiner-N (NSLV) is little affected by noise, suffering a sig-nificant F-Score loss of 5 points in the experimentation with 5% noisydata. In the rest of the experimentation, the F-Score loss is minimal.PlanMiner (NSLV) loses 40% F-Score when noise is found in the inputtraces, a big contrast when compared to the results of PlanMiner-N(NSLV). Although the other proposals behave similarly, the F-Scoreloss of PlanMiner (NSLV) is the most pronounced in the whole exper-iment. PlanMiner-N (C45) performs at 72 points, compared to Plan-Miner (C45) at 51 points, and PlanMiner-N (RIPPER) with a finalF-Score of 73%, 20 points higher than PlanMiner (RIPPER).
• Satellite. Similar to DriverLog, the results of PlanMiner-N (C45),PlanMiner-N (RIPPER) and PlanMiner-N (NSLV) show a similar trend:
35

a slight but steady drop in F-Score as the experimental assumptionsbecome more complicated. These algorithms show F-Score drops of11% in the more complex experiments compared to the no noise ex-periment. The results of the PlanMiner experiment show drops of 25points with the C45 classifier and RIPPER, and more than 40 pointswith NSLV when faced with some noise. PlanMiner (NSLV) maintainsthe results in the rest of the experimental assumptions, leaving its fi-nal performance at 48 points, while PlanMiner (C45) and PlanMiner(RIPPER) obtain an F-Score of 58% and 49% respectively.
• ZenoTravel. PlanMiner-N (NSLV) remains unchanged at certain noiselevels, with an F-Score of 89% at 3% noise. PlanMiner-N (NSLV) losesaround 11% F-Score in the more complex experimentation. PlanMiner(RIPPER) and (C45) lose some F-Score until experimentation with5% noise, but while PlanMiner (C45) shows some resistance to noise,(RIPPER) loses performance steadily. On the other hand, PlanMiner(NSLV), PlanMiner (C45) and PlanMiner (RIPPER) show a large ini-tial drop, followed by a certain stabilisation of the results. The F-Scorevalue in the most complex experiments is 30 points PlanMiner (RIP-PER), 40 points PlanMiner (C45) and 47 points PlanMiner (NSLV).
PlanMiner demonstrates some “natural resistance” to noise in this exper-iments, showing somewhat better results than the experiments with STRIPSdomains. Still, the difference in performance between the version of Plan-Miner presented in this paper and the previous version is remarkable. Us-ing the C.45 classifier, PlanMiner-N performs around 30 points better thanPlanMiner, which can reach up to 50 points difference in certain planningdomains. On the other hand, with the RIPPER classification algorithm, itmaintains in all experiments a higher performance than 70% with PlanMiner-N, while with PlanMiner it reaches values around 30 F-Score points. Finally,with NSLV the same process is repeated (i.e. F-Score differences close to 4%),although aggravated with very significant decreases in performance simplyby including noise. This contrasts sharply with PlanMiner-N (NSLV) whichremains relatively unperturbed by noise, far outperforming the other ap-proaches tested in the experiment. The aforementioned “natural resistance”to noise is given by the way the feature discovery component works, namelyit is a product of the design of the symbolic regressor. Since the symbolicregressor does not seek exact results, but rather takes approximate (but as
36

close to exact as possible) results as correct, the effect of the inclusion of cer-tain noisy elements is diluted. Although these elements increase the error ofthe expression that is being learned, it is possible that the expression meetsthe acceptance criteria of the algorithm and is accepted by the learning al-gorithm. Unfortunately, this method is not infallible, and if insufficient datais available or if there are outliers with the potential to greatly perturb theerror calculation, PlanMiner is unable to correctly learn the target expres-sion. The inclusion of noise treatment methods increases this resistance, notso much because they influence the behaviour of the regression algorithm,but because they alter the noise problem and shift it to an incompletenessproblem. As seen in the empirical studies of PlanMiner [1], incompleteness ishighly tolerated by PlanMiner (and thus by PlanMiner-N) improving greatlythe performance of the algorithm. Looking at the evolution of the accuracyand recall metrics of the algorithms throughout the experimentation, we cansee how noise affects the first metric much more than the second. This isbecause any amount of noisy elements not addressed by the noise filteringprocesses triggers the bias problems described in the paper of PlanMiner.As we have seen in previous experiments, the property of NSLV to generatedescriptive rules plays in its favour against bias problems. This particularcase is no exception, and it is the main reason why NSLV performs betterthan the other classifiers.
Validity experiments show again the effectiveness of the methods imple-mented in PlanMiner-N for dealing with noise. If we compare the results ofPlanMiner and PlanMiner-N, we see that PlanMiner’s “natural resistance”to noise when learning numerical domains is not infallible and does not guar-antee obtaining valid domains. The reason for this is as previously indicatedearlier in the experimentation: the validity criteria are very demanding, anda single erroneous effect causes the entire planning domain to be invalid.PlanMiner can meet these criteria in some experiments (using the RIPPERclassification algorithm), but generally, this is not true. PlanMiner-N on theother hand does, at least under certain noise levels.
In terms of time efficiency, PlanMiner-N is 2% slower than PlanMiner,even outperforming it in some experiments. This is because, in the faceof noise, PlanMiner may spend much more time trying to fit an arithmeticexpression (even using all the time allowed for this and reaching the timeoutthreshold), which compensates for the time spent by PlanMiner-N in applyingthe different anti-noise processes implemented.
37

Domain NoiseAlgorithm
PM (C4.5) PM-N (C4.5) PM (RIPPER) PM-N (RIPPER) PM (NSLV) PM-N (NSLV)
Depots
0% ✓ ✓ ✗ ✗ ✓ ✓
3% ✗ ✓ ✗ ✗ ✗ ✓
5% ✗ ✗ ✗ ✗ ✗ ✗
10% ✗ ✗ ✗ ✗ ✗ ✗
20% ✗ ✗ ✗ ✗ ✗ ✗
DriverLog
0% ✗ ✗ ✗ ✗ ✓ ✓
3% ✗ ✗ ✗ ✗ ✗ ✓
5% ✗ ✗ ✗ ✗ ✗ ✗
10% ✗ ✗ ✗ ✗ ✗ ✗
20% ✗ ✗ ✗ ✗ ✗ ✗
Rovers
0% ✗ ✗ ✓ ✓ ✓ ✓
3% ✗ ✗ ✗ ✗ ✗ ✓
5% ✗ ✗ ✗ ✗ ✗ ✗
10% ✗ ✗ ✗ ✗ ✗ ✗
20% ✗ ✗ ✗ ✗ ✗ ✗
Satellite
0% ✗ ✗ ✓ ✓ ✓ ✓
3% ✗ ✗ ✓ ✓ ✗ ✓
5% ✗ ✗ ✗ ✓ ✗ ✓
10% ✗ ✗ ✗ ✗ ✗ ✓
20% ✗ ✗ ✗ ✗ ✗ ✗
ZenoTravel
0% ✗ ✗ ✗ ✗ ✓ ✓
3% ✗ ✗ ✗ ✗ ✗ ✓
5% ✗ ✗ ✗ ✗ ✗ ✗
10% ✗ ✗ ✗ ✗ ✗ ✗
20% ✗ ✗ ✗ ✗ ✗ ✗
Table 6: Validity Results
5. Conclusions
This paper presents a work about including a series of methods to thedomain learning algorithm PlanMiner in order to increase its resistance tonoise in the input data. The resultant algorithm is called PlanMiner-N andthe new methods that implements are based on the preprocessing of theinput data and the post-processing of the classification models used duringthe learning process of PlanMiner. The preprocessing of the input data isbased on the discretization of noisy numerical data to automatically detectand handle outliers and to group similar values, while the postprocessingaims to unify the information contained in the learning models.
Results showed that these new methods increase notably the resistanceof PlanMiner-N to noise. PlanMiner-N outperforms the original algorithm aswell as the reference algorithms used in the experiments. These experimentswere carried out using two different sets of input datasets and modifyingthem with three types of noise.
The authors are exploring other methods to improve the domain learningalgorithm. As PlanMiner (and now PlanMiner-N) disassociates the actionsof the plans used as input when creating the datasets which later are used inthe learning process, the authors are considering the option of design a new
38

procedure able to take the contextual information contained in the orderof the actions in the input plans and include it in the learning process inorder to improve its performance. Another improvement to the PlanMineralgorithms that is being considered is the learning of more complex planningdomains such as planning domains with conditional or stochastic actions.
6. Acknowledgements
This research is being developed and partially funded by the SpanishMINECO R&D Project RTI2018-098460-B-I00
References
[1] J. A. Segura-Muros, R. Perez, J. Fernandez-Olivares, Discovering rela-tional and numerical expressions from plan traces for learning actionschemes, Applied Intelligence (2021).
[2] R. E. Fikes, N. J. Nilsson, Strips: A new approach to the application of theorem proving to problem solving,Artificial Intelligence 2 (3) (1971) 189–208.doi:10.1016/0004-3702(71)90010-5.URL http://www.sciencedirect.com/science/article/pii/0004370271900105
[3] M. Ghallab, A. Howe, C. Knoblock, D. Mcder-mott, A. Ram, M. Veloso, D. Weld, D. Wilkins,PDDL—The Planning Domain Definition Language (1998).URL http://citeseerx.ist.psu.edu/viewdoc/summary?doi=10.1.1.37.212
[4] S. B. Kotsiantis, I. Zaharakis, P. Pintelas, Supervised machine learning:A review of classification techniques, Emerging artificial intelligence ap-plications in computer engineering 160 (2007) 3–24.
[5] S. Chatterjee, A. S. Hadi, Regression analysis by example, John Wiley& Sons, 2015.
[6] S. Jimenez, T. D. L. Rosa, S. Fernandez, F. Fernandez, D. Borrajo,A review of machine learning for automated planning, The KnowledgeEngineering Review 27 (4) (2012) 433–467.
[7] Q. Yang, K. Wu, Y. Jiang, Learning action models from plan exam-ples using weighted MAX-SAT., Artificial Intelligence Journal. (2007)107–143.
39

[8] H. H. Zhuo, Q. Yang, D. H. Hu, L. Li,Learning complex action models with quantifiers and logical implications,Artificial Intelligence 174 (18) (2010) 1540 – 1569.doi:https://doi.org/10.1016/j.artint.2010.09.007.URL http://www.sciencedirect.com/science/article/pii/S0004370210001566
[9] D. Aineto, S. J. Celorrio, E. Onaindia,Learning action models with minimal observability,Artificial Intelligence 275 (2019) 104 – 137.doi:https://doi.org/10.1016/j.artint.2019.05.003.URL http://www.sciencedirect.com/science/article/pii/S0004370218304259
[10] S. N. Cresswell, T. L. McCluskey, M. M. West, Acquiring planning do-main models using locm, The Knowledge Engineering Review 28 (2)(2013) 195–213. doi:10.1017/S0269888912000422.
[11] P. Gregory, A. Lindsay, Domain model acquisition in domains with ac-tion costs., in: ICAPS, 2016, pp. 149–157.
[12] P. Gregory, A. Lindsay, J. Porteous, Domain model acquisition withmissing information and noisy data, in: Proceedings of the ICAPS, 2017.
[13] C. Rodrigues, P. Gerard, C. Rouveirol, Incremental learning of relationalaction models in noisy environments., in: ILP, Springer, 2010, pp. 206–213.
[14] K. Mourao, L. S. Zettlemoyer, R. P. A. Petrick, M. Steedman, LearningSTRIPS operators from noisy and incomplete observations, Proceedingsof the Twenty-Eighth Conference on Uncertainty in Artificial Intelli-gence (2012).
[15] K. Sadohara, Learning of boolean functions using support vector ma-chines, in: International Conference on Algorithmic Learning Theory,Springer, 2001, pp. 106–118.
[16] H. M. Pasula, L. S. Zettlemoyer, L. P. Kaelbling, Learning symbolicmodels of stochastic domains, Journal of Artificial Intelligence Research29 (2007) 309–352.
[17] I. Var, Multivariate data analysis, vectors 8 (2) (1998) 125–136.
40

[18] P. E. Hart, N. J. Nilsson, B. Raphael, A formal basis for the heuristicdetermination of minimum cost paths, IEEE transactions on SystemsScience and Cybernetics 4 (2) (1968) 100–107.
[19] A. Gonzalez, R. Perez, Improving the genetic algorithm of slave, Math-ware and Soft Computing 16 (2009) 59–70.
[20] S. Garcıa, J. Luengo, F. Herrera, Data preprocessing in data mining,Springer, 2015.
[21] H. Liu, F. Hussain, C. L. Tan, M. Dash, Discretization: An enablingtechnique, Data mining and knowledge discovery 6 (4) (2002) 393–423.
[22] S. Lamrous, M. Taileb, Divisive hierarchical k-means, in: 2006 Inter-national Conference on Computational Inteligence for Modelling Con-trol and Automation and International Conference on Intelligent AgentsWeb Technologies and International Commerce (CIMCA’06), IEEE,2006, pp. 18–18.
[23] J. MacQueen, et al., Some methods for classification and analysis ofmultivariate observations, in: Proceedings of the fifth Berkeley sympo-sium on mathematical statistics and probability, Vol. 1, Oakland, CA,USA, 1967, pp. 281–297.
[24] L. Kaufman, P. J. Rousseeuw, Finding groups in data: an introductionto cluster analysis, Vol. 344, John Wiley & Sons, 2009.
[25] D. Long, M. Fox, The 3rd international planning competition: Resultsand analysis, Journal of Artificial Intelligence Research 20 (2003) 1–59.
[26] J. Hoffmann, The metric-ff planning system: Translating“ignoring deletelists”to numeric state variables, Journal of artificial intelligence research20 (2003) 291–341.
[27] R. Howey, D. Long, Val’s progress The automatic validation tool forpddl2.1 used in the international planning competition, in: Proceedingsof the ICAPS 2003 workshop on The Competition: Impact, Organiza-tion, Evaluation, Benchmarks, Trento, Italy, 2003, pp. 28–37.
[28] J. R. Quinlan, Induction of decision trees, Machine learning 1 (1) (1986)81–106.
41

[29] J. Quinlan, C4. 5: programs for machine learning, Elsevier, 2014.
[30] W. W. Cohen, Fast effective rule induction, in: Machine learning pro-ceedings 1995, Elsevier, 1995, pp. 115–123.
[31] D. Garcıa, J. C. Gamez, A. Gonzalez, R. Perez,An interpretability improvement for fuzzy rule bases obtained by the iterative rule learning approach,Int. J. Approx. Reasoning 67 (C) (2015) 37–58.doi:10.1016/j.ijar.2015.09.001.URL https://doi.org/10.1016/j.ijar.2015.09.001
[32] H. H. Zhuo, T. A. Nguyen, S. Kambhampati, Refining incomplete plan-ning domain models through plan traces., in: IJCAI, 2013, pp. 2451–2458.
[33] T. L. McCluskey, S. Cresswell, N. E. Richardson, M. M. West, Auto-mated acquisition of action knowledge, in: International Conference onAgents and Artificial Intelligence (ICAART), 2009.
42