learning sentiment and semantic relatedness in user ... · learning sentiment and semantic...
TRANSCRIPT

Learning Sentiment and Semantic Relatedness inUser Generated Content Using Neural Models
by
Henry Michel NassifB.S., Massachusetts Institute of Technology (2015)
Submitted to the Department of Electrical Engineering and ComputerScience
in partial fulfillment of the requirements for the degree of
Master of Engineering in Electrical Engineering and Computer Science
at the
MASSACHUSETTS INSTITUTE OF TECHNOLOGY
June 2016
c○ Massachusetts Institute of Technology 2016. All rights reserved.
Author . . . . . . . . . . . . . . . . . . . . . . . . . . . . . . . . . . . . . . . . . . . . . . . . . . . . . . . . . . . . . . . .Department of Electrical Engineering and Computer Science
May 21, 2016Certified by. . . . . . . . . . . . . . . . . . . . . . . . . . . . . . . . . . . . . . . . . . . . . . . . . . . . . . . . . . . .
James GlassSenior Research Scientist
Thesis SupervisorCertified by. . . . . . . . . . . . . . . . . . . . . . . . . . . . . . . . . . . . . . . . . . . . . . . . . . . . . . . . . . . .
Mitra MohtaramiPostdoctoral Associate
Thesis Supervisor
Accepted by . . . . . . . . . . . . . . . . . . . . . . . . . . . . . . . . . . . . . . . . . . . . . . . . . . . . . . . . . . .Christopher J. Terman
Chairman, Masters of Engineering Thesis Committee

2

Learning Sentiment and Semantic Relatedness in User
Generated Content Using Neural Models
by
Henry Michel Nassif
Submitted to the Department of Electrical Engineering and Computer Scienceon May 21, 2016, in partial fulfillment of the
requirements for the degree ofMaster of Engineering in Electrical Engineering and Computer Science
Abstract
Online review platforms and discussion forums are filled with insights that are criticalto unlocking the value in user-generated content. In this thesis, we investigate twomajor Natural Language Processing (NLP) research areas: Aspect-Based SentimentAnalysis (ABSA) and Community Question Answering (cQA) ranking problems, forthe purposes of harnessing and understanding the sentiment and semantics expressedin review platforms and discussion forums. Riding on the recent trends of deeplearning, this work applies neural networks to solve these tasks. We design neural-based models including Convolutional Neural Networks (CNNs) and Long Short-TermMemory Networks (LSTMs) to capture the semantic and sentiment information.
Aspect Based Sentiment Analysis is concerned with predicting the aspect cate-gories mentioned in a sentence and the sentiments associated with each aspect cat-egory. We refer to these tasks as Aspect Category Detection and Aspect categorySentiment Prediction, respectively. We present a neural-based model with convolu-tional layers and Multi-Layer Perceptron (MLP) to address these tasks. The modeluses the word vector representations generated using word2vec and computes the con-volutional vectors of the user-generated reviews. These vectors are then employed topredict the aspect categories and their corresponding sentiments. We evaluate theperformance of our ABSA models on a restaurant review dataset and show that ourresults on the aspect category detection task and aspect category sentiment predictiontask outperform the baselines.
The Community Question Answering system is concerned with automatically find-ing the related questions in an existing set of questions, and finding the relevantanswers to a new question. We address these ranking problems, which we respec-tively refer to as similar-Question Retrieval and Answer Selection. We present aneural-based model with stacked bidirectional LSTMs and MLP to address thesetasks. The model generates the vector representations of the question-question orquestion-answer pairs and computes their semantic similarity scores. These scoresare then used to rank and predict relevancies. Extensive experiments demonstratethat our cQA models for the question retrieval and answer selection tasks outperform
3

the baselines if enough training data is available.
Thesis Supervisor: James GlassTitle: Senior Research Scientist
Thesis Supervisor: Mitra MohtaramiTitle: Postdoctoral Associate
4

Acknowledgments
I would like to express my deepest gratitude to my advisers James Glass and Mitra
Mohtarami for their guidance, support and accessibility throughout this thesis. James
met with me on a regular basis, and provided me with inspiration and insights that
helped advance my research. I am incredibly grateful to have had the opportunity to
work with such a generous, patient and knowledgeable supervisor.
Mitra was the best day-to-day mentor I could have asked for. She was always
available to answer my questions, and help me overcome setbacks. She valued my
work as much as I did, and for that, I am thankful. Working with James, Mitra and
the Spoken Language Systems group was a great learning experience that has left a
big impression on me.
I am most grateful to my mom, dad and brother for their eternal love and support,
and for being there for me under any and all circumstances. Without them, none of
this would have been possible. I also cannot but thank my uncles, aunts and cousins
because I am blessed to have them all in my life.
Finally, I would like to thank my friends, on both sides of the Atlantic, for the
good times we spent together and the many more to come.
This thesis was supported in part by Qatar Computing Research Institute (QCRI).
5

6
Contents
1 Introduction 19
1.1 Motivation . . . . . . . . . . . . . . . . . . . . . . . . . . . . . . . . . 19
1.1.1 Research Scope . . . . . . . . . . . . . . . . . . . . . . . . . . 23
1.1.2 Goal . . . . . . . . . . . . . . . . . . . . . . . . . . . . . . . . 25
1.2 Problem Description . . . . . . . . . . . . . . . . . . . . . . . . . . . 25
1.2.1 Aspect Based Sentiment analysis . . . . . . . . . . . . . . . . 25
1.2.2 Community Question Answering . . . . . . . . . . . . . . . . . 28
1.3 Contributions . . . . . . . . . . . . . . . . . . . . . . . . . . . . . . . 30
1.3.1 Aspect-Based Sentiment Analysis . . . . . . . . . . . . . . . . 30
1.3.2 Community-Question Answering . . . . . . . . . . . . . . . . 30
1.4 Thesis Outline . . . . . . . . . . . . . . . . . . . . . . . . . . . . . . . 31
2 Background 33
2.1 Convolutional Neural Networks . . . . . . . . . . . . . . . . . . . . . 33
2.2 Recurrent Neural Networks . . . . . . . . . . . . . . . . . . . . . . . . 34
2.3 Long Short-Term Memory Recurrent Neural Networks . . . . . . . . . 38
2.4 Word Vectors . . . . . . . . . . . . . . . . . . . . . . . . . . . . . . . 39
3 Related Work 45
3.1 Aspect-Based Sentiment analysis . . . . . . . . . . . . . . . . . . . . 45
3.1.1 Aspect Term Extraction and Category Detection . . . . . . . 46
3.1.2 Aspect Sentiment Prediction . . . . . . . . . . . . . . . . . . . 47
3.2 Community Question Answering . . . . . . . . . . . . . . . . . . . . . 49
7

3.2.1 Question Retrieval Task . . . . . . . . . . . . . . . . . . . . . 50
3.2.2 Answer Selection Task . . . . . . . . . . . . . . . . . . . . . . 52
4 Aspect-Based Sentiment Analysis 55
4.1 Method . . . . . . . . . . . . . . . . . . . . . . . . . . . . . . . . . . 55
4.1.1 Model Architecture . . . . . . . . . . . . . . . . . . . . . . . . 56
4.1.2 Aspect Category Detection . . . . . . . . . . . . . . . . . . . . 57
4.1.3 Aspect Category Sentiment Prediction . . . . . . . . . . . . . 58
4.1.4 Hyper-parameters . . . . . . . . . . . . . . . . . . . . . . . . . 59
4.2 Evaluation and Results . . . . . . . . . . . . . . . . . . . . . . . . . . 59
4.2.1 Dataset . . . . . . . . . . . . . . . . . . . . . . . . . . . . . . 59
4.2.2 Evaluation Metrics . . . . . . . . . . . . . . . . . . . . . . . . 59
4.2.3 Baselines . . . . . . . . . . . . . . . . . . . . . . . . . . . . . . 62
4.2.4 Overall Performance on Aspect Category Detection . . . . . . 63
4.2.5 Overall Performance on Aspect Category Sentiment Prediction 66
4.3 Visualization . . . . . . . . . . . . . . . . . . . . . . . . . . . . . . . 68
4.4 Summary . . . . . . . . . . . . . . . . . . . . . . . . . . . . . . . . . 70
5 Community Question Answering 77
5.1 Method . . . . . . . . . . . . . . . . . . . . . . . . . . . . . . . . . . 78
5.1.1 Stacked Bidirectional LSTMs for cQA . . . . . . . . . . . . . 78
5.1.2 Hyper-parameters . . . . . . . . . . . . . . . . . . . . . . . . . 81
5.2 Evaluation and Results . . . . . . . . . . . . . . . . . . . . . . . . . . 82
5.2.1 Dataset . . . . . . . . . . . . . . . . . . . . . . . . . . . . . . 82
5.2.2 Evaluation Metrics . . . . . . . . . . . . . . . . . . . . . . . . 83
5.2.3 Baselines . . . . . . . . . . . . . . . . . . . . . . . . . . . . . . 84
5.2.4 Overall Performance on Question Retrieval Task . . . . . . . . 85
5.2.5 Overall Performance on Answer Selection Task . . . . . . . . . 86
5.3 Model Visualization . . . . . . . . . . . . . . . . . . . . . . . . . . . . 88
5.4 Summary . . . . . . . . . . . . . . . . . . . . . . . . . . . . . . . . . 89
8
6 Conclusion 93
6.1 Contributions . . . . . . . . . . . . . . . . . . . . . . . . . . . . . . . 93
6.1.1 Aspect-Based Sentiment analysis . . . . . . . . . . . . . . . . 93
6.1.2 Community Question Answering . . . . . . . . . . . . . . . . . 94
6.2 Directions for Future Research . . . . . . . . . . . . . . . . . . . . . . 94
6.2.1 Aspect-Based Sentiment analysis . . . . . . . . . . . . . . . . 94
6.2.2 Community Question Answering . . . . . . . . . . . . . . . . . 95
A Visualizations of Community Question-Answering System 97
A.1 Examples . . . . . . . . . . . . . . . . . . . . . . . . . . . . . . . . . 97
A.1.1 Example 1 . . . . . . . . . . . . . . . . . . . . . . . . . . . . . 97
A.1.2 Example 2 . . . . . . . . . . . . . . . . . . . . . . . . . . . . . 99
A.1.3 Example 3 . . . . . . . . . . . . . . . . . . . . . . . . . . . . . 99
A.1.4 Example 4 . . . . . . . . . . . . . . . . . . . . . . . . . . . . . 100
A.1.5 Example 5 . . . . . . . . . . . . . . . . . . . . . . . . . . . . . 101
A.1.6 Example 6 . . . . . . . . . . . . . . . . . . . . . . . . . . . . . 103
A.1.7 Example 7 . . . . . . . . . . . . . . . . . . . . . . . . . . . . . 105
A.1.8 Example 8 . . . . . . . . . . . . . . . . . . . . . . . . . . . . . 106
A.1.9 Example 9 . . . . . . . . . . . . . . . . . . . . . . . . . . . . . 106
A.1.10 Example 10 . . . . . . . . . . . . . . . . . . . . . . . . . . . . 109
A.1.11 Example 11 . . . . . . . . . . . . . . . . . . . . . . . . . . . . 110
A.1.12 Example 12 . . . . . . . . . . . . . . . . . . . . . . . . . . . . 111
9

10
List of Figures
1-1 The rise of social media. Figure 1-1(a) shows the popularity of some
social media platforms from 2012 to 2014, and Figure 1-1(b) shows the
fraction of adults using some of the popular social media platforms. . 20
1-2 Social Media Categories (Sorokina, 2015) . . . . . . . . . . . . . . . 21
1-3 Example of a relationship network (Facebook). . . . . . . . . . . . . . 21
1-4 Example of a media sharing network (Instagram). . . . . . . . . . . . 21
1-5 Example of an online review network (Yelp). . . . . . . . . . . . . . . 22
1-6 Example of a social publishing platform (Tumblr). . . . . . . . . . . . 22
1-7 Example of a discussion forum (Quora). . . . . . . . . . . . . . . . . . 22
1-8 Example of e-commerce platform (Fiverr). . . . . . . . . . . . . . . . 23
1-9 Example of a bookmarking site (Pinterest). . . . . . . . . . . . . . . 23
1-10 Example of an interest-based network (Goodreads). . . . . . . . . . . 24
1-11 Online question answering platform. This figure shows a community
question answering platform with one question and four provided an-
swers. The second answer is selected as the best answer with respect
to the question. . . . . . . . . . . . . . . . . . . . . . . . . . . . . . . 28
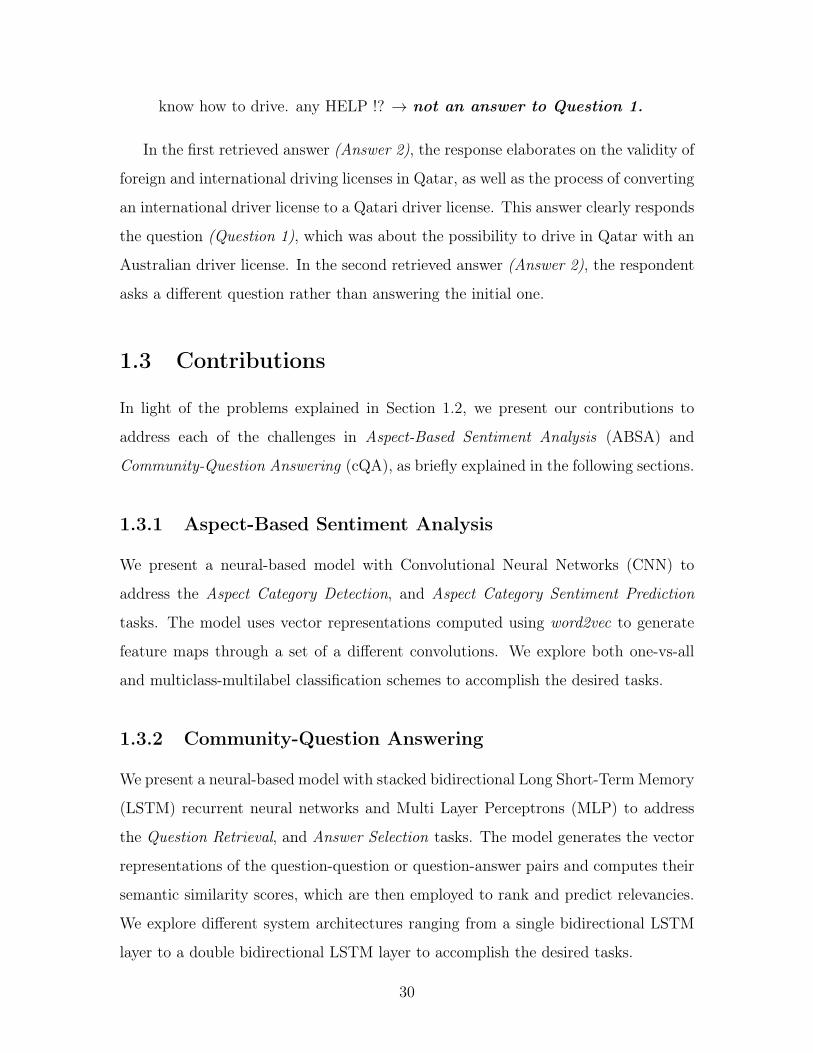
2-1 Layers in a Convolutional Neural Network. A CNN is a succession of
Convolution and Subsampling layers, preceding a fully connected layer.
Based on (LeCun et al., 1998; Strigl et al., 2010). . . . . . . . . . . 34
2-2 The Convolution Process (Ian Goodfellow and Courville, 2016). This
figure shows the process of convolving a 3x3 filter (yellow) with a 5x5
image (green) to obtain a 3x3 feature map. . . . . . . . . . . . . . . . 35
11
2-3 The Subsampling Step in CNN. This figure shows the process of sub-
sampling a 4x4 image using a maxpooling operation and a 2x2 pool
size (Karpathy and Fei-Fei, 2016). . . . . . . . . . . . . . . . . . . . 35
2-4 An Unrolled Recurrent Neural Network. The connections between
units of an RNN form a directed cycle. (Olah, 2015). . . . . . . . . . 36
2-5 Repeating module in a standard Recurrent Neural Network. Each
repeating module in a traditional RNN has a single layer (here tanh)
(Olah, 2015). . . . . . . . . . . . . . . . . . . . . . . . . . . . . . . . 36
2-6 Repeating module in a Long Short-Term Memory Network. Each re-
peating module has four layers (input gate layer, forget gate layer, tanh
layer and output gate layer). (Olah, 2015). . . . . . . . . . . . . . . . 37
2-7 Notations for the Figure 2-6 (Olah, 2015). . . . . . . . . . . . . . . . 37
2-8 Bidirectional Long Short-Term Memory Recurrent Neural Network.
Bidirectional LSTMs are equivalent to two LSTMs independently up-
dating their parameters by processing the input either in forward or
backward direction (Schuster and Paliwal, 1997). . . . . . . . . . . . 39
2-9 Continuous Bag-of-words model (Mikolov et al., 2013a). The output is
computed as the weighted average of the vectors for the input context
words, using the hidden layer weight matrix (Rong, 2014). . . . . . . 41
2-10 Skip-Gram model (Mikolov et al., 2013a). . . . . . . . . . . . . . . . 42
2-11 Two-dimensional PCA projection of the 1000-dimensional Skip-gram
vectors of countries and their capital cities, generated by Word2vec
(Mikolov et al., 2013b). . . . . . . . . . . . . . . . . . . . . . . . . . 43
4-1 The general architecture of the ABSA model. The feature maps are
produced by convolving the input sentence with filters of different sizes. 56
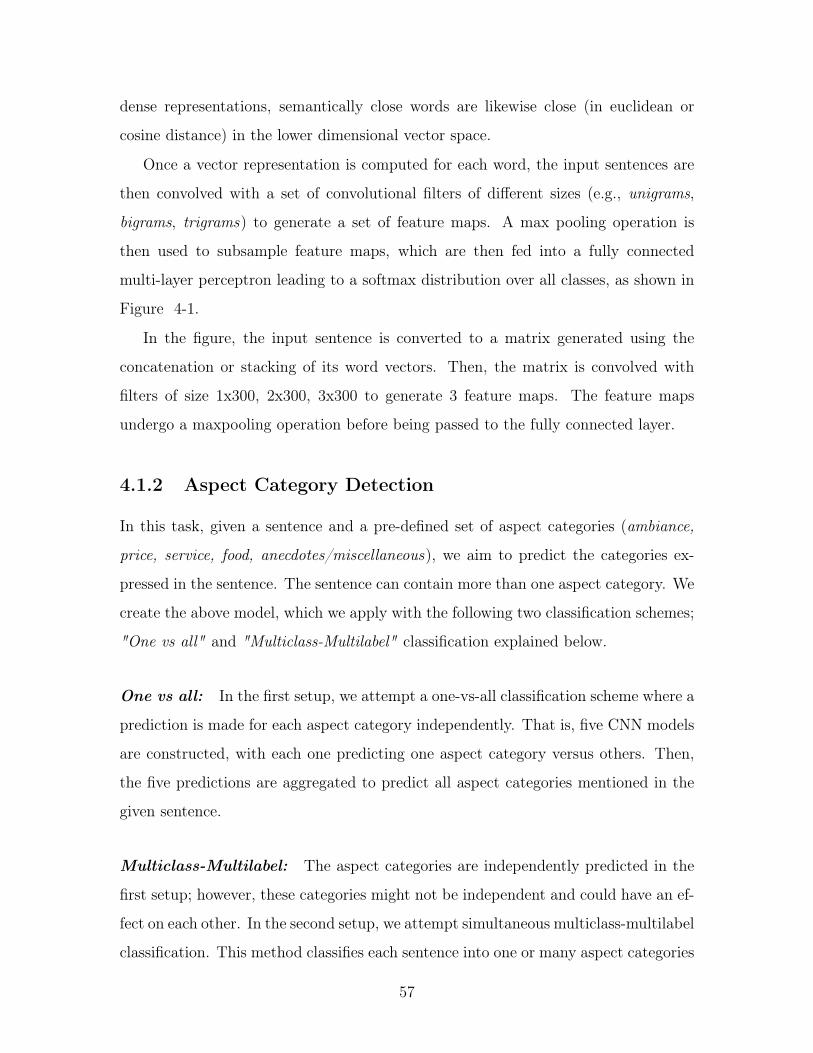
4-2 The distribution of sentence lengths in the train and test dataset of
restaurant reviews for the aspect-based sentiment analysis tasks. . . . 60
12
4-3 All Possible Elements. This figure shows all the possible elements,
including the elements selected by the algorithm, the elements not
selected by the algorithm, the relevant elements, and the irrelevant
elements (Wikipedia, 2016). . . . . . . . . . . . . . . . . . . . . . . . 61
4-4 Precision (Wikipedia, 2016). . . . . . . . . . . . . . . . . . . . . . . 61
4-5 Recall (Wikipedia, 2016). . . . . . . . . . . . . . . . . . . . . . . . . 61
4-6 The 20 words that have the highest cosine similarity with the word
Ambience : {ambience, ambiance, atmosphere, decor, environment,
vibe, setting surroundings, interior, atomosphere, decor, cozy, classy,
atmoshere atmoshpere, elegant, romantic, trendy, decoration, quaint}. 71
4-7 The 20 words that have the highest cosine similarity with the word
Food : {food, cuisine, service, restaurant, fare, authentic, meals, ambi-
ence ambiance, sushi, consistently, meal, atmosphere, mediocre, dishes,
resturant, quality, foods, portions, quantity}. . . . . . . . . . . . . . . 72
4-8 The 20 words that have the highest cosine similarity with the word
Price : {price, pricing, prices, cost, value, quality, rate, priced, expen-
sive, pricey, costs, quantity, pricy, overpriced, size, considering, pre-
mium, deal, cheaper, bargain}. . . . . . . . . . . . . . . . . . . . . . . 73
4-9 The 20 words that have the highest cosine similarity with the word
Service : {service, waitstaff, staff, consistently, food, attentive, servers,
efficient, polite, courteous, ambience, prompt, ambiance, exceptionally
waiters, overall, friendly, exceptional, atmosphere, experience}. . . . . 74
4-10 The 20 words that have the highest cosine similarity with the word
’Positive’ : {positive, negative, favorable, based, pleasurable, bad,
previous reading, rave, pleasant, important, accurate, unpleasant, com-
ments, read, concerning, horrific, enthusiastic, negatively, supportive}. 75
4-11 The 20 words that have the highest cosine similarity with the word
’Negative’ : {negative, positive, favorable, bad, read, rave, reason,
complaint, zero, agree, based, write, negatively, reading, harsh, com-
ments, writing, star, horrific, previous}. . . . . . . . . . . . . . . . . . 76
13
5-1 The general architecture of the cQA model, including the two stacked
Bidirectional LSTMs and a MLP. The model is built on two bidirec-
tional LSTMs whose output can be augmented with extra features and
fed into a multi-layer perceptron. . . . . . . . . . . . . . . . . . . . . 80
5-2 Layers of the community question answering model. The inputs to
the two bidirectional LSTMs are word embeddings that are randomly
initialized. The output of the second LSTM is merged with the aug-
mented data before going through the MLP layer. . . . . . . . . . . . 81
5-3 Example of a pair of questions that is correctly predicted as similar by
the first (top) and second (bottom) bidirectional LSTMs. The dark
blue squares represent areas of high similarity. . . . . . . . . . . . . . 90
5-4 Example of a pair of questions that is incorrectly predicted as similar by
the first bidirectional LSTM (top) and correctly predicted as dissimilar
by the the second bidirectional LSTM (bottom). The dark blue squares
represent areas of high similarity. . . . . . . . . . . . . . . . . . . . . 91
A-1 Example of a pair of questions that is correctly classified as dissimilar.
The second heatmap shows a reduction in the areas of high similarity
delimited by red boxes in both heatmaps. . . . . . . . . . . . . . . . . 98
A-2 Example of a pair of questions that is correctly classified as similar.
The second LSTM fine-tunes the output of the first one. . . . . . . . 100
A-3 Example of a pair of questions that is incorrectly classified as similar
by the first LSTM and correctly classified as dissimilar by the second
LSTM. . . . . . . . . . . . . . . . . . . . . . . . . . . . . . . . . . . . 101
A-4 Example of a question-answer pair that correctly classified as related.
Each bidirectional LSTM makes a correct prediction. . . . . . . . . . 102
A-5 Example of a question-answer pair that is correctly classified as related. 103
A-6 Example of a question-answer pair that is correctly classified as related
by both first and second bidirectional LSTM. . . . . . . . . . . . . . 104
14
A-7 Example of a question-answer pair that is correctly classified as related
by both bidirectional LSTMs. . . . . . . . . . . . . . . . . . . . . . . 105
A-8 Example of a question-answer pair that is correctly classified as related
by both bidirectional LSTMs. . . . . . . . . . . . . . . . . . . . . . . 107
A-9 Example of a question-answer pair that is correctly classified as related
by both bidirectional LSTMs. . . . . . . . . . . . . . . . . . . . . . . 108
A-10 Example of a spam answer that is first incorrectly classified as rele-
vant by the first bidirectional LSTM, but then correctly classified as
irrelevant by the second bidirectional LSTM. . . . . . . . . . . . . . . 109
A-11 Example of a question-answer pair that is correctly classified as irrele-
vant to each other. . . . . . . . . . . . . . . . . . . . . . . . . . . . . 110
A-12 Example of a question-answer pair that is correctly classified as irrele-
vant to each other. In this case, the question and answer are provided
by the same user. . . . . . . . . . . . . . . . . . . . . . . . . . . . . . 112
15

16

List of Tables
4.1 The hyper-parameters of CNN model. The values of the hyper-parameters
are optimized based on the results on the development set. . . . . . . 58
4.2 The various experimental setups of the CNN model in the context of
the one-vs-all classification scheme for the aspect category detection
task. . . . . . . . . . . . . . . . . . . . . . . . . . . . . . . . . . . . . 63
4.3 The results of the aspect category detection task of ABSA using the
CNN model in the one-vs-all classification scheme. . . . . . . . . . . . 63
4.4 Some of the seed words used in the ABSA experiments. These seed
words are retrieved using the maximum cosine similarities between the
vector representations of the words and the category names (Ambience,
Food, Price, Service). . . . . . . . . . . . . . . . . . . . . . . . . . . . 64
4.5 The results of the aspect category detection task of ABSA, using the
CNN model in the multiclass-multilabel classification scheme. . . . . 65
4.6 Accuracy achieved on the aspect category sentiment prediction task
of ABSA. This accuracy is reported over all sentiment classes under
one-vs-all and multiclass CNN classification schemes. . . . . . . . . . 66
4.7 The results of aspect category sentiment prediction for the positive
class using the CNN model with the one-vs-all and multiclass classifi-
cation schemes. . . . . . . . . . . . . . . . . . . . . . . . . . . . . . . 66
4.8 The results of aspect category sentiment prediction for the negative
class using the CNN model with the one-vs-all and multiclass classifi-
cation schemes. . . . . . . . . . . . . . . . . . . . . . . . . . . . . . . 67
17
4.9 The results of aspect category sentiment prediction for the neutral
class using the CNN model with the one-vs-all and multiclass-multilabel
classification schemes. . . . . . . . . . . . . . . . . . . . . . . . . . . 67
4.10 The results of aspect category sentiment prediction for conflict class
using the CNN model with the one-vs-all and multiclass-multilabel
classification schemes. . . . . . . . . . . . . . . . . . . . . . . . . . . 68
4.11 Count of Samples. . . . . . . . . . . . . . . . . . . . . . . . . . . . . . 68
5.1 The hyper-parameters of the stacked bidirectional LSTM model. . . . 82
5.2 The statistics for the cQA train, dev and test data (Nakov et al., 2016)
that we employ to evaluate our neural model. . . . . . . . . . . . . . 82
5.3 Some of the most important text-based and vector-based features em-
ployed in the Bag-of-Vectors (BOV) baseline (Belinkov et al., 2015). . 84
5.4 Results on development data for the question retrieval task in cQA. . 86
5.5 Results on test data for the question retrieval task in cQA. . . . . . . 86
5.6 Results on development data for answer selection task in cQA. . . . . 87
5.7 Results on test data for answer selection task in cQA. . . . . . . . . . 87
18
Chapter 1
Introduction
In this thesis, we aim to capture the sentiment and semantic information in user gen-
erated content. We aim to achieve this goal by investigating two major Natural Lan-
guage Processing (NLP) research topics: Aspect-based Sentiment Analysis (ABSA)
and Community Question Answering (cQA) ranking problems. We present several
neural-based approaches including Convolutional Neural Networks (CNN) and Long
Short-Term Memory Networks (LSTM) to tackle these problems. In this chapter, we
first discuss the motivation behind our research in Section 1.1, then identify our goals
in Section 1.1.2, explain our research problems in Section 1.2, and finally present the
contributions of this thesis in Section 1.3.
1.1 Motivation
In just a few years, social media, once merely regarded as a hub for high school and
college students, has grown into a major communication and content-sharing medium,
exerting tremendous influence over the way people around the world interact. Figure
1-1(a) shows the growing trend in social media, and Figure 1-1(b) shows the growing
trend among adults (18+).
This growth, primarily fueled by the increase in smartphone penetration, smart-
phone connectivity, and change in social trends, has had profound implications on
businesses. Social media shapes customers’ perceptions of a brand, whether through
19

(a) Popularity of Social Media Platforms. (b) Social Media Trends Among Adults.
Figure 1-1: The rise of social media. Figure 1-1(a) shows the popularity of somesocial media platforms from 2012 to 2014, and Figure 1-1(b) shows the fraction ofadults using some of the popular social media platforms.
timely and targeted promotions, responsive customer service or the creation of com-
munities of interest. At the same time, social media has granted power to the cus-
tomers who, with the click of a button, can now share their experiences -positive or
negative- with millions of people around the globe. As a result of that leverage, the
successes and missteps of organizations are now on display as never before.
In light of this new distribution of influence, businesses are now concerned with
harnessing the power of social media to better promote and maintain their brand.
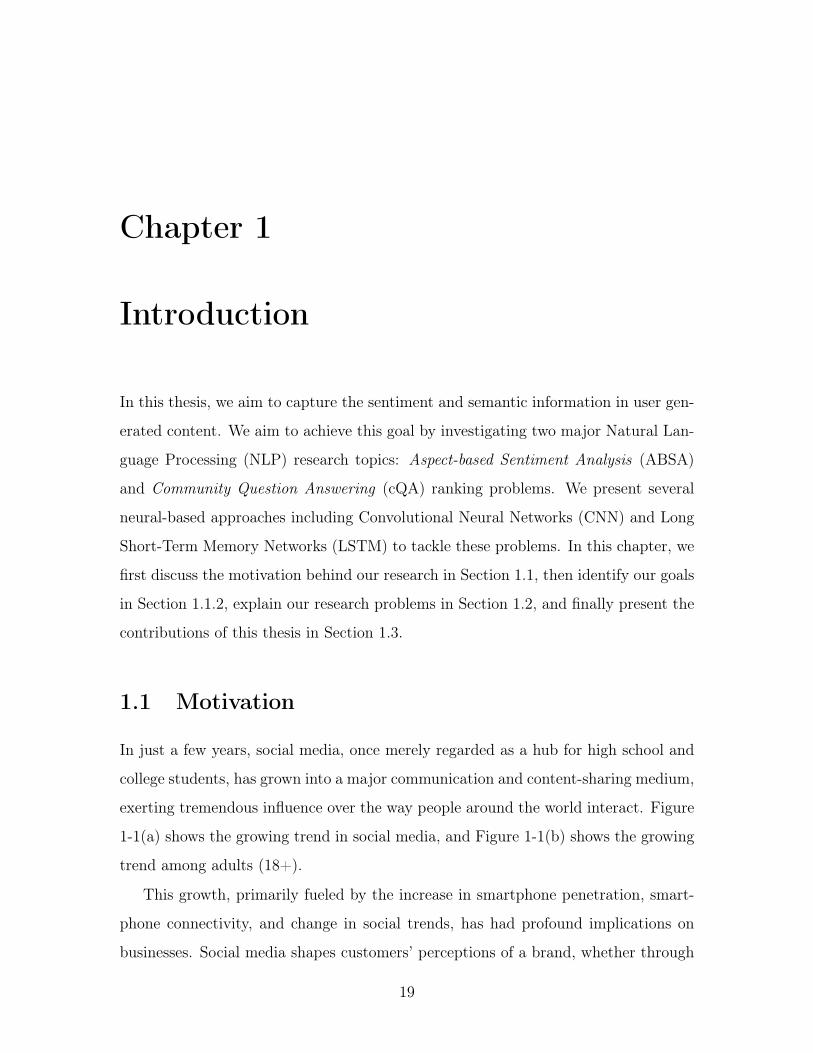
Platforms currently referred to as ‘social media’ fall into one or more of the current
eight categories shown in Figure 1-2.
A social media platform can fall under one or multiple of the following categories.
Relationship Networks: These are the most common type of social media, and
allow users to keep and share their communications either privately or with their entire
networks. They vary from social networks that help you keep up with your friends,
to professional relationship networks that help you connect with other professionals
in the field. Major players in this area include 𝐹𝑎𝑐𝑒𝑏𝑜𝑜𝑘, 𝑇𝑤𝑖𝑡𝑡𝑒𝑟 and 𝐿𝑖𝑛𝑘𝑒𝑑𝑖𝑛. An
example of a relationship network (Facebook) is shown in Figure 1-3.
20
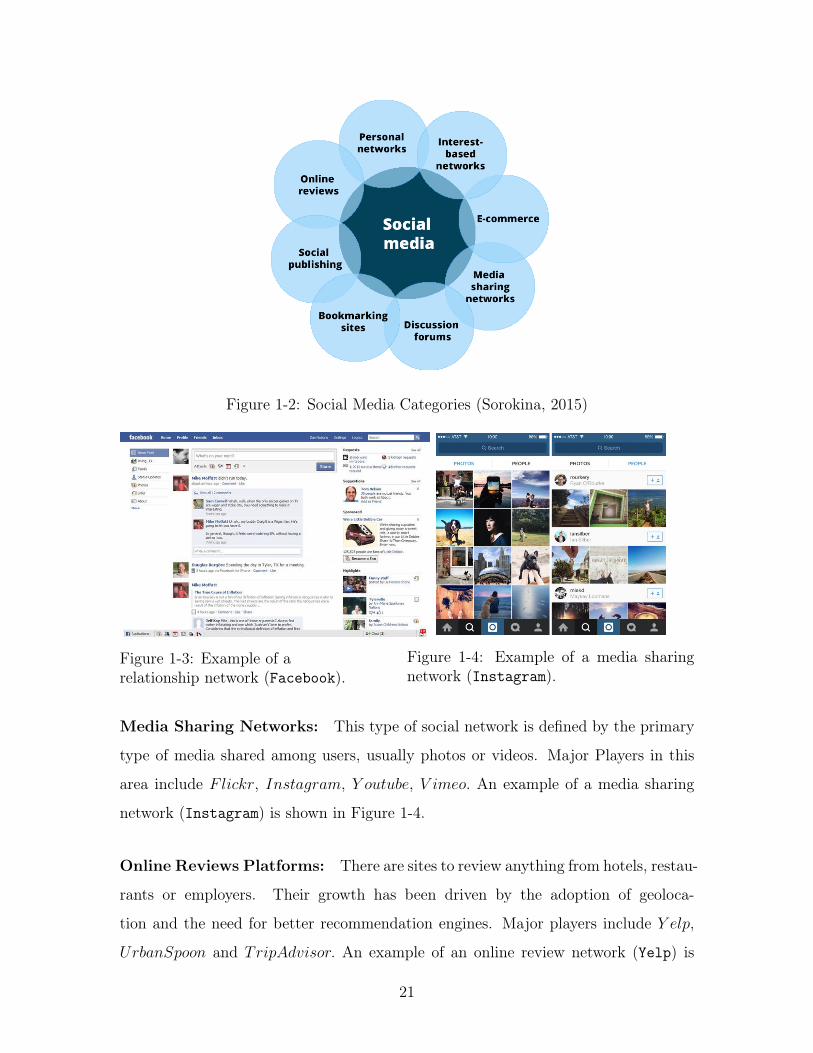
Figure 1-2: Social Media Categories (Sorokina, 2015)
Figure 1-3: Example of arelationship network (Facebook).
Figure 1-4: Example of a media sharingnetwork (Instagram).
Media Sharing Networks: This type of social network is defined by the primary
type of media shared among users, usually photos or videos. Major Players in this
area include 𝐹𝑙𝑖𝑐𝑘𝑟, 𝐼𝑛𝑠𝑡𝑎𝑔𝑟𝑎𝑚, 𝑌 𝑜𝑢𝑡𝑢𝑏𝑒, 𝑉 𝑖𝑚𝑒𝑜. An example of a media sharing
network (Instagram) is shown in Figure 1-4.
Online Reviews Platforms: There are sites to review anything from hotels, restau-
rants or employers. Their growth has been driven by the adoption of geoloca-
tion and the need for better recommendation engines. Major players include 𝑌 𝑒𝑙𝑝,
𝑈𝑟𝑏𝑎𝑛𝑆𝑝𝑜𝑜𝑛 and 𝑇𝑟𝑖𝑝𝐴𝑑𝑣𝑖𝑠𝑜𝑟. An example of an online review network (Yelp) is
21
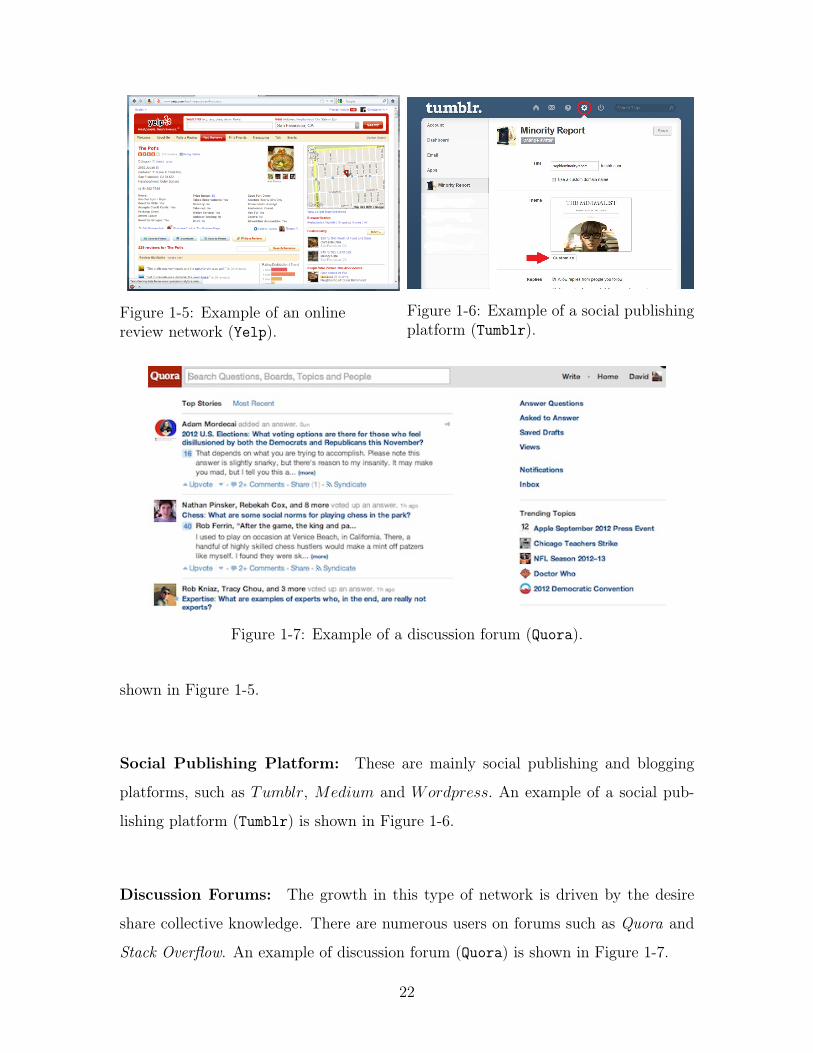
Figure 1-5: Example of an onlinereview network (Yelp).
Figure 1-6: Example of a social publishingplatform (Tumblr).
Figure 1-7: Example of a discussion forum (Quora).
shown in Figure 1-5.
Social Publishing Platform: These are mainly social publishing and blogging
platforms, such as 𝑇𝑢𝑚𝑏𝑙𝑟, 𝑀𝑒𝑑𝑖𝑢𝑚 and 𝑊𝑜𝑟𝑑𝑝𝑟𝑒𝑠𝑠. An example of a social pub-
lishing platform (Tumblr) is shown in Figure 1-6.
Discussion Forums: The growth in this type of network is driven by the desire
share collective knowledge. There are numerous users on forums such as Quora and
Stack Overflow. An example of discussion forum (Quora) is shown in Figure 1-7.
22
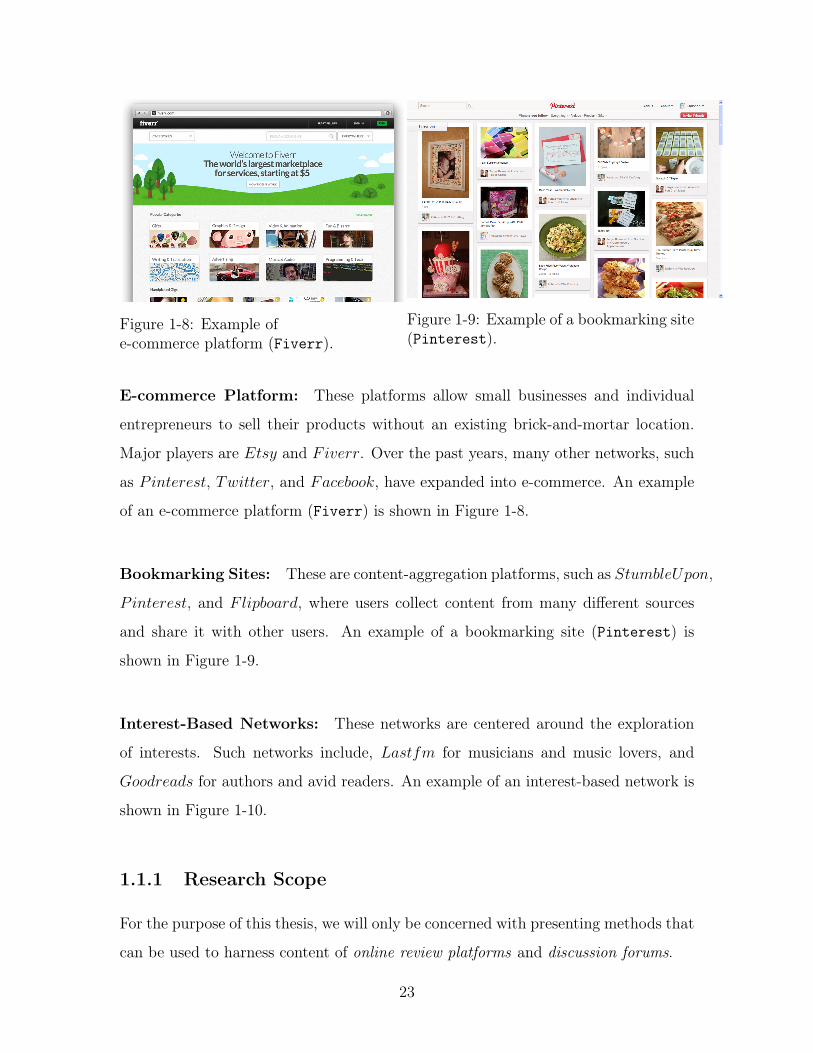
Figure 1-8: Example ofe-commerce platform (Fiverr).
Figure 1-9: Example of a bookmarking site(Pinterest).
E-commerce Platform: These platforms allow small businesses and individual
entrepreneurs to sell their products without an existing brick-and-mortar location.
Major players are 𝐸𝑡𝑠𝑦 and 𝐹𝑖𝑣𝑒𝑟𝑟. Over the past years, many other networks, such
as 𝑃𝑖𝑛𝑡𝑒𝑟𝑒𝑠𝑡, 𝑇𝑤𝑖𝑡𝑡𝑒𝑟, and 𝐹𝑎𝑐𝑒𝑏𝑜𝑜𝑘, have expanded into e-commerce. An example
of an e-commerce platform (Fiverr) is shown in Figure 1-8.
Bookmarking Sites: These are content-aggregation platforms, such as 𝑆𝑡𝑢𝑚𝑏𝑙𝑒𝑈𝑝𝑜𝑛,
𝑃𝑖𝑛𝑡𝑒𝑟𝑒𝑠𝑡, and 𝐹𝑙𝑖𝑝𝑏𝑜𝑎𝑟𝑑, where users collect content from many different sources
and share it with other users. An example of a bookmarking site (Pinterest) is
shown in Figure 1-9.
Interest-Based Networks: These networks are centered around the exploration
of interests. Such networks include, 𝐿𝑎𝑠𝑡𝑓𝑚 for musicians and music lovers, and
𝐺𝑜𝑜𝑑𝑟𝑒𝑎𝑑𝑠 for authors and avid readers. An example of an interest-based network is
shown in Figure 1-10.
1.1.1 Research Scope
For the purpose of this thesis, we will only be concerned with presenting methods that
can be used to harness content of online review platforms and discussion forums.
23

Figure 1-10: Example of an interest-based network (Goodreads).
Online Review Platforms: With the proliferation of reviews, ratings, recommen-
dations, and other forms of online expression, many businesses are now looking into
the field of sentiment analysis to identify new opportunities to manage their repu-
tations. sentiment analysis or opinion mining deals with computational analysis of
people’s opinions, sentiments, attitudes and emotions towards target entities such as
products, organizations, individuals, topics and their attributes (Liu, 2012).
Discussion Forums: Discussion forums or Community Question Answering (cQA)
systems, such as Quora, Stack Overflow, are becoming the go-to platforms for many
important decisions. Such systems are seldom moderated, quite open, and thus have
little restrictions, if any, on who can post and who can answer a question. On the
positive side, this means that one can freely ask any question and expect some good,
honest answers. On the negative side, it takes effort to go through all possible answers
and make sense of them. It is not unusual for a question to have hundreds of answers,
24
which makes it very time-consuming for the user to inspect and to winnow through
them all.
1.1.2 Goal
In this thesis, we develop several approaches to harness the content of social media
websites, specifically review websites and discussion forums. For review websites,
we perform aspect-based sentiment analysis, and for discussion forums, we perform
question and answer retrieval. In Section 1.2, we explain the research problems for
each platform.
1.2 Problem Description
The methods to harness content differ from one type of platform to another. The
effectiveness of any method will highly depend on the context in which it is applied.
Thus, harnessing content from review websites requires a different set of methods than
the ones used for harnessing content from discussion forums. For review websites, we
are primarily concerned with extracting the author’s sentiment and the entities (or
aspects) the author is referring to. For discussion forums, we are primarily concerned
with retrieving questions that are similar to a new question asked by a user, and
identifying relevant the best answers to a question in a Q&A thread. We elaborate
on the two different problems in the following sections.
1.2.1 Aspect Based Sentiment analysis
Mining opinions about specific aspects and aspect categories expressed in online re-
view platforms is referred to as Aspect-Based Sentiment Analysis (ABSA) (Pontiki
et al., 2015). ABSA entails four main tasks, which have been specified in SemEval-
2014 Task 4 (Pontiki et al., 2014) as the following:
25

Aspect Term Extraction
Given a set of sentences that target a specific pre-identified entity (e.g., a restaurant
review), the system needs to identify and return a list of distinct aspects of the
specified entity. For instance, in the following examples, the italic words are aspect
terms:
∙ “I liked the service and the staff, but not the food.”
∙ “The food was nothing much, but I loved the staff.”
Multi-word aspect terms should be treated as single terms. For example, “hard disk”
is the only aspect term of the sentence “The hard disk is very noisy”.
Aspect Sentiment Prediction
Given a set of aspect terms for a specific entity, the system should determine whether
the sentiment associated with the aspect is positive, negative, neutral or conflict (i.e.,
a combination of positive and negative. For example:
∙ “I hated their fajitas, but their salads were great.” ⇒ {fajitas: negative, salads:
positive}
∙ “The fajitas are their first plate.” ⇒ {fajitas: neutral}
∙ “The fajitas were great to taste, but not to see.” ⇒ {fajitas: conflict}
In the first example, the author mentions two aspects: fajitas and salads, and clearly
expresses an opinion on each of them. The word hated refers to fajitas making the
author’s opinion on this aspect negative, and the word great refers to salads making
the author’s opinion on this aspect positive. In the second example, the author does
not express an opinion on the aspect fajitas, but rather refers to the order in which the
food was served. Thus, the author has a neutral opinion about the aspect. In the third
example, the author expresses mixed feelings about the aspect fajitas, some positive
as corroborated by the expression “great to taste”, and some negative as corroborated
by the expression “not great to see”. In this case, the author has a conflict opinion
about the aspect.
26
Aspect Category Detection
Given a predefined set of aspect categories (e.g., price, food) and a set of review sen-
tences (but without any annotations of aspect terms and their sentiments), the system
should identify the aspect categories discussed in each sentence. Aspect categories
are coarse definitions that encompass a large set of aspect terms. For instance, given
the set of aspect categories food, service, price, ambiance, anecdotes/miscellaneous,
the categories of the following sentences are as follows:
∙ “The restaurant was too expensive.” ⇒ {price}
∙ “The restaurant was expensive, but the menu was great.” ⇒ {price, food}
In both examples, the author mentions the word expensive which pertains to the price
category. In the second example, the word menu pertains to the food category.
Aspect Category Sentiment Prediction
Given a set of identified aspect categories for a specific review, we need to classify
the sentiment of each category into one of the following classes: positive, negative,
neutral, conflict . For example:
∙ “The restaurant was too expensive.” ⇒ {price: negative}
∙ “The restaurant was expensive, but the menu was great.” ⇒ {price: negative,
food: positive}
In the first example, the author was unhappy with the restaurant’s price, and
thus expresses a negative opinion on the category price. In the second example, the
author expresses a positive opinion on the category food and a negative opinion on
the category price.
In this thesis, we investigate the tasks “Aspect Category Detection” and “Aspect
Category Sentiment Prediction” for ABSA.
27
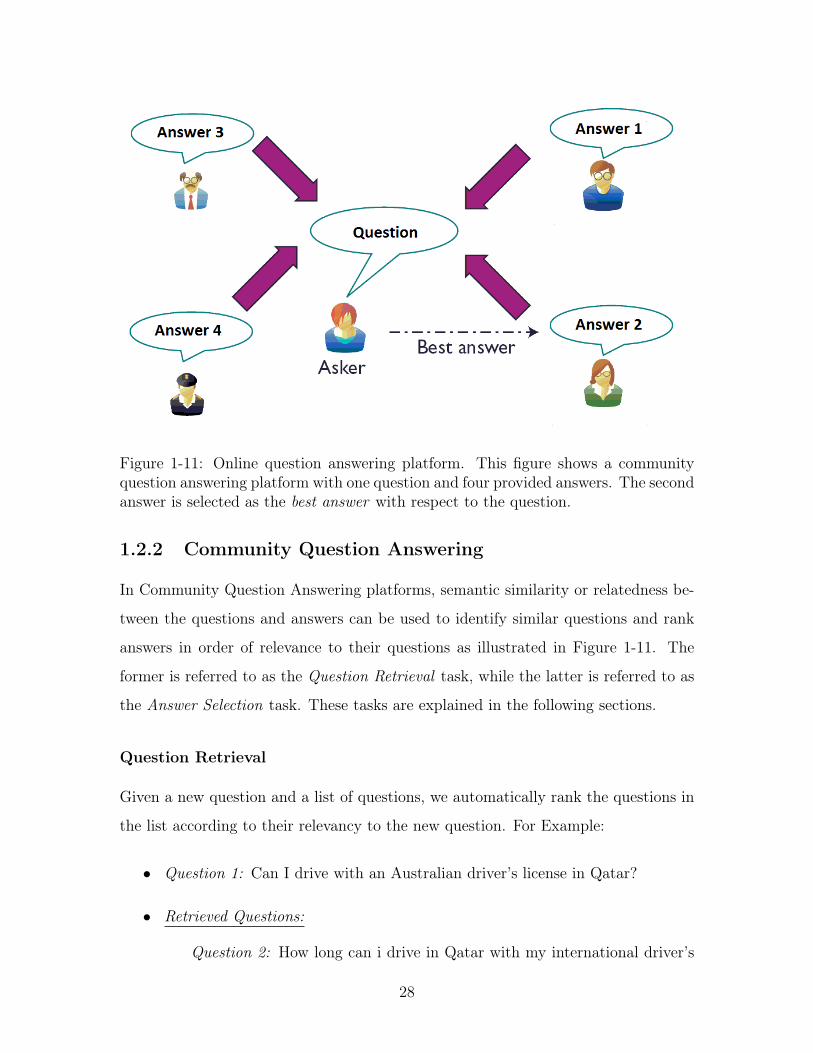
Figure 1-11: Online question answering platform. This figure shows a communityquestion answering platform with one question and four provided answers. The secondanswer is selected as the best answer with respect to the question.
1.2.2 Community Question Answering
In Community Question Answering platforms, semantic similarity or relatedness be-
tween the questions and answers can be used to identify similar questions and rank
answers in order of relevance to their questions as illustrated in Figure 1-11. The
former is referred to as the Question Retrieval task, while the latter is referred to as
the Answer Selection task. These tasks are explained in the following sections.
Question Retrieval
Given a new question and a list of questions, we automatically rank the questions in
the list according to their relevancy to the new question. For Example:
∙ Question 1: Can I drive with an Australian driver’s license in Qatar?
∙ Retrieved Questions:
Question 2: How long can i drive in Qatar with my international driver’s
28
permit before I’m forced to change my Australian license to a Qatari one? When
I do change over to a Qatar license do I actually lose my Australian license? I’d
prefer to keep it if possible... → question similar to Question 1.
Question 3: How can I get a driver license ? → question not similar to
Question 1.
In the first retrieved question (Question 2), the author inquires about the duration for
which he can use his Australian driver license to drive in Qatar. This question does
have some evident overlap with the original question (Question 1) on the possibility
of driving in Qatar with an Australian driver license. In the second retrieved question
(Question 3), the author inquires about the process of getting a driver license, which
is not related to the (Question 1).
Answer Selection
Given a cQA thread containing a question and a list of answers, we automatically
rank the answers according to their relevance to the question. For example:
∙ Question 1: Can I drive with an Australian driver’s license in Qatar?
∙ Answers:
Answer 1: depends on the insurer, Qatar Insurance Company said this
in email to me: "Thank you for your email! With regards to your query below,
a foreigner is valid to drive in Doha with the following conditions: Foreign
driver with his country valid driving license allowed driving only for one week
from entry date; Foreign driver with international valid driving license allowed
driving for 6 months from entry date; Foreign driver with GCC driving license
allowed driving for 3 months from entry" As an Aussie your driving licence
should be transferable to a Qatar one with only the eyetest (temporary, then
permanent once RP sorted). → good answer to Question 1.
Answer 2: Hi there :D does anyone know how much would it cost to get
a driving license !! although i have had it before in my country so practically i
29
know how to drive. any HELP !? → not an answer to Question 1.
In the first retrieved answer (Answer 2), the response elaborates on the validity of
foreign and international driving licenses in Qatar, as well as the process of converting
an international driver license to a Qatari driver license. This answer clearly responds
the question (Question 1), which was about the possibility to drive in Qatar with an
Australian driver license. In the second retrieved answer (Answer 2), the respondent
asks a different question rather than answering the initial one.
1.3 Contributions
In light of the problems explained in Section 1.2, we present our contributions to
address each of the challenges in Aspect-Based Sentiment Analysis (ABSA) and
Community-Question Answering (cQA), as briefly explained in the following sections.
1.3.1 Aspect-Based Sentiment Analysis
We present a neural-based model with Convolutional Neural Networks (CNN) to
address the Aspect Category Detection, and Aspect Category Sentiment Prediction
tasks. The model uses vector representations computed using word2vec to generate
feature maps through a set of a different convolutions. We explore both one-vs-all
and multiclass-multilabel classification schemes to accomplish the desired tasks.
1.3.2 Community-Question Answering
We present a neural-based model with stacked bidirectional Long Short-Term Memory
(LSTM) recurrent neural networks and Multi Layer Perceptrons (MLP) to address
the Question Retrieval, and Answer Selection tasks. The model generates the vector
representations of the question-question or question-answer pairs and computes their
semantic similarity scores, which are then employed to rank and predict relevancies.
We explore different system architectures ranging from a single bidirectional LSTM
layer to a double bidirectional LSTM layer to accomplish the desired tasks.
30

1.4 Thesis Outline
In this thesis, we start by presenting the motivation behind our work on Aspect-
Based Sentiment Analysis (ABSA) and Community Question-Answering (cQA). In
Chapter 2, we present a review of the methods and concepts used to address these
tasks. Chapter 3 discusses previous works in the areas of ABSA and cQA. In Chapter
4, we present our experimental setup for Aspect-Based Sentiment Analysis (ABSA),
our evaluation metrics and results, our system performance, and visualize the output
of the system to show some intuition behind the results. Chapter 5 follows a structure
parallel to that of Chapter 4, but applied to Community Question Answering (cQA)
instead. Finally, Chapter 6 summarizes our work and suggests future steps in these
domains.
31

32

Chapter 2
Background
This chapter presents some background information for the research presented in this
thesis. We outline some of the neural network concepts we have used in the two neural-
based models we have developed for the ABSA and cQA problems. In Section 2.1, we
review Convolutional Neural Networks, before discussing Recurrent Neural Networks
in Section 2.2. We review Long Short-Term Memory Recurrent Neural Network in
Section 2.3, and present some background about Word Vector Representations in
Section 2.4.
2.1 Convolutional Neural Networks
A Convolutional Neural Network (CNN) is comprised of one or more convolutional
layers (often with a subsampling step) followed by one or more fully connected layers
as in a standard multilayer neural network. At every layer of the CNN, multiple con-
volving filters are applied to local features (LeCun et al., 1998) to generate feature
maps. Originally invented for computer vision, CNN models have subsequently been
shown to be effective for NLP and have achieved excellent results in semantic pars-
ing (Yih et al., 2014), search query retrieval (Shen et al., 2014), sentence modeling
(Kalchbrenner et al., 2014), and other traditional NLP tasks (Collobert et al., 2011).
A typical Convolutional Neural Network is structured as shown in Figure 2-1.
The convolution process (Irwin, 1997) that leads to the generation of a feature
33
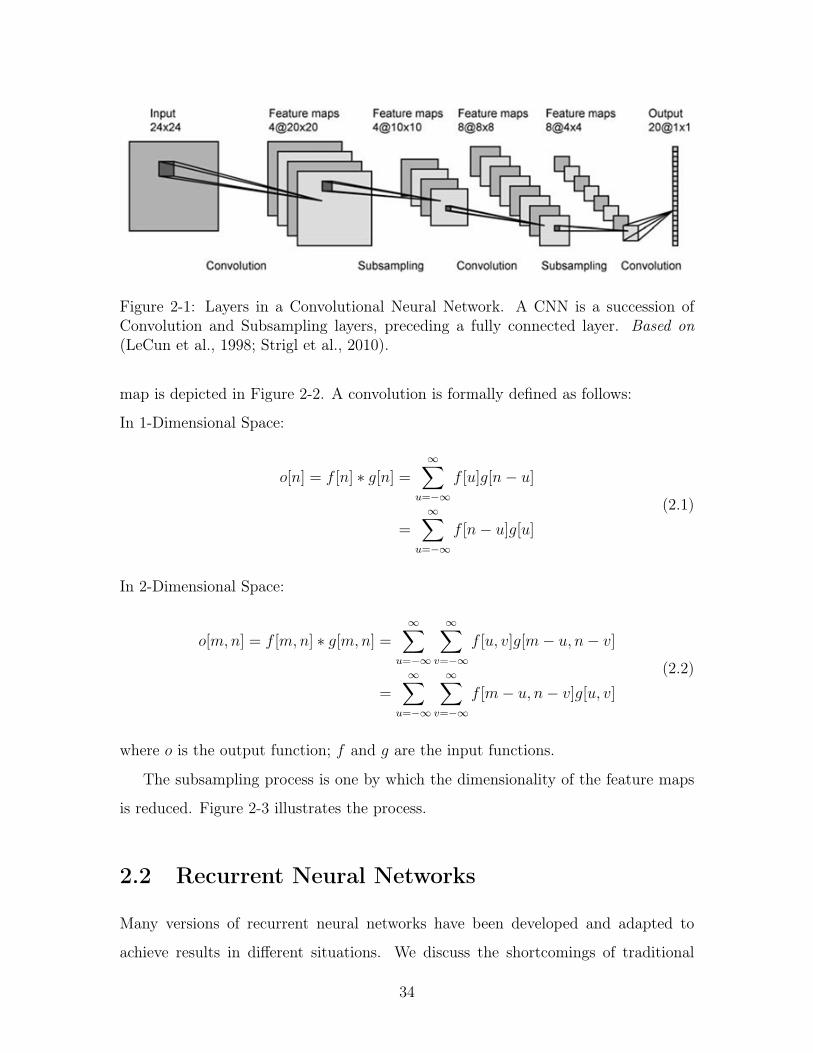
Figure 2-1: Layers in a Convolutional Neural Network. A CNN is a succession ofConvolution and Subsampling layers, preceding a fully connected layer. Based on(LeCun et al., 1998; Strigl et al., 2010).
map is depicted in Figure 2-2. A convolution is formally defined as follows:
In 1-Dimensional Space:
𝑜[𝑛] = 𝑓 [𝑛] * 𝑔[𝑛] =∞∑
𝑢=−∞
𝑓 [𝑢]𝑔[𝑛− 𝑢]
=∞∑
𝑢=−∞
𝑓 [𝑛− 𝑢]𝑔[𝑢]
(2.1)
In 2-Dimensional Space:
𝑜[𝑚,𝑛] = 𝑓 [𝑚,𝑛] * 𝑔[𝑚,𝑛] =∞∑
𝑢=−∞
∞∑𝑣=−∞
𝑓 [𝑢, 𝑣]𝑔[𝑚− 𝑢, 𝑛− 𝑣]
=∞∑
𝑢=−∞
∞∑𝑣=−∞
𝑓 [𝑚− 𝑢, 𝑛− 𝑣]𝑔[𝑢, 𝑣]
(2.2)
where 𝑜 is the output function; 𝑓 and 𝑔 are the input functions.
The subsampling process is one by which the dimensionality of the feature maps
is reduced. Figure 2-3 illustrates the process.
2.2 Recurrent Neural Networks
Many versions of recurrent neural networks have been developed and adapted to
achieve results in different situations. We discuss the shortcomings of traditional
34
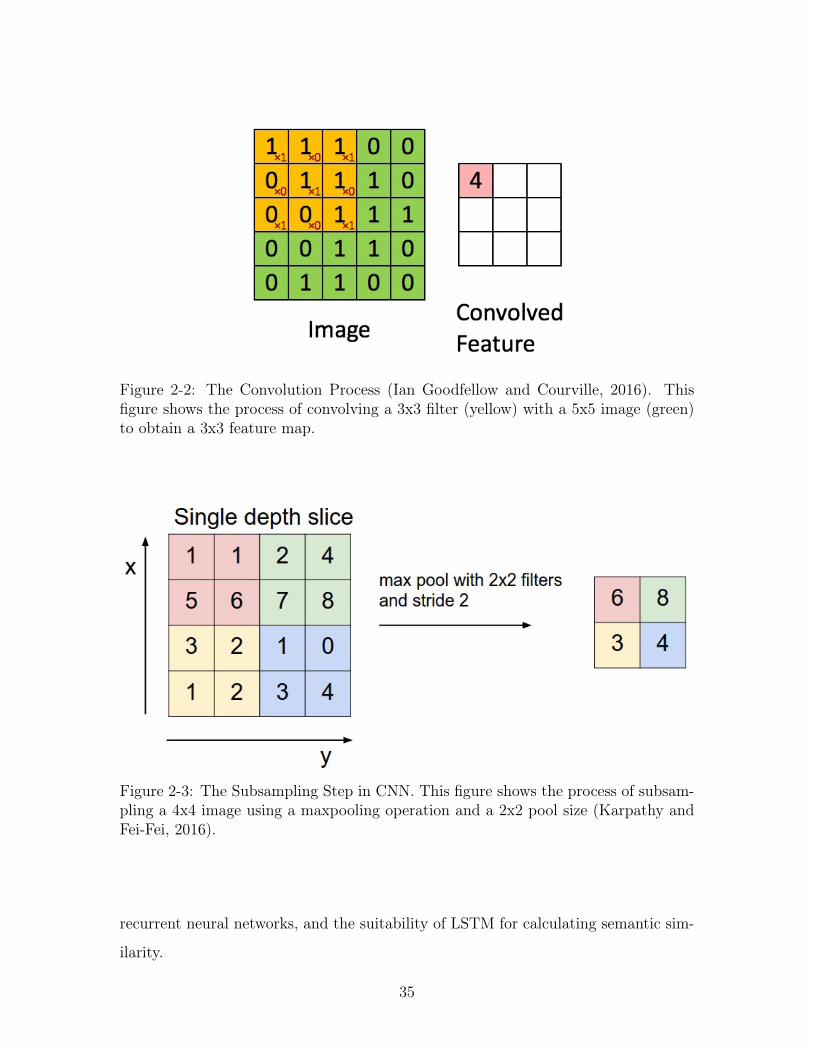
Figure 2-2: The Convolution Process (Ian Goodfellow and Courville, 2016). Thisfigure shows the process of convolving a 3x3 filter (yellow) with a 5x5 image (green)to obtain a 3x3 feature map.
Figure 2-3: The Subsampling Step in CNN. This figure shows the process of subsam-pling a 4x4 image using a maxpooling operation and a 2x2 pool size (Karpathy andFei-Fei, 2016).
recurrent neural networks, and the suitability of LSTM for calculating semantic sim-
ilarity.
35
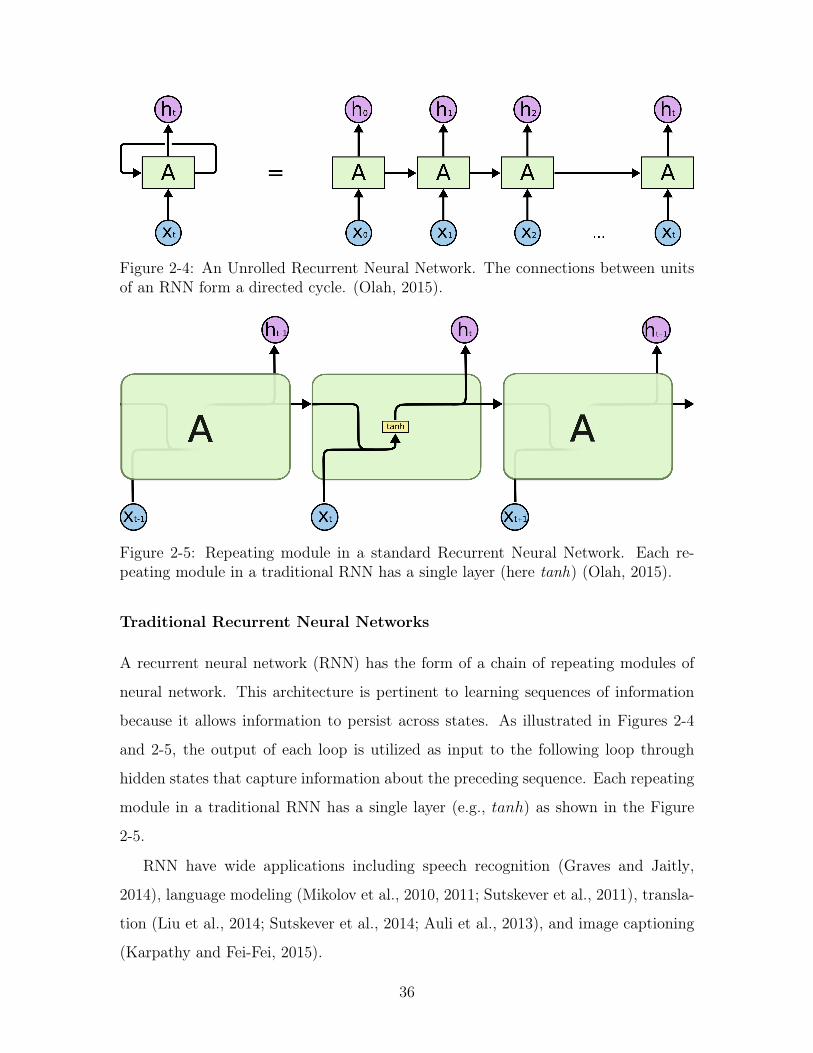
Figure 2-4: An Unrolled Recurrent Neural Network. The connections between unitsof an RNN form a directed cycle. (Olah, 2015).
Figure 2-5: Repeating module in a standard Recurrent Neural Network. Each re-peating module in a traditional RNN has a single layer (here tanh) (Olah, 2015).
Traditional Recurrent Neural Networks
A recurrent neural network (RNN) has the form of a chain of repeating modules of
neural network. This architecture is pertinent to learning sequences of information
because it allows information to persist across states. As illustrated in Figures 2-4
and 2-5, the output of each loop is utilized as input to the following loop through
hidden states that capture information about the preceding sequence. Each repeating
module in a traditional RNN has a single layer (e.g., 𝑡𝑎𝑛ℎ) as shown in the Figure
2-5.
RNN have wide applications including speech recognition (Graves and Jaitly,
2014), language modeling (Mikolov et al., 2010, 2011; Sutskever et al., 2011), transla-
tion (Liu et al., 2014; Sutskever et al., 2014; Auli et al., 2013), and image captioning
(Karpathy and Fei-Fei, 2015).
36
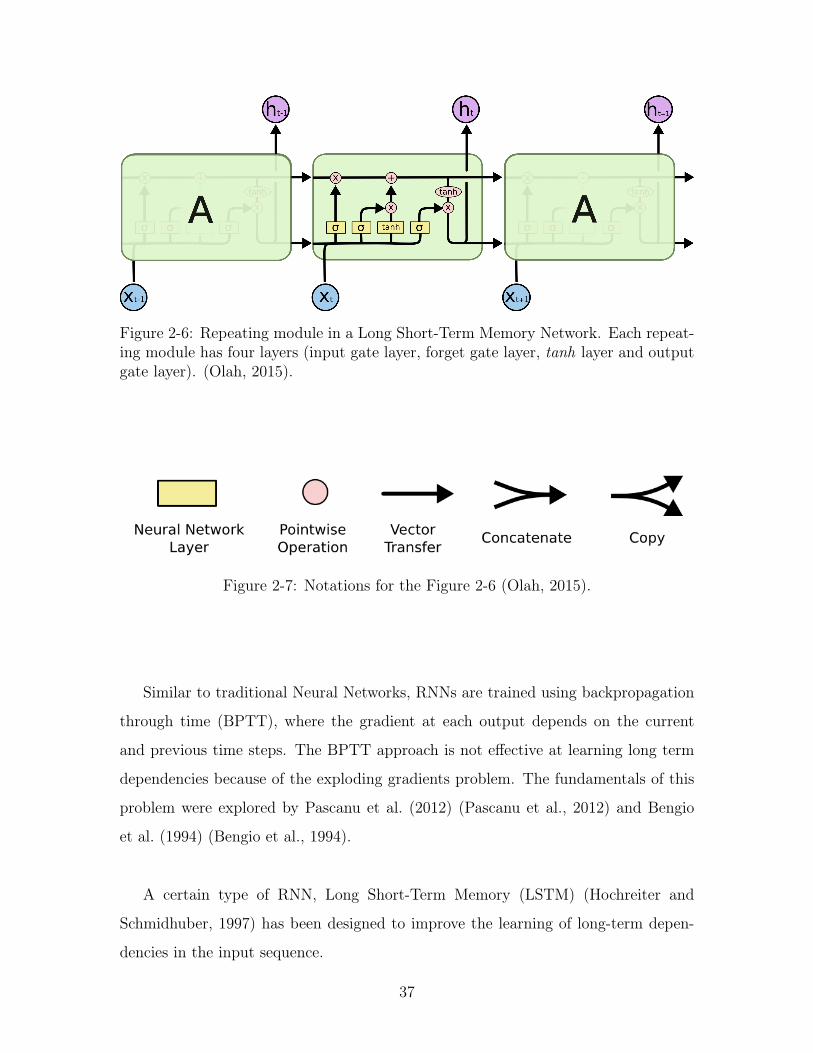
Figure 2-6: Repeating module in a Long Short-Term Memory Network. Each repeat-ing module has four layers (input gate layer, forget gate layer, tanh layer and outputgate layer). (Olah, 2015).
Figure 2-7: Notations for the Figure 2-6 (Olah, 2015).
Similar to traditional Neural Networks, RNNs are trained using backpropagation
through time (BPTT), where the gradient at each output depends on the current
and previous time steps. The BPTT approach is not effective at learning long term
dependencies because of the exploding gradients problem. The fundamentals of this
problem were explored by Pascanu et al. (2012) (Pascanu et al., 2012) and Bengio
et al. (1994) (Bengio et al., 1994).
A certain type of RNN, Long Short-Term Memory (LSTM) (Hochreiter and
Schmidhuber, 1997) has been designed to improve the learning of long-term depen-
dencies in the input sequence.
37

2.3 Long Short-Term Memory Recurrent Neural Net-
works
Like RNNs, Long Short-Term Memory Networks (Hochreiter and Schmidhuber, 1997)
have a chain like architecture, with a different module structure. Instead of having a
single neural network layer, each module has four layers filling different purposes. As
shown in Figure 2-6, each LSTM unit contains a memory cell with self-connections, as
well as three multiplicative gates - forget, input, output - to control information flow.
Each gate is composed out of a sigmoid neural net layer and a pointwise multiplication
operation. The notations for Figure 2-6 are outlined in Figure 2-6.
Given the input vector 𝑥𝑡, previous hidden outputs ℎ𝑡−1, and previous cell state
𝑐𝑡−1, the LSTM unit performs the following operations:
𝑓𝑡 = 𝜎(𝑊𝑓 .[ℎ𝑡−1, 𝑥𝑡] + 𝑏𝑓 )
𝑖𝑡 = 𝜎(𝑊𝑖.[ℎ𝑡−1, 𝑥𝑡] + 𝑏𝑖)
𝑐𝑡 = 𝑓𝑡 ⊙ 𝑐𝑡−1 + 𝑖𝑡 ⊙ tanh(𝑊𝑐.[ℎ𝑡−1, 𝑥𝑡] + 𝑏𝑐)
𝑜𝑡 = 𝜎(𝑊𝑜.[ℎ𝑡−1, 𝑥𝑡] + 𝑏𝑜)
ℎ𝑡 = 𝑜𝑡 ⊙ tanh(𝑐𝑡)
where 𝑓𝑡 represents the forget gate, 𝑖𝑡 represents the input gate, 𝑜𝑡 represents the
output gate, and ℎ𝑡 represents the hidden layer.
Many variants of LSTMs were later introduced, such as depth gated RNNs (Yao
et al., 2015), clockwork RNNS (Koutnik et al., 2014), and Gated Recurrent Unit
RNNs (Cho et al., 2014).
Bidirectional Recurrent Neural Networks
Bidirectional RNNs (Schuster and Paliwal, 1997) or BRNN use a past and future
context sequences to predict or label each element. This is done by combining the
outputs of two RNN, one processing the sequence forward (or left to right), the other
one processing the sequence backwards (or from right to left). This technique proved
38
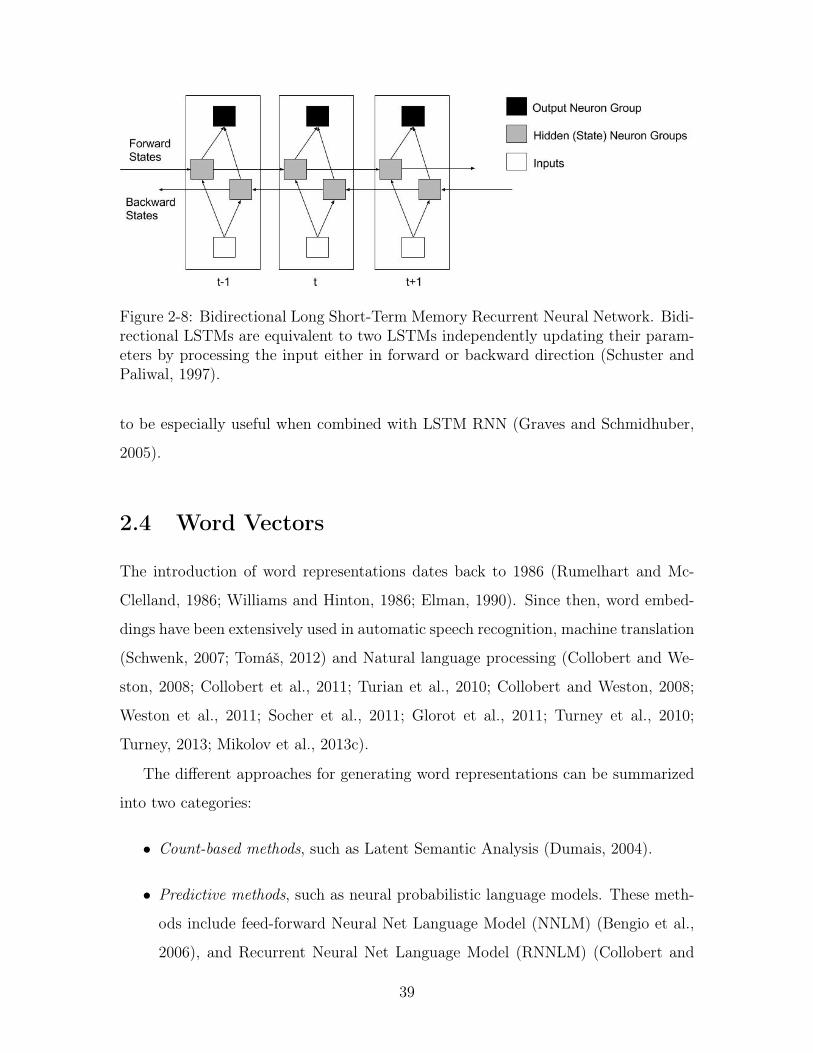
Figure 2-8: Bidirectional Long Short-Term Memory Recurrent Neural Network. Bidi-rectional LSTMs are equivalent to two LSTMs independently updating their param-eters by processing the input either in forward or backward direction (Schuster andPaliwal, 1997).
to be especially useful when combined with LSTM RNN (Graves and Schmidhuber,
2005).
2.4 Word Vectors
The introduction of word representations dates back to 1986 (Rumelhart and Mc-
Clelland, 1986; Williams and Hinton, 1986; Elman, 1990). Since then, word embed-
dings have been extensively used in automatic speech recognition, machine translation
(Schwenk, 2007; Tomáš, 2012) and Natural language processing (Collobert and We-
ston, 2008; Collobert et al., 2011; Turian et al., 2010; Collobert and Weston, 2008;
Weston et al., 2011; Socher et al., 2011; Glorot et al., 2011; Turney et al., 2010;
Turney, 2013; Mikolov et al., 2013c).
The different approaches for generating word representations can be summarized
into two categories:
∙ Count-based methods, such as Latent Semantic Analysis (Dumais, 2004).
∙ Predictive methods, such as neural probabilistic language models. These meth-
ods include feed-forward Neural Net Language Model (NNLM) (Bengio et al.,
2006), and Recurrent Neural Net Language Model (RNNLM) (Collobert and
39
Weston, 2008; Socher et al., 2011). However, these models are computationally
expensive, because of the need to compute and normalize each probability us-
ing a context-compatibility score with all other words in the current context, at
every training step.
Word2vec (Mikolov et al., 2013a) is a word vector encoder, which produces feature
vectors for words in a corpus by grouping the vectors of similar words together in
vector space. Word2vec does not use a full probabilistic model for learning features,
but instead trains using a logistic regression to discriminate the real target words
from noise words in the same context. While it is not a deep neural network, it
turns text into a numerical form that neural networks can understand, by creating a
high-dimensional distributed numerical representation of word features based on the
word’s past appearances and contexts.
Rather than training against the input words through reconstruction, as a re-
stricted Boltzmann machine does (Rummelhart et al., 1986), word2vec trains words
against other neighboring words in the input corpus. This training can be done
through two distinct models (Continuous Bag-of-Words Model and skip-gram Model),
each with two different training methods (with/without negative sampling) and other
variations (e.g. hierarchical softmax), which optimize computations (Mikolov et al.,
2013b). The architectures of the two models are described below:
∙ Continuous Bag-of-Words Model: In the Continuous Bag-of-Words model
(CBOW), Word2vec uses context to predict a target word. The input to the
model could be 𝑊𝑡−2,𝑊𝑡−1,𝑊𝑡+1,𝑊𝑡+2 the two words preceding 𝑊𝑡 and the two
words following 𝑊𝑡. The input words get projected into the same position to
produce the output 𝑊𝑡 as shown in Figure 2-9. The system’s parameters can
also be adjusted to include a bigger window of input words.
∙ Continuous Skip-gram Model: The Skip-gram Model does the inverse of the
CBOW model, and uses a target word to predict context-words by maximizing
the classification of a word based on other words within a certain range before
and after 𝑊𝑡. A log-linear classifier with continuous projection layer is used
40
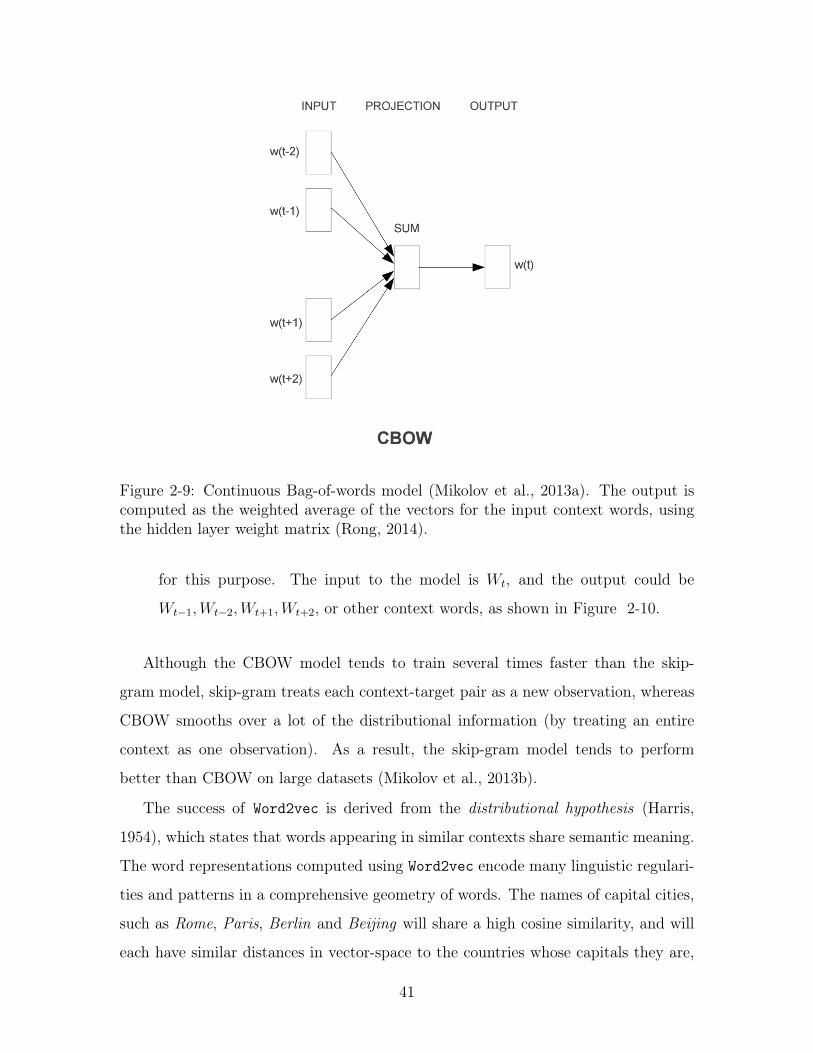
Figure 2-9: Continuous Bag-of-words model (Mikolov et al., 2013a). The output iscomputed as the weighted average of the vectors for the input context words, usingthe hidden layer weight matrix (Rong, 2014).
for this purpose. The input to the model is 𝑊𝑡, and the output could be
𝑊𝑡−1,𝑊𝑡−2,𝑊𝑡+1,𝑊𝑡+2, or other context words, as shown in Figure 2-10.
Although the CBOW model tends to train several times faster than the skip-
gram model, skip-gram treats each context-target pair as a new observation, whereas
CBOW smooths over a lot of the distributional information (by treating an entire
context as one observation). As a result, the skip-gram model tends to perform
better than CBOW on large datasets (Mikolov et al., 2013b).
The success of Word2vec is derived from the distributional hypothesis (Harris,
1954), which states that words appearing in similar contexts share semantic meaning.
The word representations computed using Word2vec encode many linguistic regulari-
ties and patterns in a comprehensive geometry of words. The names of capital cities,
such as Rome, Paris, Berlin and Beijing will share a high cosine similarity, and will
each have similar distances in vector-space to the countries whose capitals they are,
41
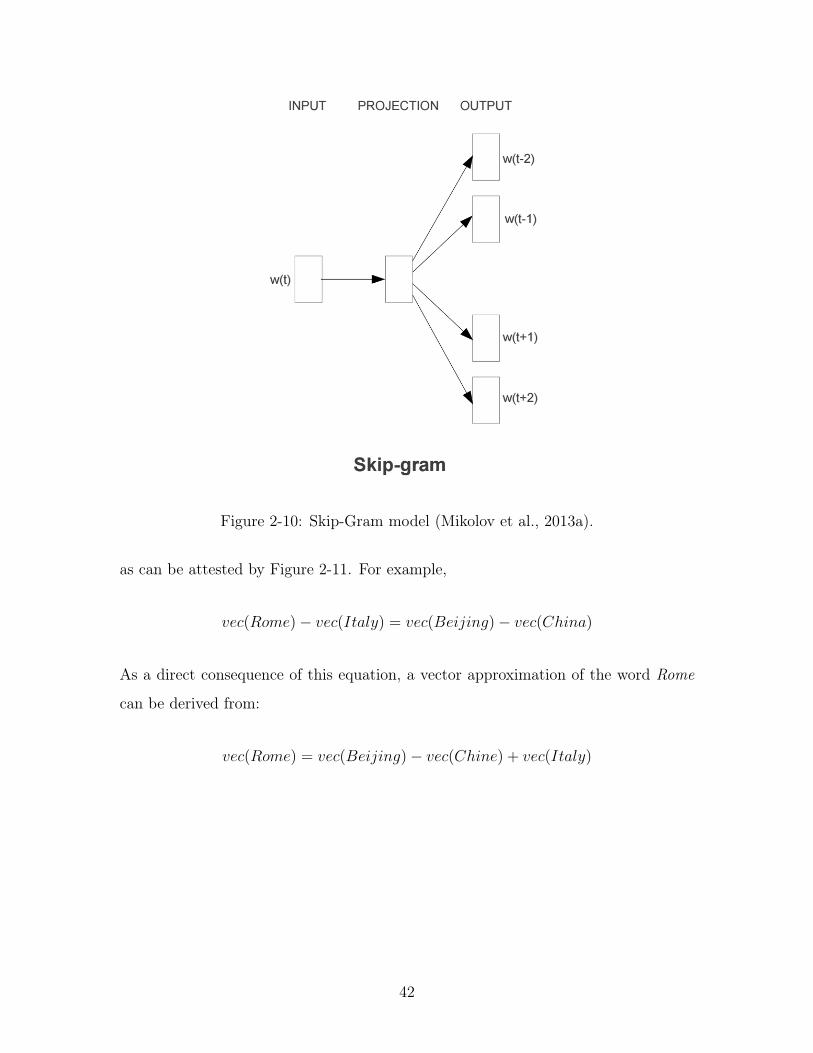
Figure 2-10: Skip-Gram model (Mikolov et al., 2013a).
as can be attested by Figure 2-11. For example,
𝑣𝑒𝑐(𝑅𝑜𝑚𝑒)− 𝑣𝑒𝑐(𝐼𝑡𝑎𝑙𝑦) = 𝑣𝑒𝑐(𝐵𝑒𝑖𝑗𝑖𝑛𝑔)− 𝑣𝑒𝑐(𝐶ℎ𝑖𝑛𝑎)
As a direct consequence of this equation, a vector approximation of the word Rome
can be derived from:
𝑣𝑒𝑐(𝑅𝑜𝑚𝑒) = 𝑣𝑒𝑐(𝐵𝑒𝑖𝑗𝑖𝑛𝑔)− 𝑣𝑒𝑐(𝐶ℎ𝑖𝑛𝑒) + 𝑣𝑒𝑐(𝐼𝑡𝑎𝑙𝑦)
42
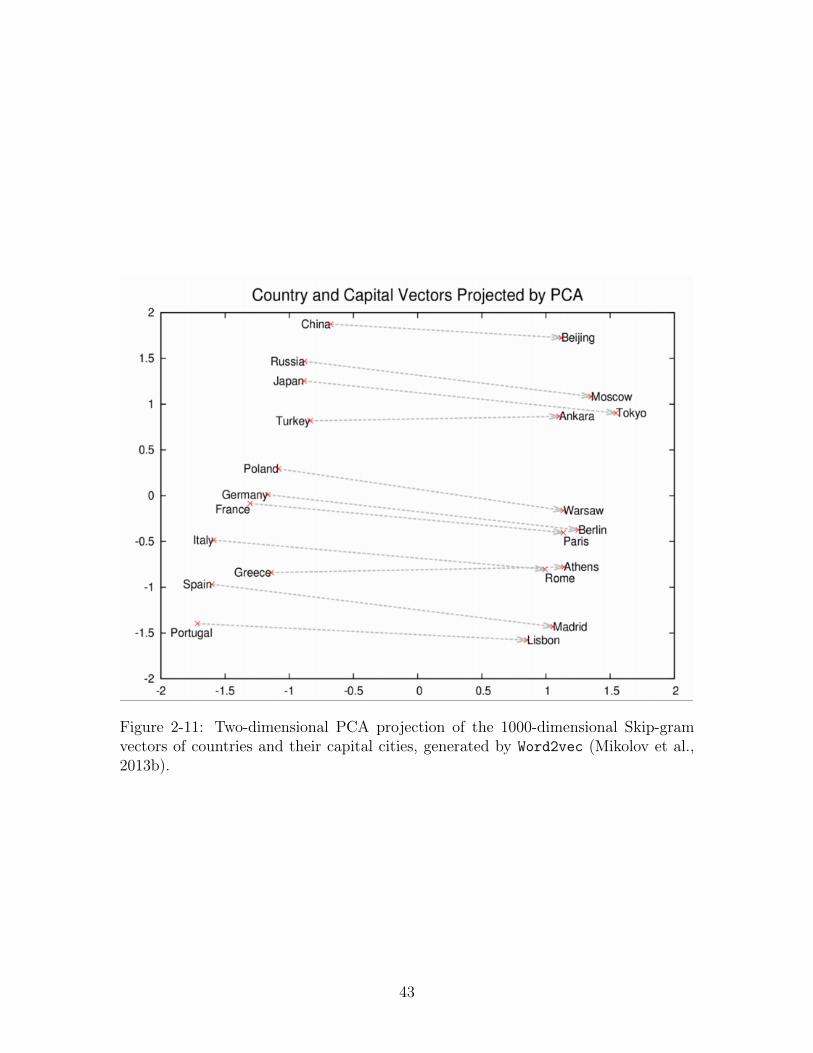
Figure 2-11: Two-dimensional PCA projection of the 1000-dimensional Skip-gramvectors of countries and their capital cities, generated by Word2vec (Mikolov et al.,2013b).
43

44
Chapter 3
Related Work
In the following sections we do a comprehensive review of previous work in the do-
mains of Aspect Based Sentiment Analysis (ABSA) and Community Question An-
swering (cQA). Within each domain, we review each task and present major ap-
proaches that have been used to address it.
3.1 Aspect-Based Sentiment analysis
Sentiment analysis is increasingly viewed as a vital task both from an academic and
a commercial standpoint. Early work in sentiment analysis was mainly aimed at
detecting the overall polarity (e.g., positive or negative) of a given text or text span
(Pang et al., 2002; Turney, 2002). In contrast, Aspect-Based Sentiment Analysis
(ABSA) aims to identify the aspects of the entities being reviewed and to determine
the sentiment for each aspect expressed by the reviewers. Within the last decade,
several ABSA systems of this kind have been developed for movie reviews (Thet
et al., 2010), customer reviews of electronic products like digital cameras (Hu and
Liu, 2004) or netbook computers (Brody and Elhadad, 2010), services (Long et al.,
2010), and restaurants (Ganu et al., 2009; Brody and Elhadad, 2010). In its most
simplistic form, aspect-based sentiment analysis involves two main stages:
1. Aspect term extraction and category detection.
45
2. Aspect sentiment classification.
3.1.1 Aspect Term Extraction and Category Detection
There are four main ways to extract explicit aspects from a sentence. The first method
uses frequent nouns and noun phrases, the second method exploits opinion and target
relationships, the third method relies on supervised learning, and the fourth method
uses topic modeling. Each method is explained as follows.
Extraction based on frequent nouns and noun phrases: This method filters
out non-aspect terms by assuming that their frequency of occurrence in a document
is lower than that of aspect terms. Since most explicit aspects are nouns, it first iden-
tifies nouns and noun phrases using a part-of-speech (POS) tagger, then counts them
and keeps the frequent ones. Non-aspect noun phrases can further be removed by the
pointwise mutual information score between phrases and some meronymy discrim-
inators associated with the entity (Popescu and Etzioni, 2007). These meronymy
discriminators are the semantic relations signaling an aspect, such as “the camera
comes with”, “the camera has”, etc.
Extraction by exploiting opinion and target relation: This approach relies on
first finding sentiment words and then identifying the corresponding aspect, usually
using a dependency parser. In Zhuang et al. (2006); Somasundaran and Wiebe (2009);
Kobayashi et al. (2006), a dependency parser was used to identify such dependency
relations for aspect extraction.
Extraction using supervised learning: This method relies on sequential learn-
ing involving the use of Hidden Markov Models (HMM) and Conditional Random
Fields (CRF) (Hamdan et al., 2000; Toh and Wang, 2014). The models are trained
on manually labeled data from different domains for a more domain independent ex-
traction. The features can be chosen to be domain-independent e.g. tokens, POS
tags, syntactic dependency, word distance, and opinion sentences. The current state-
46

of-the-art sequential learning methods are Hidden Markov Models (HMM) (Rabiner,
1989) and Conditional Random Fields (CRF) (Lafferty et al., 2001). Jin and Ho (Jin
et al., 2009) applied a lexicalized HMM model to learn patterns to extract aspects and
opinion expressions. Jakob and Gurevych (Jakob and Gurevych, 2010) used CRFs to
do the same task.
Extraction using topic modeling: Topic modeling is an unsupervised learning
method that assumes each document consists of a mixture of topics, and each topic is
a probability distribution over words. There are two main basic models; Probabilistic
Latent Semantic Analysis (pLSA) (Hofmann, 1999) and Latent Dirichlet allocation
(LDA) (Blei et al., 2003; Griffiths et al., 2003; Steyvers and Griffiths, 2007).
In the sentiment analysis context, one can design a mixture model to model the
distribution of both sentiment words and topics at the same time, due to the obser-
vation that every opinion has a target. Mei et al. (Mei et al., 2007) proposed a joint
model for sentiment analysis based on pLSA. One main issue with topic modeling is
that it needs a large volume of data and a significant amount of tuning in order to
achieve reasonable results. In addition, while it is not hard for topic modeling to find
those very general and frequent topics or aspects from a large document collection,
it is not easy to find those locally frequent but globally not so frequent aspects. Such
locally frequent aspects are often the most useful ones for applications because they
are likely to be most relevant to the specific entities that the user is interested in.
Topic modeling succeeds at giving a high level idea about what a document collection
is about.
3.1.2 Aspect Sentiment Prediction
The Aspect Sentiment Prediction task consists of determining the orientation or po-
larity of aspect-specific sentiments expressed by the author, and can be done through
two main approaches: “Supervised learning” and “Lexicon-based approach” explained
as follows.
47

Supervised learning: Supervised learning methods are mainly used to classify
sentence-level or clause-level sentiments, and involve training a classifier on a training
set of labeled data. Since sentiment classification is, at its essence, a classifying
problem, it can be approached using naive Bayes classification, and support vector
machines (SVM) (Joachims, 1999; Cristianini and Shawe-Taylor, 2000). The first
supervised learning approach to classify movie reviews using unigrams as features and
naive Bayes or SVM was demonstrated by Pang, Lee and Vaithyanathan (Pang et al.,
2002). When it comes to sentiment classification, the challenge of supervised learning
lies in the engineering of a set of effective features. Some of the most commonly used
features are: Terms and their frequency, part of speech, sentiment words and phrases,
rules of opinions, sentiment shifters and syntactic dependency (Kouloumpis et al.,
2011; Pak and Paroubek, 2010; Go et al., 2009; Wilson et al., 2009; Chikersal et al.,
2015; Anjaria and Guddeti, 2014). Some more advanced approaches include a scoring
functions in Dave et al. (2003). In Pang and Lee (2004), the minimum cut algorithm
working on a graph was employed to help sentiment classification. In Wei and Gulla
(2010), the authors proposed a Localized Feature Selection framework approach based
on hierarchical learning with sentiment ontology tree that is able to identify attributes
and its corresponding sentiment in one hierarchical classification process. However,
this approach still fails to capture the scope of each sentiment expression, i.e., whether
it covers the aspect of interest in the sentence. Overall, supervised learning is heavily
dependent on the training data and suffers from domain adaptation/transfer learning.
As a result, scalability to different domains can be limited.
Lexicon-based approaches: Unsupervised methods tend to perform better than
supervised learning methods across different domains. They rely on a sentiment
lexicon (words, phrases and idioms), composite expressions, rules of opinions, sentence
parse trees and sentiment shifters to determine the sentiment orientation on each
aspect in a sentence (Taboada et al., 2011; Augustyniak et al., 2014; Musto et al.,
2014). After entities and aspects are extracted, Ding, Liu and Yu (Ding et al., 2008)
presents the following four main steps to predict their sentiments:
48
∙ Mark sentiment words and phrases : This stage assigns a score of +1 to each
positive sentiment word and -1 to each negative sentiment word.
∙ Apply sentiment shifters : This stage revisits the score assignment and switches
the sign of the score based on its dependency on the sentiment shifter.
∙ The but-clauses : This stage handles contrary words which do not always indi-
cate sentiment shift.
∙ Aggregate opinions for each aspect : this stage aggregates the score of all the
sentiments assigned to a specific aspect to determine the overall sentiment ori-
entation for that aspect. Ding, Liu and Yu (Ding et al., 2008) used a sum
weighted by the distance between the sentiment word and the aspect in the
sentence, whereas Hu and Liu (Hu and Liu, 2004) simply summed up the sen-
timent scores of all sentiment words in a sentence or sentence segment, and
Kim and Hovy (Kim and Hovy, 2004) used multiplication of sentiment scores
of words.
3.2 Community Question Answering
Managing community question websites has grown increasingly difficult because of the
exponential growth in content triggered by wider access to the internet. Traditionally,
websites used to keep track of a list of frequently asked questions (FAQs) that a
visitor is expected to consult before asking a question. Now, with a wider range of
questions being asked, a need has emerged for a better, more scalable, system to
identify similarities between any two questions on the platform. In addition, with
many users contributing to a single question, it has become harder to identify which
answers are more relevant than others. We summarize these problems into two main
tasks:
∙ Question Retrieval Task
∙ Answer Selection Task
49
3.2.1 Question Retrieval Task
The recent increase in the number of community-based question platforms has lead
to a rapid build up of large archives of user-generated questions and answers. When
a new question is asked on the platform, the system searches for questions that are
semantically similar in the archives. If a similar question is found, the corresponding
correct answer is retrieved and returned immediately to the user as the final answer.
The quality of the answer depends on the effectiveness of the similar question retrieval
process.
However, measuring semantic similarities between questions is not trivial. Some-
times, two questions that have the same meaning use very different wording. For
example, “Is downloading movies illegal?” and “Can I share a copy of a DVD online”
have almost identical meanings but they are lexically very different. Traditional met-
rics for measuring sentence distance such as the Jaccard coefficient and the overlap
coefficient (Manning and Schütze, 1999) perform poorly.
Three different types of approaches have been developed in the literature to solve
this word mismatch problem among questions. The first approach uses knowledge
databases such as machine readable dictionaries. There has been some research on
retrieval using FAQ data. FAQ Finder (Burke et al., 1997) heuristically combines
statistical and semantic similarities between questions to rank FAQs. Conventional
vector space models are used to calculate the statistical similarity, and WordNet (Fell-
baum, 1998) is used to estimate the semantic similarity between questions. Song
et al. (2007) presented an approach which is a linear combination of statistic sim-
ilarity, calculated based on word co-occurrence, and semantic similarity, calculated
using WordNet (Fellbaum, 1998) and a bipartite mapping. Auto-FAQ (Whitehead,
1995) applied shallow language understanding into automatic FAQ answering, where
the matching of a user question to FAQs is based on keyword comparison enhanced
by limited language processing techniques. However, the quality and structure of
current knowledge databases are, based on the results of previous experiments, not
good enough for reliable performance.
50
The second approach employs manual rules or templates. These methods are ex-
pensive and hard to scale for large size collections. Sneiders (2002) proposed template
based FAQ retrieval systems. Lai et al. (2002) proposed an approach to automatically
mine FAQs from the Web. However, they did not study the use of these FAQs after
they were collected. FALLQ (Lenz et al., 1998) used case-based knowledge for FAQ
answering. Berger et al. (2000) proposed a statistical lexicon correlation method.
These previous approaches were tested with relatively small sized collections and are
hard to scale because they are based on specific knowledge databases or handcrafted
rules. User click log has also been used to find similar queries in Kim and Seo (2006).
The third approach is to use statistical techniques developed in information re-
trieval and natural language processing (Berger et al., 2000). Jeon et al. (2005) dis-
cussed methods for question retrieval that are based on using the similarity between
answers in the archive to estimate probabilities for a translation-based retrieval model.
They performed the IBM model 1 (Brown et al., 1993) to learn word translation prob-
abilities on a collection of question pairs. Given a new question, a translation-based
information retrieval model exploits the word relationships to retrieve similar ques-
tions from Q&A archives. They showed that this model makes it possible to find
semantically similar questions with relatively little word overlap.
In addition, recent work shows the effectiveness of neural models in question
similarity (dos Santos et al., 2015) in community question answering. dos Santos
et al. (2015) developed CNN and bag-of-words (BOW) representation models for the
question similarity task. Cosine similarity between the representations of the input
questions were used to compute the CNN and BOW similarity scores for the question-
question pairs. The convolutional representations, in conjunction with other vectors,
are then passed to a MLP to compute the similarity score of the question pair. In
this thesis, we present a neural model based on the stacked bidirectional LSTMs and
MLPs to capture the long dependencies in questions and answers.
51

3.2.2 Answer Selection Task
Passage reordering or reranking has always been an essential step of automatic answer
selection (Radlinski and Joachims, 2005; Jeon et al., 2005; Shen and Lapata, 2007;
Moschitti et al., 2007; Severyn and Moschitti, 2015a; Moschitti, 2008; Tymoshenko
and Moschitti, 2015; Surdeanu et al., 2008). Many methods have been proposed, such
as web redundancy information (Magnini et al., 2002) and non-textual features (Jeon
et al., 2006).
Recently, many advanced models have been developed for automating answer se-
lection based on syntactic structures (Severyn and Moschitti, 2012, 2013; Grundström
and Nugues, 2014) and textual entailment. These models include quasi- synchronous
grammars to learn syntactic transformations from the question to the candidate an-
swers (Wang et al., 2007); Continuous word and phrase vectors to encode semantic
similarity (Belinkov et al., 2015); Tree Edit Distance (TED) to learn tree transfor-
mations in pairs (Heilman and Smith, 2010); Probabilistic model to learn tree-edit
operations on dependency parse trees (Wang and Manning, 2010); and linear chain
CRFs with features derived from TED to automatically learn associations between
questions and candidate answers (Yao et al., 2013).
In addition to the usual local features that only look at the question-answer pair,
automatic answer selection algorithms can rely on global thread-level features, such
as the position of the answer in the thread (Hou et al., 2015), or the context of an
answer in a thread (Nicosia et al., 2015), or the dependencies between thread answers
using structured prediction models (Barrón-Cedeno et al., 2015).
Joty et al. (2015), modeled the relations between pairs of answers at any distance in
the thread, which they combine in a graph-cut and in an Integer Linear Programming
(ILP) framework (Schrijver, 1998; Wolsey and Nemhauser, 2014). They then proposed
a fully connected pairwise CRFs (FCCRFs) with global normalization and an Ising-
like edge potential (Ising, 1925).
In addition, recent work shows the effectiveness of neural models in answer selec-
tion (Severyn and Moschitti, 2015b; Tan et al., 2015; Feng et al., 2015) in community
52

question answering. While recent research has shown the effectiveness of CNNs for
answer ranking of short textual contents Severyn and Moschitti (2015b), we develop
a neural model based on LSTMs to explore the effectiveness of the neural networks
on the longer questions and answers.
53

54
Chapter 4
Aspect-Based Sentiment Analysis
We aim to address the Aspect-based Sentiment Analysis tasks, which we briefly sum-
marize as follows:
∙ Aspect category detection: Given a predefined set of aspect categories (e.g.,
price, food), identify the aspect categories expressed in a given sentence.
∙ Aspect category sentiment prediction: Given a set of pre-identified aspect cat-
egories (e.g., food, price), determine the sentiment (positive, negative, neutral
or conflict) of each aspect category.
These tasks are explained in details in Chapter 1. In this chapter, we present a
neural-based model based on CNNs, which we explain in Section 2.1, to address these
tasks. As shown in Section 4.2, extensive experiments demonstrate the model out-
performs the baselines. In Section 4.3, we visualize the semantic similarities between
words on the basis of the cosine similarities between their vector representations.
4.1 Method
Unlike traditional feature-based classification methods, our method for approaching
the aspect based sentiment analysis tasks relies on using Convolutional Neural Net-
works to capture n-grams features and long-range dependencies (Yu et al., 2014),
55
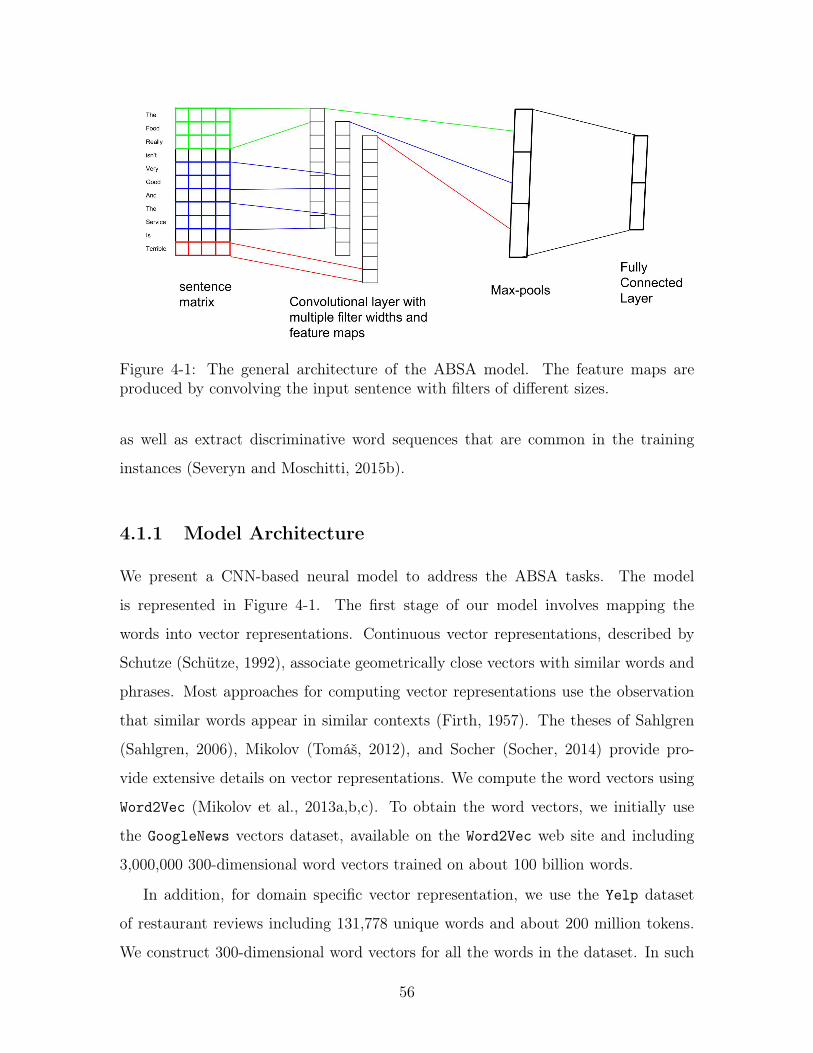
Figure 4-1: The general architecture of the ABSA model. The feature maps areproduced by convolving the input sentence with filters of different sizes.
as well as extract discriminative word sequences that are common in the training
instances (Severyn and Moschitti, 2015b).
4.1.1 Model Architecture
We present a CNN-based neural model to address the ABSA tasks. The model
is represented in Figure 4-1. The first stage of our model involves mapping the
words into vector representations. Continuous vector representations, described by
Schutze (Schütze, 1992), associate geometrically close vectors with similar words and
phrases. Most approaches for computing vector representations use the observation
that similar words appear in similar contexts (Firth, 1957). The theses of Sahlgren
(Sahlgren, 2006), Mikolov (Tomáš, 2012), and Socher (Socher, 2014) provide pro-
vide extensive details on vector representations. We compute the word vectors using
Word2Vec (Mikolov et al., 2013a,b,c). To obtain the word vectors, we initially use
the GoogleNews vectors dataset, available on the Word2Vec web site and including
3,000,000 300-dimensional word vectors trained on about 100 billion words.
In addition, for domain specific vector representation, we use the Yelp dataset
of restaurant reviews including 131,778 unique words and about 200 million tokens.
We construct 300-dimensional word vectors for all the words in the dataset. In such
56
dense representations, semantically close words are likewise close (in euclidean or
cosine distance) in the lower dimensional vector space.
Once a vector representation is computed for each word, the input sentences are
then convolved with a set of convolutional filters of different sizes (e.g., unigrams,
bigrams, trigrams) to generate a set of feature maps. A max pooling operation is
then used to subsample feature maps, which are then fed into a fully connected
multi-layer perceptron leading to a softmax distribution over all classes, as shown in
Figure 4-1.
In the figure, the input sentence is converted to a matrix generated using the
concatenation or stacking of its word vectors. Then, the matrix is convolved with
filters of size 1x300, 2x300, 3x300 to generate 3 feature maps. The feature maps
undergo a maxpooling operation before being passed to the fully connected layer.
4.1.2 Aspect Category Detection
In this task, given a sentence and a pre-defined set of aspect categories (ambiance,
price, service, food, anecdotes/miscellaneous), we aim to predict the categories ex-
pressed in the sentence. The sentence can contain more than one aspect category. We
create the above model, which we apply with the following two classification schemes;
"One vs all" and "Multiclass-Multilabel" classification explained below.
One vs all: In the first setup, we attempt a one-vs-all classification scheme where a
prediction is made for each aspect category independently. That is, five CNN models
are constructed, with each one predicting one aspect category versus others. Then,
the five predictions are aggregated to predict all aspect categories mentioned in the
given sentence.
Multiclass-Multilabel: The aspect categories are independently predicted in the
first setup; however, these categories might not be independent and could have an ef-
fect on each other. In the second setup, we attempt simultaneous multiclass-multilabel
classification. This method classifies each sentence into one or many aspect categories
57

Embedding word2vec, fixedHidden dimension 300
Filter width {3, 4, 5}Optimizer AdaDelta
Learning rate 0.95Dropout rate 0.5
Table 4.1: The hyper-parameters of CNN model. The values of the hyper-parametersare optimized based on the results on the development set.
using a single CNN model rather than five.
4.1.3 Aspect Category Sentiment Prediction
In this task, given a sentence and its aspect category, we aim to predict the sentiment
(positive, negative, neutral, conflict) of the aspect categories expressed in the sentence.
If the sentiment of a category is predicted as both positive and negative and their
corresponding sentiment scores are close, it would be predicted as conflict. We apply
the CNN model for the Aspect Category Sentiment Prediction task with the following
two classification schemes; "One vs all" and "Multiclass-Multilabel" classification
explained as follows.
One vs all: In the first setup, we attempt a one-vs-all classification scheme where
a prediction is independently made for each sentiment class, for each aspect category.
That is, four CNN models are constructed each predicting one sentiment versus others,
for each aspect category. Then, the four predictions are aggregated to predict the
sentiment of the aspect category mentioned in the sentence. The sentiment class with
the highest probability score is assigned to the aspect category.
Multiclass-Multilabel: In the second setup, we simultaneously consider all sen-
timent classes, and classify the aspect into one of them. This approach allows the
capture of any dependencies between aspects and sentiments.
58
4.1.4 Hyper-parameters
Table 4.1 shows the hyper-parameters used in our CNN model. The values for the
hyper-parameters are optimized based on the results on the development set. The
word vectors are initialized using word2vec, as explained in Section 4.1.1. These vec-
tor representations are updated during the training phase if the non-static parameter
is used, and remain the same if the static parameter is used in the CNN model. We
employ AdaDelta (Zeiler, 2012) as the optimization method and negative log likeli-
hood as loss function for our model. Furthermore, we use the values 0.95 and 0.5 as
learning rate and dropout rate respectively. The convolutional filter widths selected
are {3, 4, 5}.
4.2 Evaluation and Results
4.2.1 Dataset
In our experiments, we use restaurant reviews provided by Pontiki et al. (2014);
Ganu et al. (2009) that contain 3,041 training sentences and 800 test sentences. The
training data contains 3,713 aspect categories, while the test data contains 1,025
aspect categories. In the dataset, the predefined aspect categories are food, service,
price, ambiance, anecdotes/miscellaneous. The four sentiment labels are positive,
negative, conflict, and neutral. The histogram in Figure 4-2 shows the distribution of
sentence lengths in the train and test datasets. While the average sentence length is
around 40 words, the CNN model can accurately capture the long dependencies in
the longer sentences to address the ABSA tasks.
4.2.2 Evaluation Metrics
We decompose ABSA into two classification problems explained in Section 4.1, and
present the CNN models to predict the aspect categories and sentiment classes for a
given sentence. We evaluate our results using classification metrics such as precision,
recall and F1 score.
59
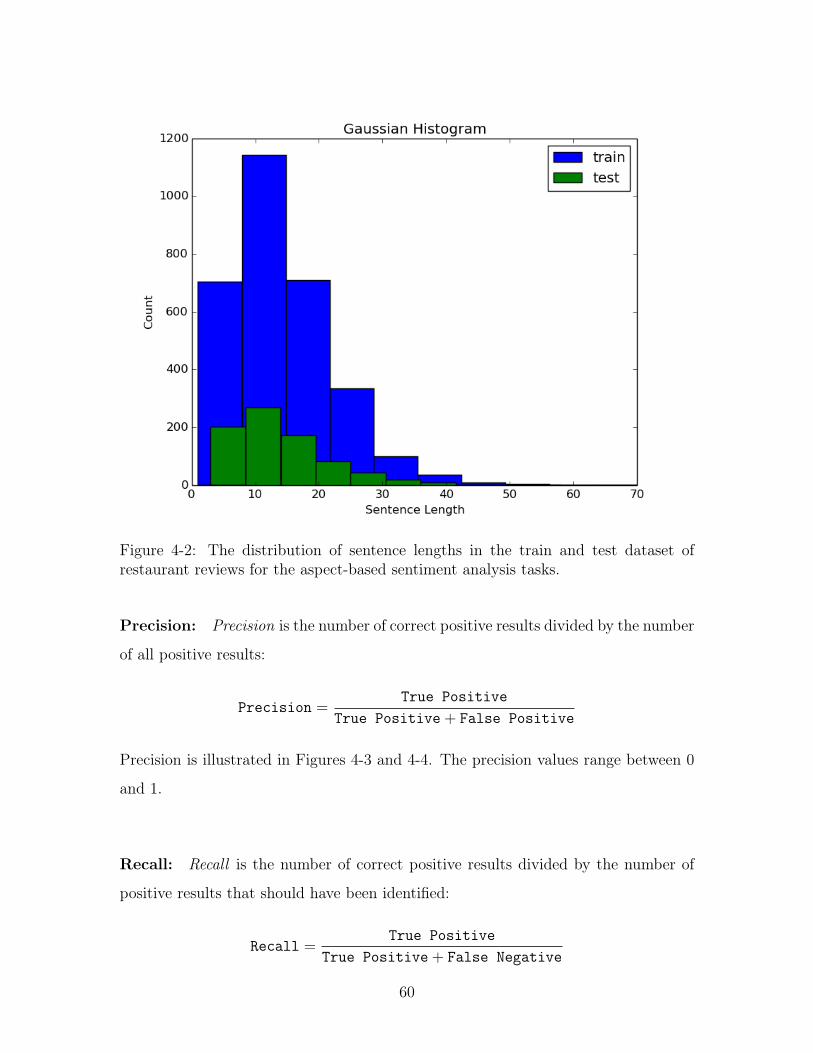
Figure 4-2: The distribution of sentence lengths in the train and test dataset ofrestaurant reviews for the aspect-based sentiment analysis tasks.
Precision: Precision is the number of correct positive results divided by the number
of all positive results:
Precision =True Positive
True Positive+ False Positive
Precision is illustrated in Figures 4-3 and 4-4. The precision values range between 0
and 1.
Recall: Recall is the number of correct positive results divided by the number of
positive results that should have been identified:
Recall =True Positive
True Positive+ False Negative
60
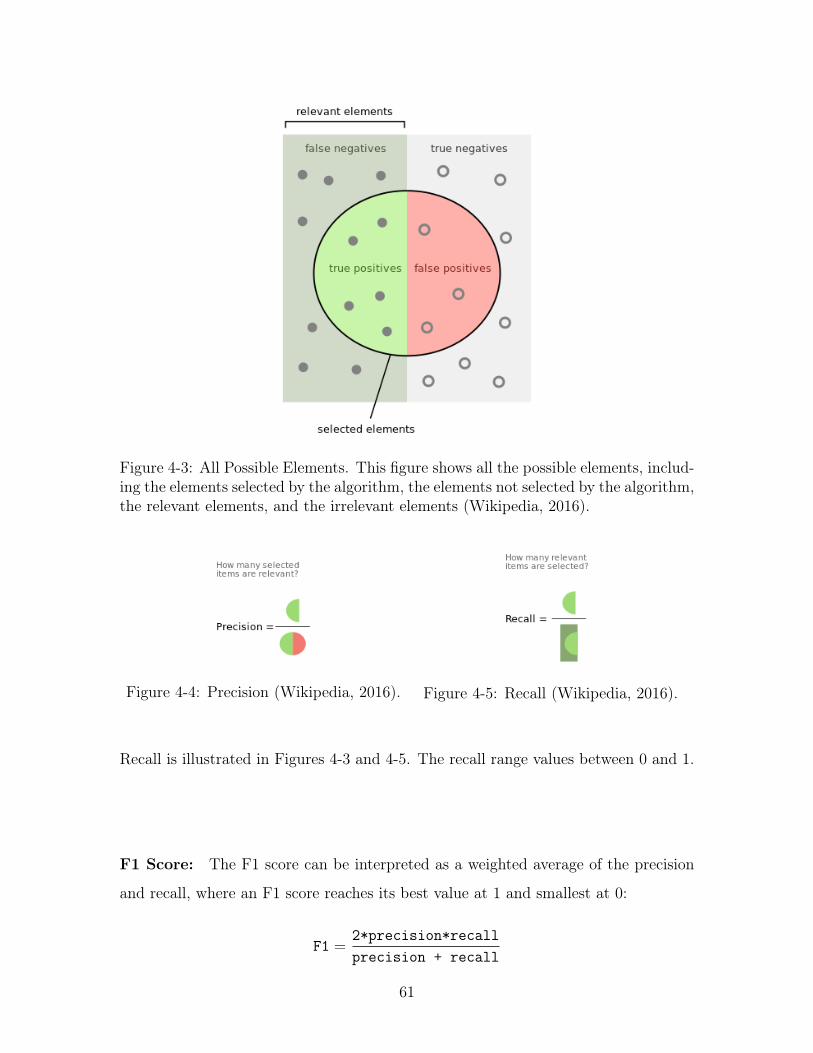
Figure 4-3: All Possible Elements. This figure shows all the possible elements, includ-ing the elements selected by the algorithm, the elements not selected by the algorithm,the relevant elements, and the irrelevant elements (Wikipedia, 2016).
Figure 4-4: Precision (Wikipedia, 2016). Figure 4-5: Recall (Wikipedia, 2016).
Recall is illustrated in Figures 4-3 and 4-5. The recall range values between 0 and 1.
F1 Score: The F1 score can be interpreted as a weighted average of the precision
and recall, where an F1 score reaches its best value at 1 and smallest at 0:
F1 =2*precision*recallprecision + recall
61

4.2.3 Baselines
We compare the performance of our CNN model on the ABSA tasks with the baselines
that are briefly explained as follows:
Aspect category detection baselin Baselinee: For every test sentence, the 𝑘
training sentences that are most similar to the test sentence are first retrieved. The
similarity between two sentences is measured as the Dice coefficient of the sets of
distinct words of the two sentences (Sørensen, 1948; Dice, 1945). For example, the
similarity between the sentences “this is a demo” and “that is yet another demo” is:
2 * 2/(4 + 5) = 0.44
The most frequent number 𝑚 of aspect categories per sentence among the 𝑘 retrieved
training sentences is then computed. For example, assume that 𝑘 = 5 and the re-
trieved training sentences have the following aspect categories, then 𝑚 = 2:
∙ sentence 1: food.
∙ sentence 2: food, service.
∙ sentence 3: price.
∙ sentence 4: food, price.
∙ sentence 5: food, ambience.
The test sentence is then assigned the 𝑚 most frequent aspect categories of the 𝑘
training sentences. In the above example, the test sentence would be assigned the
𝑚 = 2 aspect categories “food ” (with frequency 4) and “price” (with frequency 2).
The default value of 𝑘 is 5. The implementation of this baseline includes a parameter
multi. If multi is set to True, then 𝑚 is computed as above. If 𝑚𝑢𝑙𝑡𝑖 = 𝐹𝑎𝑙𝑠𝑒, then
𝑚 = 1.
62
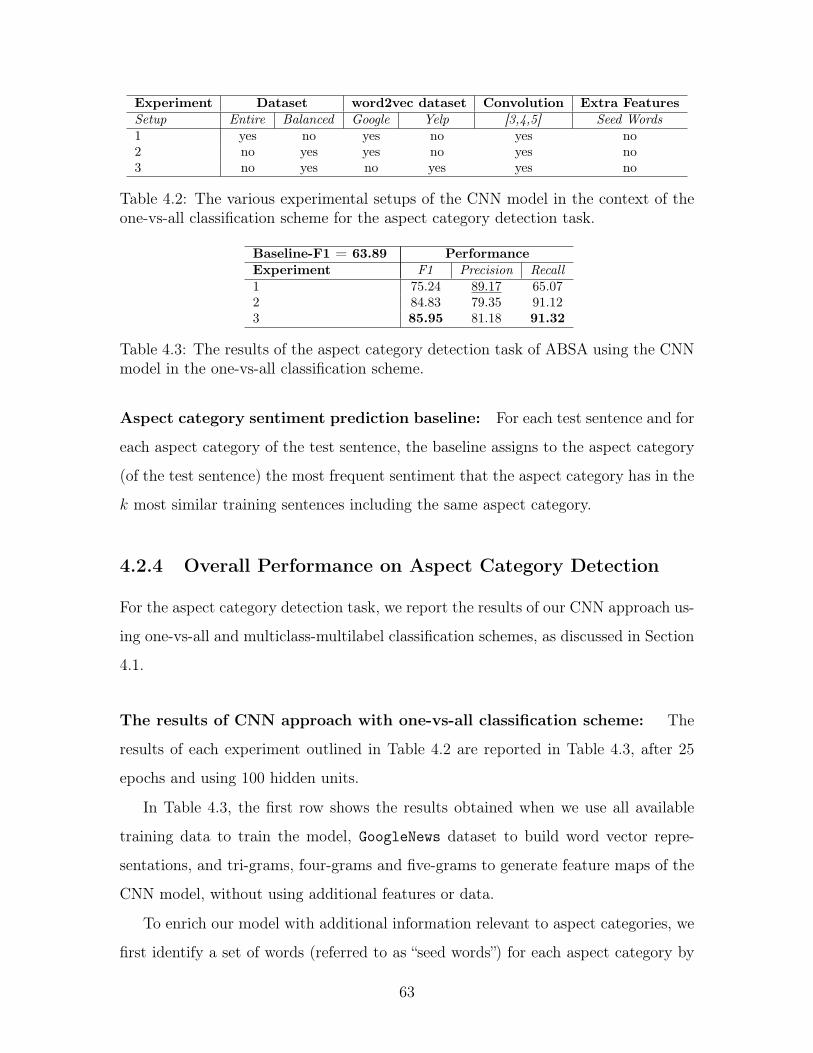
Experiment Dataset word2vec dataset Convolution Extra FeaturesSetup Entire Balanced Google Yelp [3,4,5] Seed Words1 yes no yes no yes no2 no yes yes no yes no3 no yes no yes yes no
Table 4.2: The various experimental setups of the CNN model in the context of theone-vs-all classification scheme for the aspect category detection task.
Baseline-F1 = 63.89 PerformanceExperiment F1 Precision Recall1 75.24 89.17 65.072 84.83 79.35 91.123 85.95 81.18 91.32
Table 4.3: The results of the aspect category detection task of ABSA using the CNNmodel in the one-vs-all classification scheme.
Aspect category sentiment prediction baseline: For each test sentence and for
each aspect category of the test sentence, the baseline assigns to the aspect category
(of the test sentence) the most frequent sentiment that the aspect category has in the
𝑘 most similar training sentences including the same aspect category.
4.2.4 Overall Performance on Aspect Category Detection
For the aspect category detection task, we report the results of our CNN approach us-
ing one-vs-all and multiclass-multilabel classification schemes, as discussed in Section
4.1.
The results of CNN approach with one-vs-all classification scheme: The
results of each experiment outlined in Table 4.2 are reported in Table 4.3, after 25
epochs and using 100 hidden units.
In Table 4.3, the first row shows the results obtained when we use all available
training data to train the model, GoogleNews dataset to build word vector repre-
sentations, and tri-grams, four-grams and five-grams to generate feature maps of the
CNN model, without using additional features or data.
To enrich our model with additional information relevant to aspect categories, we
first identify a set of words (referred to as “seed words”) for each aspect category by
63
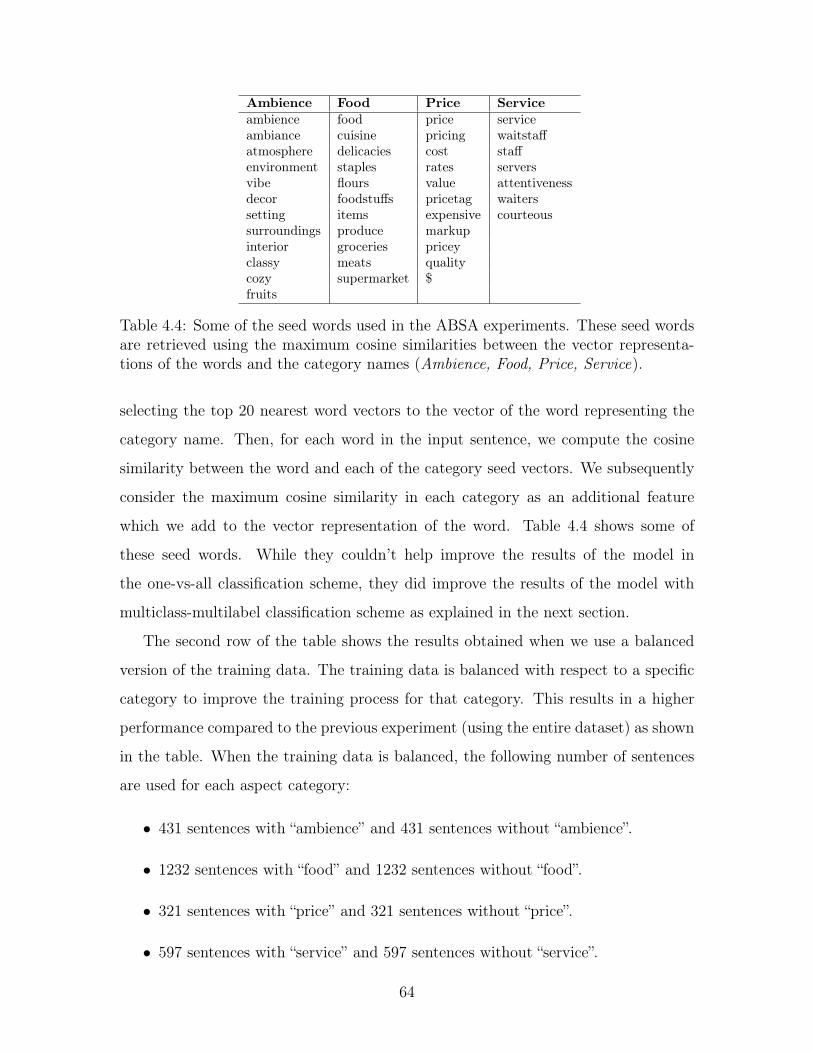
Ambience Food Price Serviceambience food price serviceambiance cuisine pricing waitstaffatmosphere delicacies cost staffenvironment staples rates serversvibe flours value attentivenessdecor foodstuffs pricetag waiterssetting items expensive courteoussurroundings produce markupinterior groceries priceyclassy meats qualitycozy supermarket $fruits
Table 4.4: Some of the seed words used in the ABSA experiments. These seed wordsare retrieved using the maximum cosine similarities between the vector representa-tions of the words and the category names (Ambience, Food, Price, Service).
selecting the top 20 nearest word vectors to the vector of the word representing the
category name. Then, for each word in the input sentence, we compute the cosine
similarity between the word and each of the category seed vectors. We subsequently
consider the maximum cosine similarity in each category as an additional feature
which we add to the vector representation of the word. Table 4.4 shows some of
these seed words. While they couldn’t help improve the results of the model in
the one-vs-all classification scheme, they did improve the results of the model with
multiclass-multilabel classification scheme as explained in the next section.
The second row of the table shows the results obtained when we use a balanced
version of the training data. The training data is balanced with respect to a specific
category to improve the training process for that category. This results in a higher
performance compared to the previous experiment (using the entire dataset) as shown
in the table. When the training data is balanced, the following number of sentences
are used for each aspect category:
∙ 431 sentences with “ambience” and 431 sentences without “ambience”.
∙ 1232 sentences with “food” and 1232 sentences without “food”.
∙ 321 sentences with “price” and 321 sentences without “price”.
∙ 597 sentences with “service” and 597 sentences without “service”.
64

Baseline-F1 = 63.89Dataset Extra Features CNN Settings Performance
Entire Balanced Seed Words Classification Convolution F1 Pre Recyes no no softmax relu 84.7 84.62 84.78yes no no tanh tanh 80.09 72.36 89.66yes no yes tanh tanh 83.76 78.29 90.05
Table 4.5: The results of the aspect category detection task of ABSA, using the CNNmodel in the multiclass-multilabel classification scheme.
∙ 1130 sentences with “anecdotes/miscellaneous” and 1130 sentences without “anec-
dotes/miscellaneous”.
The highest F1 is obtained when we use the Yelp data to compute the word vector
representations and balanced training data, as shown in the last row of the table. This
result shows the effectiveness of using the domain-specific and balanced training data
to address this research problem.
The results of CNN approach with multiclass-multilabel classification scheme:
In this experiment, our CNN model is trained over all aspect categories instead of
one category versus the others. The CNN is also trained using all training data,
which is unbalanced across different categories. The results of this experiment are
shown in in Table 4.5. All results are reported after 25 epochs, using the Yelp dataset
for training word2vec, 100 hidden units, and unigram, bigram and trigram convolu-
tions. The relu (linear) and tanh (non-linear) are used at the convolution layer, and
softmax (linear) and tanh (non-linear) are used at the classification layer. The first
two rows of Table 4.5 show that better results are achieved by using relu (linear) at
the convolution layer and softmax (linear) at the classification layer. The last row
of the table shows the result when the maximum cosine similarity between the seed
words of each category and the words of the input sentence is added as an additional
feature. This increase in F1 score shows that additional features can improve the
overall performance of the system.
65
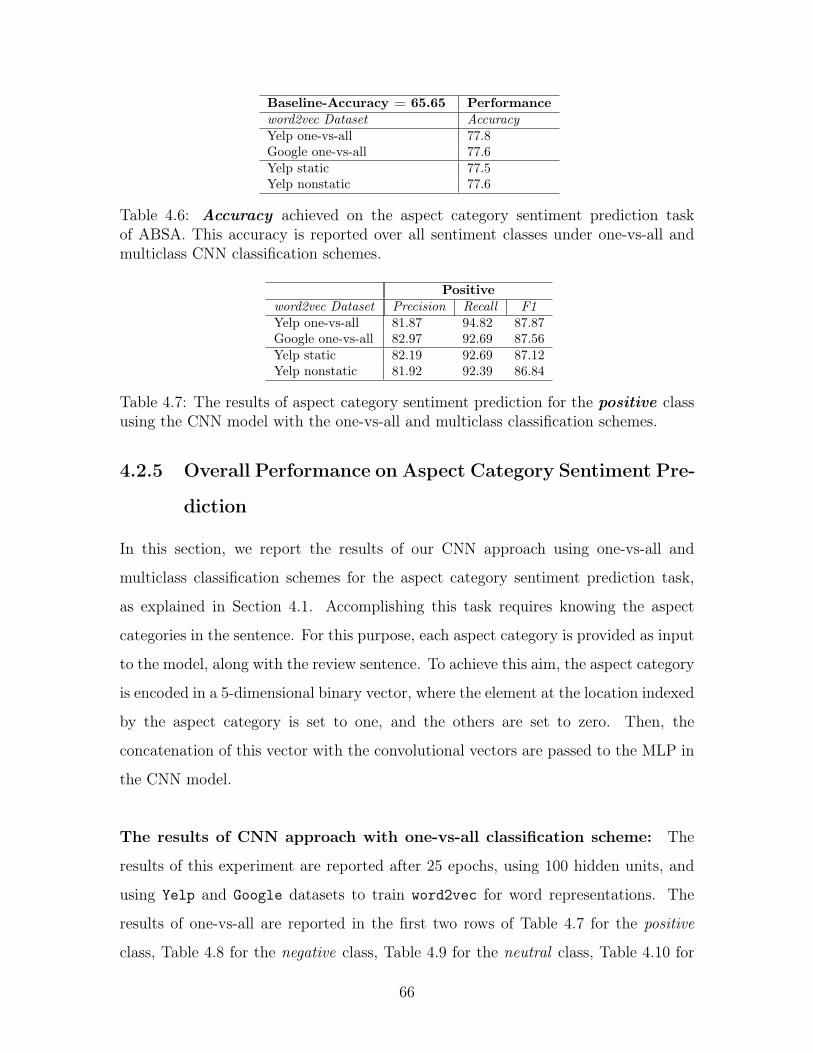
Baseline-Accuracy = 65.65 Performanceword2vec Dataset AccuracyYelp one-vs-all 77.8Google one-vs-all 77.6Yelp static 77.5Yelp nonstatic 77.6
Table 4.6: Accuracy achieved on the aspect category sentiment prediction taskof ABSA. This accuracy is reported over all sentiment classes under one-vs-all andmulticlass CNN classification schemes.
Positiveword2vec Dataset Precision Recall F1Yelp one-vs-all 81.87 94.82 87.87Google one-vs-all 82.97 92.69 87.56Yelp static 82.19 92.69 87.12Yelp nonstatic 81.92 92.39 86.84
Table 4.7: The results of aspect category sentiment prediction for the positive classusing the CNN model with the one-vs-all and multiclass classification schemes.
4.2.5 Overall Performance on Aspect Category Sentiment Pre-
diction
In this section, we report the results of our CNN approach using one-vs-all and
multiclass classification schemes for the aspect category sentiment prediction task,
as explained in Section 4.1. Accomplishing this task requires knowing the aspect
categories in the sentence. For this purpose, each aspect category is provided as input
to the model, along with the review sentence. To achieve this aim, the aspect category
is encoded in a 5-dimensional binary vector, where the element at the location indexed
by the aspect category is set to one, and the others are set to zero. Then, the
concatenation of this vector with the convolutional vectors are passed to the MLP in
the CNN model.
The results of CNN approach with one-vs-all classification scheme: The
results of this experiment are reported after 25 epochs, using 100 hidden units, and
using Yelp and Google datasets to train word2vec for word representations. The
results of one-vs-all are reported in the first two rows of Table 4.7 for the positive
class, Table 4.8 for the negative class, Table 4.9 for the neutral class, Table 4.10 for
66

Negativeword2vec Dataset Precision Recall F1Yelp one-vs-all 73.64 72.97 73.30Google one-vs-all 67.26 67.57 67.42Yelp static 68.33 68.02 68.17Yelp nonstatic 69.67 66.22 67.90
Table 4.8: The results of aspect category sentiment prediction for the negative classusing the CNN model with the one-vs-all and multiclass classification schemes.
Neutralword2vec Dataset Precision Recall F1Yelp one-vs-all 68.42 13.83 23.01Google one-vs-all 73.47 38.30 50.35Yelp static 59.26 34.04 43.24Yelp nonstatic 60.61 42.55 50.00
Table 4.9: The results of aspect category sentiment prediction for the neutral classusing the CNN model with the one-vs-all and multiclass-multilabel classificationschemes.
the conflict class. The overall accuracy of the one-vs-all experiments is reported in
the first two rows of Table 4.6. As shown in the first two rows of the tables, higher
scores have been achieved for the positive and negative classes using the Yelp data,
while the neutral and conflict sentiment classes were better identified when words
were trained using Google data. Table 4.10 shows that the model performs poorly at
predicting the conflict class. The reason is that the number of training instances for
this class is very small, as can be seen in Table 4.11.
The results of CNN approach with multiclass classification scheme: In the
second setup, we simultaneously consider all sentiment classes in one CNN rather
than four, and classify a given (𝑠𝑒𝑛𝑡𝑒𝑛𝑐𝑒, 𝑎𝑠𝑝𝑒𝑐𝑡𝑐𝑎𝑡𝑒𝑔𝑜𝑟𝑦) pair into one of the four
sentiment classes. We consider both static and non-static word representations. static
word representations are initialized using word2vec trained on Yelp dataset and not
updated during training, while non-static word representations are initialized using
word2vec and updated during training using the adadelta (Zeiler, 2012). The results
of this experiment for each sentiment class are reported in the last two rows of Ta-
bles 4.7, 4.8, 4.9, 4.10 with the overall accuracy reported in the last two rows of
Table 4.6. The results show that static representations tend to perform slightly better
67
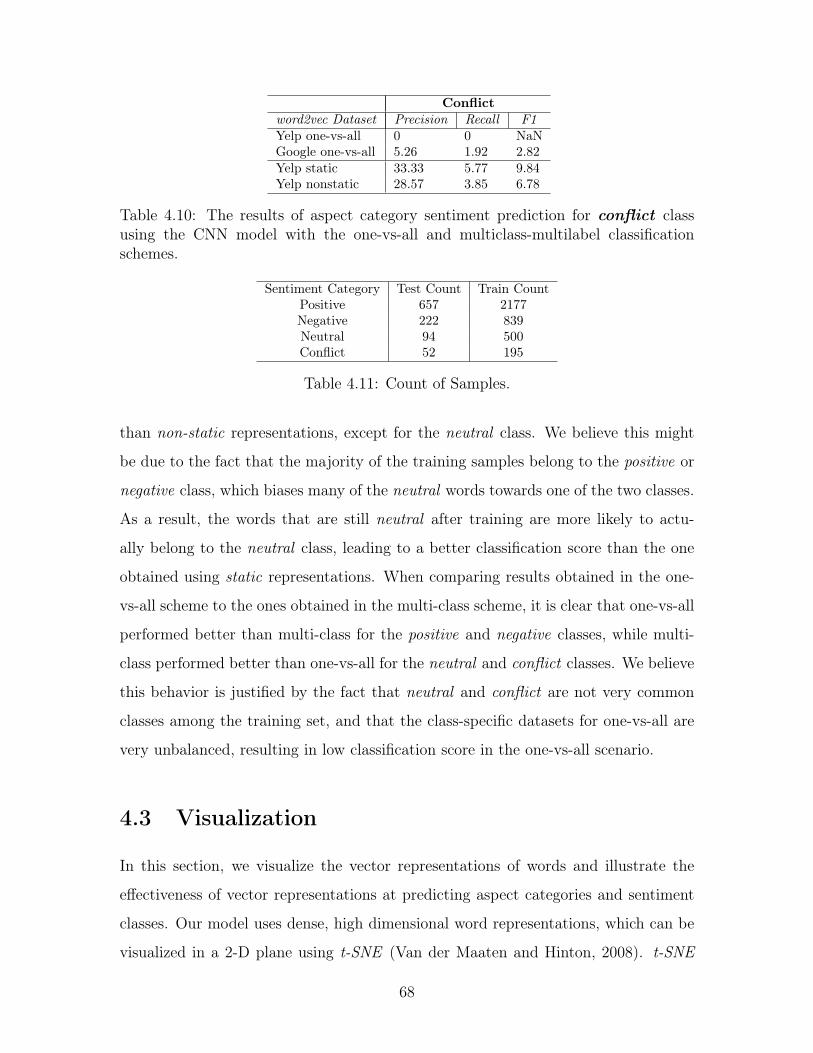
Conflictword2vec Dataset Precision Recall F1Yelp one-vs-all 0 0 NaNGoogle one-vs-all 5.26 1.92 2.82Yelp static 33.33 5.77 9.84Yelp nonstatic 28.57 3.85 6.78
Table 4.10: The results of aspect category sentiment prediction for conflict classusing the CNN model with the one-vs-all and multiclass-multilabel classificationschemes.
Sentiment Category Test Count Train CountPositive 657 2177Negative 222 839Neutral 94 500Conflict 52 195
Table 4.11: Count of Samples.
than non-static representations, except for the neutral class. We believe this might
be due to the fact that the majority of the training samples belong to the positive or
negative class, which biases many of the neutral words towards one of the two classes.
As a result, the words that are still neutral after training are more likely to actu-
ally belong to the neutral class, leading to a better classification score than the one
obtained using static representations. When comparing results obtained in the one-
vs-all scheme to the ones obtained in the multi-class scheme, it is clear that one-vs-all
performed better than multi-class for the positive and negative classes, while multi-
class performed better than one-vs-all for the neutral and conflict classes. We believe
this behavior is justified by the fact that neutral and conflict are not very common
classes among the training set, and that the class-specific datasets for one-vs-all are
very unbalanced, resulting in low classification score in the one-vs-all scenario.
4.3 Visualization
In this section, we visualize the vector representations of words and illustrate the
effectiveness of vector representations at predicting aspect categories and sentiment
classes. Our model uses dense, high dimensional word representations, which can be
visualized in a 2-D plane using t-SNE (Van der Maaten and Hinton, 2008). t-SNE
68
is a variation of Stochastic Neighbor Embedding (Hinton and Roweis, 2002) that is
much easier to optimize, and reduces the clustering of the points around the center
of the map. It eventually results in producing better visualizations.
For each of the four aspect categories ambience, food, price, service and sentiment
classes positive, negative, we project the 20 words that are closest to the category
name by cosine distance into a 2-D plane using t-SNE. The words are represented
in the scatter plot in Figure 4-6 for ambience, Figure 4-7 for food, Figure 4-8 for
price, Figure 4-9 for service, Figure 4-10 for positive and Figure 4-11 for negative.
These vector representations are initially generated by training word2vec on the Yelp
dataset using the continuous skip-gram model. Below are the 20 closest words for
each aspect category and sentiment class. The words are ordered in ascending cosine
distance to the category name or sentiment class.
Aspect Category Detection:
∙ Ambience: {ambience, ambiance, atmosphere, decor, environment, vibe, set-
ting surroundings, interior, atomosphere, decor, cozy, classy, atmoshere atmosh-
pere, elegant, romantic, trendy, decoration, quaint}, shown in Plot 4-6.
∙ Food : {food, cuisine, service, restaurant, fare, authentic, meals, ambience am-
biance, sushi, consistently, meal, atmosphere, mediocre, dishes, resturant, qual-
ity, foods, portions, quantity}, shown in Plot 4-7.
∙ Price: {price, pricing, prices, cost, value, quality, rate, priced, expensive,
pricey, costs, quantity, pricy, overpriced, size, considering, premium, deal, cheaper,
bargain}, shown in Plot 4-8.
∙ Service: {service, waitstaff, staff, consistently, food, attentive, servers, effi-
cient, polite, courteous, ambience, prompt, ambiance, exceptionally waiters,
overall, friendly, exceptional, atmosphere, experience}, shown in Plot 4-9.
Aspect Category Sentiment Prediction:
∙ Positive: {positive, negative, favorable, based, pleasurable, bad, previous read-
ing, rave, pleasant, important, accurate, unpleasant, comments, read, concern-
69
ing, horrific, enthusiastic, negatively, supportive}, shown in Plot 4-10.
∙ Negative: {negative, positive, favorable, bad, read, rave, reason, complaint,
zero, agree, based, write, negatively, reading, harsh, comments, writing, star,
horrific, previous} , shown in Plot 4-11.
4.4 Summary
We presented a neural model based on Convolutional Neural Networks and MLP for
the tasks of Aspect Category Detection and Aspect Sentiment Prediction. The vector
representations of words in the user-generated reviews are initialized using word2vec
trained on the Yelp dataset. For each task, we explored the one-vs-all and multi-
class classification schemes, and the static and nonstatic training methods for word
representations. The experimental results showed that our model can perform better
than the baselines. We further demonstrated the impact of unbalanced train data
on the performance of the neural model for aspect category detection and sentiment
prediction.
70
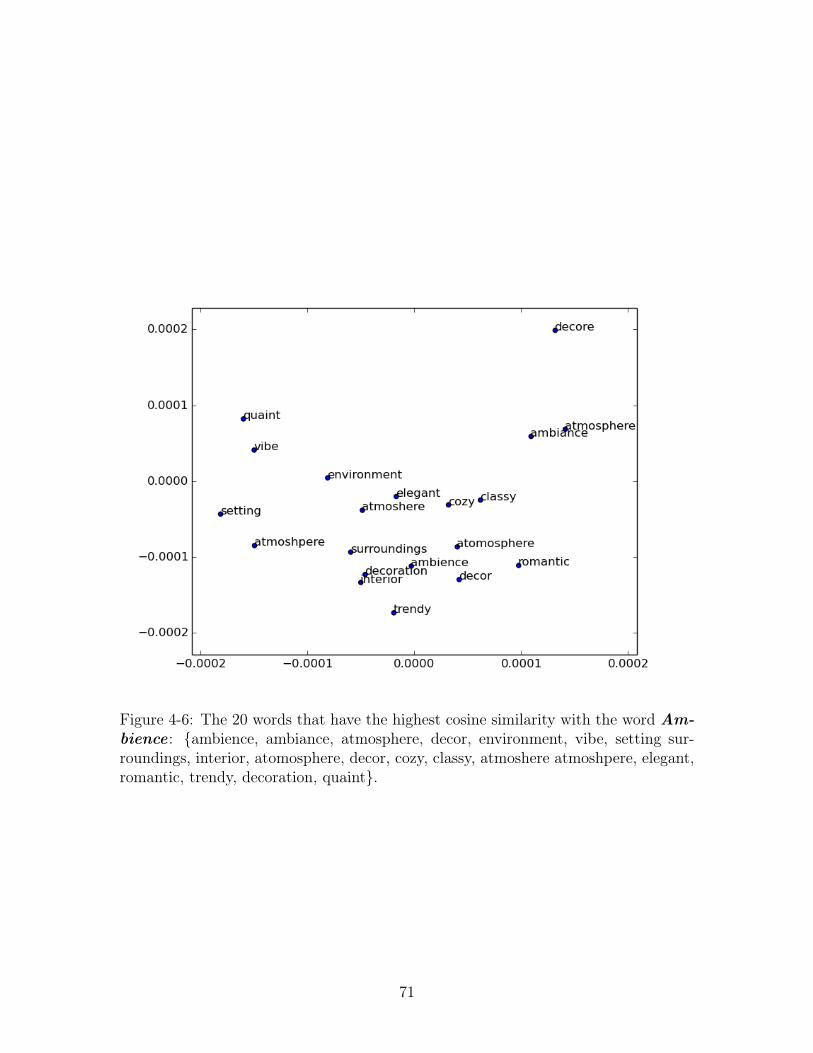
Figure 4-6: The 20 words that have the highest cosine similarity with the word Am-bience : {ambience, ambiance, atmosphere, decor, environment, vibe, setting sur-roundings, interior, atomosphere, decor, cozy, classy, atmoshere atmoshpere, elegant,romantic, trendy, decoration, quaint}.
71
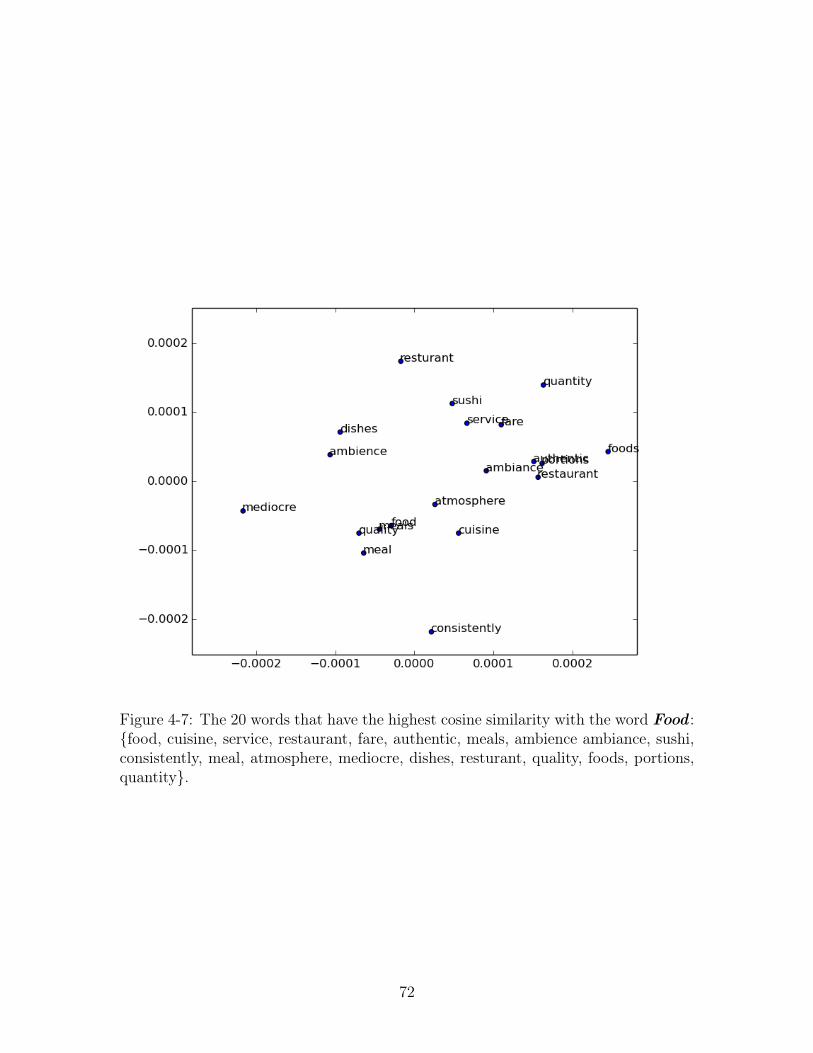
Figure 4-7: The 20 words that have the highest cosine similarity with the word Food :{food, cuisine, service, restaurant, fare, authentic, meals, ambience ambiance, sushi,consistently, meal, atmosphere, mediocre, dishes, resturant, quality, foods, portions,quantity}.
72
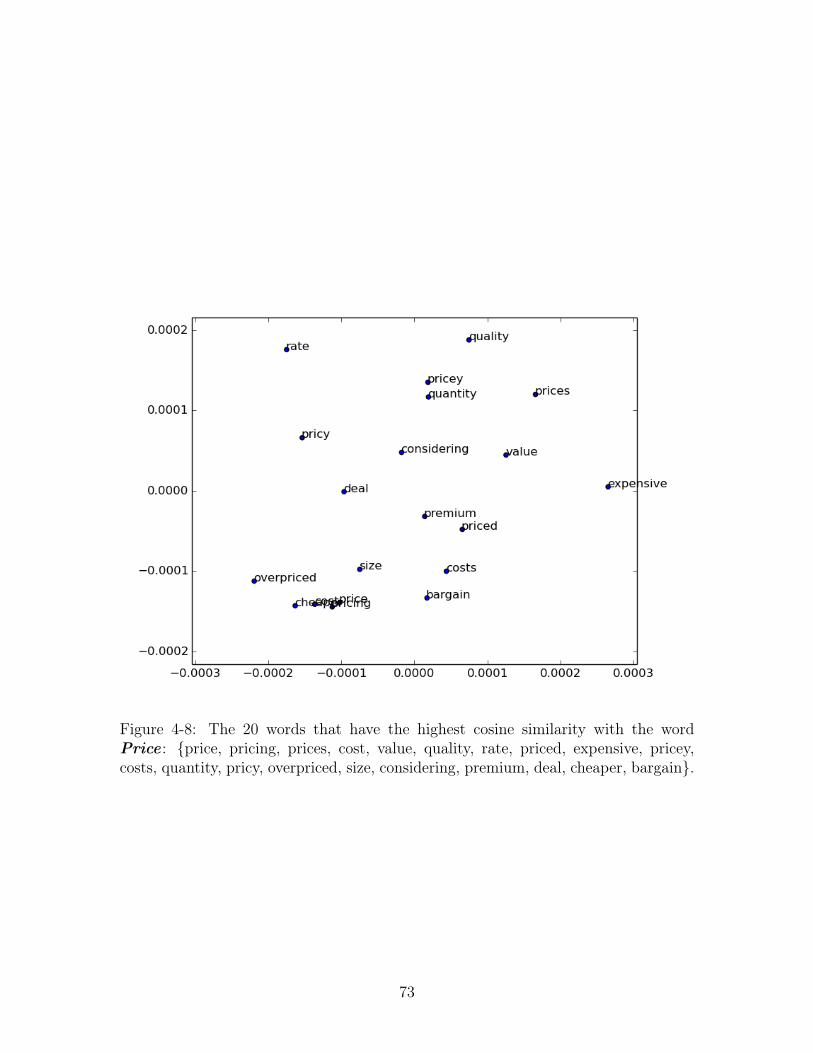
Figure 4-8: The 20 words that have the highest cosine similarity with the wordPrice : {price, pricing, prices, cost, value, quality, rate, priced, expensive, pricey,costs, quantity, pricy, overpriced, size, considering, premium, deal, cheaper, bargain}.
73
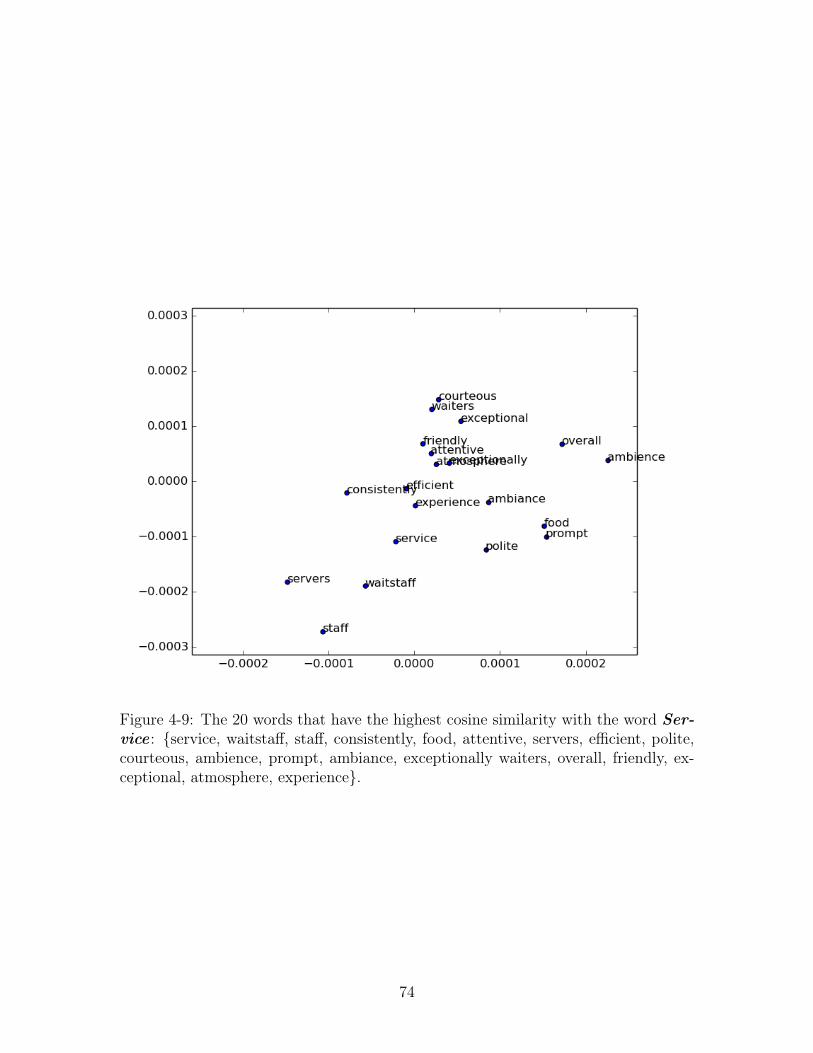
Figure 4-9: The 20 words that have the highest cosine similarity with the word Ser-vice : {service, waitstaff, staff, consistently, food, attentive, servers, efficient, polite,courteous, ambience, prompt, ambiance, exceptionally waiters, overall, friendly, ex-ceptional, atmosphere, experience}.
74
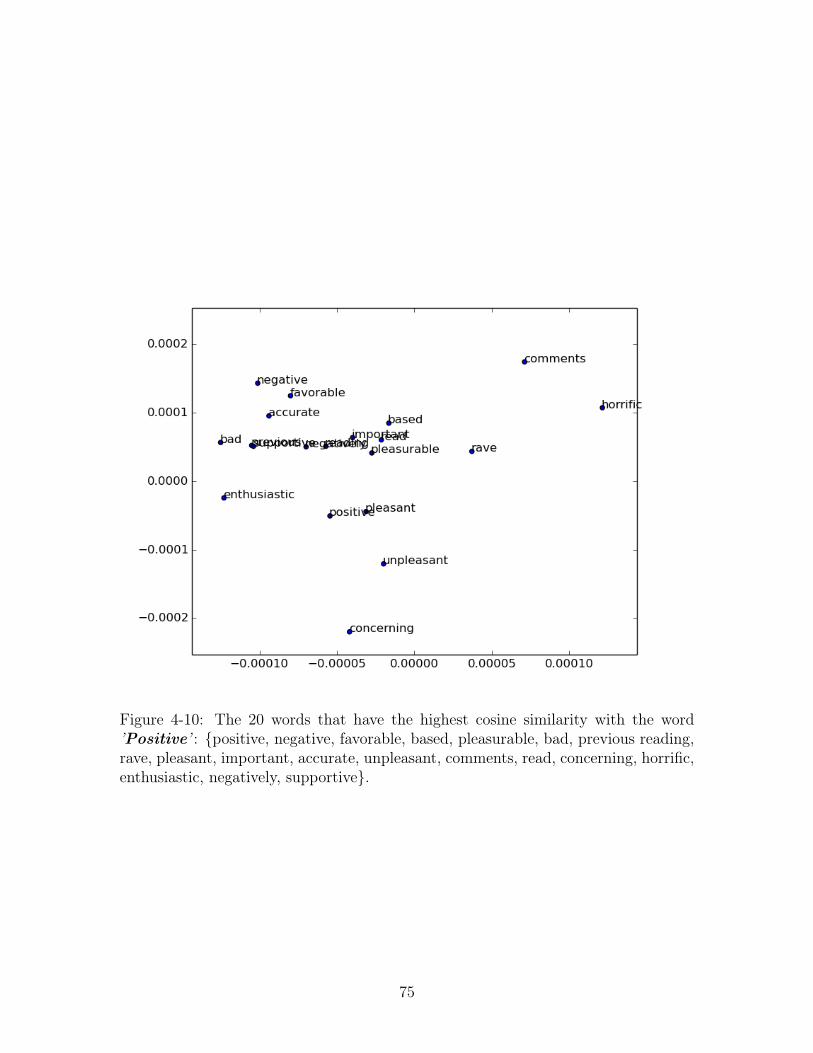
Figure 4-10: The 20 words that have the highest cosine similarity with the word’Positive’ : {positive, negative, favorable, based, pleasurable, bad, previous reading,rave, pleasant, important, accurate, unpleasant, comments, read, concerning, horrific,enthusiastic, negatively, supportive}.
75

Figure 4-11: The 20 words that have the highest cosine similarity with the word ’Neg-ative’ : {negative, positive, favorable, bad, read, rave, reason, complaint, zero, agree,based, write, negatively, reading, harsh, comments, writing, star, horrific, previous}.
76
Chapter 5
Community Question Answering
Community Question Answering forums (cQA), such as Quora and Stack Overflow
contain millions of questions and answers. Automatically finding the relevant ques-
tions from the existing questions and finding the relevant answers to a new question
are Natural Language Processing tasks. In this chapter, we aim to address these
tasks, which we refer to as similar-Question Retrieval and Answer Selection. We
summarize these two problems as follows:
∙ Question Retrieval: Given a new question and a list of questions, we automati-
cally rank the questions in the list according to their relevancy or similarity to
the new question.
∙ Answer Selection: Given a cQA thread containing a question and a list of
answers, we automatically rank the answers according to their relevance to the
question.
In this chapter, we present a neural-based model with stacked bidirectional LSTMs
and MLP, which we explain in Section 5.1, to address these tasks. The model gen-
erates the vector representations of the question-question or question-answer pairs
and computes their semantic similarity scores and then uses these score to rank and
predict relevancies. As shown in Section 5.2, extensive experiments demonstrate our
results outperform the baselines. In section 5.3, we visualize the semantic similari-
77
ties between the questions and answers using the cosine similarities between different
word vectors computed by the first and second bidirectional LSTM in our model.
5.1 Method
In Chapter 2, we explained recurrent neural networks (RNNs), Long Short-Term
Memory (LSTM) networks and their bidirectional networks. In this chapter, we
extend these neural networks for cQA and develop a neural model using stacked
bidirectional LSTMs and MLPs to capture the semantic similarities between questions
and answers in cQA.
5.1.1 Stacked Bidirectional LSTMs for cQA
Given a question, we aim to rank a list of questions, for the question retrieval task,
and a list of answers to the question, for the answer selection task. To address these
ranking problems, we propose a neural model that computes a semantic similarity
score for each question-question (𝑞, 𝑞′) or question-answer (𝑞, 𝑎) pair. These similarity
scores are then employed to rank the list of questions and answers in order of relevance
to the given question 𝑞. Figure 5-1 shows the general architecture of our model. We
explain our model by referring to the pair (𝑞, 𝑎), but the same description applies to
the pair (𝑞, 𝑞′). The question 𝑞 and answer 𝑎 contain the following lists of words:
𝑞 = {𝑤𝑞1, 𝑤
𝑞2, 𝑤
𝑞3, ..., 𝑤
𝑞𝑘}
𝑎 = {𝑤𝑎1 , 𝑤
𝑎2 , 𝑤
𝑎3 , ..., 𝑤
𝑎𝑚}
where 𝑤𝑞𝑖 and 𝑤𝑎
𝑖 are the 𝑖𝑡ℎ words in the question 𝑞 and answer 𝑎 ,respectively.
First, the question 𝑞 and answer 𝑎 are truncated to a similar length1, and two lists
of vectors representing the words in the question 𝑞 and the words in the answer 𝑎 are
1The length of each question or answer is set to 100 words. The questions and answers with lessthan 100 words are padded with zeros, and those with more than 100 words are clipped.
78
generated and randomly initialized:
𝑉𝑞 = {𝑋1, 𝑋2, 𝑋3, ..., 𝑋𝑛/2}
𝑉𝑎 = {𝑋𝑛/2+1, 𝑋𝑛/2+2, 𝑋𝑛/2+3, ..., 𝑋𝑛}
where 𝑋𝑖 with 𝑖 ∈ [1, 𝑛/2] is the vector of the word 𝑤𝑞𝑖 in the question 𝑞, 𝑋𝑖 with
𝑖 ∈ [𝑛/2 + 1, 𝑛] is the vector of 𝑤𝑎𝑖−𝑛/2 for the answer 𝑎2.
The vector representations of the words in the question 𝑞 (i.e., 𝑉𝑞) are sequentially
passed to the model as shown in Figure 5-1. The model computes the representation
of the question 𝑞 after reading the last word vector of the question. Then the 𝑞
representation along with the word vectors of the answer 𝑎 (i.e., 𝑉𝑎) are passed to
the next stage of the model. The model then uses the representation of 𝑞 to generate
the representation of the given pair (𝑞, 𝑎), after processing the last word vector of the
answer 𝑎. This information processing is performed at the forward layer of the first
bidirectional LSTM shown in the figure (left to right). Similar processing occurs in
the reverse direction (right to left), starting from the answer 𝑎 and moving to the
question 𝑞 in the (𝑞, 𝑎) pair. The output vectors of the hidden layers for these two
directions of the first bidirectional LSTM are then concatenated and inputted to the
second bidirectional LSTM as shown in the Figure 5-1. Steps similar to the ones
described above occur at the second LSTM.
While the second bidirectional LSTM processes the input vectors similarly to the
first one, its output vectors from two directions are summed3. Finally, the resulting
vectors produced by the second LSTM are augmented with the extra features and
passed to the MLP with two hidden layers to compute the semantic similarity score
of the (𝑞, 𝑎) pair.
2𝑛 equals to 2003Using summation instead of concatenation is selected based on the experimental results obtained
on the development set.
79
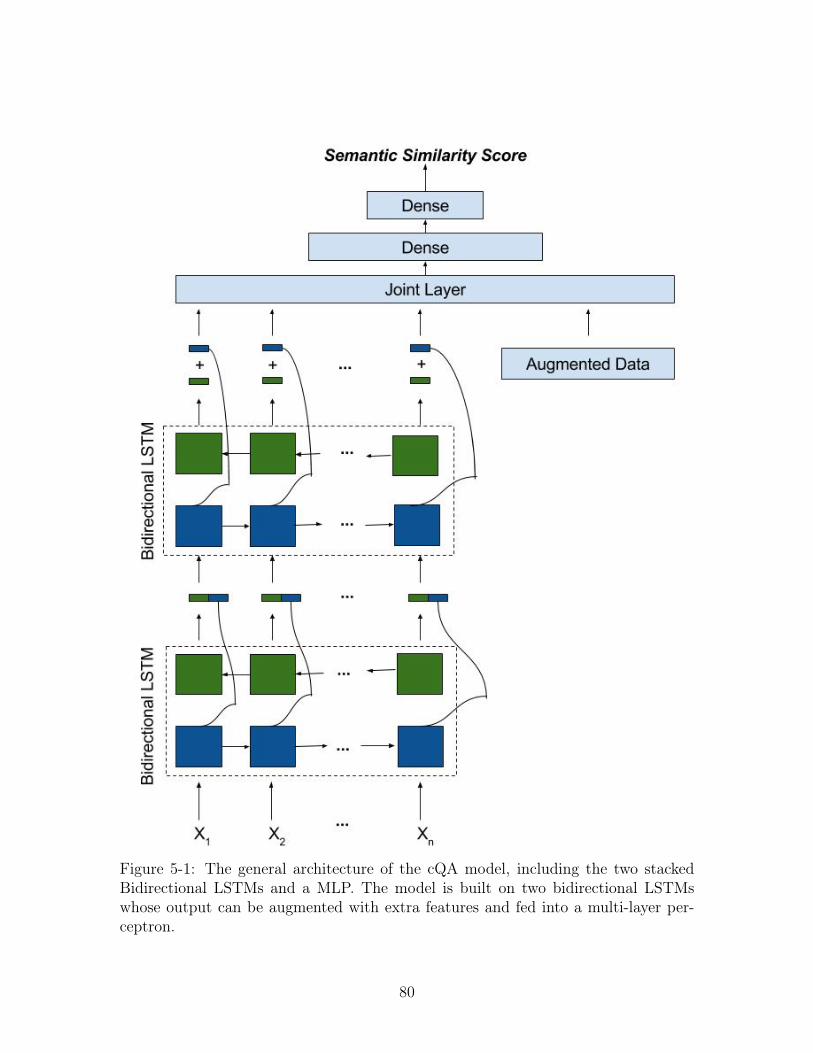
Figure 5-1: The general architecture of the cQA model, including the two stackedBidirectional LSTMs and a MLP. The model is built on two bidirectional LSTMswhose output can be augmented with extra features and fed into a multi-layer per-ceptron.
80
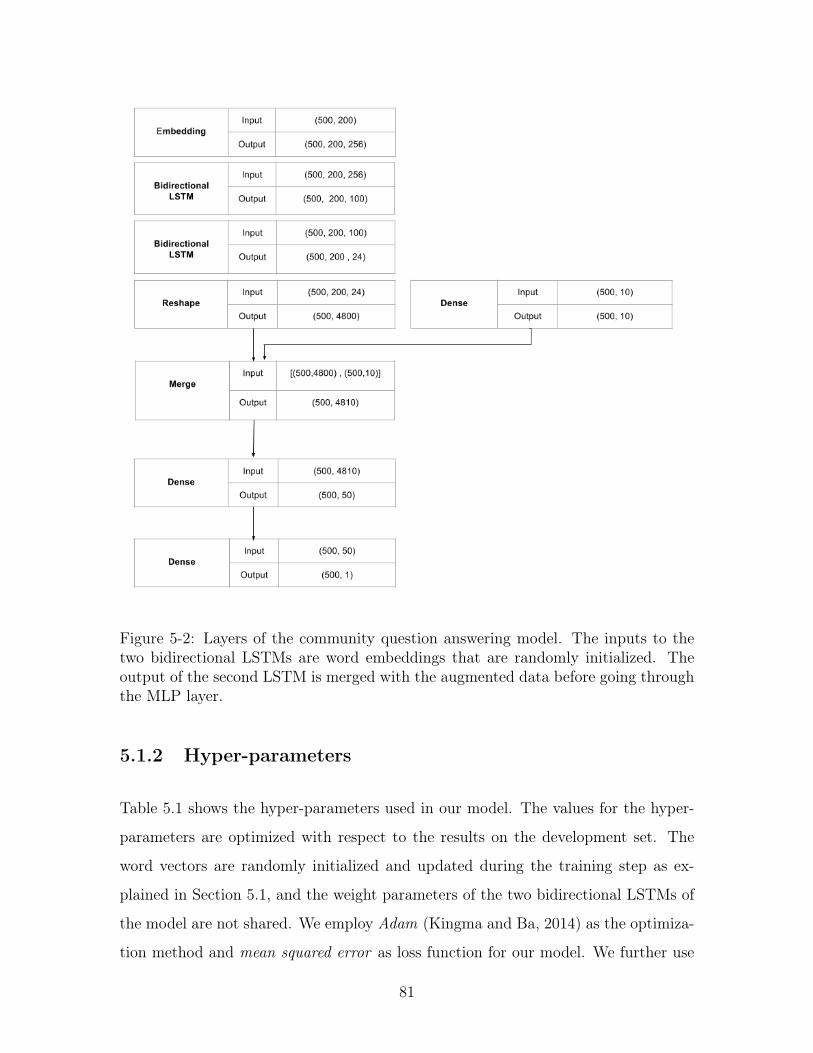
Figure 5-2: Layers of the community question answering model. The inputs to thetwo bidirectional LSTMs are word embeddings that are randomly initialized. Theoutput of the second LSTM is merged with the augmented data before going throughthe MLP layer.
5.1.2 Hyper-parameters
Table 5.1 shows the hyper-parameters used in our model. The values for the hyper-
parameters are optimized with respect to the results on the development set. The
word vectors are randomly initialized and updated during the training step as ex-
plained in Section 5.1, and the weight parameters of the two bidirectional LSTMs of
the model are not shared. We employ Adam (Kingma and Ba, 2014) as the optimiza-
tion method and mean squared error as loss function for our model. We further use
81

Embedding initialized, updatedWeights for Two LSTMs not sharedOptimizer AdamLearning rate 0.001Dropout rate 0.5Batch Size 16
Table 5.1: The hyper-parameters of the stacked bidirectional LSTM model.
Category Train Dev TestNew Coming Questions 267 50 70Related Questions 2,669 500 700– Perfect-Match 235 59 81– Relevant 848 155 152– Irrelevant 1,586 286 467Related Answers 17,900 2,440 7,000– Good 6651 818 2,767– Bad 8,139 1,209 3,090– Potentially-Useful 3,110 413 1,143
Table 5.2: The statistics for the cQA train, dev and test data (Nakov et al., 2016)that we employ to evaluate our neural model.
the values 0.001, 0.5 and 16 for learning rate, dropout rate and batch size respectively.
Figure 5-2 indicates the size of the inputs and outputs for each layer in the network.
5.2 Evaluation and Results
5.2.1 Dataset
We evaluate our model on the cQA data (Nakov et al., 2016) in which the questions
and answers have been manually labeled by a community of annotators in a crowd-
sourcing platform. Table 5.2 shows some statistics of the train, development and
test data. For the question retrieval task, questions are labeled as Perfect-Match,
Relevant and Irrelevant. Given a specific question, the Irrelevant questions should
be ranked lower than the other Perfect-Match or Relevant questions. For the answer
selection task, answers are labeled as Good, Bad and Potentially-Useful with respect
to a question. Both Good and Potentially-Useful answers have useful information
that is relevant to the question, and should be ranked higher than Bad answers.
82
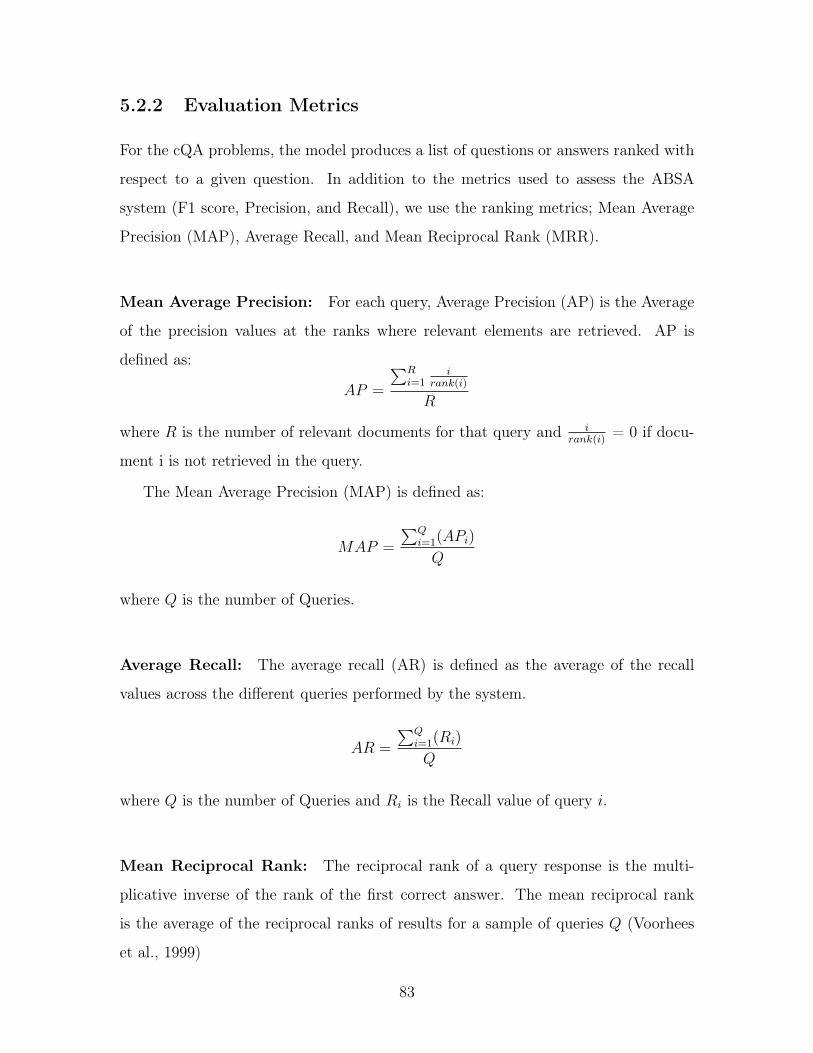
5.2.2 Evaluation Metrics
For the cQA problems, the model produces a list of questions or answers ranked with
respect to a given question. In addition to the metrics used to assess the ABSA
system (F1 score, Precision, and Recall), we use the ranking metrics; Mean Average
Precision (MAP), Average Recall, and Mean Reciprocal Rank (MRR).
Mean Average Precision: For each query, Average Precision (AP) is the Average
of the precision values at the ranks where relevant elements are retrieved. AP is
defined as:
𝐴𝑃 =
∑𝑅𝑖=1
𝑖𝑟𝑎𝑛𝑘(𝑖)
𝑅
where 𝑅 is the number of relevant documents for that query and 𝑖𝑟𝑎𝑛𝑘(𝑖)
= 0 if docu-
ment i is not retrieved in the query.
The Mean Average Precision (MAP) is defined as:
𝑀𝐴𝑃 =
∑𝑄𝑖=1(𝐴𝑃𝑖)
𝑄
where 𝑄 is the number of Queries.
Average Recall: The average recall (AR) is defined as the average of the recall
values across the different queries performed by the system.
𝐴𝑅 =
∑𝑄𝑖=1(𝑅𝑖)
𝑄
where 𝑄 is the number of Queries and 𝑅𝑖 is the Recall value of query 𝑖.
Mean Reciprocal Rank: The reciprocal rank of a query response is the multi-
plicative inverse of the rank of the first correct answer. The mean reciprocal rank
is the average of the reciprocal ranks of results for a sample of queries 𝑄 (Voorhees
et al., 1999)
83
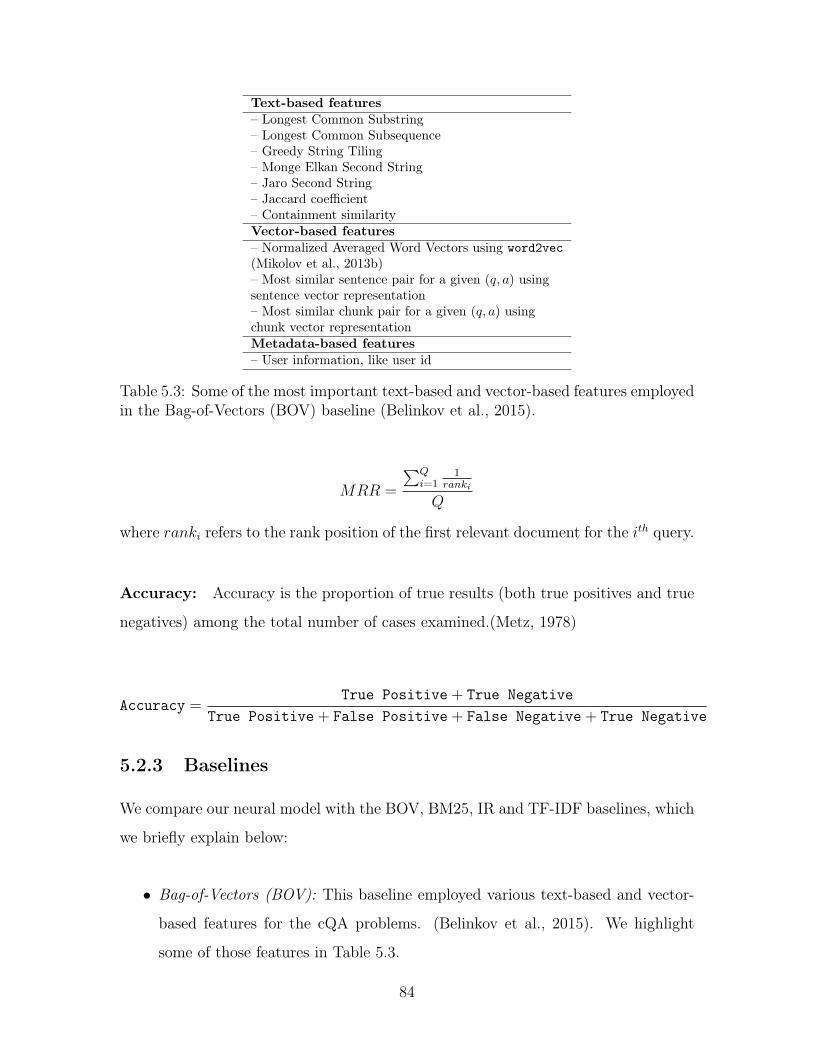
Text-based features– Longest Common Substring– Longest Common Subsequence– Greedy String Tiling– Monge Elkan Second String– Jaro Second String– Jaccard coefficient– Containment similarityVector-based features– Normalized Averaged Word Vectors using word2vec(Mikolov et al., 2013b)– Most similar sentence pair for a given (𝑞, 𝑎) usingsentence vector representation– Most similar chunk pair for a given (𝑞, 𝑎) usingchunk vector representationMetadata-based features– User information, like user id
Table 5.3: Some of the most important text-based and vector-based features employedin the Bag-of-Vectors (BOV) baseline (Belinkov et al., 2015).
𝑀𝑅𝑅 =
∑𝑄𝑖=1
1𝑟𝑎𝑛𝑘𝑖
𝑄
where 𝑟𝑎𝑛𝑘𝑖 refers to the rank position of the first relevant document for the 𝑖𝑡ℎ query.
Accuracy: Accuracy is the proportion of true results (both true positives and true
negatives) among the total number of cases examined.(Metz, 1978)
Accuracy =True Positive+ True Negative
True Positive+ False Positive+ False Negative+ True Negative
5.2.3 Baselines
We compare our neural model with the BOV, BM25, IR and TF-IDF baselines, which
we briefly explain below:
∙ Bag-of-Vectors (BOV): This baseline employed various text-based and vector-
based features for the cQA problems. (Belinkov et al., 2015). We highlight
some of those features in Table 5.3.
84
∙ BM25: We use the BM25 similarity measure trained on the cQA raw data
provided by (Màrquez et al., 2015).
∙ IR: In the context of question retrieval, this is the order of the related questions
provided by the search engine. In the context of answer selection, this is the
chronological ranking of answers based on their time of posting.
∙ TF-IDF: This is computed using the cQA raw data provided by Màrquez et al.
(2015). The ranking is defined by the cosine similarity of the TF-IDF vectors
for the questions and answers.
5.2.4 Overall Performance on Question Retrieval Task
In the question retrieval experiments, we restrict the vocab to words that occur at
least 40 times across the entire training sample, and choose the model with the lowest
validation error over 10 epochs. For each question, we append the subject title of the
thread to the beginning of the question, before supplying it to the model.
The results of the question retrieval task on development and test data are shown
in Tables 5.4 and 5.5. In these tables, the first four rows show the baseline results,
and the following rows show the results obtained using the neural models described in
Section 5.1.1. In this task, we employ the IR rank, the order of the related questions
provided by the search engine as explained in Section 5.2.1, as augmented features
𝐹𝑎𝑢𝑔. As shown in the tables, the neural models using 𝐹𝑎𝑢𝑔 outperform the models
without 𝐹𝑎𝑢𝑔 for both development and test data. For the development set shown
in Table 5.4, the “Double BLSTM ” model achieves the highest performance over the
evaluation metrics. For the test set shown in Table 5.5, the result of the “Single
BLSTM ” model is comparable with the IR and TF-IDF baselines, while the highest
F1 is obtained using BOV baseline. There are several points to highlight regarding
the performance of the neural models in comparison to the baselines: First, the size
of the data for this task is small, which makes it harder to train our neural models.
Second, the baselines have access to external resources; for example IR had access to
the click log of the users and TF-IDF is trained on a large cQA raw dataset (Màrquez
85

Method DevMAP AveRec MRR F1 R P
BOV 64.60 80.83 71.42 59.55 49.53 74.65BM25 61.31 79.42 69.27 - - -IR 71.35 86.11 76.67 - - -TF-IDF 63.40 81.74 70.43 - - -Single LSTM - 𝐹𝑎𝑢𝑔 54.49 73.39 62.00 - - -Single BLSTM - 𝐹𝑎𝑢𝑔 57.00 74.54 62.85 51.64 51.40 51.89Single BLSTM 67.40 83.14 75.87 44.94 37.38 56.34Double BLSTMs 70.75 86.2 76.83 62.83 66.36 59.66
Table 5.4: Results on development data for the question retrieval task in cQA.
Method TestMAP AveRec MRR F1 R P
BOV 66.27 82.40 77.96 56.81 51.93 62.69BM25 67.27 83.41 79.12 - - -IR 74.75 88.30 83.79 - - -TF-IDF 73.95 87.50 84.55 - - -Single LSTM - 𝐹𝑎𝑢𝑔 45.24 67.12 52.07 - - -Single BLSTM - 𝐹𝑎𝑢𝑔 48.00 70.39 54.18 40.88 48.07 35.56Single BLSTM 73.20 86.99 83.38 48.15 44.64 52.26Double BLSTMs 71.98 85.86 81.16 51.27 64.81 42.42
Table 5.5: Results on test data for the question retrieval task in cQA.
et al., 2015). Finally, the number of out-of-vocabulary (OOV) words in the test
data is higher than the development data, and the OOV word vectors are randomly
initialized and do not get updated during the training phase. This results in a smaller
improvement on the test data.
5.2.5 Overall Performance on Answer Selection Task
In the answer selection experiments, we also restrict the vocab to words that occur
at least 40 times across the entire training sample, and choose the model with the
lowest validation error over 10 epochs. For each question, we append the subject title
of the thread to the beginning of the question, before supplying it to the model.
The results of the answer selection task on development and test data are shown
in Tables 5.6 and 5.7. In the tables, the first four rows show the baseline results,
and the following rows show the neural models results. The “Single LSTM - 𝐹𝑎𝑢𝑔”
row shows the results when only one LSTM is used in our model instead of two
bidirectional LSTMs, and no augmented features 𝐹𝑎𝑢𝑔 are used. The “Single BLSTM
86
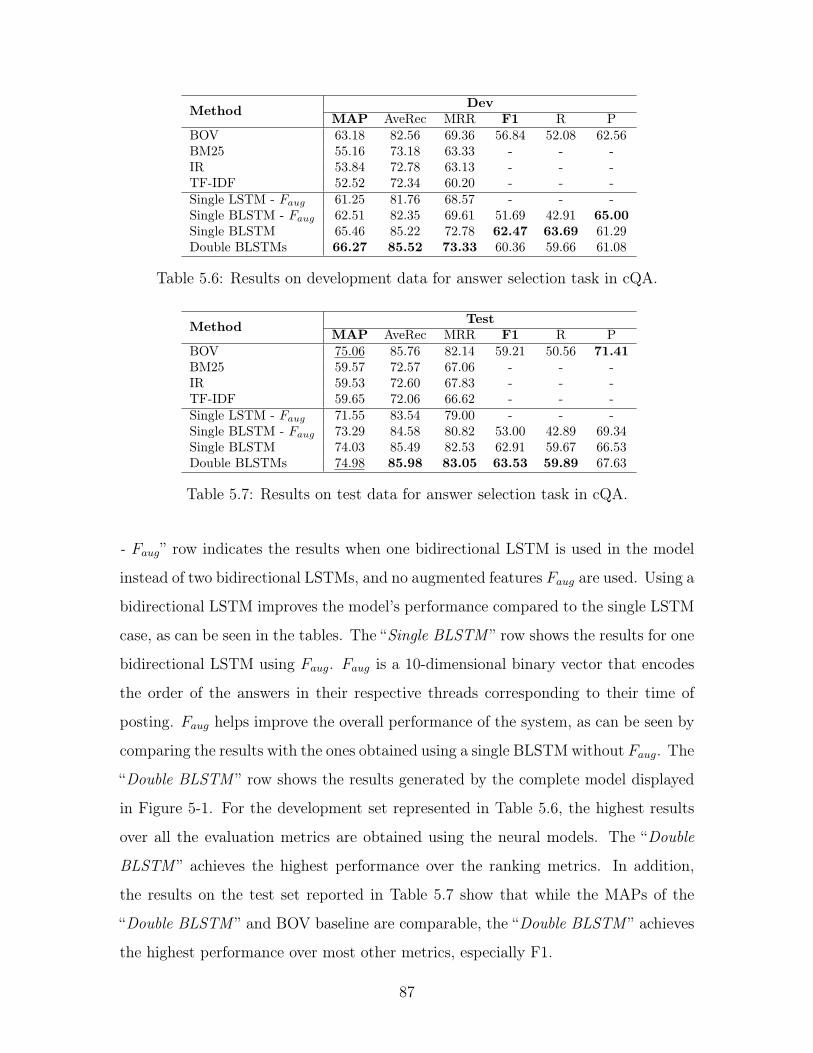
Method DevMAP AveRec MRR F1 R P
BOV 63.18 82.56 69.36 56.84 52.08 62.56BM25 55.16 73.18 63.33 - - -IR 53.84 72.78 63.13 - - -TF-IDF 52.52 72.34 60.20 - - -Single LSTM - 𝐹𝑎𝑢𝑔 61.25 81.76 68.57 - - -Single BLSTM - 𝐹𝑎𝑢𝑔 62.51 82.35 69.61 51.69 42.91 65.00Single BLSTM 65.46 85.22 72.78 62.47 63.69 61.29Double BLSTMs 66.27 85.52 73.33 60.36 59.66 61.08
Table 5.6: Results on development data for answer selection task in cQA.
Method TestMAP AveRec MRR F1 R P
BOV 75.06 85.76 82.14 59.21 50.56 71.41BM25 59.57 72.57 67.06 - - -IR 59.53 72.60 67.83 - - -TF-IDF 59.65 72.06 66.62 - - -Single LSTM - 𝐹𝑎𝑢𝑔 71.55 83.54 79.00 - - -Single BLSTM - 𝐹𝑎𝑢𝑔 73.29 84.58 80.82 53.00 42.89 69.34Single BLSTM 74.03 85.49 82.53 62.91 59.67 66.53Double BLSTMs 74.98 85.98 83.05 63.53 59.89 67.63
Table 5.7: Results on test data for answer selection task in cQA.
- 𝐹𝑎𝑢𝑔” row indicates the results when one bidirectional LSTM is used in the model
instead of two bidirectional LSTMs, and no augmented features 𝐹𝑎𝑢𝑔 are used. Using a
bidirectional LSTM improves the model’s performance compared to the single LSTM
case, as can be seen in the tables. The “Single BLSTM ” row shows the results for one
bidirectional LSTM using 𝐹𝑎𝑢𝑔. 𝐹𝑎𝑢𝑔 is a 10-dimensional binary vector that encodes
the order of the answers in their respective threads corresponding to their time of
posting. 𝐹𝑎𝑢𝑔 helps improve the overall performance of the system, as can be seen by
comparing the results with the ones obtained using a single BLSTM without 𝐹𝑎𝑢𝑔. The
“Double BLSTM ” row shows the results generated by the complete model displayed
in Figure 5-1. For the development set represented in Table 5.6, the highest results
over all the evaluation metrics are obtained using the neural models. The “Double
BLSTM ” achieves the highest performance over the ranking metrics. In addition,
the results on the test set reported in Table 5.7 show that while the MAPs of the
“Double BLSTM ” and BOV baseline are comparable, the “Double BLSTM ” achieves
the highest performance over most other metrics, especially F1.
87

5.3 Model Visualization
In order to gain better intuition of the neural model illustrated in Figure 5-1, we rep-
resent the outputs of the hidden layers of each bidirectional LSTM. The represented
outputs correspond to the cosine similarities between vector representations of words
in question-question pairs or question-answer pairs. Figure 5-3 shows the heatmaps
for the first (top) and second (bottom) bidirectional LSTM for the question retrieval
task with the following two questions:
∙ 𝑞1: Which is the best Pakistani school for children in Qatar ? Which is the best
Pakistani school for children in Qatar ?
∙ 𝑞2: Which Indian school is better for the kids ? I wish to admit my kid to one
of the Indian schools in Qatar Which is better DPS or Santhinekethan ? please
post your comments.
The areas of high similarity are highlighted in the red squares in Figure 5-3.
While both bidirectional LSTMs correctly predict that the questions are similar, the
heatmaps show that the second bidirectional LSTM performs better than the first one,
and that the areas of similarities (delimited by the red rectangles) are much better
defined in the output of the second bidirectional LSTM than they were in the output
of the first bidirectional LSTM. For example, the first bidirectional LSTM identifies
similarities between the part “for children in qatar ? Which is the” from the question
𝑞1 and the parts “is better for the kids ? ” and “is better DPS or Santhinekethan
? please post” from the question 𝑞2. The second bidirectional LSTM accurately
updates those parts from the question 𝑞2 to “for the kids ? I wish to admit my” and
“Qatar which is better DPS or Santhinekethan”, respectively. This difference shows
that the second bidirectional LSTM assigns smaller values to the non-important words
(e.g., “please post”), while emphasizing more important ones, such as “admit”.
Figure 5-4 shows the heatmaps of the outputs of the first bidirectional LSTM
(top) and the second bidirectional LSTM (bottom) in another example drawn from
the question retrieval task with the following two questions:
88

∙ 𝑞1: New car price guide. Can anyone tell me prices of new German cars in
Qatar and deals available ?
∙ 𝑞2: Reliable and honest garages in Doha. Can anyone recommend a reliable
garage that is also low priced ? I have been around the industrial area but it
is hard to know who is reliable and who is not. The best way is if I hear from
the experience of the qatarliving members . I am looking to do some work on
my land cruiser.
As shown in Figure 5-4, the dark blue areas are much larger in the first bidi-
rectional than in the second bidirectional LSTM. These results show that the first
bidirectional LSTM incorrectly predicts that the questions 𝑞1 and 𝑞2 are similar, while
the second bidirectional LSTM correctly predicts that the questions are dissimilar.
More examples of question-question pairs, and question-answer pairs are available
in the appendix A.
5.4 Summary
We presented a neural-based model with stacked bidirectional LSTMs to generate the
vector representations of questions and answers, and predict their semantic similari-
ties. These similarity scores are then employed to rank questions in a list of questions
for the question retrieval task, and answers to a given question in a list of answers
for the answer selection task. The experimental results show that our model can out-
perform the baselines, even though baselines use various text-based and vector-based
features and have access to external resources. We also demonstrate the impact of the
Out-Of-Vocabulary (OOV) words, and the size of the train data on the performance
of the neural model.
89
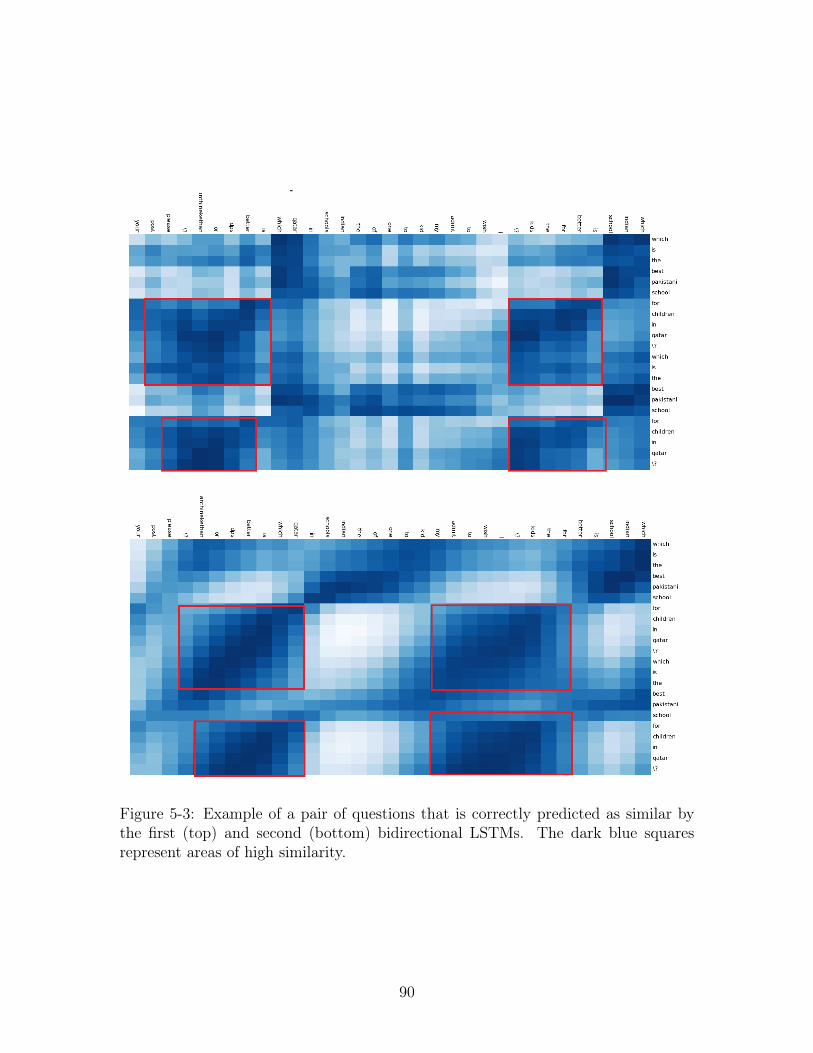
Figure 5-3: Example of a pair of questions that is correctly predicted as similar bythe first (top) and second (bottom) bidirectional LSTMs. The dark blue squaresrepresent areas of high similarity.
90
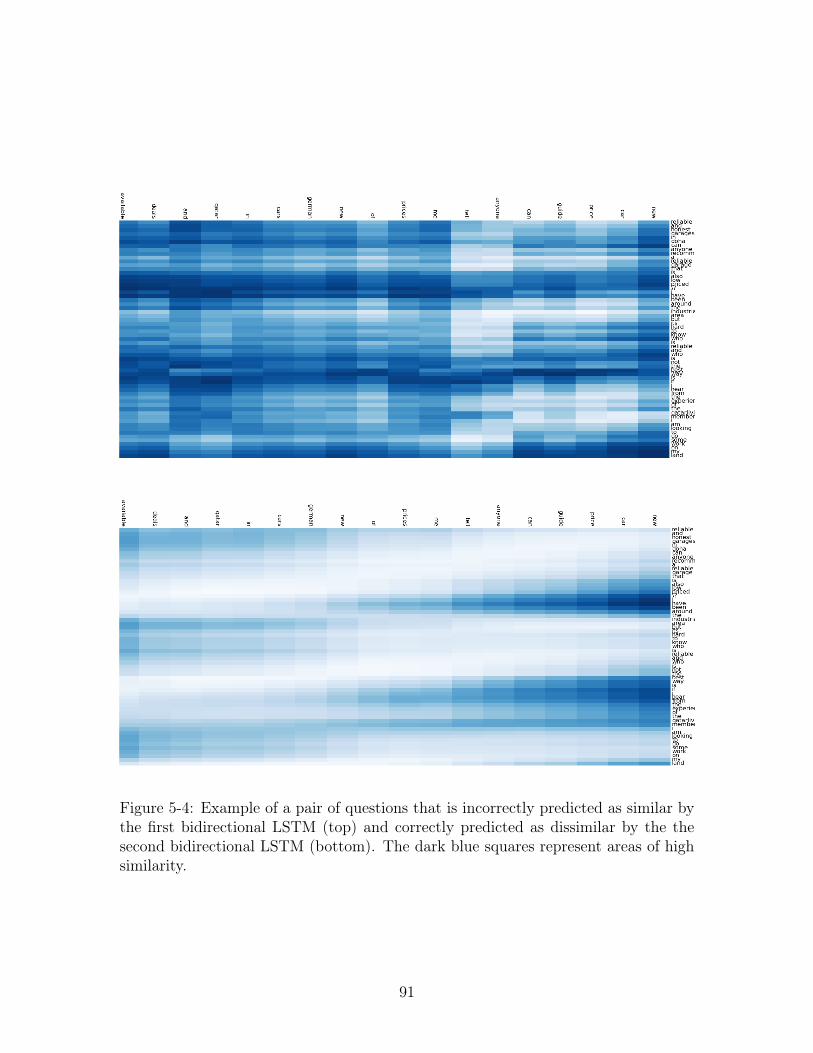
Figure 5-4: Example of a pair of questions that is incorrectly predicted as similar bythe first bidirectional LSTM (top) and correctly predicted as dissimilar by the thesecond bidirectional LSTM (bottom). The dark blue squares represent areas of highsimilarity.
91

92
Chapter 6
Conclusion
In this thesis, we presented neural-based models for semantic and sentiment under-
standing of user-generated content. We have examined online review platforms in
the context of Aspect-based Sentiment Analysis, with the goal of capturing the aspect
categories and the sentiment of each category, and discussion forums in the context
of Community Question Answering with the goal of capturing semantic similarities
between questions and answers and retrieving the similar questions and relevant an-
swers for a given question. In the future, we plan to combine the presented models
for semantic and sentiment prediction into an integrated model.
6.1 Contributions
The methods presented in this thesis are centered around semantic and sentiment
understanding in the context of two major NLP research problems: Aspect-Based
Sentiment analysis and Community Question Answering. The primary contributions
are as follows.
6.1.1 Aspect-Based Sentiment analysis
In Chapter 4, we presented neural-based models with Convolutional Neural Networks
(CNN) to address two ABSA tasks: Aspect Category Detection, and Aspect Category
93
Sentiment Prediction. The models use the word vector representations of a given
sentence computed from word2vec to generate feature maps through a set of a dif-
ferent convolutions. Th multilayer perceptron then uses the feature maps to predict
the aspect category or sentiment labels expressed in the sentence. Furthermore, we
explored both one-vs-all and multiclass-multilabel classification schemes to accom-
plish the desired tasks. Our evaluation of the model’s performance on the restaurant
reviews dataset demonstrated that the results for aspect category detection and cat-
egory sentiment prediction outperform the baselines.
6.1.2 Community Question Answering
In Chapter 5, we presented neural-based models with stacked bidirectional LSTMs
and MLP to address the Similar-Question Retrieval and Answer Selection tasks.
The model generates the vector representations of the questions and answers, and
computes their semantic similarity scores which are then employed to rank and predict
relevancies. We explored different architectures for the models ranging from a single
bidirectional LSTM layer to a double bidirectional LSTM layer to accomplish the
desired tasks. We demonstrated that our model performs more accurately than the
baselines if enough training data is available. Our work for cQA is submitted to the
ACL Workshop on Representation Learning for NLP (Nassif et al., 2016).
6.2 Directions for Future Research
There are many interesting directions we could take to improve and refine the devel-
oped models. Here, we describe a few possible extensions of our work on aspect-based
sentiment analysis and community question answering.
6.2.1 Aspect-Based Sentiment analysis
In the future, we plan on applying our current experimental setup on the other ABSA
sub-tasks, such as aspect term extraction and aspect sentiment prediction. We would
94
additionally like to explore ways to integrate both models for aspect category detec-
tion and aspect sentiment prediction into a single joint model which extracts both
semantic and sentiment information from a given user-generated input. It would also
be interesting to assess the performance of a neural model based on recurrent neural
networks, such as Long short-Term Memory Networks (LSTMs), rather than CNNs.
6.2.2 Community Question Answering
In the future, we plan on extending our current setup to retrieve the relevant answers
from existing cQA threads, and rank them with respect to a new coming question.
We would like to explore an integrated model built on the combination of our de-
veloped models for question retrieval and answer selection. Moreover, we would like
to investigate the combination of several neural models, such as LSTM and CNN,
to better learn joint representations of question-question pairs and question-answer
pairs in cQA.
95

96
Appendix A
Visualizations of Community
Question-Answering System
A.1 Examples
In this appendix are more examples that illustrate the performance of our cQA neural
model. This model is designed to capture the semantic similarities between questions
for question retrieval task and the semantic similarities between questions and answers
for the answer selection task.
A.1.1 Example 1
The two questions represented in Figure A-1 are:
∙ 𝑞1: Buying car without driving license. Hi folks is it possible to buy a car and
register it in my name without having a driving license ?
∙ 𝑞2: Buying a car. Hi I’m planning to buy a car, which is better Honda civic or
Hyundai Santa Fe both 2011 model ? just new here in Qatar could you please
give some feedback reviews.
The algorithm initially identifies similarities between “Buying a car without driving
license” from 𝑞1 and “Buying a car. Hi I’m planning” from 𝑞2, as well as between “is it
97
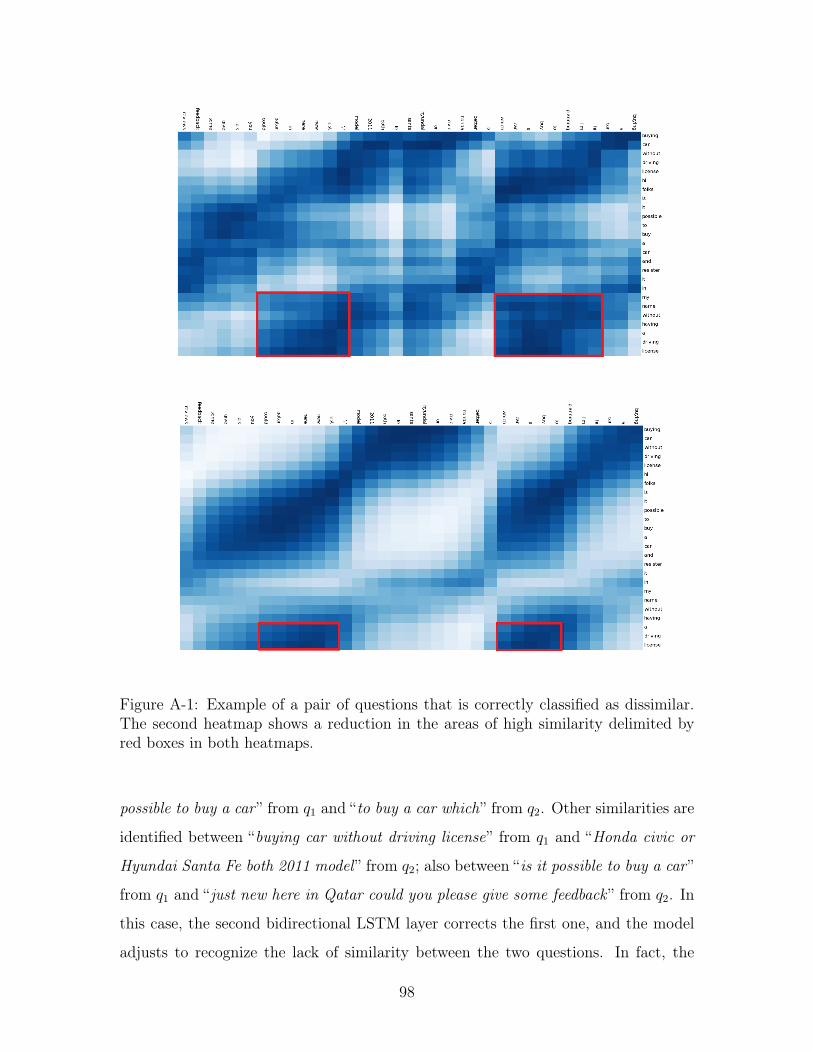
Figure A-1: Example of a pair of questions that is correctly classified as dissimilar.The second heatmap shows a reduction in the areas of high similarity delimited byred boxes in both heatmaps.
possible to buy a car ” from 𝑞1 and “to buy a car which” from 𝑞2. Other similarities are
identified between “buying car without driving license” from 𝑞1 and “Honda civic or
Hyundai Santa Fe both 2011 model ” from 𝑞2; also between “is it possible to buy a car ”
from 𝑞1 and “just new here in Qatar could you please give some feedback ” from 𝑞2. In
this case, the second bidirectional LSTM layer corrects the first one, and the model
adjusts to recognize the lack of similarity between the two questions. In fact, the
98
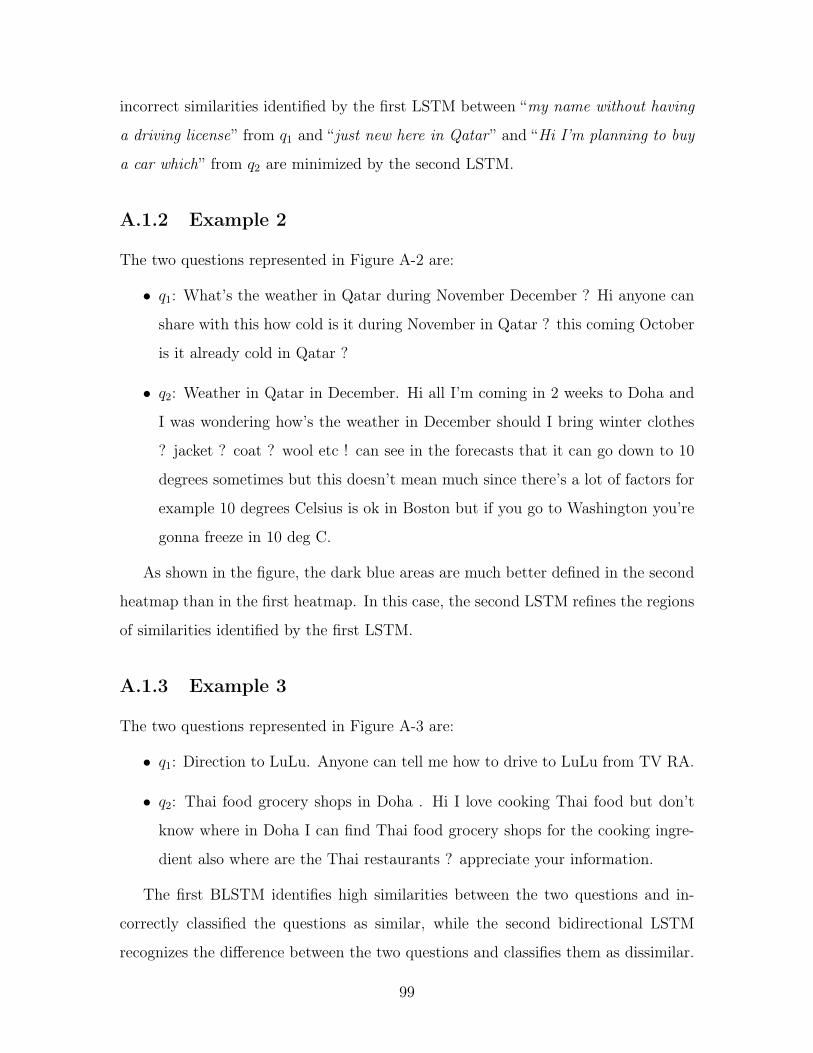
incorrect similarities identified by the first LSTM between “my name without having
a driving license” from 𝑞1 and “just new here in Qatar ” and “Hi I’m planning to buy
a car which” from 𝑞2 are minimized by the second LSTM.
A.1.2 Example 2
The two questions represented in Figure A-2 are:
∙ 𝑞1: What’s the weather in Qatar during November December ? Hi anyone can
share with this how cold is it during November in Qatar ? this coming October
is it already cold in Qatar ?
∙ 𝑞2: Weather in Qatar in December. Hi all I’m coming in 2 weeks to Doha and
I was wondering how’s the weather in December should I bring winter clothes
? jacket ? coat ? wool etc ! can see in the forecasts that it can go down to 10
degrees sometimes but this doesn’t mean much since there’s a lot of factors for
example 10 degrees Celsius is ok in Boston but if you go to Washington you’re
gonna freeze in 10 deg C.
As shown in the figure, the dark blue areas are much better defined in the second
heatmap than in the first heatmap. In this case, the second LSTM refines the regions
of similarities identified by the first LSTM.
A.1.3 Example 3
The two questions represented in Figure A-3 are:
∙ 𝑞1: Direction to LuLu. Anyone can tell me how to drive to LuLu from TV RA.
∙ 𝑞2: Thai food grocery shops in Doha . Hi I love cooking Thai food but don’t
know where in Doha I can find Thai food grocery shops for the cooking ingre-
dient also where are the Thai restaurants ? appreciate your information.
The first BLSTM identifies high similarities between the two questions and in-
correctly classified the questions as similar, while the second bidirectional LSTM
recognizes the difference between the two questions and classifies them as dissimilar.
99
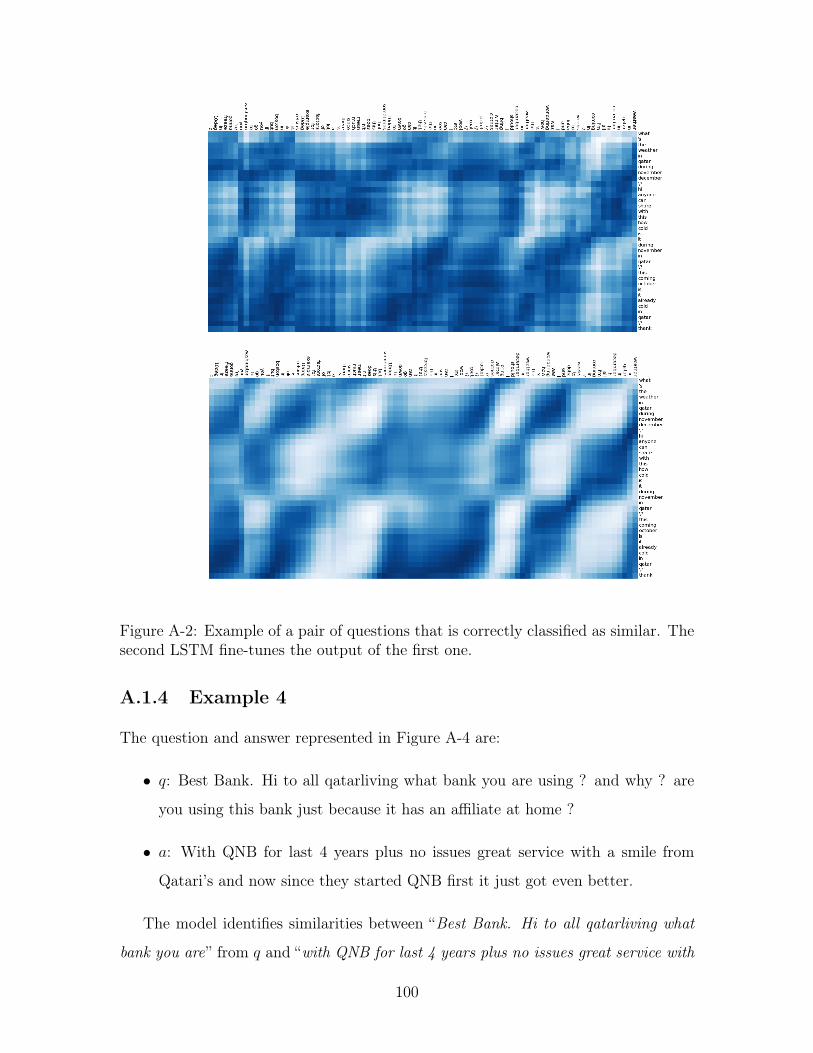
Figure A-2: Example of a pair of questions that is correctly classified as similar. Thesecond LSTM fine-tunes the output of the first one.
A.1.4 Example 4
The question and answer represented in Figure A-4 are:
∙ 𝑞: Best Bank. Hi to all qatarliving what bank you are using ? and why ? are
you using this bank just because it has an affiliate at home ?
∙ 𝑎: With QNB for last 4 years plus no issues great service with a smile from
Qatari’s and now since they started QNB first it just got even better.
The model identifies similarities between “Best Bank. Hi to all qatarliving what
bank you are” from 𝑞 and “with QNB for last 4 years plus no issues great service with
100
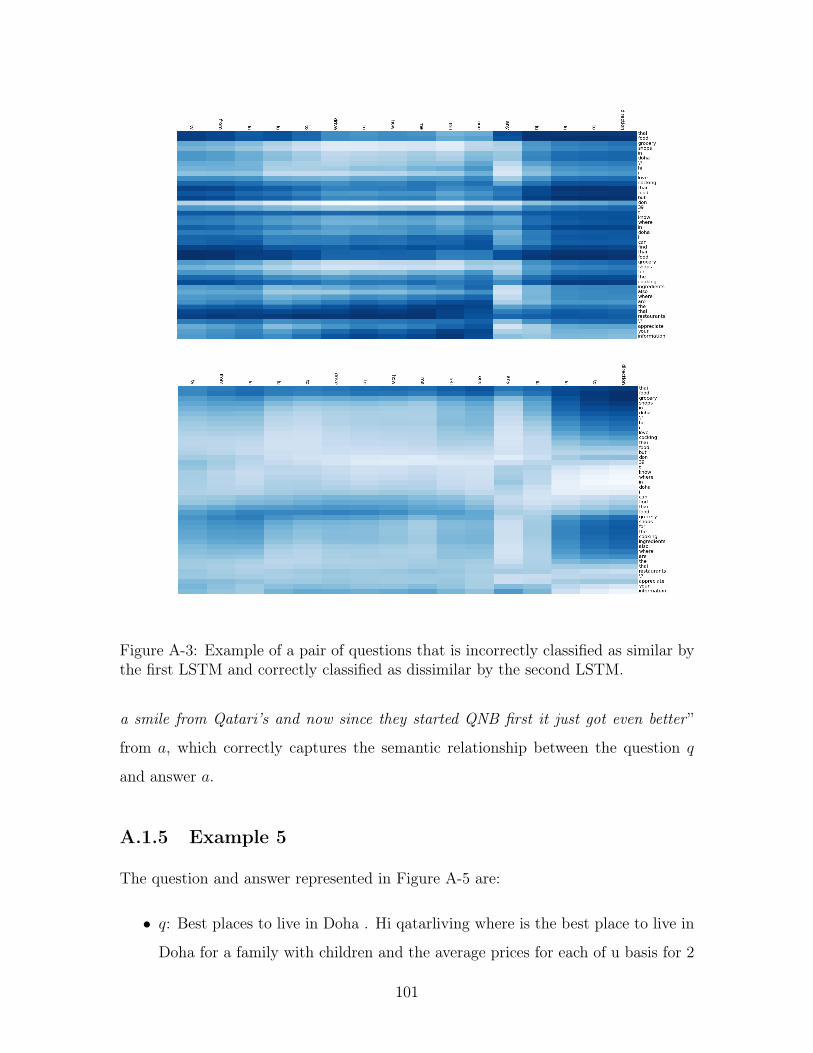
Figure A-3: Example of a pair of questions that is incorrectly classified as similar bythe first LSTM and correctly classified as dissimilar by the second LSTM.
a smile from Qatari’s and now since they started QNB first it just got even better ”
from 𝑎, which correctly captures the semantic relationship between the question 𝑞
and answer 𝑎.
A.1.5 Example 5
The question and answer represented in Figure A-5 are:
∙ 𝑞: Best places to live in Doha . Hi qatarliving where is the best place to live in
Doha for a family with children and the average prices for each of u basis for 2
101

Figure A-4: Example of a question-answer pair that correctly classified as related.Each bidirectional LSTM makes a correct prediction.
rooms quits and clean and modern areas.
∙ 𝑎: ezdan al wakrah qr 5200 with water and electricity nice compound with all
amenities quite.
The model identifies similarities between “a family with children and the average
prices for each of u basis for 2 rooms quits and clean and modern areas” from 𝑞 and
“ezdan al wakrah qr 5200 with water and electricity nice compound with all amenities
quite and ” from 𝑎.
102
Figure A-5: Example of a question-answer pair that is correctly classified as related.
A.1.6 Example 6
The question and answer represented in Figure A-6 are:
∙ 𝑞: My inhouse plants are dying. I dont know what is happening to all my
inhouse plants . they just wont survive. I changed manure; but in vain. put
them in sunlight. gave them ventilation tried all tactics but they would just die
away. turn black. watz happening can anyone suggest me?
103

Figure A-6: Example of a question-answer pair that is correctly classified as relatedby both first and second bidirectional LSTM.
∙ 𝑎: I got plants lots of plant. The black thing is lack of sufficient sun; too much
water and wrong fertilizer. Or worst to come Fungus!.
The model identifies similarities between “My inhouse plants are dying. I dont
know what is happening to all my inhouse plants . they just wont survive. I changed
manure; but in vain. put them in” from 𝑞 and “I got plants lots of plant. The black
thing is lack of sufficient sun; too much water and wrong fertilizer. Or worst to come
Fungus! ” from 𝑎.
104
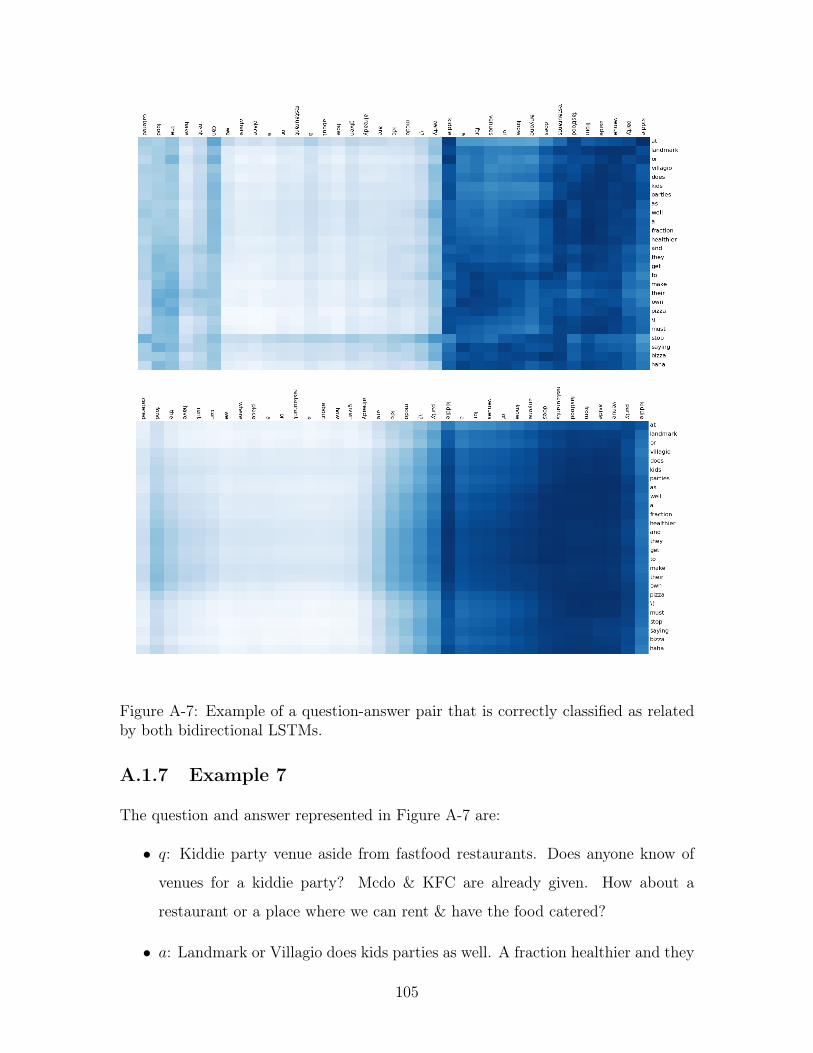
Figure A-7: Example of a question-answer pair that is correctly classified as relatedby both bidirectional LSTMs.
A.1.7 Example 7
The question and answer represented in Figure A-7 are:
∙ 𝑞: Kiddie party venue aside from fastfood restaurants. Does anyone know of
venues for a kiddie party? Mcdo & KFC are already given. How about a
restaurant or a place where we can rent & have the food catered?
∙ 𝑎: Landmark or Villagio does kids parties as well. A fraction healthier and they
105
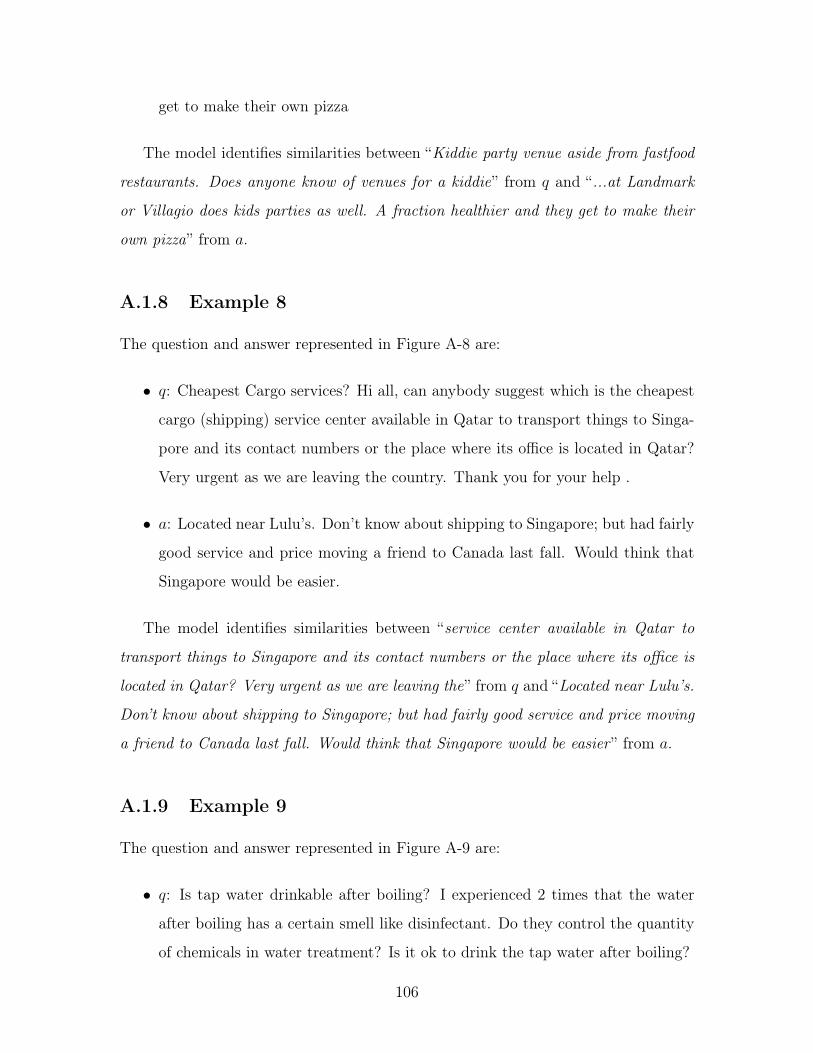
get to make their own pizza
The model identifies similarities between “Kiddie party venue aside from fastfood
restaurants. Does anyone know of venues for a kiddie” from 𝑞 and “...at Landmark
or Villagio does kids parties as well. A fraction healthier and they get to make their
own pizza” from 𝑎.
A.1.8 Example 8
The question and answer represented in Figure A-8 are:
∙ 𝑞: Cheapest Cargo services? Hi all, can anybody suggest which is the cheapest
cargo (shipping) service center available in Qatar to transport things to Singa-
pore and its contact numbers or the place where its office is located in Qatar?
Very urgent as we are leaving the country. Thank you for your help .
∙ 𝑎: Located near Lulu’s. Don’t know about shipping to Singapore; but had fairly
good service and price moving a friend to Canada last fall. Would think that
Singapore would be easier.
The model identifies similarities between “service center available in Qatar to
transport things to Singapore and its contact numbers or the place where its office is
located in Qatar? Very urgent as we are leaving the” from 𝑞 and “Located near Lulu’s.
Don’t know about shipping to Singapore; but had fairly good service and price moving
a friend to Canada last fall. Would think that Singapore would be easier ” from 𝑎.
A.1.9 Example 9
The question and answer represented in Figure A-9 are:
∙ 𝑞: Is tap water drinkable after boiling? I experienced 2 times that the water
after boiling has a certain smell like disinfectant. Do they control the quantity
of chemicals in water treatment? Is it ok to drink the tap water after boiling?
106
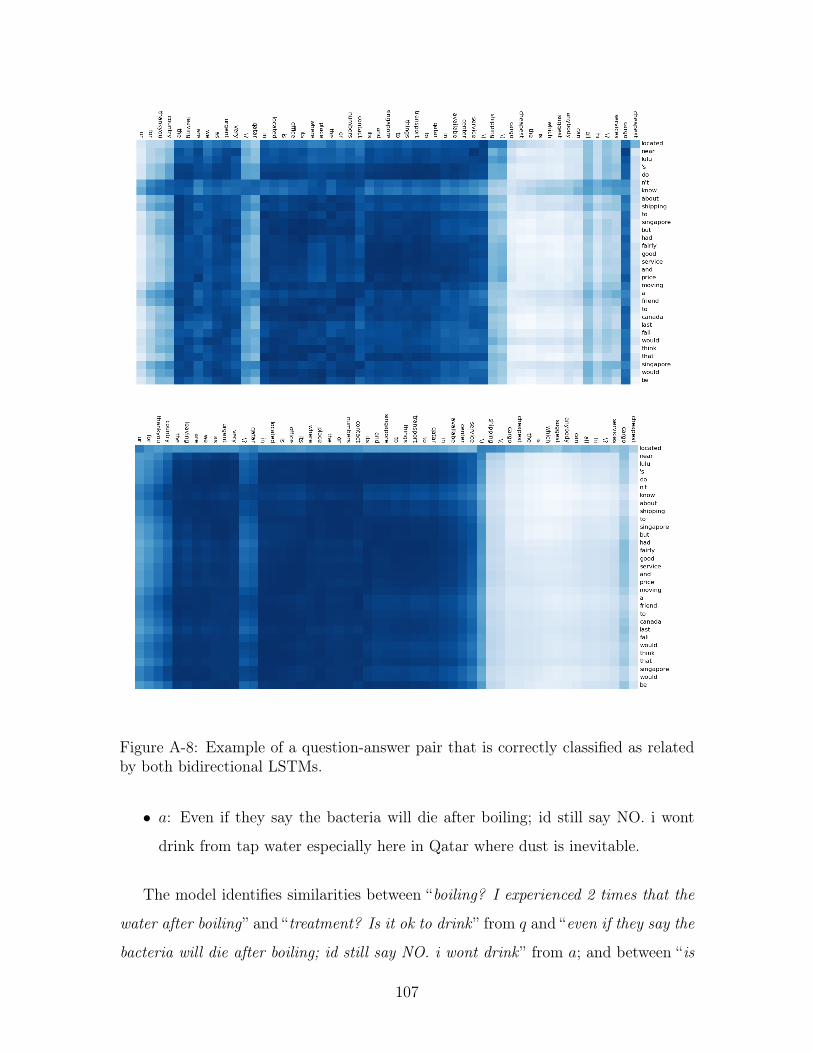
Figure A-8: Example of a question-answer pair that is correctly classified as relatedby both bidirectional LSTMs.
∙ 𝑎: Even if they say the bacteria will die after boiling; id still say NO. i wont
drink from tap water especially here in Qatar where dust is inevitable.
The model identifies similarities between “boiling? I experienced 2 times that the
water after boiling” and “treatment? Is it ok to drink ” from 𝑞 and “even if they say the
bacteria will die after boiling; id still say NO. i wont drink ” from 𝑎; and between “is
107
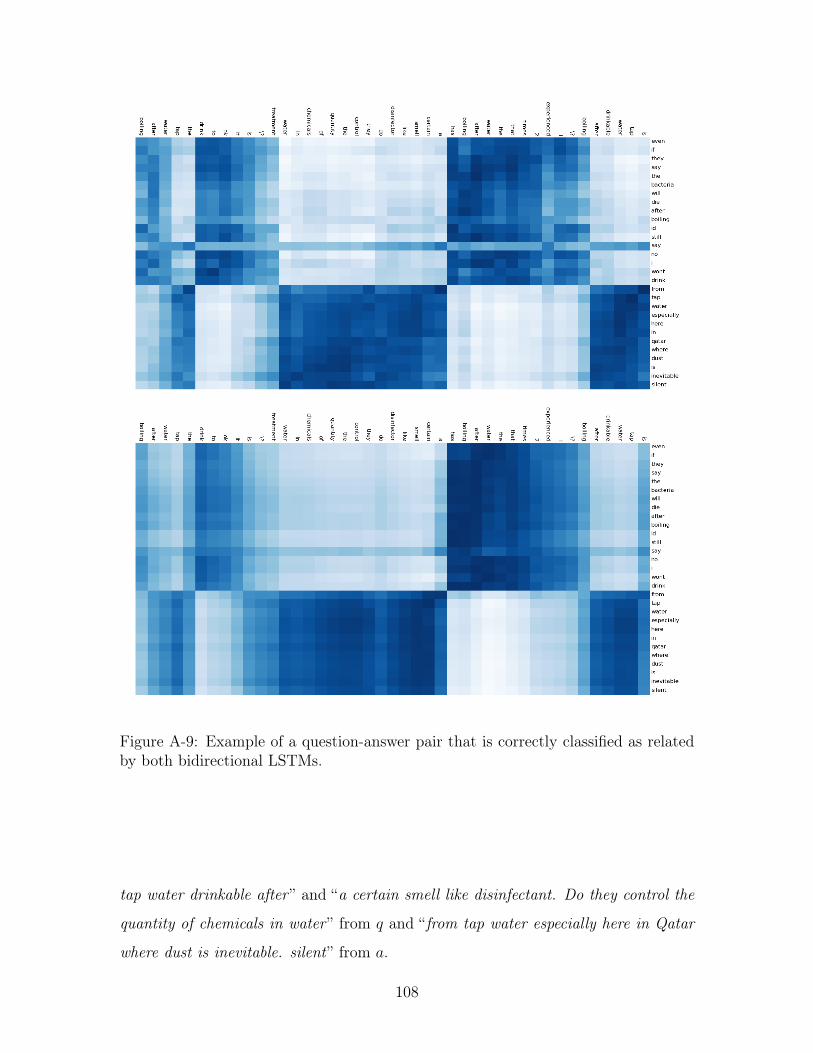
Figure A-9: Example of a question-answer pair that is correctly classified as relatedby both bidirectional LSTMs.
tap water drinkable after ” and “a certain smell like disinfectant. Do they control the
quantity of chemicals in water ” from 𝑞 and “from tap water especially here in Qatar
where dust is inevitable. silent” from 𝑎.
108
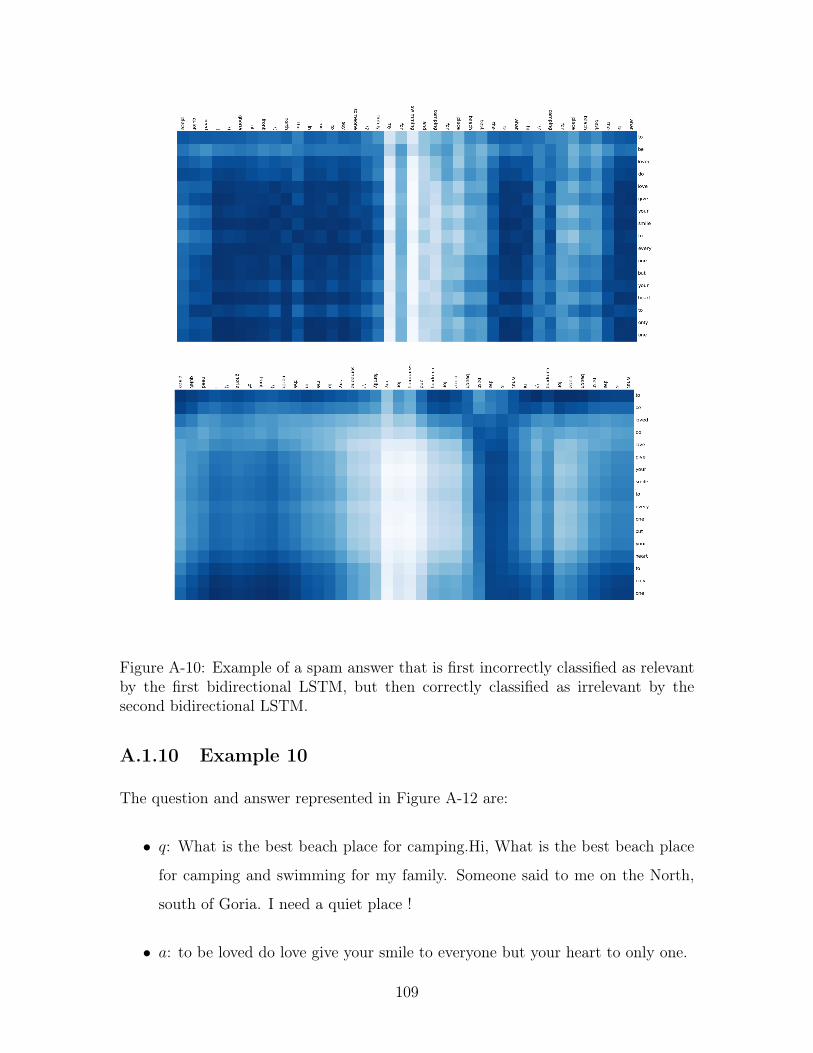
Figure A-10: Example of a spam answer that is first incorrectly classified as relevantby the first bidirectional LSTM, but then correctly classified as irrelevant by thesecond bidirectional LSTM.
A.1.10 Example 10
The question and answer represented in Figure A-12 are:
∙ 𝑞: What is the best beach place for camping.Hi, What is the best beach place
for camping and swimming for my family. Someone said to me on the North,
south of Goria. I need a quiet place !
∙ 𝑎: to be loved do love give your smile to everyone but your heart to only one.
109
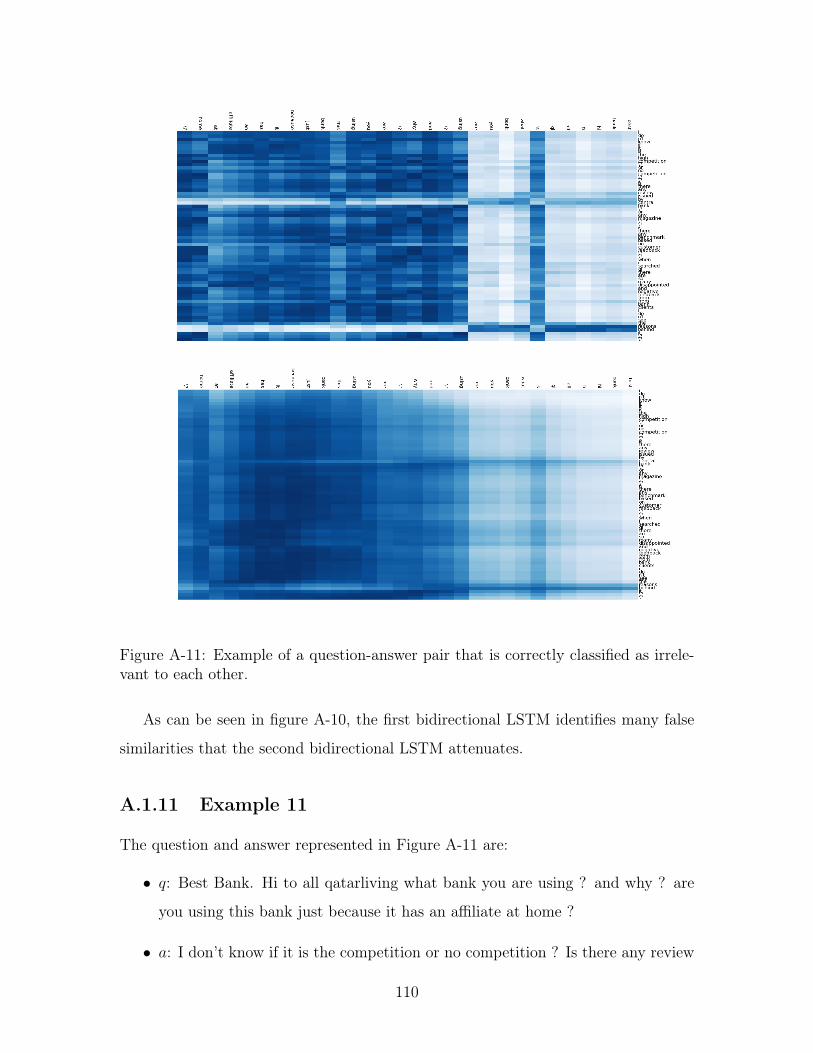
Figure A-11: Example of a question-answer pair that is correctly classified as irrele-vant to each other.
As can be seen in figure A-10, the first bidirectional LSTM identifies many false
similarities that the second bidirectional LSTM attenuates.
A.1.11 Example 11
The question and answer represented in Figure A-11 are:
∙ 𝑞: Best Bank. Hi to all qatarliving what bank you are using ? and why ? are
you using this bank just because it has an affiliate at home ?
∙ 𝑎: I don’t know if it is the competition or no competition ? Is there any review
110
issued by central bank ? Is there any magazine ? Is there any benchmark
based on customer feedback ? When I searched qatarliving there are so many
disappointed and negative feedback from bank clients. I don’t see the reasons
behind it.
The first bidirectional LSTM in the model incorrectly identifies a high level of
similarity between “using ? and why ? are you using this bank just because it has an
affiliate at home ? ” from 𝑞 and all of 𝑎. The second LSTM reduces the similarity
scores to a value under the threshold.
A.1.12 Example 12
The question and answer represented in Figure A-12 are:
∙ 𝑞: best Bank. hi to all qatarliving what bank you are using ? and why ? are
you using this bank just because it has an affiliate at home ?
∙ 𝑎: Westernindoha that’s the information i am looking for and it answers my
question
The model first identifies similarities between “using ? and why ? are you using
this bank just because it has an affiliate at home ? ” from 𝑞 and “westernindoha that’s
the information i am looking for and it answers my question” from 𝑎. However,
because the question is asked and answered by the same user, this question-answer
pair is labeled as bad.
111

Figure A-12: Example of a question-answer pair that is correctly classified as irrele-vant to each other. In this case, the question and answer are provided by the sameuser.
112
Bibliography
Anjaria, M. and Guddeti, R. M. R. (2014). A novel sentiment analysis of socialnetworks using supervised learning. Social Network Analysis and Mining, 4(1):1–15.
Augustyniak, L., Kajdanowicz, T., Szymanski, P., Tuliglowicz, W., Kazienko, P.,Alhajj, R., and Szymanski, B. (2014). Simpler is better? Lexicon-based ensemblesentiment classification beats supervised methods. In Advances in Social NetworksAnalysis and Mining (ASONAM), 2014 IEEE/ACM International Conference on,pages 924–929. IEEE.
Auli, M., Galley, M., Quirk, C., and Zweig, G. (2013). Joint language and translationmodeling with recurrent neural networks. In EMNLP, volume 3, page 0.
Barrón-Cedeno, A., Filice, S., Da San Martino, G., Joty, S., Marquez, L., Nakov, P.,and Moschitti, A. (2015). Threadlevel information for comment classification incommunity question answering. In Proceedings of the 53rd Annual Meeting of theAssociation for Computational Linguistics and the 7th International Joint Confer-ence on Natural Language Processing, ACLIJCNLP, volume 15, pages 687–693.
Belinkov, Y., Mohtarami, M., Cyphers, S., and Glass, J. (2015). Vectorslu: A contin-uous word vector approach to answer selection in community question answeringsystems. SemEval-2015, page 282.
Bengio, Y., Schwenk, H., Senécal, J.-S., Morin, F., and Gauvain, J.-L. (2006). Neuralprobabilistic language models. In Innovations in Machine Learning, pages 137–186.Springer.
Bengio, Y., Simard, P., and Frasconi, P. (1994). Learning long-term dependencies withgradient descent is difficult. Neural Networks, IEEE Transactions on, 5(2):157–166.
Berger, A., Caruana, R., Cohn, D., Freitag, D., and Mittal, V. (2000). Bridgingthe lexical chasm: Statistical approaches to answer-finding. In Proceedings of the23rd annual international ACM SIGIR conference on Research and development ininformation retrieval, pages 192–199. ACM.
Blei, D. M., Ng, A. Y., and Jordan, M. I. (2003). Latent dirichlet allocation. theJournal of machine Learning research, 3:993–1022.
113
Brody, S. and Elhadad, N. (2010). An unsupervised aspect-sentiment model for onlinereviews. In Human Language Technologies: The 2010 Annual Conference of theNorth American Chapter of the Association for Computational Linguistics, pages804–812. Association for Computational Linguistics.
Brown, P. F., Pietra, V. J. D., Pietra, S. A. D., and Mercer, R. L. (1993). The math-ematics of statistical machine translation: Parameter estimation. Computationallinguistics, 19(2):263–311.
Burke, R. D., Hammond, K. J., Kulyukin, V., Lytinen, S. L., Tomuro, N., andSchoenberg, S. (1997). Question answering from frequently asked question files:Experiences with the FAQ finder system. AI magazine, 18(2):57.
Chikersal, P., Poria, S., Cambria, E., Gelbukh, A., and Siong, C. E. (2015). Modellingpublic sentiment in Twitter: using linguistic patterns to enhance supervised learn-ing. In Computational Linguistics and Intelligent Text Processing, pages 49–65.Springer.
Cho, K., Van Merriënboer, B., Gulcehre, C., Bahdanau, D., Bougares, F., Schwenk,H., and Bengio, Y. (2014). Learning phrase representations using rnn encoder-decoder for statistical machine translation. arXiv preprint arXiv:1406.1078.
Collobert, R. and Weston, J. (2008). A unified architecture for natural languageprocessing: Deep neural networks with multitask learning. In Proceedings of the25th international conference on Machine learning, pages 160–167. ACM.
Collobert, R., Weston, J., Bottou, L., Karlen, M., Kavukcuoglu, K., and Kuksa, P.(2011). Natural language processing (almost) from scratch. The Journal of MachineLearning Research, 12:2493–2537.
Cristianini, N. and Shawe-Taylor, J. (2000). An introduction to support vector ma-chines and other kernel-based learning methods. Cambridge university press.
Dave, K., Lawrence, S., and Pennock, D. M. (2003). Mining the peanut gallery:Opinion extraction and semantic classification of product reviews. In Proceedingsof the 12th international conference on World Wide Web, pages 519–528. ACM.
Dice, L. R. (1945). Measures of the amount of ecologic association between species.Ecology, 26(3):297–302.
Ding, X., Liu, B., and Yu, P. S. (2008). A holistic lexicon-based approach to opinionmining. In Proceedings of the 2008 International Conference on Web Search andData Mining, pages 231–240. ACM.
dos Santos, C., Barbosa, L., Bogdanova, D., and Zadrozny, B. (2015). Learning hybridrepresentations to retrieve semantically equivalent questions. In Proceedings of the53rd Annual Meeting of the Association for Computational Linguistics and the 7thInternational Joint Conference on Natural Language Processing (Volume 2: ShortPapers), pages 694–699, Beijing, China. Association for Computational Linguistics.
114
Dumais, S. T. (2004). Latent semantic analysis. Annual review of information scienceand technology, 38(1):188–230.
Elman, J. L. (1990). Finding structure in time. Cognitive science, 14(2):179–211.
Fellbaum, C. (1998). A semantic network of English verbs. WordNet: An electroniclexical database, 3:153–178.
Feng, M., Xiang, B., Glass, M. R., Wang, L., and Zhou, B. (2015). Applying deeplearning to answer selection: A study and an open task. CoRR, abs/1508.01585.
Firth, J. R. (1957). A synopsis of linguistic theory.
Ganu, G., Elhadad, N., and Marian, A. (2009). Beyond the stars: Improving ratingpredictions using review text content. In WebDB, volume 9, pages 1–6. CiteSeer.
Glorot, X., Bordes, A., and Bengio, Y. (2011). Domain adaptation for large-scalesentiment classification: A deep learning approach. In Proceedings of the 28thInternational Conference on Machine Learning (ICML-11), pages 513–520.
Go, A., Bhayani, R., and Huang, L. (2009). Twitter sentiment classification usingdistant supervision. CS224N Project Report, Stanford, 1:12.
Graves, A. and Jaitly, N. (2014). Towards end-to-end speech recognition with re-current neural networks. In Proceedings of the 31st International Conference onMachine Learning (ICML-14), pages 1764–1772.
Graves, A. and Schmidhuber, J. (2005). Framewise phoneme classification withbidirectional LSTM and other neural network architectures. Neural Networks,18(5):602–610.
Griffiths, T., Steyvers, M., et al. (2003). Prediction and semantic association. Ad-vances in neural information processing systems, pages 11–18.
Grundström, J. and Nugues, P. (2014). Using syntactic features in answer reranking.In AAAI 2014 Workshop on Cognitive Computing for Augmented Human Intelli-gence, pages 13–19.
Hamdan, H., Bellot, P., and Béchet, F. (2000). Supervised methods for aspect-basedsentiment analysis.
Harris, Z. S. (1954). Distributional structure. Word, 10(2-3):146–162.
Heilman, M. and Smith, N. A. (2010). Tree edit models for recognizing textual entail-ments, paraphrases, and answers to questions. In Human Language Technologies:The 2010 Annual Conference of the North American Chapter of the Associationfor Computational Linguistics, pages 1011–1019. Association for ComputationalLinguistics.
115
Hinton, G. E. and Roweis, S. T. (2002). Stochastic neighbor embedding. In Advancesin neural information processing systems, pages 833–840.
Hochreiter, S. and Schmidhuber, J. (1997). Long short-term memory. Neural compu-tation, 9(8):1735–1780.
Hofmann, T. (1999). Probabilistic latent semantic indexing. In Proceedings of the22nd annual international ACM SIGIR conference on Research and developmentin information retrieval, pages 50–57. ACM.
Hou, Y., Tan, C., Wang, X., Zhang, Y., Xu, J., and Chen, Q. (2015). Hitszicrc:Exploiting classification approach for answer selection in community question an-swering. In Proceedings of the 9th International Workshop on Semantic Evaluation,SemEval, volume 15, pages 196–202.
Hu, M. and Liu, B. (2004). Mining and summarizing customer reviews. In Proceedingsof the tenth ACM SIGKDD international conference on Knowledge discovery anddata mining, pages 168–177. ACM.
Ian Goodfellow, Y. B. and Courville, A. (2016). Deep learning. Book in preparationfor MIT Press.
Irwin, J. D. (1997). The industrial electronics handbook. CRC Press.
Ising, E. (1925). A contribution to the theory of ferromagnetism. Z. Phys, 31(1):253–258.
Jakob, N. and Gurevych, I. (2010). Extracting opinion targets in a single-and cross-domain setting with conditional random fields. In Proceedings of the 2010 confer-ence on empirical methods in natural language processing, pages 1035–1045. Asso-ciation for Computational Linguistics.
Jeon, J., Croft, W. B., and Lee, J. H. (2005). Finding similar questions in large ques-tion and answer archives. In Proceedings of the 14th ACM international conferenceon Information and knowledge management, pages 84–90. ACM.
Jeon, J., Croft, W. B., Lee, J. H., and Park, S. (2006). A framework to predict thequality of answers with non-textual features. In Proceedings of the 29th annualinternational ACM SIGIR conference on Research and development in informationretrieval, pages 228–235. ACM.
Jin, W., Ho, H. H., and Srihari, R. K. (2009). A novel lexicalized HMM-based learningframework for web opinion mining. In Proceedings of the 26th Annual InternationalConference on Machine Learning, pages 465–472. Citeseer.
Joachims, T. (1999). Making large scale SVM learning practical. Technical report,Universität Dortmund.
116

Joty, S., Barrón-Cedeno, A., Da San Martino, G., Filice, S., Marquez, L., Moschitti,A., and Nakov, P. (2015). Global thread-level inference for comment classificationin community question answering. In Proceedings of the Conference on EmpiricalMethods in Natural Language Processing, EMNLP, volume 15.
Kalchbrenner, N., Grefenstette, E., and Blunsom, P. (2014). A convolutional neuralnetwork for modelling sentences. arXiv preprint arXiv:1404.2188.
Karpathy, A. and Fei-Fei (2016). CS231n: Convolutional Neural Networks for VisualRecognition.
Karpathy, A. and Fei-Fei, L. (2015). Deep visual-semantic alignments for generatingimage descriptions. In Proceedings of the IEEE Conference on Computer Visionand Pattern Recognition, pages 3128–3137.
Kim, H. and Seo, J. (2006). High-performance FAQ retrieval using an automaticclustering method of query logs. Information processing & management, 42(3):650–661.
Kim, S.-M. and Hovy, E. (2004). Determining the sentiment of opinions. In Proceed-ings of the 20th international conference on Computational Linguistics, page 1367.Association for Computational Linguistics.
Kingma, D. P. and Ba, J. (2014). Adam: A method for stochastic optimization.CoRR, abs/1412.6980.
Kobayashi, N., Iida, R., Inui, K., and Matsumoto, Y. (2006). Opinion mining onthe web by extracting subject-aspect-evaluation relasions. Proceedings of AAAI-CAAW.
Kouloumpis, E., Wilson, T., and Moore, J. D. (2011). Twitter sentiment analysis:The good the bad and the omg! Icwsm, 11:538–541.
Koutnik, J., Greff, K., Gomez, F., and Schmidhuber, J. (2014). A clockwork rnn.arXiv preprint arXiv:1402.3511.
Lafferty, J., McCallum, A., and Pereira, F. C. (2001). Conditional random fields:Probabilistic models for segmenting and labeling sequence data.
Lai, Y.-S., Fung, K.-A., and Wu, C.-H. (2002). FAQ mining via list detection. Inproceedings of the 2002 conference on multilingual summarization and questionanswering-Volume 19, pages 1–7. Association for Computational Linguistics.
LeCun, Y., Bottou, L., Bengio, Y., and Haffner, P. (1998). Gradient-based learningapplied to document recognition. Proceedings of the IEEE, 86(11):2278–2324.
Lenz, M., Hübner, A., and Kunze, M. (1998). Question answering with Textual CBR.In Flexible Query Answering Systems, pages 236–247. Springer.
117
Liu, B. (2012). Sentiment analysis and opinion mining. Synthesis lectures on humanlanguage technologies, 5(1):1–167.
Liu, S., Yang, N., Li, M., and Zhou, M. (2014). A recursive recurrent neural networkfor statistical machine translation. In ACL (1), pages 1491–1500.
Long, C., Zhang, J., and Zhut, X. (2010). A review selection approach for accuratefeature rating estimation. In Proceedings of the 23rd International Conference onComputational Linguistics: Posters, pages 766–774. Association for ComputationalLinguistics.
Magnini, B., Negri, M., Prevete, R., and Tanev, H. (2002). Is it the right answer?: Ex-ploiting web redundancy for Answer Validation. In Proceedings of the 40th AnnualMeeting on Association for Computational Linguistics, pages 425–432. Associationfor Computational Linguistics.
Manning, C. D. and Schütze, H. (1999). Foundations of statistical natural languageprocessing, volume 999. MIT Press.
Màrquez, L., Glass, J., Magdy, W., Moschitti, A., Nakov, P., and Randeree, B. (2015).SemEval-2015 Task 3: Answer Selection in Community Question Answering. InProceedings of the 9th International Workshop on Semantic Evaluation (SemEval2015).
Mei, Q., Ling, X., Wondra, M., Su, H., and Zhai, C. (2007). Topic sentiment mixture:Modeling facets and opinions in weblogs. In Proceedings of the 16th internationalconference on World Wide Web, pages 171–180. ACM.
Metz, C. E. (1978). Basic principles of ROC analysis. In Seminars in nuclear medicine,volume 8, pages 283–298. Elsevier.
Mikolov, T., Chen, K., Corrado, G., and Dean, J. (2013a). Efficient estimation ofword representations in vector space. arXiv preprint arXiv:1301.3781.
Mikolov, T., Karafiát, M., Burget, L., Cernocky, J., and Khudanpur, S. (2010).Recurrent neural network based language model. In INTERSPEECH, volume 2,page 3.
Mikolov, T., Kombrink, S., Burget, L., Černocky, J. H., and Khudanpur, S. (2011).Extensions of recurrent neural network language model. In Acoustics, Speech andSignal Processing (ICASSP), 2011 IEEE International Conference on, pages 5528–5531. IEEE.
Mikolov, T., Sutskever, I., Chen, K., Corrado, G. S., and Dean, J. (2013b). Dis-tributed representations of words and phrases and their compositionality. In Ad-vances in neural information processing systems, pages 3111–3119.
Mikolov, T., Yih, W.-t., and Zweig, G. (2013c). Linguistic regularities in continuousspace word representations. In HLT-NAACL, pages 746–751.
118

Moschitti, A. (2008). Kernel methods, syntax and semantics for relational text catego-rization. In Proceedings of the 17th ACM conference on Information and knowledgemanagement, pages 253–262. ACM.
Moschitti, A., Quarteroni, S., Basili, R., and Manandhar, S. (2007). Exploitingsyntactic and shallow semantic kernels for question answer classification. In Annualmeeting-association for computational linguistics, volume 45, page 776.
Musto, C., Semeraro, G., and Polignano, M. (2014). A comparison of lexicon-basedapproaches for sentiment analysis of microblog posts. Information Filtering andRetrieval, page 59.
Nakov, P., Màrquez, L., Magdy, W., Moschitti, A., Glass, J., and Randeree, B.(2016). SemEval-2016 task 3: Community question answering. In Proceedings ofthe 10th International Workshop on Semantic Evaluation, SemEval ’16, San Diego,California. Association for Computational Linguistics.
Nassif, H. M., Mohtarami, M., and Glass, J. (2016). Learning semantic relatedness incommunity question answering using neural models. Submitted to ACL Workshopon Representation Learning for NLP.
Nicosia, M., Filice, S., Barrón-Cedeno, A., Saleh, I., Mubarak, H., Gao, W., Nakov,P., Da San Martino, G., Moschitti, A., Darwish, K., et al. (2015). QCRI: Answerselection for community question answering experiments for Arabic and English. InProceedings of the 9th International Workshop on Semantic Evaluation, SemEval,volume 15, pages 203–209.
Olah, C. (2015). Understanding LSTM Networks.
Pak, A. and Paroubek, P. (2010). Twitter as a corpus for sentiment analysis andopinion mining. In LREc, volume 10, pages 1320–1326.
Pang, B. and Lee, L. (2004). A sentimental education: Sentiment analysis usingsubjectivity summarization based on minimum cuts. In Proceedings of the 42ndannual meeting on Association for Computational Linguistics, page 271. Associa-tion for Computational Linguistics.
Pang, B., Lee, L., and Vaithyanathan, S. (2002). Thumbs up?: Sentiment classifica-tion using machine learning techniques. In Proceedings of the ACL-02 conferenceon Empirical methods in natural language processing-Volume 10, pages 79–86. As-sociation for Computational Linguistics.
Pascanu, R., Mikolov, T., and Bengio, Y. (2012). On the difficulty of training recur-rent neural networks. arXiv preprint arXiv:1211.5063.
Pontiki, M., Galanis, D., Papageorgiou, H., Manandhar, S., and Androutsopoulos,I. (2015). Semeval-2015 task 12: Aspect based sentiment analysis. In Proceed-ings of the 9th International Workshop on Semantic Evaluation (SemEval 2015),Association for Computational Linguistics, Denver, Colorado, pages 486–495.
119

Pontiki, M., Galanis, D., Pavlopoulos, J., Papageorgiou, H., Androutsopoulos, I.,and Manandhar, S. (2014). Semeval-2014 task 4: Aspect based sentiment analysis.In Proceedings of the 8th international workshop on semantic evaluation (SemEval2014), pages 27–35.
Popescu, A.-M. and Etzioni, O. (2007). Extracting product features and opinions fromreviews. In Natural language processing and text mining, pages 9–28. Springer.
Rabiner, L. R. (1989). A tutorial on hidden Markov models and selected applicationsin speech recognition. Proceedings of the IEEE, 77(2):257–286.
Radlinski, F. and Joachims, T. (2005). Query chains: learning to rank from implicitfeedback. In Proceedings of the eleventh ACM SIGKDD international conferenceon Knowledge discovery in data mining, pages 239–248. ACM.
Rong, X. (2014). word2vec parameter learning explained. arXiv preprintarXiv:1411.2738.
Rumelhart, D. and McClelland, J. (1986). Distributed representations.
Rummelhart, D. E., McClelland, J. L., Group, P. R., et al. (1986). Parallel Dis-tributed Processing. Explorations in the Microstructure of Cognition. Volume 1:Foundations.
Sahlgren, M. (2006). The Word-space model. PhD thesis, Citeseer.
Schrijver, A. (1998). Theory of linear and integer programming. John Wiley & Sons.
Schuster, M. and Paliwal, K. K. (1997). Bidirectional recurrent neural networks.Signal Processing, IEEE Transactions on, 45(11):2673–2681.
Schütze, H. (1992). Dimensions of meaning. In Supercomputing’92., Proceedings,pages 787–796. IEEE.
Schwenk, H. (2007). Continuous space language models. Computer Speech & Lan-guage, 21(3):492–518.
Severyn, A. and Moschitti, A. (2012). Structural relationships for large-scale learn-ing of answer re-ranking. In Proceedings of the 35th international ACM SIGIRconference on Research and development in information retrieval, pages 741–750.ACM.
Severyn, A. and Moschitti, A. (2013). Automatic feature engineering for answerselection and extraction. In EMNLP, pages 458–467.
Severyn, A. and Moschitti, A. (2015a). Learning to rank short text pairs with con-volutional deep neural networks. In Proceedings of the 38th International ACMSIGIR Conference on Research and Development in Information Retrieval, pages373–382. ACM.
120
Severyn, A. and Moschitti, A. (2015b). Learning to rank short text pairs with con-volutional deep neural networks. In Proceedings of the 38th International ACMSIGIR Conference on Research and Development in Information Retrieval, SIGIR’15, pages 373–382, New York, NY, USA. ACM.
Shen, D. and Lapata, M. (2007). Using semantic roles to improve question answering.In EMNLP-CoNLL, pages 12–21.
Shen, Y., He, X., Gao, J., Deng, L., and Mesnil, G. (2014). Learning semanticrepresentations using convolutional neural networks for web search. In Proceedingsof the companion publication of the 23rd international conference on World wide webcompanion, pages 373–374. International World Wide Web Conferences SteeringCommittee.
Sneiders, E. (2002). Automated question answering using question templates thatcover the conceptual model of the database. In Natural Language Processing andInformation Systems, pages 235–239. Springer.
Socher, R. (2014). Recursive Deep Learning for Natural Language Processing andComputer Vision. PhD thesis, Citeseer.
Socher, R., Lin, C. C., Manning, C., and Ng, A. Y. (2011). Parsing natural scenesand natural language with recursive neural networks. In Proceedings of the 28thinternational conference on machine learning (ICML-11), pages 129–136.
Somasundaran, S. and Wiebe, J. (2009). Recognizing stances in online debates. InProceedings of the Joint Conference of the 47th Annual Meeting of the ACL and the4th International Joint Conference on Natural Language Processing of the AFNLP:Volume 1-Volume 1, pages 226–234. Association for Computational Linguistics.
Song, W., Feng, M., Gu, N., and Wenyin, L. (2007). Question similarity calcula-tion for FAQ answering. In Semantics, Knowledge and Grid, Third InternationalConference on, pages 298–301. IEEE.
Sørensen, T. (1948). A method of establishing groups of equal amplitude in plant soci-ology based on similarity of species and its application to analyses of the vegetationon danish commons. Biol. Skr., 5:1–34.
Sorokina, O. (2015). Eight types of social media and how each can benefit yourbusiness.
Steyvers, M. and Griffiths, T. (2007). Probabilistic topic models. Handbook of latentsemantic analysis, 427(7):424–440.
Strigl, D., Kofler, K., and Podlipnig, S. (2010). Performance and scalability of GPU-based convolutional neural networks. In 2010 18th Euromicro Conference on Par-allel, Distributed and Network-based Processing, pages 317–324. IEEE.
121
Surdeanu, M., Ciaramita, M., and Zaragoza, H. (2008). Learning to Rank Answerson Large Online QA Collections. In ACL, volume 8, pages 719–727.
Sutskever, I., Martens, J., and Hinton, G. E. (2011). Generating text with recurrentneural networks. In Proceedings of the 28th International Conference on MachineLearning (ICML-11), pages 1017–1024.
Sutskever, I., Vinyals, O., and Le, Q. V. (2014). Sequence to sequence learningwith neural networks. In Advances in neural information processing systems, pages3104–3112.
Taboada, M., Brooke, J., Tofiloski, M., Voll, K., and Stede, M. (2011). Lexicon-basedmethods for sentiment analysis. Computational linguistics, 37(2):267–307.
Tan, M., Xiang, B., and Zhou, B. (2015). Lstm-based deep learning models fornon-factoid answer selection. CoRR, abs/1511.04108.
Thet, T. T., Na, J.-C., and Khoo, C. S. (2010). Aspect-based sentiment analy-sis of movie reviews on discussion boards. Journal of Information Science, page0165551510388123.
Toh, Z. and Wang, W. (2014). DLIREC: Aspect term extraction and term polarityclassification system. In Proceedings of the 8th International Workshop on SemanticEvaluation (SemEval 2014), pages 235–240. Citeseer.
Tomáš, M. (2012). Statistical language models based on neural networks. PhD thesis,PhD thesis, Brno University of Technology. 2012.[PDF].
Turian, J., Ratinov, L., and Bengio, Y. (2010). Word representations: a simpleand general method for semi-supervised learning. In Proceedings of the 48th annualmeeting of the association for computational linguistics, pages 384–394. Associationfor Computational Linguistics.
Turney, P. D. (2002). Thumbs up or thumbs down?: Semantic orientation applied tounsupervised classification of reviews. In Proceedings of the 40th annual meetingon association for computational linguistics, pages 417–424. Association for Com-putational Linguistics.
Turney, P. D. (2013). Distributional semantics beyond words: Supervised learning ofanalogy and paraphrase. arXiv preprint arXiv:1310.5042.
Turney, P. D., Pantel, P., et al. (2010). From frequency to meaning: Vector spacemodels of semantics. Journal of artificial intelligence research, 37(1):141–188.
Tymoshenko, K. and Moschitti, A. (2015). Assessing the impact of syntactic andsemantic structures for answer passages reranking. In Proceedings of the 24th ACMInternational on Conference on Information and Knowledge Management, pages1451–1460. ACM.
122

Van der Maaten, L. and Hinton, G. (2008). Visualizing data using t-sne. Journal ofMachine Learning Research, 9(2579-2605):85.
Voorhees, E. M. et al. (1999). The TREC-8 Question Answering Track Report. InTrec, volume 99, pages 77–82.
Wang, M. and Manning, C. D. (2010). Probabilistic tree-edit models with structuredlatent variables for textual entailment and question answering. In Proceedings ofthe 23rd International Conference on Computational Linguistics, pages 1164–1172.Association for Computational Linguistics.
Wang, M., Smith, N. A., and Mitamura, T. (2007). What is the Jeopardy Model? AQuasi-Synchronous Grammar for QA. In EMNLP-CoNLL, volume 7, pages 22–32.
Wei, W. and Gulla, J. A. (2010). Sentiment learning on product reviews via senti-ment ontology tree. In Proceedings of the 48th Annual Meeting of the Associationfor Computational Linguistics, pages 404–413. Association for Computational Lin-guistics.
Weston, J., Bengio, S., and Usunier, N. (2011). Wsabie: Scaling up to large vocabularyimage annotation. In IJCAI, volume 11, pages 2764–2770.
Whitehead, S. D. (1995). Auto-FAQ: An experiment in cyberspace leveraging. Com-puter Networks and ISDN Systems, 28(1):137–146.
Wikipedia (2016). Precision and recall — wikipedia, the free encyclopedia. [Online;accessed 11-May-2016].
Williams, D. R. G. H. R. and Hinton, G. (1986). Learning representations by back-propagating errors. Nature, 323:533–536.
Wilson, T., Wiebe, J., and Hoffmann, P. (2009). Recognizing contextual polarity: Anexploration of features for phrase-level sentiment analysis. Computational linguis-tics, 35(3):399–433.
Wolsey, L. A. and Nemhauser, G. L. (2014). Integer and combinatorial optimization.John Wiley & Sons.
Yao, K., Cohn, T., Vylomova, K., Duh, K., and Dyer, C. (2015). Depth-gated recur-rent neural networks. arXiv preprint arXiv:1508.03790.
Yao, X., Van Durme, B., Callison-Burch, C., and Clark, P. (2013). Answer extrac-tion as sequence tagging with tree edit distance. In HLT-NAACL, pages 858–867.Citeseer.
Yih, W.-t., He, X., and Meek, C. (2014). Semantic parsing for single-relation questionanswering. In ACL (2), pages 643–648. Citeseer.
Yu, L., Hermann, K. M., Blunsom, P., and Pulman, S. (2014). Deep learning foranswer sentence selection. CoRR, abs/1412.1632.
123

Zeiler, M. D. (2012). ADADELTA : An adaptive learning rate method. arXiv preprintarXiv:1212.5701.
Zhuang, L., Jing, F., and Zhu, X.-Y. (2006). Movie review mining and summariza-tion. In Proceedings of the 15th ACM international conference on Information andknowledge management, pages 43–50. ACM.
124