least cost electricity mix for south africadr tobias bischof-niemz chief engineer least cost...
TRANSCRIPT

Dr Tobias Bischof-Niemz Chief Engineer
Least Cost Electricity Mix for South Africa Optimisation of the South African power sector until 2050
CSIR Energy Centre
Status: 16 January 2017
Jarrad Wright Dr Tobias Bischof-Niemz
+27 79 527 6002 +27 83 403 1108
[email protected] [email protected]
Robbie van Heerden Crescent Mushwana
+27 82 803 0961 +27 82 310 2142

Agenda
2
Expertise of Commentators
Comments on IRP Assumptions
IRP Results and Least-cost Scenario
Proposal / Next Steps
Commentators have significant expertise to give feedback on IRP & its implementation, from planning, system operation and grid perspective
Dr Tobias Bischof-Niemz • Head of CSIR’s Energy Centre • Member of Ministerial Advisory Council on Energy (MACE) • Member of IRP2010/IRP2013 teams at Eskom, energy planning in Europe for large utilities
Robbie van Heerden • Senior Specialist: Energy Systems at the CSIR’s Energy Centre • Former General Manager and long-time head of System Operations at Eskom
Crescent Mushwana • Research Group Leader: Energy Systems at the CSIR’s Energy Centre • Former Chief Engineer at Eskom strategic transmission grid planning
Jarrad Wright • Principal Engineer: Energy Planning at the CSIR’s Energy Centre • Energy Commissioner in the National Planning Commission • Former Africa manager of PLEXOS (software package used for the IRP) 3

The Integrated Resource Plan (IRP) is the expansion plan for the South African power system until 2050
The IRP 2016 has a significant self-imposed limitation: The amount of wind and solar PV capacity that the model is allowed to build per year is limited, which is not technically/economically justified in the plan
The CSIR has therefore conducted a study to re-optimise the South African power mix until 2050 • First and most important deviation from IRP2016: no new-build limits on renewables (wind/solar PV) • Additional deviation: relative costing for solar PV and wind aligned with latest relative IPP tariff results
Two scenarios from the draft IRP 2016 are compared with the re-optimisation • “Draft IRP 2016 Base Case” – new coal, new nuclear • “Draft IRP 2016 Carbon Budget” – significant new nuclear • “CSIR Re-Optimised” – least-cost without constraints
An hourly capacity expansion and dispatch model (incl. unit commitment) using PLEXOS was run for all scenarios to test for technical adequacy à same software platform as IRP
4
Same software package as per the IRP was used to determine the least-cost expansion path of the South African power system to 2050
Sources: CSIR analysis

Proposal / Next Steps
5
Agenda
Expertise of Commentators
Comments on IRP Assumptions
IRP Results and Least-cost Scenario

6
BW4: 0.87-0.95
BW4: 0.69-0.80
Actual tariffs for new solar PV and wind are 40% cheaper than new baseload coal, whereas IRP 2016 assumes similar LCOE for all three
1.03
0.62 0.62
Wind IPP (Bid Window 4 Expedited)
Solar PV IPP (Bid Window 4 Expedited)
-40% -40%
Baseload Coal IPP (Bid Window 1)
Actual tariffs from RE IPP and Coal IPP Procurement Programme
Actual average new-build tariffs
in R/kWh (Apr-2016-Rand)
IRP 2016 cost input assumptions
IRP 2016 model input assumptions
in R/kWh (Apr-2016-Rand)
0.86 0.81 0.93
Solar PV
1.13 1.05
Wind
0.98
-7% +8%
Baseload Coal
Sources: South African Department of Energy IPP Office’s publications on results of IPP Bid Windows; IRP 2016 Draft; StatsSA on CPI; CSIR analysis

7
Actual tariffs for new solar PV and wind are 40% cheaper than new baseload coal, whereas IRP 2016 assumes similar LCOE for all three
1.03
0.62 0.62
2.02
-40% +95%
-40%
Actual average new-build tariffs
in R/kWh (Apr-2016-Rand)
Actual tariffs from RE IPP and Coal IPP Procurement Programme IRP 2016 cost input assumptions
0.86 0.81 0.93
2.34
-7% +8%
+171%
IRP 2016 model input assumptions
in R/kWh (Jan-2015-Rand)
Sources: South African Department of Energy IPP Office’s publications on results of IPP Bid Windows; IPP Office on Bid Window 4 expedited; StatsSA on CPI; CSIR analysis
Solar PV IPP (Bid Window
Wind IPP (Bid Window
Baseload Coal IPP
CSP IPP (Bid Window
Solar PV Wind Baseload Coal
CSP
4 Expedited) 4 Expedited) (Bid Window 1)
4 Expedited)

Actual coal tariff of Bid Window 1 is significantly above IRP 2010 assumptions and almost exactly on the Coal PF assumption of IRP 2016
1.03
0.25
0.75
0.50
1.00
Tariff in R/kWh (Apr-2016-Rand)
1.25
Assumptions: IRP2010 - Coal PF Assumptions: IRP2010 - Coal FBC Assumptions: IRP2016 - Coal FBC Assumptions: IRP2016 - Coal PF Actuals: Coal IPPPP (BW1)
0.00 2010 2012 2014 2016 2018 2020 2022 2024 2026 2028 2030
Assumptions: CPI used for normalisation to Apr-2016-Rand; LCOE calculated for IRP 2010 and 2013 with 8% discount rate (real), 30 yrs lifetime, cost and load factor assumptions as per relevant IRP document; LCOE for IRP 2016 straight from IRP document; “IRP Tariff” then calculated assuming 90% of total tariff to be LCOE EPC costs, i.e. divide the LCOE by 0.9 to derive at the “IRP Tariff” Sources: IRP 2010; IRP 2013; IRP 2016 draft as of November 2016; https://www.ipp-projects.co.za/Home/GetPressRelease?fileid=228bdd35-e18e-e611-9455- 2c59e59ac9cd&fileNam e=PressRelease-Coal-based-Independent-Power-Producer-program m e-announcem ent-10Oct2016.pdf; CSIR analysis
8
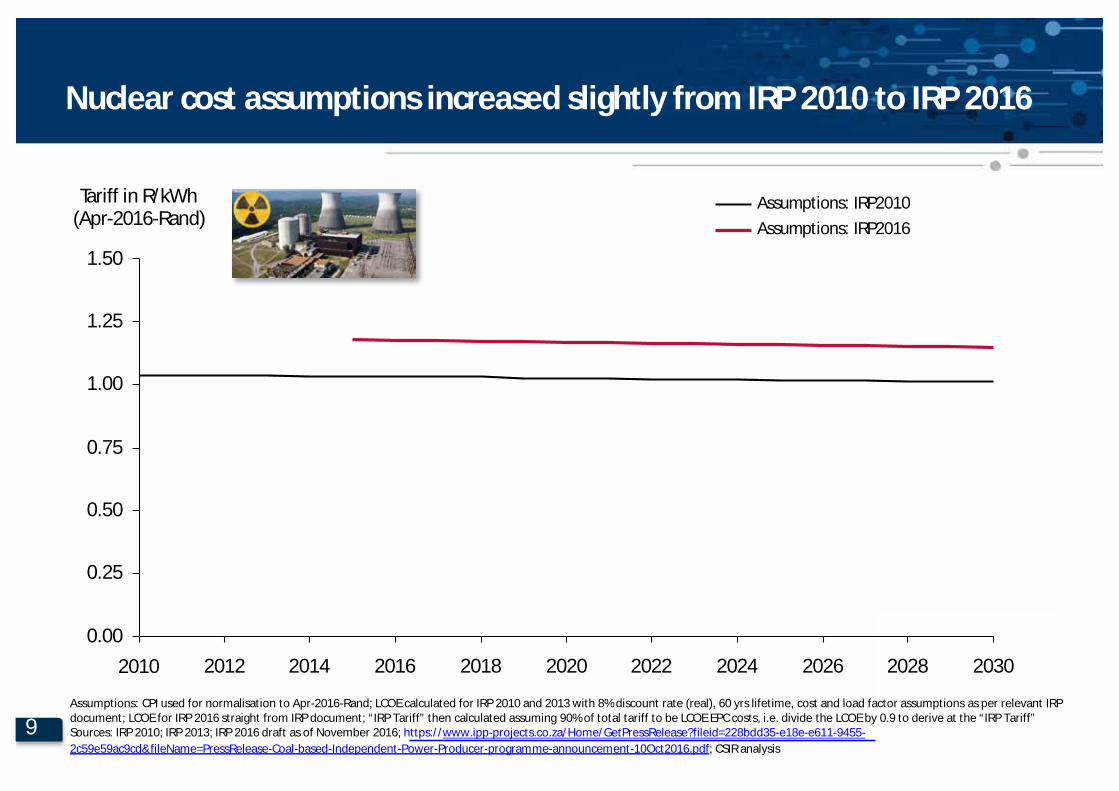
Nuclear cost assumptions increased slightly from IRP 2010 to IRP 2016
Tariff in R/kWh (Apr-2016-Rand)
1.50
1.25
1.00
0.75
0.50
0.25
Assumptions: IRP2010 Assumptions: IRP2016
0.00 2010 2012 2014 2016 2018 2020 2022 2024 2026 2028 2030
Assumptions: CPI used for normalisation to Apr-2016-Rand; LCOE calculated for IRP 2010 and 2013 with 8% discount rate (real), 60 yrs lifetime, cost and load factor assumptions as per relevant IRP document; LCOE for IRP 2016 straight from IRP document; “IRP Tariff” then calculated assuming 90% of total tariff to be LCOE EPC costs, i.e. divide the LCOE by 0.9 to derive at the “IRP Tariff” Sources: IRP 2010; IRP 2013; IRP 2016 draft as of November 2016; https://www.ipp-projects.co.za/Home/GetPressRelease?fileid=228bdd35-e18e-e611-9455- 2c59e59ac9cd&fileNam e=PressRelease-Coal-based-Independent-Power-Producer-program m e-announcem ent-10Oct2016.pdf; CSIR analysis
9

Actual solar PV tariffs quickly approached IRP 2010 assumptions in first four bid windows and are now well below cost assumption funnel
0.62
0.91
3.65
0.5
1.0
1.5
2.0
2.5
3.5
3.0
4.0
Tariff in R/kWh (Apr-2016-Rand)
1.17
2.18
Assumptions: IRP2010 - high Assumptions: IRP2010 - low Assumptions: IRP2016 - high Assumptions: IRP2016 - low Actuals: REIPPPP (BW1-4 Expedited)
0.0 2010 2012 2014 2016 2018 2020 2022 2024 2026 2028 2030
Assumptions: CPI used for normalisation to Apr-2016-Rand; LCOE calculated for IRP 2010 and 2013 with 8% discount rate (real), 25 yrs lifetime, cost and load factor assumptions as per relevant IRP document; LCOE for IRP 2016 straight from IRP document; “IRP Tariff” then calculated assuming 90% of total tariff to be LCOE EPC costs, i.e. divide the LCOE by 0.9 to derive at the “IRP Tariff” Sources: IRP 2010; IRP 2013; IRP 2016 draft as of November 2016; http://www.energy.gov.za/files/renewable-energy-status-report/Market-Overview-and-Current-Levels-of-Renewable-Energy- Deploym ent-NERSA.pdf; CSIR analysis
10

Actual wind tariffs in bid window four were below the level that was assumed for 2030 in IRP 2010, BW 4 Expedited is significantly below
0.62 0.50 0.25
1.19
0.75 0.75
Tariff in R/kWh (Apr-2016-Rand)
1.75
1.51 1.50
1.00 0.87
1.25
Assumptions: IRP2010 Assumptions: IRP2016
Actuals: REIPPPP (BW1-4 Expedited)
0.00 2010 2012 2014 2016 2018 2020 2022 2024 2026 2028 2030
Assumptions: CPI used for normalisation to Apr-2016-Rand; LCOE calculated for IRP 2010 and 2013 with 8% discount rate (real), 20 yrs lifetime, cost and load factor assumptions as per relevant IRP document; LCOE for IRP 2016 straight from IRP document; “IRP Tariff” then calculated assuming 90% of total tariff to be LCOE EPC costs, i.e. divide the LCOE by 0.9 to derive at the “IRP Tariff” Sources: IRP 2010; IRP 2013; IRP 2016 draft as of November 2016; http://www.energy.gov.za/files/renewable-energy-status-report/Market-Overview-and-Current-Levels-of-Renewable-Energy- Deploym ent-NERSA.pdf; CSIR analysis
11

Actual CSP tariffs are declining from bid window 1 to 4 Expedited, and are now close to the upper boundary of IRP 2013 cost assumptions
2.90 3.11
3.32 3.55
2.5 2.02
2.0
1.5
1.0
0.5
3.0
3.5
4.0
Tariff in R/kWh (Apr-2016-Rand)
Assumptions: IRP2010 - high Assumptions: IRP2010 - low Assumptions: IRP2016 - high Assumptions: IRP2016 - low Actuals: REIPPPP (BW1-4 Expedited)
Weighted average tariff for Bid Window 3, 3.5 and 4 Expedited calculated on the assumption of a 64%/36% split between base
and peak tariff energy
0.0 2010 2012 2014 2016 2018 2020 2022 2024 2026 2028 2030
Assumptions: CPI used for normalisation to Apr-2016-Rand; LCOE calculated for IRP 2010 and 2013 with 8% discount rate (real), 30 yrs lifetime, cost and load factor assumptions as per relevant IRP document; LCOE for IRP 2016 straight from IRP document; “IRP Tariff” then calculated assuming 90% of total tariff to be LCOE EPC costs, i.e. divide the LCOE by 0.9 to derive at the “IRP Tariff” Sources: IRP 2010; IRP 2013; IRP 2016 draft as of November 2016; http://www.energy.gov.za/files/renewable-energy-status-report/Market-Overview-and-Current-Levels-of-Renewable-Energy- Deploym ent-NERSA.pdf; CSIR analysis
12

IRP 2016 Solar PV cost assumptions relative to baseload coal much higher than in IRP 2010 – despite actual PV/coal ratio is much lower
100
50
+22% +43% +79%
Solar PV relative to baseload coal cost
400
350
300
250
200
150 Baseload
0
2010 2012 2014 2016 2018 2020 2022 2024 2026 2028 2030
BW1 à BW 4 (Expedited) Assumptions: CPI used for normalisation to Apr-2016-Rand; LCOE calculated for IRP 2010 and 2013 with 8% discount rate (real), 25 yrs lifetime, cost and load factor assum ptions as per relevant IRP document; LCOE for IRP 2016 straight from IRP document Sources: IRP 2010; IRP 2013; IRP 2016 draft as of November 2016; http://www.energy.gov.za/files/renewable-energy-status- report/M arket-Overview-and-Current-Levels-of-Renewable-Energy-Deploym ent-NERSA.pdf; CSIR analysis
13
Assumptions: IRP2010 Assumptions: IRP2016
Actuals: REIPPPP relative to Coal IPPPP
Coal = 100

IRP 2016 wind cost assumptions relative to baseload coal lower than in IRP 2010 – but actual ratios from IPP Programmes being even lower
50
+40% +40% +55%
Baseload Coal 100 = 100
0 2010 2012 2014 2016 2018 2020 2022 2024 2026 2028 2030
BW1 à BW 4 (Expedited) Assumptions: CPI used for normalisation to Apr-2016-Rand; LCOE calculated for IRP 2010 and 2013 with 8% discount rate (real), 20 yrs lifetime, cost and load factor assum ptions as per relevant IRP document; LCOE for IRP 2016 straight from IRP document Sources: IRP 2010; IRP 2013; IRP 2016 draft as of November 2016; http://www.energy.gov.za/files/renewable-energy-status- report/M arket-Overview-and-Current-Levels-of-Renewable-Energy-Deploym ent-NERSA.pdf; CSIR analysis
14
Wind relative to baseload coal cost
150
Assumptions: IRP2010 Assumptions: IRP2016
Actuals: REIPPPP relative to Coal IPPPP

IRP 2016 CSP cost assumptions relative to baseload coal higher than in IRP 2010 – actual ratios from IPP Programmes lie between IRP2010/16
50
100
200
150 Baseload
250
CSP relative to baseload coal cost
350
300
+8%
+38%
Assumptions: IRP2010 Assumptions: IRP2016
Actuals: REIPPPP relative to Coal IPPPP
Coal = 100
0 2010 2012 2014 2016 2018 2020 2022 2024 2026 2028 2030
BW1 à BW 4 (Expedited) Assumptions: CPI used for normalisation to Apr-2016-Rand; LCOE calculated for IRP 2010 and 2013 with 8% discount rate (real), 25 yrs lifetime, cost and load factor assum ptions as per relevant IRP document; LCOE for IRP 2016 straight from IRP document Sources: IRP 2010; IRP 2013; IRP 2016 draft as of November 2016; http://www.energy.gov.za/files/renewable-energy-status- report/M arket-Overview-and-Current-Levels-of-Renewable-Energy-Deploym ent-NERSA.pdf; CSIR analysis
15

IRP 2016 Solar PV cost assumptions relative to nuclear much higher than in IRP 2010
0
20
40
60
80
Nuclear 100
Assumptions: CPI used for normalisation to Apr-2016-Rand; LCOE calculated for IRP 2010 and 2013 with 8% discount rate (real), 25 yrs lifetime, cost and load factor assum ptions as per relevant IRP document; LCOE for IRP 2016 straight from IRP document Sources: IRP 2010; IRP 2013; IRP 2016 draft as of November 2016; http://www.energy.gov.za/files/renewable-energy-status- report/M arket-Overview-and-Current-Levels-of-Renewable-Energy-Deploym ent-NERSA.pdf; CSIR analysis
16
120
140
2010 2012 2014 2016 2018 2020 2022 2024 2026 2028 2030
Solar PV relative to nuclear cost Assumptions: IRP2010
Assumptions: IRP2016
= 100

IRP 2016 wind cost assumptions relative to nuclear kept constant compared to IRP 2010
0
20
40
60
80
100
2010 2012 2014 2016 2018 2020 2022 2024 2026 2028 2030
Wind relative to nuclear cost
Assumptions: IRP2010 Assumptions: IRP2016
Nuclear = 100
Assumptions: CPI used for normalisation to Apr-2016-Rand; LCOE calculated for IRP 2010 and 2013 with 8% discount rate (real), 20 yrs lifetime, cost and load factor assum ptions as per relevant IRP document; LCOE for IRP 2016 straight from IRP document Sources: IRP 2010; IRP 2013; IRP 2016 draft as of November 2016; http://www.energy.gov.za/files/renewable-energy-status- report/M arket-Overview-and-Current-Levels-of-Renewable-Energy-Deploym ent-NERSA.pdf; CSIR analysis
17

IRP 2016 CSP cost assumptions relative to nuclear significantly higher than in IRP 2010
0
Nuclear = 100 100
200
300
2010 2012 2014 2016 2018 2020 2022 2024 2026 2028 2030
Wind relative to nuclear cost
Assumptions: IRP2010 Assumptions: IRP2016
Assumptions: CPI used for normalisation to Apr-2016-Rand; LCOE calculated for IRP 2010 and 2013 with 8% discount rate (real), 20 yrs lifetime, cost and load factor assum ptions as per relevant IRP document; LCOE for IRP 2016 straight from IRP document Sources: IRP 2010; IRP 2013; IRP 2016 draft as of November 2016; http://www.energy.gov.za/files/renewable-energy-status- report/M arket-Overview-and-Current-Levels-of-Renewable-Energy-Deploym ent-NERSA.pdf; CSIR analysis
18

Logic to derive “IRP Tariff” curves
19 Sources: CSIR analysis
Calculate the IRP LCOE path for each technology based on • Cost development path for CAPEX in R/kW and for O&M in R/kW/yr as per IRP 2010 / IRP 2013 • Discount rate of 8% • Lifetime of 25/20/30 years for PV/wind/CSP • Load factors as per the profiles used in IRP 2010 / IRP 2013 • For IRP 2016, use straight the reported LCOE (i.e. without own LCOE calculation)
Adjust all resulting IRP LCOE numbers to Apr 2016 via CPI table • http://www.statssa.gov.za/keyindicators/CPI/CPIHistory.pdf
Translate all Apr-2016-based IRP LCOE numbers into an “IRP Tariff” • The IRP-assumed costs (CAPEX and O&M) reflect only the costs within the battery limit of the EPC contract. Owner’s
development costs (ODCs) and grid connection costs are not considered • Assume that for an IPP the pure EPC CAPEX plus O&M stands for 90% of the total costs that lead to the tariff • Therefore, divide “IRP LCOE” numbers by 90% to derive at the “IRP Tariff” • This tariff is logically comparable to the tariffs that IPPs bid for in the REIPPPP

IRP 2016: Annual new-build limits for solar PV and wind are constant in absolute terms but decrease relative to the size of the power system
The imposed new-build limits for solar PV and wind mean that the IRP model is not allowed in any given year to add more Solar PV and Wind capacity to the system than these limits
No such limits are applied for any other technology. No technical justification is provided for these limits. No explanation is given why these limits are constant over a 30-year period while the power system grows.
20 Note: Relative new-build limit = New-build limit / system peak load Sources: IRP 2016 Draft; CSIR analysis
Year System Peak Load in MW
New-build limit Solar PV in MW/yr
Relative new-build limit Solar PV
New-build imit Wind in MW/yr
Relative new-build limit Wind
2020 44 916 1 000 2.2% 1 600 3.6%
2025 51 015 1 000 2.0% 1 600 3.1%
2030 57 274 1 000 1.7% 1 600 2.8%
2035 64 169 1 000 1.6% 1 600 2.5%
2040 70 777 1 000 1.4% 1 600 2.3%
2045 78 263 1 000 1.3% 1 600 2.0%
2050 85 804 1 000 1.2% 1 600 1.9%

To day: Both leading and follower countries install much more new solar PV capacity per year than what South Africa’s limit is in 2030
2%
3%
4%
10% 9% 9%
5%
2%
4%
2%
4%
1% 1% 1%
3% 3%
7%
4%
1%
0%
6%
3% 3%
2%
1%
0% 0% 0%
1% 0%
7%
6%
4%
1% 1% 1% 1% 0% 0%
2%
2% 2%
1% 0% 0% 0%
0% 0%
1% 1%
1% 0% 0% 0%
2%
2007
3%
0%
2014
0%
3%
2008
0% 0%
2013
2%
0%
2012
2%
1%
2011
17%
3%
2010
0%
1%
2009
2030 (1.7%) 2050 (1.2%)
2015
Germany Spain Italy UK Australia Japan China India South Africa
Annual new solar PV capacity relative to system peak load
RSA’s IRP relative new-build limit
decreases over time
Leader
Follower
Follower 2 wave nd
RSA new-build limits in 2030 and 2050
21 Sources: SolarPowerEurope; CIGRE; websites of System Operators; IRP 2016 Draft; CSIR analysis

To day: Both leading and follower countries install much more new wind capacity per year than what South Africa’s limit is in 2050
7%
6%
4%
3%
0%
2015
0%
2014
0%
2013 2012 2007 2006 2011
2% 2%
2010
2% 2% 2%
2% 2% 2% 2%
3% 3% 3%
6% 6%
3% 4%
5% 5%
7%
3%
4% 5%
5%
4%
4%
3%
3% 4%
3%
2%
1%
2% 2%
5% 4%
2% 2%
2%
1% 1% 0%
0% 0% 0%
1%
1%
2009 2008
RSA’s IRP relative new-build limit
decreases over time
2030 (2.8%)
2050 (1.9%) 2% 1% 1%
0%
2%
1% 1%
8%
1%
Germany Spain Ireland China India Brazil South Africa
Annual new wind capacity relative to system peak load
Leader
RSA new-build limits in 2030 and 2050 Follower
22 Sources: GWEC; CIGRE; websites of System Operators; IRP 2016 Draft; CSIR analysis

To day: Solar PV penetration in leading countries 2.5 times RSA’s plan for 2050 – follower countries already today almost at RSA’s 2050 level
10%
20%
30%
40%
50%
Tota
l sol
ar P
V ca
paci
ty
rela
tive
to sy
stem
pea
k lo
ad
Germany Spain Italy UK Australia Japan China India South Africa South Africa IRP 2016 Base Case
Leader
Follower
Follower 2nd wave
0% 2005 2010 2015 2020 2025 2030 2035 2040 2045 2050
23 Year Sources: SolarPowerEurope; CIGRE; websites of System Operators; IRP 2016 Draft; CSIR analysis
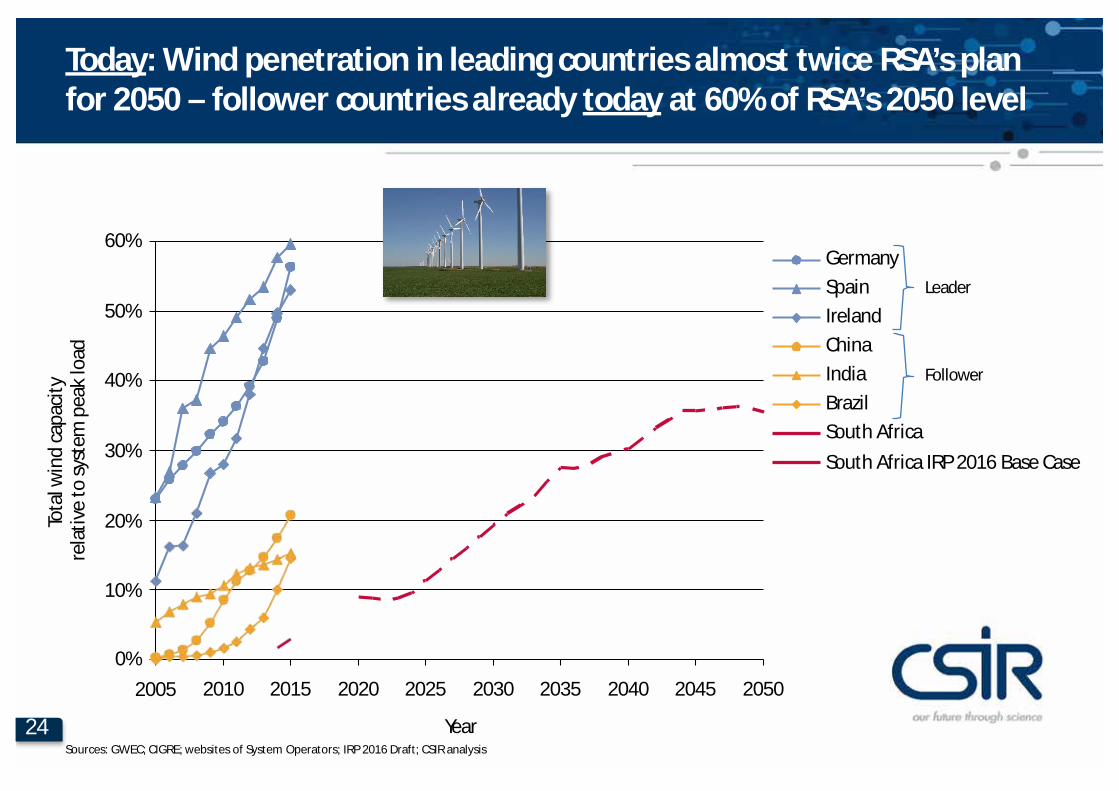
To day: Wind penetration in leading countries almost twice RSA’s plan for 2050 – follower countries already today at 60% of RSA’s 2050 level
60% 50% 40% 30% 20% 10%
Tota
l win
d ca
paci
ty
rela
tive
to sy
stem
pea
k lo
ad
Germany Spain Ireland China India Brazil South Africa South Africa IRP 2016 Base Case
Leader
0% 2005 2010 2015 2020 2025 2030 2035 2040 2045 2050
24 Year Sources: GWEC; CIGRE; websites of System Operators; IRP 2016 Draft; CSIR analysis
Follower

Proposal / Next Steps
25
Agenda
Expertise of Commentators
Comments on IRP Assumptions
IRP Results and Least-cost Scenario

26
The CSIR conducted a Wind and Solar PV Resource Aggregation Study
CSIR, SANEDI, Eskom and Fraunhofer IWES conducted a joint study to holistically quantify • the wind-power potential in South Africa and • the portfolio effects of widespread spatial wind and solar power aggregation in South Africa
Wind Atlas South Africa (WASA) data was used to simulate wind power across South Africa
Solar Radiation Data (SoDa) was used to simulate solar PV power across South Africa
Output: Simulated time-synchronous solar PV and wind power production time-series
• 5 km x 5 km spatial resolution • Almost 50,000 pixels covering entire South Africa • 15-minute temporal resolution • 5 years temporal coverage (2009-2013)
Sources: www.csir.co.za/Energy_Centre/wind_solarpv.htm l

A single wind farm changes its power output quickly Simulated wind-speed profile and wind power output for 14 January 2012
27

Aggregating 100 wind farms: 15-min gradients almost zero Simulated wind-speed profile and wind power output for 14 January 2012
28

Space requirement 0.1km²/MW à max. 250 MW per pixel
Five different generic wind turbine types defined for simulation of wind power output per 5x5 km pixel in South Africa (~50 000 pixels)
High-wind-speed turbine
29
Low-wind-speed turbine
Turbine type no. 1 2 3 4 5 Nominal power [MW] 3 2.2 2.4 2.4 2.4
Selection criterion
Blade diameter [m] 90 95 117 117 117
Hub height [m] 80 80 100 120 140

On almost 70% of suitable land area in South Africa a 35% capacity factor or higher can be achieved (>50% for turbines 1-3) Share of South African land mass less exclusion zones with capacity factors to be reached accordingly
à Installing turbine type 4 and 5 will cause higher costs but also increase capacity factors and electricity yield whilst consuming the same area
0.05 0.1 0.15 0.2 0.25 0.3 Load fac tor
0.35 0.4 0.45 0.5 0
10
20
30
40
12 50
60
70
80
90
100
Per
cent
age
of S
outh
Afr
ican
land
mas
s le
ss e
xclu
sion
zo
nes
Turbine types 1-5 Turbine types 1-3
0
2
4
6
8
10
14
16
18
20
Ele
ctric
ity g
ener
ated
per
yea
r [10
00
TWh]
0
1000
2000
3000
4000
5000
6000
30
Inst
alla
ble
capa
city
[G
W]

Demand grows, existing fleet phases out – gap needs to be filled Forecasted supply and demand balance for the South African electricity system from 2016 to 2040
500 450 400 350 300 250 200 150 100
50
Electricity in TWh/yr
4732
3661
288
Other (incl. cogen) Gas (CCGT) Hydro (incl. PS) Nuclear
Supply gap Solar PV CSP Wind Other RE Peaking
Decommissioning of Eskom’s coal fleet Coal
0 2016 2020 2025 2030 2035 2040
31 Notes: MTSAO demand forecasts are extrapolated from 2025 to 2040 using CAGR; IRP 2016 under development is using High Growth Low Intensity (CSIR) demand forecast as base case. 1. Peak demand = 53.2 GW 2. Peak demand = 68.7 GW Sources: DoE (IRP 2010); DoE (IRP 2013); Eskom MTSAO 2016-2021; StatsSA; World Bank; CSIR analysis
All power plants considered for “existing fleet” that are either: 1) Existing in 2016 2) Under construction 3) Procured (preferred bidder)

Two scenarios defined to fill the supply/demand gap until 2040 Forecasted supply and demand balance for the South African electricity system from 2016 to 2040
500 450 400 350 300 250 200 150 100
50
3661
4732
Electricity in TWh/yr
288
Other (incl. cogen) •
Gas (CCGT) Hydro (incl. PS) Nuclear
Supply gap Solar PV CSP Wind Other RE Peaking
1
2
1 Scenario: “Business-as-Usual”
2 Scenario: “Re-Optimised”
• Generally aligned with IRP 2010, but demand shifted
• Nuclear as per briefing to Portfolio Committee on Energy (11 October 2016)
• New coal, nuclear, some RE • New capacities fixed as per
IRP 2010 (no optimisation)
• Coal, nuclear, gas, RE are all available as supply options Supply candidates chosen by least cost optimisation to meet energy and capacity requirement
IRP 2010
Coal 0 2016 2020 2025 2030 2035 2040
32 Notes: MTSAO demand forecasts are extrapolated from 2025 to 2040 using CAGR; IRP 2016 under development is using High Growth Low Intensity (CSIR) demand forecast as base case. 1. Peak demand = 53.2 GW 2. Peak demand = 68.7 GW Sources: DoE (IRP 2010); DoE (IRP 2013); Eskom MTSAO 2016-2021; StatsSA; World Bank; CSIR analysis

33
Actual tariffs: new renewables projects much cheaper than first ones First four Bid Windows’ results of Department of Energy’s RE IPP Procurement Programme (REIPPPP)
2.02
2.90 3.11 200 MW
3.32
0.62
1.17
417 MW 2.18
3.65
0.62 0.87
1.19 559 MW
1.51 649 MW
0.0
0.5
1.0
1.5
2.0
2.5
3.0
3.5
4.0
0.69-0.79 676 + 686 MW
415 + 398 MW
0.87-0.95
Bid Window 3 (19 Aug 2013)
Bid Window 2 (5 Mar 2012)
Bid Window 1 (4 Nov 2011)
Bid Window 4 Expedited
(11 Nov 2015)
Bid Window 4 + additional (18 Aug 2014)
Average tariff in R/kWh
(Apr-2016-R)
627 MW
3.55
Bid sub-
mission dates
∑ = 2.8 GW
∑ = 4.0 GW 787 MW
435 MW
150 MW
50 MW
CSP PV
Wind
∑ = 1.2 GW
Notes: For CSP Bid Window 3, 3.5 and 4 Expedited, the weighted average of base and peak tariff is indicated, assuming 64%/36% split between base and peak tariff; BW = Bid Window; Sources:
200 MW (BW 3.5)
Department of Energy’s publications on results of first four bidding windows http://www.energy.gov.za/files/renewable-energy-status-report/Market-Overview-and-Current-Levels-of- Renewable-Energy-Deploym ent-NERSA.pdf; IPP Office on BW4 Expedited; StatsSA on CPI; CSIR analysis
520 MW
650 MW
450 MW

34
2.40
R/kWh (Apr-2016-R)
3.10
1.24 1.51
1.17 1.05-1.16 1.03
Bid Window 1
Bid Window 1
Key input cost assumptions for new supply technologies
Actual new-build tariffs
Assumptions based new-build cost
82% 92% 50% 50% 10% 10% Typical capacity factor2 à
Lifetime cost per energy unit1
1 Lifetime cost per energy unit is only presented for brevity. The model inherently includes the specific cost structures of each technology i.e. capex, Fixed O&M, variable O&M, fuel costs etc. 2 Changing full-load hours for conventional new-build options drastically changes the fixed cost components per kWh (lower full-load hours à higher capital costs and fixed O&M costs per kWh);
0.62 0.62
High-priced gas
Assumptions: Average efficiency for CCGT = 55%, OCGT = 35%; nuclear = 33%; IRP costs from Jan-2012 escalated to May-2016 with CPI; assumed EPC CAPEX inflated by 10% to convert EPC/LCOE into tariff; Sources: IRP 2013 Update; Doe IPP Office; StatsSA for CPI; Eskom financial reports for coal/diesel fuel cost; EE Publishers for Medupi/Kusile; Rosatom for nuclear capex; CSIR analysis
at 150 R/GJ
Solar PV Wind Baseload Baseload Nuclear Gas (CCGT) Mid-merit Coal Gas (OCGT) Diesel (OCGT)
Coal (IPP) Coal (Eskom)

Future cost assumptions for solar PV aligned with IRP 2010
0.62
3.65
0.5
1.0
1.5
2.0
2.5
3.0
3.5
4.0
Tariff in R/kWh (Apr-2016-Rand)
1.17 0.91
0.49 0.49
2.18
Assumptions: IRP2010 - high Assumptions: IRP2010 - low Assumptions for this study Actuals: REIPPPP (BW1-4Exp)
∑ = 2.8 GW
0.0 2010 2012 2014 2016 2018 2020 2022 2024 2026 2028 2030 2032 2034 2036 2038 2040
Year BW1 à BW 4 (Expedited) 35 Notes: REIPPPP = Renewable Energy Independant Power Producer Programme; BW = Bid Window; bid submissions for the different BWs: BW1 = Nov 2011; BW2 = Mar 2012; BW 3 = Aug 2013;
BW 4 = Aug 2014; BW 4 (Expedited) = Nov 2015 Sources: StatsSA for CPI; IRP 2010; South African Department of Energy (DoE); DoE IPP Office; CSIR analysis

Future cost assumptions for wind aligned with results of Bid Window 4
0.62 0.62
0.62
0.69 0.87
1.19
1.52
0.5
1.0
1.5
2.0
Tariff in R/kWh (Apr-2016-Rand)
Assumptions: IRP2010 Assumptions for this study Actuals: REIPPPP (BW1-4Exp) ∑ = 4.0 GW
0.0 2010 2012 2014 2016 2018 2020 2022 2024 2026 2028 2030 2032 2034 2036 2038 2040
Year BW1 à BW 4 (Expedited) 36 Notes: REIPPPP = Renewable Energy Independant Power Producer Programme; BW = Bid Window; bid submissions for the different BWs: BW1 = Nov 2011; BW2 = Mar 2012; BW 3 = Aug 2013;
BW 4 = Aug 2014; BW 4 (Expedited) = Nov 2015 Sources: StatsSA for CPI; IRP 2010; South African Department of Energy (DoE); DoE IPP Office; CSIR analysis

Actual CSP tariffs are declining from bid window 1 to 4 Expedited, and are now close to the upper boundary of IRP 2013 cost assumptions
1.20 1.20
2.90 3.11
3.55
1.0
0.5
1.5
2.5 2.02
2.0
3.0
3.5
4.0
Tariff in R/kWh (Apr-2016-Rand)
3.32
Assumptions: IRP2010 - high Assumptions: IRP2010 - low Assumptions for this study Actuals: REIPPPP (BW1-4Exp)
For bid window 3, 3.5 and 4 Exp, weighted average tariff of base
and peak tariff calculated on the assumption of 64%/36%
base/peak tariff utilisation ratio
0.0 2010 2012 2014 2016 2018 2020 2022 2024 2026 2028 2030 2032 2034 2036 2038 2040
Year BW1 à BW 4 (Expedited) 37 Notes: REIPPPP = Renewable Energy Independant Power Producer Programme; BW = Bid Window; bid submissions for the different BWs: BW1 = Nov 2011; BW2 = Mar 2012; BW 3 = Aug 2013;
BW 4 = Aug 2014; BW 4 (Expedited) = Nov 2015 Sources: StatsSA for CPI; IRP 2010; South African Department of Energy (DoE); DoE IPP Office; CSIR analysis

250 250
200
150
100
50
0 2010 2015 2020 2025 2030 2035 2040
CO2 cap implemented as a hard constraint into the model (i.e. must not be exceeded) Only in post-processing to calculate cost of CO2, cost of 120 R/t assumed
PPD = Peak Plateau Decline Sources: DoE (IRP 2010-2030 Update); StatsSA; CSIR analysis
38
275 275 300
CO2 emissions (electricity sector) [Mt/yr]
CO2 emissions constrained by RSA’s Peak-Plateau-Decline objective PPD that constrains CO2 emission from electricity sector

Least-cost “CSIR Re-Optimised” case is largely based on wind and PV
Draft IRP 2016 Base Case CSIR Re-Optimised Draft IRP 2016 Carbon Budget
550
500
450
400
350
300
250
200
150
100
50
0
33 (6%)
165 (32%)
2040
39 (7%)
28 (5%) 93 (18%)
523
15
Total electricity produced in TWh/yr
431
229
35
159 (30%)
34 33
66
2050 2030
344
235
13 23
22
13
2016
248
207
17
36
Wind
2040 2050
Gas (CCGT) Nuclear Solar PV
550
500
450
400
350
300
250
200
150
100
50
0
345
161
433
2030
103
44 (8%)
85
33
134
109 (21%)
17
39
29
Total electricity produced in TWh/yr
15
35 (7%)
206 (39%)
63 (12%)
525
207
23
248
2016
23
63
57
63 (12%)
550
500
450
400
350
300
250
200
150
100
50
0
9 16 15
83
433
2040
130 (25%)
22
87
189 282 (54%)
44 (8%)
2050
49
22 15
527
15
Total electricity produced in TWh/yr
20 (4%) 36 (7%)
346
2030
17
207
248
2016
35
212
As per Draft IRP 2016
More stringent carbon limits
39 CSP Peaking Hydro+PS Coal Sources: CSIR analysis
No RE limits

In the CSIR Re-Optimised case, 100 GW of wind & 60 GW of PV by 2050
Draft IRP 2016 Base Case CSIR Re-Optimised Draft IRP 2016 Carbon Budget
250
200
150
100
50
0 2050
135
25
20 8
22 13
30
16
2040
111
33 5 8
17 12 21 12
2030
85
39
2 6 8
11 7
2016
51
37
5 3
Total installed net capacity in GW
Nuclear
2040 2050
Gas (CCGT) Wind Solar PV
250
0
200
150
100
50
Total installed net capacity in GW
149
10 26
8 8 8
33
10
36
25 129
19 17
19
34
22
2030
98
34 7 8
10 20 13
2016
51
37
5 3
100
0
50
250
150
200
60
52
2016 2030 2040
Plus 25 GW demand response from warm
100
31
34
2050
5 10 18
237
Total installed net capacity in GW
7
178
19 2 5
73
5 37
2
19
22
93
51 5 3
37
16
As per Draft IRP 2016
More stringent carbon limits
No RE limits
40 water provision CSP Peaking Hydro+PS Coal Sources: CSIR analysis

CSP sensitivity: CSP < 1.4 R/kWh and at 20% CF is cost competitive Comparison of energy supply for Re-Optimised base scenario and Re-Optimised with low CSP cost
CSIR Re-Optimised (base) Re-Optimised, CSP Sensitivity
550
500
450
400
350
300
250
200
150
100
50
0
527
2050
Total electricity produced in TWh/yr
346
83
130 (25%)
2040
433
15
212
282 (54%)
44 (8%) 20 (4%)
49
35
2016
248
207
15 17
9 16 15
22
36 (7%)
22
2030
87
189
550
500
450
400
350
300
250
200
150
100
50
0
15 17
0 0 0 0
0 0 0
2016
248
207
260 (49%)
14 (3%)
Total electricity produced in TWh/yr
40 (8%)
2040
20 (4%)
0
2030
527
2050
36 (7%)
143 (27%)
WIP
41 Sources: CSIR analysis

CSP sensitivity: CSP < 1.4 R/kWh and at 20% CF is cost competitive Comparison of energy supply for Re-Optimised base scenario and Re-Optimised with low CSP cost
CSIR Re-Optimised (base)
Total installed net capacity in GW
WIP
100
150
0
50
2050
5 10 18
37
93
2040
19 2
31 5
2030
34 2
52
60 100
5
37
51
2016
19 16 22
5 7 3
150
50
0
100
2040
0 0 0 0
0 0
2016
5
2050
0 0 0
0 0
2030
Re-Optimised, CSP Sensitivity
Total installed net capacity in GW
242
80
8
85
51
250
200
237
73 178
200
250
3
10 5 16
37
37
42 Sources: CSIR analysis

CSP sensitivity: CSP < 0.9 R/kWh and at 60% CF is cost competitive Comparison of energy supply for Re-Optimised base scenario and Re-Optimised with low CSP cost
CSIR Re-Optimised (base) Re-Optimised, CSP Sensitivity
550
500
450
400
350
300
250
200
150
100
50
0
9 16 15
189 15
17
Total electricity produced in TWh/yr
20 (4%)
87
2030
346
212
15 22
49
35
2016
44 (8%)
207
282 (54%)
130 (25%)
2040
433
248
83
22
2050
527
36 (7%)
550
500
450
400
350
300
250
200
150
100
50
0
2050
527
34 (6%)
19 (4%)
0 0 0
Total electricity produced in TWh/yr
2040
0 0 0
34 (6%)
248
207
15 17
2016
228 (43%)
137 (26%)
60 (11%)
0
2030
0
WIP
43 Sources: CSIR analysis

CSP sensitivity: CSP < 0.9 R/kWh and at 60% CF is cost competitive Comparison of energy supply for Re-Optimised base scenario and Re-Optimised with low CSP cost
CSIR Re-Optimised (base)
Total installed net capacity in GW
WIP
100
150
0
50
2050
5 10 18
37
93
2040
19 2
31 5
2030
34 2
52
60 100
5
37
51
2016
19 16 22
5 7 3
150
50
0
100
2040
0 0 0 0
0 0
2016
5
2050
0 0 0
0 0
2030
Re-Optimised, CSP Sensitivity
Total installed net capacity in GW
232
77
11
74
51
250
200
237
73 178
200
250
3
10 5 13
42
37
44 Sources: CSIR analysis

45
CSP sensitivity: CSP cost below 1.4 R/kWh makes it a gas fuel saver
Two pre-conditions for CSP to be a cost-efficient contributor in the energy mix in 2050 • 1) CSP cost below 1.4 R/kWh @ 20% CF à today RSA: 2.0 R/kWh @ 50-60% CF, or • 2) CSP cost below 0.9 R/kWh @ 60% CF à today RSA: 2.0 R/kWh @ 50-60% CF • CSP fully dispatchable within a certain daily energy budget (i.e. CSP energy budget can be distributed by
the System Operator as required into the 24 hours of the day, within the maximum of installed capacity)
If these two conditions are met, then CSP can play the role of a gas fuel saver and displaces wind in 2050
34 0 34
228
60
137
CSIR Re- CSP CSP Optimised Sensitivity Sensitivity
(20% CF) (60% CF)
36 0
Electricity supplied in 2050 in TWh/yr
40
260
14 143
36 0
44
282
0 130
Installed net capacity in 2050 in GW
CSIR Re- CSP CSP Optimised Sensitivity Sensitivity
(20% CF) (60% CF)
232
13 10
80
237
18 10
11
242
16 10
37
85 8
Solar PV CSP Wind Other Peaking Gas (CCGT) Hydro+PS Nuclear Coal
73
0 93
37
77
74
42

80
20
40
60
100
Demand and Supply in GW
IRP 2016 (DRAFT): CSIR Re-Optimised in 2050 CSP 20% CF
Example Week under CSIR Re-Optimised 2050
0
Monday Solar PV
Wind
CSP
Tuesday
CCGT
Other (RE)
Wednesday Coal
Nuclear
Thursday Friday Saturday Sunday DR
OCGT
Hydro, PS
Demand
Demand +PS (charging)
Demand + PS (charging) + DR Other (incl. cogeneration)
46 Sources: CSIR analysis

20
80
100
40
60
Demand and Supply in GW
IRP 2016 (DRAFT): CSIR Re-Optimised in 2050 CSP 60% CF
Example Week under CSIR Re-Optimised 2050
0
Monday Solar PV
Wind
CSP
Tuesday
CCGT
Other (RE)
Wednesday Coal
Nuclear
Thursday Friday Saturday Sunday DR
OCGT
Hydro, PS
Demand
Demand +PS (charging)
Demand + PS (charging) + DR Other (incl. cogeneration)
47 Sources: CSIR analysis

40
20
80
60
100
Demand and Supply in GW
IRP 2016 (DRAFT): CSIR Re-Optimised in 2050 CSP 90% CF
Example Week under CSIR Re-Optimised 2050
0
Monday Solar PV
Wind
CSP
Tuesday Wednesday Thursday Friday Saturday Sunday
OCGT Hydro, PS
CCGT
Other (RE)
Other (incl. cogeneration)
Coal
Nuclear
Demand
Demand +PS (charging)
Demand + PS (charging) + DR
DR 48 Sources: CSIR analysis

CSIR Re-Optimised case without renewables limits is R90 billion/yr cheaper than both IRP 2016 Base Case & IRP 2016 Carbon Budget case
Draft IRP 2016 Base Case CSIR Re-Optimised Draft IRP 2016 Carbon Budget
R580 billion/yr R490 billion/yr
100 Mt/yr 70 Mt/yr
16 bn l/yr 11 bn l/yr
R580 billion/yr
200 Mt/yr
40 bn l/yr
27% 33% 80%
49 Sources: CSIR analysis

Tipping point cost for CSP depends on annual average CF
1.600 1.400 1.200 1.000 0.800 0.600 0.400 0.200
- 0% 10% 20% 30% 40% 50%
Capacity factor 60% 70% 80% 90% 100%
LCO
E (R
/kW
h)
50

Agenda
51
Expertise of Commentators
Comments on IRP Assumptions
IRP Results and Least-cost Scenario
Proposal / Next Steps

52 Sources: CSIR analysis
Recommendation: The IRP Base Case should be least-cost, free of any artificial constraints
Solar PV, wind and flexibility is the cheapest new-build mix for the South African power system and it is the cost-optimal expansion to aim for a >70% renewable energy share by 2050
This “CSIR Re-Optimised” mix is R90 billion per year cheaper by 2050 than current Draft IRP Base Case
Also, CSIR Re-Optimised mix reduces CO2 emissions by 65% (-130 Mt/yr) compared to Draft IRP Base Case
Avoiding CO2 emissions and least-cost is not a trade-off anymore – South Africa can de-carbonise its electricity sector at negative carbon-avoidance cost
Recommendation: The IRP Base Case should be least-cost, free of any artificial constraints • New-build limits for renewables should be lifted, relative costs of wind/PV updated, and the
unconstrained re-run should form the Base Case of the IRP 2016 • Any cost increase due to deviations from the least-cost Base Case should be reported on
Note: Wind and solar PV would have to be 60% more expensive than assumed before the IRP Base Case and the CSIR Re-Optimised case break even

53 Note: „Thank you“ in all official languages of the Republic of South Africa
Thank you Re a leboga
Ro livhuha
Siyathokoza Enkosi
Siyabonga
Re a leboha Ha Khensa
Dankie

54
BACKUP
55
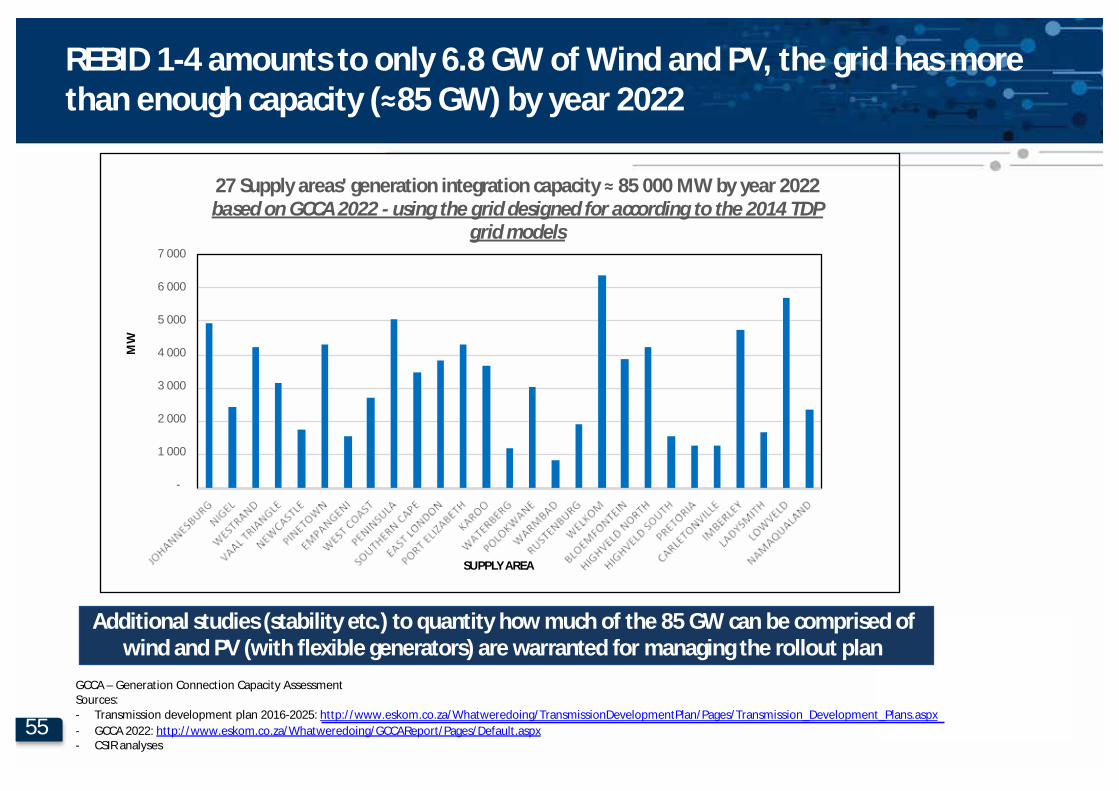
REBID 1-4 amounts to only 6.8 GW of Wind and PV, the grid has more than enough capacity (≈85 GW) by year 2022
GCCA – Generation Connection Capacity Assessment Sources: - Transmission development plan 2016-2025: http://www.eskom.co.za/Whatweredoing/TransmissionDevelopmentPlan/Pages/Transmission_Development_Plans.aspx - GCCA 2022: http://www.eskom .co.za/Whatweredoing/GCCAReport/Pages/Default.aspx
7 000 6 000 5 000 4 000 3 000 2 000 1 000
-
27 Supply areas' generation integration capacity ≈ 85 000 MW by year 2022 based on GCCA 2022 - using the grid designed for according to the 2014 TDP
grid models
MW
SUPPLY AREA
Additional studies (stability etc.) to quantity how much of the 85 GW can be comprised of wind and PV (with flexible generators) are warranted for managing the rollout plan
- CSIR analyses

56
Lack of location-based incentives for IPPs leads to interest in substations that are already constrained (e.g. RE Bid 4 Expedited)
Proactive planning (location-based IPP programme) can derisk projects and lead to early grid connection and higher allocations
For Bid Window 4 Expedited, only 1170 MW was allocated for wind (650 MW) and PV (520 MW); more could have been allocated
- CSIR analysis
Sources: - Eskom Transmission Grid Planning - Expedited Bid Window Programme Access Risk Assessment
Low risk: Capacity available
Medium risk: Minimal grid infrastructure required
High risk: Extensive grid infrastructure required at Tx level

57
Grid assessment/information to accompany the formal submission – all to be based publicly available information and data sets
• Grid capacity available at all busbars (66/88/132/275/400 kV) in
transmission substations after RE Bid Windows 1-4
• Wind and solar PV correlation/aggregation impact on grid capacity
assessment
• Location of wind and PV plants for the least-cost optimised electricity
generation mix by 2050
• The estimated grid cost for the integration of new generation capacity for
each scenario studies
• High-level assessment of the variable RE penetration levels for South
Africa that will necessitate detailed stability and other studies associated
with a South African system with low inertia
Actual experience from power systems globally indicate that > 50% instantaneous penetration of variable RE is possible before stability issues are a cause for concern